Cambridge A Level Biology 9700 — 2010 Oct/Nov Paper 5 · Variant 3
9700/53/O/N/10 · 30 marks · ≈34 min
The question paper and its mark scheme, free to read here and free to download. This is Cambridge’s own paper, exactly as it was sat.
Question paper8 pages
Mark scheme5 pages
Answers below. Sit the paper first if you are practising.
Paper as text
Question paper, page 1
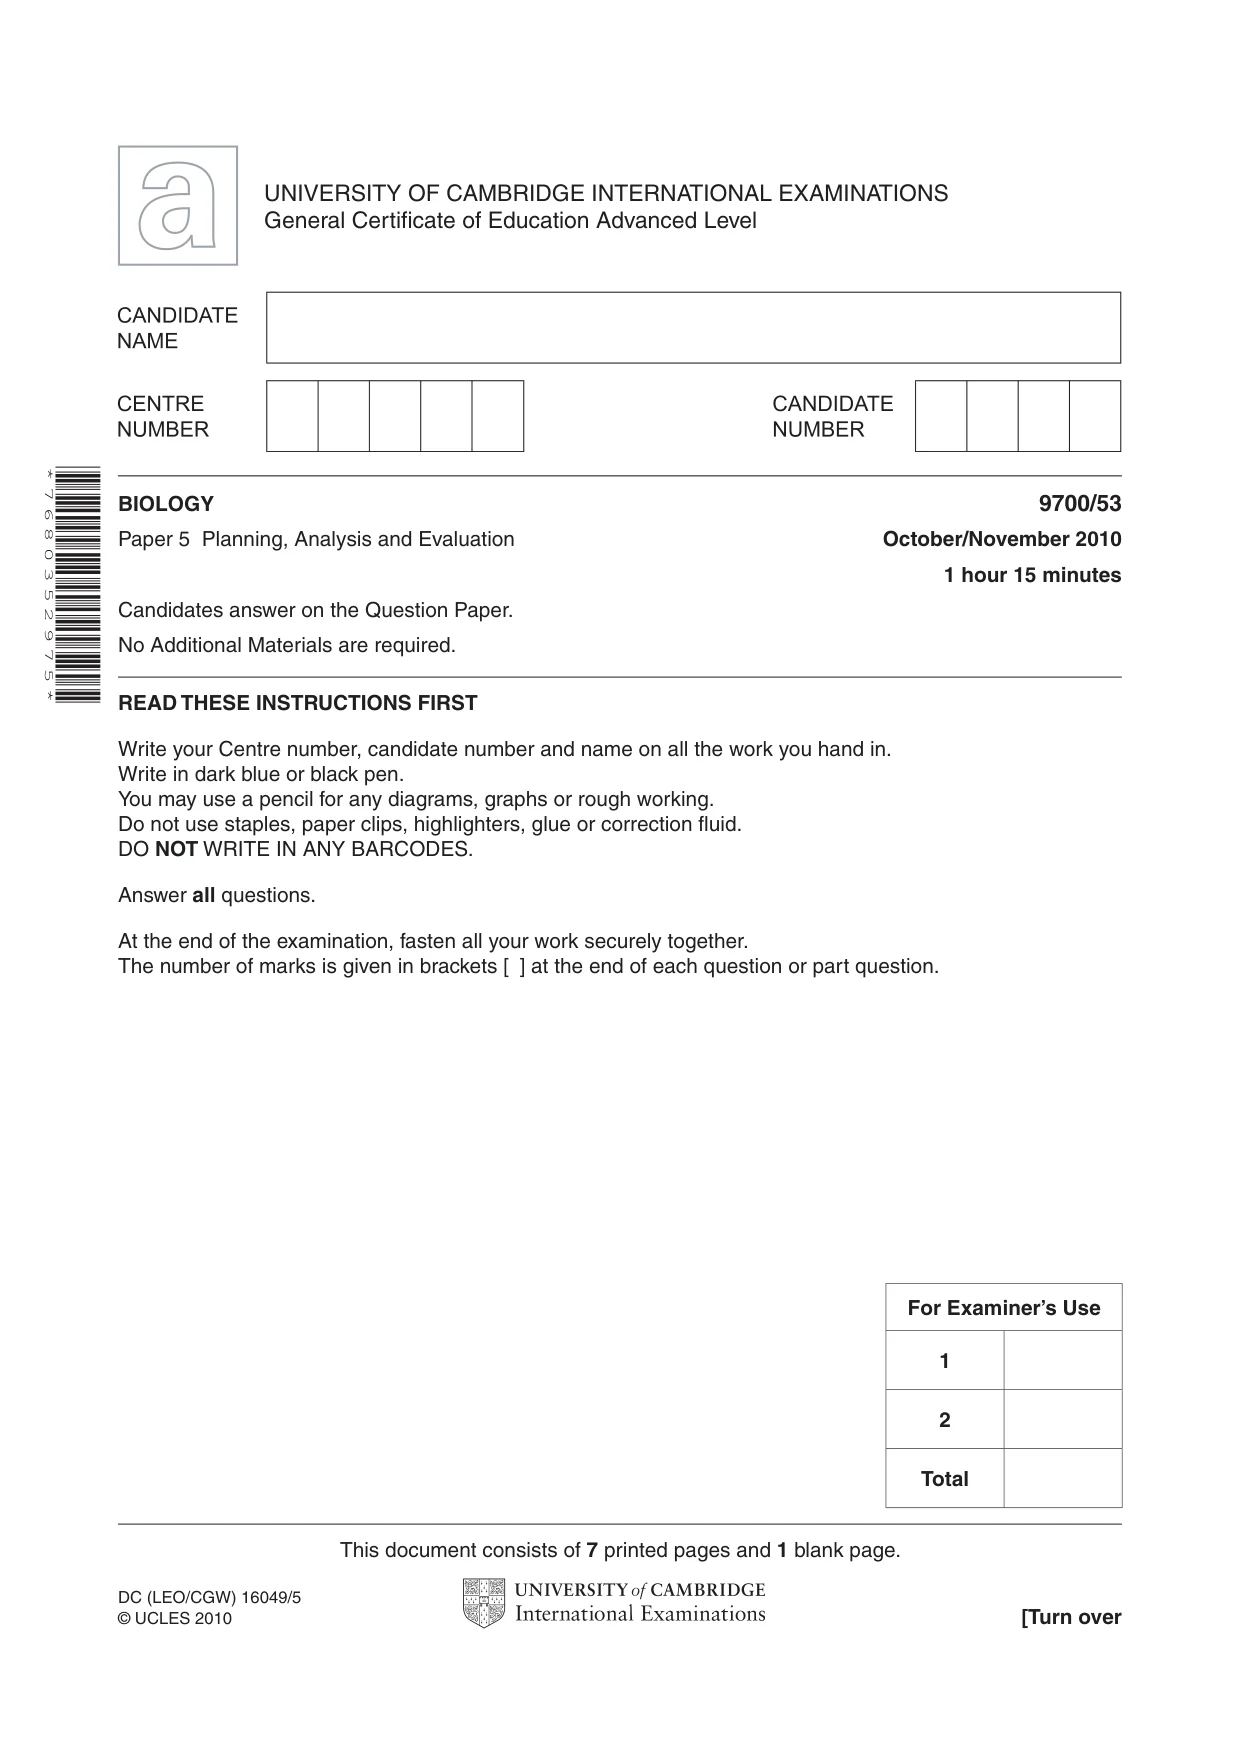
For Examiner’s Use 1 2 Total This document consists of 7 printed pages and 1 blank page. DC (LEO/CGW) 16049/5 © UCLES 2010 [Turn over UNIVERSITY OF CAMBRIDGE INTERNATIONAL EXAMINATIONS General Certificate of Education Advanced Level READ THESE INSTRUCTIONS FIRST Write your Centre number, candidate number and name on all the work you hand in. Write in dark blue or black pen. You may use a pencil for any diagrams, graphs or rough working. Do not use staples, paper clips, highlighters, glue or correction fluid. DO NOT WRITE IN ANY BARCODES. Answer all questions. At the end of the examination, fasten all your work securely together. The number of marks is given in brackets [ ] at the end of each question or part question. * 7 6 8 0 3 5 2 9 7 5 * BIOLOGY 9700/53 Paper 5 Planning, Analysis and Evaluation October/November 2010 1 hour 15 minutes Candidates answer on the Question Paper. No Additional Materials are required.
Question paper, page 2
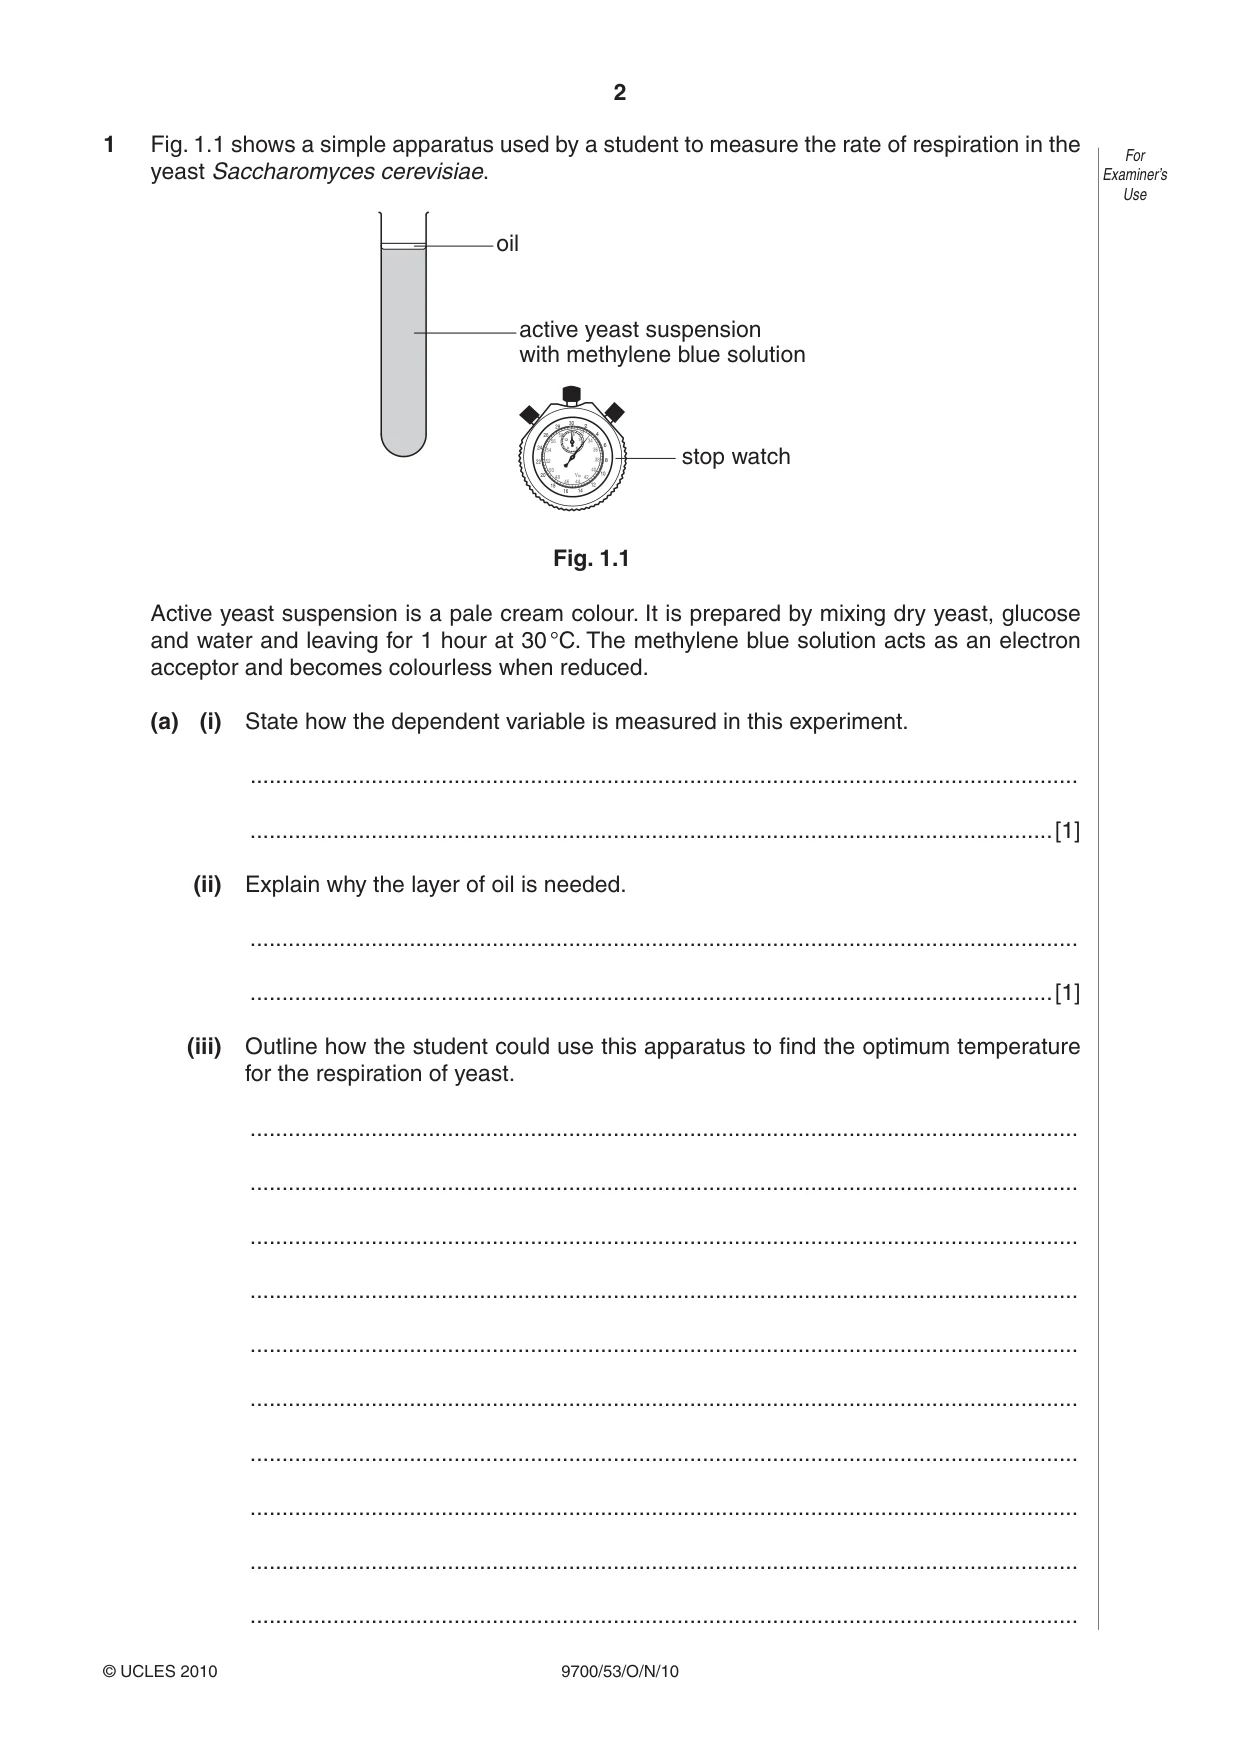
2 9700/53/O/N/10 © UCLES 2010 For Examiner’s Use 1 Fig. 1.1 shows a simple apparatus used by a student to measure the rate of respiration in the yeast Saccharomyces cerevisiae. 32 58 3 6 9 12 15 2 4 6 8 10 12 14 16 18 20 22 24 26 28 30 34 36 38 40 42 46 44 48 50 52 54 56 1/10 oil stop watch active yeast suspension with methylene blue solution Fig. 1.1 Active yeast suspension is a pale cream colour. It is prepared by mixing dry yeast, glucose and water and leaving for 1 hour at 30 °C. The methylene blue solution acts as an electron acceptor and becomes colourless when reduced. (a) (i) State how the dependent variable is measured in this experiment. … …[1] (ii) Explain why the layer of oil is needed. … …[1] (iii) Outline how the student could use this apparatus to find the optimum temperature for the respiration of yeast. … … … … … … … … … …
Question paper, page 3
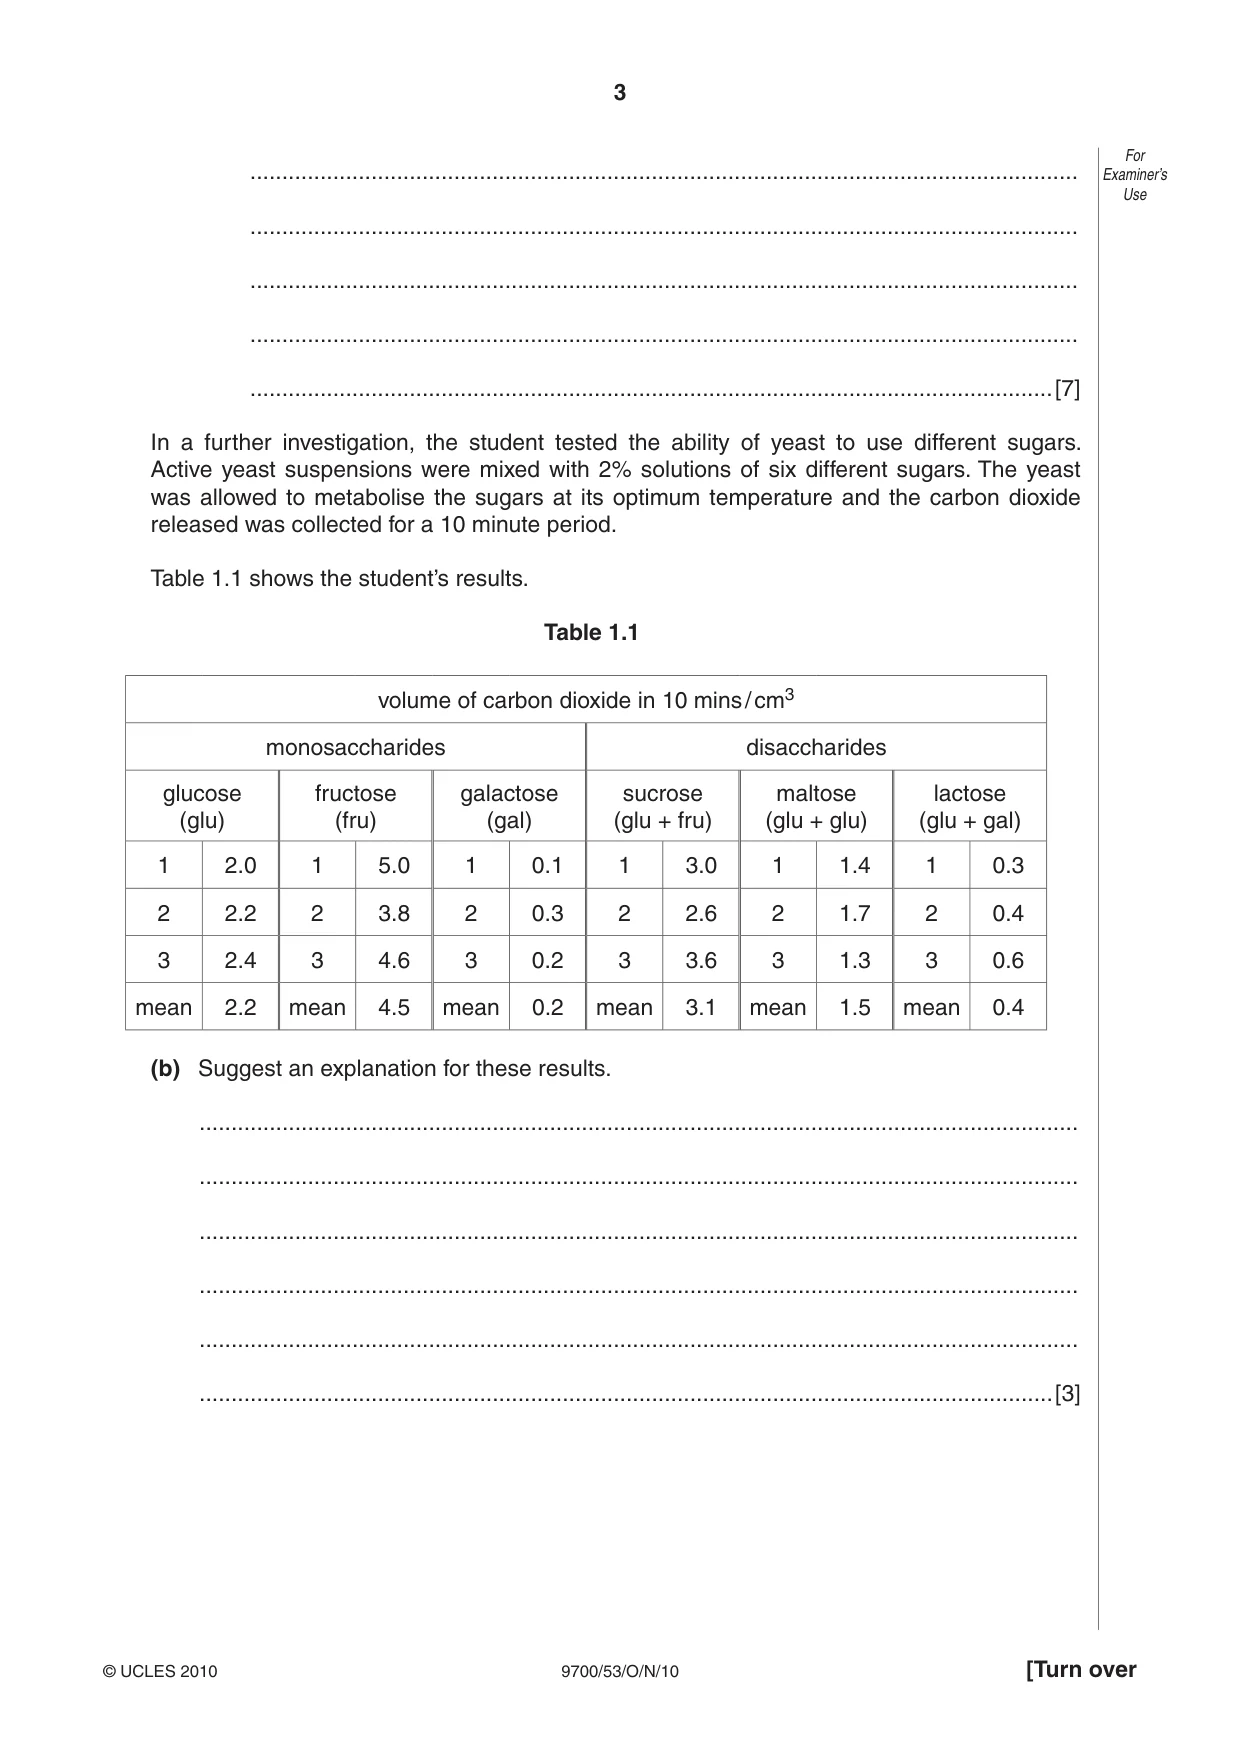
3 9700/53/O/N/10 © UCLES 2010 [Turn over For Examiner’s Use … … … … …[7] In a further investigation, the student tested the ability of yeast to use different sugars. Active yeast suspensions were mixed with 2% solutions of six different sugars. The yeast was allowed to metabolise the sugars at its optimum temperature and the carbon dioxide released was collected for a 10 minute period. Table 1.1 shows the student’s results. Table 1.1 volume of carbon dioxide in 10 mins / cm3 monosaccharides disaccharides glucose (glu) fructose (fru) galactose (gal) sucrose (glu + fru) maltose (glu + glu) lactose (glu + gal) 1 2.0 1 5.0 1 0.1 1 3.0 1 1.4 1 0.3 2 2.2 2 3.8 2 0.3 2 2.6 2 1.7 2 0.4 3 2.4 3 4.6 3 0.2 3 3.6 3 1.3 3 0.6 mean 2.2 mean 4.5 mean 0.2 mean 3.1 mean 1.5 mean 0.4 (b) Suggest an explanation for these results. … … … … … …[3]
Question paper, page 4
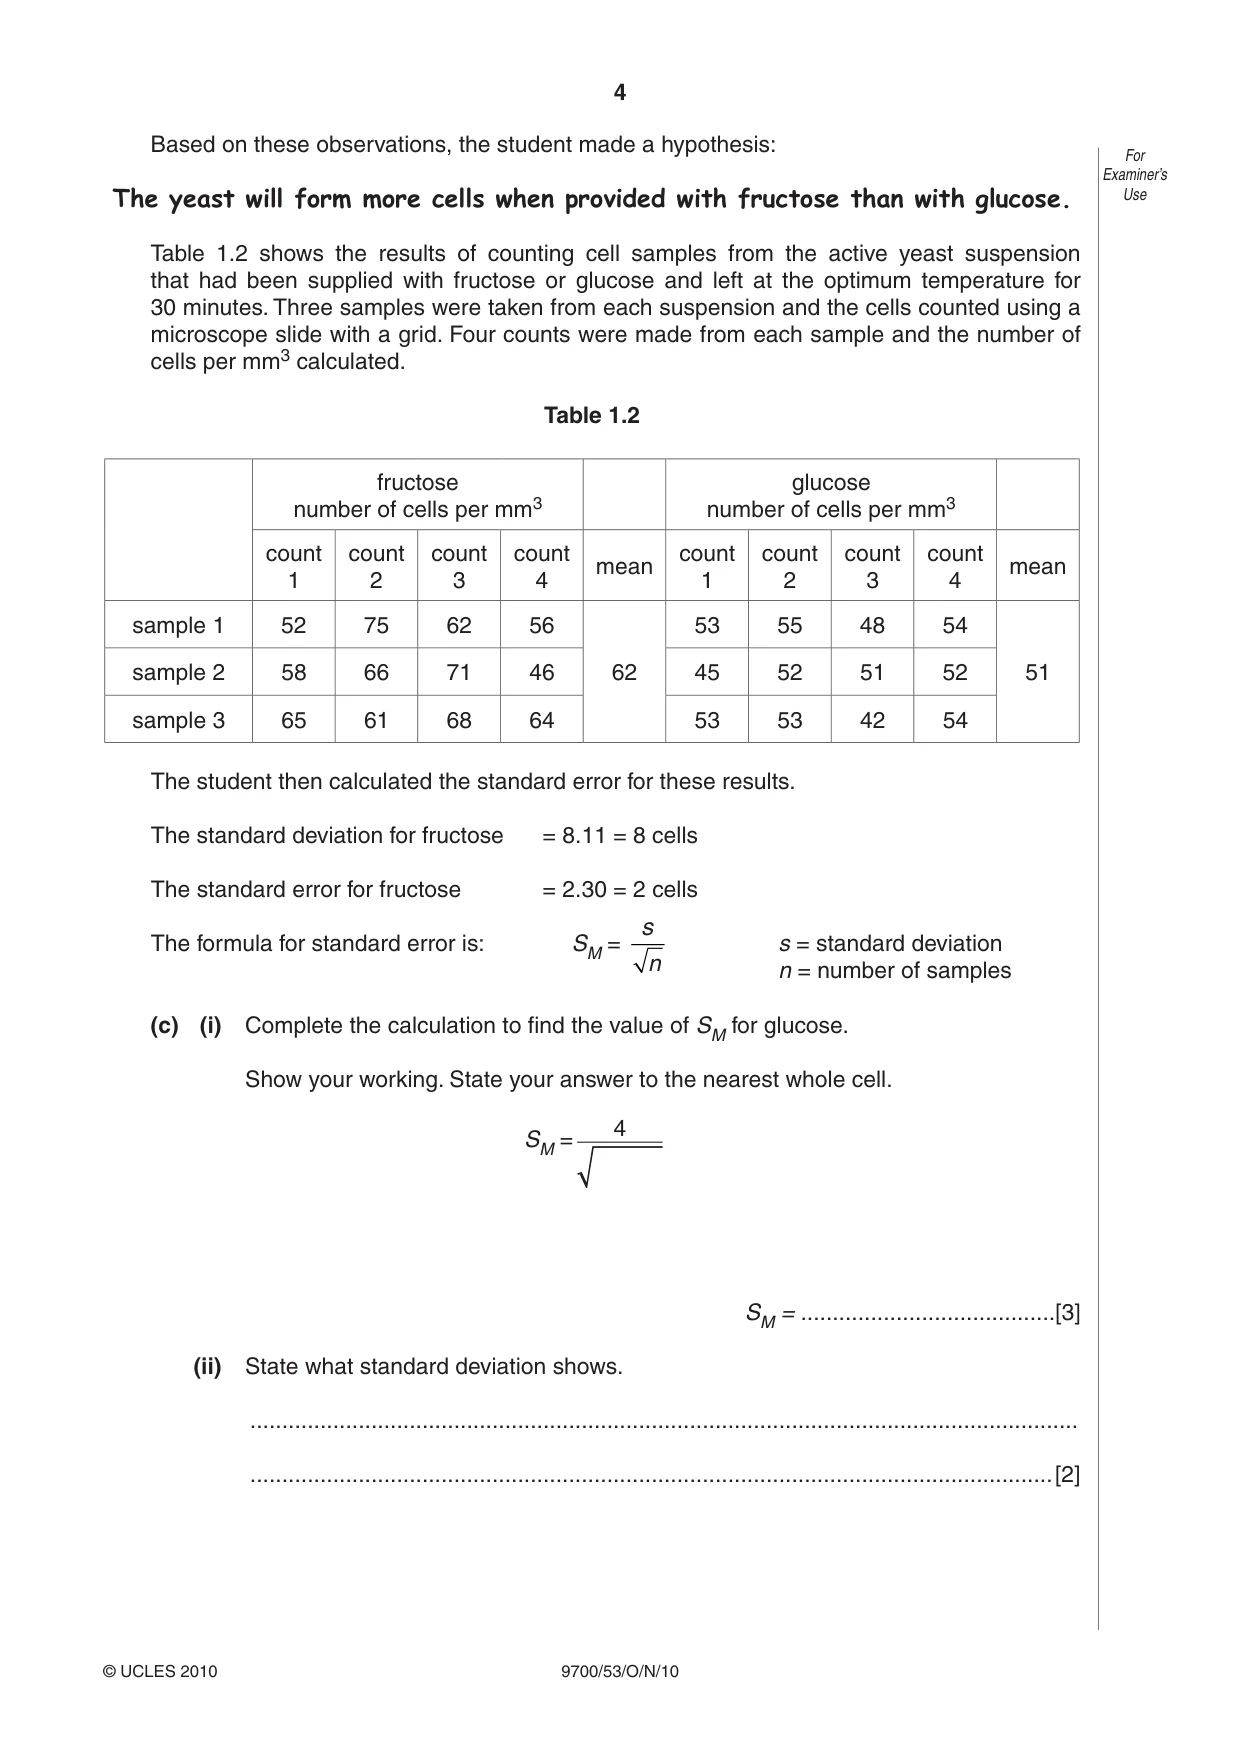
4 9700/53/O/N/10 © UCLES 2010 For Examiner’s Use Based on these observations, the student made a hypothesis: The yeast will form more cells when provided with fructose than with glucose. Table 1.2 shows the results of counting cell samples from the active yeast suspension that had been supplied with fructose or glucose and left at the optimum temperature for 30 minutes. Three samples were taken from each suspension and the cells counted using a microscope slide with a grid. Four counts were made from each sample and the number of cells per mm3 calculated. Table 1.2 fructose number of cells per mm3 glucose number of cells per mm3 count 1 count 2 count 3 count 4 mean count 1 count 2 count 3 count 4 mean sample 1 52 75 62 56 62 53 55 48 54 51 sample 2 58 66 71 46 45 52 51 52 sample 3 65 61 68 64 53 53 42 54 The student then calculated the standard error for these results. The standard deviation for fructose = 8.11 = 8 cells The standard error for fructose = 2.30 = 2 cells The formula for standard error is: SM = s n s = standard deviation n = number of samples (c) (i) Complete the calculation to find the value of SM for glucose. Show your working. State your answer to the nearest whole cell. SM = 4 SM = …[3] (ii) State what standard deviation shows. … …[2]
Question paper, page 5
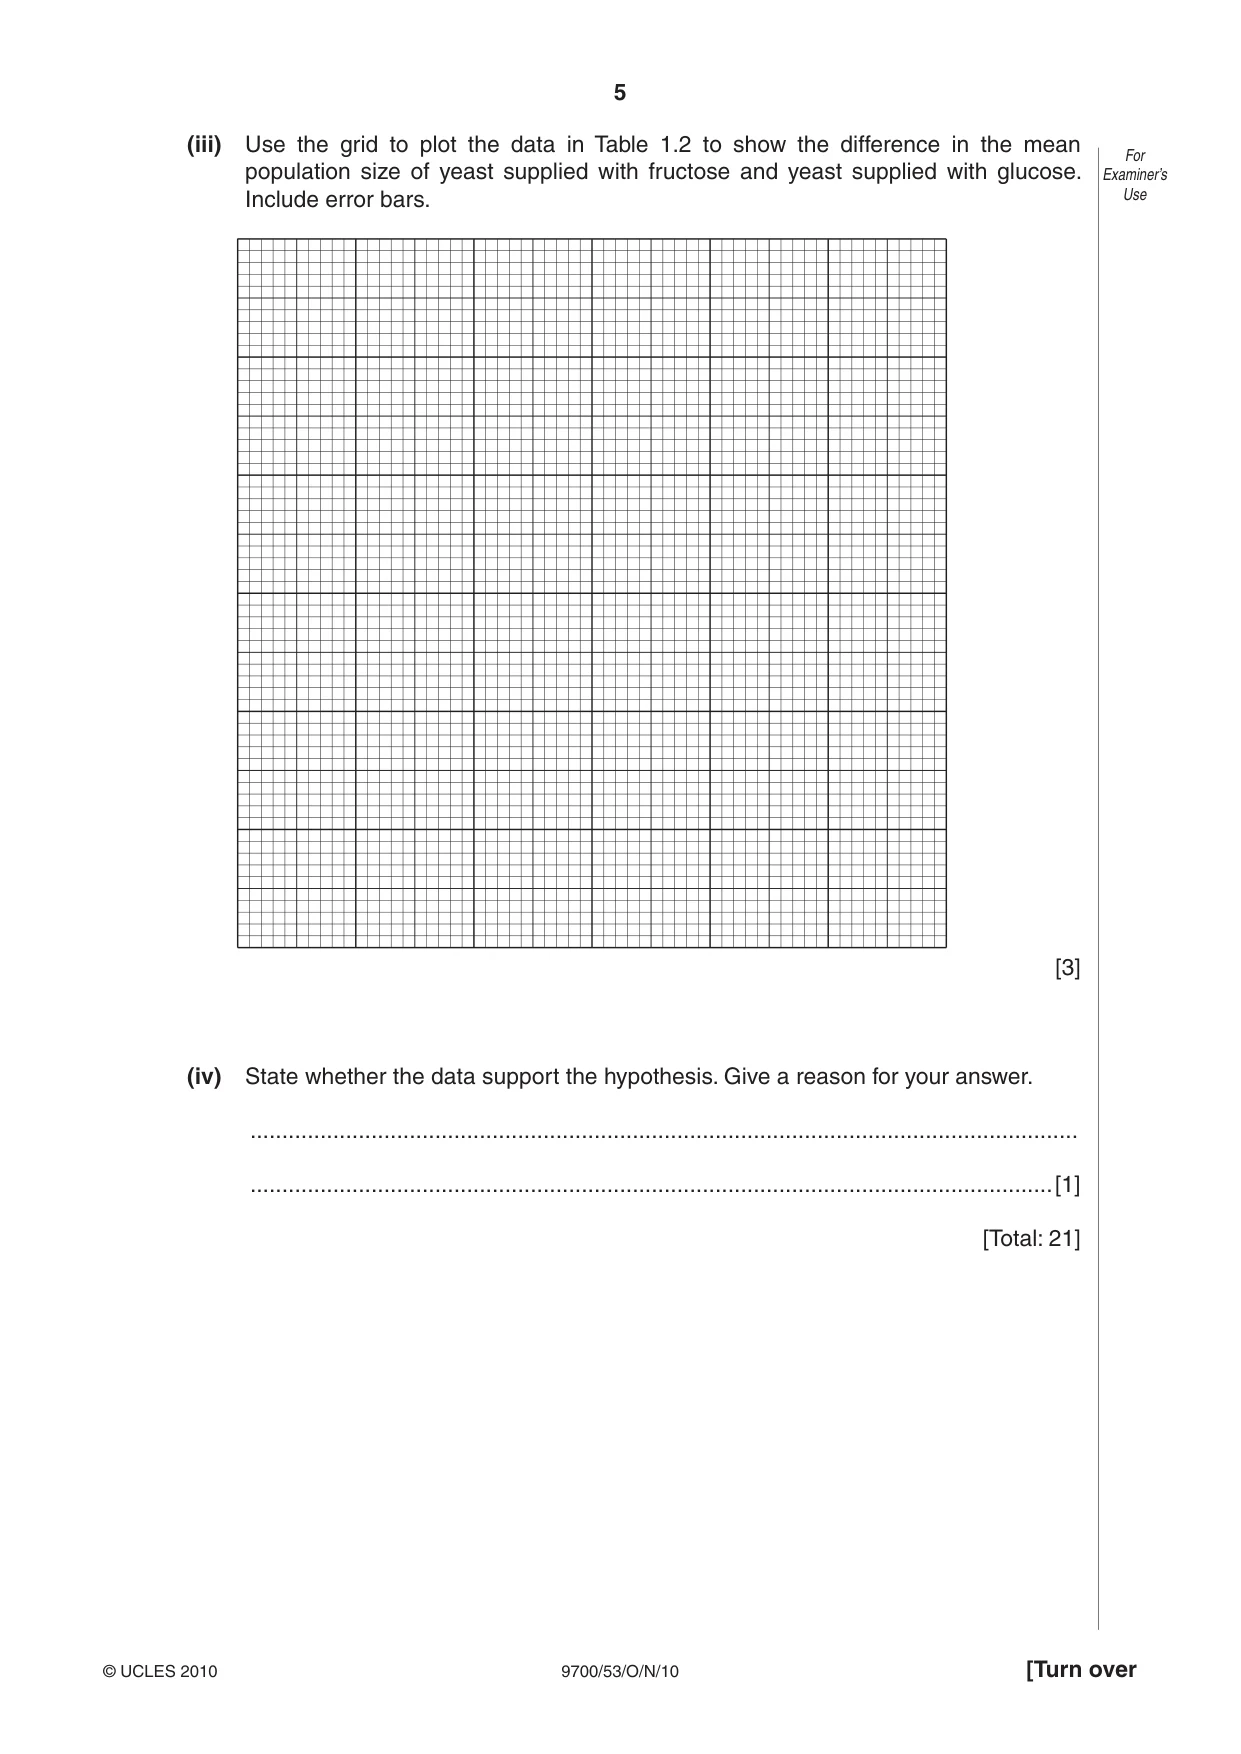
5 9700/53/O/N/10 © UCLES 2010 [Turn over For Examiner’s Use (iii) Use the grid to plot the data in Table 1.2 to show the difference in the mean population size of yeast supplied with fructose and yeast supplied with glucose. Include error bars. [3] (iv) State whether the data support the hypothesis. Give a reason for your answer. … …[1] [Total: 21]
Question paper, page 6
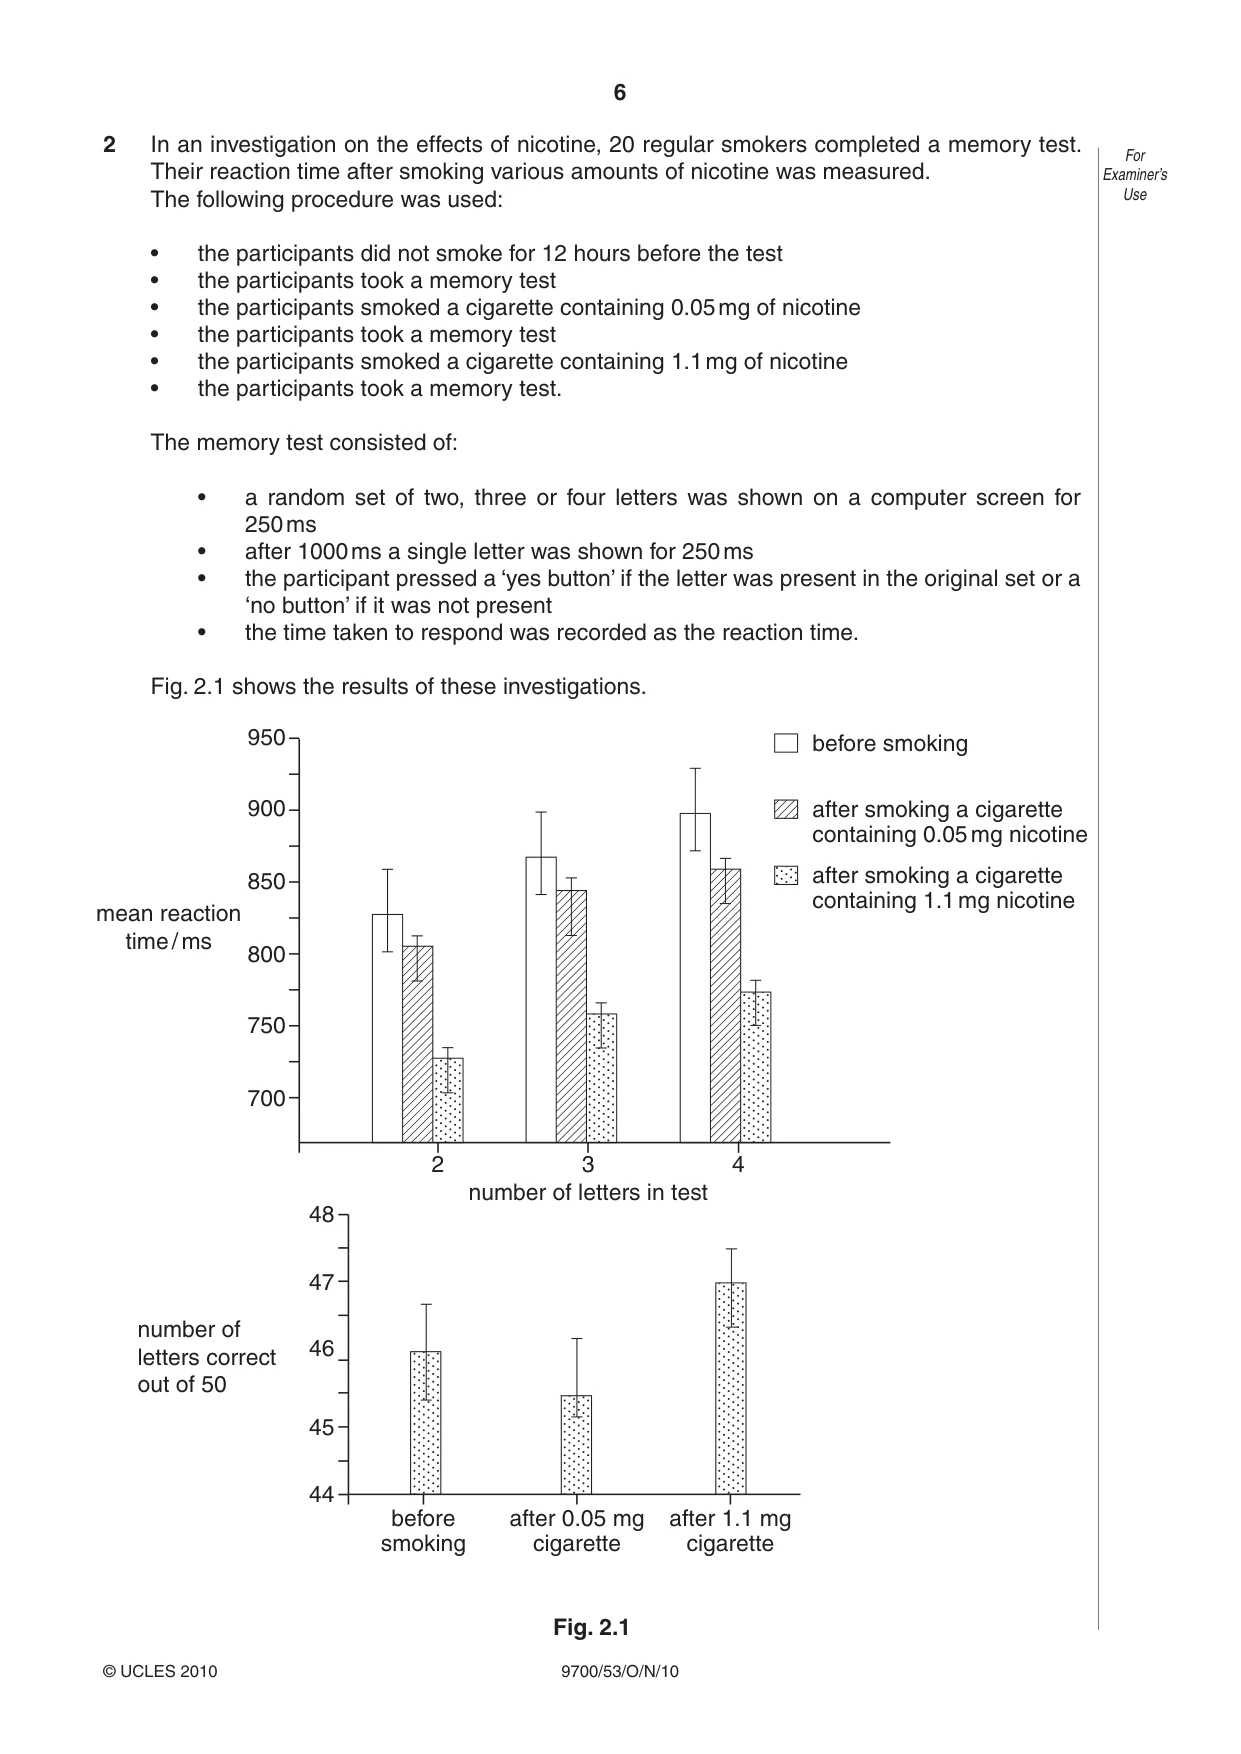
6 9700/53/O/N/10 © UCLES 2010 For Examiner’s Use 2 In an investigation on the effects of nicotine, 20 regular smokers completed a memory test. Their reaction time after smoking various amounts of nicotine was measured. The following procedure was used: • the participants did not smoke for 12 hours before the test • the participants took a memory test • the participants smoked a cigarette containing 0.05 mg of nicotine • the participants took a memory test • the participants smoked a cigarette containing 1.1 mg of nicotine • the participants took a memory test. The memory test consisted of: • a random set of two, three or four letters was shown on a computer screen for 250 ms • after 1000 ms a single letter was shown for 250 ms • the participant pressed a ‘yes button’ if the letter was present in the original set or a ‘no button’ if it was not present • the time taken to respond was recorded as the reaction time. Fig. 2.1 shows the results of these investigations. 950 before smoking after smoking a cigarette containing 0.05 mg nicotine after smoking a cigarette containing 1.1 mg nicotine 900 850 800 750 700 47 48 46 45 44 2 before smoking after 0.05 mg cigarette after 1.1 mg cigarette 3 number of letters in test mean reaction time / ms number of letters correct out of 50 4 Fig. 2.1
Question paper, page 7
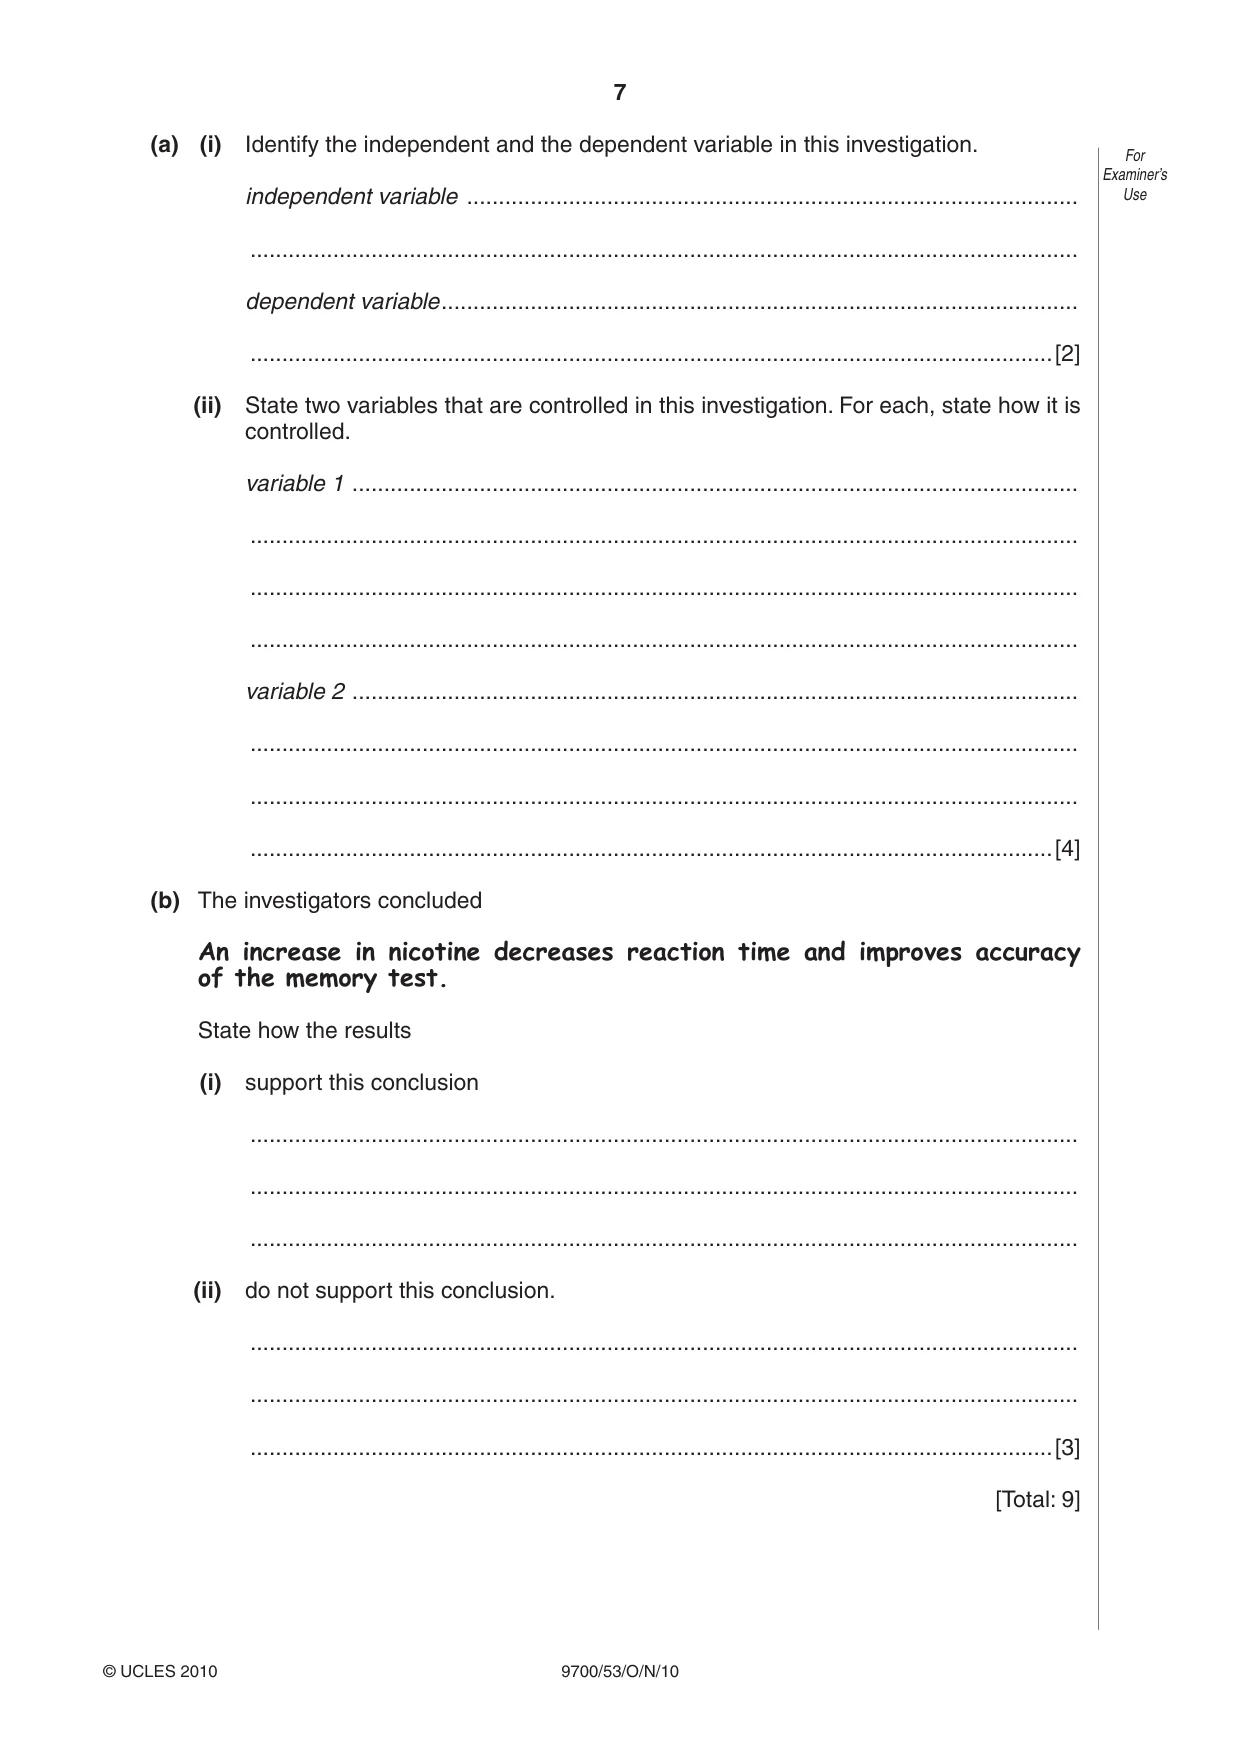
7 9700/53/O/N/10 © UCLES 2010 For Examiner’s Use (a) (i) Identify the independent and the dependent variable in this investigation. independent variable … … dependent variable … …[2] (ii) State two variables that are controlled in this investigation. For each, state how it is controlled. variable 1 … … … … variable 2 … … … …[4] (b) The investigators concluded An increase in nicotine decreases reaction time and improves accuracy of the memory test. State how the results (i) support this conclusion … … … (ii) do not support this conclusion. … … …[3] [Total: 9]
Question paper, page 8
8 9700/53/O/N/10 © UCLES 2010 BLANK PAGE Permission to reproduce items where third-party owned material protected by copyright is included has been sought and cleared where possible. Every reasonable effort has been made by the publisher (UCLES) to trace copyright holders, but if any items requiring clearance have unwittingly been included, the publisher will be pleased to make amends at the earliest possible opportunity. University of Cambridge International Examinations is part of the Cambridge Assessment Group. Cambridge Assessment is the brand name of University of Cambridge Local Examinations Syndicate (UCLES), which is itself a department of the University of Cambridge.
Mark scheme, page 1
UNIVERSITY OF CAMBRIDGE INTERNATIONAL EXAMINATIONS GCE Advanced Subsidiary Level and GCE Advanced Level MARK SCHEME for the October/November 2010 question paper for the guidance of teachers 9700 BIOLOGY 9700/53 Paper 5 (Planning, Analysis and Evaluation), maximum raw mark 30 This mark scheme is published as an aid to teachers and candidates, to indicate the requirements of the examination. It shows the basis on which Examiners were instructed to award marks. It does not indicate the details of the discussions that took place at an Examiners’ meeting before marking began, which would have considered the acceptability of alternative answers. Mark schemes must be read in conjunction with the question papers and the report on the examination. • CIE will not enter into discussions or correspondence in connection with these mark schemes. CIE is publishing the mark schemes for the October/November 2010 question papers for most IGCSE, GCE Advanced Level and Advanced Subsidiary Level syllabuses and some Ordinary Level syllabuses.
Mark scheme, page 2
Page 2 Mark Scheme: Teachers’ version Syllabus Paper GCE A/AS LEVEL – October/November 2010 9700 53 © UCLES 2010 Mark schemes abbreviations: ; separates marking points / alternative answers for the same point R reject A accept (for answers correctly cued by the question, or guidance on the mark scheme) AW alternative wording (where responses vary more than usual) underline actual word given must be used by candidate (grammatical variants excepted) max indicates the maximum number of marks that can be given ora or reverse argument
Mark scheme, page 3
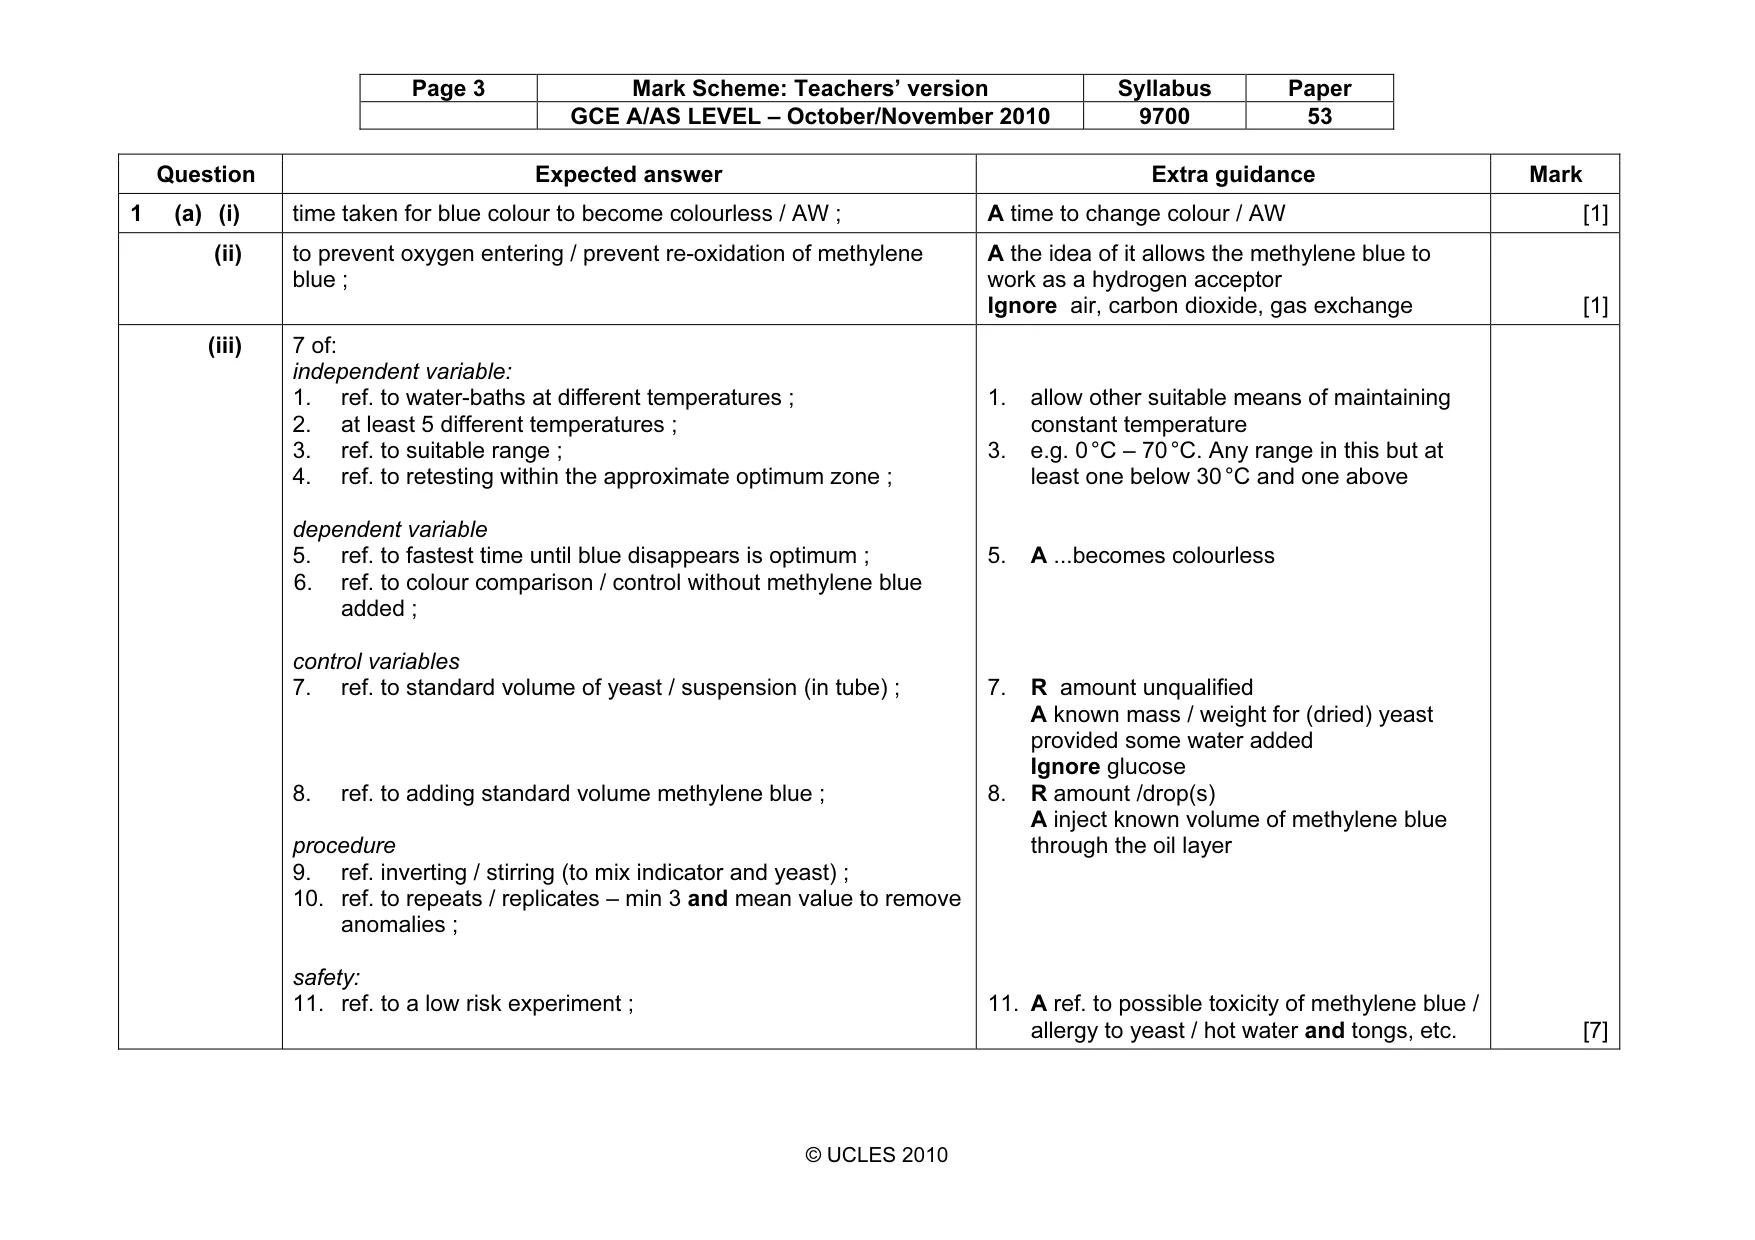
Page 3 Mark Scheme: Teachers’ version Syllabus Paper GCE A/AS LEVEL – October/November 2010 9700 53 © UCLES 2010 Question Expected answer Extra guidance Mark 1 (a) (i) time taken for blue colour to become colourless / AW ; A time to change colour / AW [1] (ii) to prevent oxygen entering / prevent re-oxidation of methylene blue ; A the idea of it allows the methylene blue to work as a hydrogen acceptor Ignore air, carbon dioxide, gas exchange [1] (iii) 7 of: independent variable: 1. ref. to water-baths at different temperatures ; 2. at least 5 different temperatures ; 3. ref. to suitable range ; 4. ref. to retesting within the approximate optimum zone ; dependent variable 5. ref. to fastest time until blue disappears is optimum ; 6. ref. to colour comparison / control without methylene blue added ; control variables 7. ref. to standard volume of yeast / suspension (in tube) ; 8. ref. to adding standard volume methylene blue ; procedure 9. ref. inverting / stirring (to mix indicator and yeast) ; 10. ref. to repeats / replicates – min 3 and mean value to remove anomalies ; safety: 11. ref. to a low risk experiment ; 1. allow other suitable means of maintaining constant temperature 3. e.g. 0 °C – 70 °C. Any range in this but at least one below 30 °C and one above 5. A ...becomes colourless 7. R amount unqualified A known mass / weight for (dried) yeast provided some water added Ignore glucose 8. R amount /drop(s) A inject known volume of methylene blue through the oil layer 11. A ref. to possible toxicity of methylene blue / allergy to yeast / hot water and tongs, etc. [7]
Mark scheme, page 4
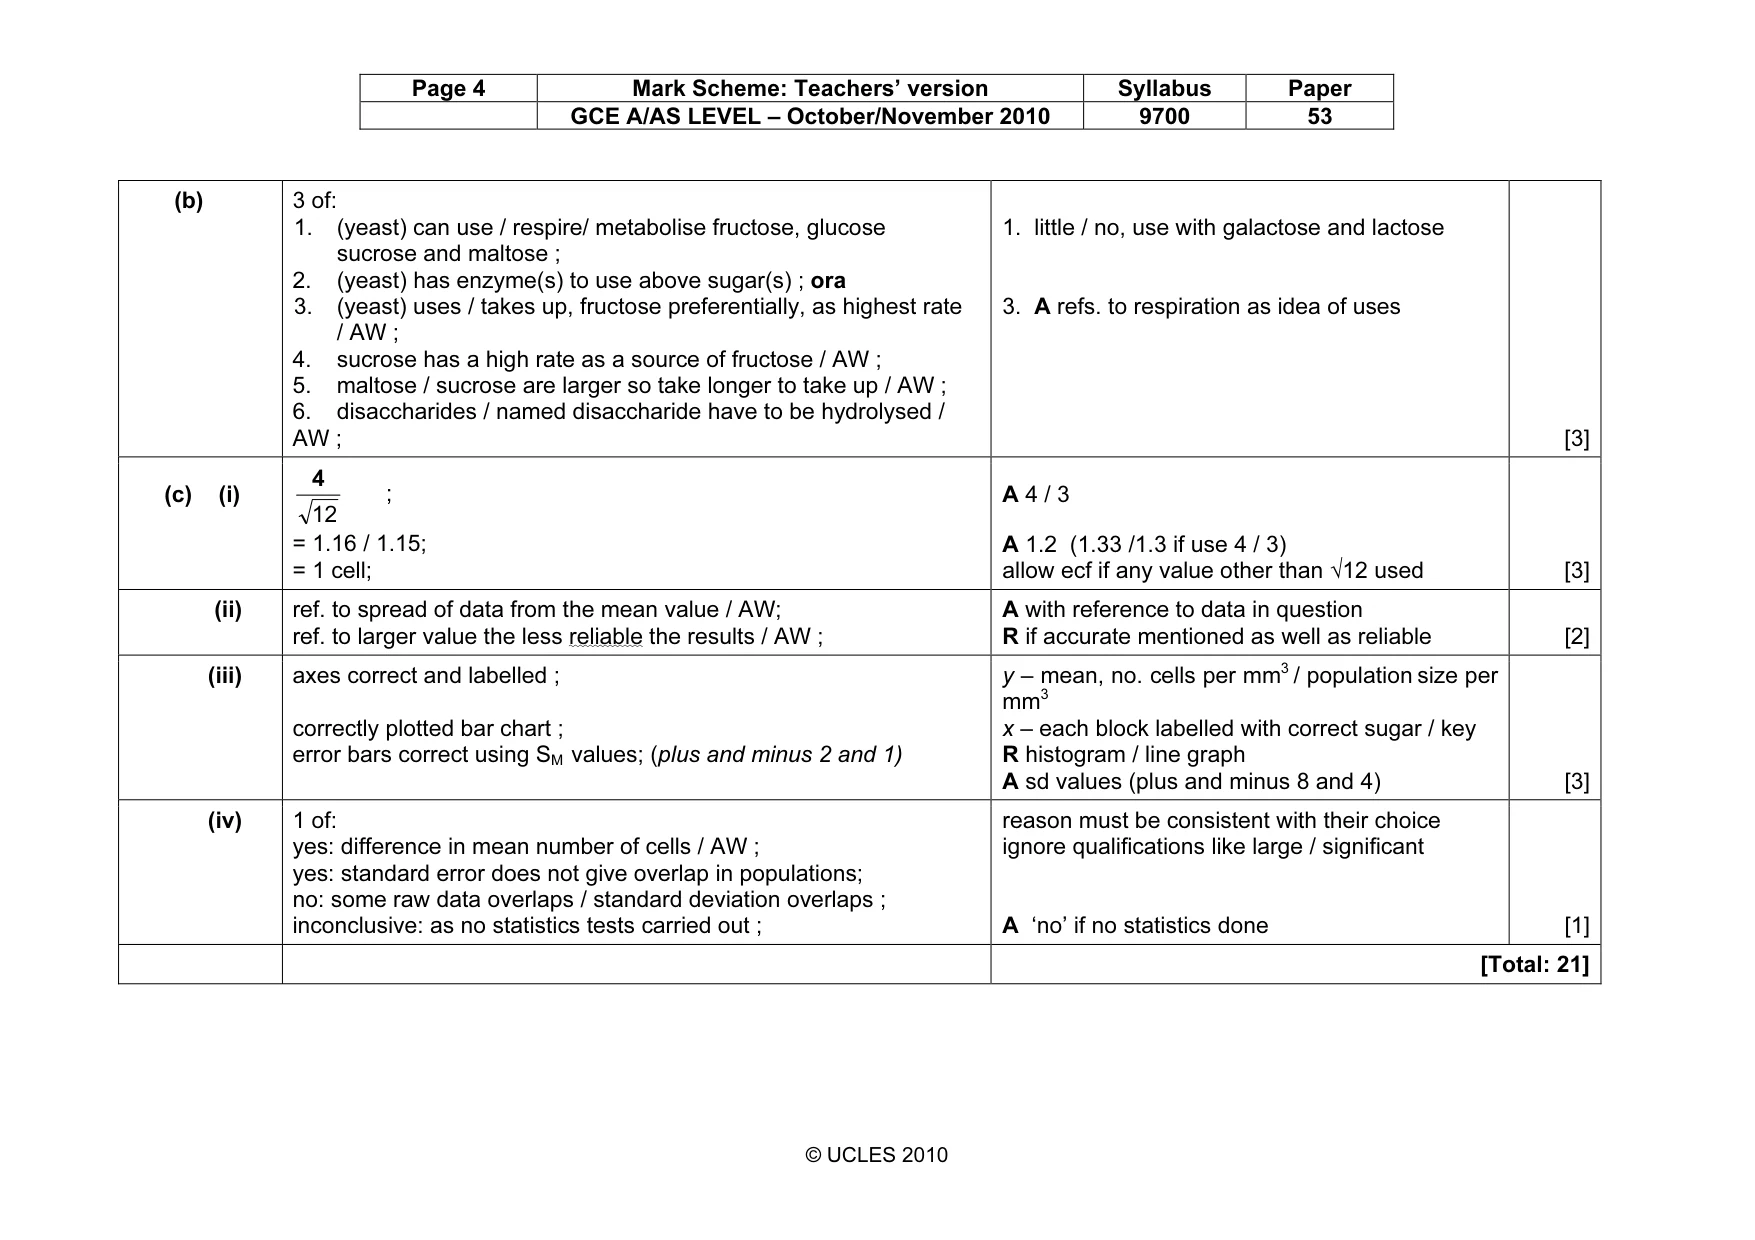
Page 4 Mark Scheme: Teachers’ version Syllabus Paper GCE A/AS LEVEL – October/November 2010 9700 53 © UCLES 2010 (b) 3 of: 1. (yeast) can use / respire/ metabolise fructose, glucose sucrose and maltose ; 2. (yeast) has enzyme(s) to use above sugar(s) ; ora 3. (yeast) uses / takes up, fructose preferentially, as highest rate / AW ; 4. sucrose has a high rate as a source of fructose / AW ; 5. maltose / sucrose are larger so take longer to take up / AW ; 6. disaccharides / named disaccharide have to be hydrolysed / AW ; 1. little / no, use with galactose and lactose 3. A refs. to respiration as idea of uses [3] (c) (i) 12 4 ; = 1.16 / 1.15; = 1 cell; A 4 / 3 A 1.2 (1.33 /1.3 if use 4 / 3) allow ecf if any value other than √12 used [3] (ii) ref. to spread of data from the mean value / AW; ref. to larger value the less reliable the results / AW ; A with reference to data in question R if accurate mentioned as well as reliable [2] (iii) axes correct and labelled ; correctly plotted bar chart ; error bars correct using SM values; (plus and minus 2 and 1) y – mean, no. cells per mm3 / population size per mm3 x – each block labelled with correct sugar / key R histogram / line graph A sd values (plus and minus 8 and 4) [3] (iv) 1 of: yes: difference in mean number of cells / AW ; yes: standard error does not give overlap in populations; no: some raw data overlaps / standard deviation overlaps ; inconclusive: as no statistics tests carried out ; reason must be consistent with their choice ignore qualifications like large / significant A ‘no’ if no statistics done [1] [Total: 21]
Mark scheme, page 5
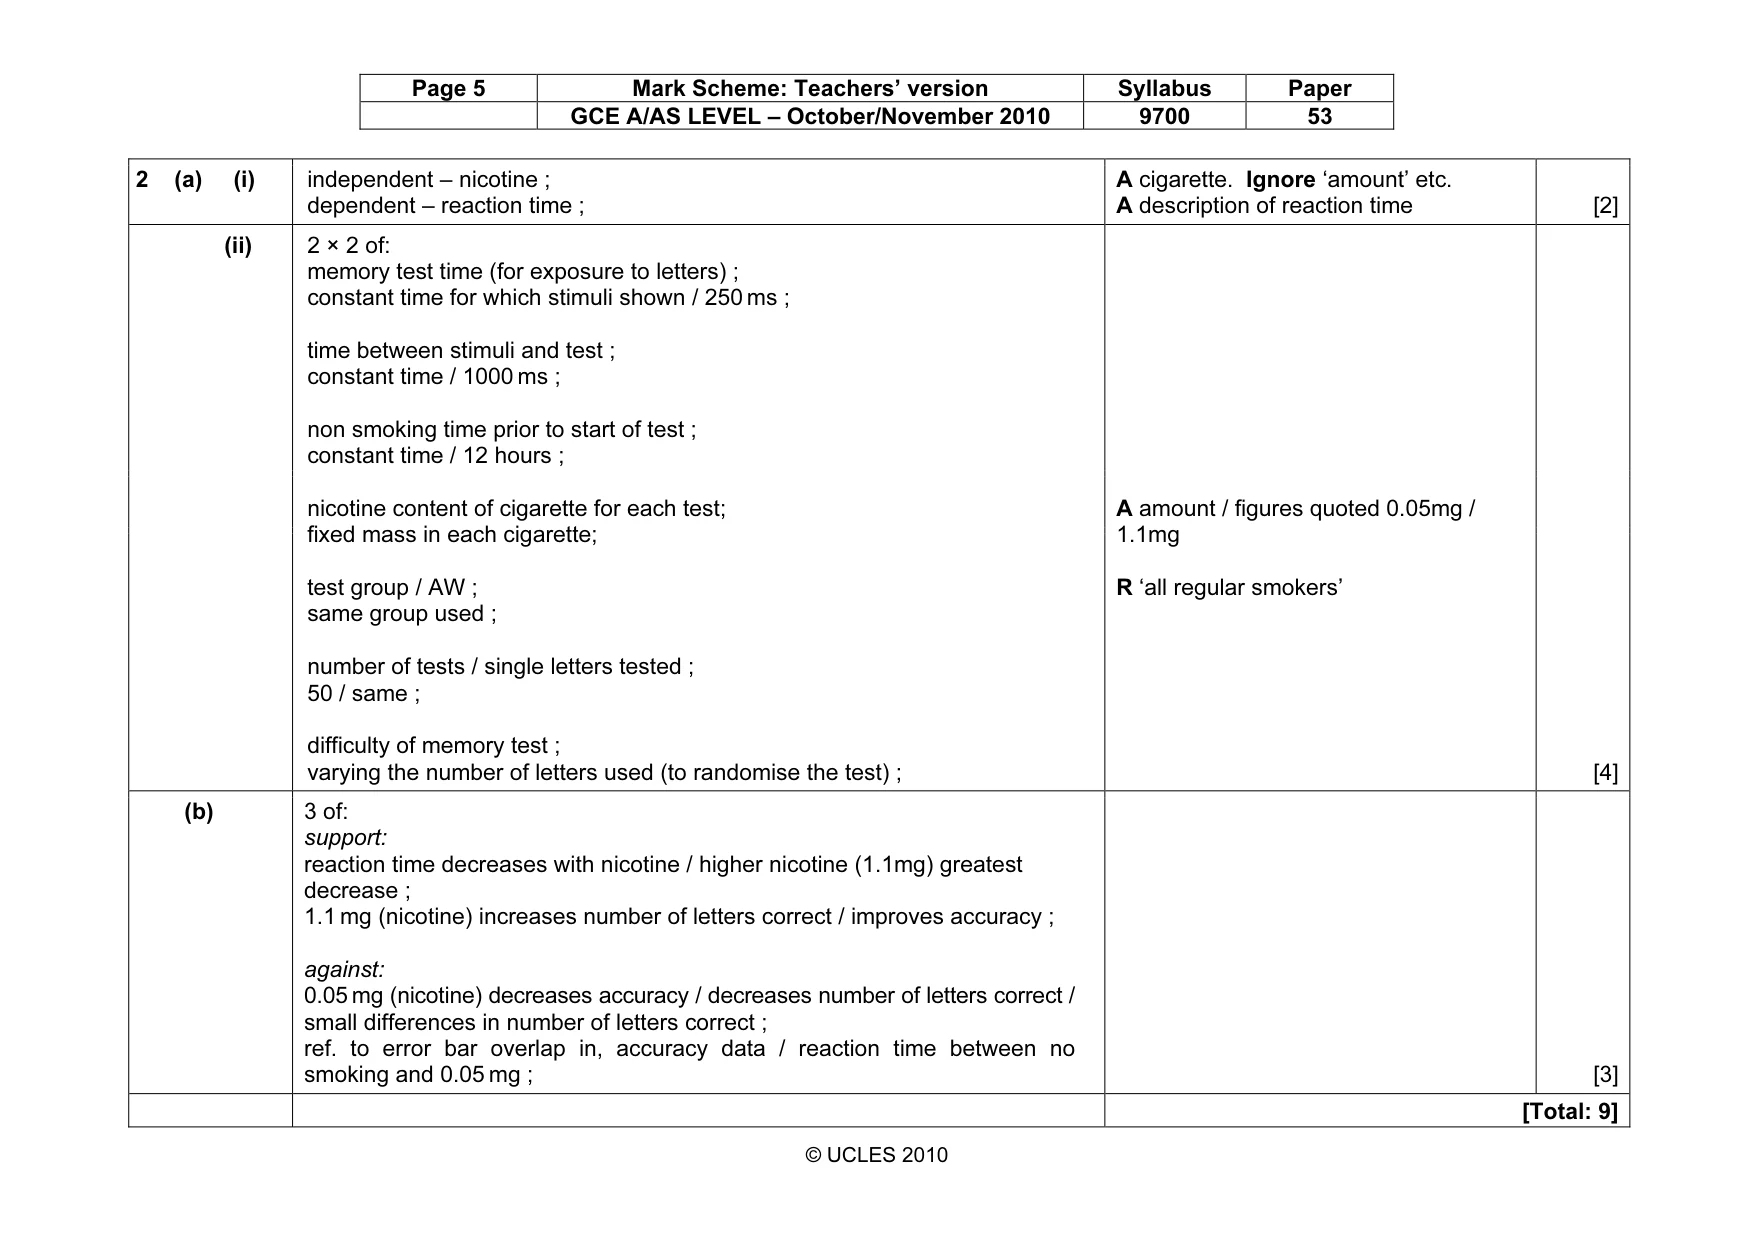
Page 5 Mark Scheme: Teachers’ version Syllabus Paper GCE A/AS LEVEL – October/November 2010 9700 53 © UCLES 2010 2 (a) (i) independent – nicotine ; dependent – reaction time ; A cigarette. Ignore ‘amount’ etc. A description of reaction time [2] (ii) 2 × 2 of: memory test time (for exposure to letters) ; constant time for which stimuli shown / 250 ms ; time between stimuli and test ; constant time / 1000 ms ; non smoking time prior to start of test ; constant time / 12 hours ; nicotine content of cigarette for each test; fixed mass in each cigarette; test group / AW ; same group used ; number of tests / single letters tested ; 50 / same ; difficulty of memory test ; varying the number of letters used (to randomise the test) ; A amount / figures quoted 0.05mg / 1.1mg R ‘all regular smokers’ [4] (b) 3 of: support: reaction time decreases with nicotine / higher nicotine (1.1mg) greatest decrease ; 1.1 mg (nicotine) increases number of letters correct / improves accuracy ; against: 0.05 mg (nicotine) decreases accuracy / decreases number of letters correct / small differences in number of letters correct ; ref. to error bar overlap in, accuracy data / reaction time between no smoking and 0.05 mg ; [3] [Total: 9]
What you needed in this session
Cambridge’s own grade thresholds for 2010 Oct/Nov, Paper 5 · Variant 3. A higher threshold means an easier paper — the bar moves with how the cohort did.