Cambridge A Level Biology 9700 — 2010 May/June Paper 3 · Variant 1
9700/31/M/J/10 · 40 marks · ≈45 min
The question paper and its mark scheme, free to read here and free to download. This is Cambridge’s own paper, exactly as it was sat.
Question paper12 pages
Mark scheme9 pages
Answers below. Sit the paper first if you are practising.
Paper as text
Question paper, page 1
This document consists of 10 printed pages and 2 blank pages. DC (CW/SW) 15987/4 © UCLES 2010 [Turn over UNIVERSITY OF CAMBRIDGE INTERNATIONAL EXAMINATIONS General Certificate of Education Advanced Subsidiary Level and Advanced Level READ THESE INSTRUCTIONS FIRST Write your Centre number, candidate number and name on all the work you hand in. Write in dark blue or black pen. You may use a pencil for any diagrams, graphs or rough working. Do not use staples, paper clips, highlighters, glue or correction fluid. DO NOT WRITE IN ANY BARCODES. Answer all questions. At the end of the examination, fasten all your work securely together. The number of marks is given in brackets [ ] at the end of each question or part question. You are advised to spend one hour on each question. * 8 6 9 3 3 1 0 9 3 3 * BIOLOGY 9700/31 Paper 31 Advanced Practical Skills May/June 2010 2 hours Candidates answer on the Question Paper. Additional Materials: As listed in the Confidential Instructions For Examiner’s Use 1 2 Total
Question paper, page 2
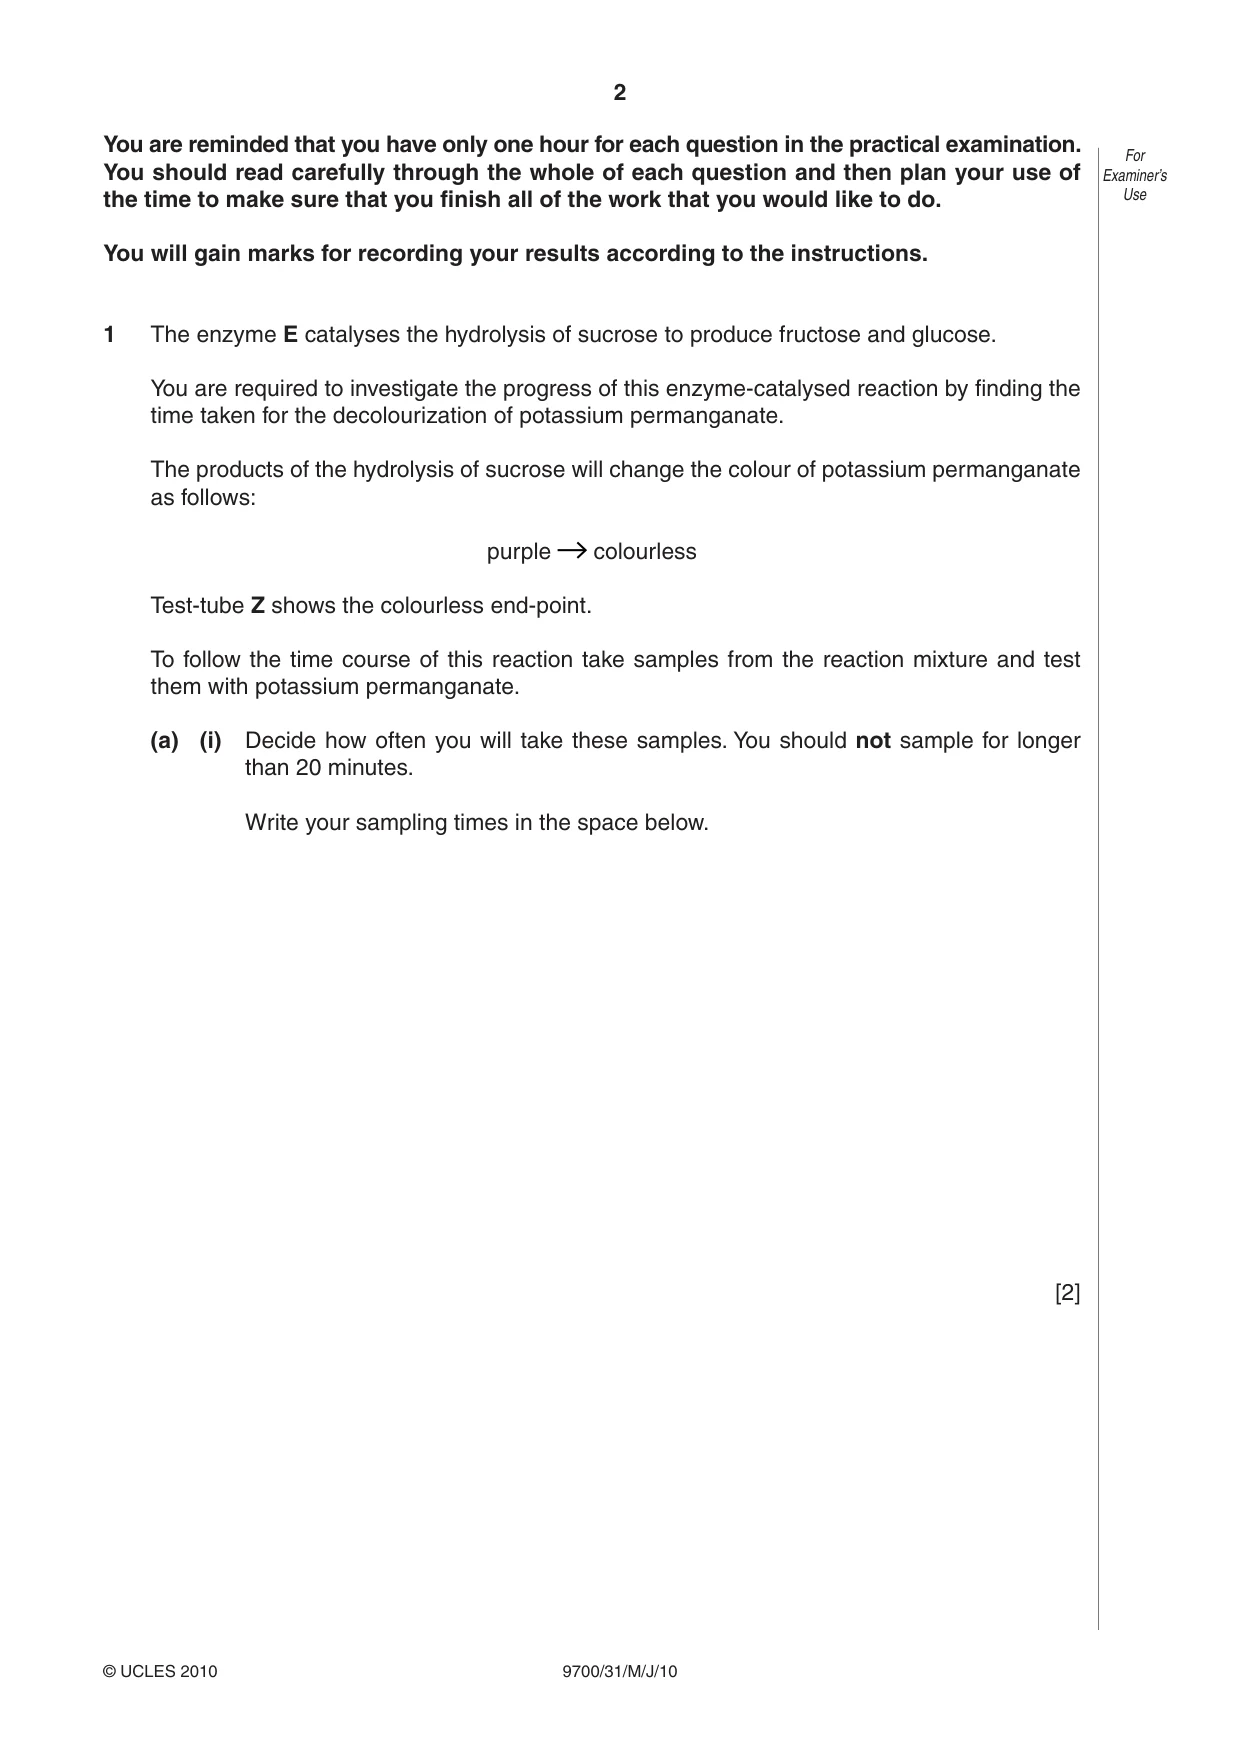
2 9700/31/M/J/10 © UCLES 2010 For Examiner’s Use You are reminded that you have only one hour for each question in the practical examination. You should read carefully through the whole of each question and then plan your use of the time to make sure that you finish all of the work that you would like to do. You will gain marks for recording your results according to the instructions. 1 The enzyme E catalyses the hydrolysis of sucrose to produce fructose and glucose. You are required to investigate the progress of this enzyme-catalysed reaction by finding the time taken for the decolourization of potassium permanganate. The products of the hydrolysis of sucrose will change the colour of potassium permanganate as follows: purple colourless Test-tube Z shows the colourless end-point. To follow the time course of this reaction take samples from the reaction mixture and test them with potassium permanganate. (a) (i) Decide how often you will take these samples. You should not sample for longer than 20 minutes. Write your sampling times in the space below. [2]
Question paper, page 3
3 9700/31/M/J/10 © UCLES 2010 [Turn over For Examiner’s Use (ii) Prepare the space below to record • the time you remove each sample and • the time at which the end-point is reached and • the time taken to reach the end-point. [5]
Question paper, page 4
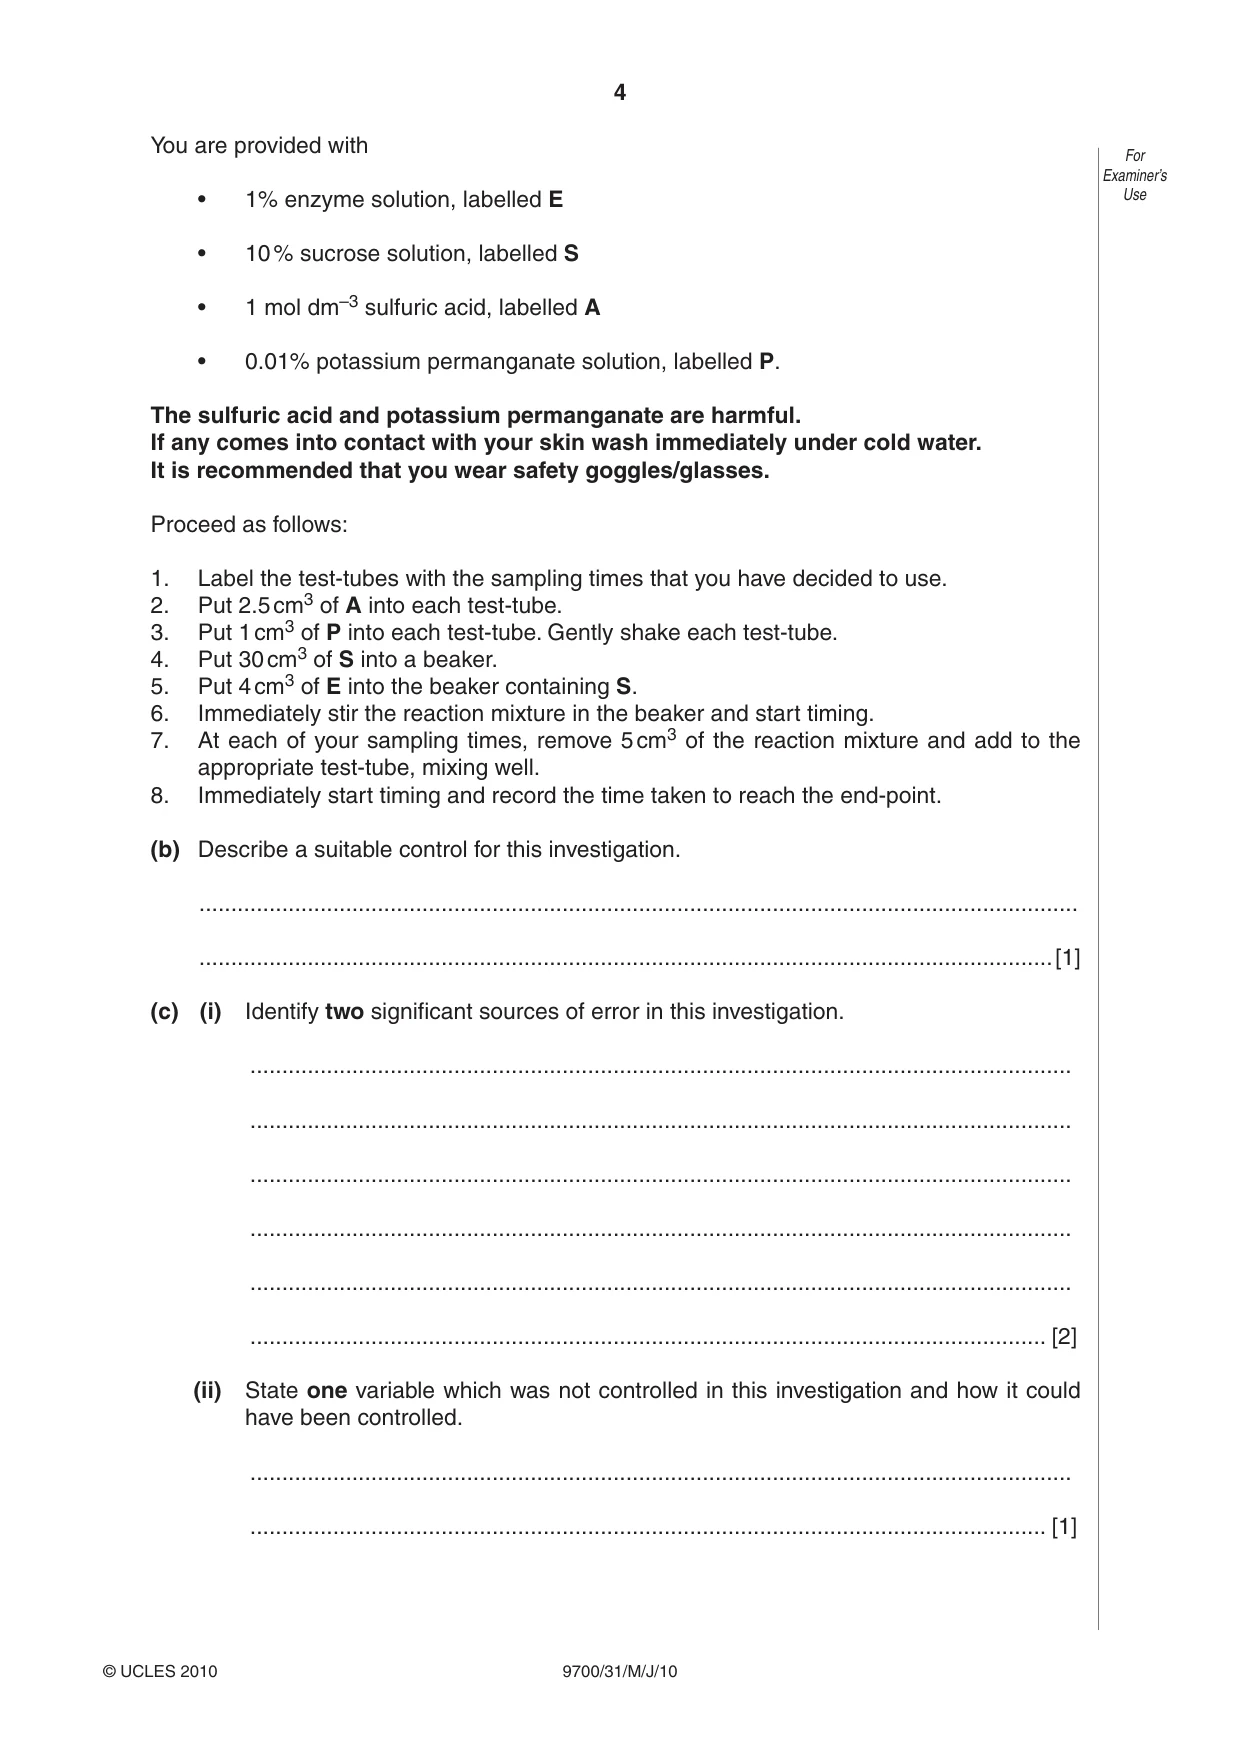
4 9700/31/M/J/10 © UCLES 2010 For Examiner’s Use You are provided with • 1% enzyme solution, labelled E • 10 % sucrose solution, labelled S • 1 mol dm–3 sulfuric acid, labelled A • 0.01% potassium permanganate solution, labelled P. The sulfuric acid and potassium permanganate are harmful. If any comes into contact with your skin wash immediately under cold water. It is recommended that you wear safety goggles/glasses. Proceed as follows: 1. Label the test-tubes with the sampling times that you have decided to use. 2. Put 2.5 cm3 of A into each test-tube. 3. Put 1 cm3 of P into each test-tube. Gently shake each test-tube. 4. Put 30 cm3 of S into a beaker. 5. Put 4 cm3 of E into the beaker containing S. 6. Immediately stir the reaction mixture in the beaker and start timing. 7. At each of your sampling times, remove 5 cm3 of the reaction mixture and add to the appropriate test-tube, mixing well. 8. Immediately start timing and record the time taken to reach the end-point. (b) Describe a suitable control for this investigation. … …[1] (c) (i) Identify two significant sources of error in this investigation. … … … … … … [2] (ii) State one variable which was not controlled in this investigation and how it could have been controlled. … … [1]
Question paper, page 5
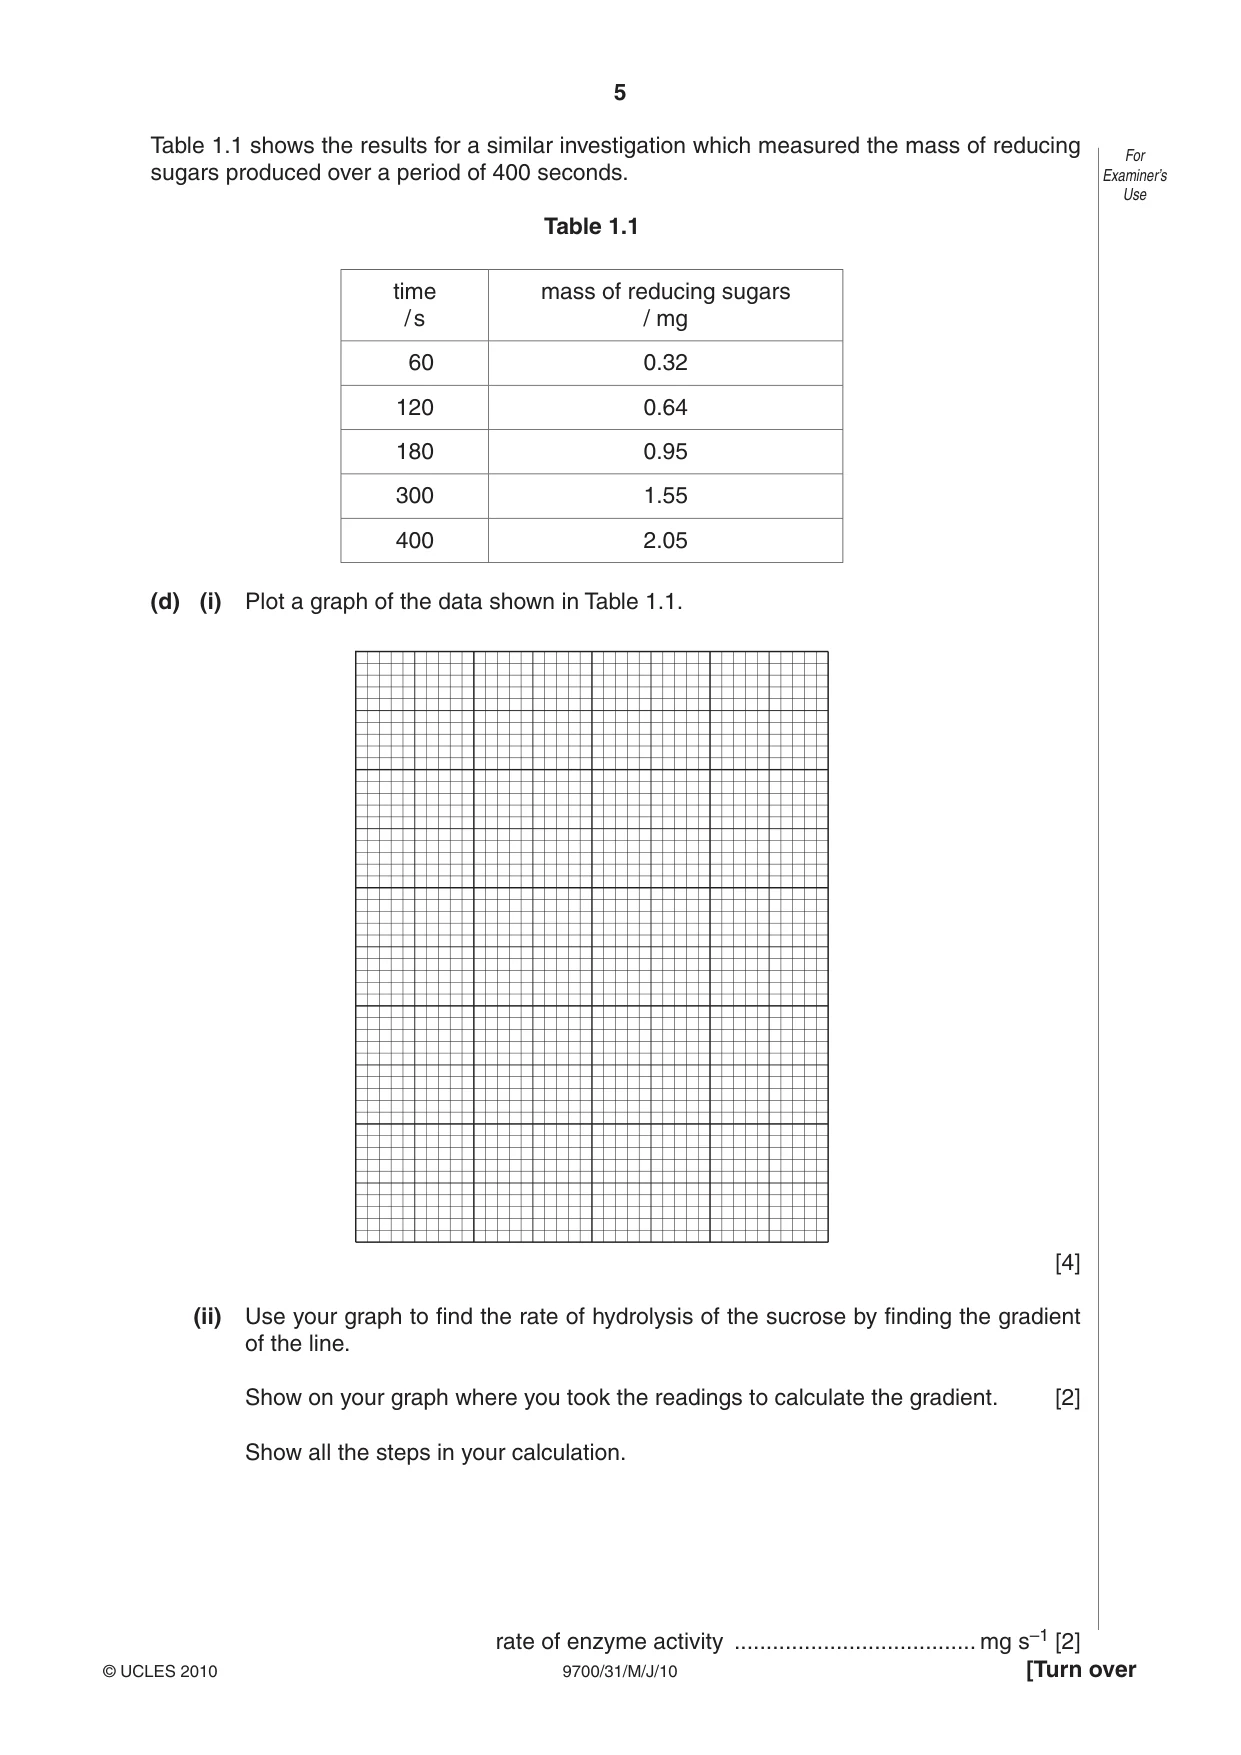
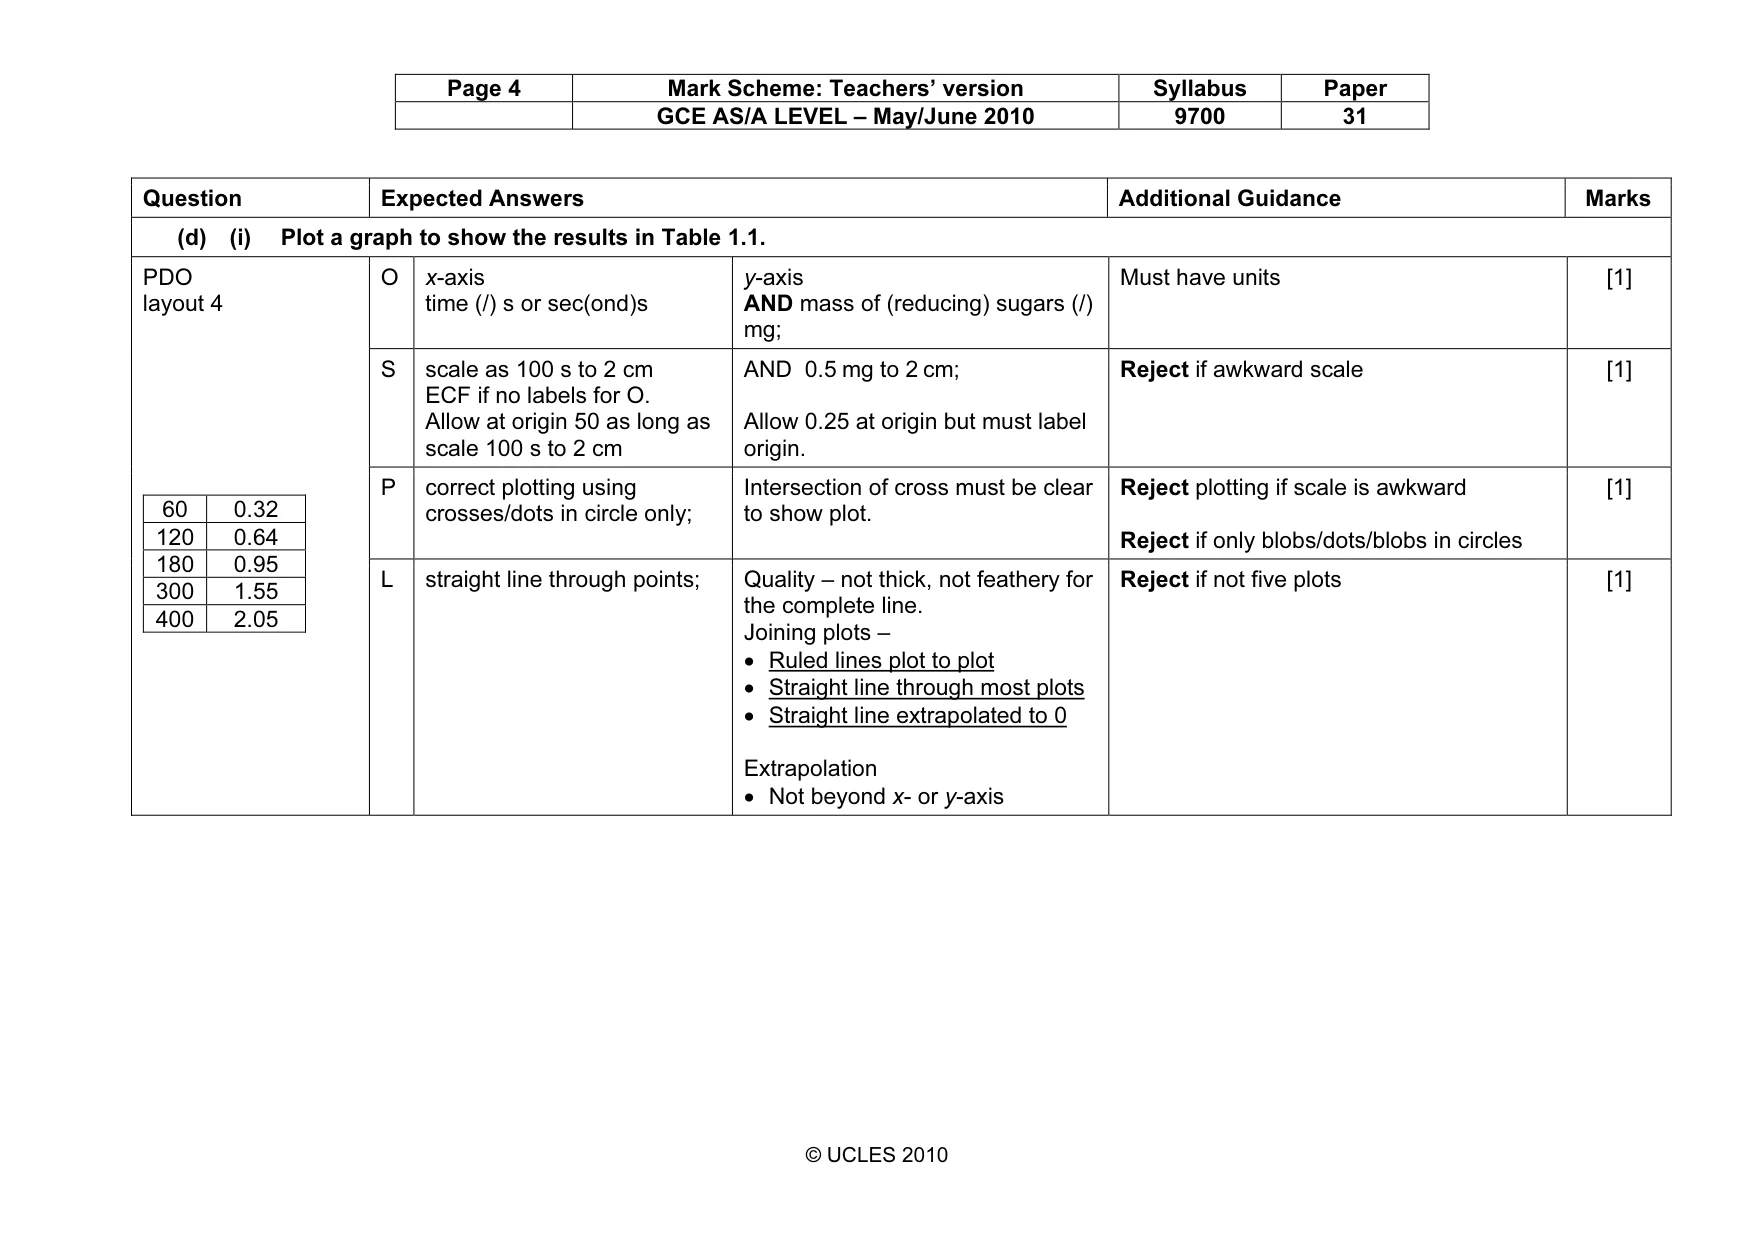
5 9700/31/M/J/10 © UCLES 2010 [Turn over For Examiner’s Use Table 1.1 shows the results for a similar investigation which measured the mass of reducing sugars produced over a period of 400 seconds. Table 1.1 time / s mass of reducing sugars / mg 60 0.32 120 0.64 180 0.95 300 1.55 400 2.05 (d) (i) Plot a graph of the data shown in Table 1.1. [4] (ii) Use your graph to find the rate of hydrolysis of the sucrose by finding the gradient of the line. Show on your graph where you took the readings to calculate the gradient. [2] Show all the steps in your calculation. rate of enzyme activity … mg s–1 [2]
Question paper, page 6
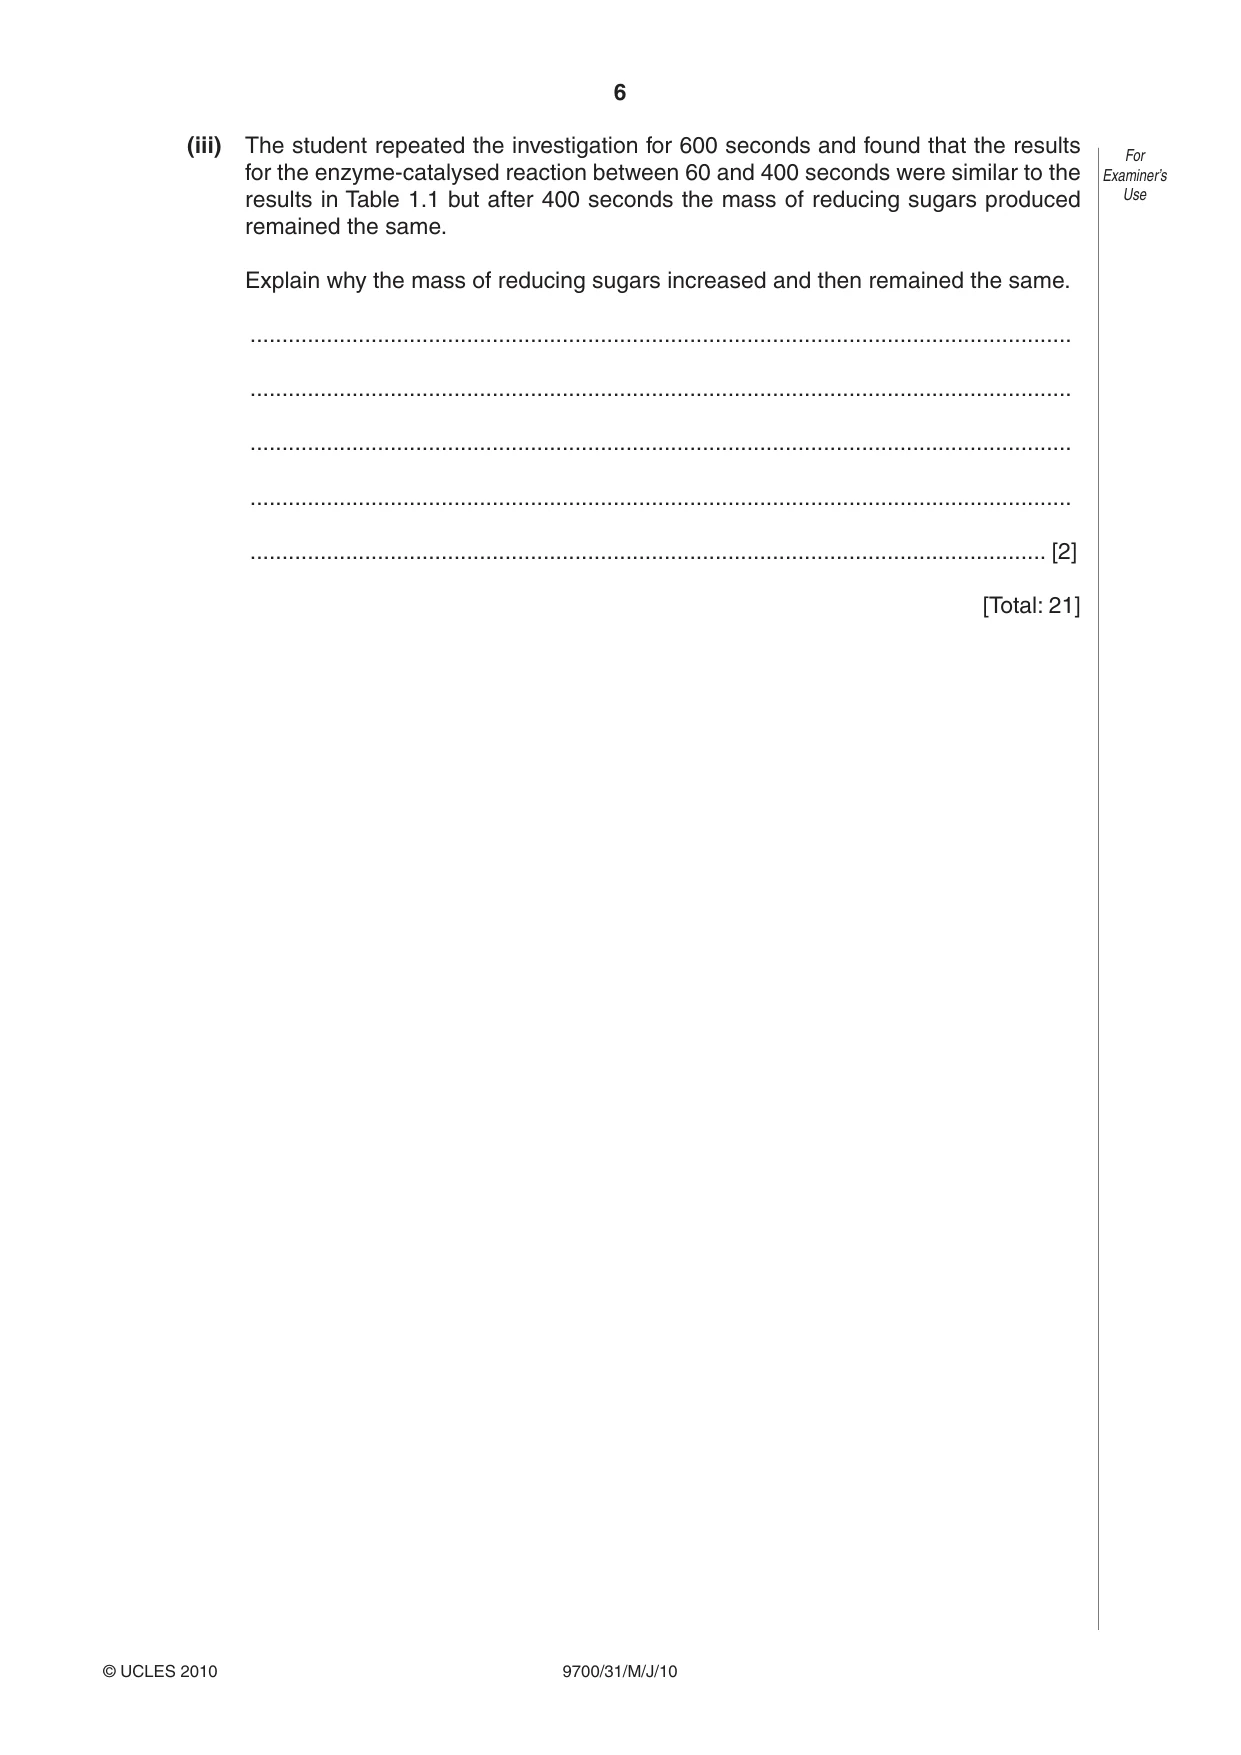
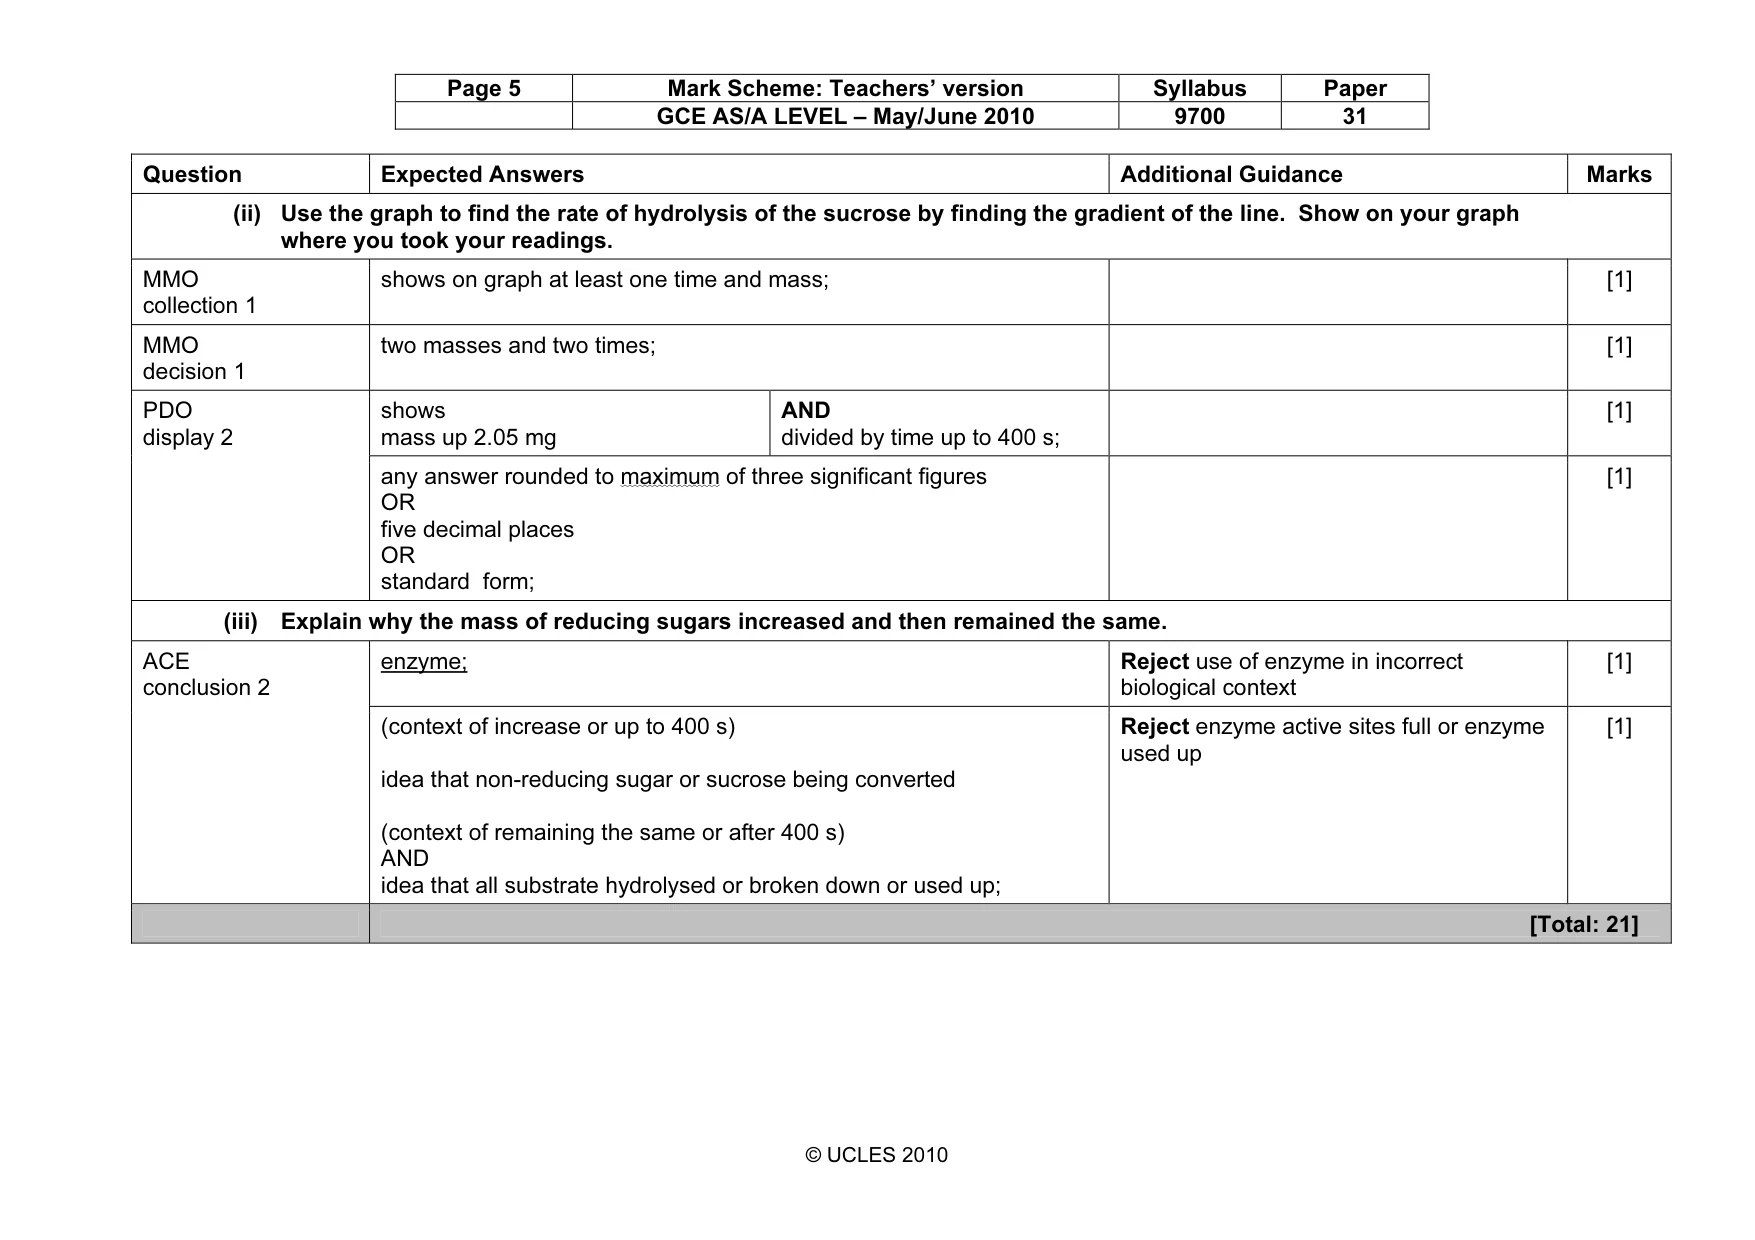
6 9700/31/M/J/10 © UCLES 2010 For Examiner’s Use (iii) The student repeated the investigation for 600 seconds and found that the results for the enzyme-catalysed reaction between 60 and 400 seconds were similar to the results in Table 1.1 but after 400 seconds the mass of reducing sugars produced remained the same. Explain why the mass of reducing sugars increased and then remained the same. … … … … … [2] [Total: 21]
Question paper, page 7
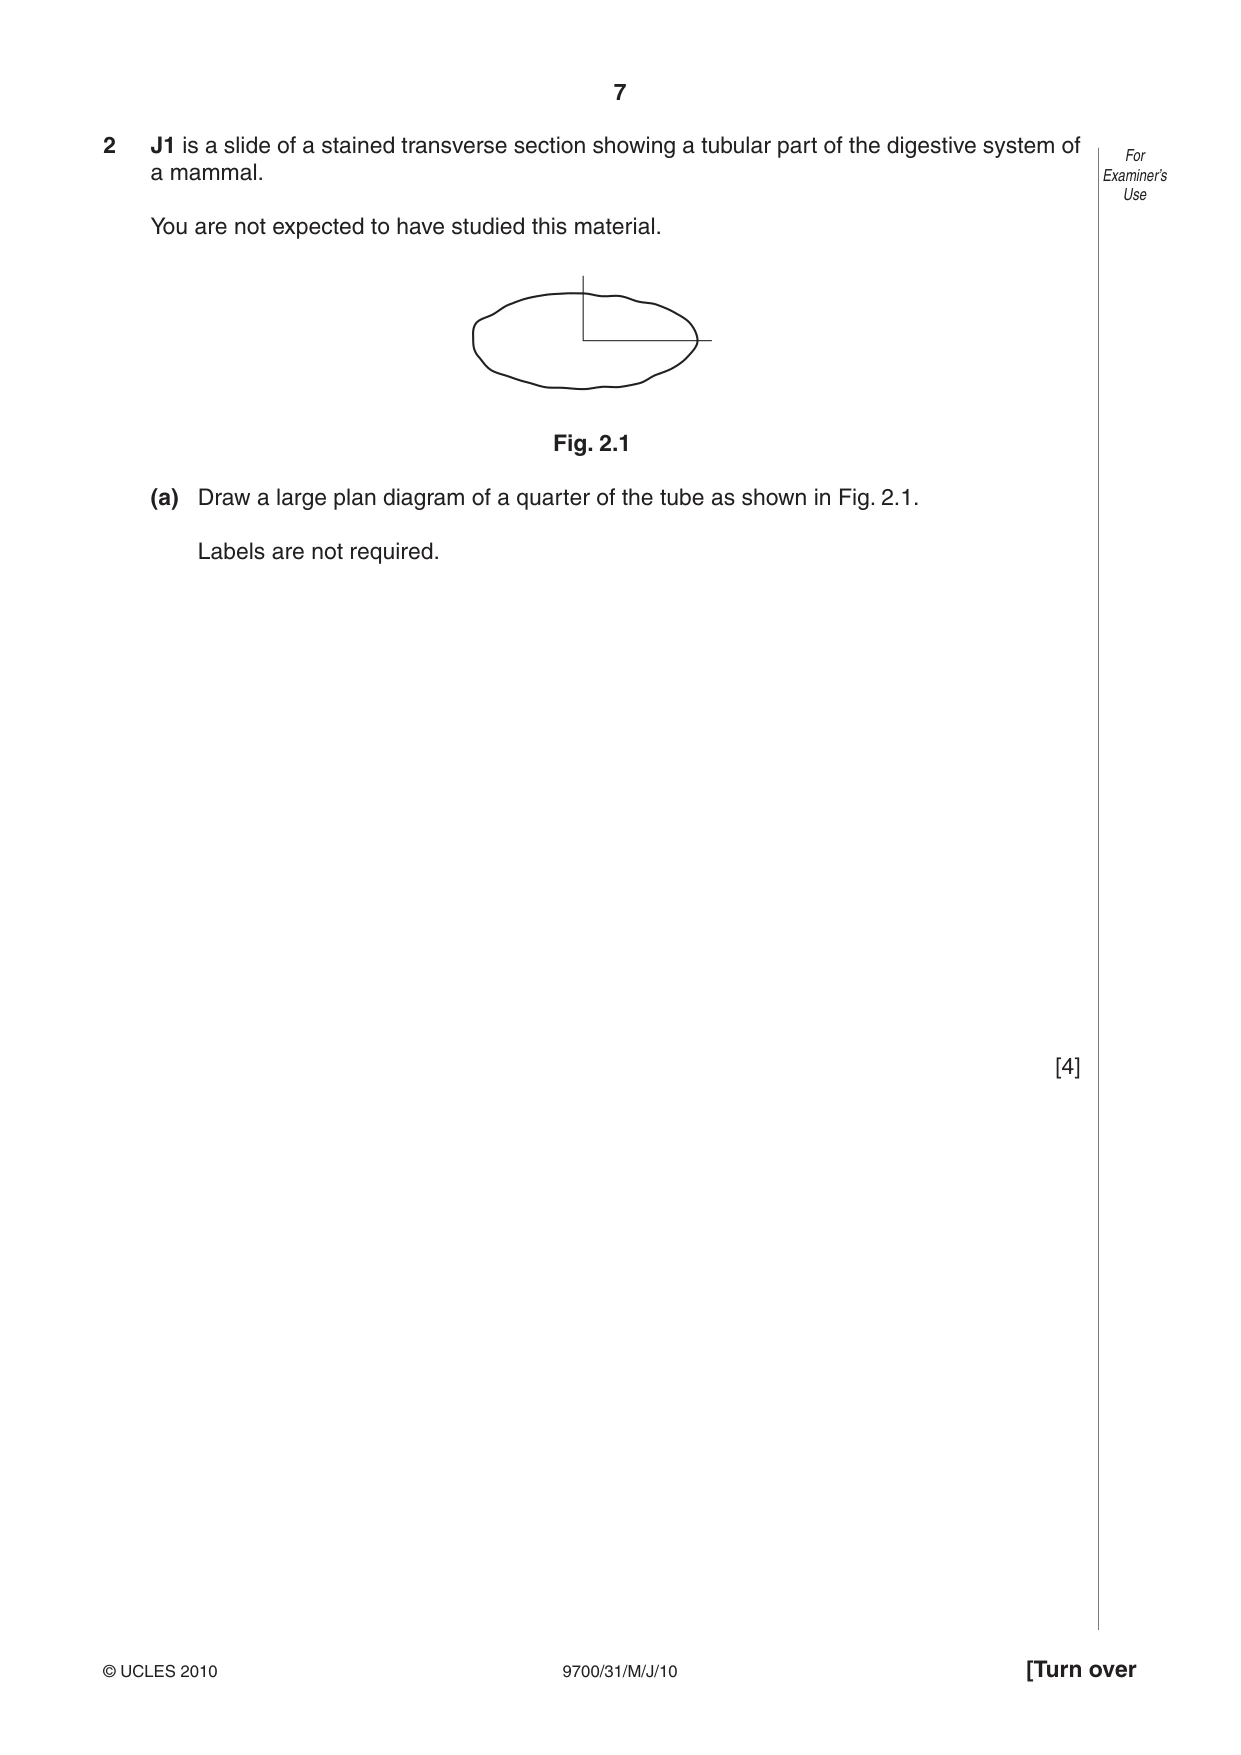
7 9700/31/M/J/10 © UCLES 2010 [Turn over For Examiner’s Use 2 J1 is a slide of a stained transverse section showing a tubular part of the digestive system of a mammal. You are not expected to have studied this material. Fig. 2.1 (a) Draw a large plan diagram of a quarter of the tube as shown in Fig. 2.1. Labels are not required. [4]
Question paper, page 8
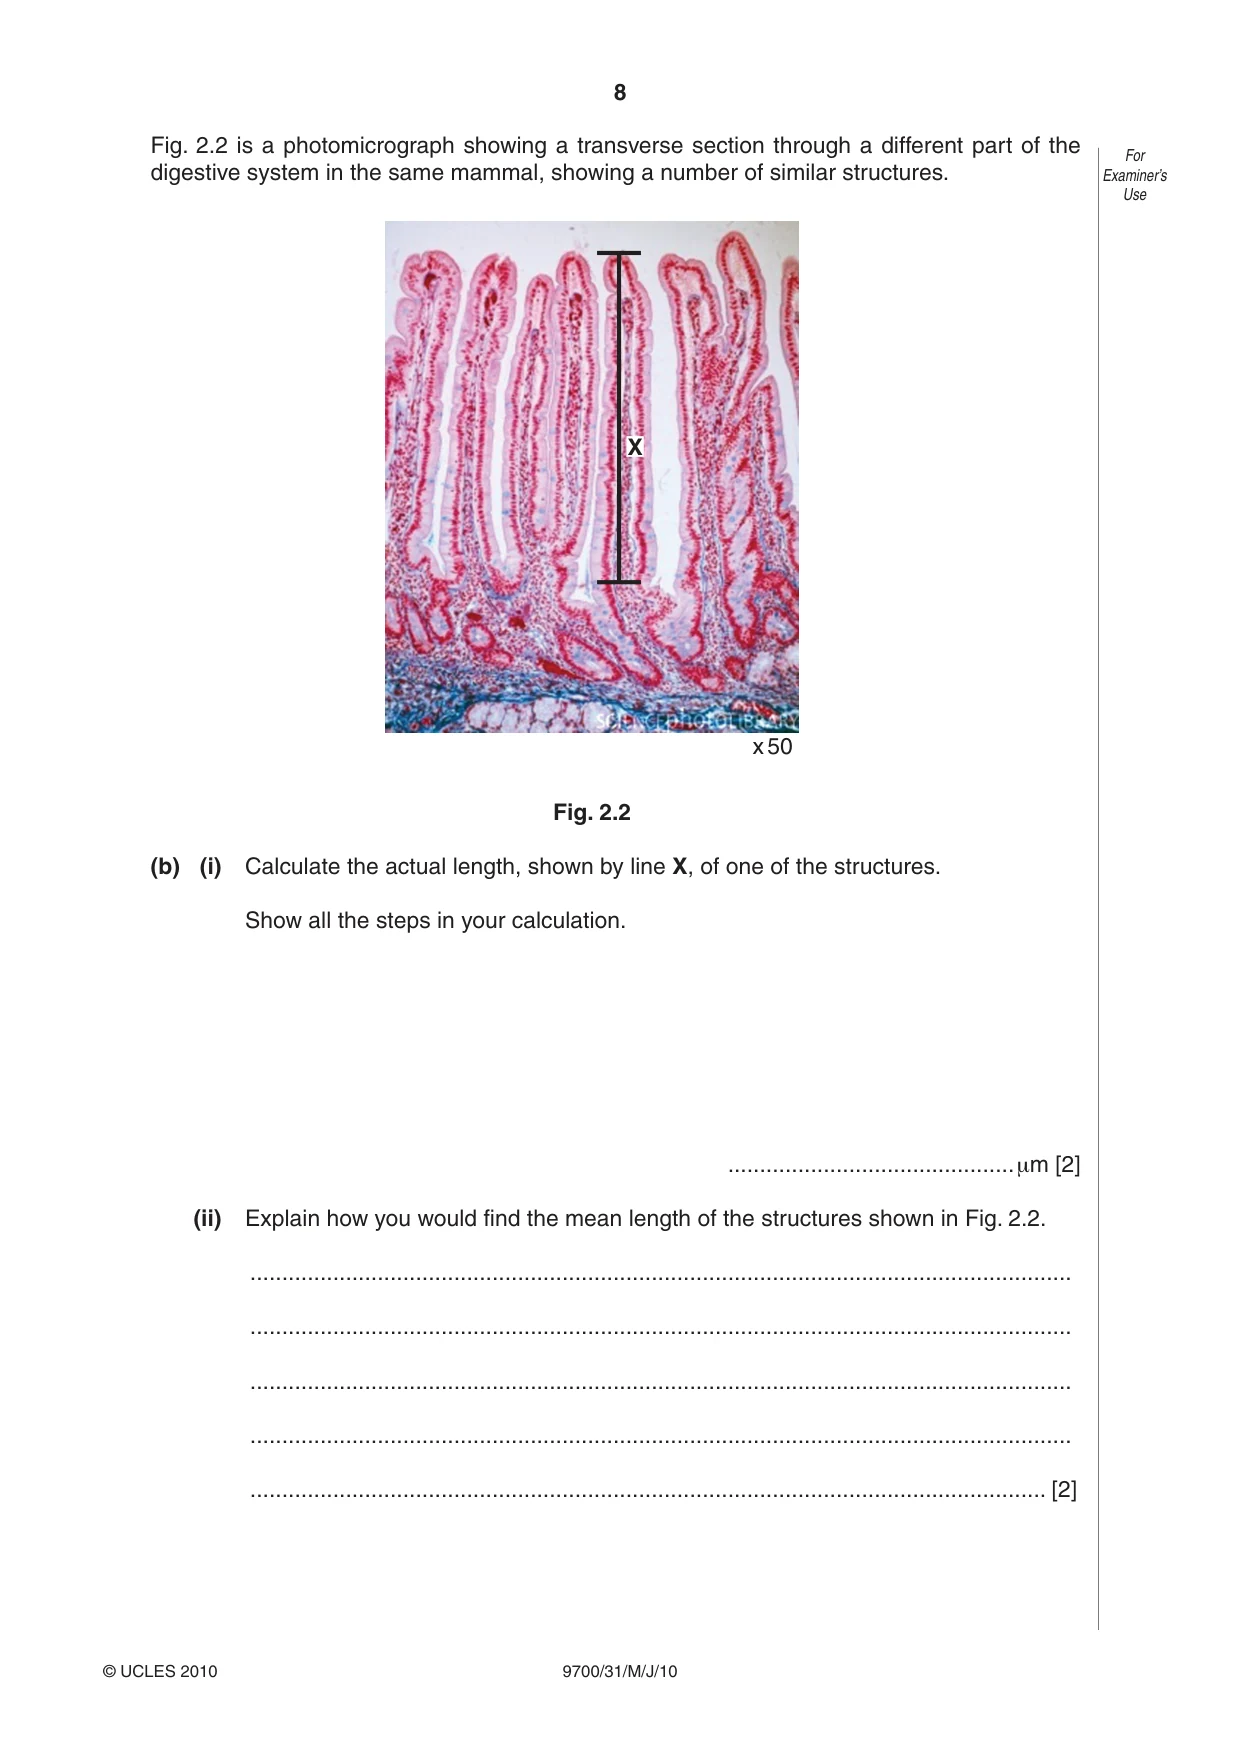
8 9700/31/M/J/10 © UCLES 2010 For Examiner’s Use Fig. 2.2 is a photomicrograph showing a transverse section through a different part of the digestive system in the same mammal, showing a number of similar structures. X x 50 Fig. 2.2 (b) (i) Calculate the actual length, shown by line X, of one of the structures. Show all the steps in your calculation. …μm [2] (ii) Explain how you would find the mean length of the structures shown in Fig. 2.2. … … … … … [2]
Question paper, page 9
9 9700/31/M/J/10 © UCLES 2010 [Turn over For Examiner’s Use (iii) Prepare the space below so that it is suitable for you to compare and contrast the specimen on J1 and that in Fig. 2.2. Record your observations in the space you have prepared. [5] (iv) Suggest how the structures in Fig. 2.2 are adapted for absorption. … … [1]
Question paper, page 10
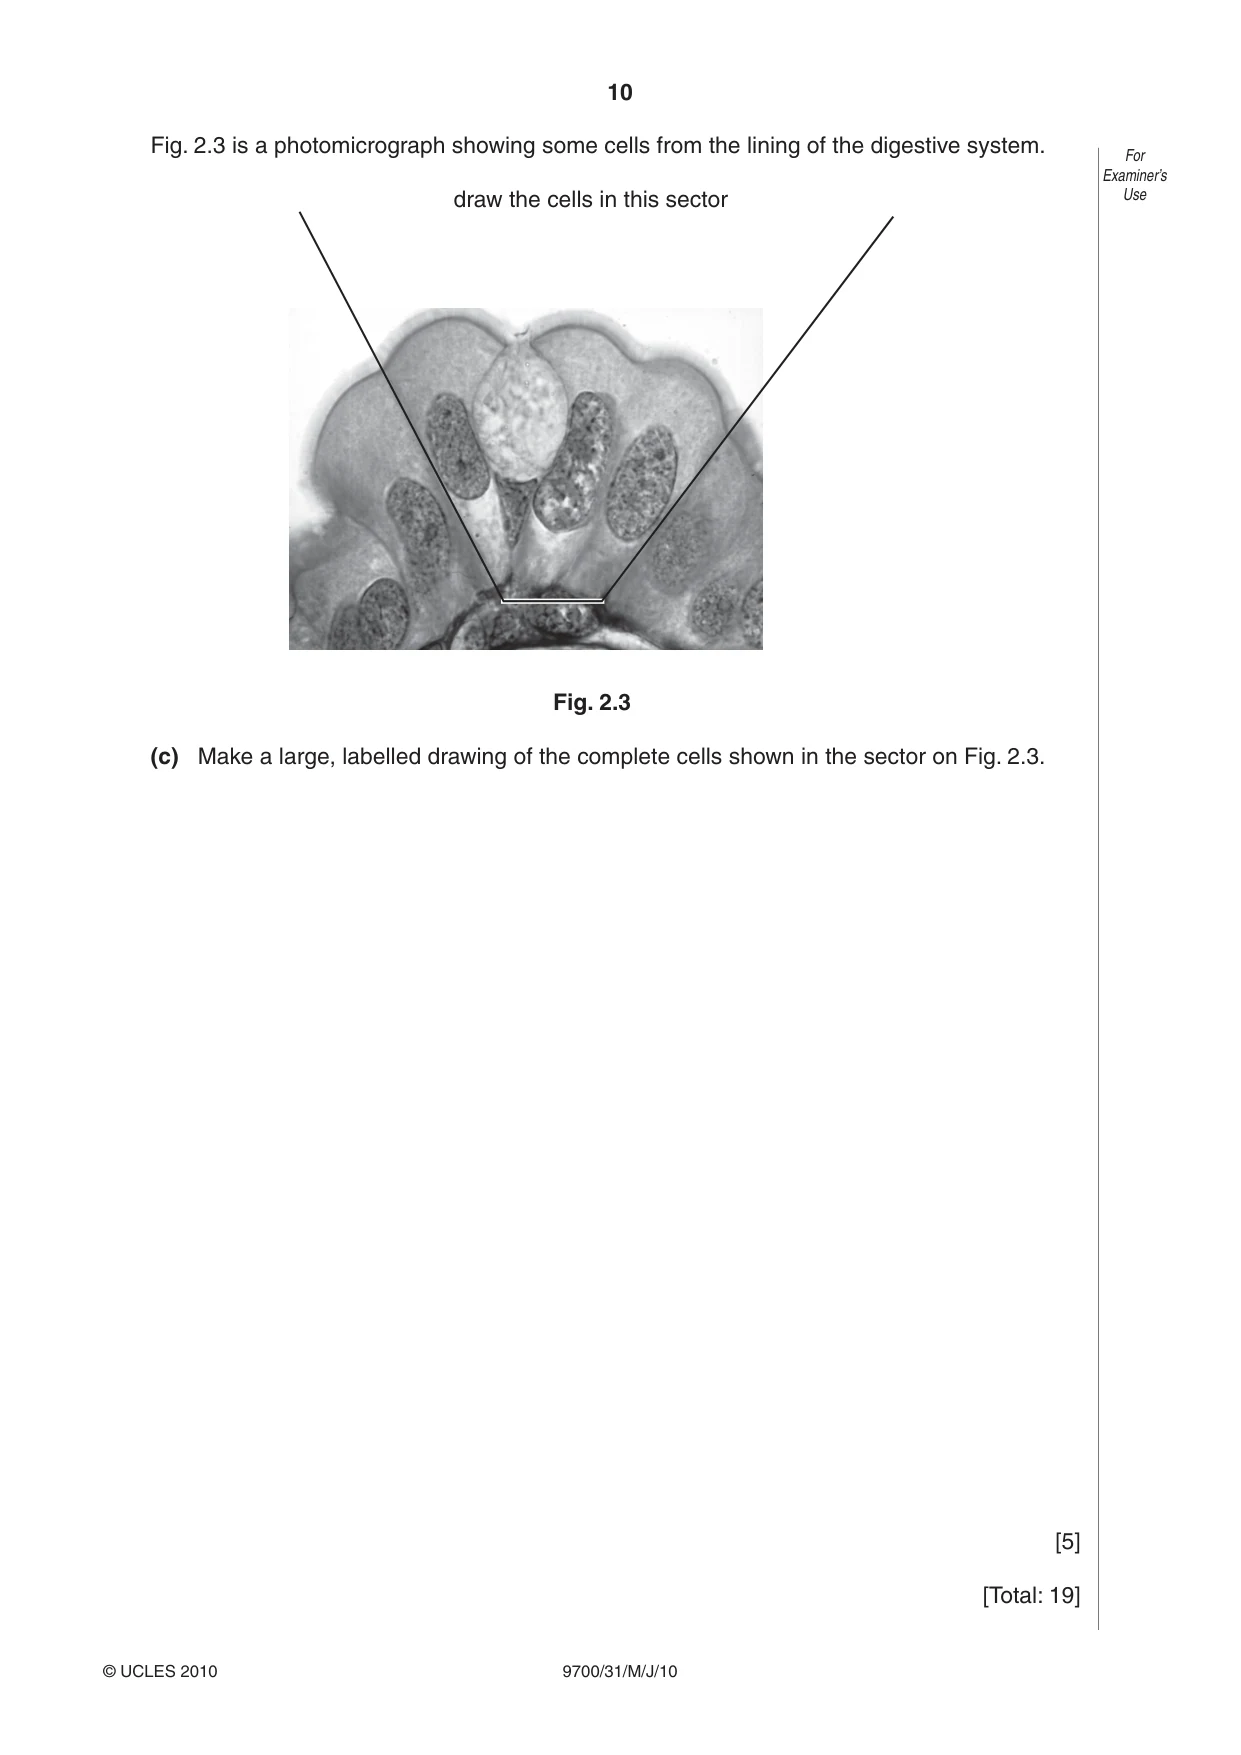
10 9700/31/M/J/10 © UCLES 2010 For Examiner’s Use Fig. 2.3 is a photomicrograph showing some cells from the lining of the digestive system. draw the cells in this sector Fig. 2.3 (c) Make a large, labelled drawing of the complete cells shown in the sector on Fig. 2.3. [5] [Total: 19]
Question paper, page 11
11 9700/31/M/J/10 © UCLES 2010 BLANK PAGE
Question paper, page 12
12 9700/31/M/J/10 © UCLES 2010 BLANK PAGE Copyright Acknowledgements: Figure 2.2 © Manfred Kage/Science Photo Library. Permission to reproduce items where third-party owned material protected by copyright is included has been sought and cleared where possible. Every reasonable effort has been made by the publisher (UCLES) to trace copyright holders, but if any items requiring clearance have unwittingly been included, the publisher will be pleased to make amends at the earliest possible opportunity. University of Cambridge International Examinations is part of the Cambridge Assessment Group. Cambridge Assessment is the brand name of University of Cambridge Local Examinations Syndicate (UCLES), which is itself a department of the University of Cambridge.
Mark scheme, page 1
UNIVERSITY OF CAMBRIDGE INTERNATIONAL EXAMINATIONS GCE Advanced Subsidiary Level and GCE Advanced Level MARK SCHEME for the May/June 2010 question paper for the guidance of teachers 9700 BIOLOGY 9700/31 Paper 31 (Advanced Practical Skills 1), maximum raw mark 40 This mark scheme is published as an aid to teachers and candidates, to indicate the requirements of the examination. It shows the basis on which Examiners were instructed to award marks. It does not indicate the details of the discussions that took place at an Examiners’ meeting before marking began, which would have considered the acceptability of alternative answers. Mark schemes must be read in conjunction with the question papers and the report on the examination. • CIE will not enter into discussions or correspondence in connection with these mark schemes. CIE is publishing the mark schemes for the May/June 2010 question papers for most IGCSE, GCE Advanced Level and Advanced Subsidiary Level syllabuses and some Ordinary Level syllabuses.
Mark scheme, page 2
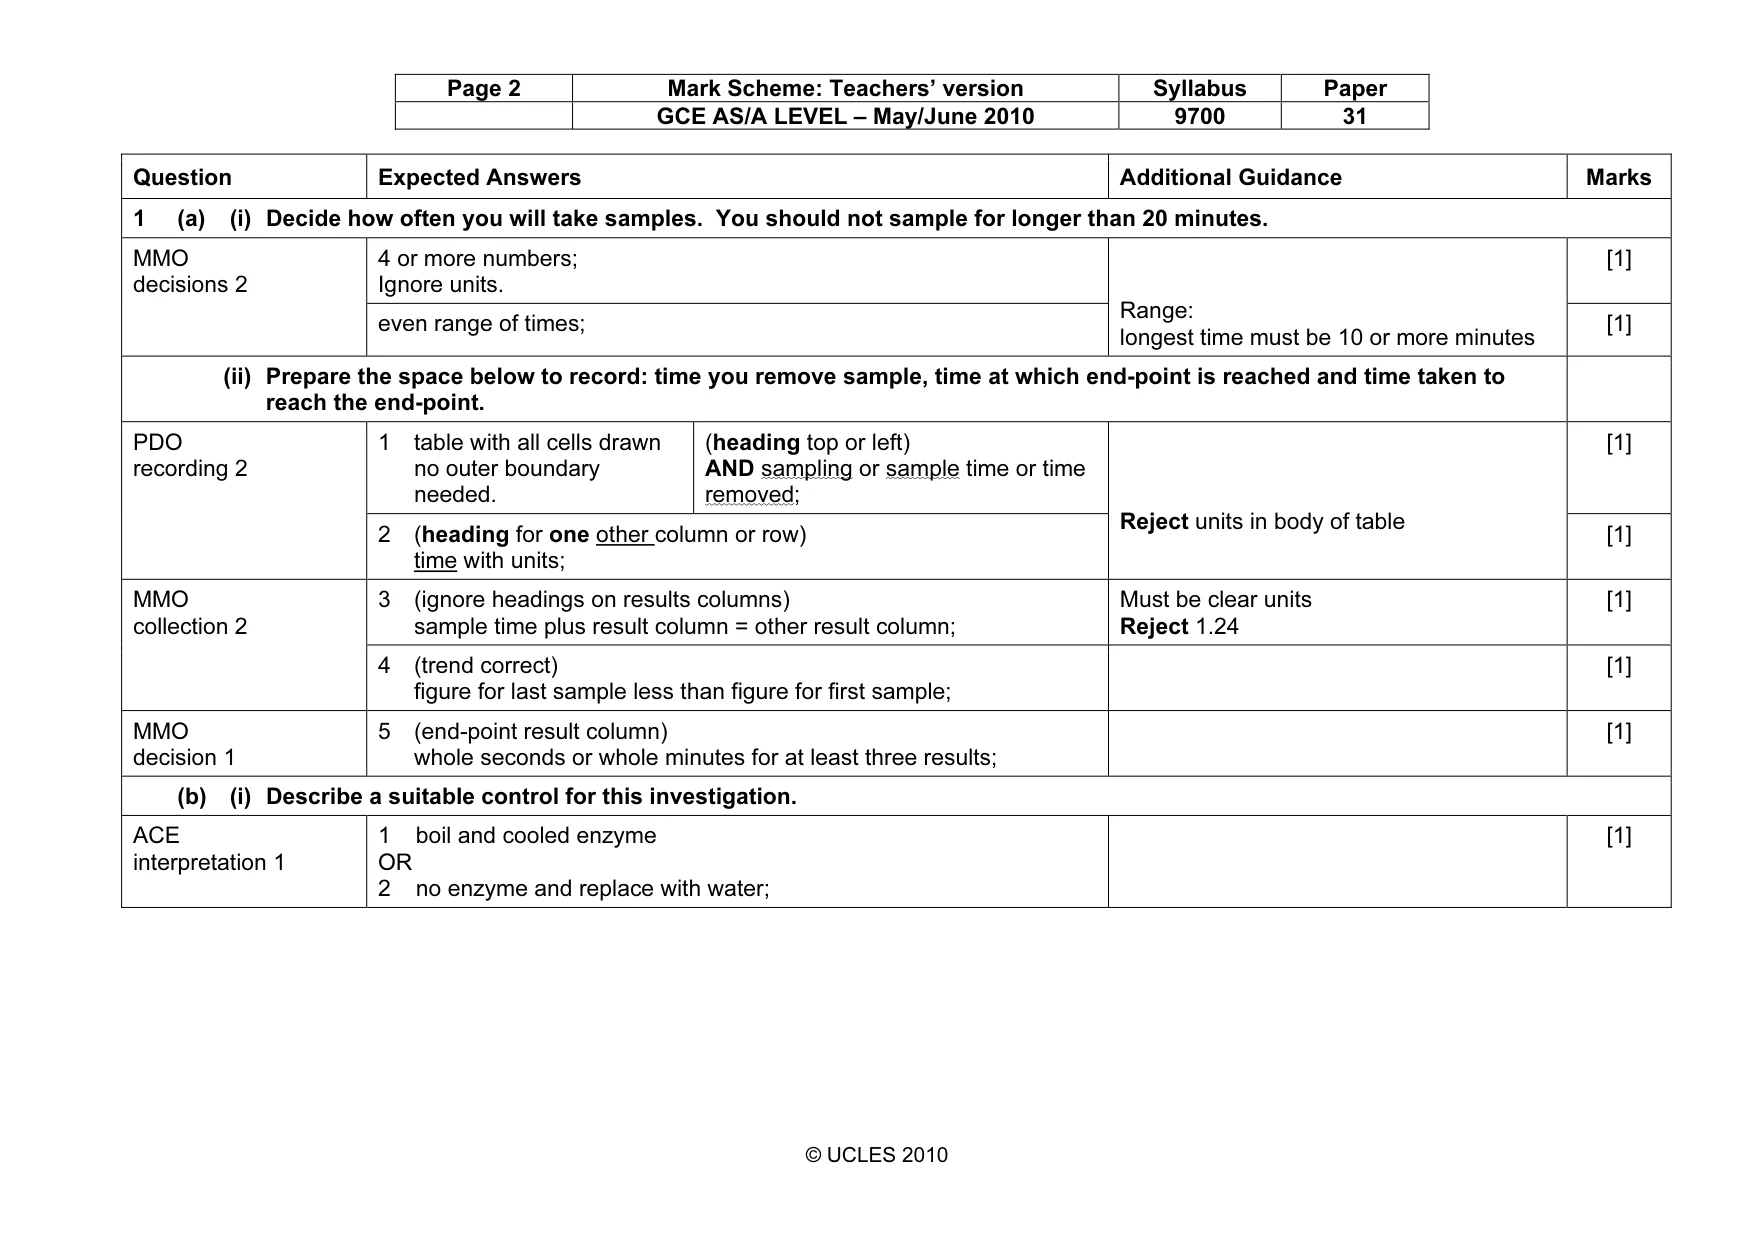
Page 2 Mark Scheme: Teachers’ version Syllabus Paper GCE AS/A LEVEL – May/June 2010 9700 31 © UCLES 2010 Question Expected Answers Additional Guidance Marks 1 (a) (i) Decide how often you will take samples. You should not sample for longer than 20 minutes. 4 or more numbers; Ignore units. [1] MMO decisions 2 even range of times; Range: longest time must be 10 or more minutes [1] (ii) Prepare the space below to record: time you remove sample, time at which end-point is reached and time taken to reach the end-point. 1 table with all cells drawn no outer boundary needed. (heading top or left) AND sampling or sample time or time removed; [1] PDO recording 2 2 (heading for one other column or row) time with units; Reject units in body of table [1] 3 (ignore headings on results columns) sample time plus result column = other result column; Must be clear units Reject 1.24 [1] MMO collection 2 4 (trend correct) figure for last sample less than figure for first sample; [1] MMO decision 1 5 (end-point result column) whole seconds or whole minutes for at least three results; [1] (b) (i) Describe a suitable control for this investigation. ACE interpretation 1 1 boil and cooled enzyme OR 2 no enzyme and replace with water; [1]
Mark scheme, page 3
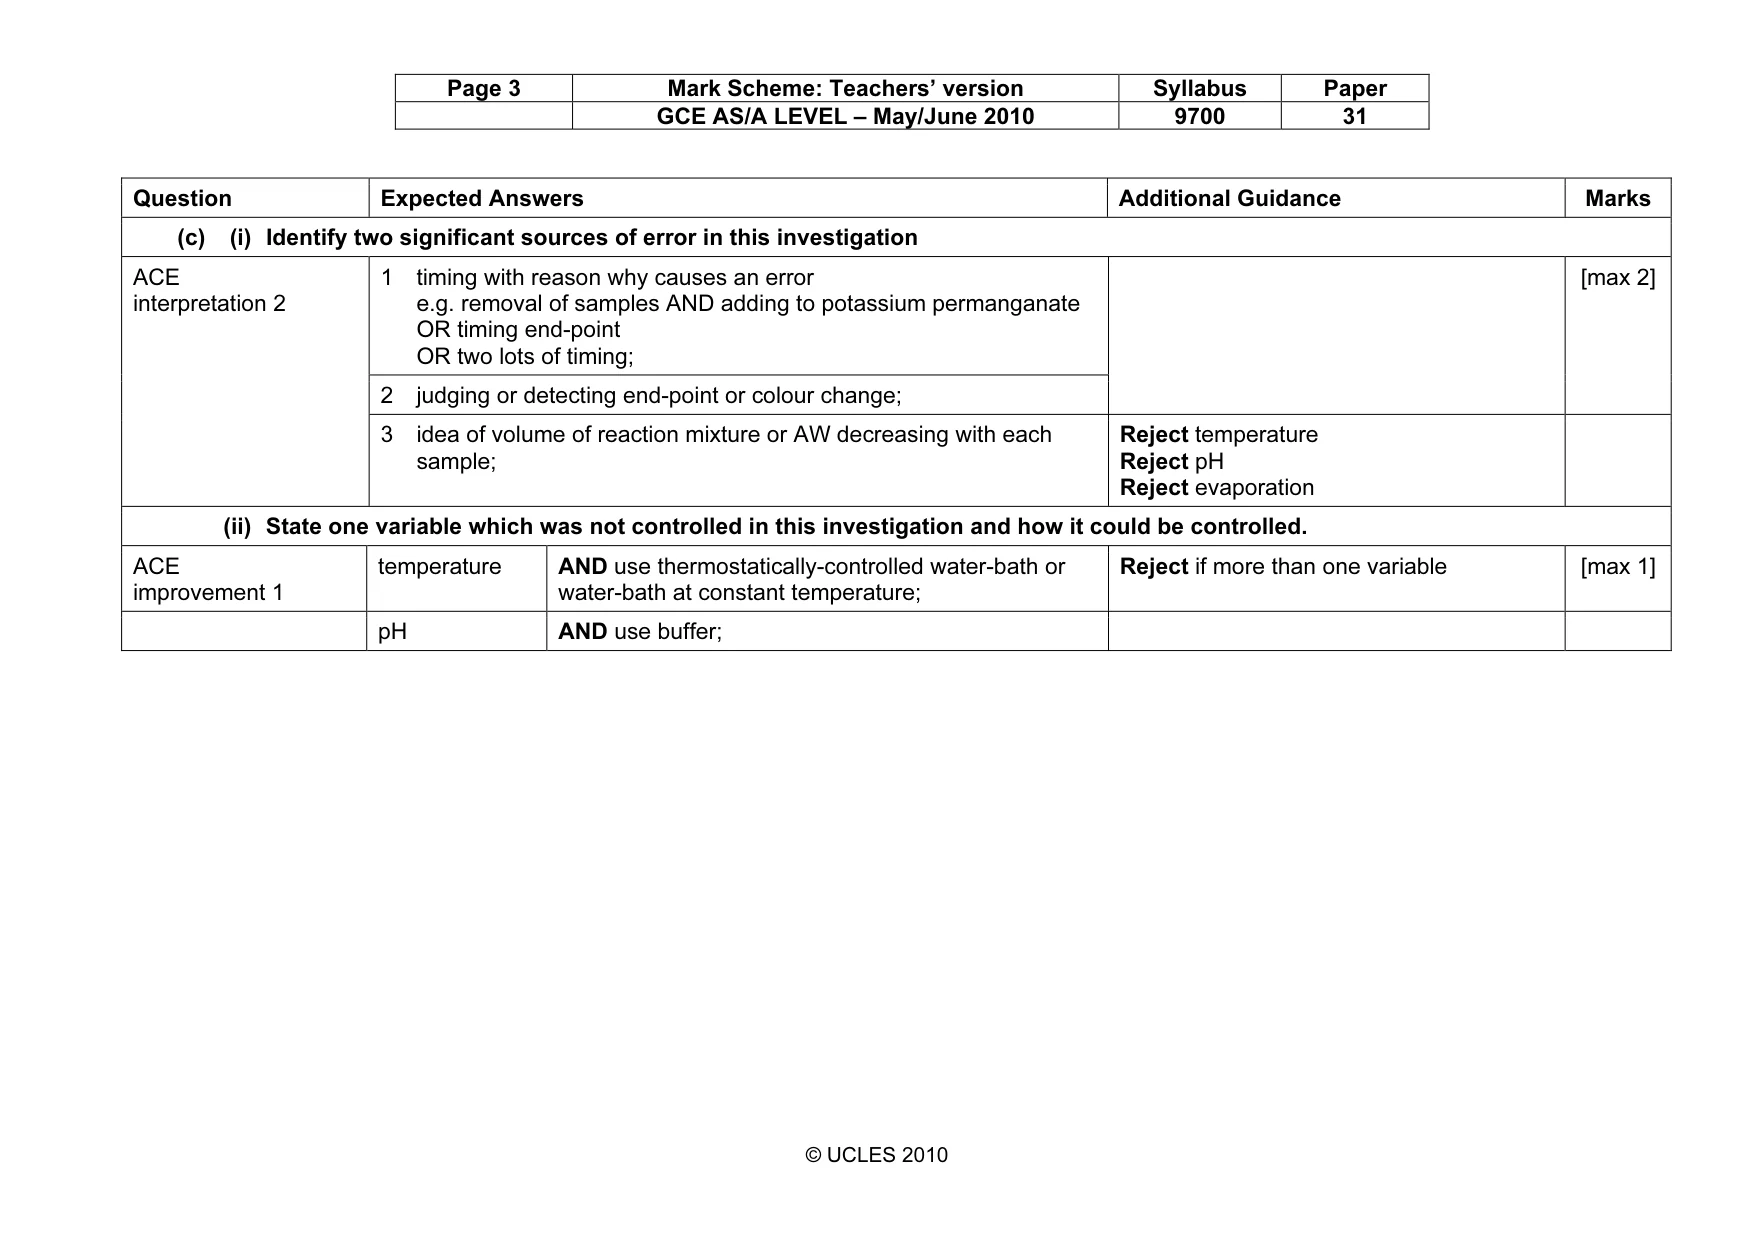
Page 3 Mark Scheme: Teachers’ version Syllabus Paper GCE AS/A LEVEL – May/June 2010 9700 31 © UCLES 2010 Question Expected Answers Additional Guidance Marks (c) (i) Identify two significant sources of error in this investigation 1 timing with reason why causes an error e.g. removal of samples AND adding to potassium permanganate OR timing end-point OR two lots of timing; 2 judging or detecting end-point or colour change; [max 2] ACE interpretation 2 3 idea of volume of reaction mixture or AW decreasing with each sample; Reject temperature Reject pH Reject evaporation (ii) State one variable which was not controlled in this investigation and how it could be controlled. ACE improvement 1 temperature AND use thermostatically-controlled water-bath or water-bath at constant temperature; Reject if more than one variable [max 1] pH AND use buffer;
Mark scheme, page 4
Page 4 Mark Scheme: Teachers’ version Syllabus Paper GCE AS/A LEVEL – May/June 2010 9700 31 © UCLES 2010 Question Expected Answers Additional Guidance Marks (d) (i) Plot a graph to show the results in Table 1.1. O x-axis time (/) s or sec(ond)s y-axis AND mass of (reducing) sugars (/) mg; Must have units [1] S scale as 100 s to 2 cm ECF if no labels for O. Allow at origin 50 as long as scale 100 s to 2 cm AND 0.5 mg to 2 cm; Allow 0.25 at origin but must label origin. Reject if awkward scale [1] P correct plotting using crosses/dots in circle only; Intersection of cross must be clear to show plot. Reject plotting if scale is awkward Reject if only blobs/dots/blobs in circles [1] PDO layout 4 60 0.32 120 0.64 180 0.95 300 1.55 400 2.05 L straight line through points; Quality – not thick, not feathery for the complete line. Joining plots – • Ruled lines plot to plot • Straight line through most plots • Straight line extrapolated to 0 Extrapolation • Not beyond x- or y-axis Reject if not five plots [1]
Mark scheme, page 5
Page 5 Mark Scheme: Teachers’ version Syllabus Paper GCE AS/A LEVEL – May/June 2010 9700 31 © UCLES 2010 Question Expected Answers Additional Guidance Marks (ii) Use the graph to find the rate of hydrolysis of the sucrose by finding the gradient of the line. Show on your graph where you took your readings. MMO collection 1 shows on graph at least one time and mass; [1] MMO decision 1 two masses and two times; [1] shows mass up 2.05 mg AND divided by time up to 400 s; [1] PDO display 2 any answer rounded to maximum of three significant figures OR five decimal places OR standard form; [1] (iii) Explain why the mass of reducing sugars increased and then remained the same. enzyme; Reject use of enzyme in incorrect biological context [1] ACE conclusion 2 (context of increase or up to 400 s) idea that non-reducing sugar or sucrose being converted (context of remaining the same or after 400 s) AND idea that all substrate hydrolysed or broken down or used up; Reject enzyme active sites full or enzyme used up [1] [Total: 21]
Mark scheme, page 6
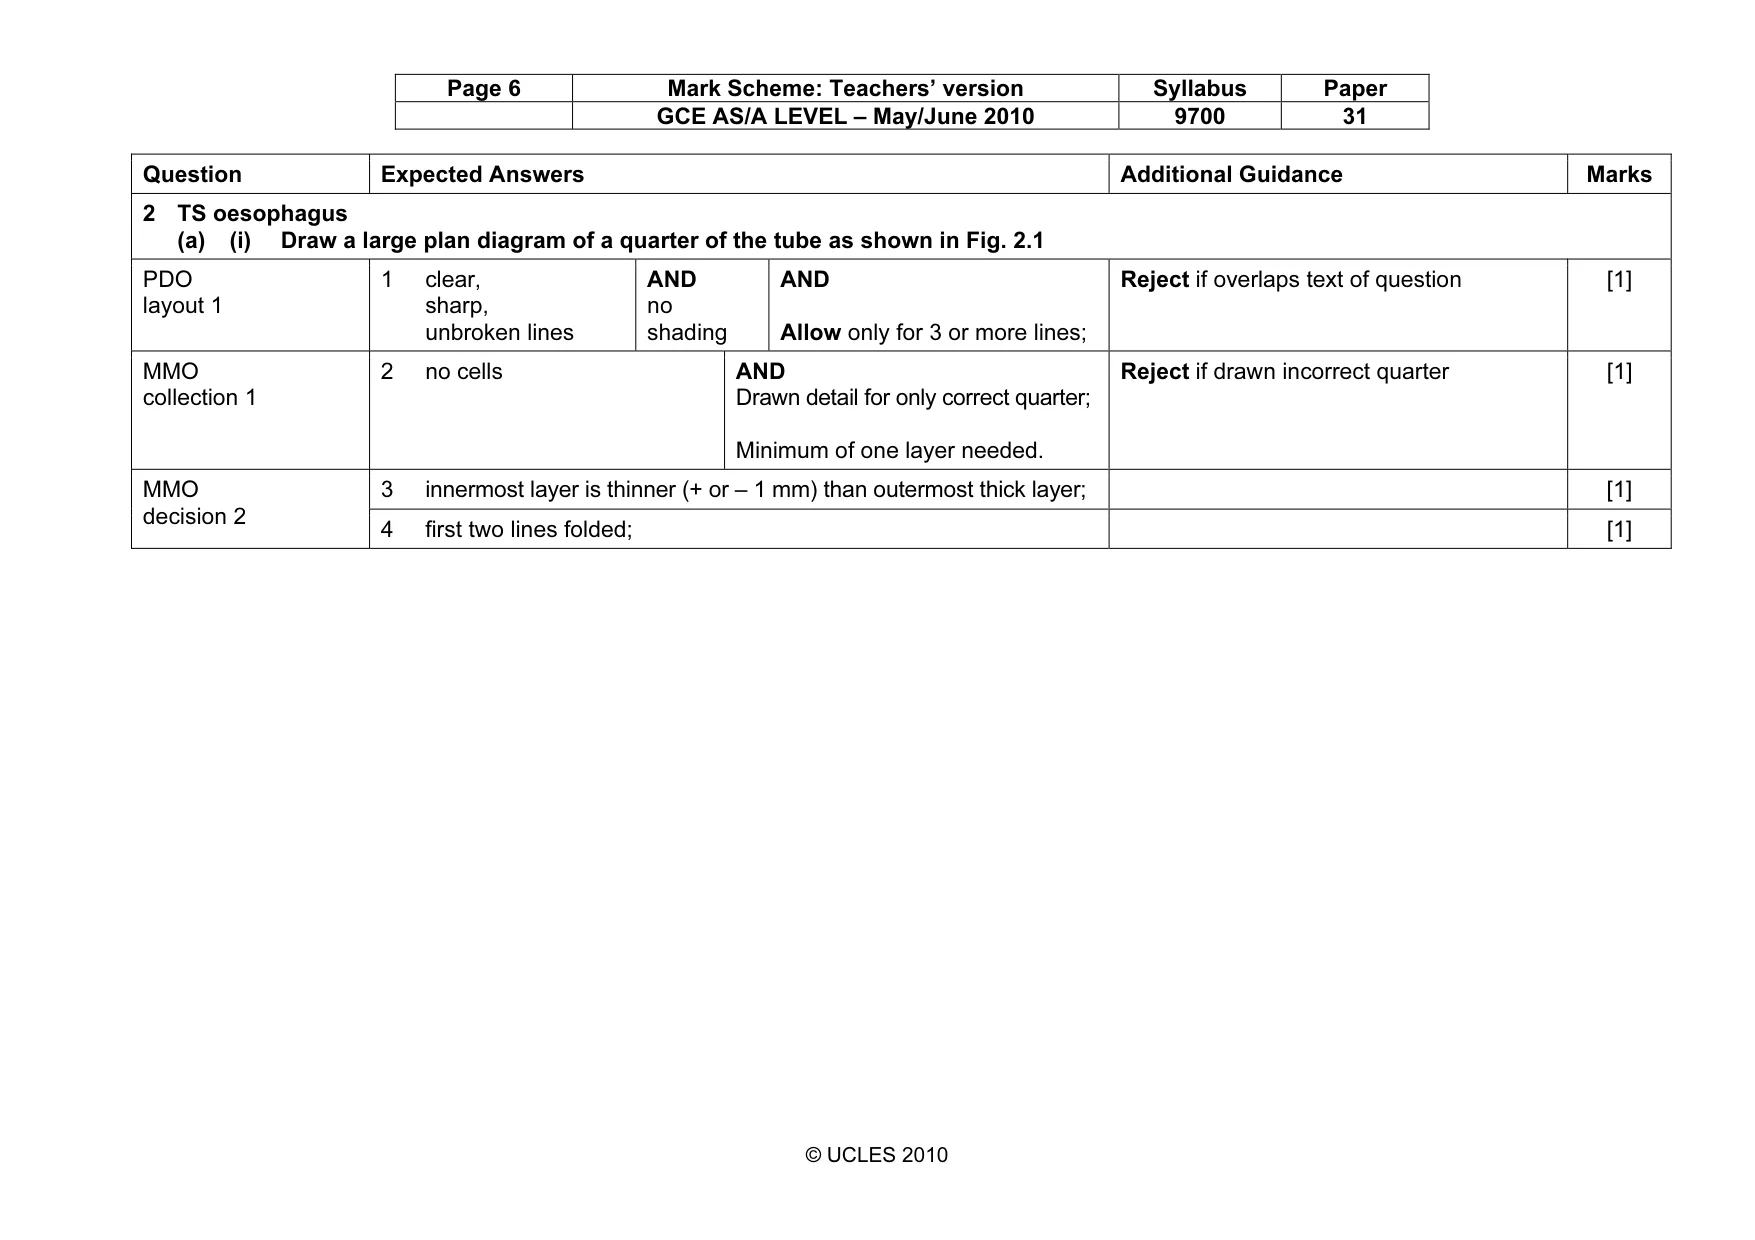
Page 6 Mark Scheme: Teachers’ version Syllabus Paper GCE AS/A LEVEL – May/June 2010 9700 31 © UCLES 2010 Question Expected Answers Additional Guidance Marks 2 TS oesophagus (a) (i) Draw a large plan diagram of a quarter of the tube as shown in Fig. 2.1 PDO layout 1 1 clear, sharp, unbroken lines AND no shading AND Allow only for 3 or more lines; Reject if overlaps text of question [1] MMO collection 1 2 no cells AND Drawn detail for only correct quarter; Minimum of one layer needed. Reject if drawn incorrect quarter [1] 3 innermost layer is thinner (+ or – 1 mm) than outermost thick layer; [1] MMO decision 2 4 first two lines folded; [1]
Mark scheme, page 7
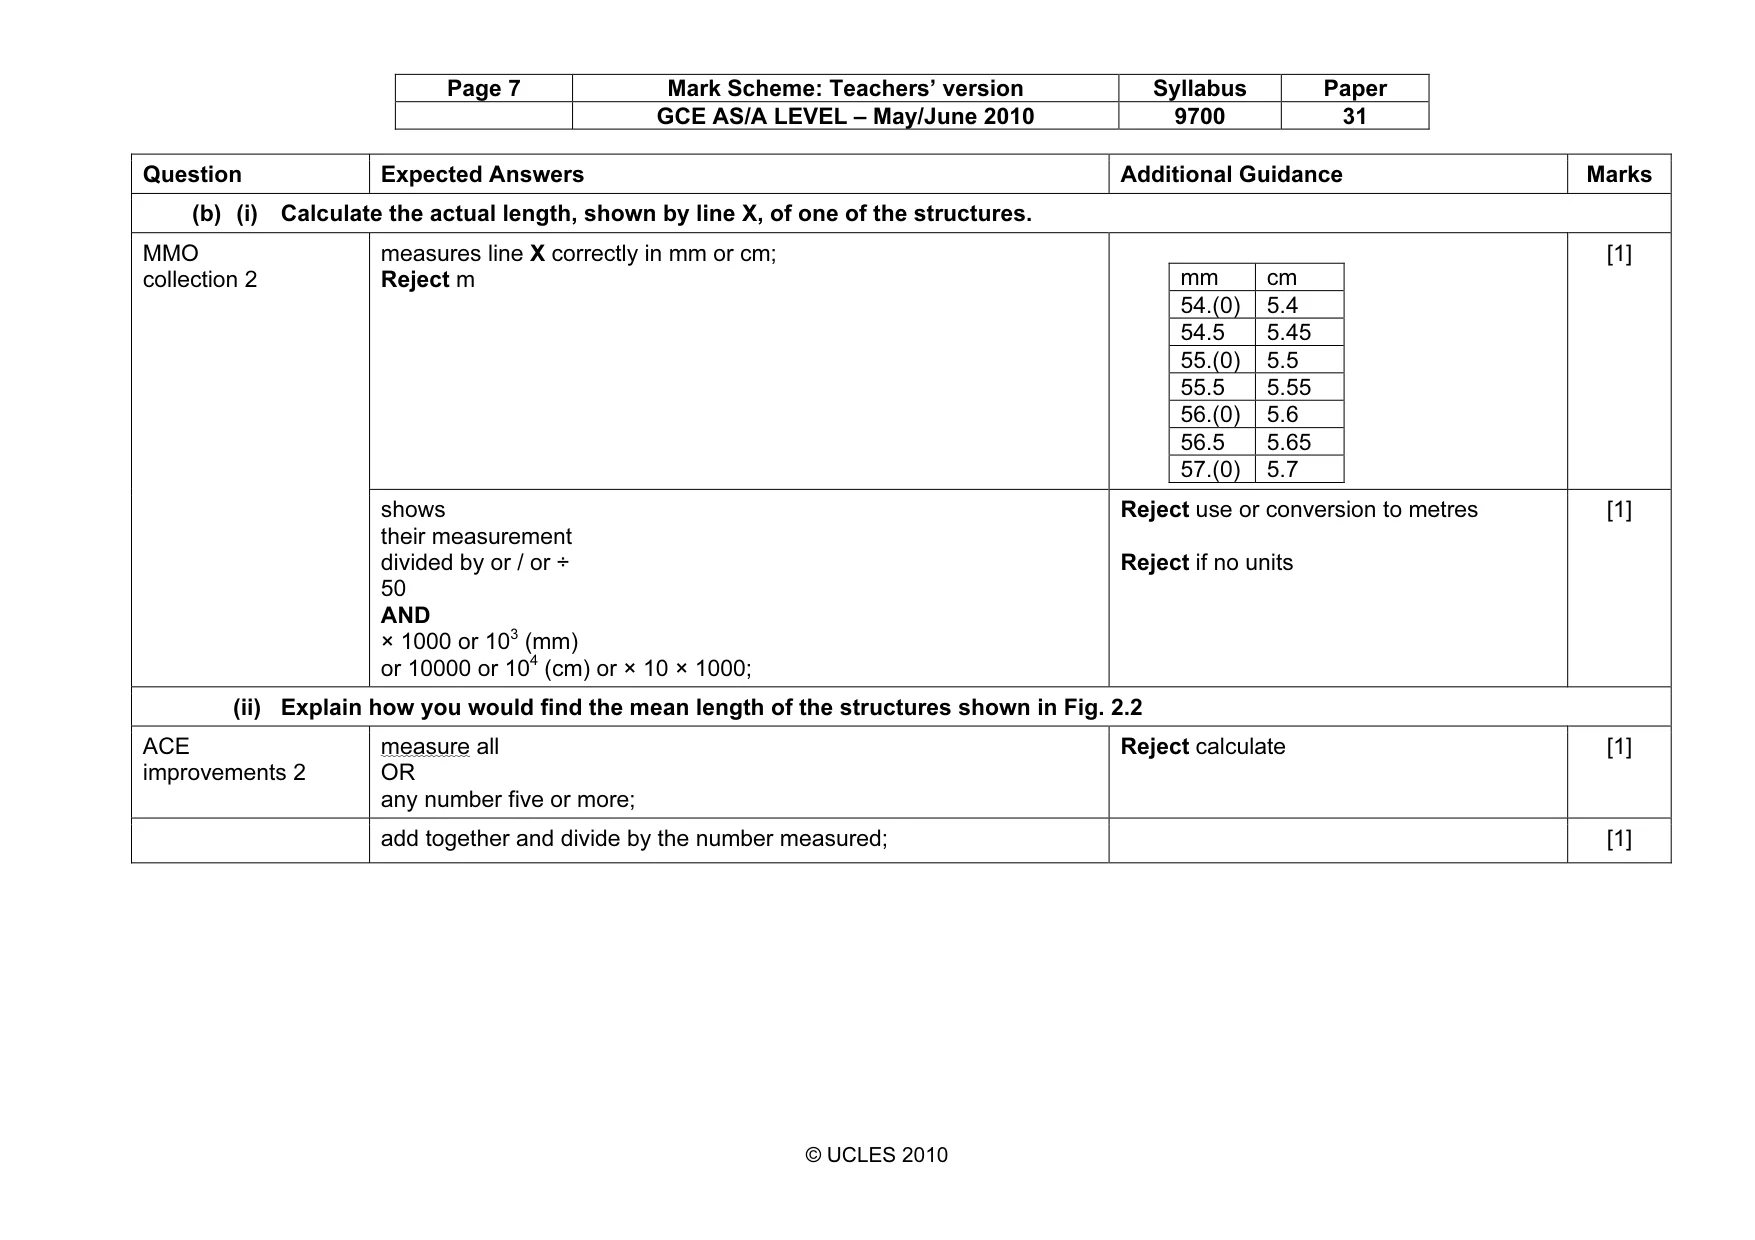
Page 7 Mark Scheme: Teachers’ version Syllabus Paper GCE AS/A LEVEL – May/June 2010 9700 31 © UCLES 2010 Question Expected Answers Additional Guidance Marks (b) (i) Calculate the actual length, shown by line X, of one of the structures. measures line X correctly in mm or cm; Reject m mm cm 54.(0) 5.4 54.5 5.45 55.(0) 5.5 55.5 5.55 56.(0) 5.6 56.5 5.65 57.(0) 5.7 [1] MMO collection 2 shows their measurement divided by or / or ÷ 50 AND × 1000 or 103 (mm) or 10000 or 104 (cm) or × 10 × 1000; Reject use or conversion to metres Reject if no units [1] (ii) Explain how you would find the mean length of the structures shown in Fig. 2.2 ACE improvements 2 measure all OR any number five or more; Reject calculate [1] add together and divide by the number measured; [1]
Mark scheme, page 8
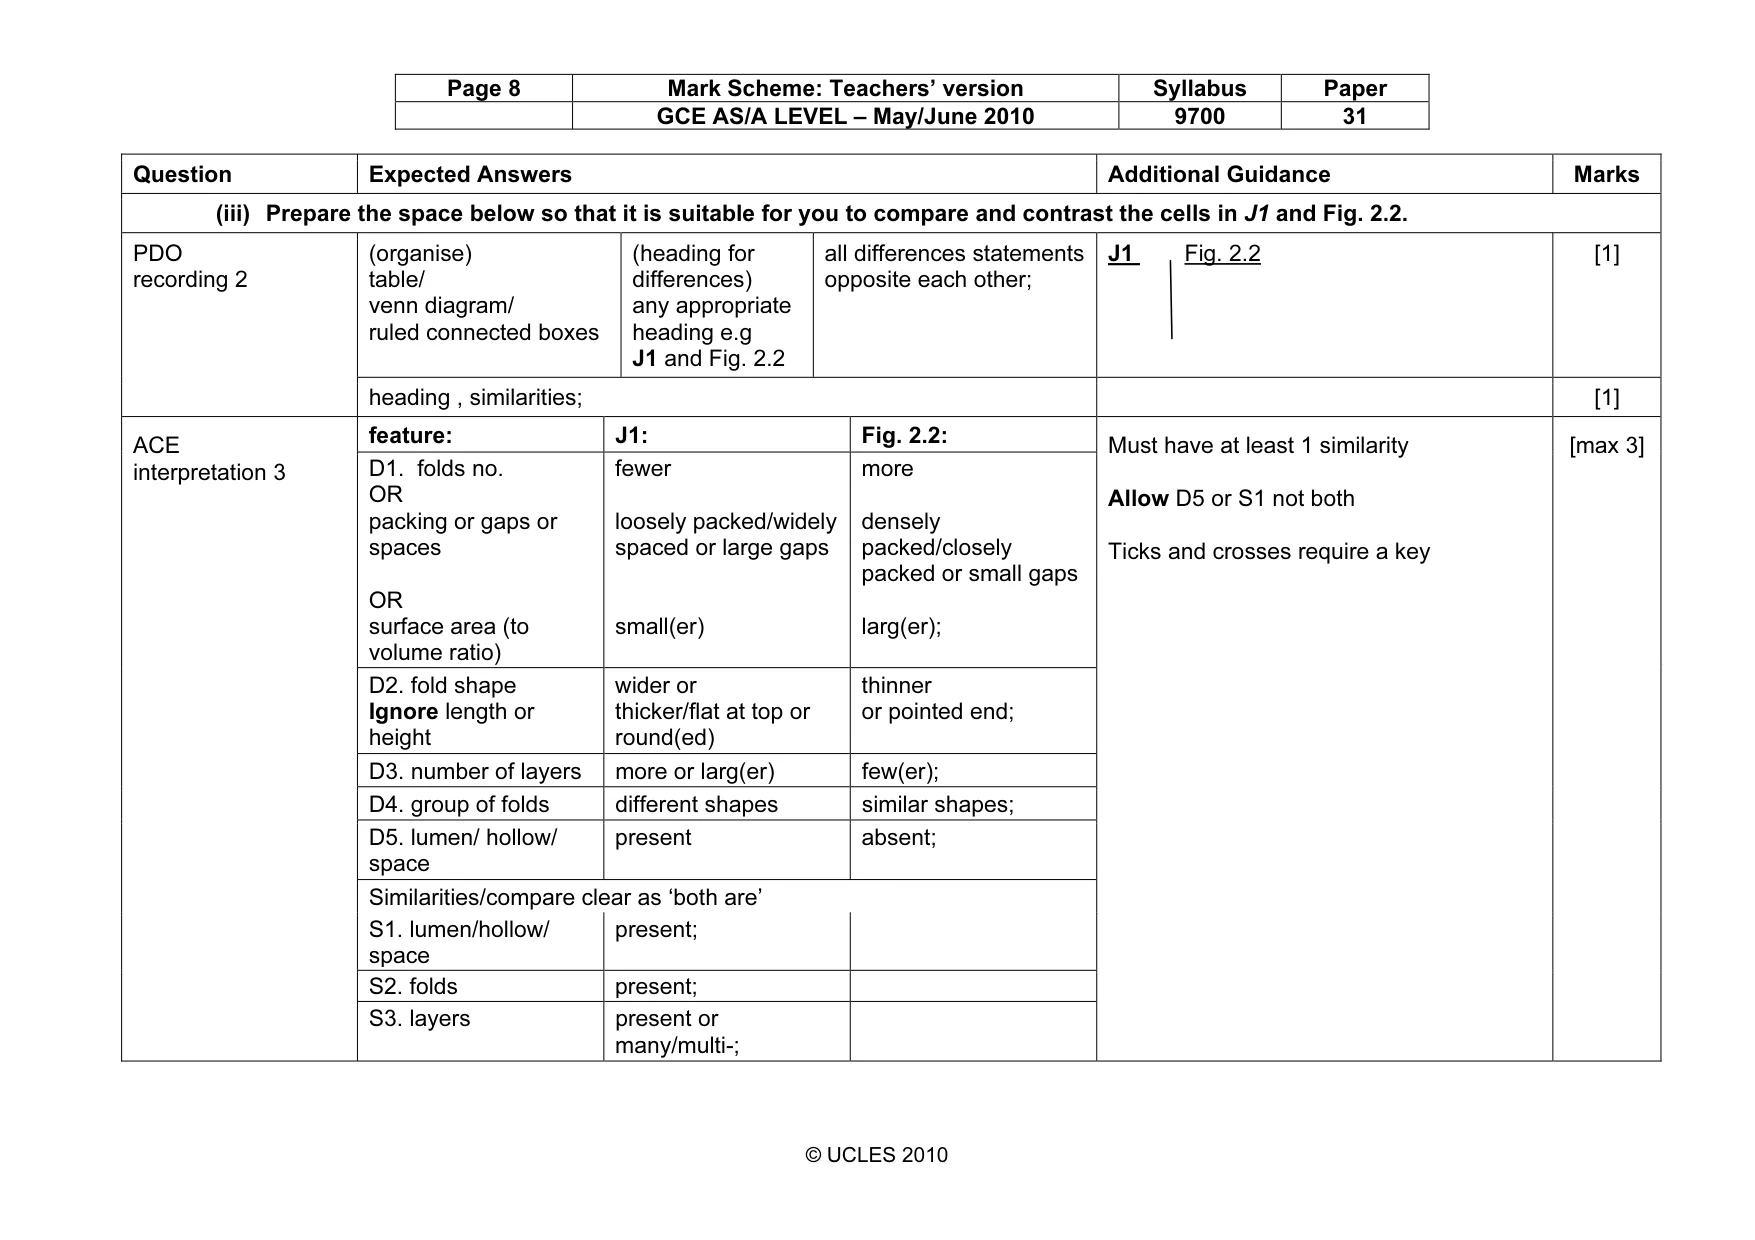
Page 8 Mark Scheme: Teachers’ version Syllabus Paper GCE AS/A LEVEL – May/June 2010 9700 31 © UCLES 2010 Question Expected Answers Additional Guidance Marks (iii) Prepare the space below so that it is suitable for you to compare and contrast the cells in J1 and Fig. 2.2. (organise) table/ venn diagram/ ruled connected boxes (heading for differences) any appropriate heading e.g J1 and Fig. 2.2 all differences statements opposite each other; J1 Fig. 2.2 [1] PDO recording 2 heading , similarities; [1] feature: J1: Fig. 2.2: D1. folds no. OR packing or gaps or spaces OR surface area (to volume ratio) fewer loosely packed/widely spaced or large gaps small(er) more densely packed/closely packed or small gaps larg(er); D2. fold shape Ignore length or height wider or thicker/flat at top or round(ed) thinner or pointed end; D3. number of layers more or larg(er) few(er); D4. group of folds different shapes similar shapes; D5. lumen/ hollow/ space present absent; Similarities/compare clear as ‘both are’ S1. lumen/hollow/ space present; S2. folds present; ACE interpretation 3 S3. layers present or many/multi-; Must have at least 1 similarity Allow D5 or S1 not both Ticks and crosses require a key [max 3]
Mark scheme, page 9
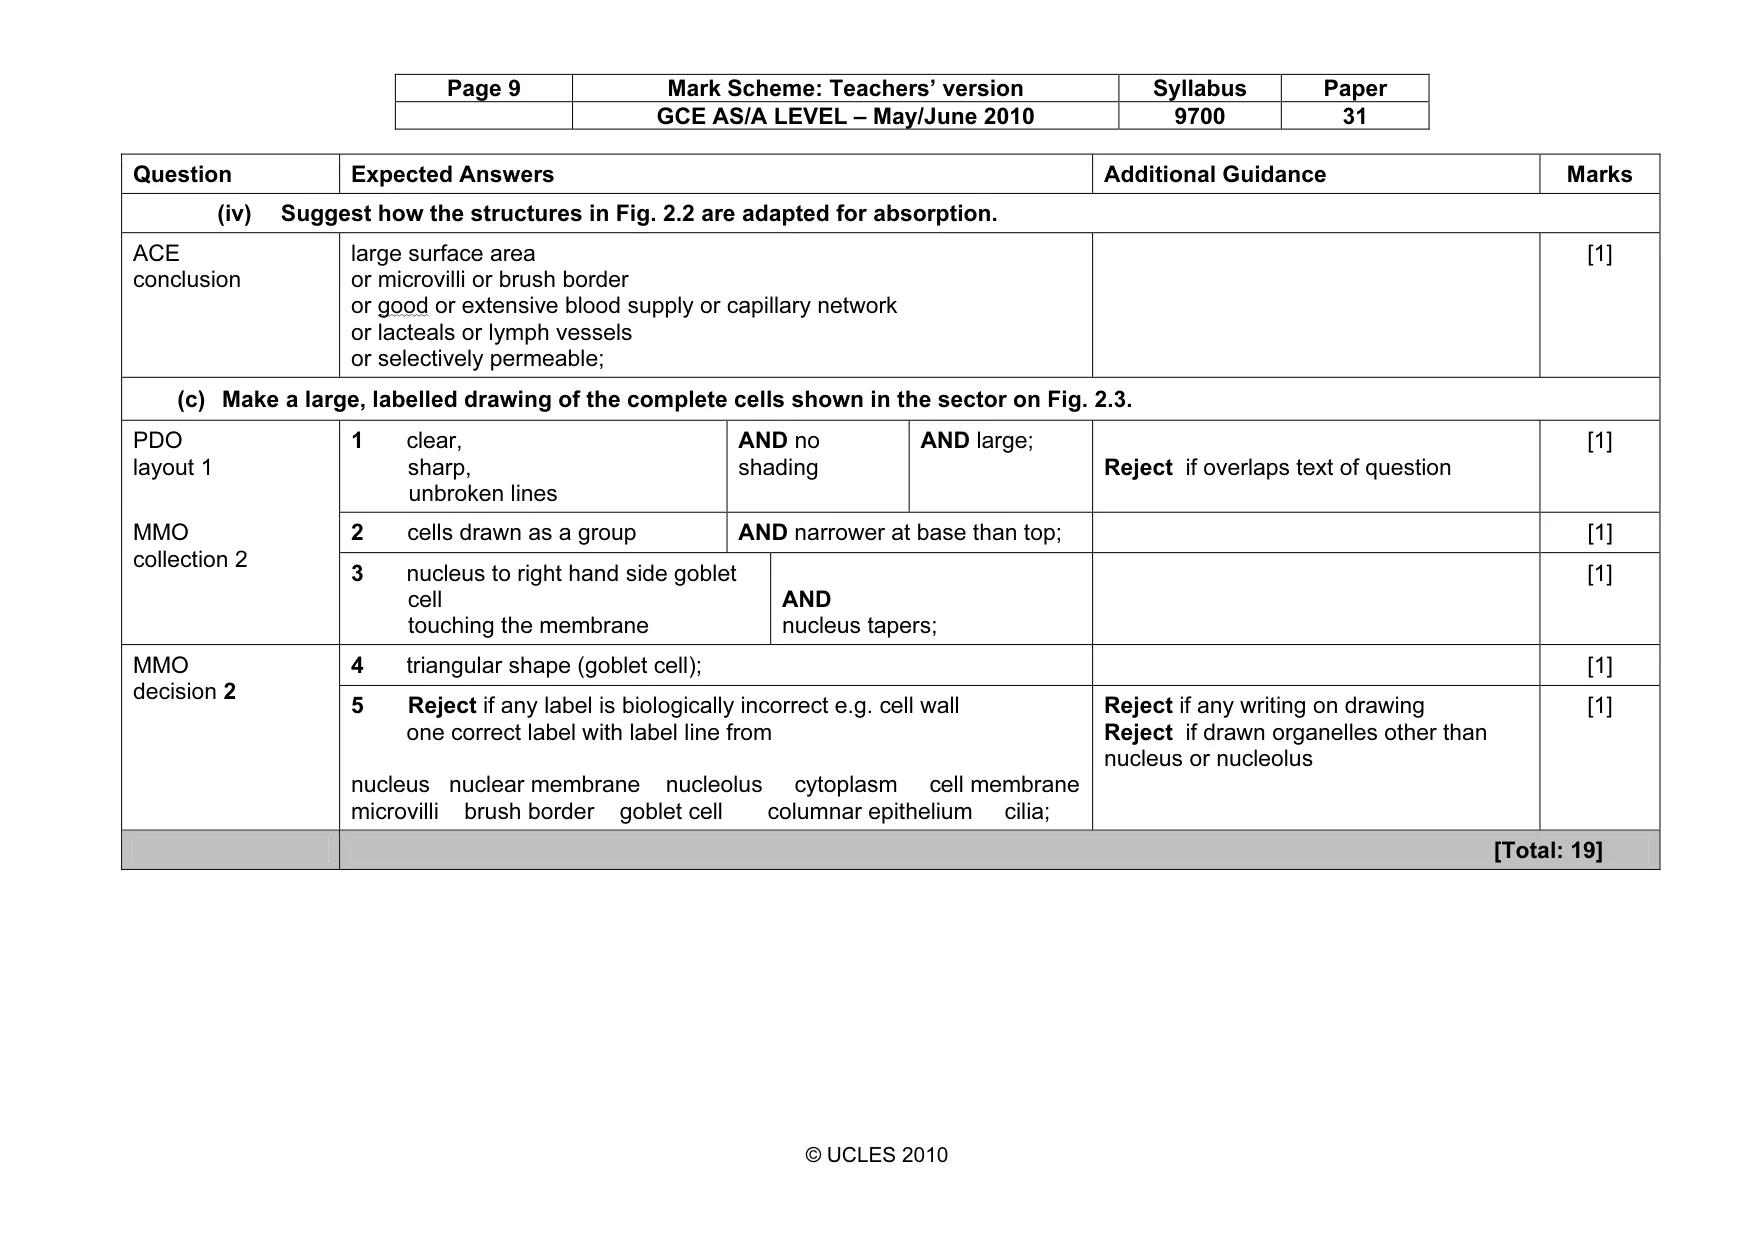
Page 9 Mark Scheme: Teachers’ version Syllabus Paper GCE AS/A LEVEL – May/June 2010 9700 31 © UCLES 2010 Question Expected Answers Additional Guidance Marks (iv) Suggest how the structures in Fig. 2.2 are adapted for absorption. ACE conclusion large surface area or microvilli or brush border or good or extensive blood supply or capillary network or lacteals or lymph vessels or selectively permeable; [1] (c) Make a large, labelled drawing of the complete cells shown in the sector on Fig. 2.3. PDO layout 1 1 clear, sharp, unbroken lines AND no shading AND large; Reject if overlaps text of question [1] 2 cells drawn as a group AND narrower at base than top; [1] MMO collection 2 3 nucleus to right hand side goblet cell touching the membrane AND nucleus tapers; [1] 4 triangular shape (goblet cell); [1] MMO decision 2 5 Reject if any label is biologically incorrect e.g. cell wall one correct label with label line from nucleus nuclear membrane nucleolus cytoplasm cell membrane microvilli brush border goblet cell columnar epithelium cilia; Reject if any writing on drawing Reject if drawn organelles other than nucleus or nucleolus [1] [Total: 19]
What you needed in this session
Cambridge’s own grade thresholds for 2010 May/June, Paper 3 · Variant 1. A higher threshold means an easier paper — the bar moves with how the cohort did.