Cambridge A Level Biology 9700 — 2008 Oct/Nov Paper 3 · Variant 1
9700/31/O/N/08 · 40 marks · ≈45 min
The question paper and its mark scheme, free to read here and free to download. This is Cambridge’s own paper, exactly as it was sat.
Question paper12 pages

Mark scheme10 pages
Answers below. Sit the paper first if you are practising.
Paper as text
Question paper, page 1
This document consists of 10 printed pages and 2 blank pages. SP (CW/SLM) T65972/3 © UCLES 2008 [Turn over UNIVERSITY OF CAMBRIDGE INTERNATIONAL EXAMINATIONS General Certificate of Education Advanced Subsidiary Level and Advanced Level READ THESE INSTRUCTIONS FIRST Write your Centre number, candidate number and name on all the work you hand in. Write in dark blue or black pen in the spaces provided on the Question Paper. You may use a pencil for any diagrams, graphs or rough working. Do not use staples, paper clips, highlighters, glue or correction fluid. DO NOT WRITE IN ANY BARCODES. Answer both questions. The number of marks is given in brackets [ ] at the end of each question or part question. You are advised to spend an hour on each question. At the end of the examination, fasten all your work securely together. * 9 5 1 3 7 5 3 3 7 7 * BIOLOGY 9700/31 Paper 31 Advanced Practical Skills October/November 2008 2 hours Candidates answer on the Question Paper. Additional Materials: As listed in the confidential instructions For Examiner’s Use 1 2 Total
Question paper, page 2
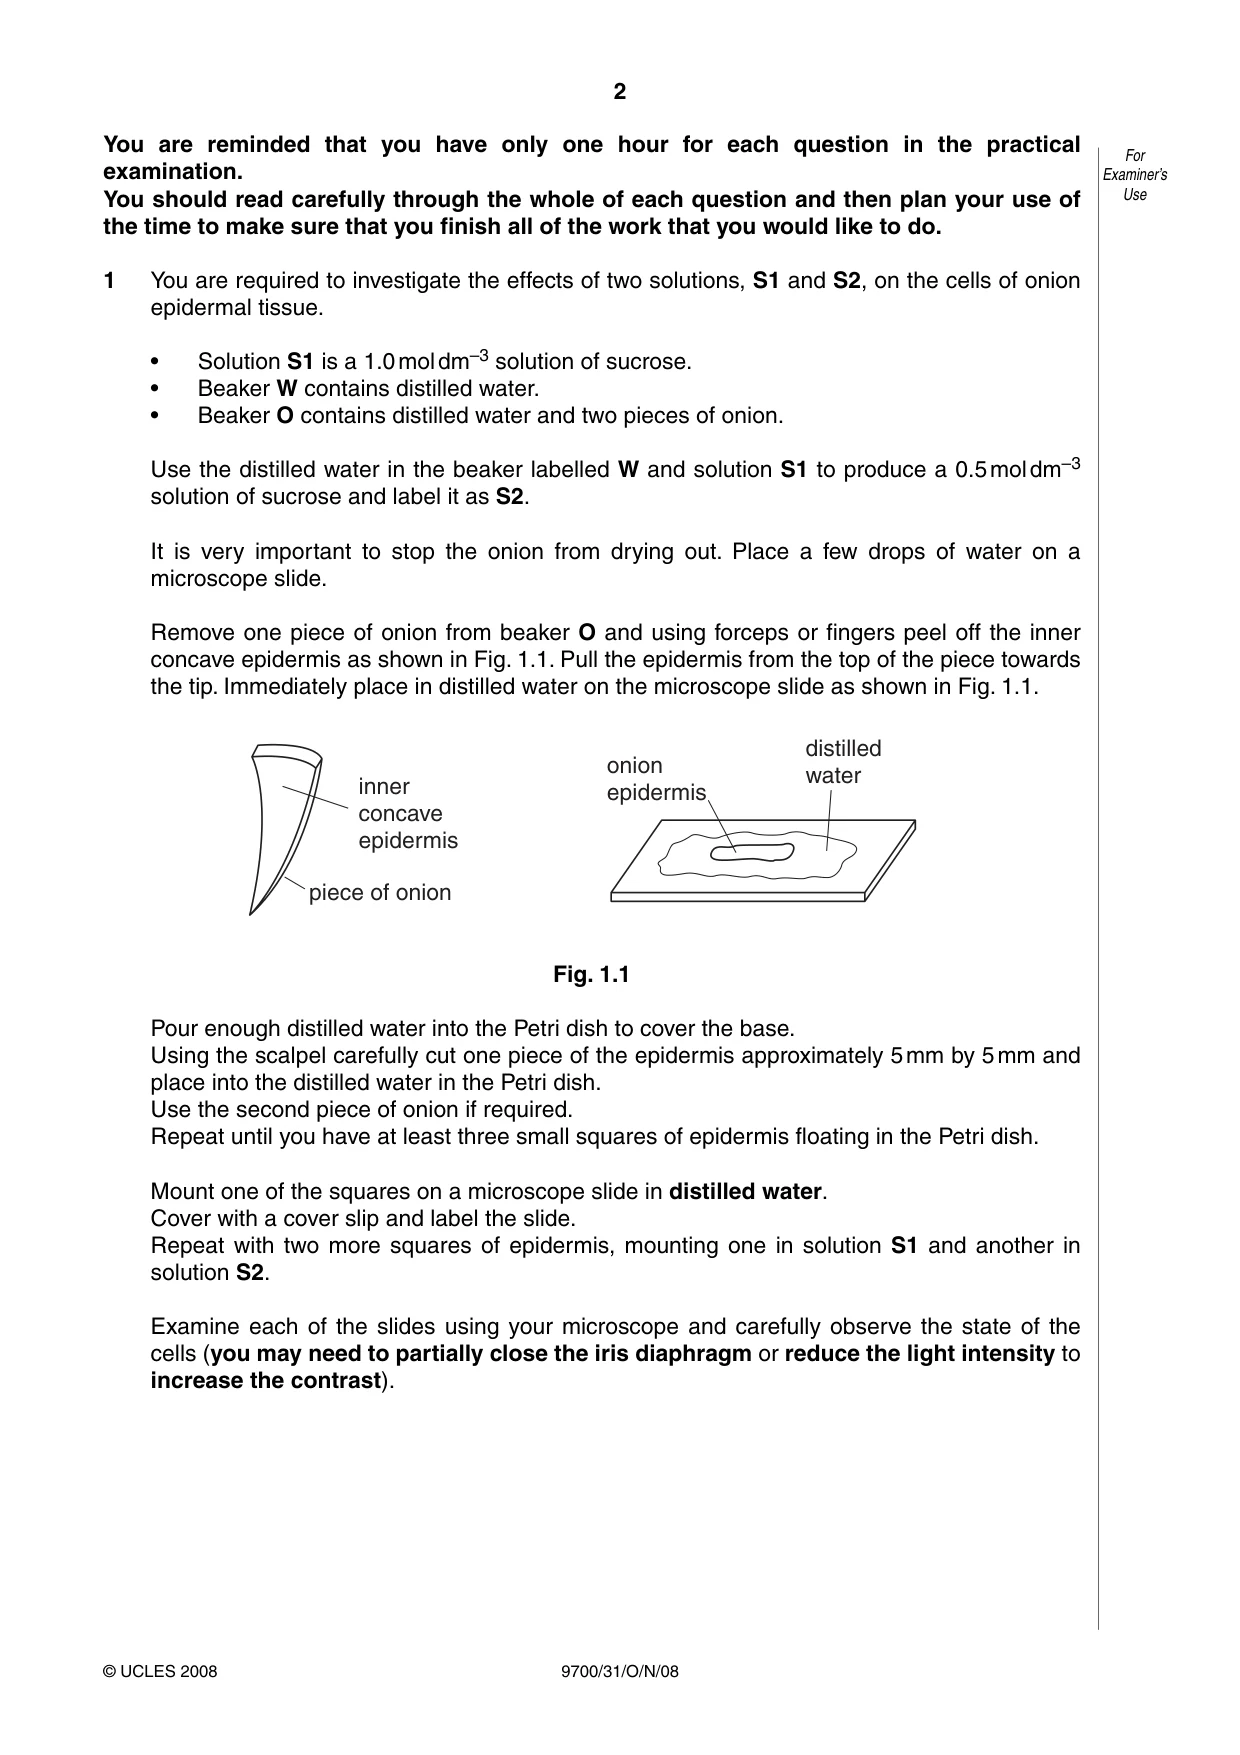
2 9700/31/O/N/08 © UCLES 2008 For Examiner’s Use You are reminded that you have only one hour for each question in the practical examination. You should read carefully through the whole of each question and then plan your use of the time to make sure that you finish all of the work that you would like to do. 1 You are required to investigate the effects of two solutions, S1 and S2, on the cells of onion epidermal tissue. • Solution S1 is a 1.0 mol dm–3 solution of sucrose. • Beaker W contains distilled water. • Beaker O contains distilled water and two pieces of onion. Use the distilled water in the beaker labelled W and solution S1 to produce a 0.5 mol dm–3 solution of sucrose and label it as S2. It is very important to stop the onion from drying out. Place a few drops of water on a microscope slide. Remove one piece of onion from beaker O and using forceps or fingers peel off the inner concave epidermis as shown in Fig. 1.1. Pull the epidermis from the top of the piece towards the tip. Immediately place in distilled water on the microscope slide as shown in Fig. 1.1. inner concave epidermis piece of onion onion epidermis distilled water Fig. 1.1 Pour enough distilled water into the Petri dish to cover the base. Using the scalpel carefully cut one piece of the epidermis approximately 5 mm by 5 mm and place into the distilled water in the Petri dish. Use the second piece of onion if required. Repeat until you have at least three small squares of epidermis floating in the Petri dish. Mount one of the squares on a microscope slide in distilled water. Cover with a cover slip and label the slide. Repeat with two more squares of epidermis, mounting one in solution S1 and another in solution S2. Examine each of the slides using your microscope and carefully observe the state of the cells (you may need to partially close the iris diaphragm or reduce the light intensity to increase the contrast).
Question paper, page 3
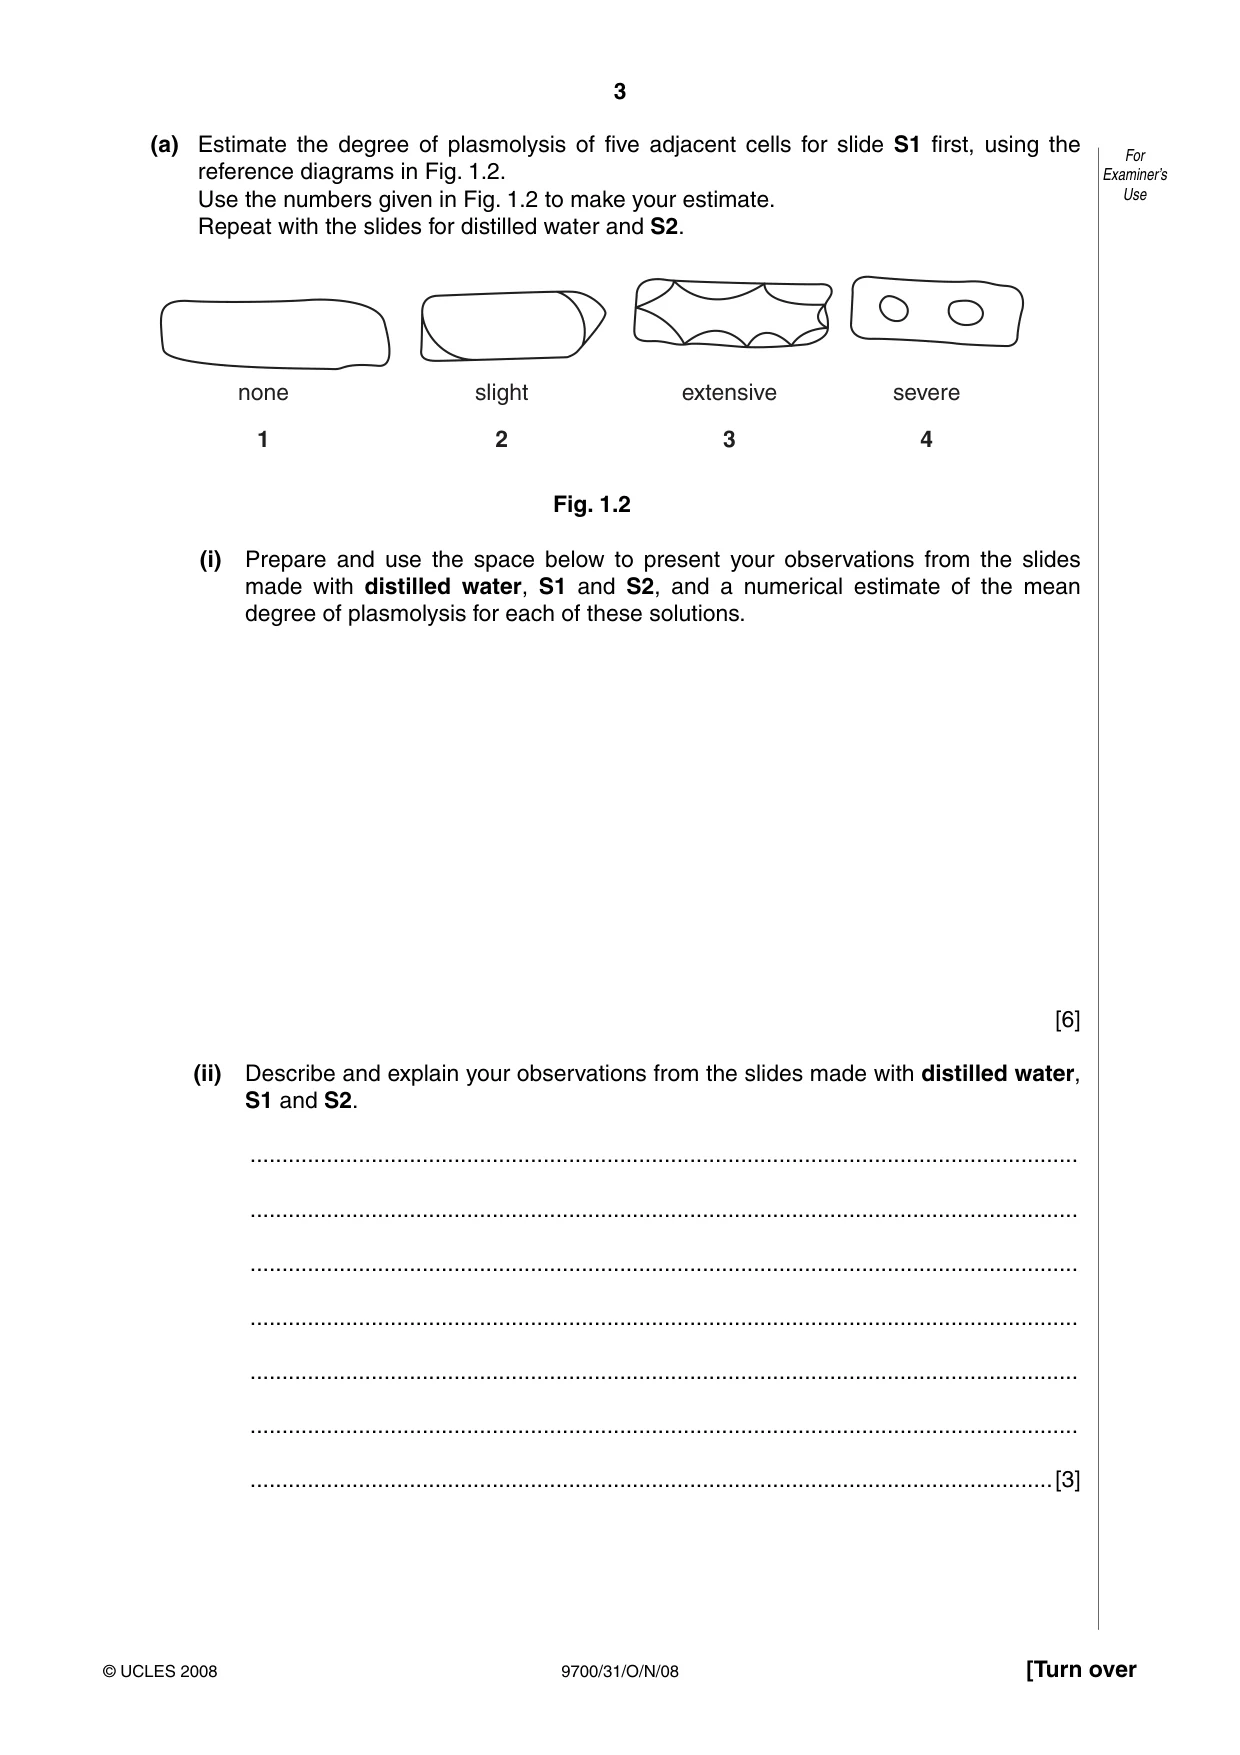
3 9700/31/O/N/08 © UCLES 2008 [Turn over For Examiner’s Use (a) Estimate the degree of plasmolysis of five adjacent cells for slide S1 first, using the reference diagrams in Fig. 1.2. Use the numbers given in Fig. 1.2 to make your estimate. Repeat with the slides for distilled water and S2. none slight extensive severe 1 2 3 4 Fig. 1.2 (i) Prepare and use the space below to present your observations from the slides made with distilled water, S1 and S2, and a numerical estimate of the mean degree of plasmolysis for each of these solutions. [6] (ii) Describe and explain your observations from the slides made with distilled water, S1 and S2. … … … … … … …[3]
Question paper, page 4
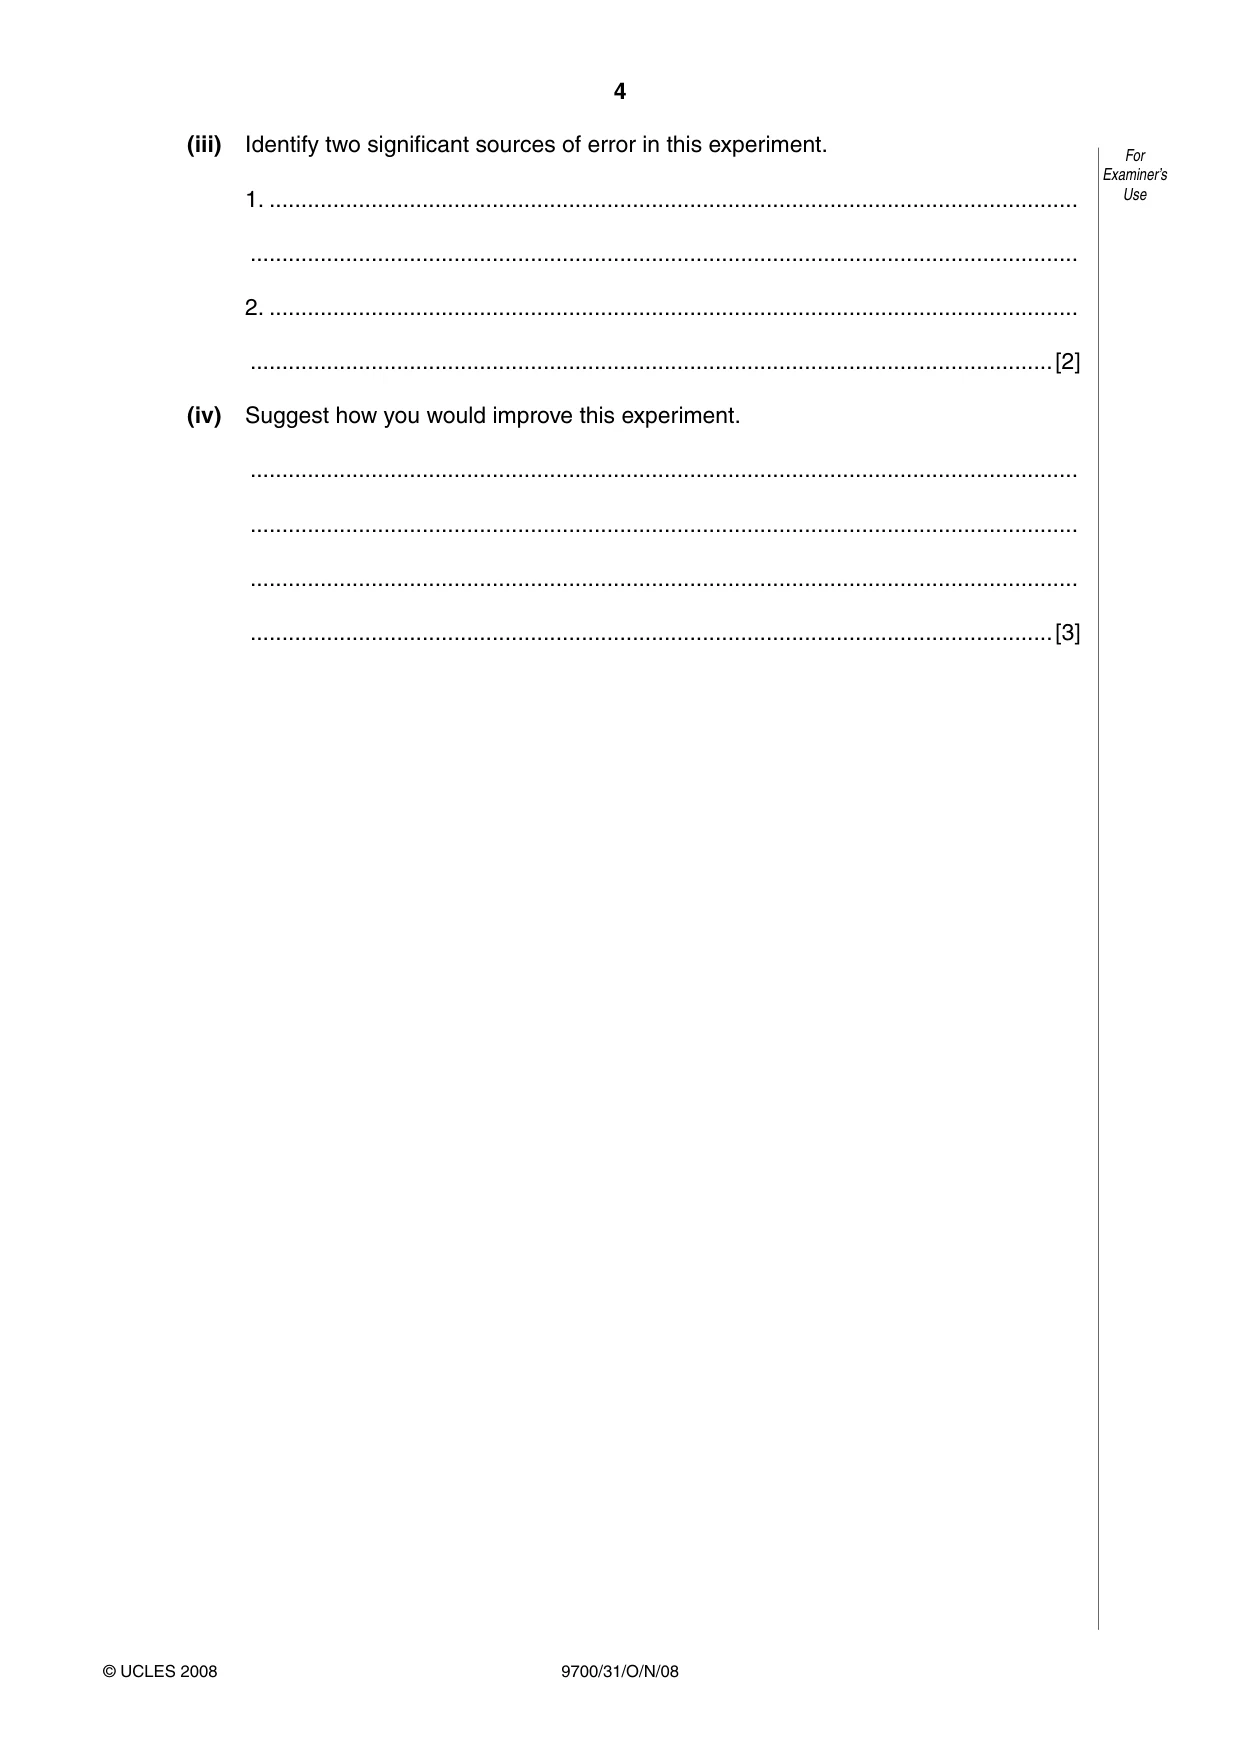
4 9700/31/O/N/08 © UCLES 2008 For Examiner’s Use (iii) Identify two significant sources of error in this experiment. 1. … … 2. … …[2] (iv) Suggest how you would improve this experiment. … … … …[3]
Question paper, page 5
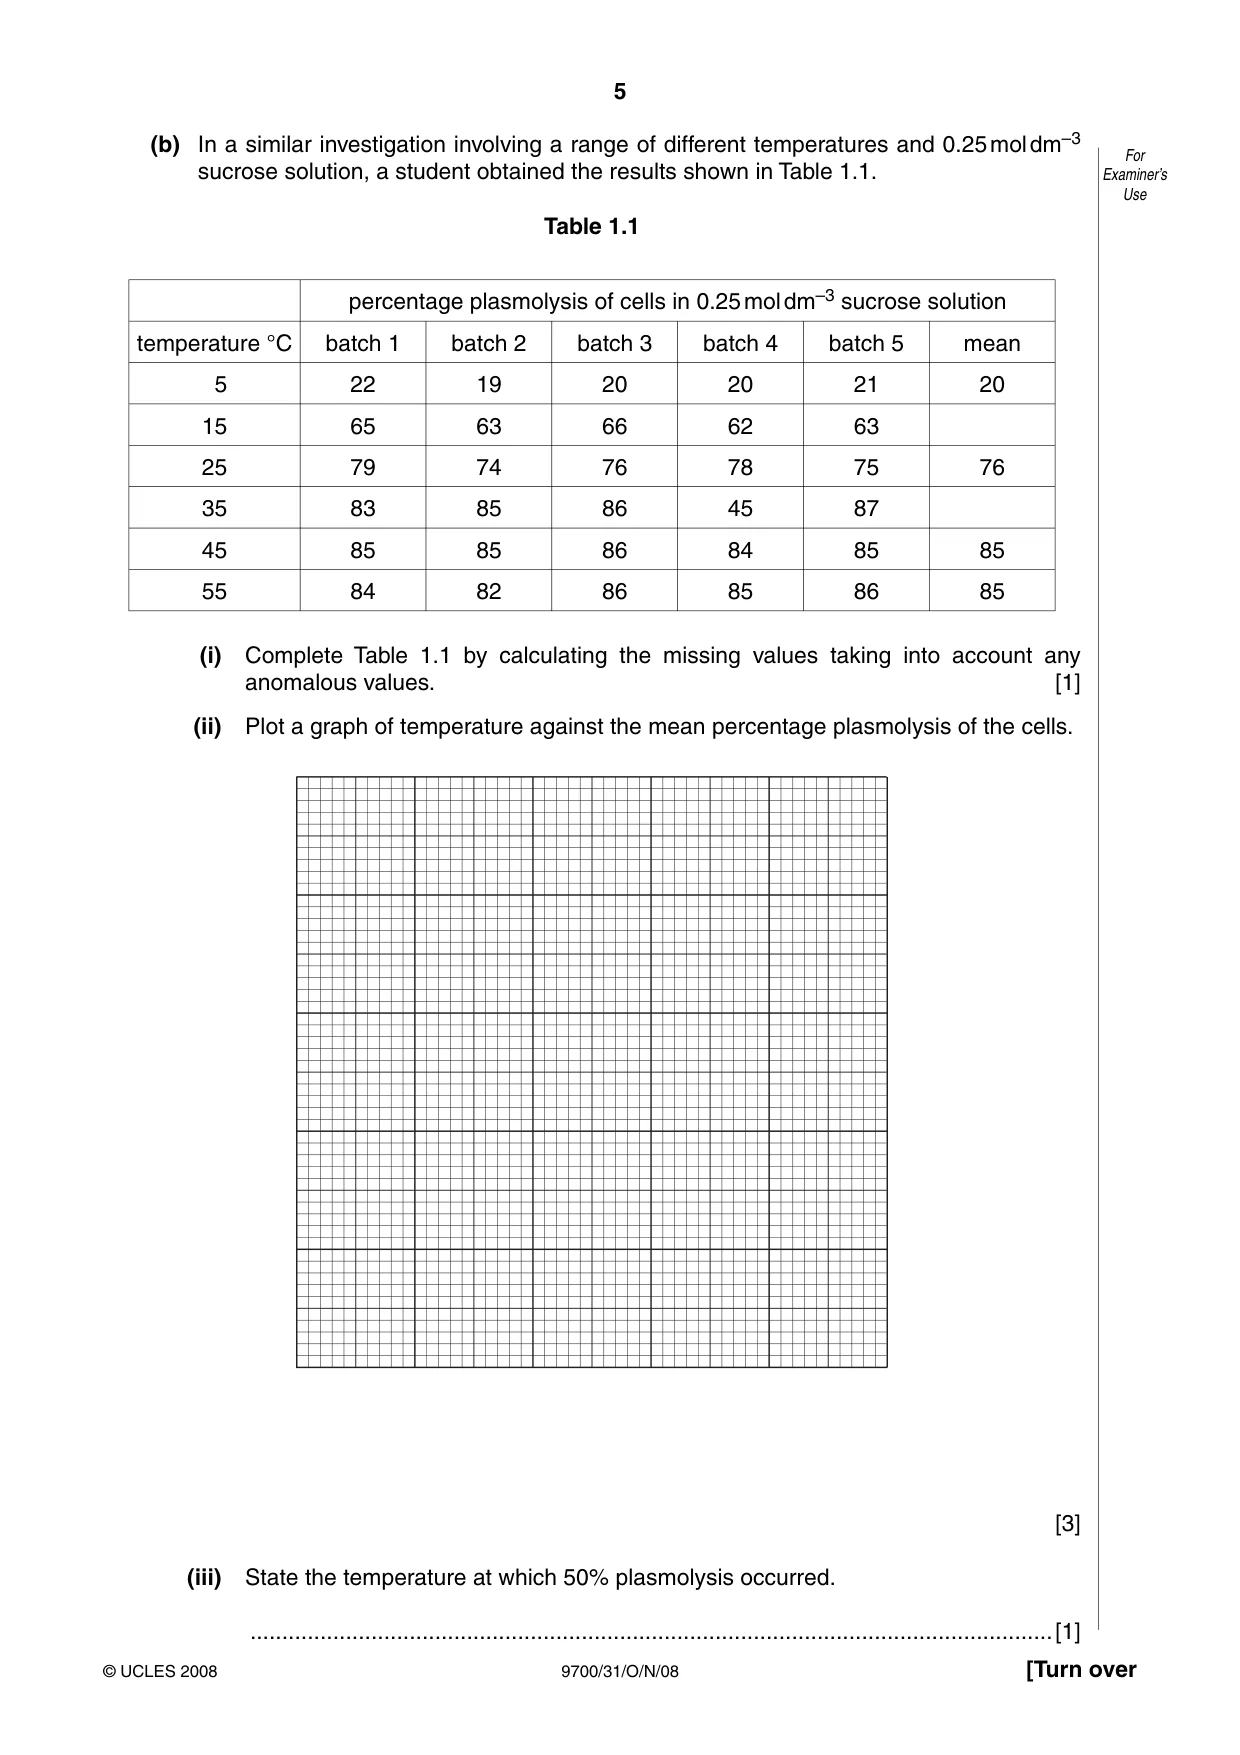
5 9700/31/O/N/08 © UCLES 2008 [Turn over For Examiner’s Use (b) In a similar investigation involving a range of different temperatures and 0.25 mol dm–3 sucrose solution, a student obtained the results shown in Table 1.1. Table 1.1 percentage plasmolysis of cells in 0.25 mol dm–3 sucrose solution temperature °C batch 1 batch 2 batch 3 batch 4 batch 5 mean 5 22 19 20 20 21 20 15 65 63 66 62 63 25 79 74 76 78 75 76 35 83 85 86 45 87 45 85 85 86 84 85 85 55 84 82 86 85 86 85 (i) Complete Table 1.1 by calculating the missing values taking into account any anomalous values. [1] (ii) Plot a graph of temperature against the mean percentage plasmolysis of the cells. [3] (iii) State the temperature at which 50% plasmolysis occurred. …[1]
Question paper, page 6
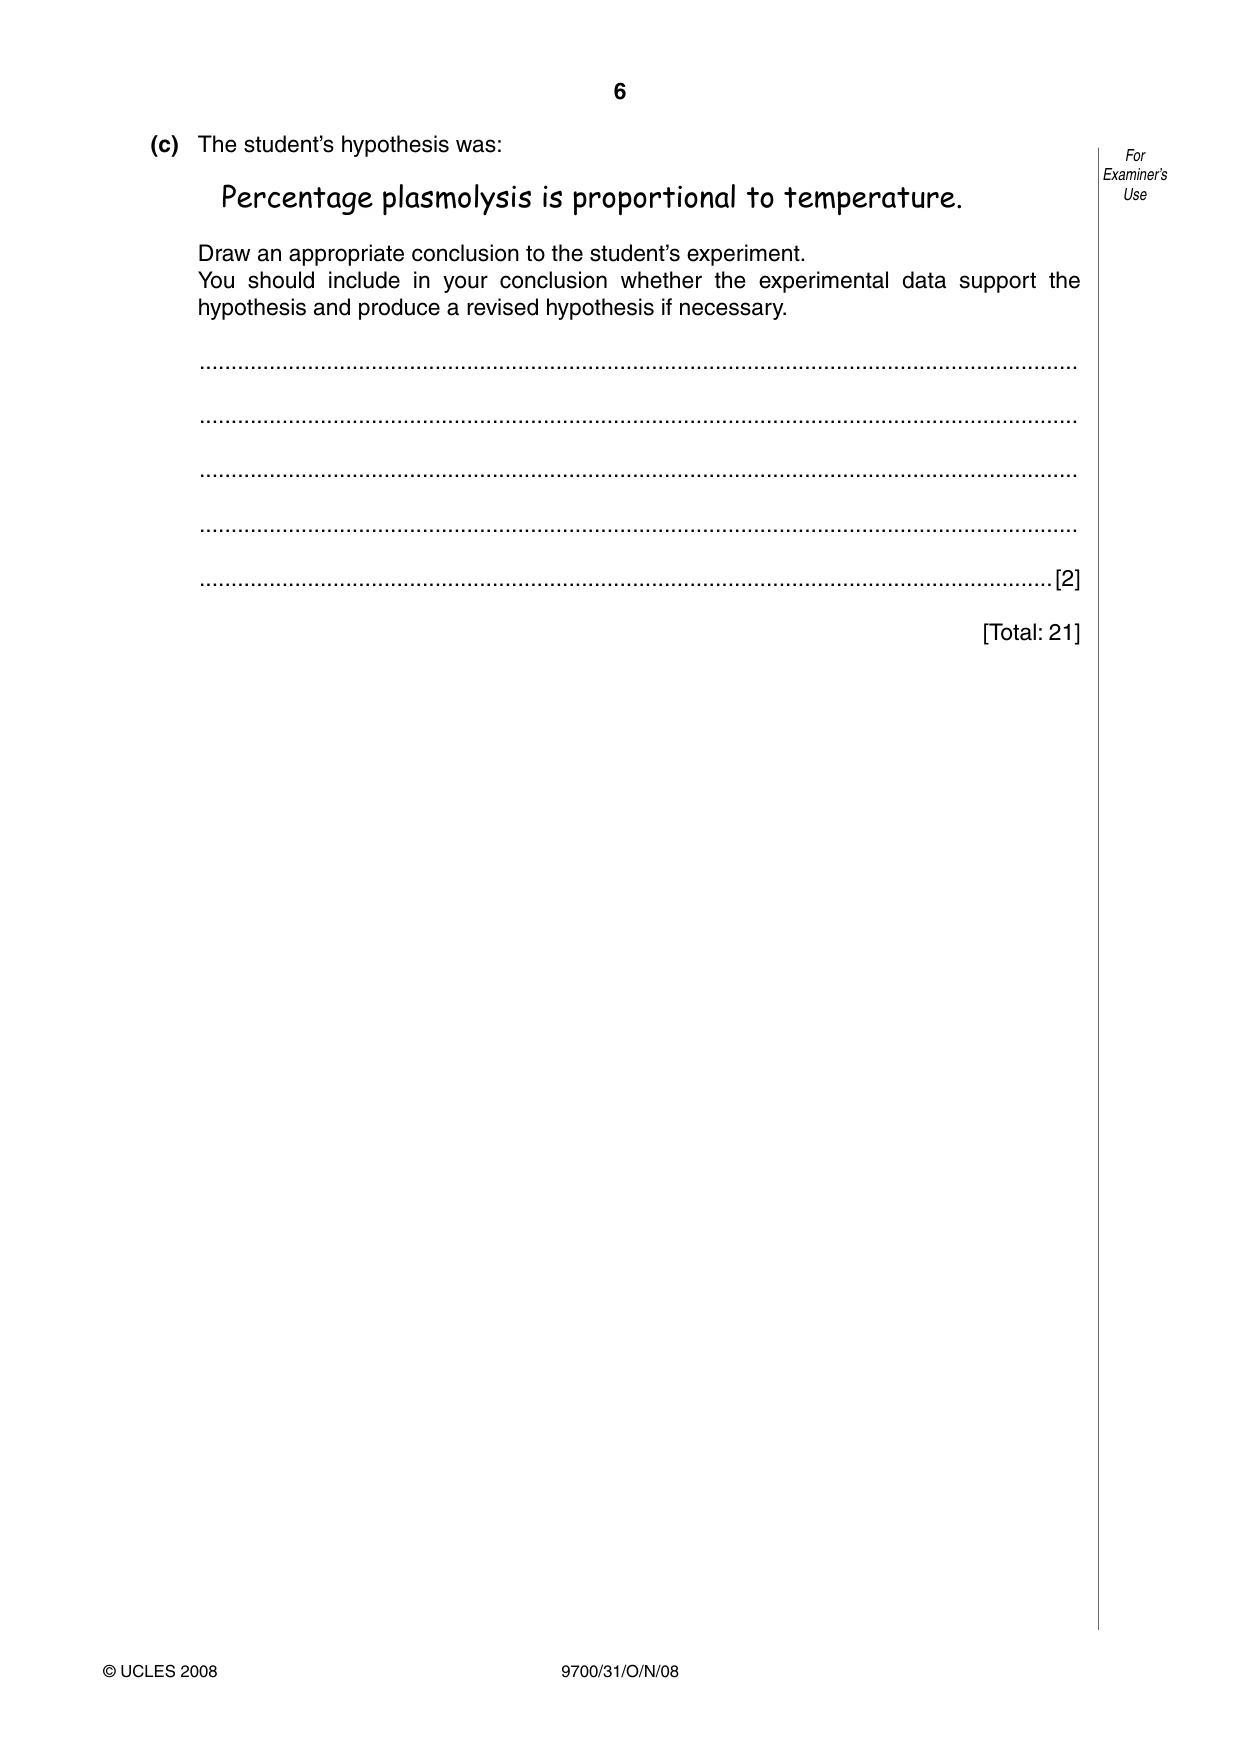
6 9700/31/O/N/08 © UCLES 2008 For Examiner’s Use (c) The student’s hypothesis was: Percentage plasmolysis is proportional to temperature. Draw an appropriate conclusion to the student’s experiment. You should include in your conclusion whether the experimental data support the hypothesis and produce a revised hypothesis if necessary. … … … … …[2] [Total: 21]
Question paper, page 7
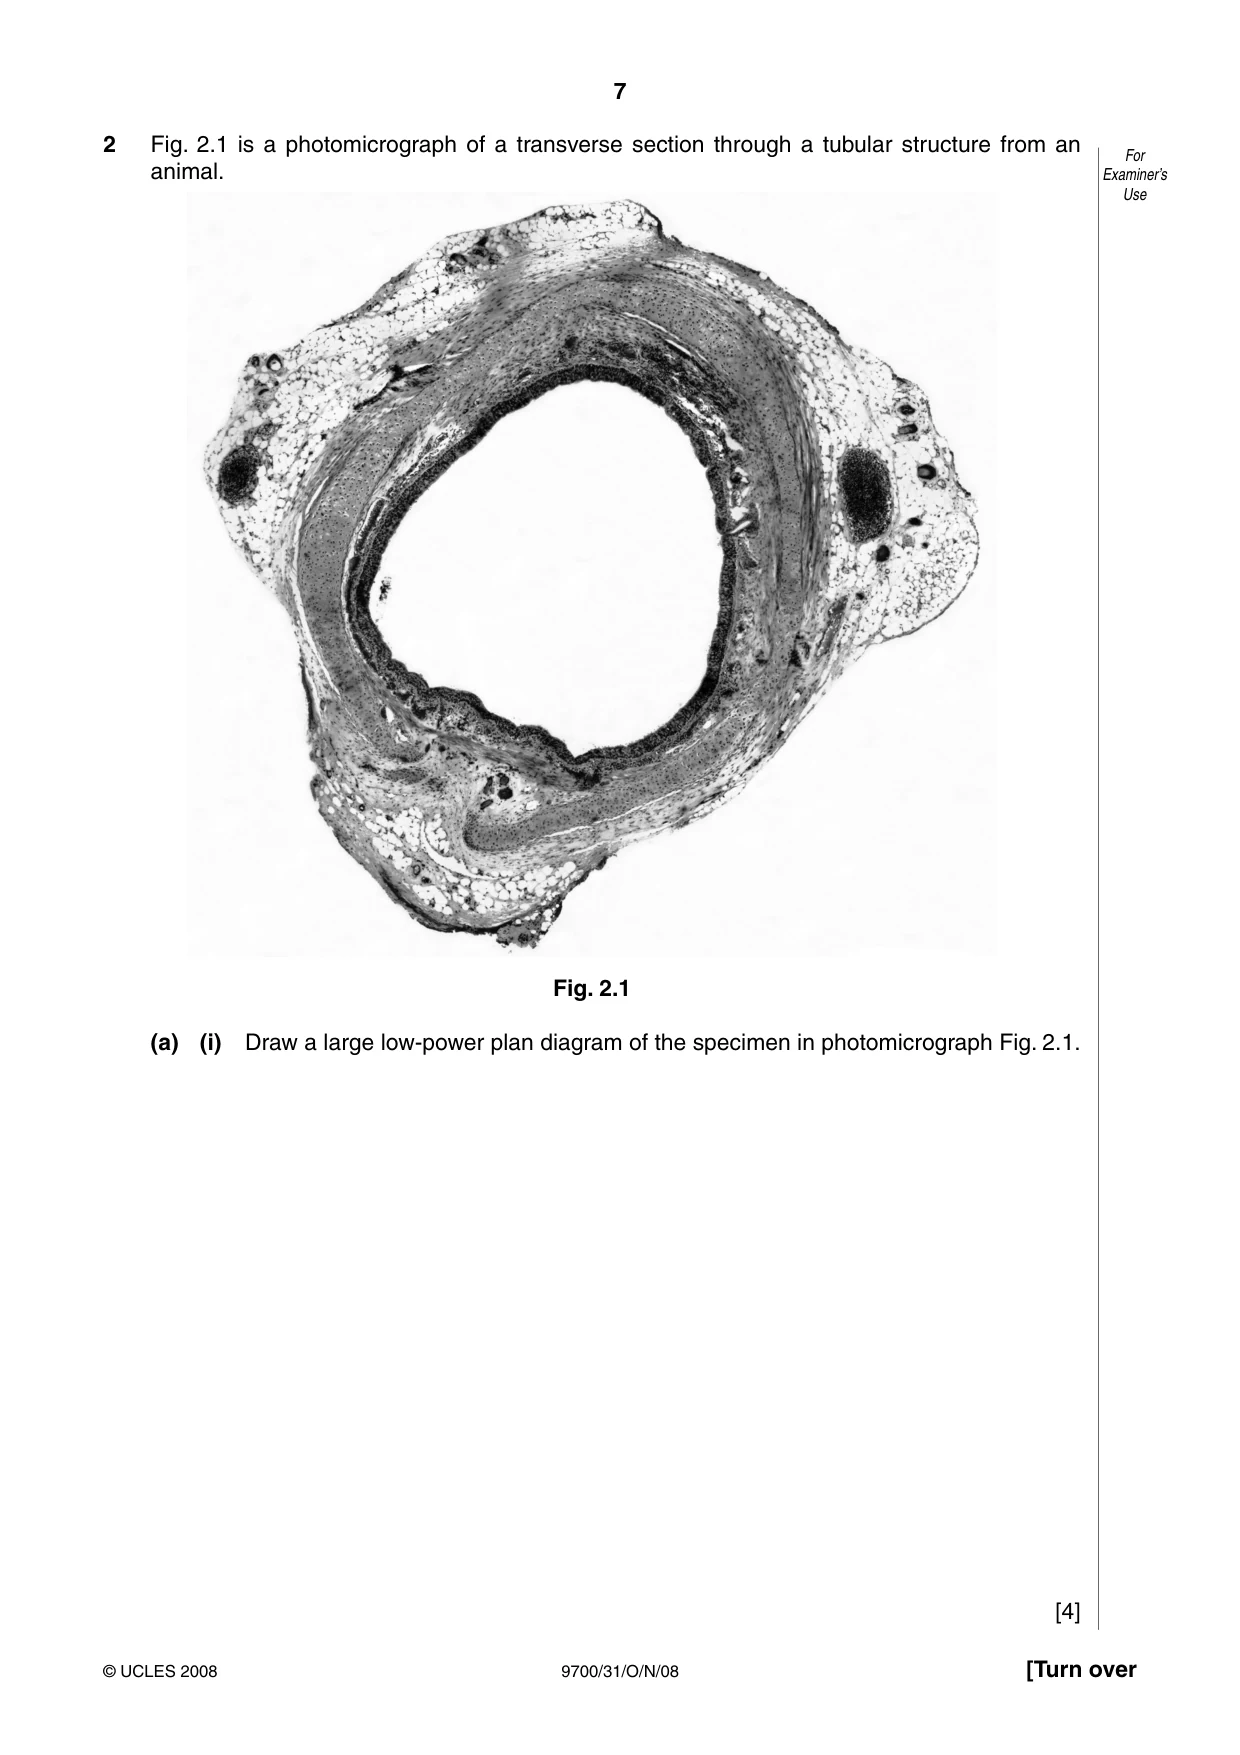
7 9700/31/O/N/08 © UCLES 2008 [Turn over For Examiner’s Use 2 Fig. 2.1 is a photomicrograph of a transverse section through a tubular structure from an animal. Fig. 2.1 (a) (i) Draw a large low-power plan diagram of the specimen in photomicrograph Fig. 2.1. [4]
Question paper, page 9
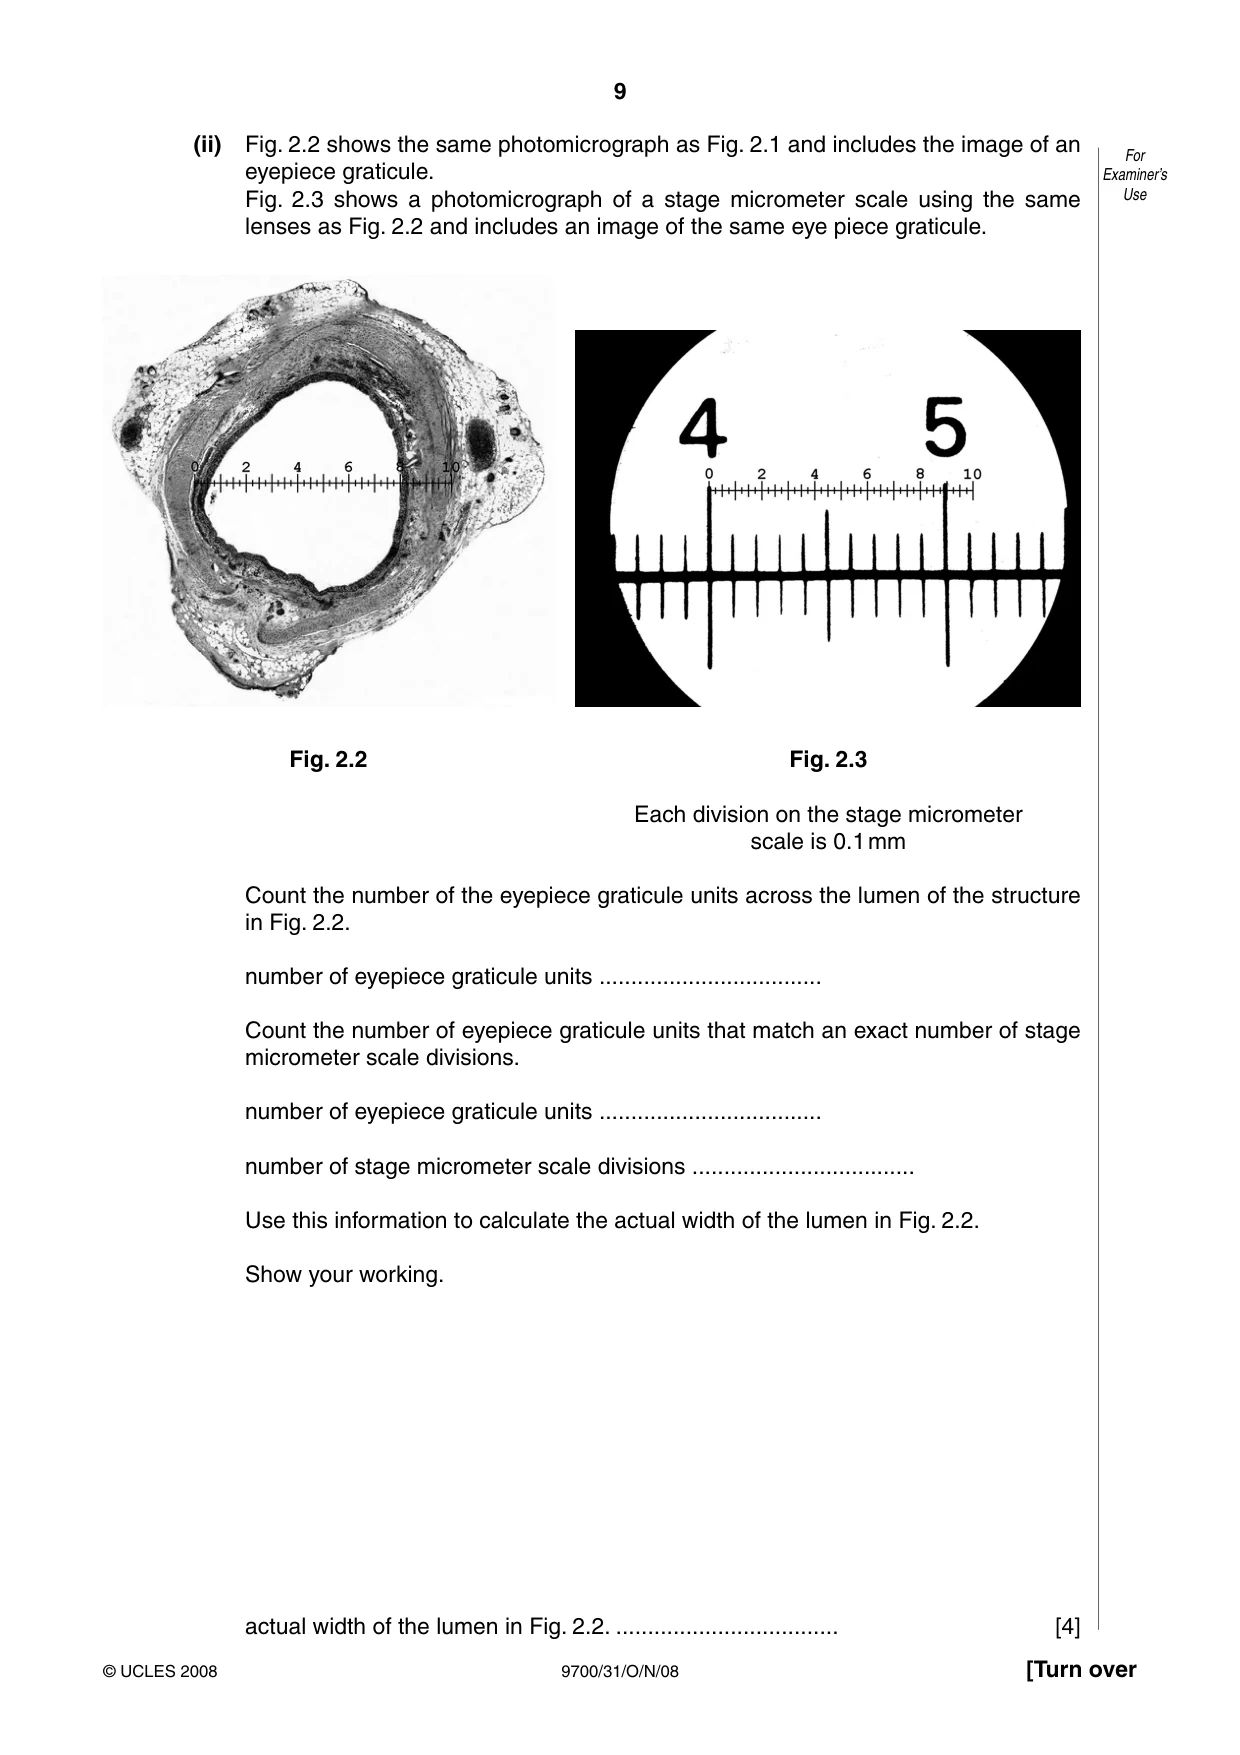
9 9700/31/O/N/08 © UCLES 2008 [Turn over For Examiner’s Use (ii) Fig. 2.2 shows the same photomicrograph as Fig. 2.1 and includes the image of an eyepiece graticule. Fig. 2.3 shows a photomicrograph of a stage micrometer scale using the same lenses as Fig. 2.2 and includes an image of the same eye piece graticule. Fig. 2.2 Fig. 2.3 Each division on the stage micrometer scale is 0.1 mm Count the number of the eyepiece graticule units across the lumen of the structure in Fig. 2.2. number of eyepiece graticule units … Count the number of eyepiece graticule units that match an exact number of stage micrometer scale divisions. number of eyepiece graticule units … number of stage micrometer scale divisions … Use this information to calculate the actual width of the lumen in Fig. 2.2. Show your working. actual width of the lumen in Fig. 2.2. … [4]
Question paper, page 10
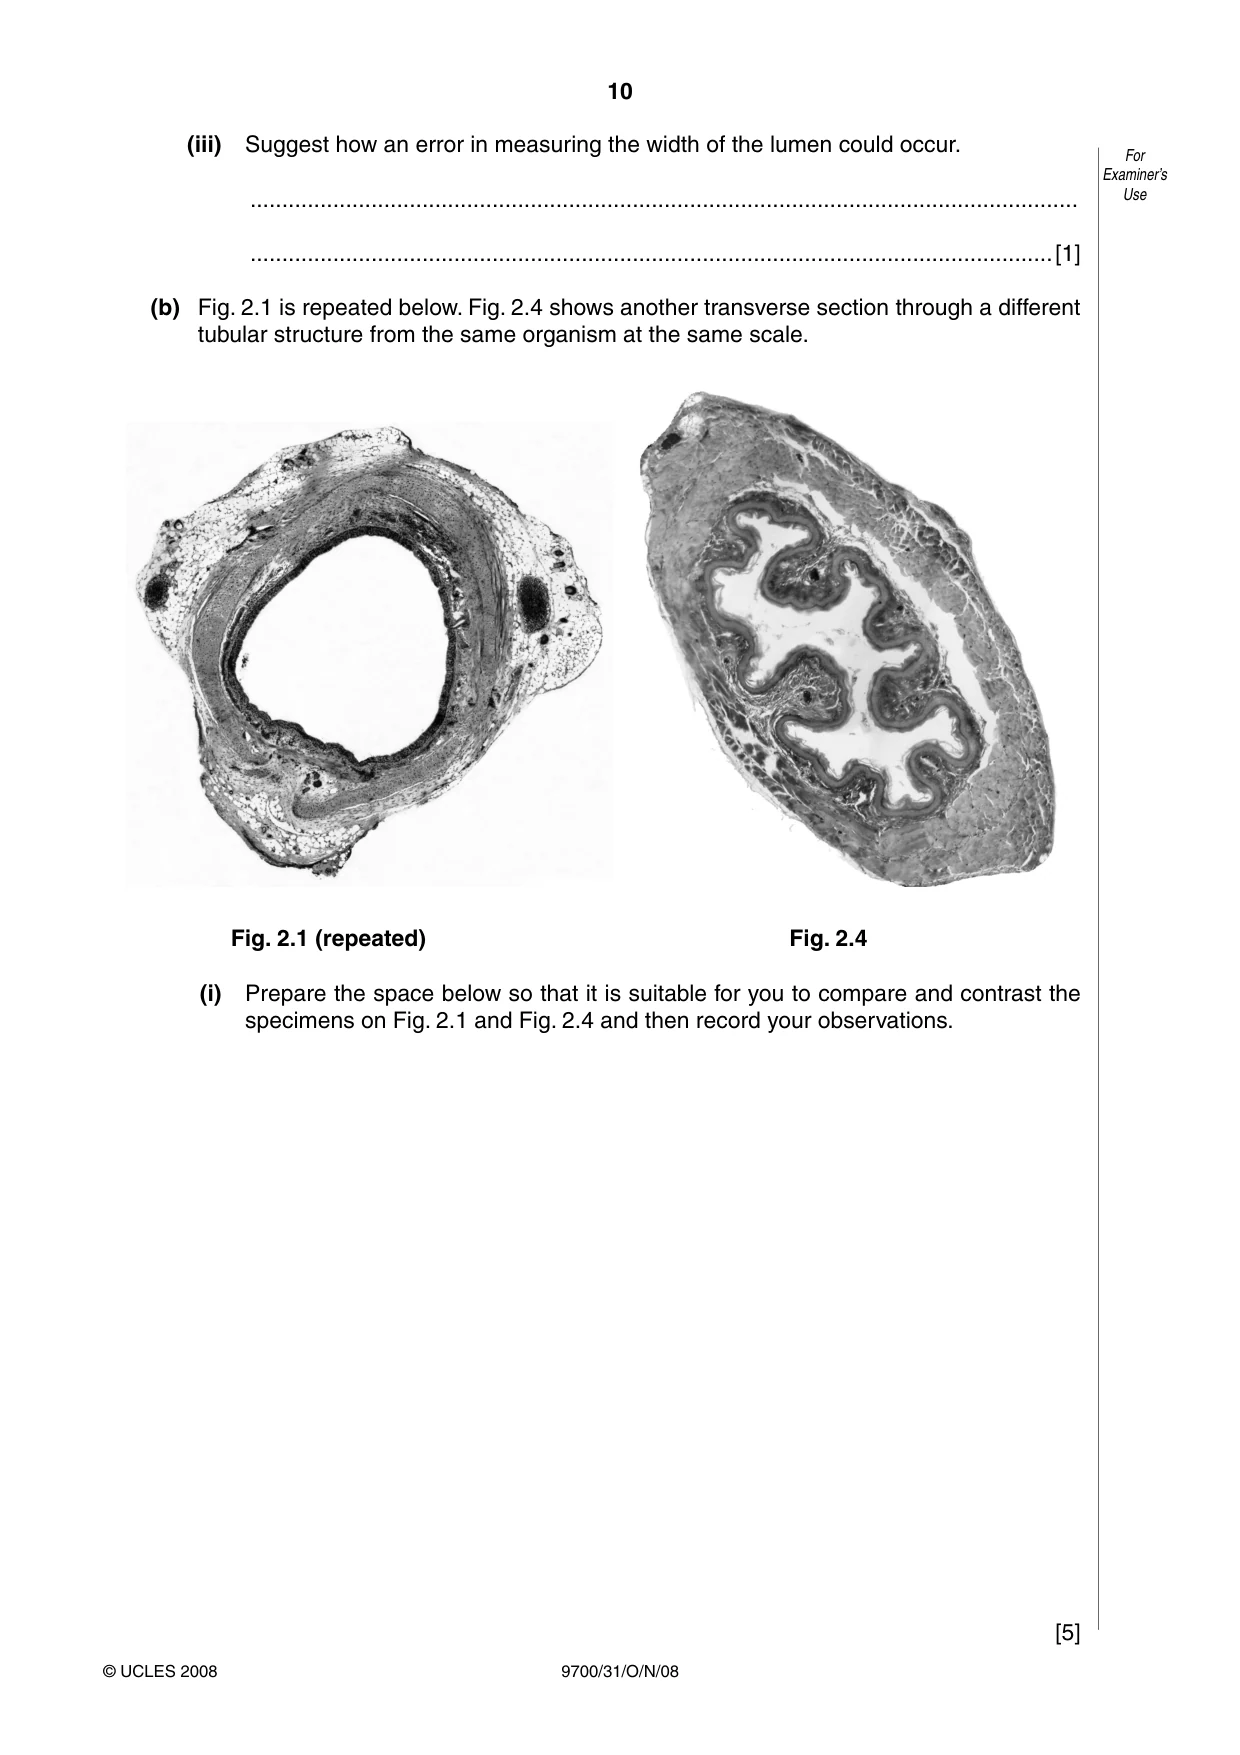
10 9700/31/O/N/08 © UCLES 2008 For Examiner’s Use (iii) Suggest how an error in measuring the width of the lumen could occur. … …[1] (b) Fig. 2.1 is repeated below. Fig. 2.4 shows another transverse section through a different tubular structure from the same organism at the same scale. Fig. 2.1 (repeated) Fig. 2.4 (i) Prepare the space below so that it is suitable for you to compare and contrast the specimens on Fig. 2.1 and Fig. 2.4 and then record your observations. [5]
Question paper, page 11
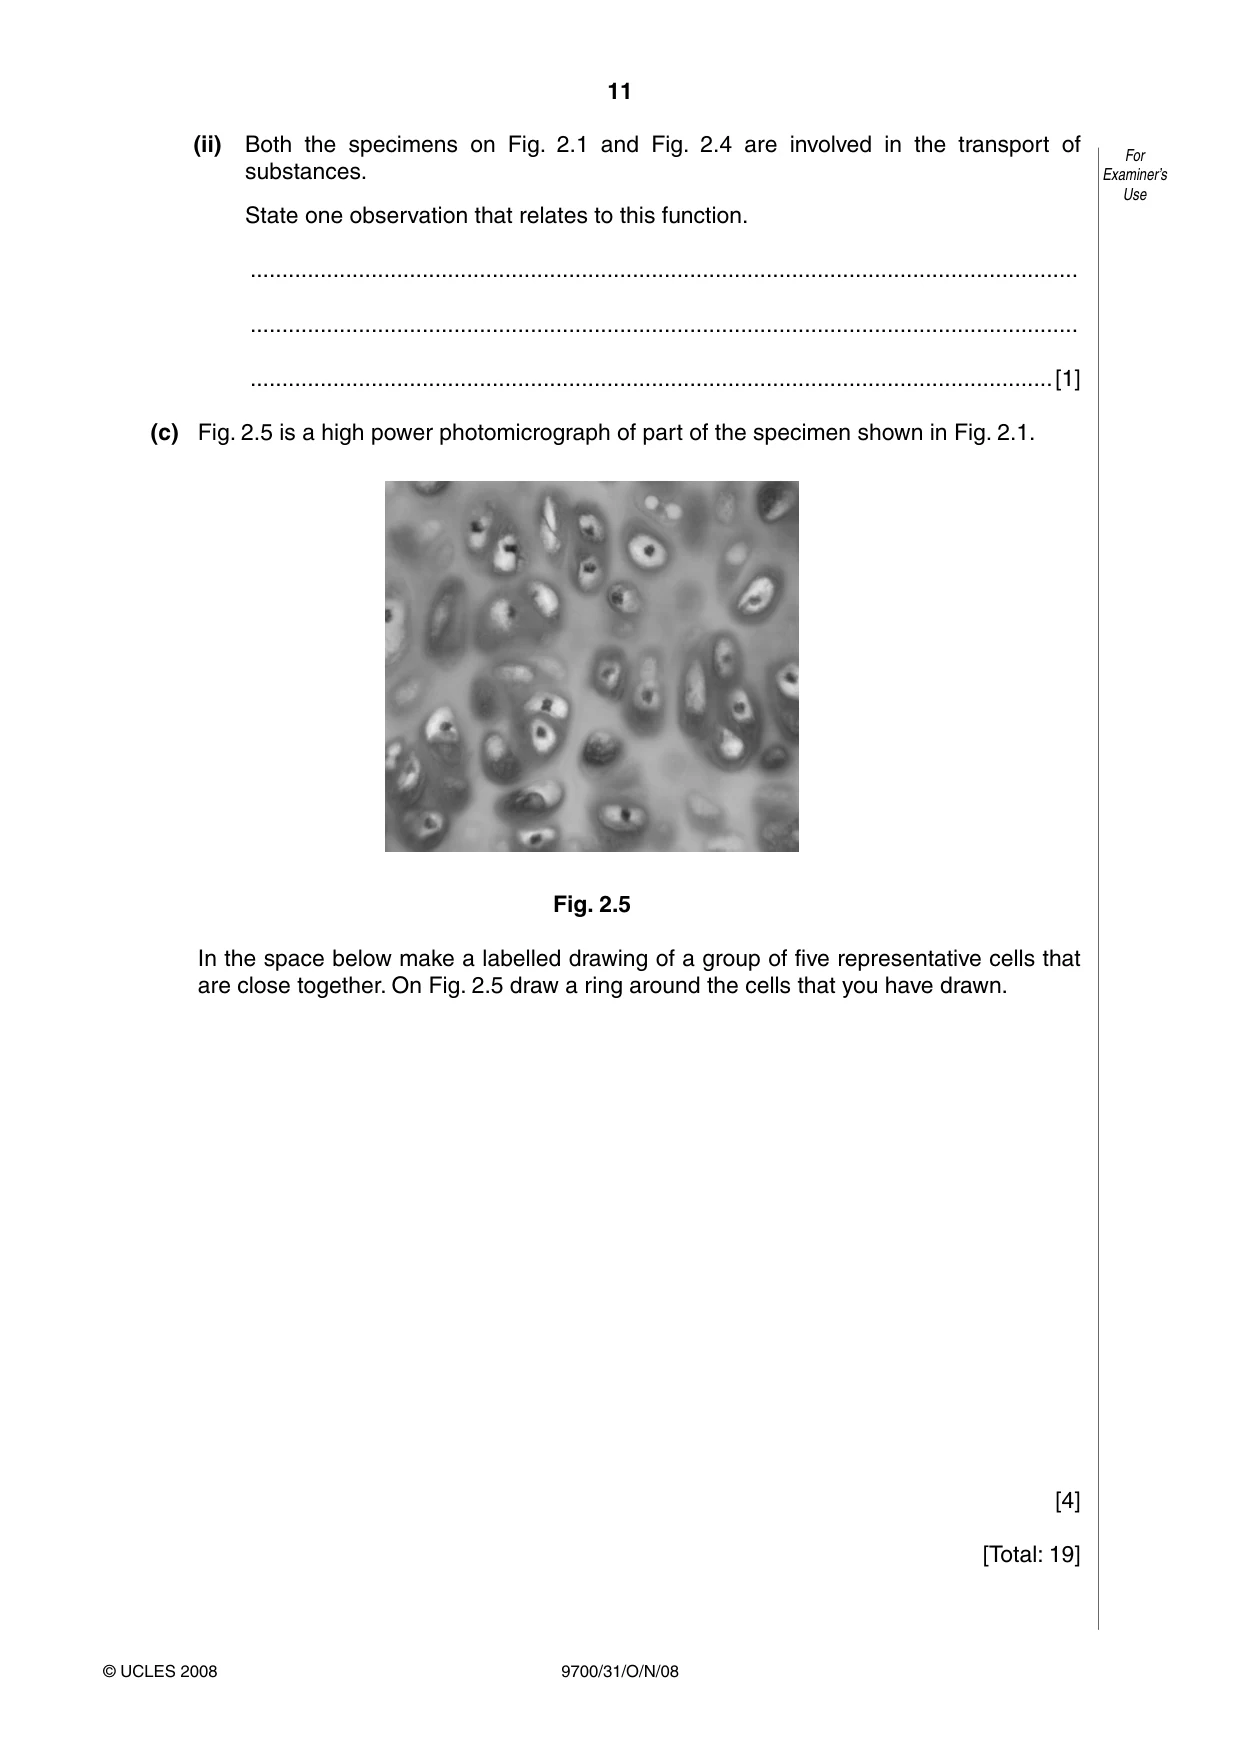
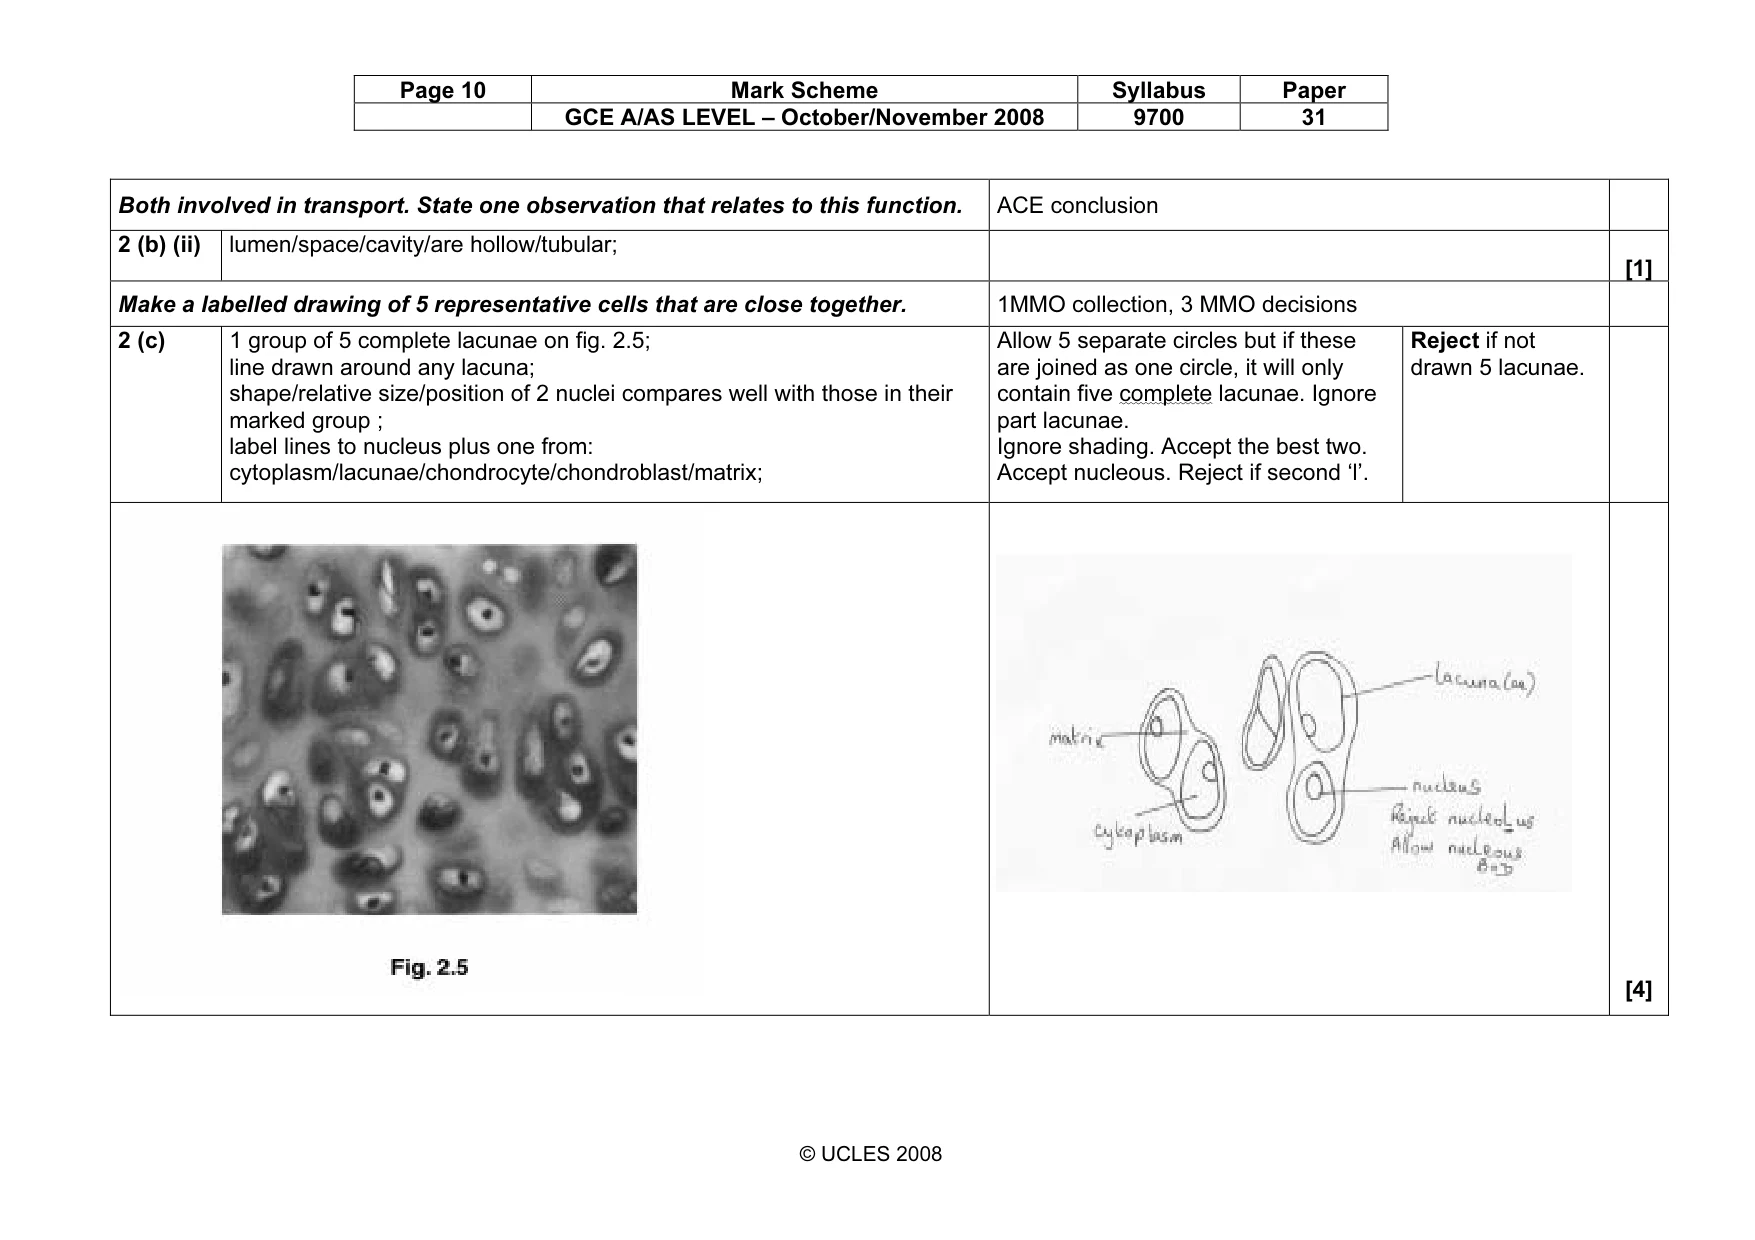
11 9700/31/O/N/08 © UCLES 2008 For Examiner’s Use (ii) Both the specimens on Fig. 2.1 and Fig. 2.4 are involved in the transport of substances. State one observation that relates to this function. … … …[1] (c) Fig. 2.5 is a high power photomicrograph of part of the specimen shown in Fig. 2.1. Fig. 2.5 In the space below make a labelled drawing of a group of five representative cells that are close together. On Fig. 2.5 draw a ring around the cells that you have drawn. [4] [Total: 19]
Question paper, page 12
12 9700/31/O/N/08 Permission to reproduce items where third-party owned material protected by copyright is included has been sought and cleared where possible. Every reasonable effort has been made by the publisher (UCLES) to trace copyright holders, but if any items requiring clearance have unwittingly been included, the publisher will be pleased to make amends at the earliest possible opportunity. University of Cambridge International Examinations is part of the Cambridge Assessment Group. Cambridge Assessment is the brand name of University of Cambridge Local Examinations Syndicate (UCLES), which is itself a department of the University of Cambridge. BLANK PAGE
Mark scheme, page 1
UNIVERSITY OF CAMBRIDGE INTERNATIONAL EXAMINATIONS GCE Advanced Subsidiary Level and GCE Advanced Level MARK SCHEME for the October/November 2008 question paper 9700 BIOLOGY 9700/31 Paper 31 (Advanced Practical 1), maximum raw mark 40 This mark scheme is published as an aid to teachers and candidates, to indicate the requirements of the examination. It shows the basis on which Examiners were instructed to award marks. It does not indicate the details of the discussions that took place at an Examiners’ meeting before marking began. All Examiners are instructed that alternative correct answers and unexpected approaches in candidates’ scripts must be given marks that fairly reflect the relevant knowledge and skills demonstrated. Mark schemes must be read in conjunction with the question papers and the report on the examination. • CIE will not enter into discussions or correspondence in connection with these mark schemes. CIE is publishing the mark schemes for the October/November 2008 question papers for most IGCSE, GCE Advanced Level and Advanced Subsidiary Level syllabuses and some Ordinary Level syllabuses.
Mark scheme, page 2
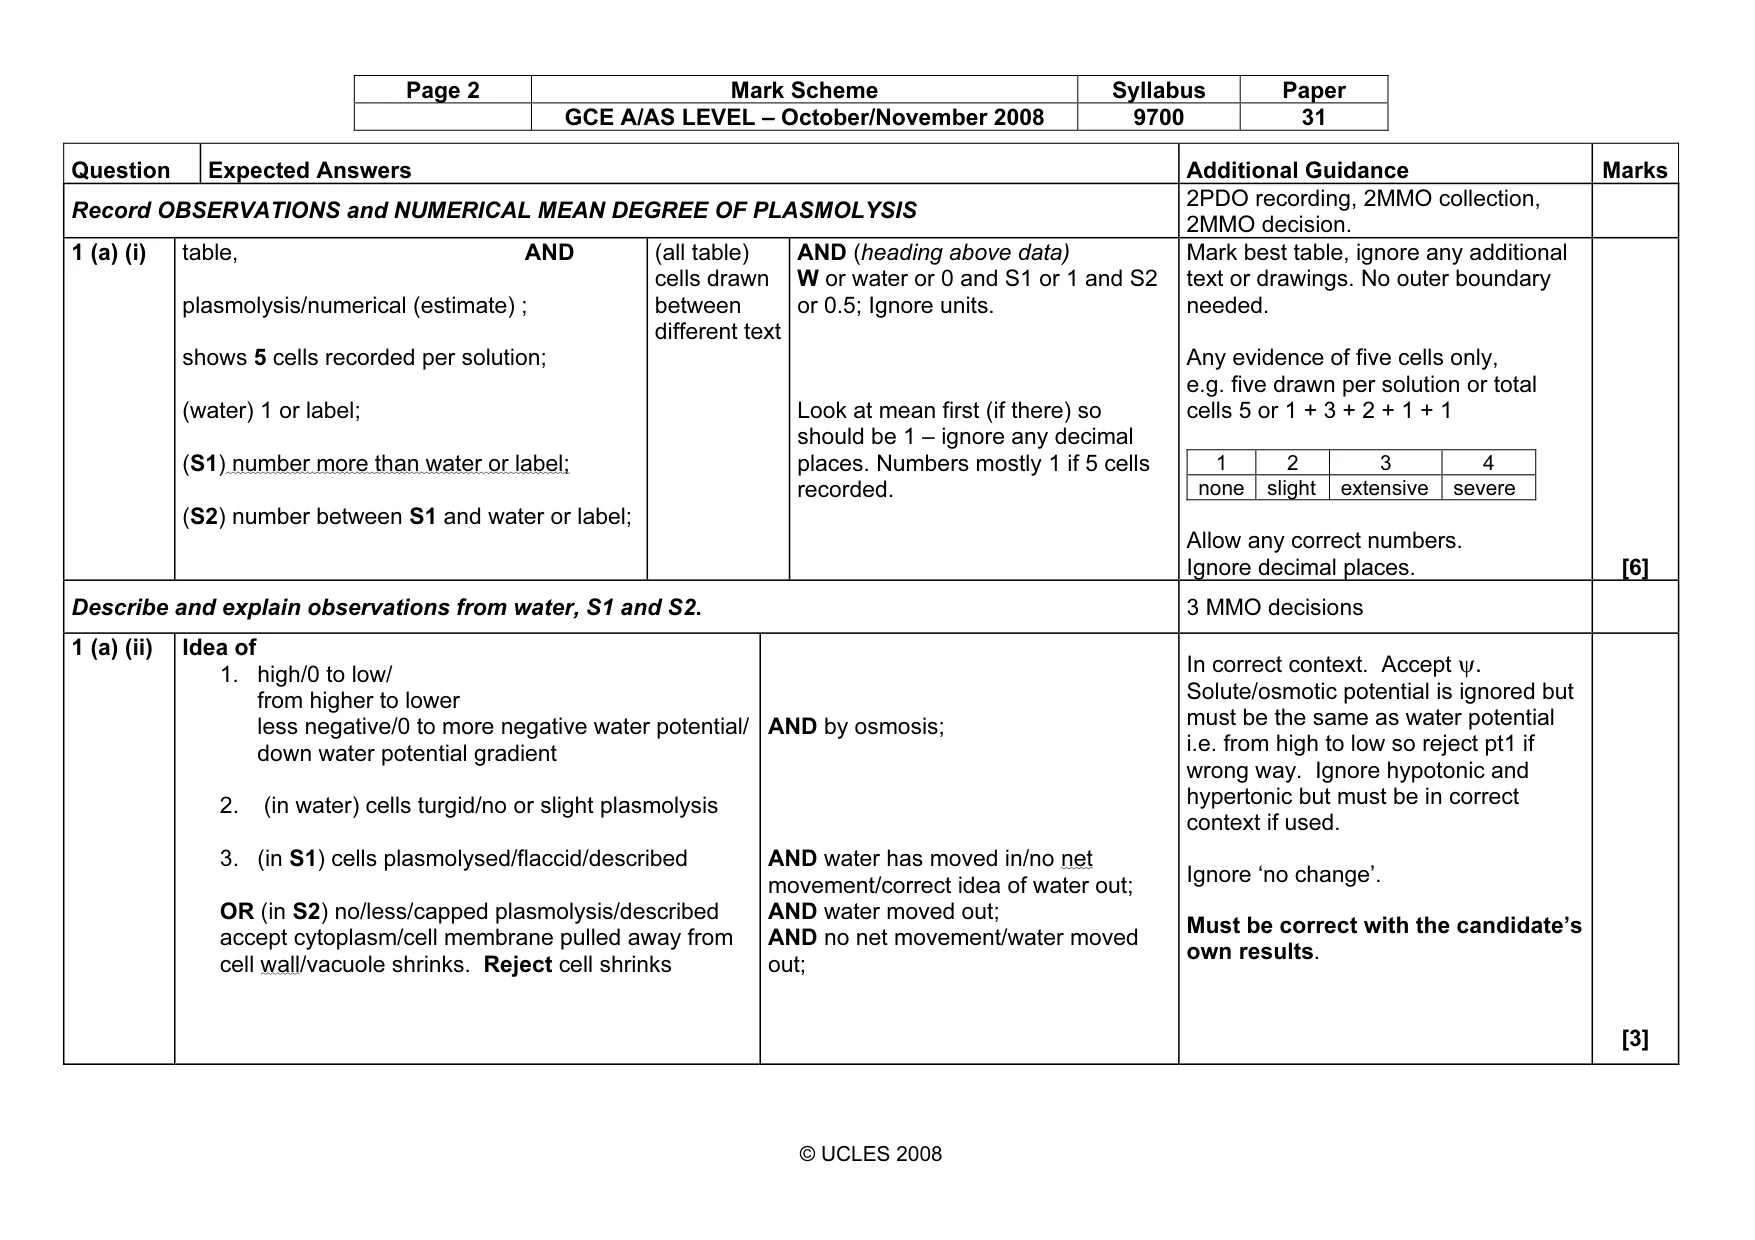
Page 2 Mark Scheme Syllabus Paper GCE A/AS LEVEL – October/November 2008 9700 31 © UCLES 2008 Question Expected Answers Additional Guidance Marks Record OBSERVATIONS and NUMERICAL MEAN DEGREE OF PLASMOLYSIS 2PDO recording, 2MMO collection, 2MMO decision. 1 (a) (i) table, AND plasmolysis/numerical (estimate) ; shows 5 cells recorded per solution; (water) 1 or label; (S1) number more than water or label; (S2) number between S1 and water or label; (all table) cells drawn between different text AND (heading above data) W or water or 0 and S1 or 1 and S2 or 0.5; Ignore units. Look at mean first (if there) so should be 1 – ignore any decimal places. Numbers mostly 1 if 5 cells recorded. Mark best table, ignore any additional text or drawings. No outer boundary needed. Any evidence of five cells only, e.g. five drawn per solution or total cells 5 or 1 + 3 + 2 + 1 + 1 1 2 3 4 none slight extensive severe Allow any correct numbers. Ignore decimal places. [6] Describe and explain observations from water, S1 and S2. 3 MMO decisions 1 (a) (ii) Idea of 1. high/0 to low/ from higher to lower less negative/0 to more negative water potential/ down water potential gradient 2. (in water) cells turgid/no or slight plasmolysis 3. (in S1) cells plasmolysed/flaccid/described OR (in S2) no/less/capped plasmolysis/described accept cytoplasm/cell membrane pulled away from cell wall/vacuole shrinks. Reject cell shrinks AND by osmosis; AND water has moved in/no net movement/correct idea of water out; AND water moved out; AND no net movement/water moved out; In correct context. Accept ψ. Solute/osmotic potential is ignored but must be the same as water potential i.e. from high to low so reject pt1 if wrong way. Ignore hypotonic and hypertonic but must be in correct context if used. Ignore ‘no change’. Must be correct with the candidate’s own results. [3]
Mark scheme, page 3
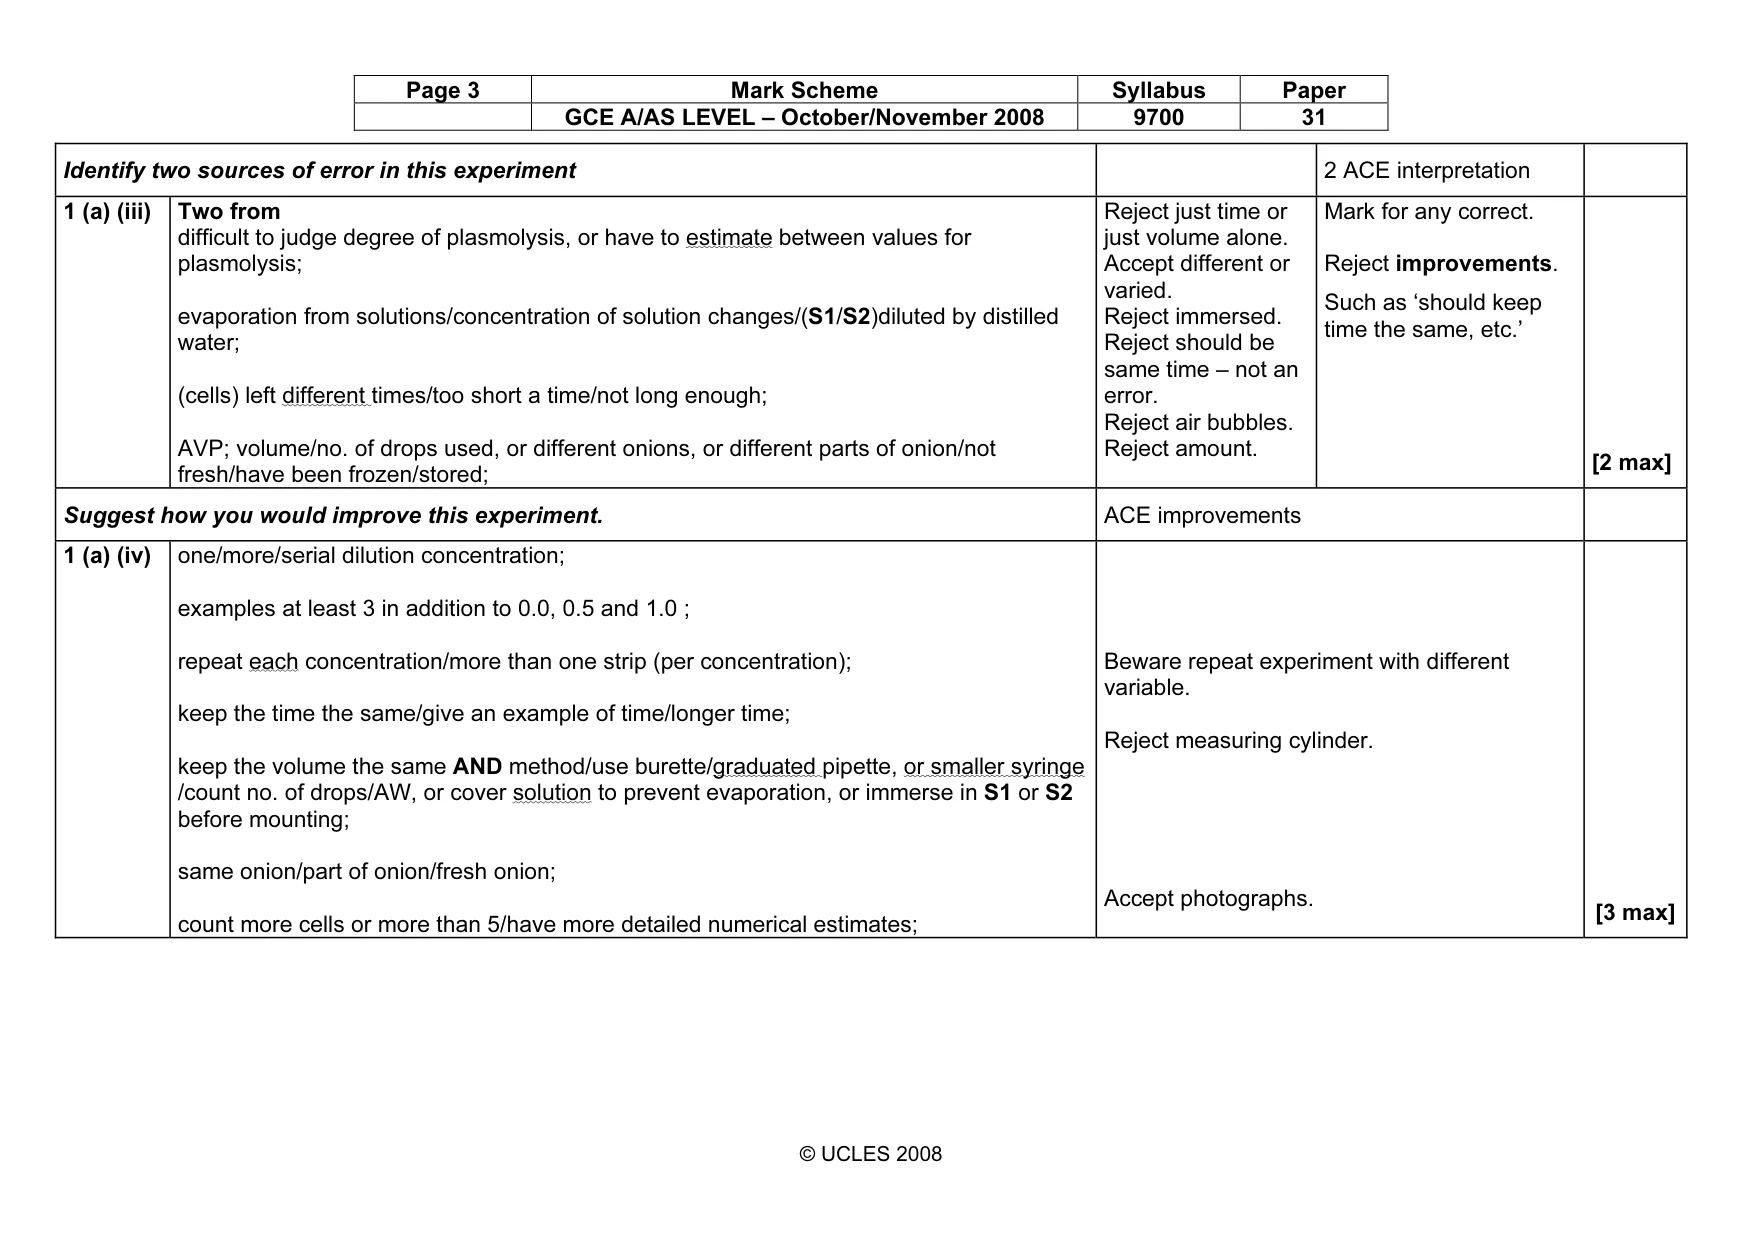
Page 3 Mark Scheme Syllabus Paper GCE A/AS LEVEL – October/November 2008 9700 31 © UCLES 2008 Identify two sources of error in this experiment 2 ACE interpretation 1 (a) (iii) Two from difficult to judge degree of plasmolysis, or have to estimate between values for plasmolysis; evaporation from solutions/concentration of solution changes/(S1/S2)diluted by distilled water; (cells) left different times/too short a time/not long enough; AVP; volume/no. of drops used, or different onions, or different parts of onion/not fresh/have been frozen/stored; Reject just time or just volume alone. Accept different or varied. Reject immersed. Reject should be same time – not an error. Reject air bubbles. Reject amount. Mark for any correct. Reject improvements. Such as ‘should keep time the same, etc.’ [2 max] Suggest how you would improve this experiment. ACE improvements 1 (a) (iv) one/more/serial dilution concentration; examples at least 3 in addition to 0.0, 0.5 and 1.0 ; repeat each concentration/more than one strip (per concentration); keep the time the same/give an example of time/longer time; keep the volume the same AND method/use burette/graduated pipette, or smaller syringe /count no. of drops/AW, or cover solution to prevent evaporation, or immerse in S1 or S2 before mounting; same onion/part of onion/fresh onion; count more cells or more than 5/have more detailed numerical estimates; Beware repeat experiment with different variable. Reject measuring cylinder. Accept photographs. [3 max]
Mark scheme, page 4
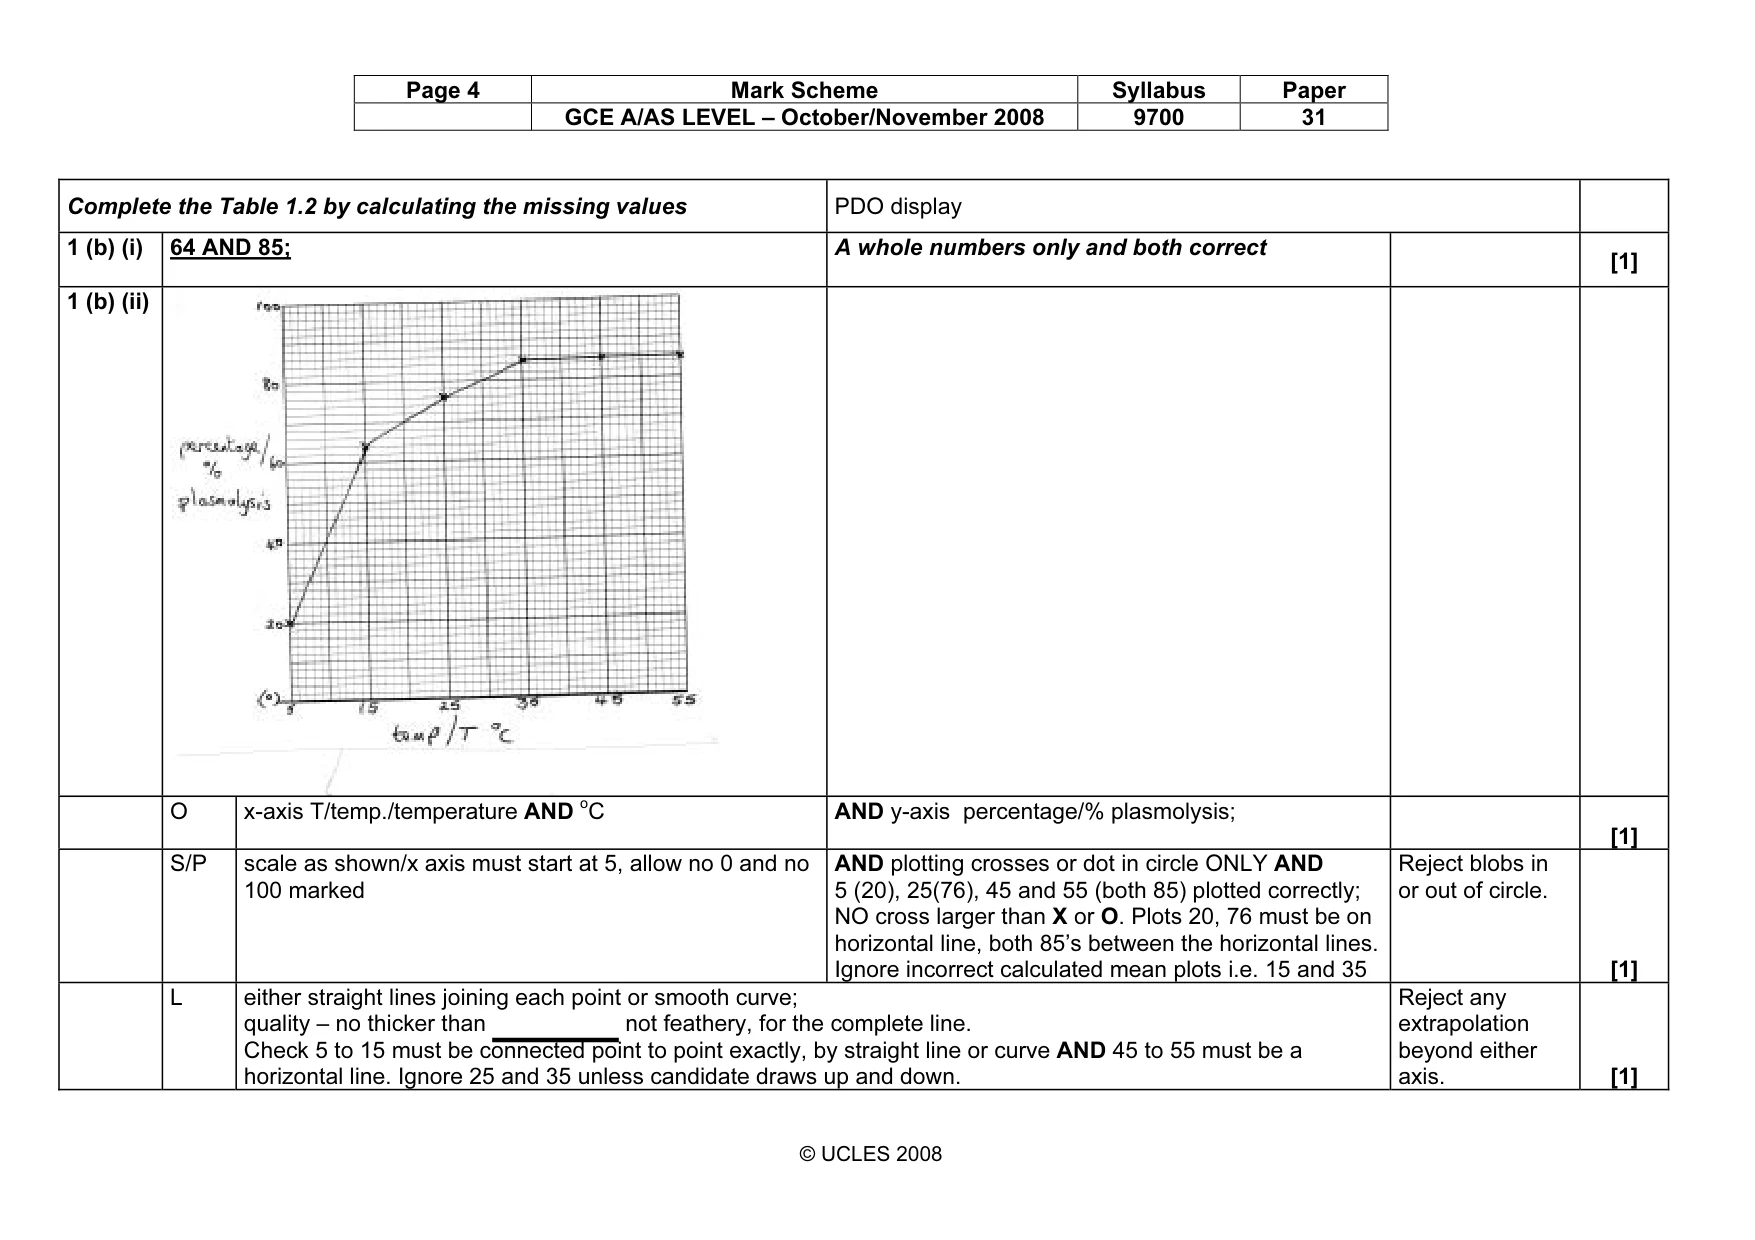
Page 4 Mark Scheme Syllabus Paper GCE A/AS LEVEL – October/November 2008 9700 31 © UCLES 2008 Complete the Table 1.2 by calculating the missing values PDO display 1 (b) (i) 64 AND 85; A whole numbers only and both correct [1] 1 (b) (ii) O x-axis T/temp./temperature AND oC AND y-axis percentage/% plasmolysis; [1] S/P scale as shown/x axis must start at 5, allow no 0 and no 100 marked AND plotting crosses or dot in circle ONLY AND 5 (20), 25(76), 45 and 55 (both 85) plotted correctly; NO cross larger than X or O. Plots 20, 76 must be on horizontal line, both 85’s between the horizontal lines. Ignore incorrect calculated mean plots i.e. 15 and 35 Reject blobs in or out of circle. [1] L either straight lines joining each point or smooth curve; quality – no thicker than not feathery, for the complete line. Check 5 to 15 must be connected point to point exactly, by straight line or curve AND 45 to 55 must be a horizontal line. Ignore 25 and 35 unless candidate draws up and down. Reject any extrapolation beyond either axis. [1]
Mark scheme, page 5
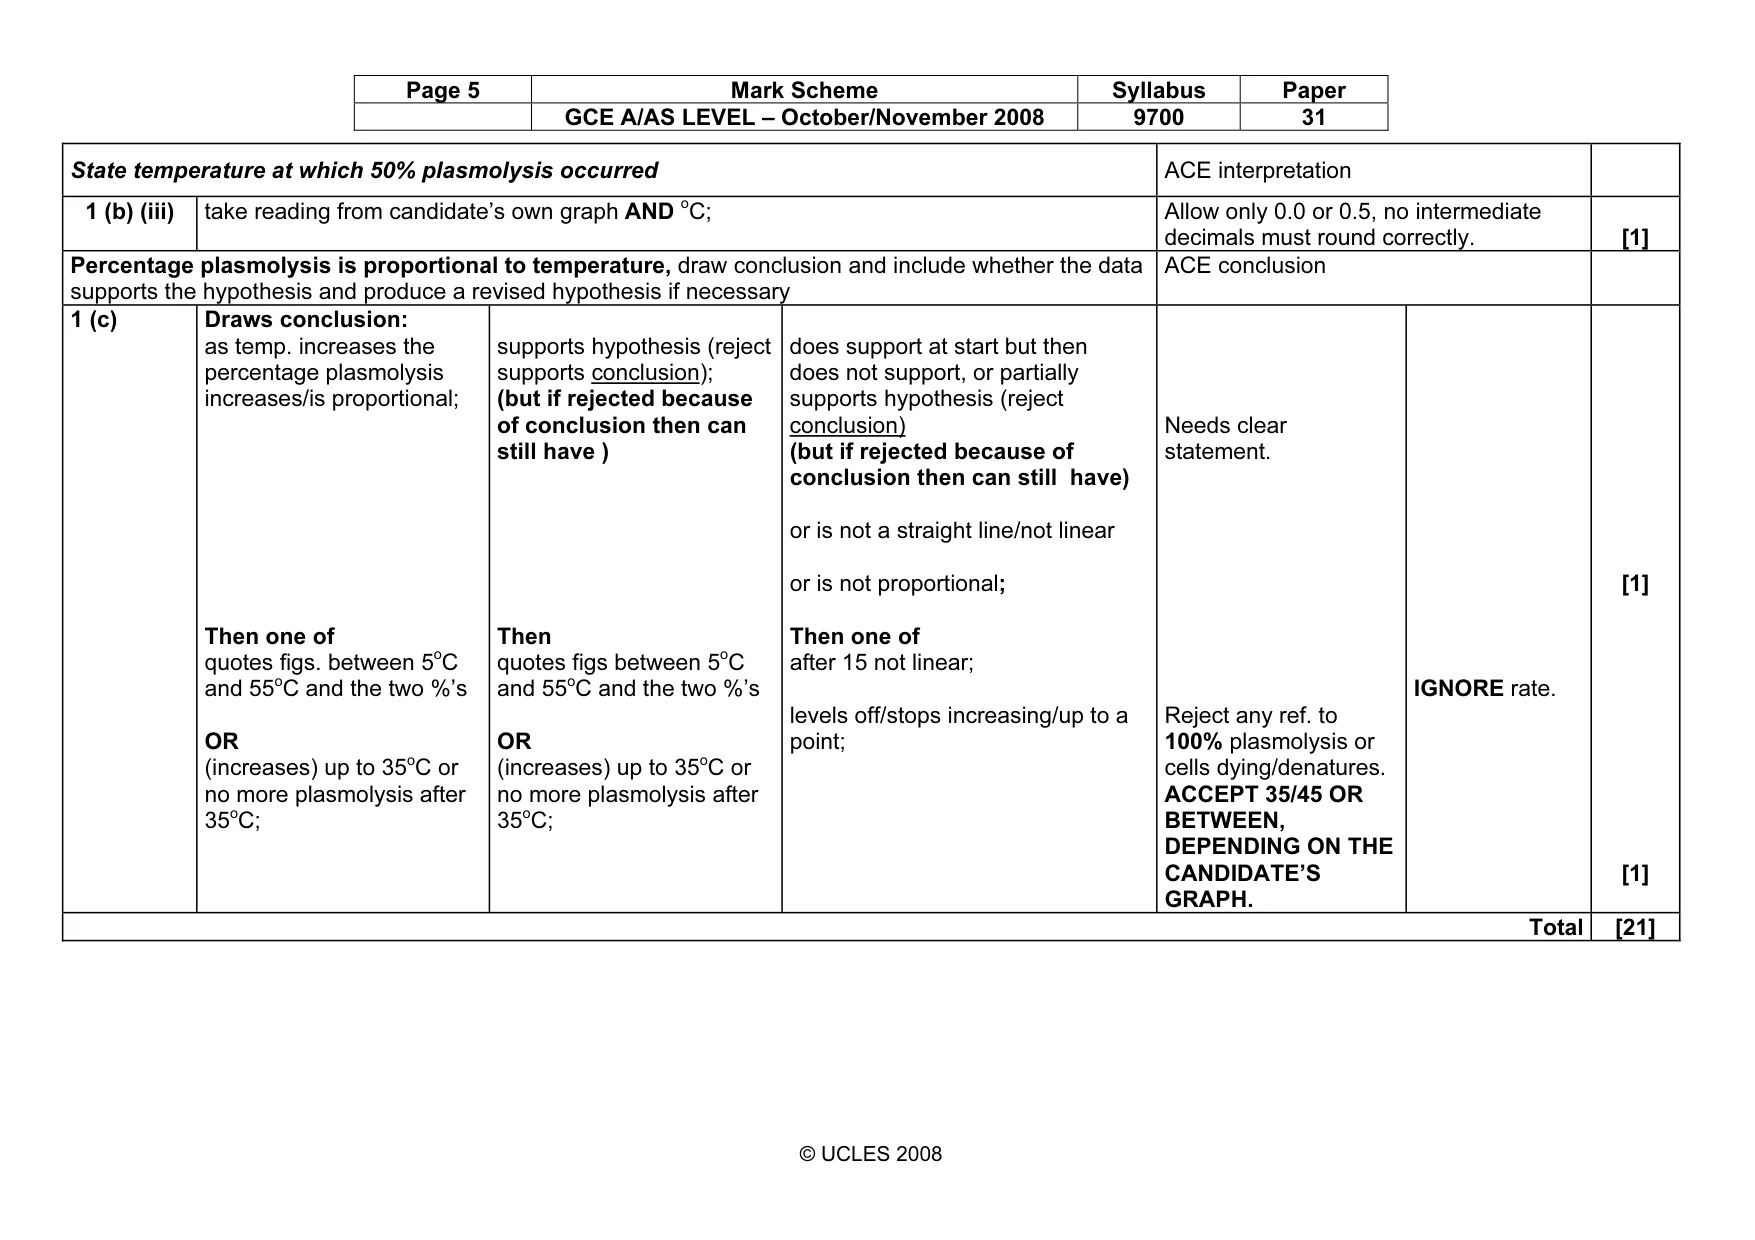
Page 5 Mark Scheme Syllabus Paper GCE A/AS LEVEL – October/November 2008 9700 31 © UCLES 2008 State temperature at which 50% plasmolysis occurred ACE interpretation 1 (b) (iii) take reading from candidate’s own graph AND oC; Allow only 0.0 or 0.5, no intermediate decimals must round correctly. [1] Percentage plasmolysis is proportional to temperature, draw conclusion and include whether the data supports the hypothesis and produce a revised hypothesis if necessary ACE conclusion 1 (c) Draws conclusion: as temp. increases the percentage plasmolysis increases/is proportional; Then one of quotes figs. between 5oC and 55oC and the two %’s OR (increases) up to 35oC or no more plasmolysis after 35oC; supports hypothesis (reject supports conclusion); (but if rejected because of conclusion then can still have ) Then quotes figs between 5oC and 55oC and the two %’s OR (increases) up to 35oC or no more plasmolysis after 35oC; does support at start but then does not support, or partially supports hypothesis (reject conclusion) (but if rejected because of conclusion then can still have) or is not a straight line/not linear or is not proportional; Then one of after 15 not linear; levels off/stops increasing/up to a point; Needs clear statement. Reject any ref. to 100% plasmolysis or cells dying/denatures. ACCEPT 35/45 OR BETWEEN, DEPENDING ON THE CANDIDATE’S GRAPH. IGNORE rate. [1] [1] Total [21]
Mark scheme, page 6
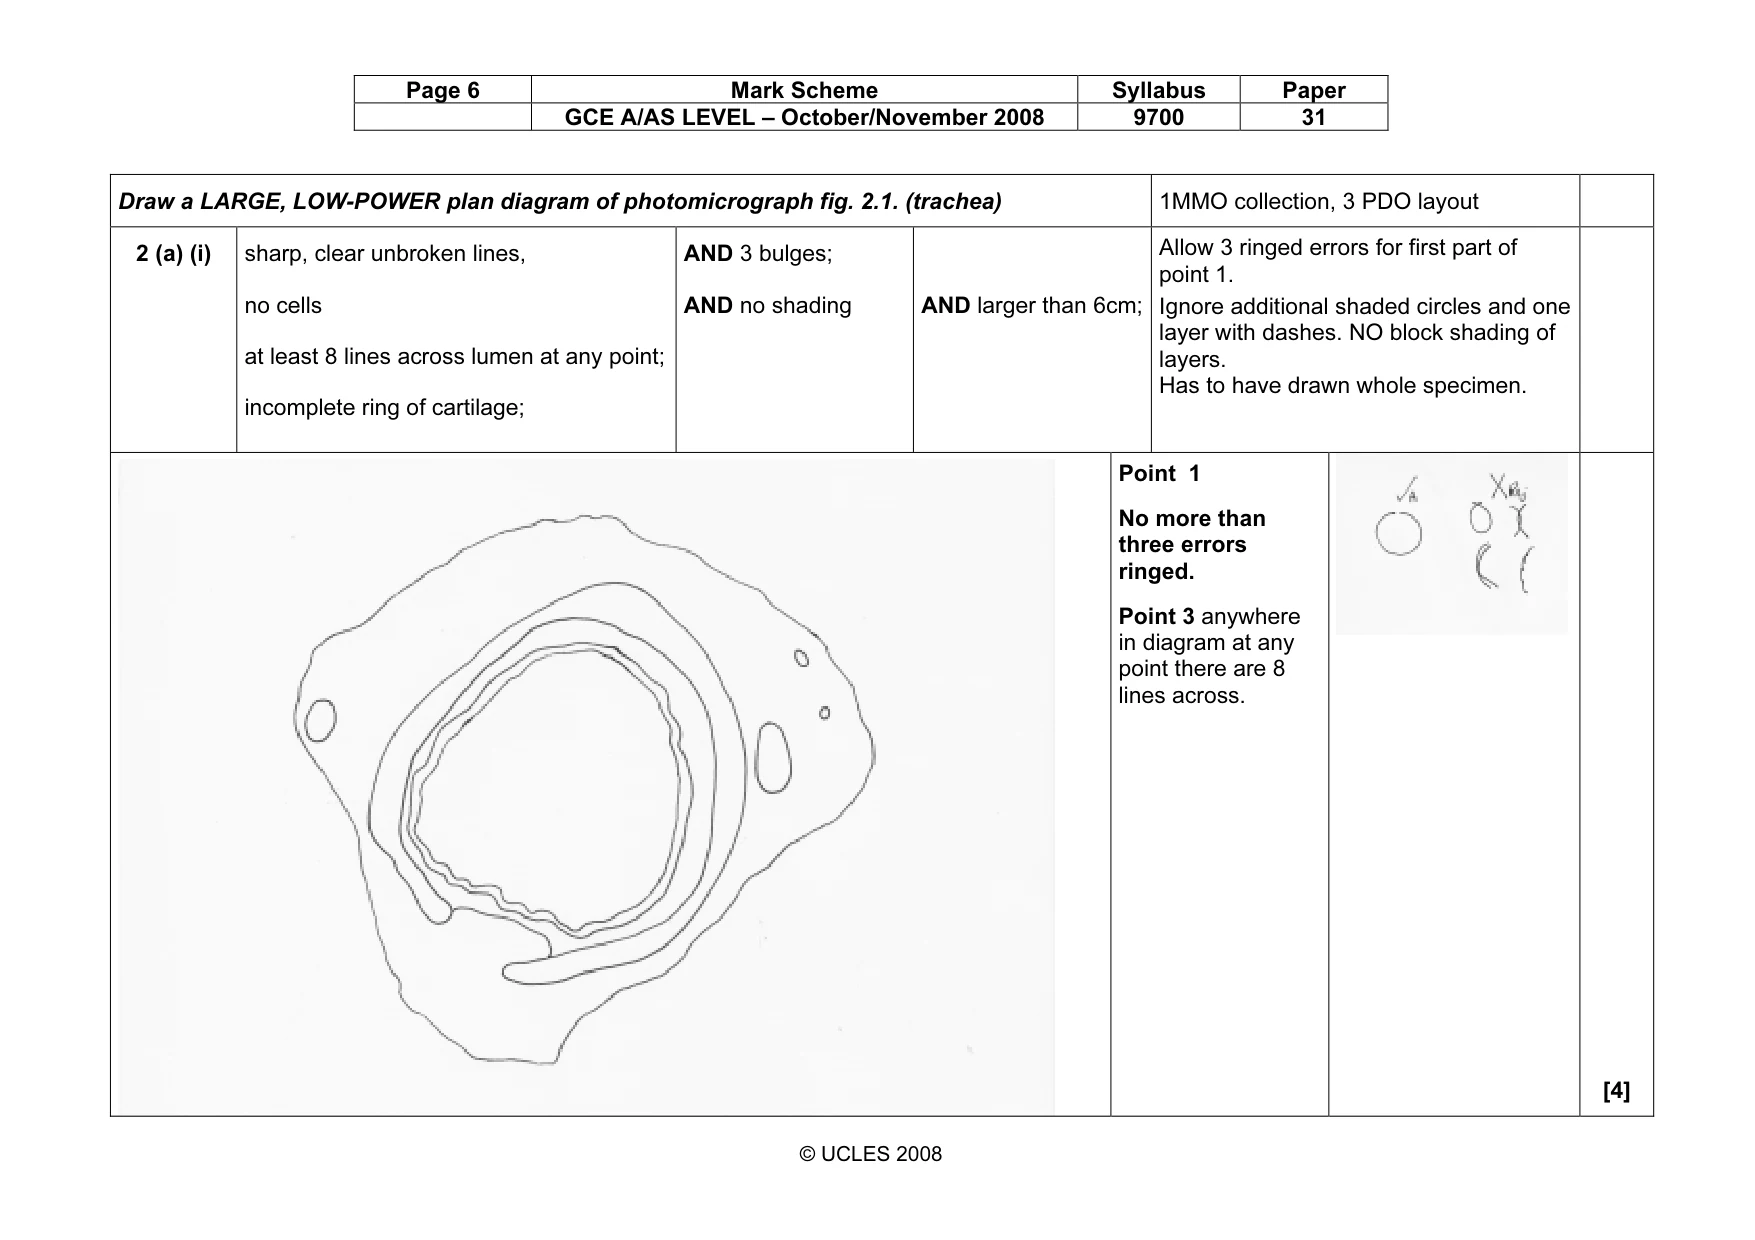
Page 6 Mark Scheme Syllabus Paper GCE A/AS LEVEL – October/November 2008 9700 31 © UCLES 2008 Draw a LARGE, LOW-POWER plan diagram of photomicrograph fig. 2.1. (trachea) 1MMO collection, 3 PDO layout 2 (a) (i) sharp, clear unbroken lines, no cells at least 8 lines across lumen at any point; incomplete ring of cartilage; AND 3 bulges; AND no shading AND larger than 6cm; Allow 3 ringed errors for first part of point 1. Ignore additional shaded circles and one layer with dashes. NO block shading of layers. Has to have drawn whole specimen. Point 1 No more than three errors ringed. Point 3 anywhere in diagram at any point there are 8 lines across. [4]
Mark scheme, page 7
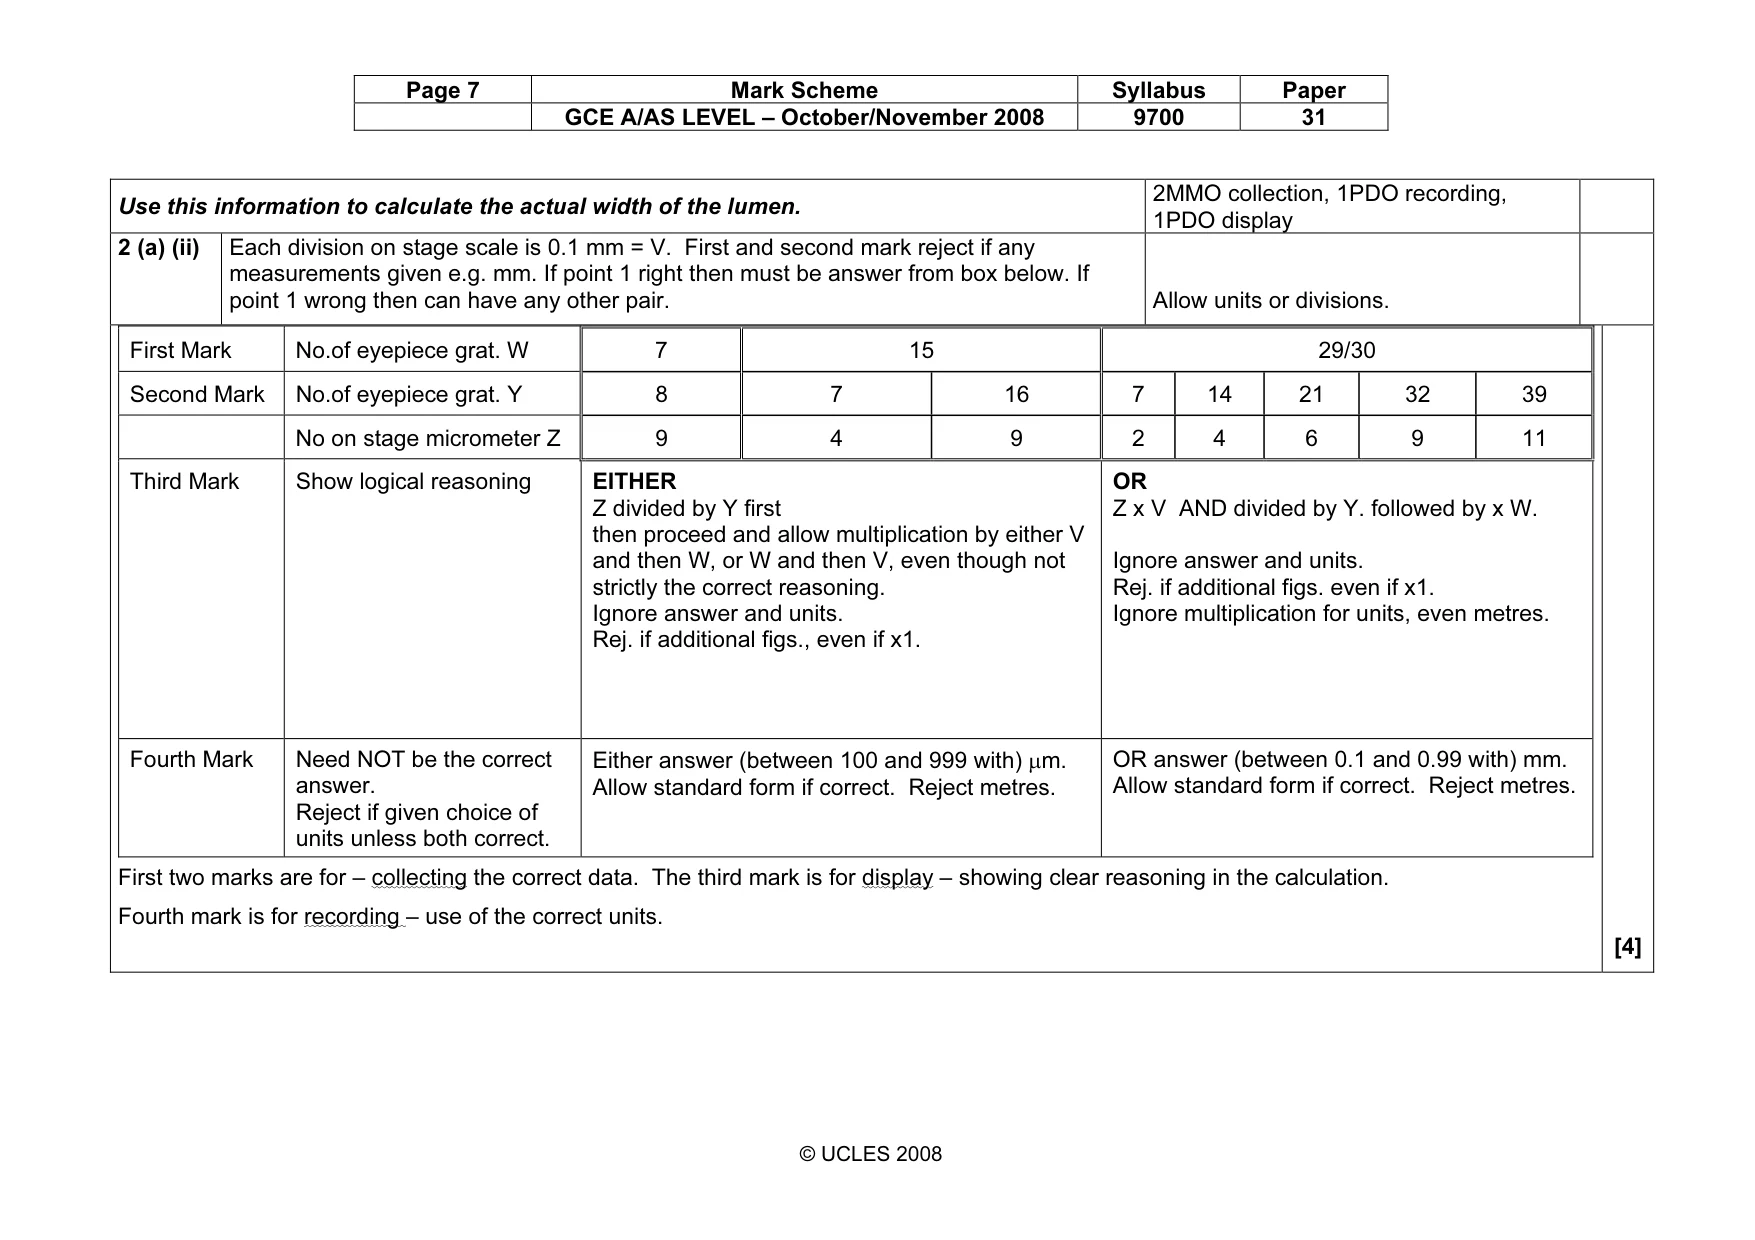
Page 7 Mark Scheme Syllabus Paper GCE A/AS LEVEL – October/November 2008 9700 31 © UCLES 2008 Use this information to calculate the actual width of the lumen. 2MMO collection, 1PDO recording, 1PDO display 2 (a) (ii) Each division on stage scale is 0.1 mm = V. First and second mark reject if any measurements given e.g. mm. If point 1 right then must be answer from box below. If point 1 wrong then can have any other pair. Allow units or divisions. First Mark No.of eyepiece grat. W 7 15 29/30 Second Mark No.of eyepiece grat. Y 8 7 16 7 14 21 32 39 No on stage micrometer Z 9 4 9 2 4 6 9 11 Third Mark Show logical reasoning EITHER Z divided by Y first then proceed and allow multiplication by either V and then W, or W and then V, even though not strictly the correct reasoning. Ignore answer and units. Rej. if additional figs., even if x1. OR Z x V AND divided by Y. followed by x W. Ignore answer and units. Rej. if additional figs. even if x1. Ignore multiplication for units, even metres. Fourth Mark Need NOT be the correct answer. Reject if given choice of units unless both correct. Either answer (between 100 and 999 with) µm. Allow standard form if correct. Reject metres. OR answer (between 0.1 and 0.99 with) mm. Allow standard form if correct. Reject metres. First two marks are for – collecting the correct data. The third mark is for display – showing clear reasoning in the calculation. Fourth mark is for recording – use of the correct units. [4]
Mark scheme, page 8
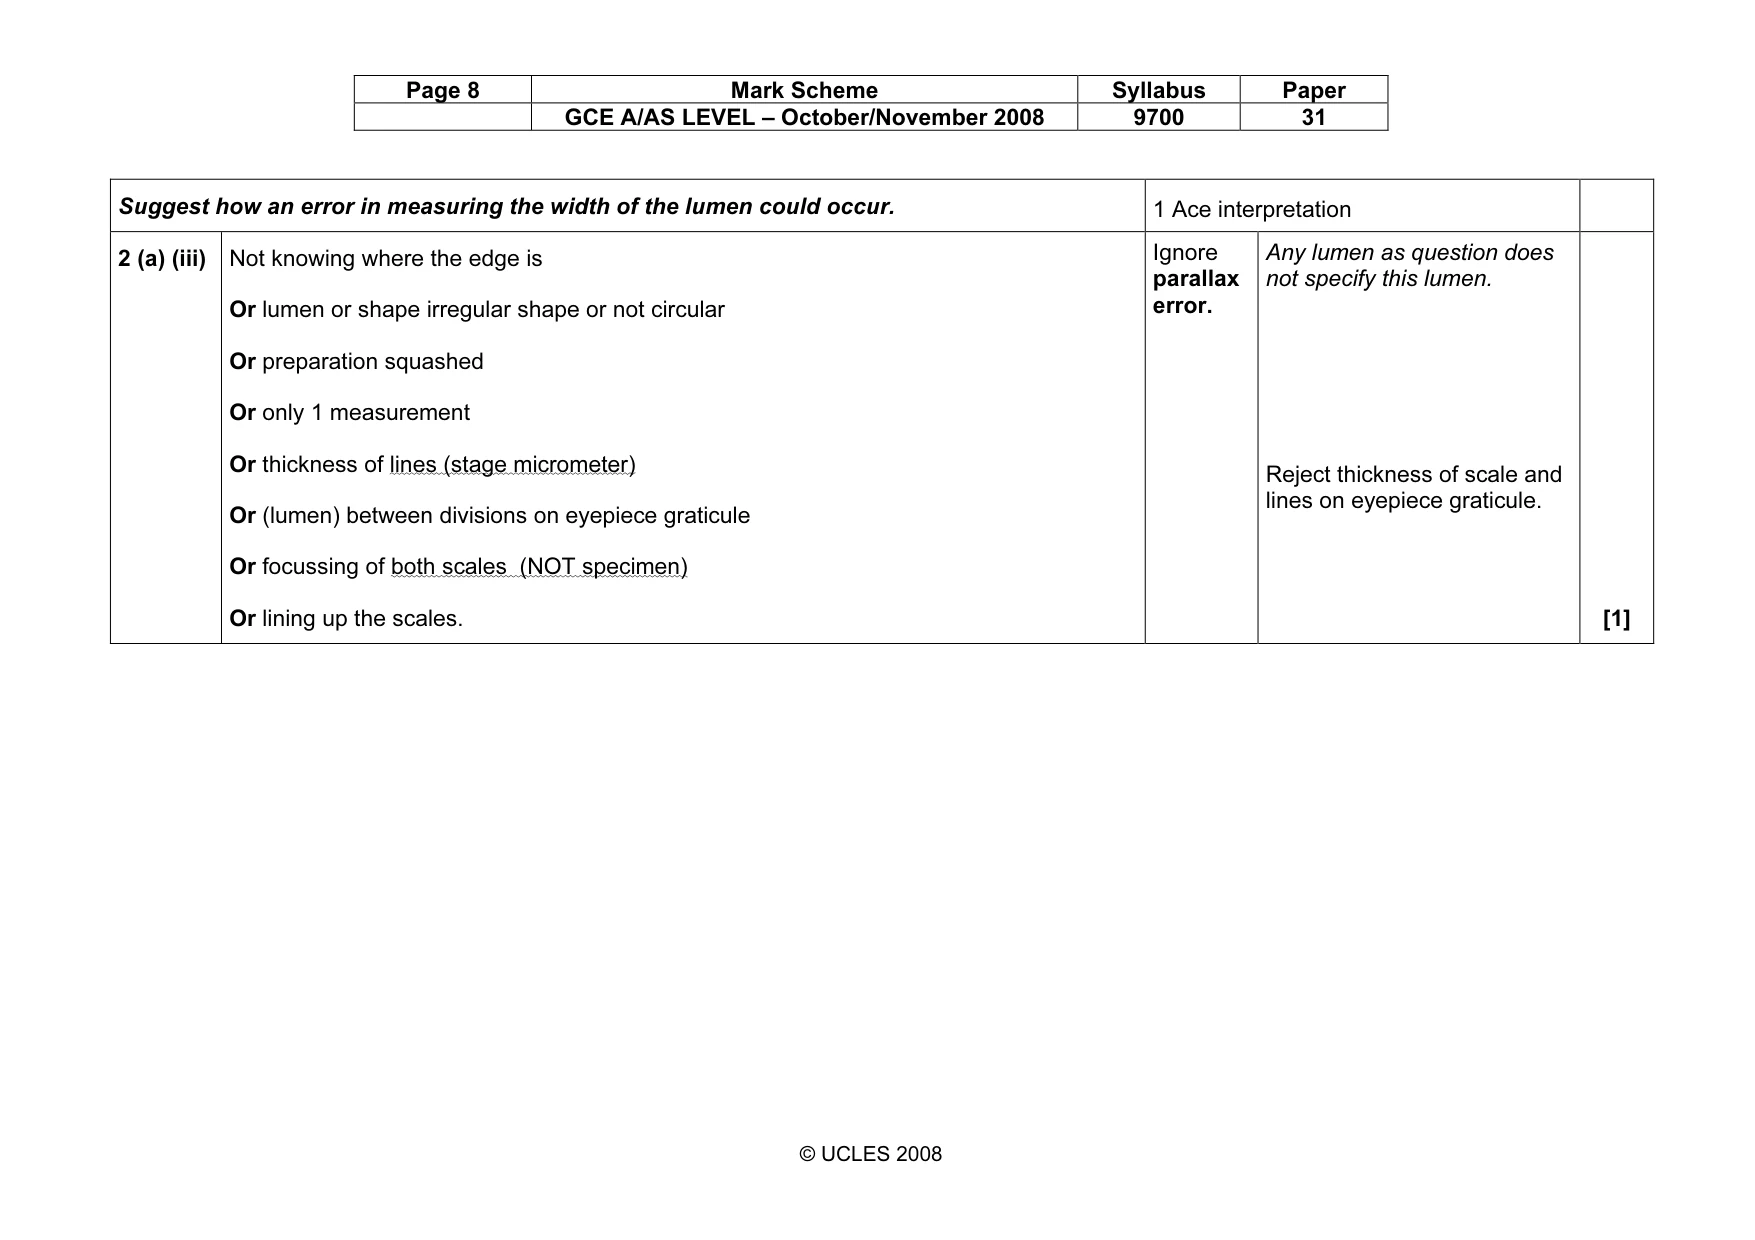
Page 8 Mark Scheme Syllabus Paper GCE A/AS LEVEL – October/November 2008 9700 31 © UCLES 2008 Suggest how an error in measuring the width of the lumen could occur. 1 Ace interpretation 2 (a) (iii) Not knowing where the edge is Or lumen or shape irregular shape or not circular Or preparation squashed Or only 1 measurement Or thickness of lines (stage micrometer) Or (lumen) between divisions on eyepiece graticule Or focussing of both scales (NOT specimen) Or lining up the scales. Ignore parallax error. Any lumen as question does not specify this lumen. Reject thickness of scale and lines on eyepiece graticule. [1]
Mark scheme, page 9
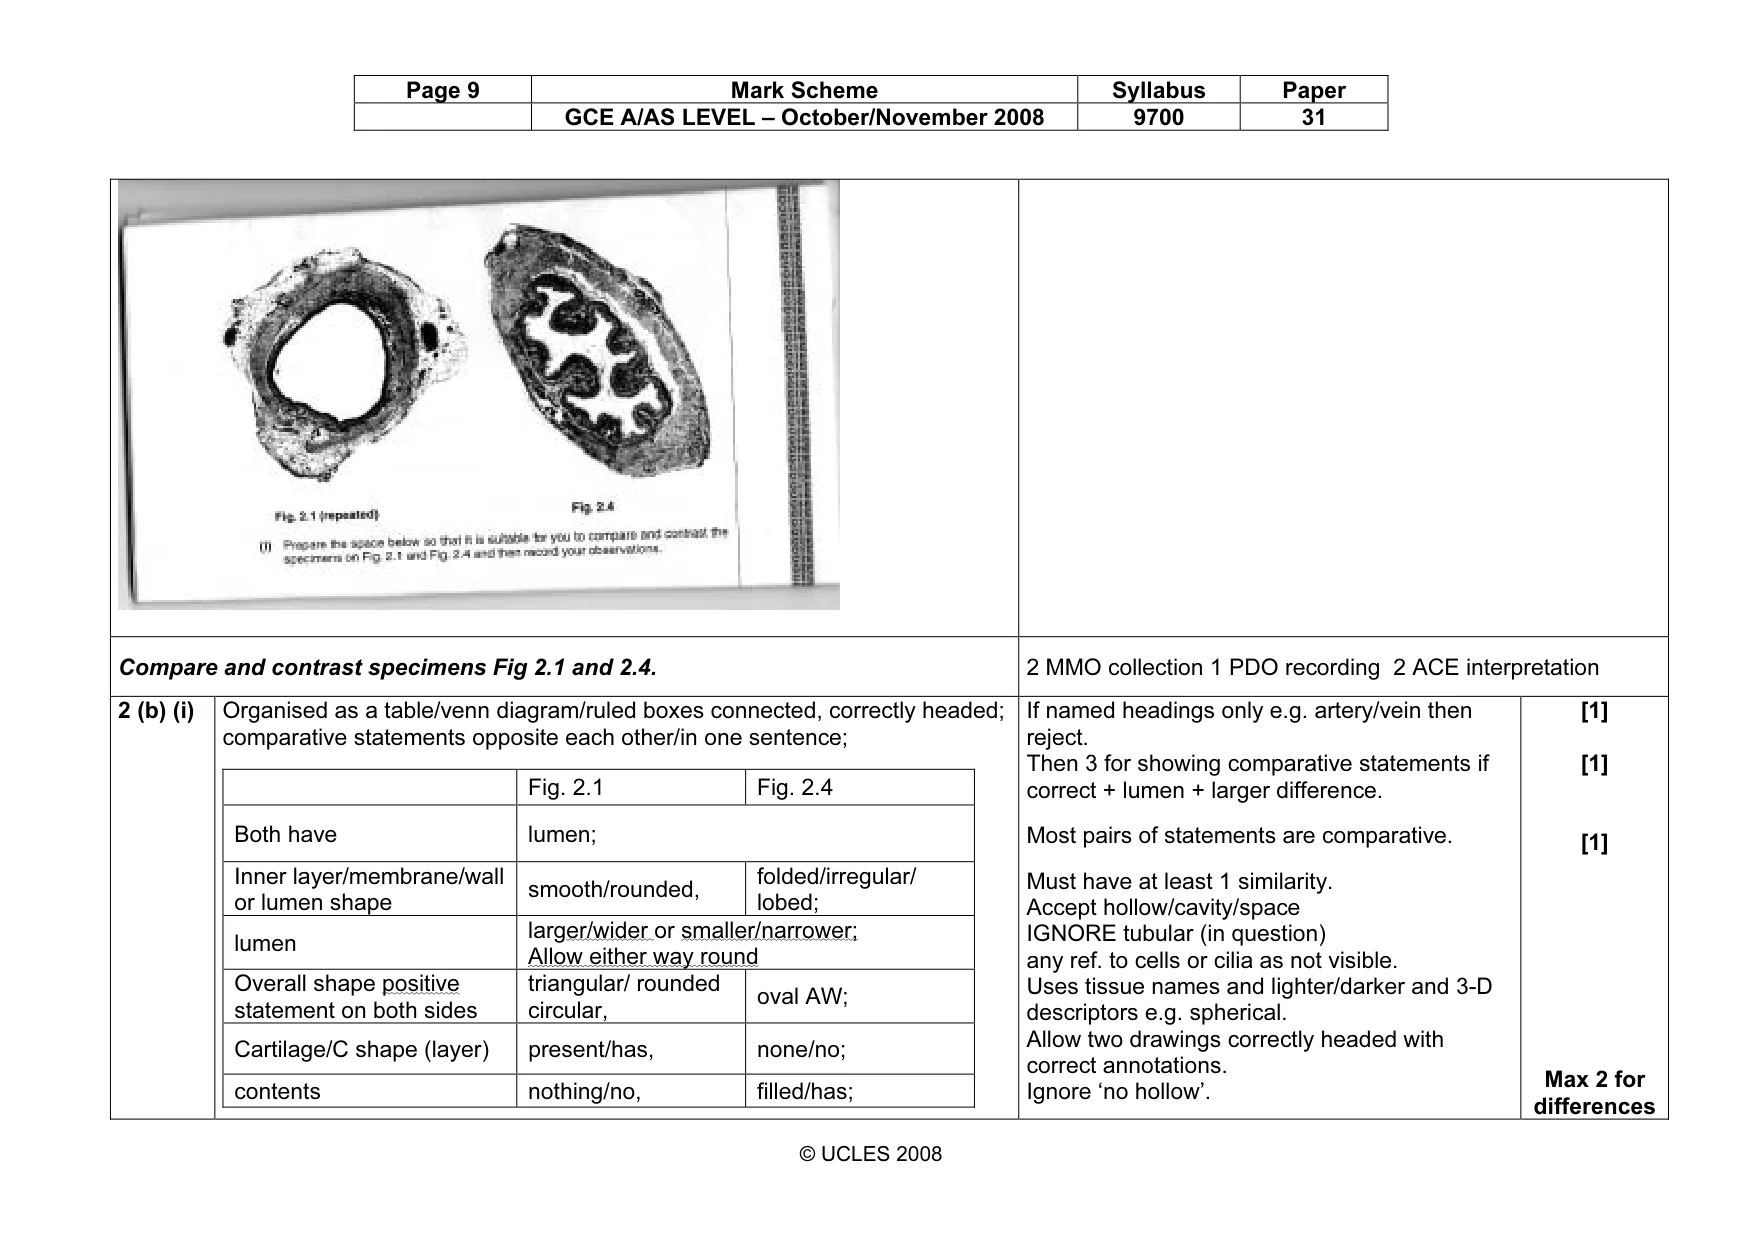
Page 9 Mark Scheme Syllabus Paper GCE A/AS LEVEL – October/November 2008 9700 31 © UCLES 2008 Compare and contrast specimens Fig 2.1 and 2.4. 2 MMO collection 1 PDO recording 2 ACE interpretation 2 (b) (i) Organised as a table/venn diagram/ruled boxes connected, correctly headed; comparative statements opposite each other/in one sentence; Fig. 2.1 Fig. 2.4 Both have lumen; Inner layer/membrane/wall or lumen shape smooth/rounded, folded/irregular/ lobed; lumen larger/wider or smaller/narrower; Allow either way round Overall shape positive statement on both sides triangular/ rounded circular, oval AW; Cartilage/C shape (layer) present/has, none/no; contents nothing/no, filled/has; If named headings only e.g. artery/vein then reject. Then 3 for showing comparative statements if correct + lumen + larger difference. Most pairs of statements are comparative. Must have at least 1 similarity. Accept hollow/cavity/space IGNORE tubular (in question) any ref. to cells or cilia as not visible. Uses tissue names and lighter/darker and 3-D descriptors e.g. spherical. Allow two drawings correctly headed with correct annotations. Ignore ‘no hollow’. [1] [1] [1] Max 2 for differences
Mark scheme, page 10
Page 10 Mark Scheme Syllabus Paper GCE A/AS LEVEL – October/November 2008 9700 31 © UCLES 2008 Both involved in transport. State one observation that relates to this function. ACE conclusion 2 (b) (ii) lumen/space/cavity/are hollow/tubular; [1] Make a labelled drawing of 5 representative cells that are close together. 1MMO collection, 3 MMO decisions 2 (c) 1 group of 5 complete lacunae on fig. 2.5; line drawn around any lacuna; shape/relative size/position of 2 nuclei compares well with those in their marked group ; label lines to nucleus plus one from: cytoplasm/lacunae/chondrocyte/chondroblast/matrix; Allow 5 separate circles but if these are joined as one circle, it will only contain five complete lacunae. Ignore part lacunae. Ignore shading. Accept the best two. Accept nucleous. Reject if second ‘l’. Reject if not drawn 5 lacunae. [4]
What you needed in this session
Cambridge’s own grade thresholds for 2008 Oct/Nov, Paper 3 · Variant 1. A higher threshold means an easier paper — the bar moves with how the cohort did.