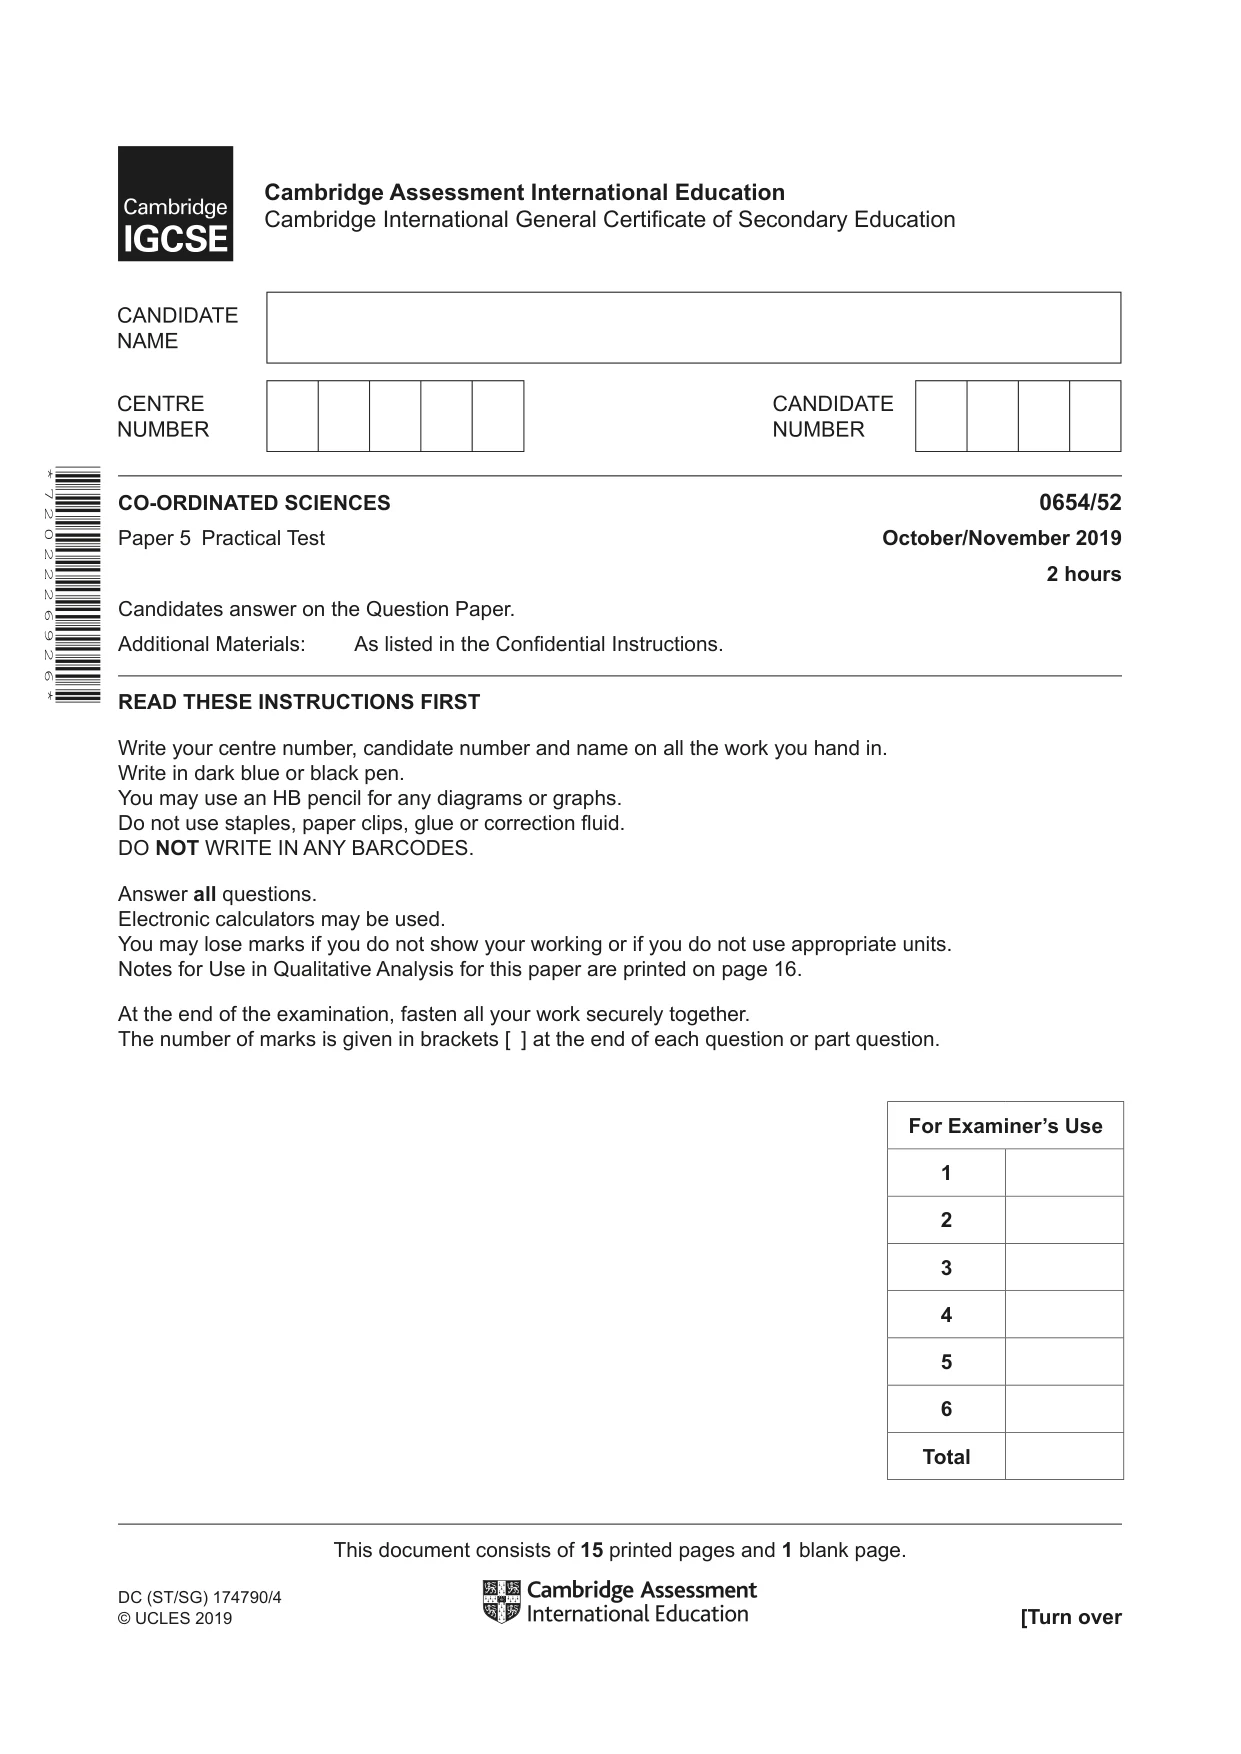
Cambridge IGCSE Sciences - Co-ordinated (Double) 0654 — 2019 Oct/Nov Paper 5 · Variant 2
0654/52/O/N/19 · 6 questions · 60 marks · ≈68 min
The question paper and its mark scheme, free to read here and free to download. This is Cambridge’s own paper, exactly as it was sat.
Question paper16 pages



Mark scheme8 pages
Answers below. Sit the paper first if you are practising.
Questions as text
Q1 · You are going to investigate the nutrient content of yogurt and rice water
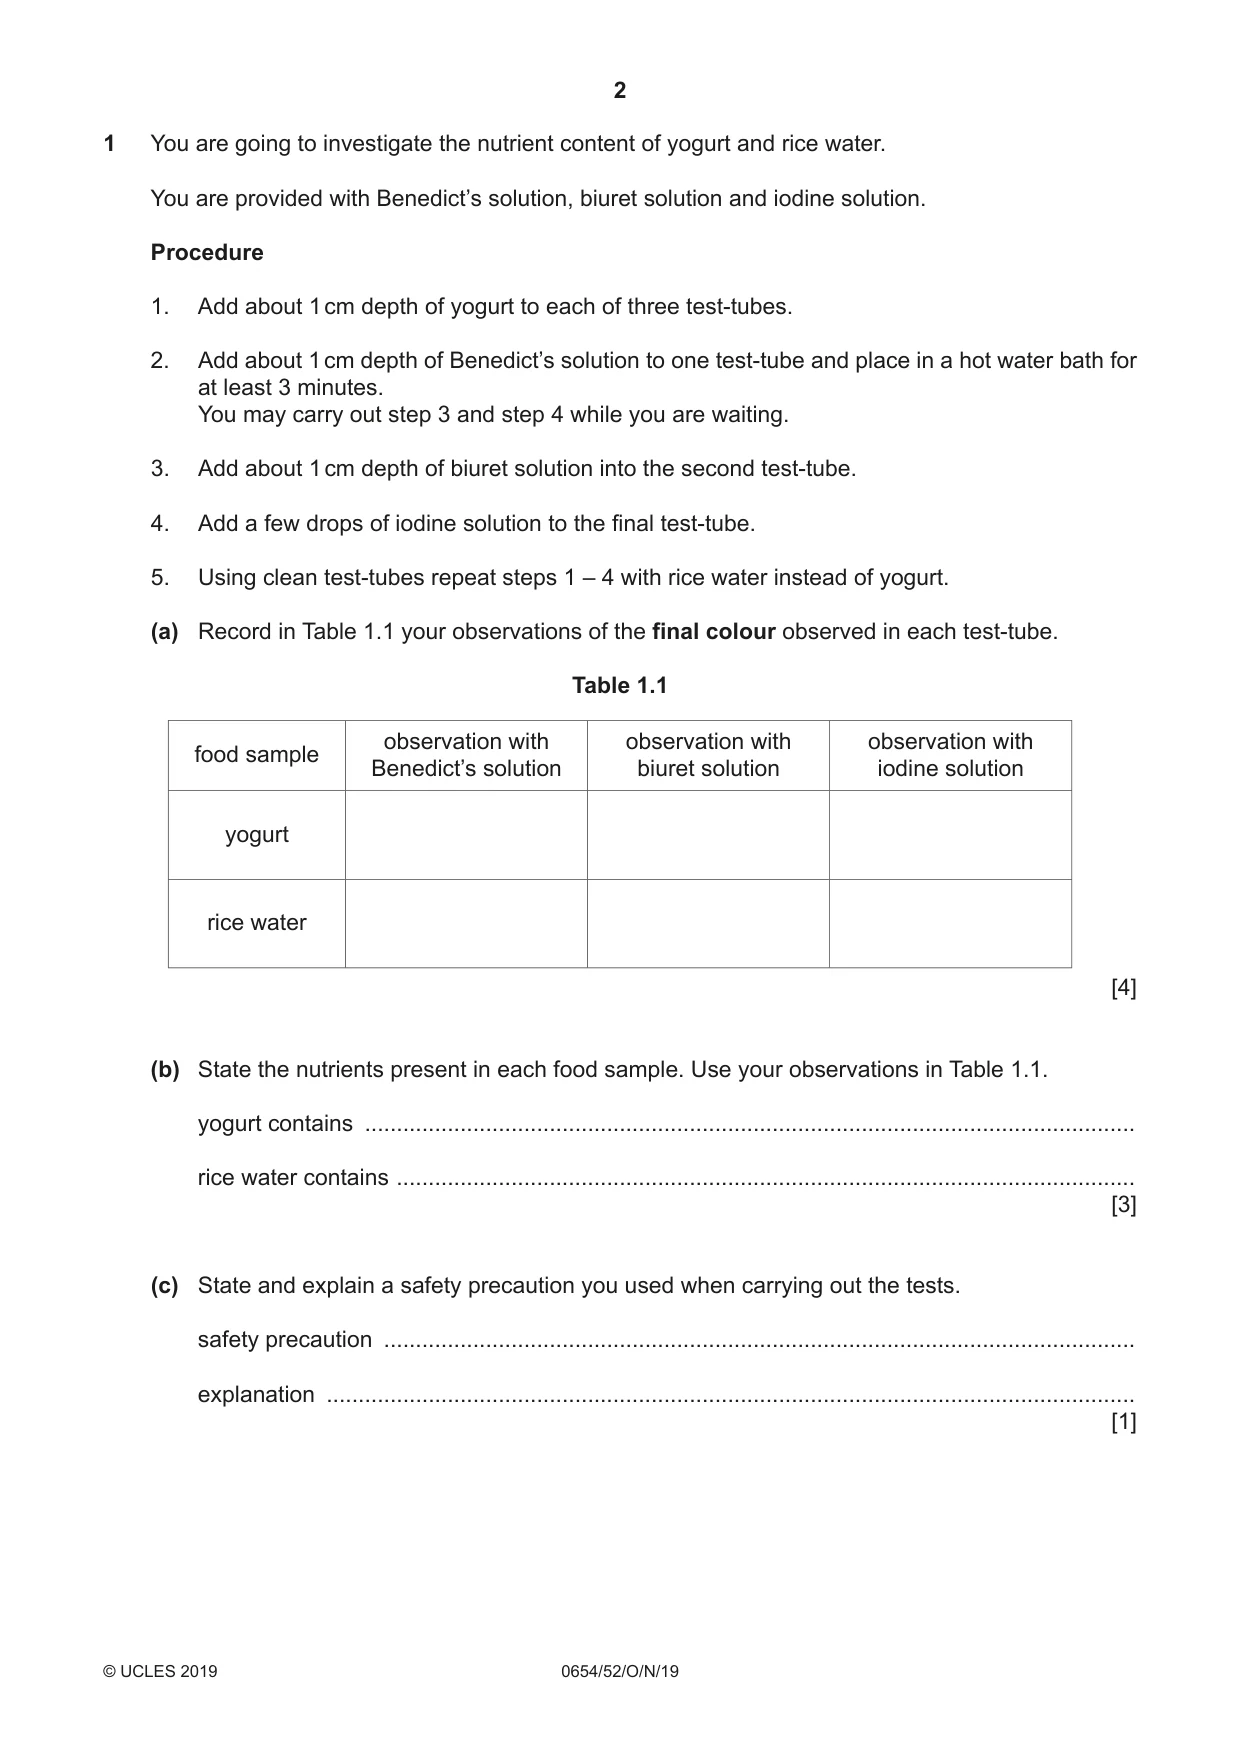
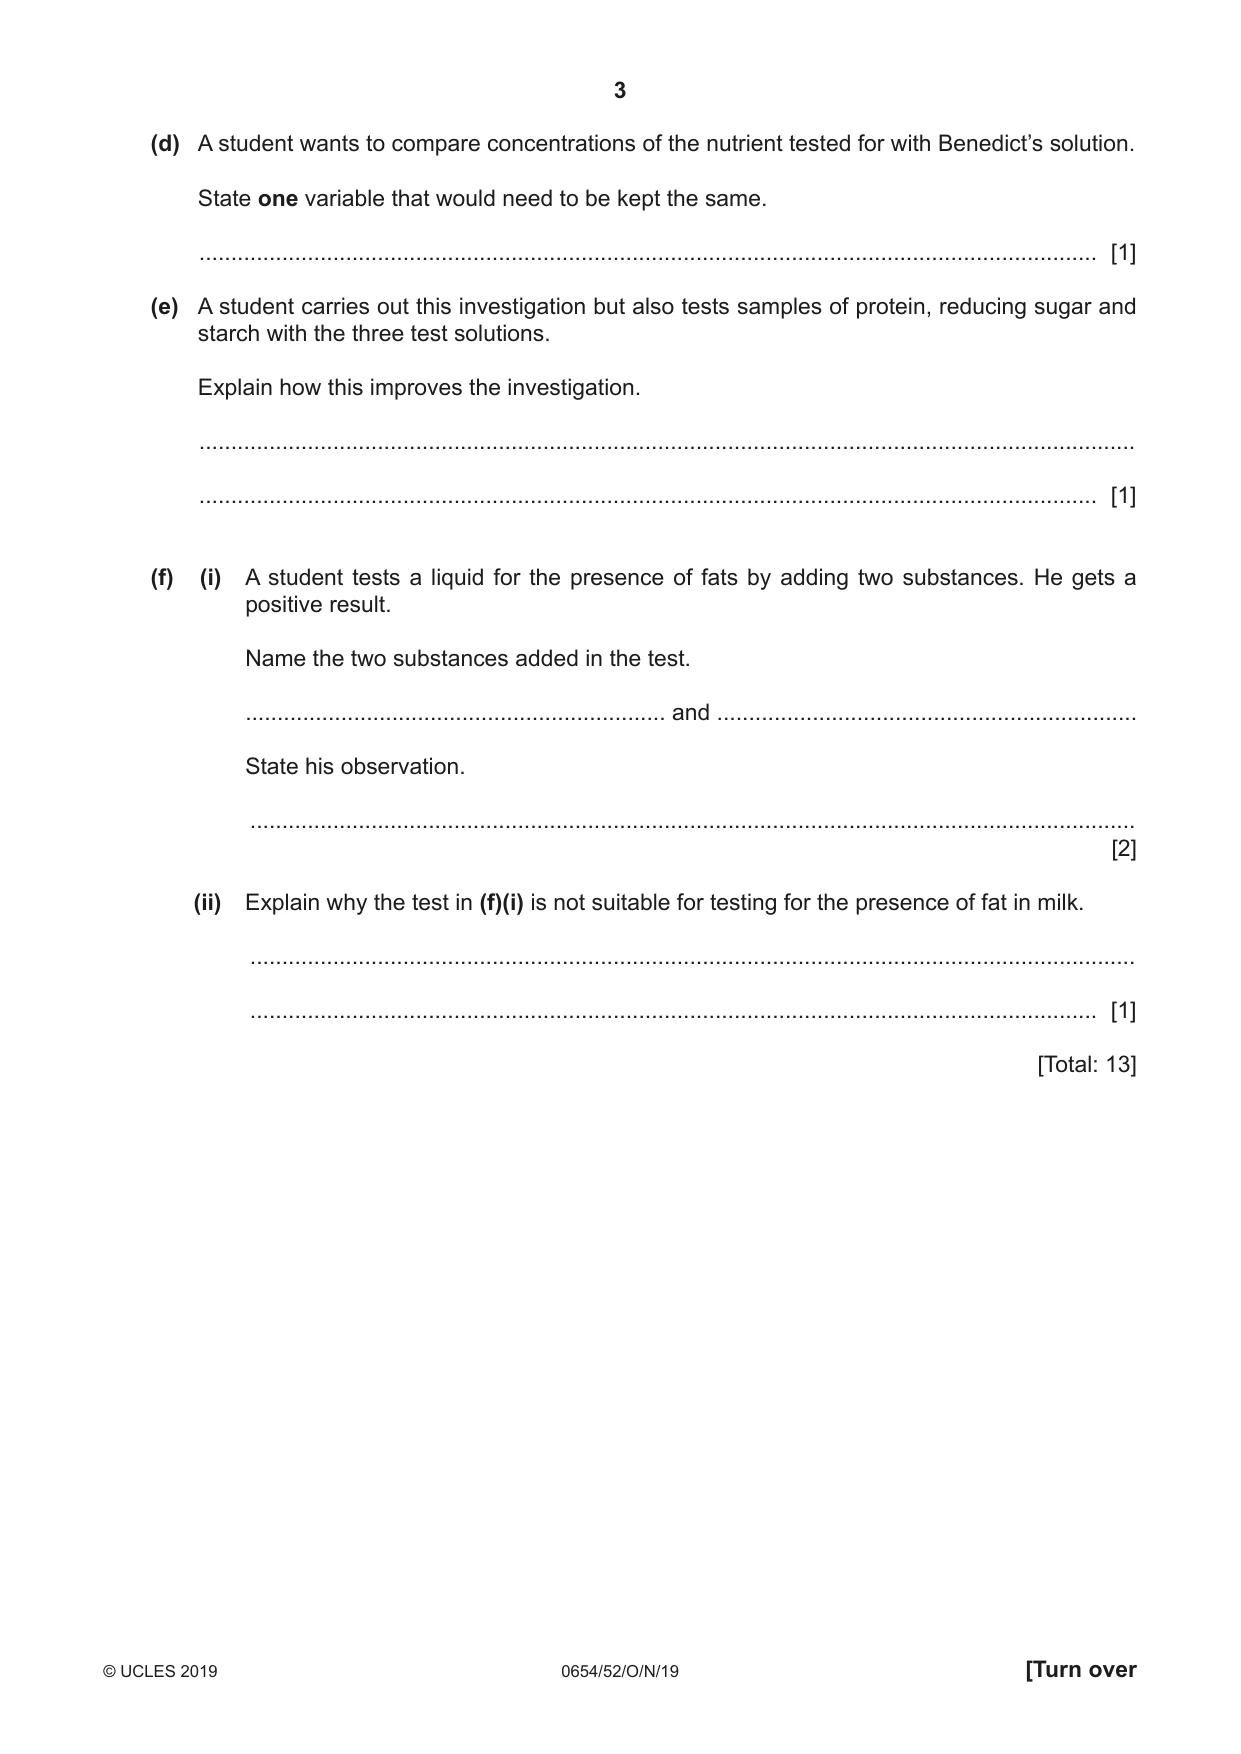
1 You are going to investigate the nutrient content of yogurt and rice water. You are provided with Benedict’s solution, biuret solution and iodine solution. Procedure 1. Add about 1 cm depth of yogurt to each of three test-tubes. 2. Add about 1 cm depth of Benedict’s solution to one test-tube and place in a hot water bath for at least 3 minutes. You may carry out step 3 and step 4 while you are waiting. 3. Add about 1 cm depth of biuret solution into the second test-tube. 4. Add a few drops of iodine solution to the final test-tube. 5. Using clean test-tubes repeat steps 1 – 4 with rice water instead of yogurt. (a) Record in Table 1.1 your observations of the final colour observed in each test-tube. Table 1.1 observation with observation with observation with food sample Benedict’s solution biuret solution iodine solution yogurt rice water [4] (b) State the nutrients present in each food sample. Use your observations in Table 1.1. yogurt contains ......................................................................................................................... rice water contains .................................................................................................................... [3] (c) State and explain a safety precaution you used when carrying out the tests. safety precaution ...................................................................................................................... explanation ............................................................................................................................... [1] (d) A student wants to compare concentrations of the nutrient tested for with Benedict’s solution. State one variable that would need to be kept the same. ............................................................................................................................................. [1] (e) A student carries out this investigation but also tests samples of protein, reducing sugar and starch with the three test solutions. Explain how this improves the investigation. ................................................................................................................................................... ............................................................................................................................................. [1] (f) (i) A student tests a liquid for the presence of fats by adding two substances. He gets a positive result. Name the two substances added in the test. .................................................................. and .................................................................. State his observation. ........................................................................................................................................... [2] (ii) Explain why the test in (f)(i) is not suitable for testing for the presence of fat in milk. ........................................................................................................................................... ..................................................................................................................................... [1] [Total: 13]
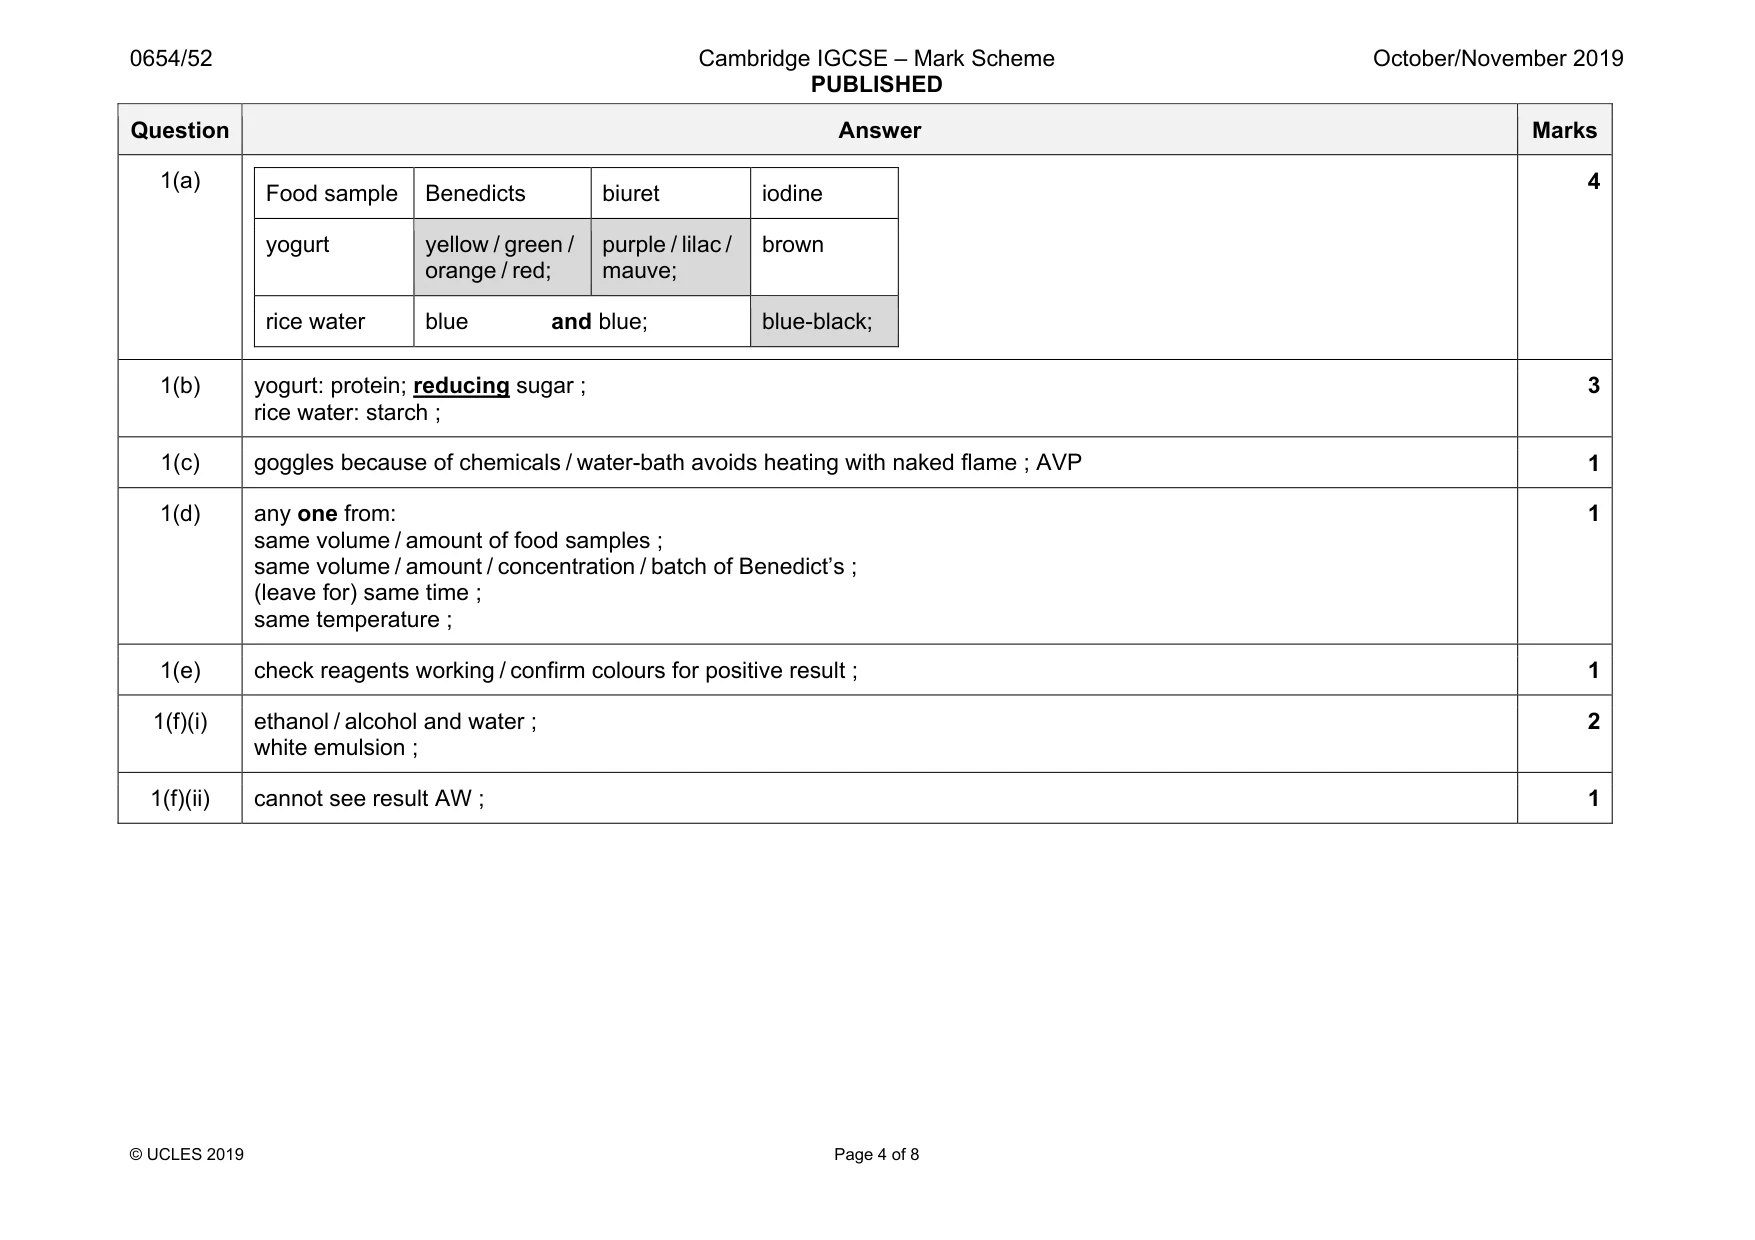
Mark scheme: 1(a) Food sample Benedicts biuret iodine yogurt yellow / green / orange / red; purple / lilac / mauve; brown rice water blue and blue; blue-black; 4 1(b) yogurt: protein; reducing sugar ; rice water: starch ; 3 1(c) goggles because of chemicals / water-bath avoids heating with naked flame ; AVP 1 1(d) any one from: same volume / amount of food samples ; same volume / amount / concentration / batch of Benedict’s ; (leave for) same time ; same temperature ; 1 1(e) check reagents working / confirm colours for positive result ; 1 1(f)(i) ethanol / alcohol and water ; white emulsion ; 2 1(f)(ii) cannot see result AW ; 1
Q2 · You are provided with half a tomato
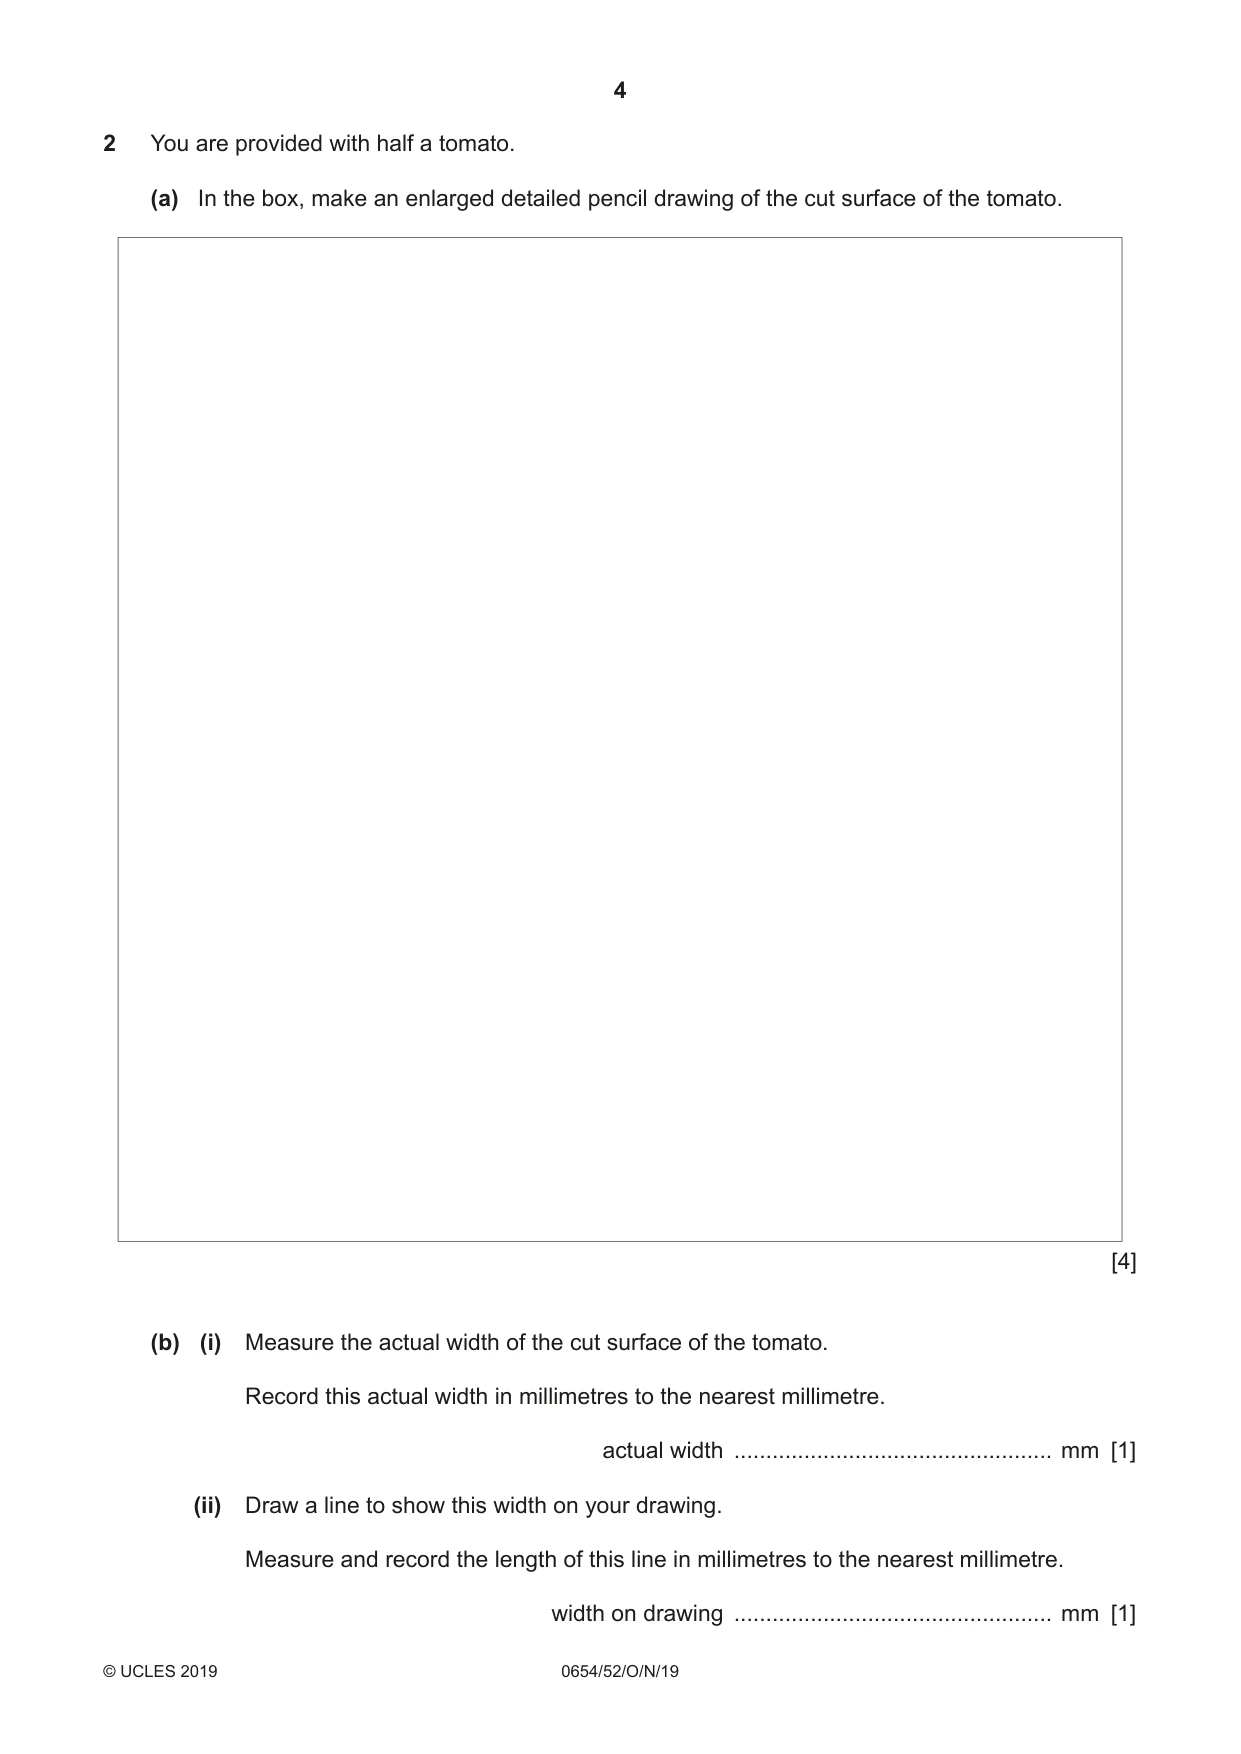
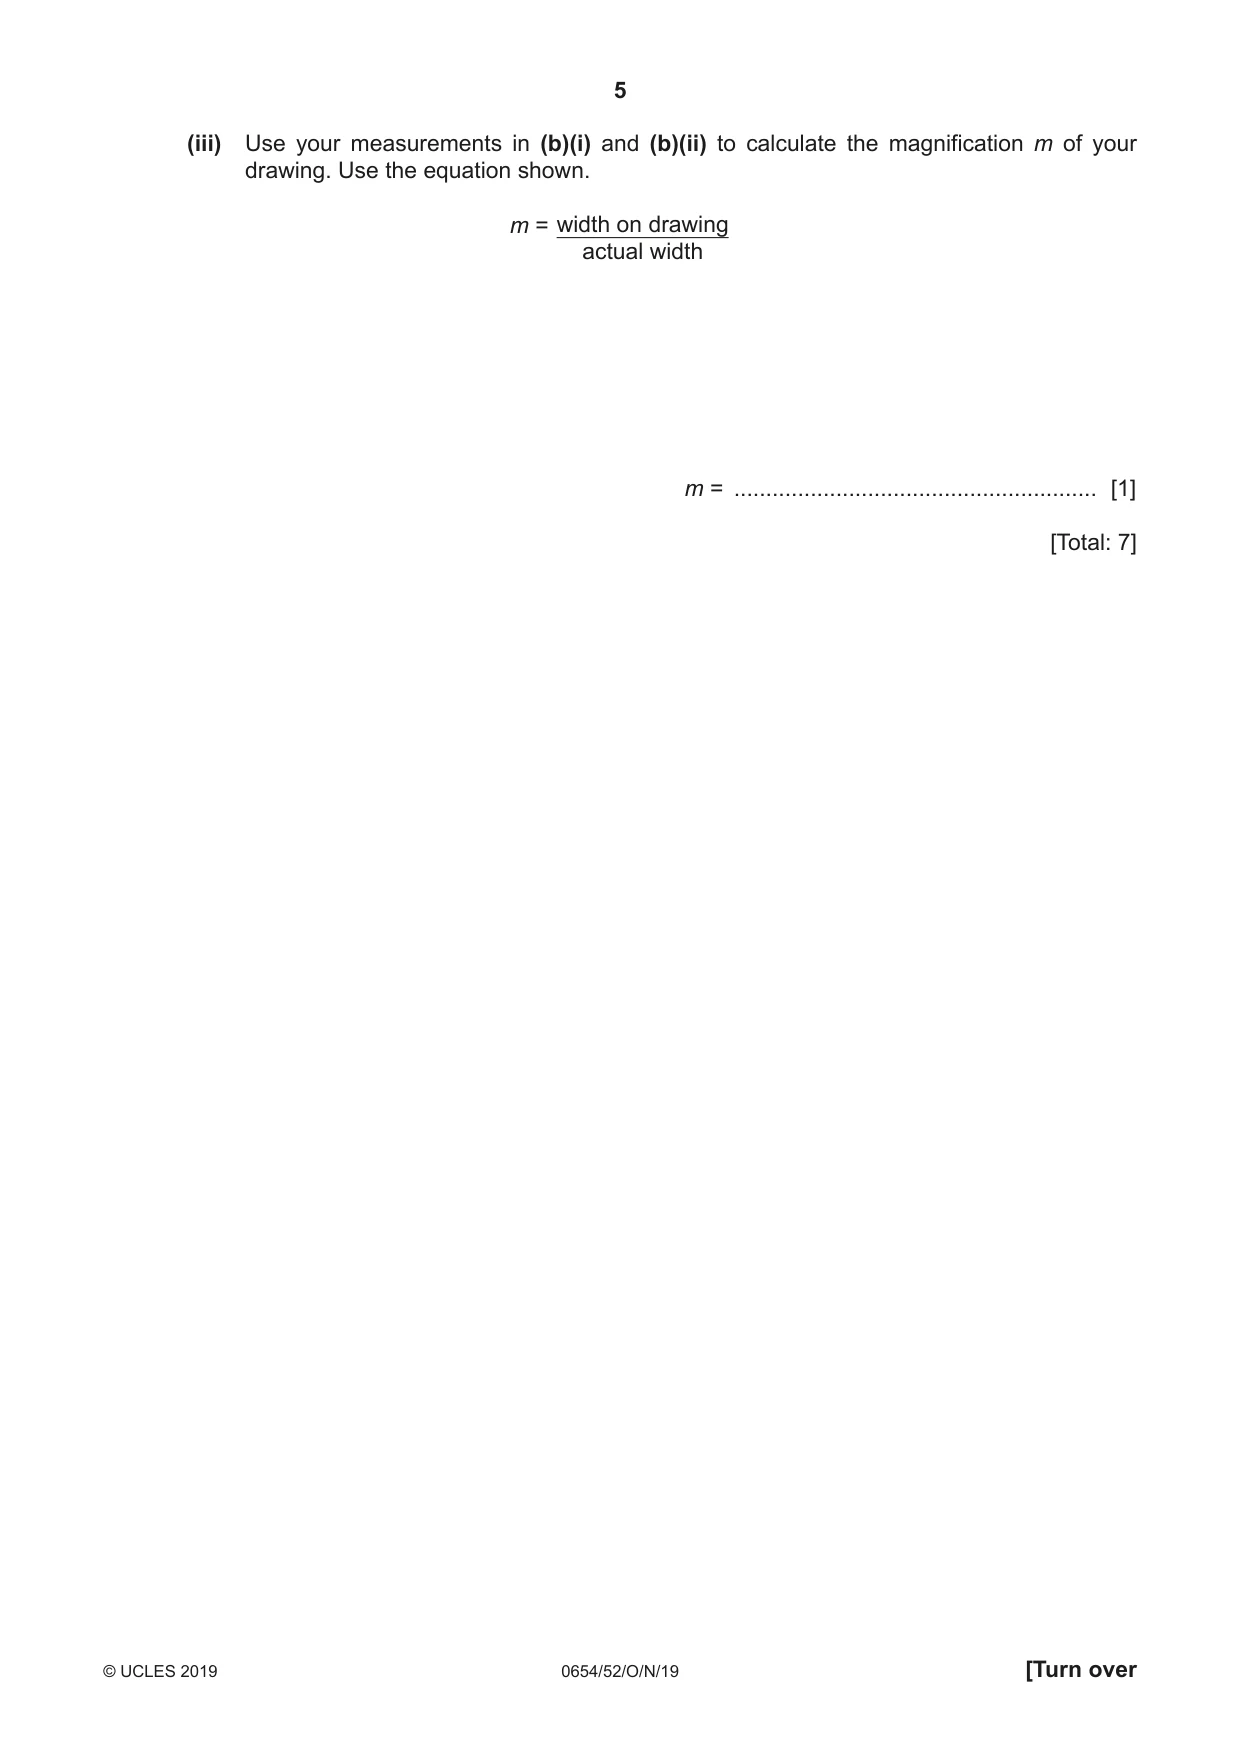
2 You are provided with half a tomato. (a) In the box, make an enlarged detailed pencil drawing of the cut surface of the tomato. [4] (b) (i) Measure the actual width of the cut surface of the tomato. Record this actual width in millimetres to the nearest millimetre. actual width .................................................. mm [1] (ii) Draw a line to show this width on your drawing. Measure and record the length of this line in millimetres to the nearest millimetre. width on drawing .................................................. mm [1] (iii) Use your measurements in (b)(i) and (b)(ii) to calculate the magnification m of your drawing. Use the equation shown. m = width on drawing actual width m = ......................................................... [1] [Total: 7]
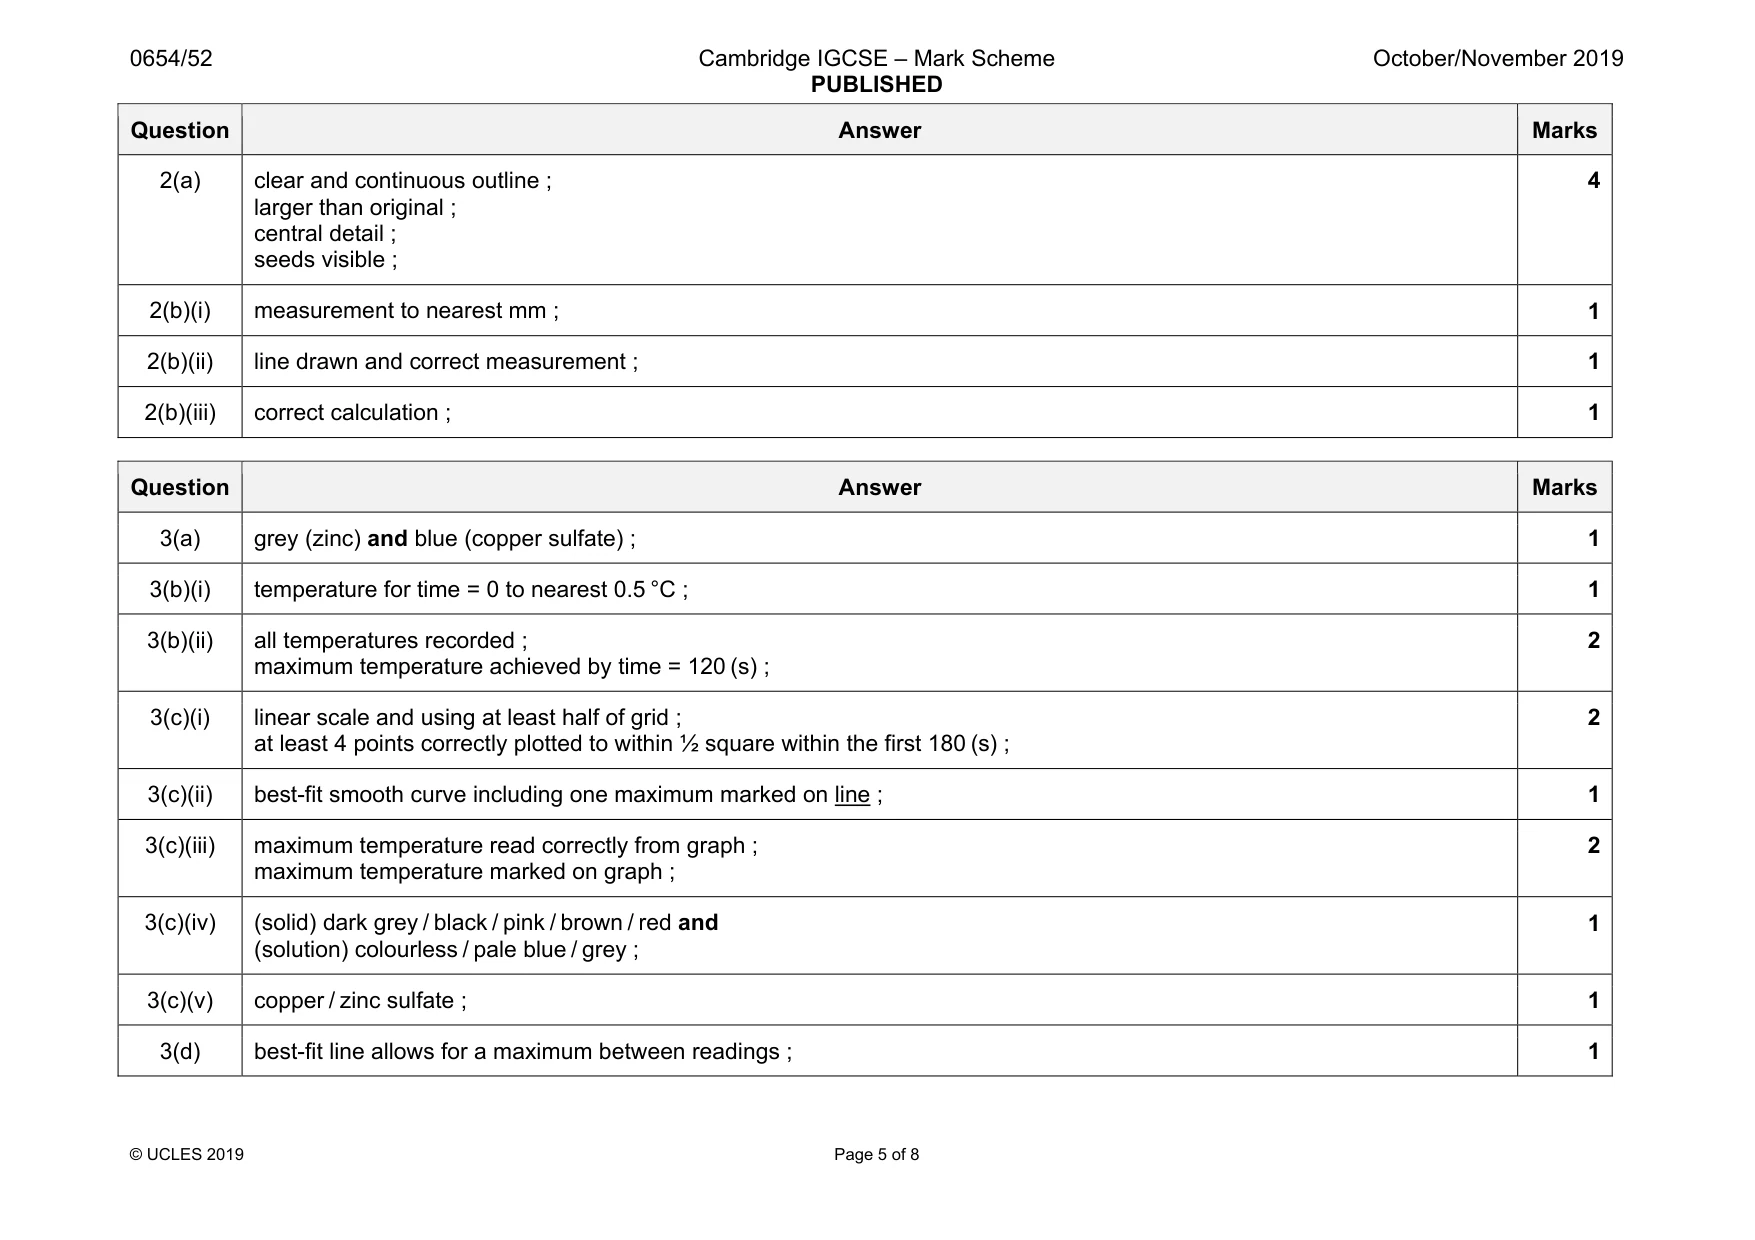
Mark scheme: 2(a) clear and continuous outline ; larger than original ; central detail ; seeds visible ; 4 2(b)(i) measurement to nearest mm ; 1 2(b)(ii) line drawn and correct measurement ; 1 2(b)(iii) correct calculation ; 1
Q3 · You are going to investigate the reaction between zinc powder and copper sulfate solution
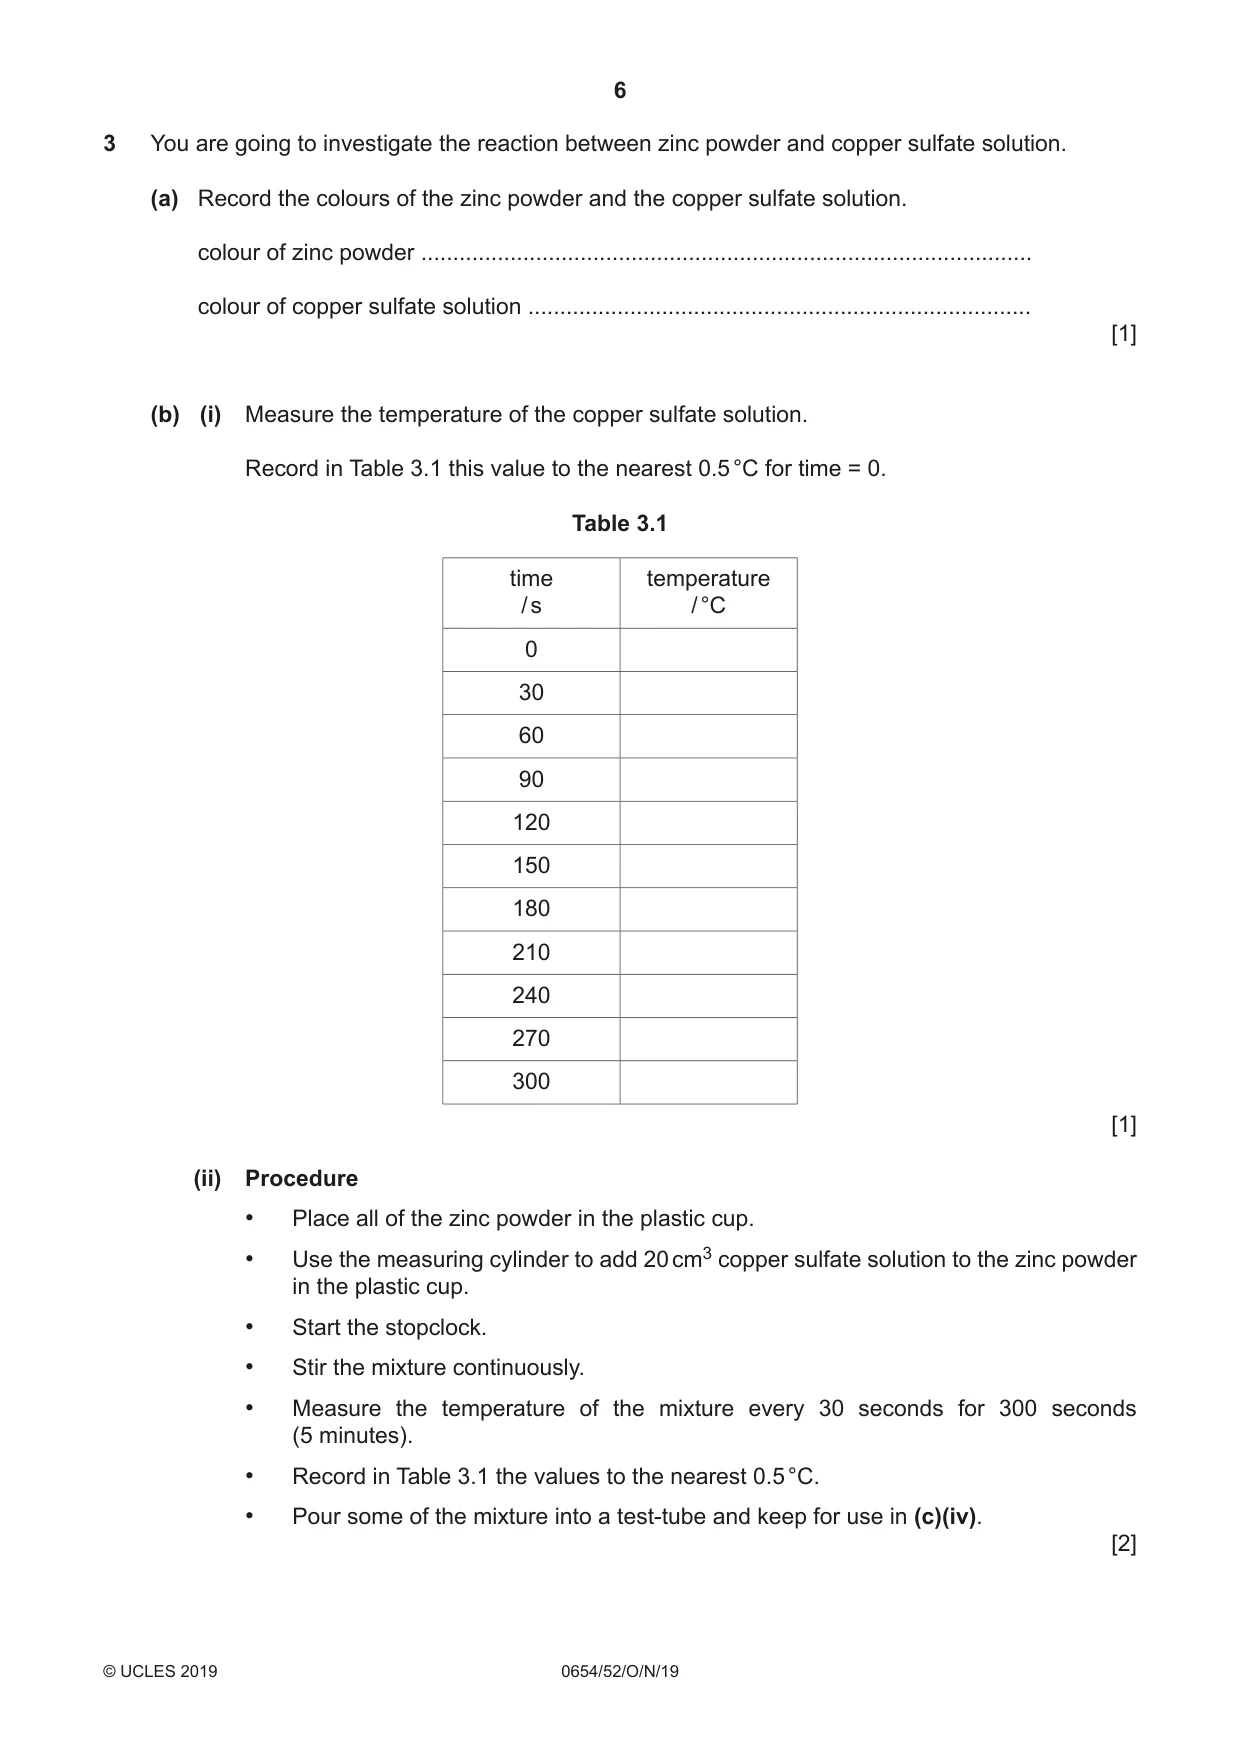
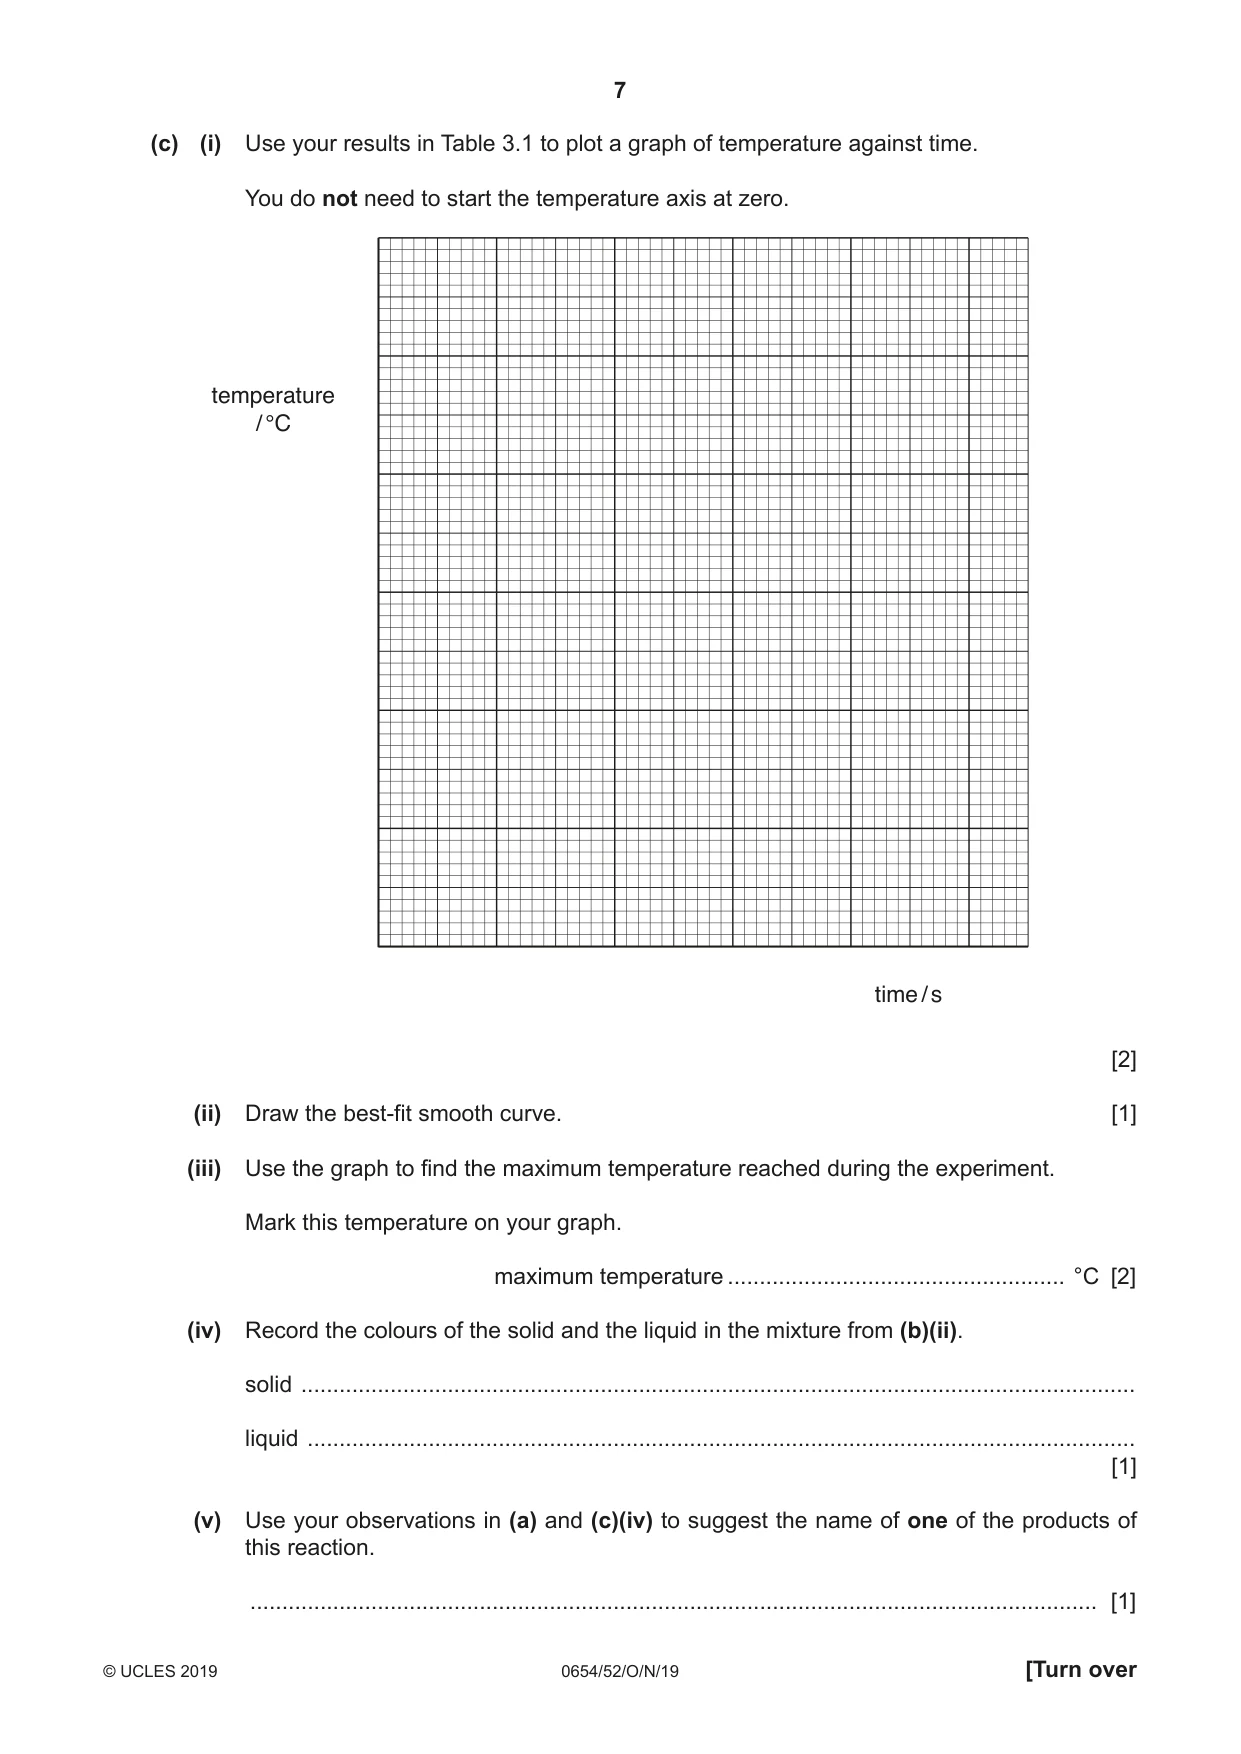
3 You are going to investigate the reaction between zinc powder and copper sulfate solution. (a) Record the colours of the zinc powder and the copper sulfate solution. colour of zinc powder ................................................................................................ colour of copper sulfate solution ............................................................................... [1] (b) (i) Measure the temperature of the copper sulfate solution. Record in Table 3.1 this value to the nearest 0.5 °C for time = 0. Table 3.1 time temperature / s / °C 0 30 60 90 120 150 180 210 240 270 300 [1] (ii) Procedure • Place all of the zinc powder in the plastic cup. • Use the measuring cylinder to add 20 cm3 copper sulfate solution to the zinc powder in the plastic cup. • Start the stopclock. • Stir the mixture continuously. • Measure the temperature of the mixture every 30 seconds for 300 seconds (5 minutes). • Record in Table 3.1 the values to the nearest 0.5 °C. • Pour some of the mixture into a test-tube and keep for use in (c)(iv). [2] (c) (i) Use your results in Table 3.1 to plot a graph of temperature against time. You do not need to start the temperature axis at zero. temperature / °C time / s [2] (ii) Draw the best-fit smooth curve. [1] (iii) Use the graph to find the maximum temperature reached during the experiment. Mark this temperature on your graph. maximum temperature ..................................................... °C [2] (iv) Record the colours of the solid and the liquid in the mixture from (b)(ii). solid ................................................................................................................................... liquid .................................................................................................................................. [1] (v) Use your observations in (a) and (c)(iv) to suggest the name of one of the products of this reaction. ..................................................................................................................................... [1] (d) Suggest why the maximum temperature in the experiment should be more accurate when read from the graph than from the results in Table 3.1. ................................................................................................................................................... ............................................................................................................................................. [1] [Total: 12]
Mark scheme: 3(a) grey (zinc) and blue (copper sulfate) ; 1 3(b)(i) temperature for time = 0 to nearest 0.5 °C ; 1 3(b)(ii) all temperatures recorded ; maximum temperature achieved by time = 120 (s) ; 2 3(c)(i) linear scale and using at least half of grid ; at least 4 points correctly plotted to within ½ square within the first 180 (s) ; 2 3(c)(ii) best-fit smooth curve including one maximum marked on line ; 1 3(c)(iii) maximum temperature read correctly from graph ; maximum temperature marked on graph ; 2 3(c)(iv) (solid) dark grey / black / pink / brown / red and (solution) colourless / pale blue / grey ; 1 3(c)(v) copper / zinc sulfate ; 1 3(d) best-fit line allows for a maximum between readings ; 1
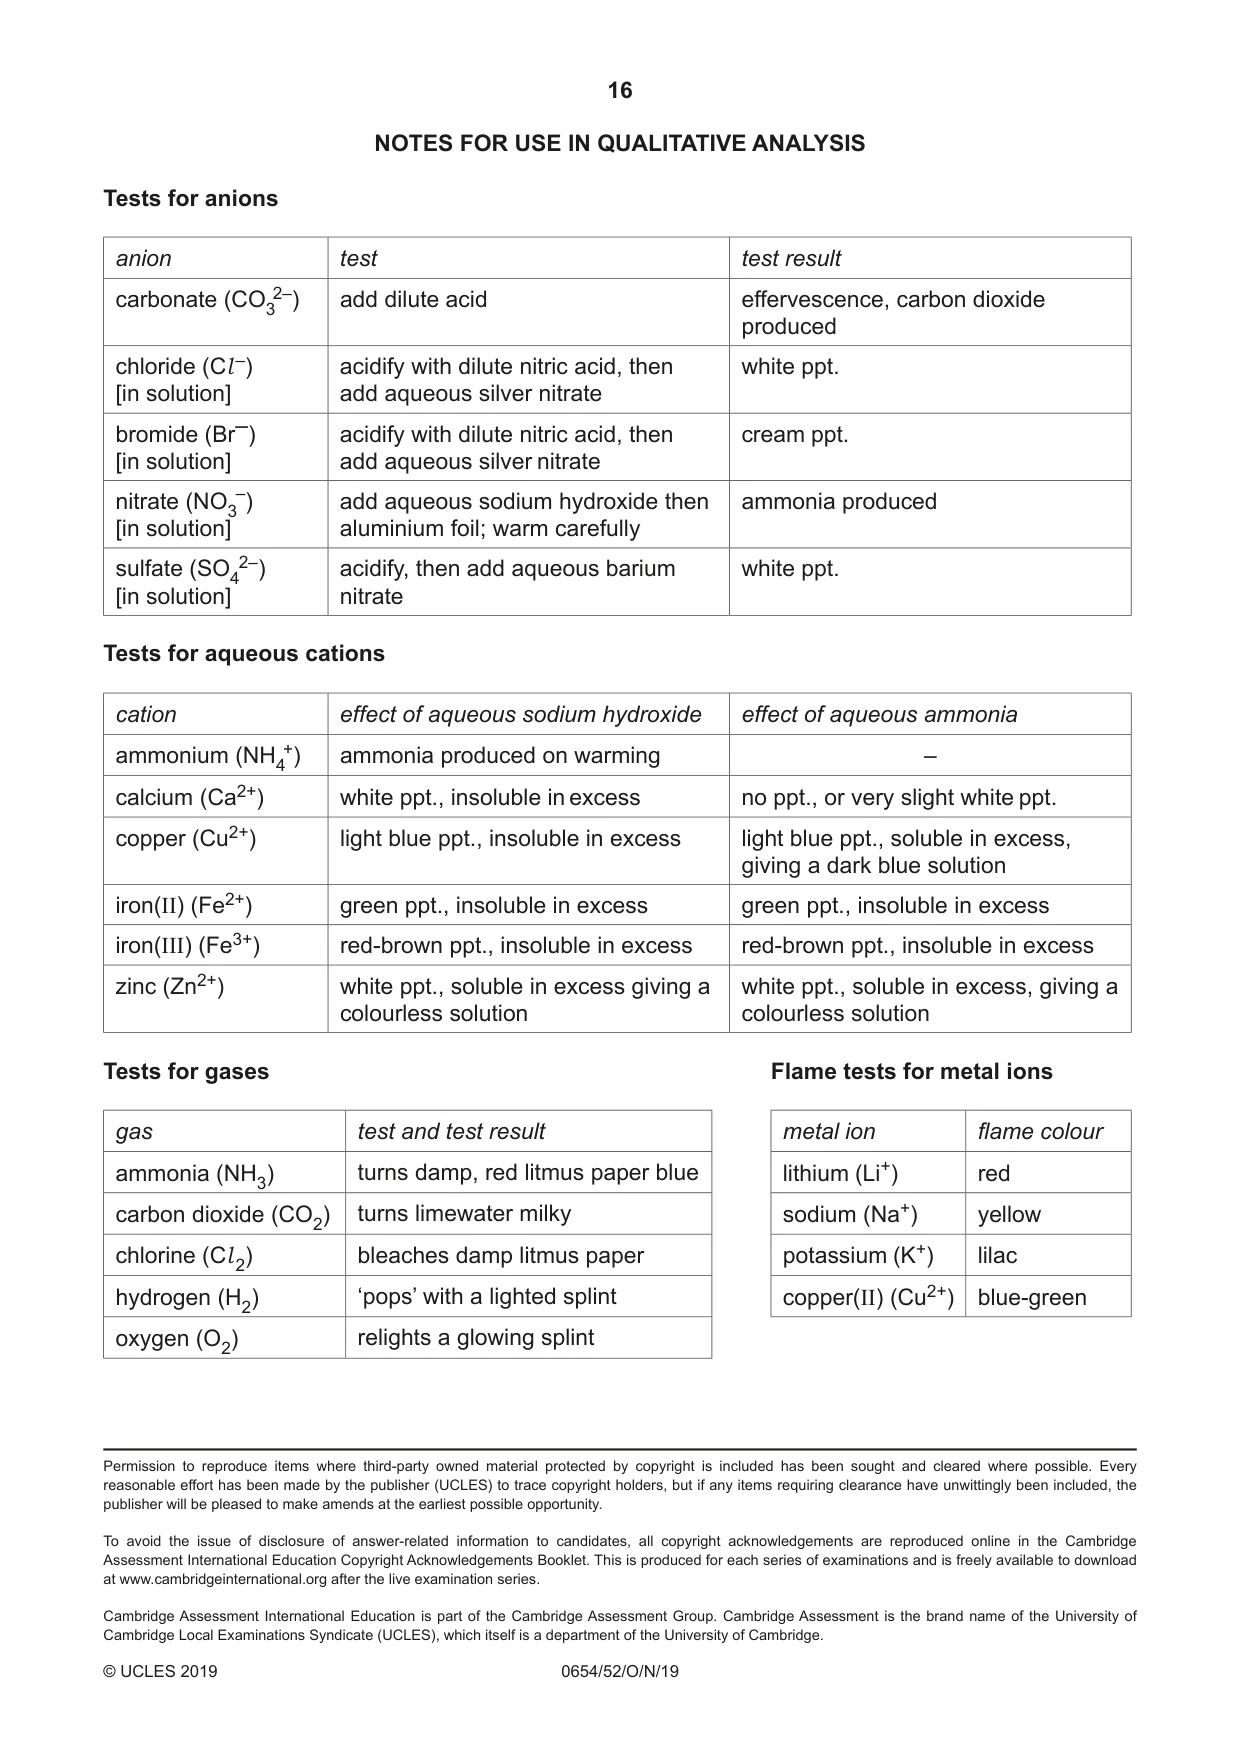
Q4 · Notes for use in Qualitative Analysis for this question are printed on page 16
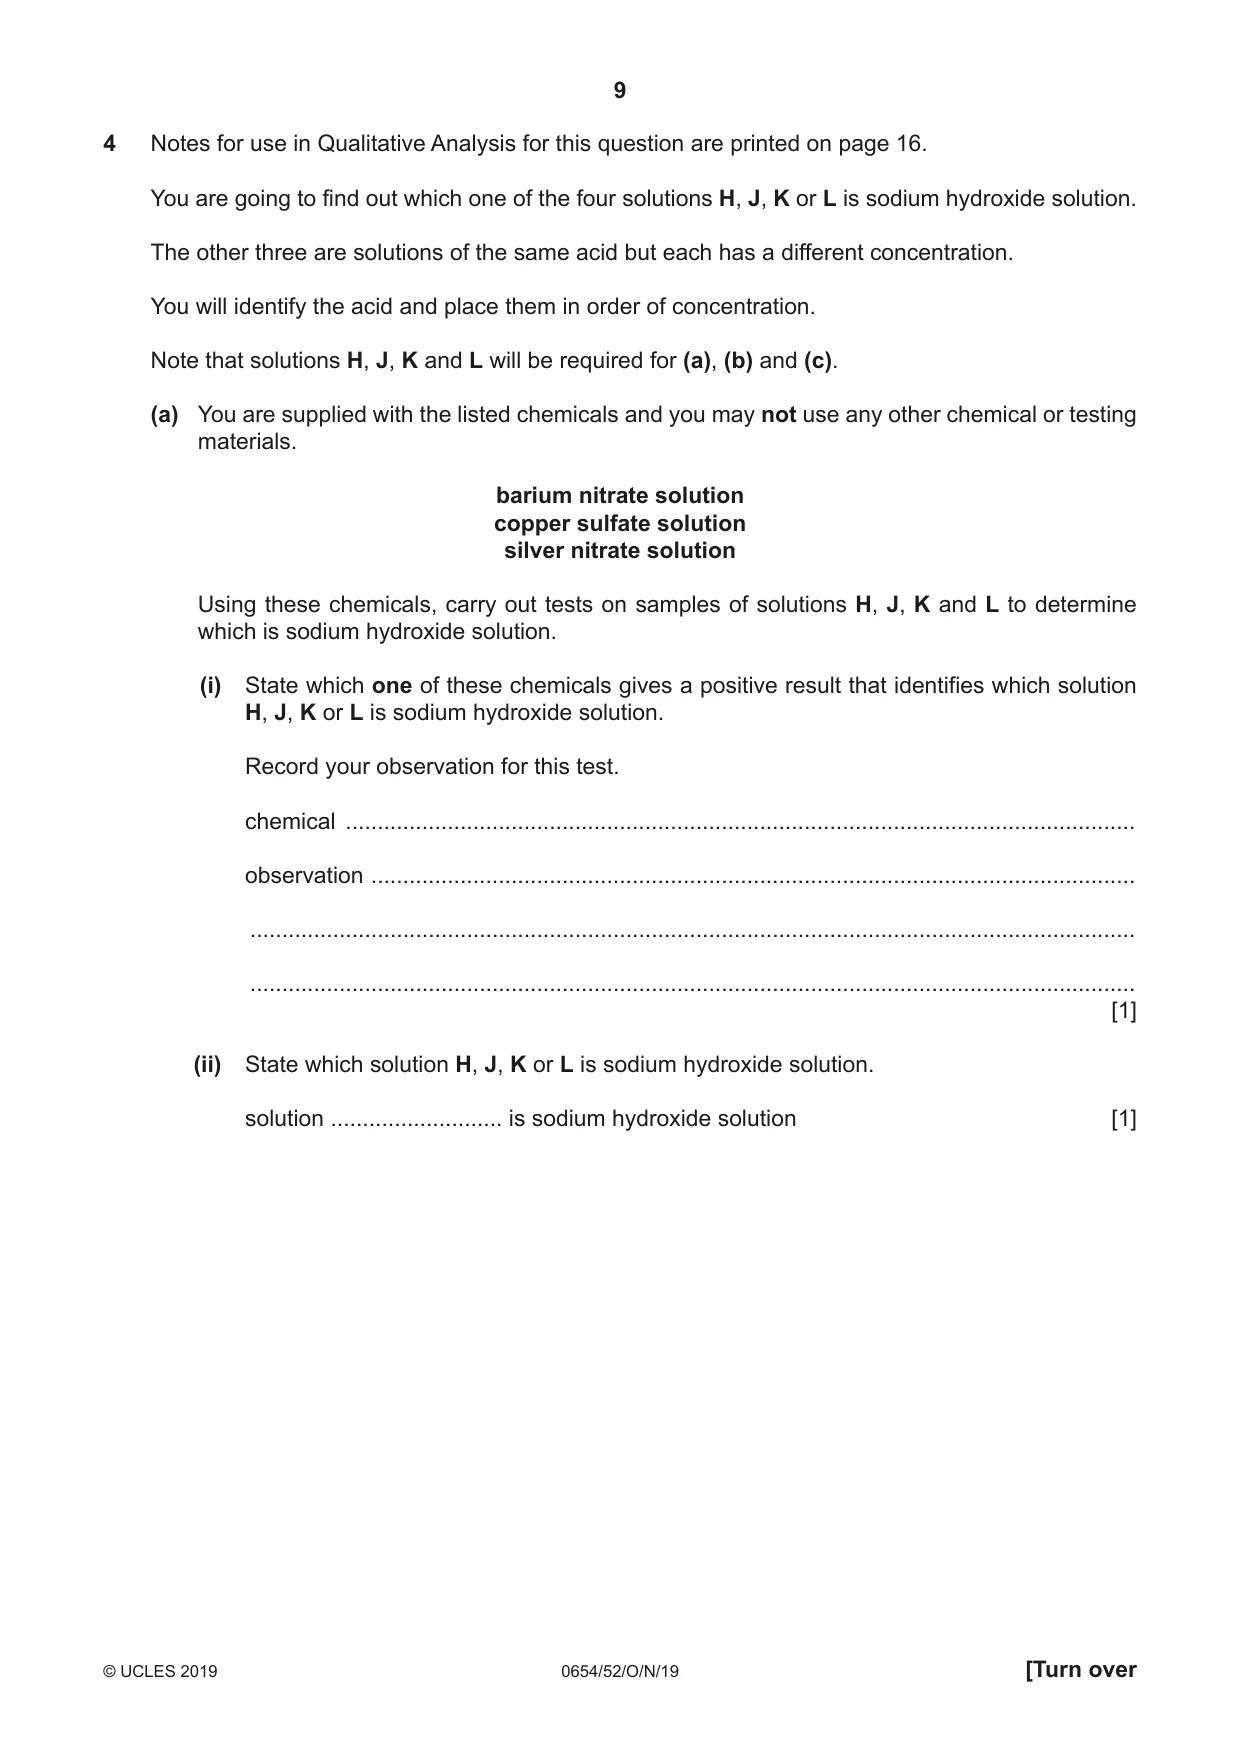
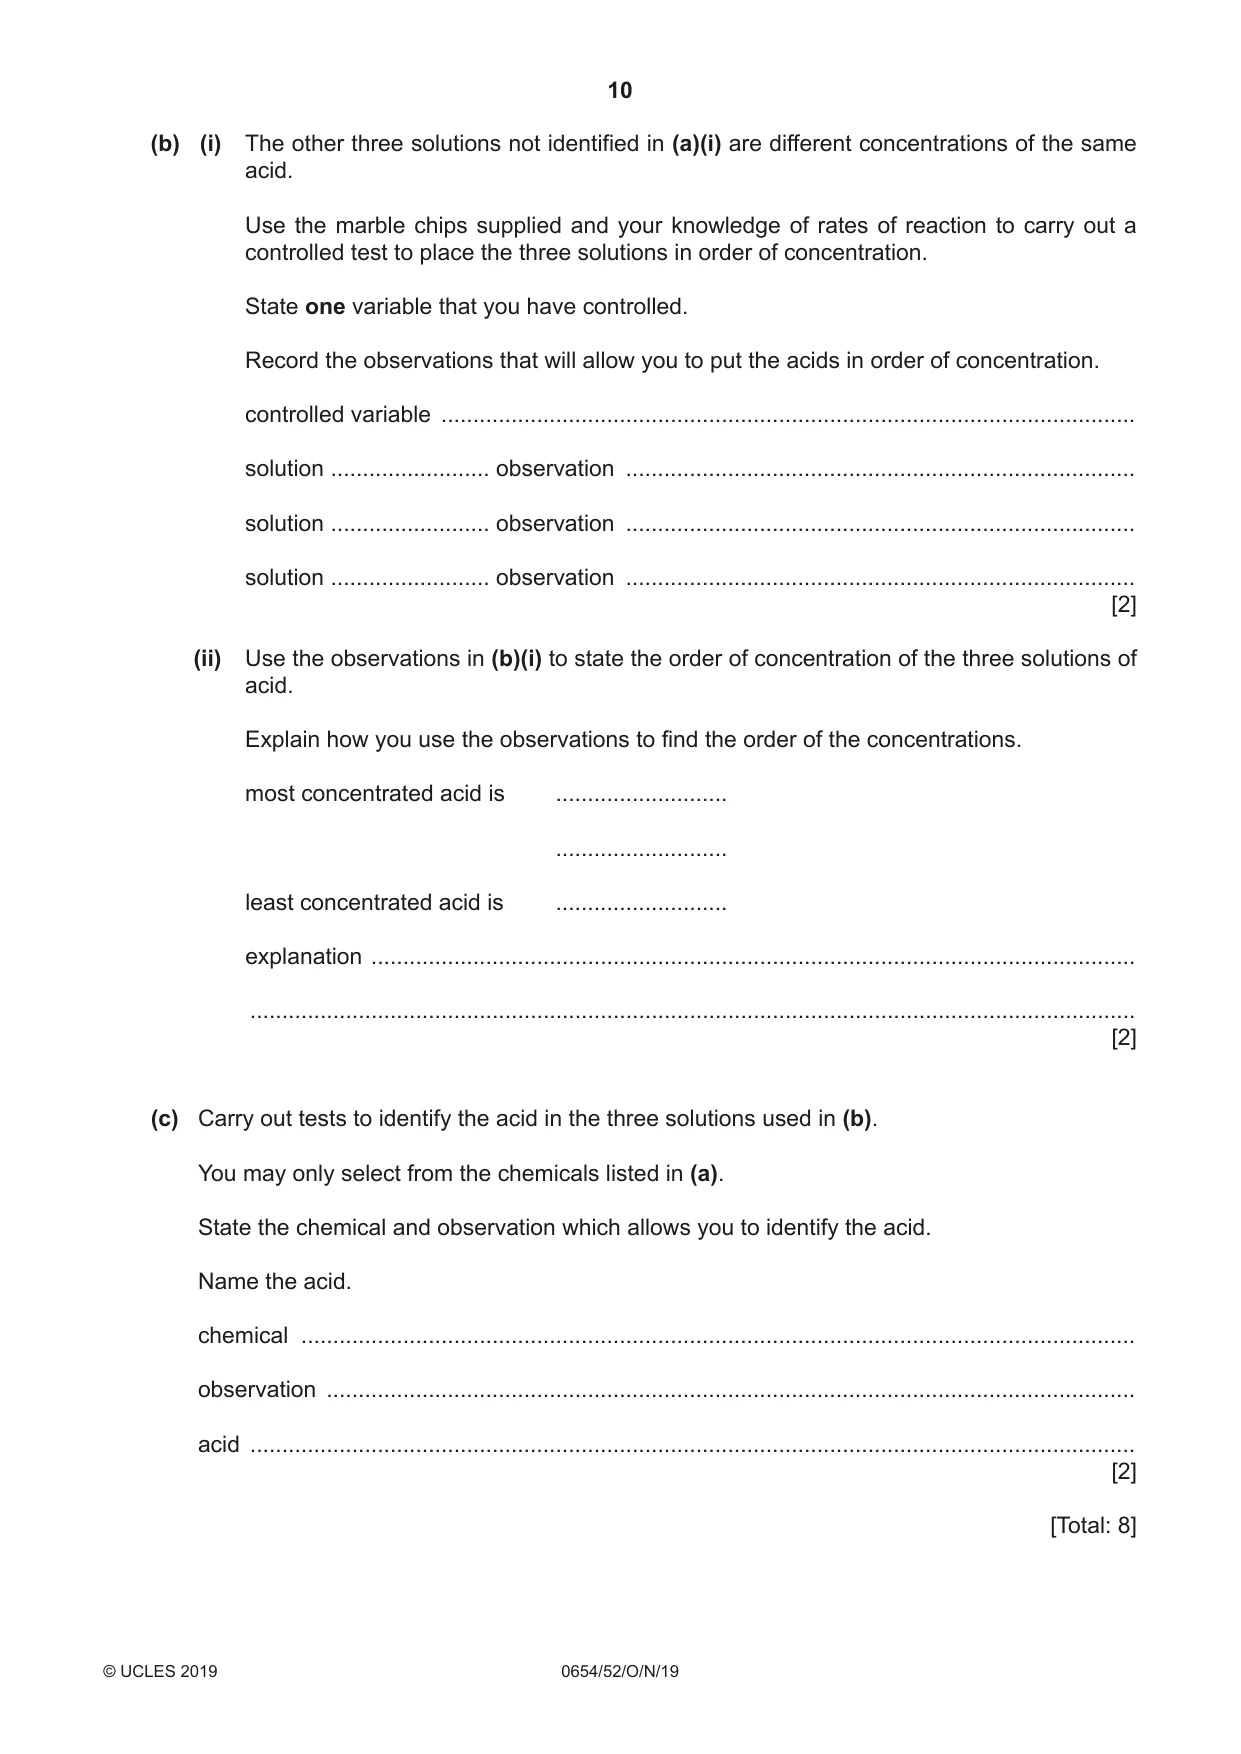
4 Notes for use in Qualitative Analysis for this question are printed on page 16. You are going to find out which one of the four solutions H, J, K or L is sodium hydroxide solution. The other three are solutions of the same acid but each has a different concentration. You will identify the acid and place them in order of concentration. Note that solutions H, J, K and L will be required for (a), (b) and (c). (a) You are supplied with the listed chemicals and you may not use any other chemical or testing materials. barium nitrate solution copper sulfate solution silver nitrate solution Using these chemicals, carry out tests on samples of solutions H, J, K and L to determine which is sodium hydroxide solution. (i) State which one of these chemicals gives a positive result that identifies which solution H, J, K or L is sodium hydroxide solution. Record your observation for this test. chemical ............................................................................................................................ observation ........................................................................................................................ ........................................................................................................................................... ........................................................................................................................................... [1] (ii) State which solution H, J, K or L is sodium hydroxide solution. solution ........................... is sodium hydroxide solution [1] (b) (i) The other three solutions not identified in (a)(i) are different concentrations of the same acid. Use the marble chips supplied and your knowledge of rates of reaction to carry out a controlled test to place the three solutions in order of concentration. State one variable that you have controlled. Record the observations that will allow you to put the acids in order of concentration. controlled variable ............................................................................................................. solution ......................... observation ................................................................................ solution ......................... observation ................................................................................ solution ......................... observation ................................................................................ [2] (ii) Use the observations in (b)(i) to state the order of concentration of the three solutions of acid. Explain how you use the observations to find the order of the concentrations. most concentrated acid is ........................... ........................... least concentrated acid is ........................... explanation ........................................................................................................................ ........................................................................................................................................... [2] (c) Carry out tests to identify the acid in the three solutions used in (b). You may only select from the chemicals listed in (a). State the chemical and observation which allows you to identify the acid. Name the acid. chemical ................................................................................................................................... observation ............................................................................................................................... acid ........................................................................................................................................... [2] [Total: 8]
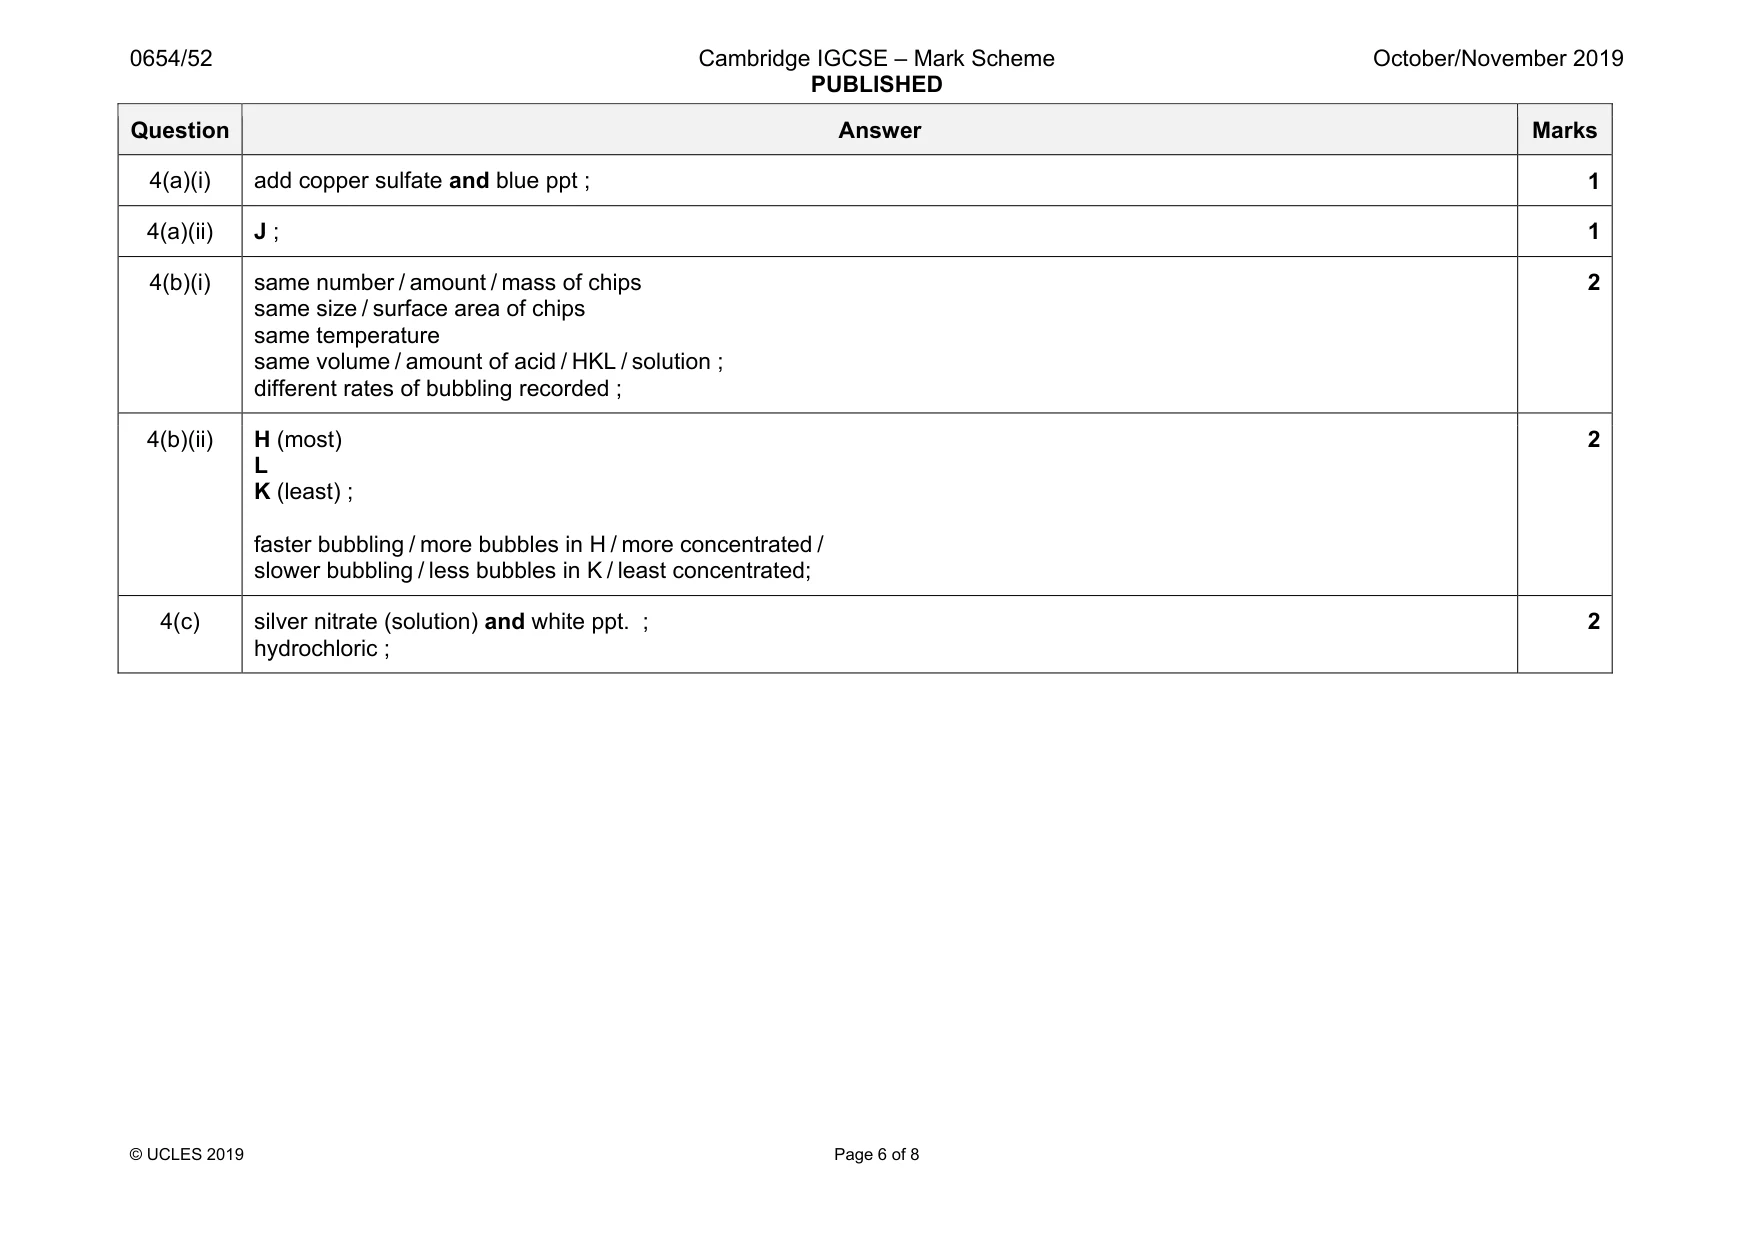
Mark scheme: 4(a)(i) add copper sulfate and blue ppt ; 1 4(a)(ii) J ; 1 4(b)(i) same number / amount / mass of chips same size / surface area of chips same temperature same volume / amount of acid / HKL / solution ; different rates of bubbling recorded ; 2 4(b)(ii) H (most) L K (least) ; faster bubbling / more bubbles in H / more concentrated / slower bubbling / less bubbles in K / least concentrated; 2 4(c) silver nitrate (solution) and white ppt. ; hydrochloric ; 2
Q5 · You are going to determine an approximate value for the specific heat capacity of glass
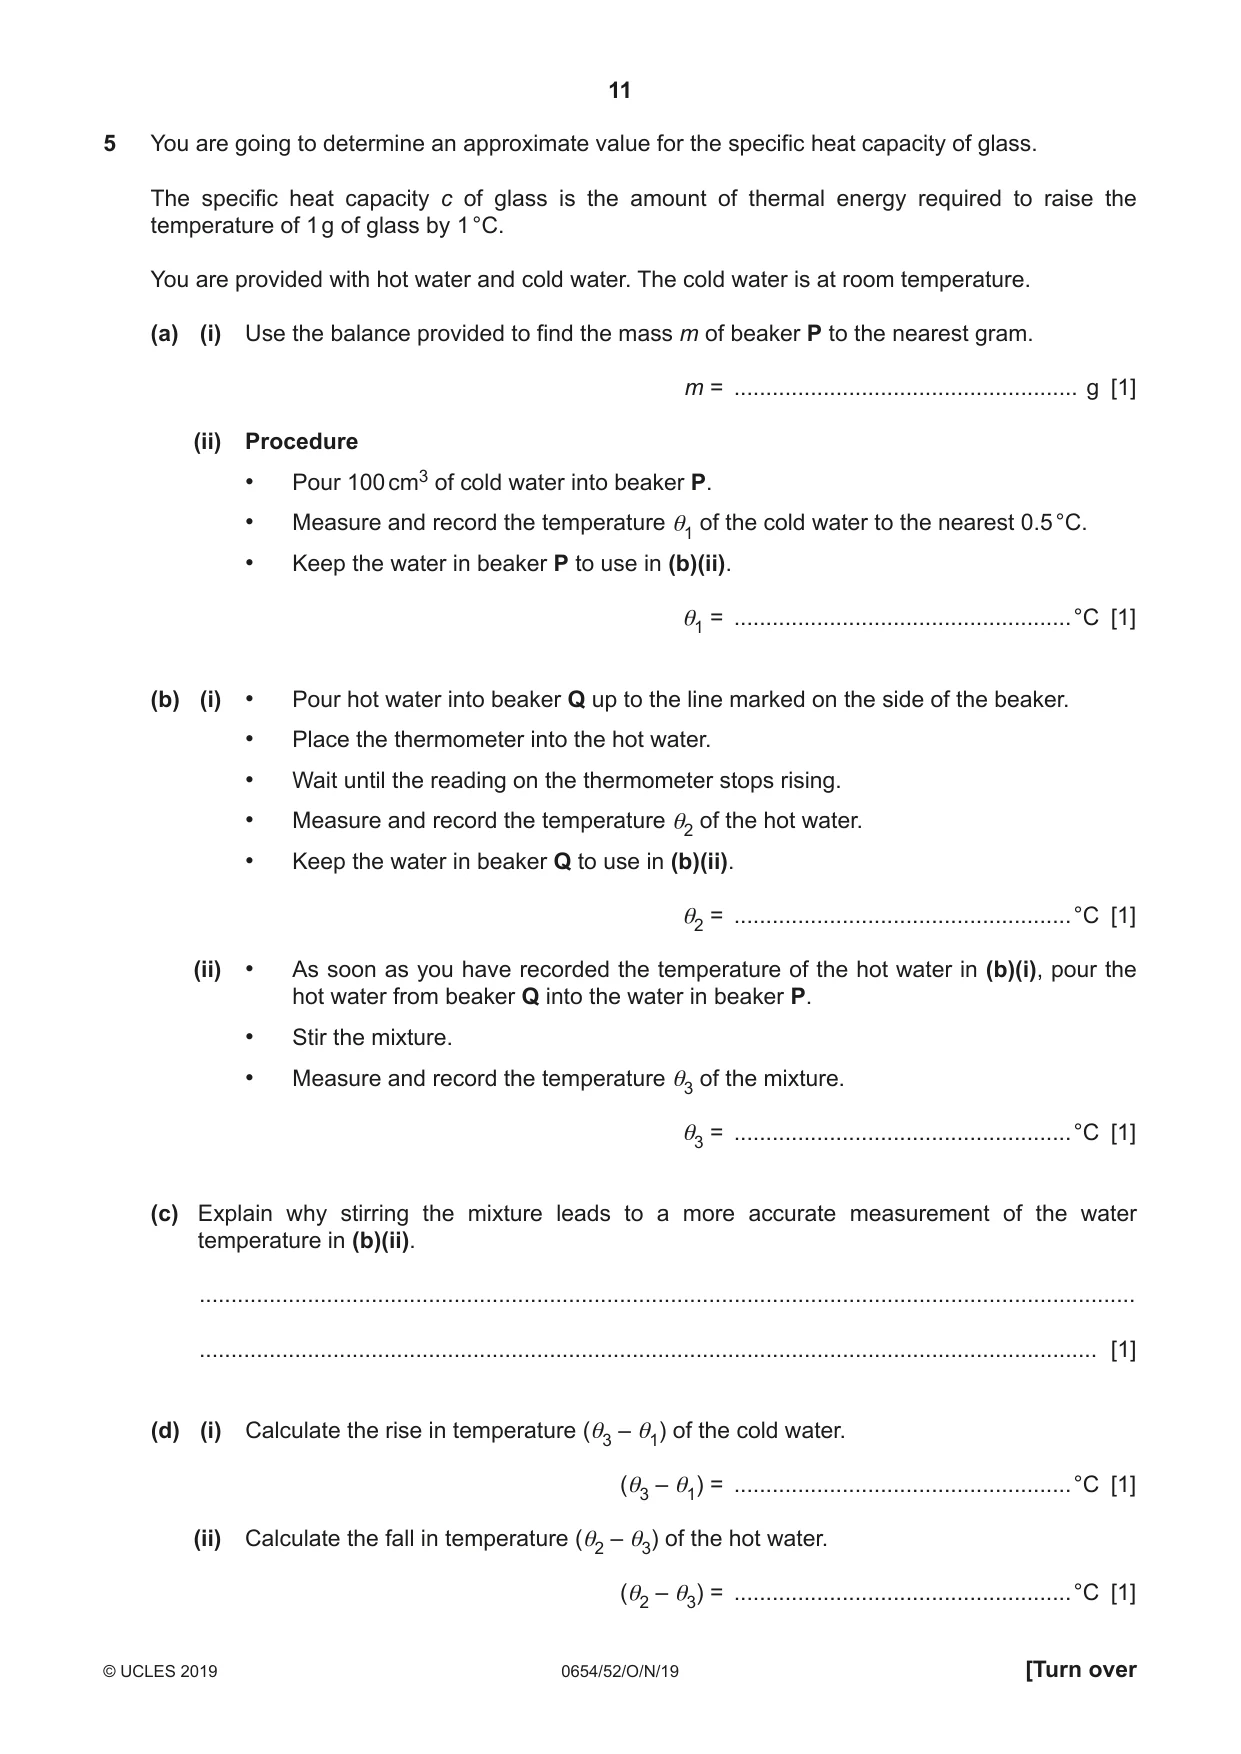
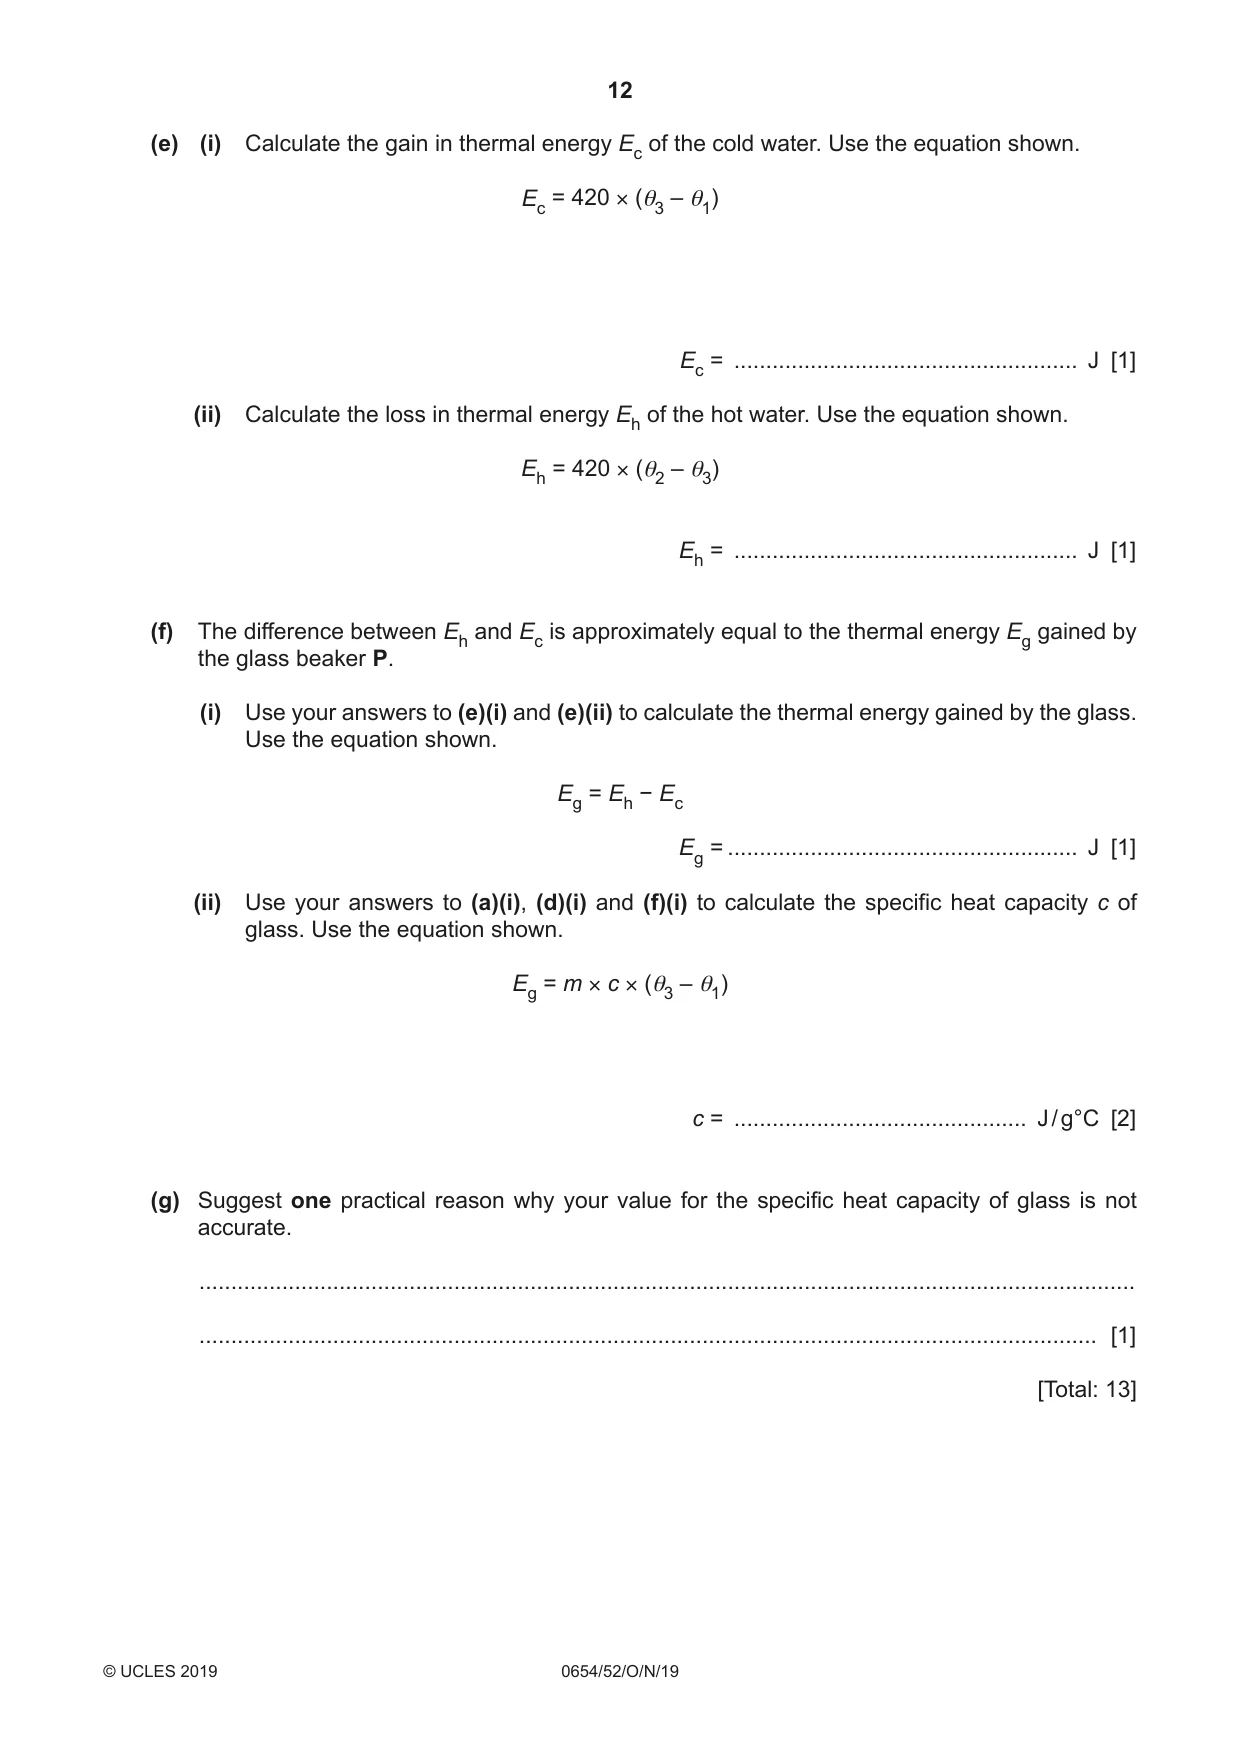
5 You are going to determine an approximate value for the specific heat capacity of glass. The specific heat capacity c of glass is the amount of thermal energy required to raise the temperature of 1 g of glass by 1 °C. You are provided with hot water and cold water. The cold water is at room temperature. (a) (i) Use the balance provided to find the mass m of beaker P to the nearest gram. m = ...................................................... g [1] (ii) Procedure • Pour 100 cm3 of cold water into beaker P. • Measure and record the temperature θ1 of the cold water to the nearest 0.5 °C. • Keep the water in beaker P to use in (b)(ii). θ1 = .....................................................°C [1] (b) (i) • Pour hot water into beaker Q up to the line marked on the side of the beaker. • Place the thermometer into the hot water. • Wait until the reading on the thermometer stops rising. • Measure and record the temperature θ2 of the hot water. • Keep the water in beaker Q to use in (b)(ii). θ2 = .....................................................°C [1] (ii) • As soon as you have recorded the temperature of the hot water in (b)(i), pour the hot water from beaker Q into the water in beaker P. • Stir the mixture. • Measure and record the temperature θ3 of the mixture. θ3 = .....................................................°C [1] (c) Explain why stirring the mixture leads to a more accurate measurement of the water temperature in (b)(ii). ................................................................................................................................................... ............................................................................................................................................. [1] (d) (i) Calculate the rise in temperature (θ3 – θ1) of the cold water. (θ3 – θ1) = .....................................................°C [1] (ii) Calculate the fall in temperature (θ2 – θ3) of the hot water. (θ2 – θ3) = .....................................................°C [1] (e) (i) Calculate the gain in thermal energy Ec of the cold water. Use the equation shown. Ec = 420 × (θ3 – θ1) Ec = ...................................................... J [1] (ii) Calculate the loss in thermal energy Eh of the hot water. Use the equation shown. Eh = 420 × (θ2 – θ3) Eh = ...................................................... J [1] (f) The difference between Eh and Ec is approximately equal to the thermal energy Eg gained by the glass beaker P. (i) Use your answers to (e)(i) and (e)(ii) to calculate the thermal energy gained by the glass. Use the equation shown. Eg = Eh − Ec Eg = ....................................................... J [1] (ii) Use your answers to (a)(i), (d)(i) and (f)(i) to calculate the specific heat capacity c of glass. Use the equation shown. Eg = m × c × (θ3 – θ1) c = .............................................. J / g°C [2] (g) Suggest one practical reason why your value for the specific heat capacity of glass is not accurate. ................................................................................................................................................... ............................................................................................................................................. [1] [Total: 13]
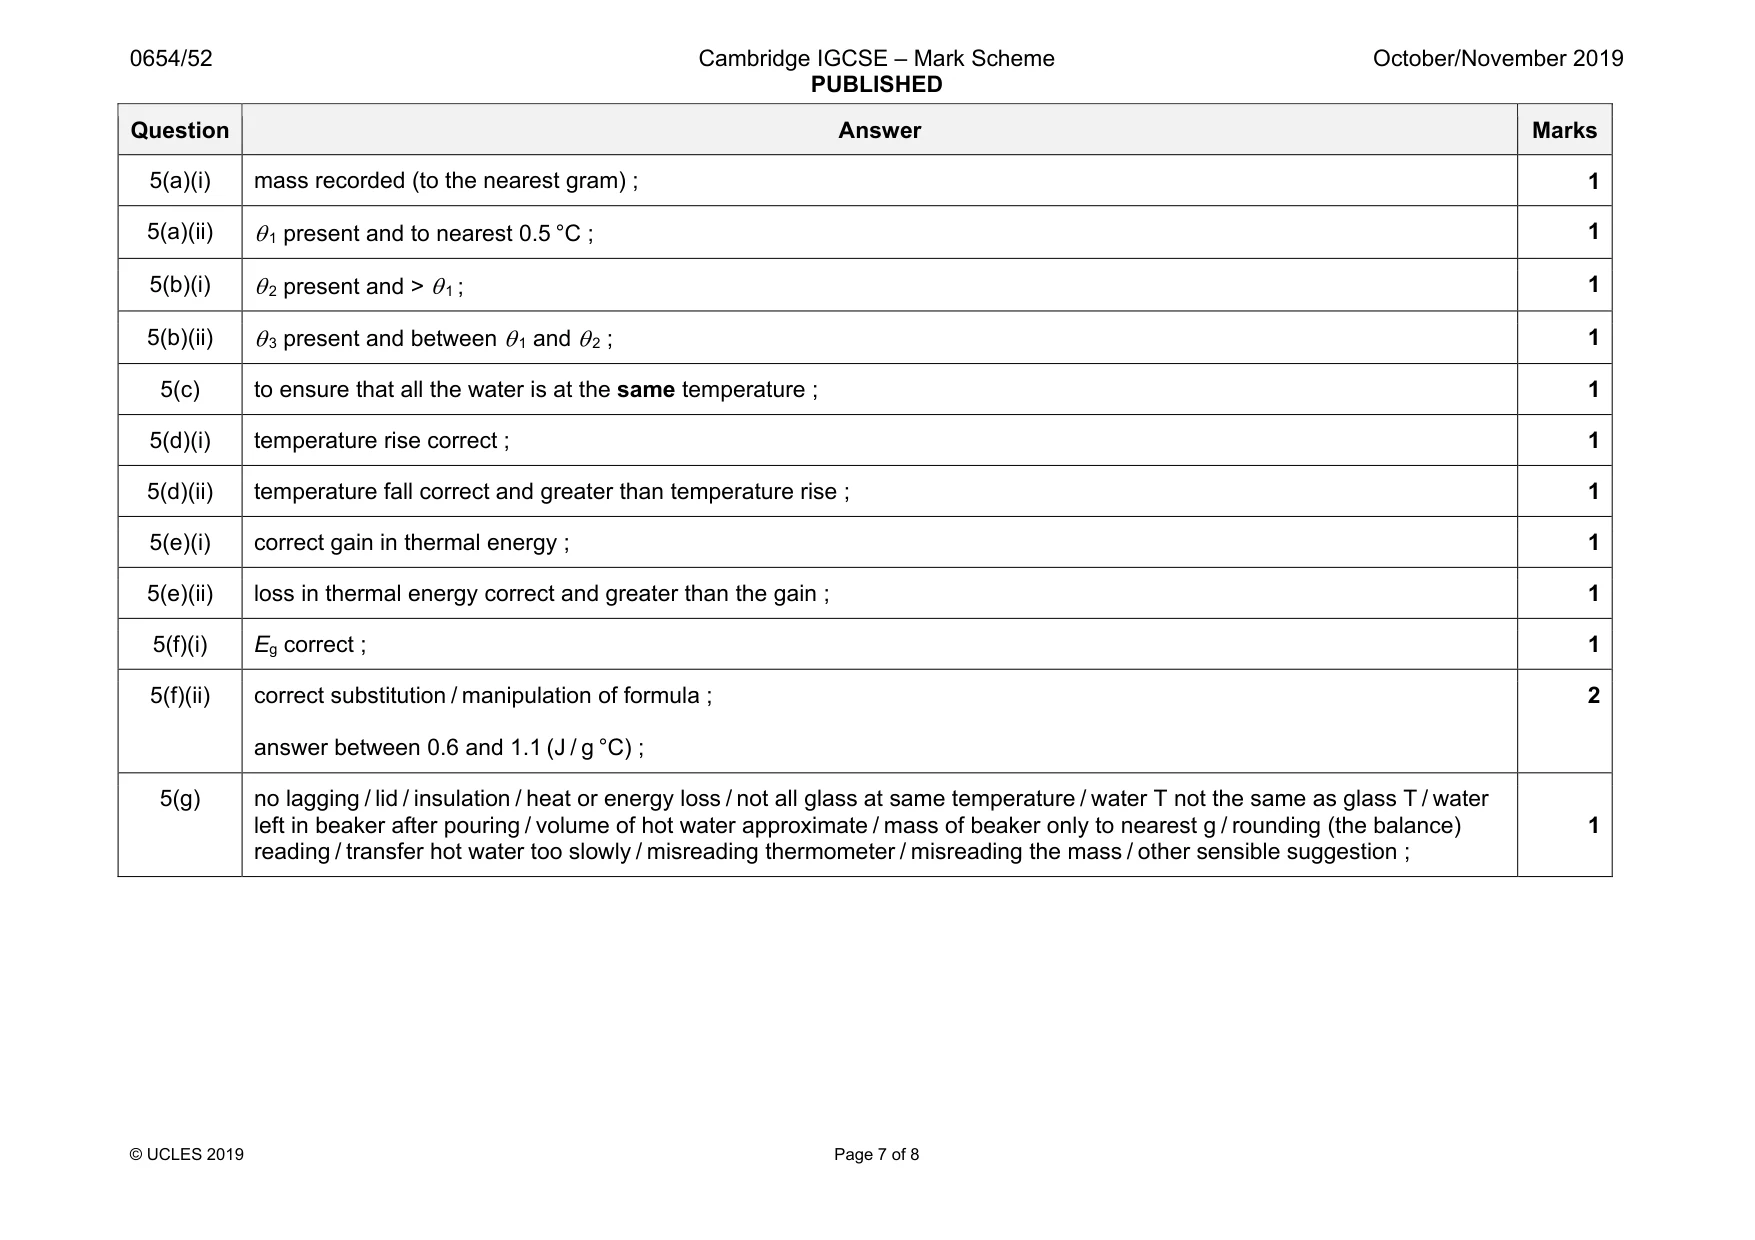
Mark scheme: 5(a)(i) mass recorded (to the nearest gram) ; 1 5(a)(ii) θ 1 present and to nearest 0.5 °C ; 1 5(b)(i) θ 2 present and > θ 1 ; 1 5(b)(ii) θ 3 present and between θ 1 and θ 2 ; 1 5(c) to ensure that all the water is at the same temperature ; 1 5(d)(i) temperature rise correct ; 1 5(d)(ii) temperature fall correct and greater than temperature rise ; 1 5(e)(i) correct gain in thermal energy ; 1 5(e)(ii) loss in thermal energy correct and greater than the gain ; 1 5(f)(i) Eg correct ; 1 5(f)(ii) correct substitution / manipulation of formula ; answer between 0.6 and 1.1 (J / g °C) ; 2 5(g) no lagging / lid / insulation / heat or energy loss / not all glass at same temperature / water T not the same as glass T / water left in beaker after pouring / volume of hot water approximate / mass of beaker only to nearest g / rounding (the balance) reading / transfer hot water too slowly / misreading thermometer / misreading the mass / other sensible suggestion ; 1
Q6 · A student investigates how the resistance of a wire depends upon its length
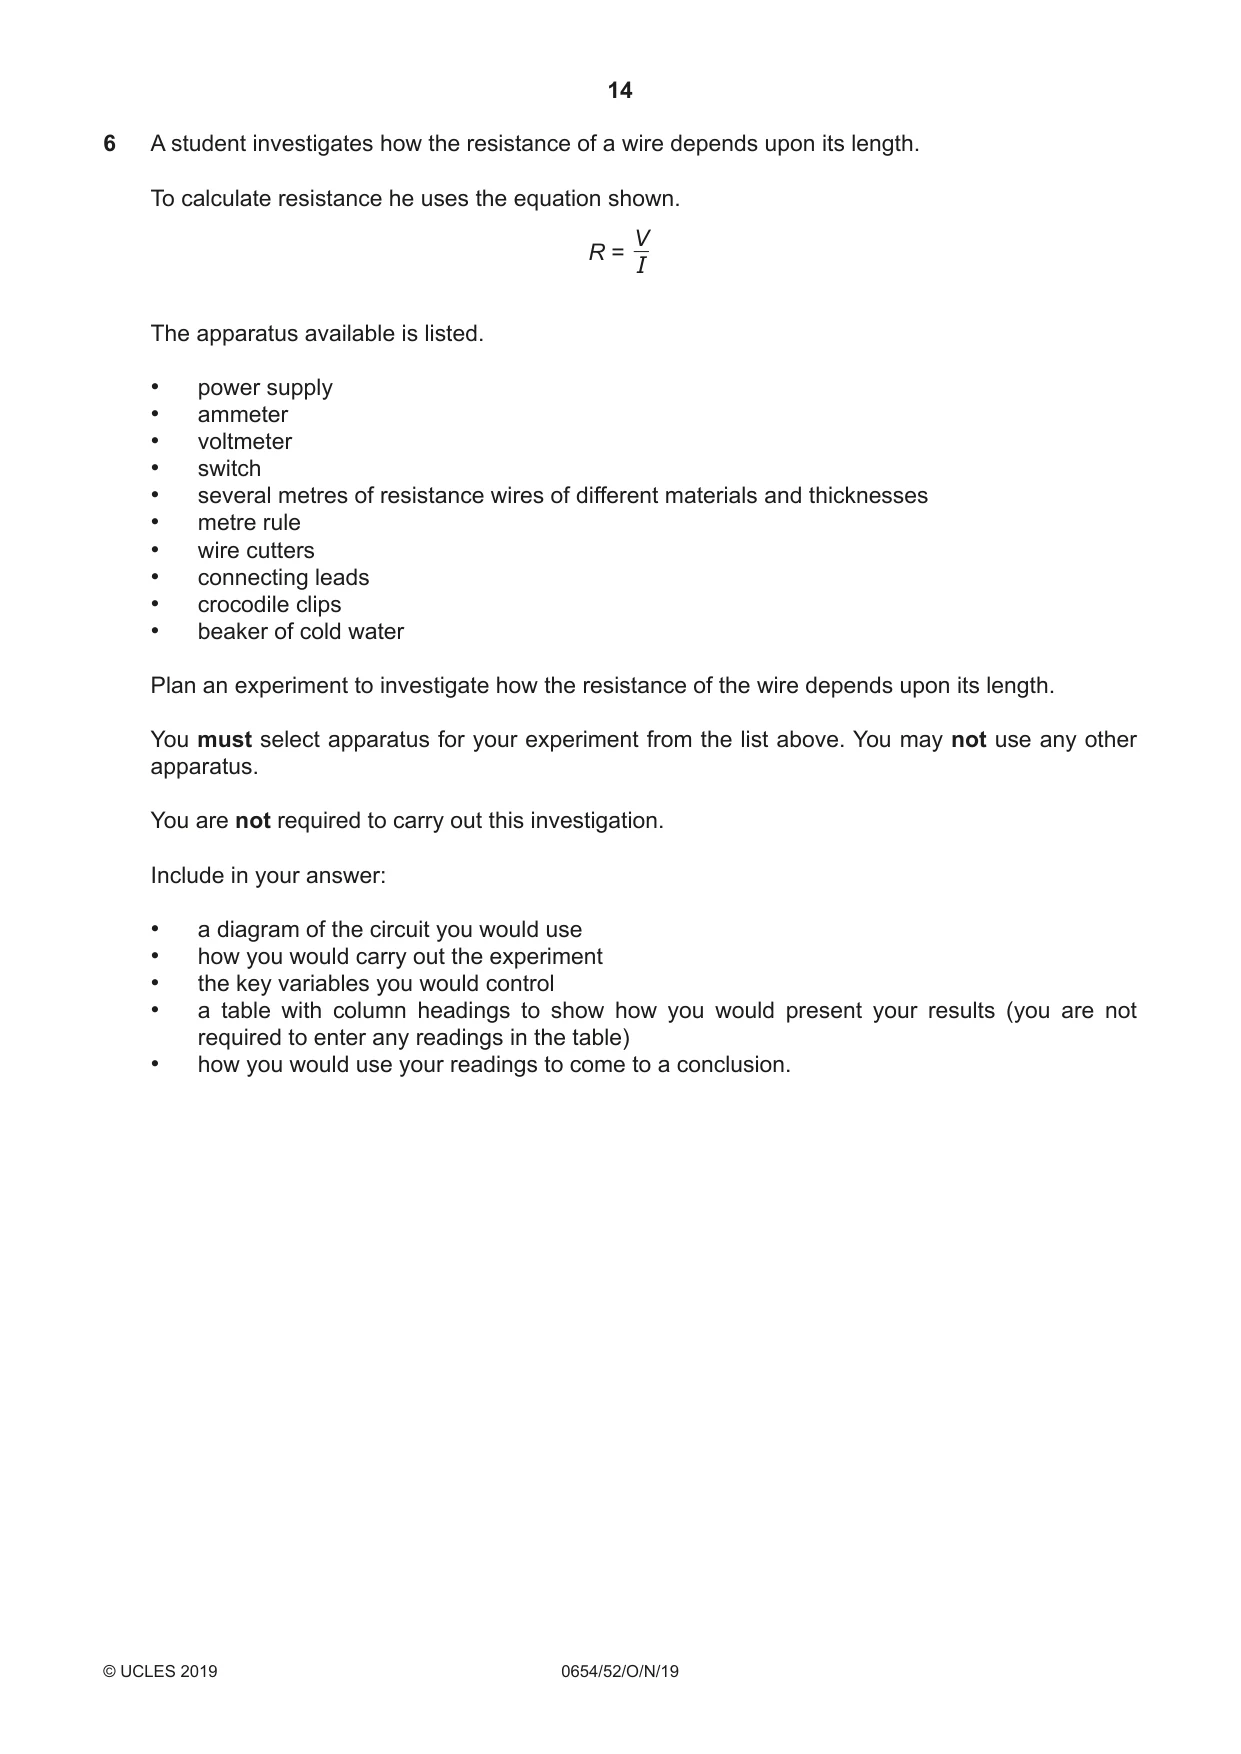
6 A student investigates how the resistance of a wire depends upon its length. To calculate resistance he uses the equation shown. V R = I The apparatus available is listed. • power supply • ammeter • voltmeter • switch • several metres of resistance wires of different materials and thicknesses • metre rule • wire cutters • connecting leads • crocodile clips • beaker of cold water Plan an experiment to investigate how the resistance of the wire depends upon its length. You must select apparatus for your experiment from the list above. You may not use any other apparatus. You are not required to carry out this investigation. Include in your answer: • a diagram of the circuit you would use • how you would carry out the experiment • the key variables you would control • a table with column headings to show how you would present your results (you are not required to enter any readings in the table) • how you would use your readings to come to a conclusion. .......................................................................................................................................................... .......................................................................................................................................................... .......................................................................................................................................................... .......................................................................................................................................................... .......................................................................................................................................................... .......................................................................................................................................................... .......................................................................................................................................................... .......................................................................................................................................................... .......................................................................................................................................................... .................................................................................................................................................... [7] [Total: 7] NOTES FOR USE IN QUALITATIVE ANALYSIS Tests for anions anion test test result carbonate (CO32–) add dilute acid effervescence, carbon dioxide produced chloride (Cl –) acidify with dilute nitric acid, then white ppt. [in solution] add aqueous silver nitrate bromide (Br–) acidify with dilute nitric acid, then cream ppt. [in solution] add aqueous silver nitrate nitrate (NO3–) add aqueous sodium hydroxide then ammonia produced [in solution] aluminium foil; warm carefully sulfate (SO42–) acidify, then add aqueous barium white ppt. [in solution] nitrate Tests for aqueous cations cation effect of aqueous sodium hydroxide effect of aqueous ammonia ammonium (NH4+) ammonia produced on warming – calcium (Ca2+) white ppt., insoluble in excess no ppt., or very slight white ppt. copper (Cu2+) light blue ppt., insoluble in excess light blue ppt., soluble in excess, giving a dark blue solution iron(II) (Fe2+) green ppt., insoluble in excess green ppt., insoluble in excess iron(III) (Fe3+) red-brown ppt., insoluble in excess red-brown ppt., insoluble in excess zinc (Zn2+) white ppt., soluble in excess giving a white ppt., soluble in excess, giving a colourless solution colourless solution Tests for gases Flame tests for metal ions gas test and test result metal ion flame colour ammonia (NH3) turns damp, red litmus paper blue lithium (Li+) red carbon dioxide (CO2) turns limewater milky sodium (Na+) yellow chlorine (Cl 2) bleaches damp litmus paper potassium (K+) lilac hydrogen (H2) ‘pops’ with a lighted splint copper(II) (Cu2+) blue-green oxygen (O2) relights a glowing splint
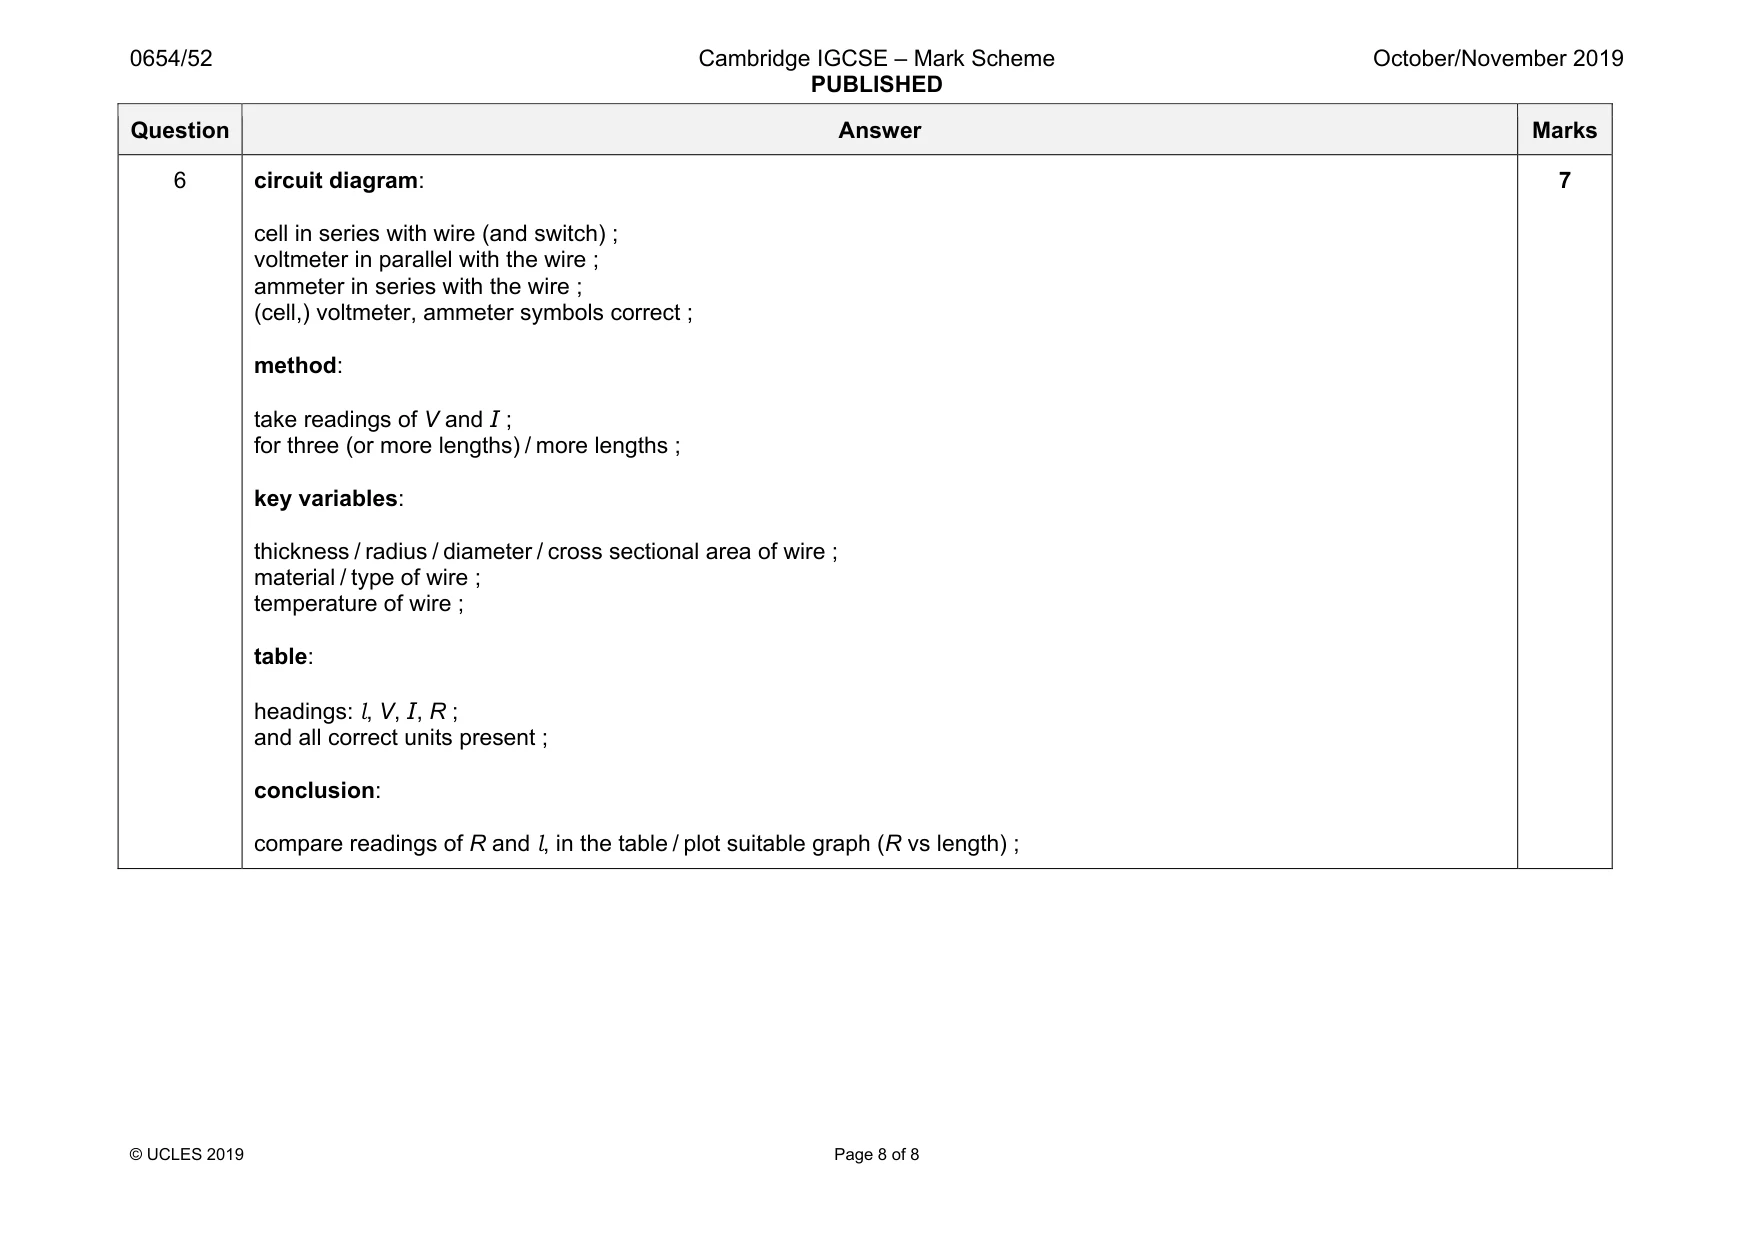
Mark scheme: 6 circuit diagram: cell in series with wire (and switch) ; voltmeter in parallel with the wire ; ammeter in series with the wire ; (cell,) voltmeter, ammeter symbols correct ; method: take readings of V and I ; for three (or more lengths) / more lengths ; key variables: thickness / radius / diameter / cross sectional area of wire ; material / type of wire ; temperature of wire ; table: headings: l, V, I, R ; and all correct units present ; conclusion: compare readings of R and l, in the table / plot suitable graph (R vs length) ; 7
What was in this paper
The subtopics covered by these 6 questions, and how many questions each got. Open one in a new tab to see every Cambridge question on it.
What you needed in this session
Cambridge’s own grade thresholds for 2019 Oct/Nov, Paper 5 · Variant 2. A higher threshold means an easier paper — the bar moves with how the cohort did.