Cambridge IGCSE Sciences - Co-ordinated (Double) 0654 — 2019 Oct/Nov Paper 5 · Variant 1
0654/51/O/N/19 · 6 questions · 60 marks · ≈68 min
The question paper and its mark scheme, free to read here and free to download. This is Cambridge’s own paper, exactly as it was sat.
Question paper16 pages

Mark scheme9 pages
Answers below. Sit the paper first if you are practising.
Questions as text
Q1 · You are going to investigate an enzyme controlled reaction
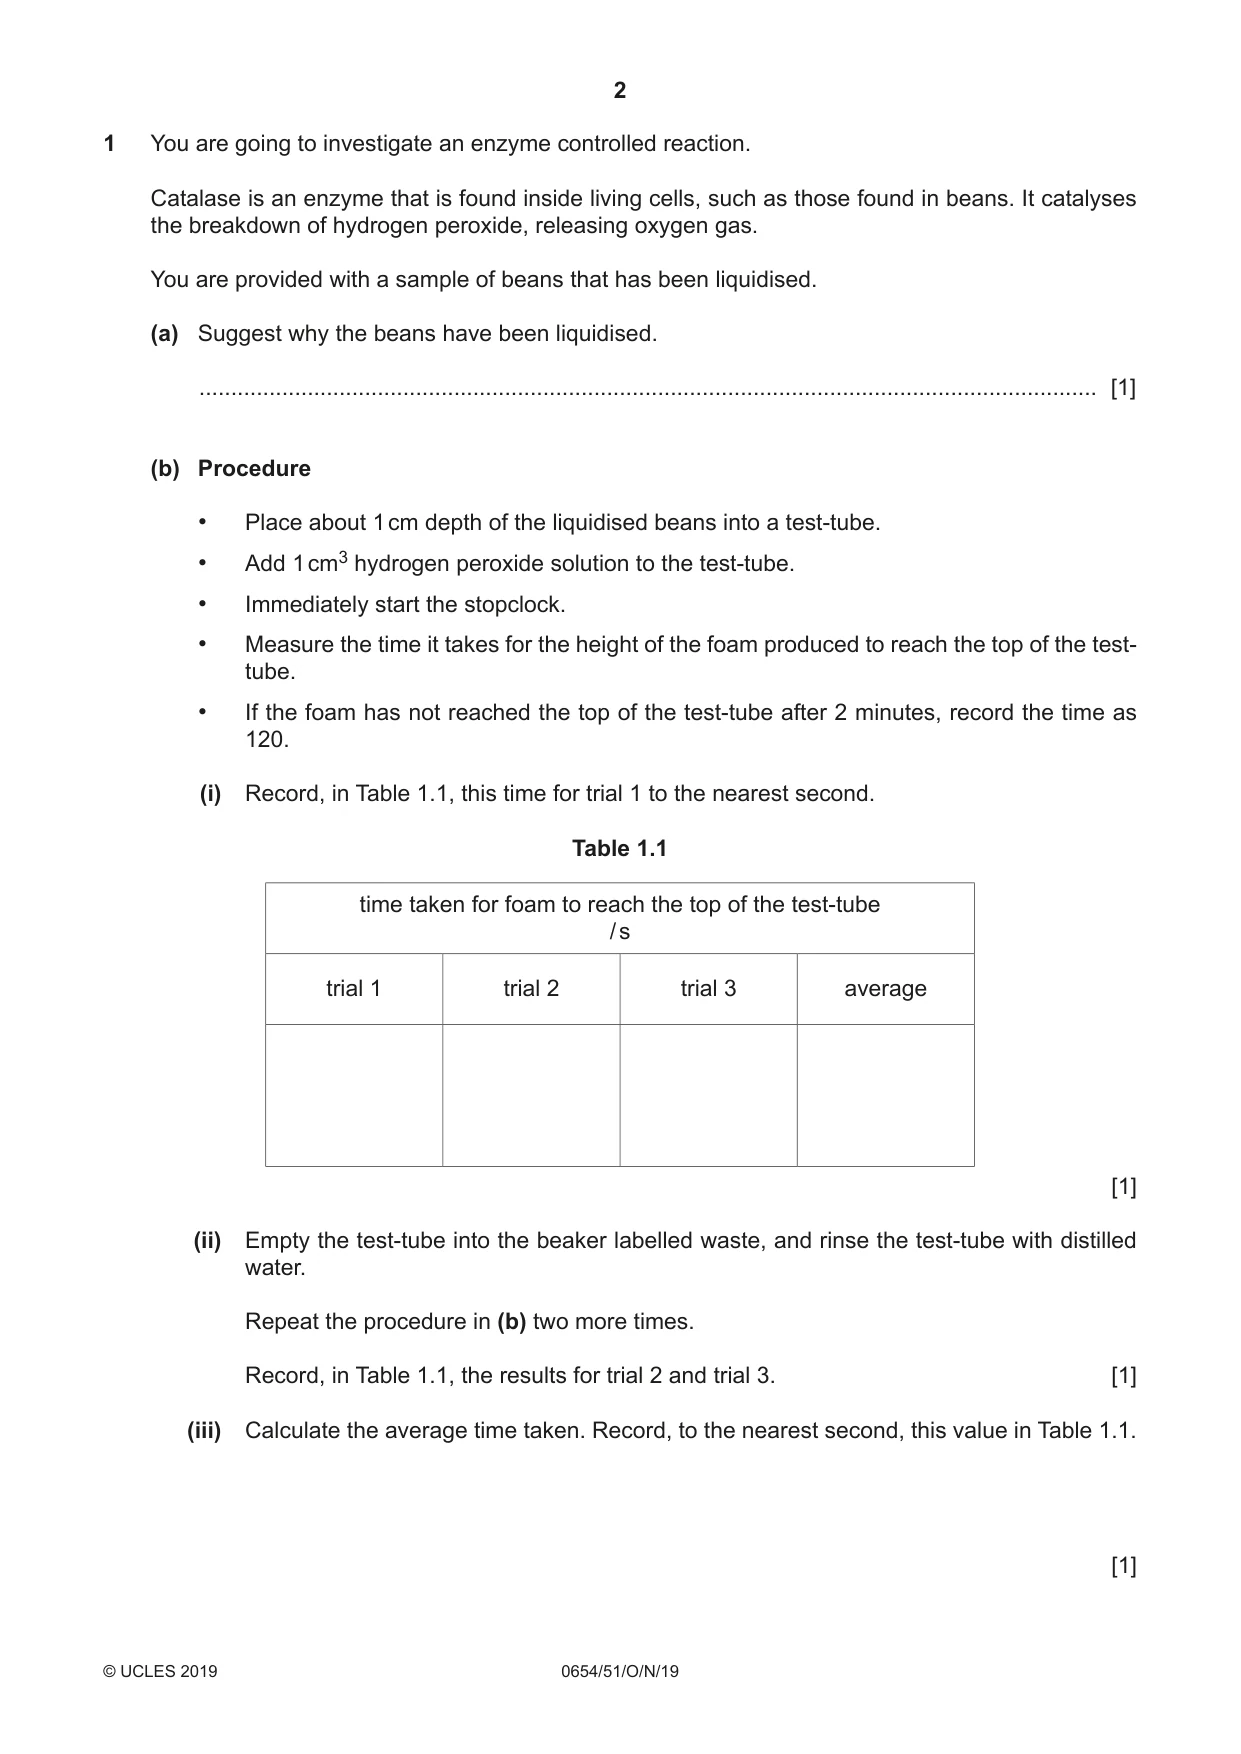
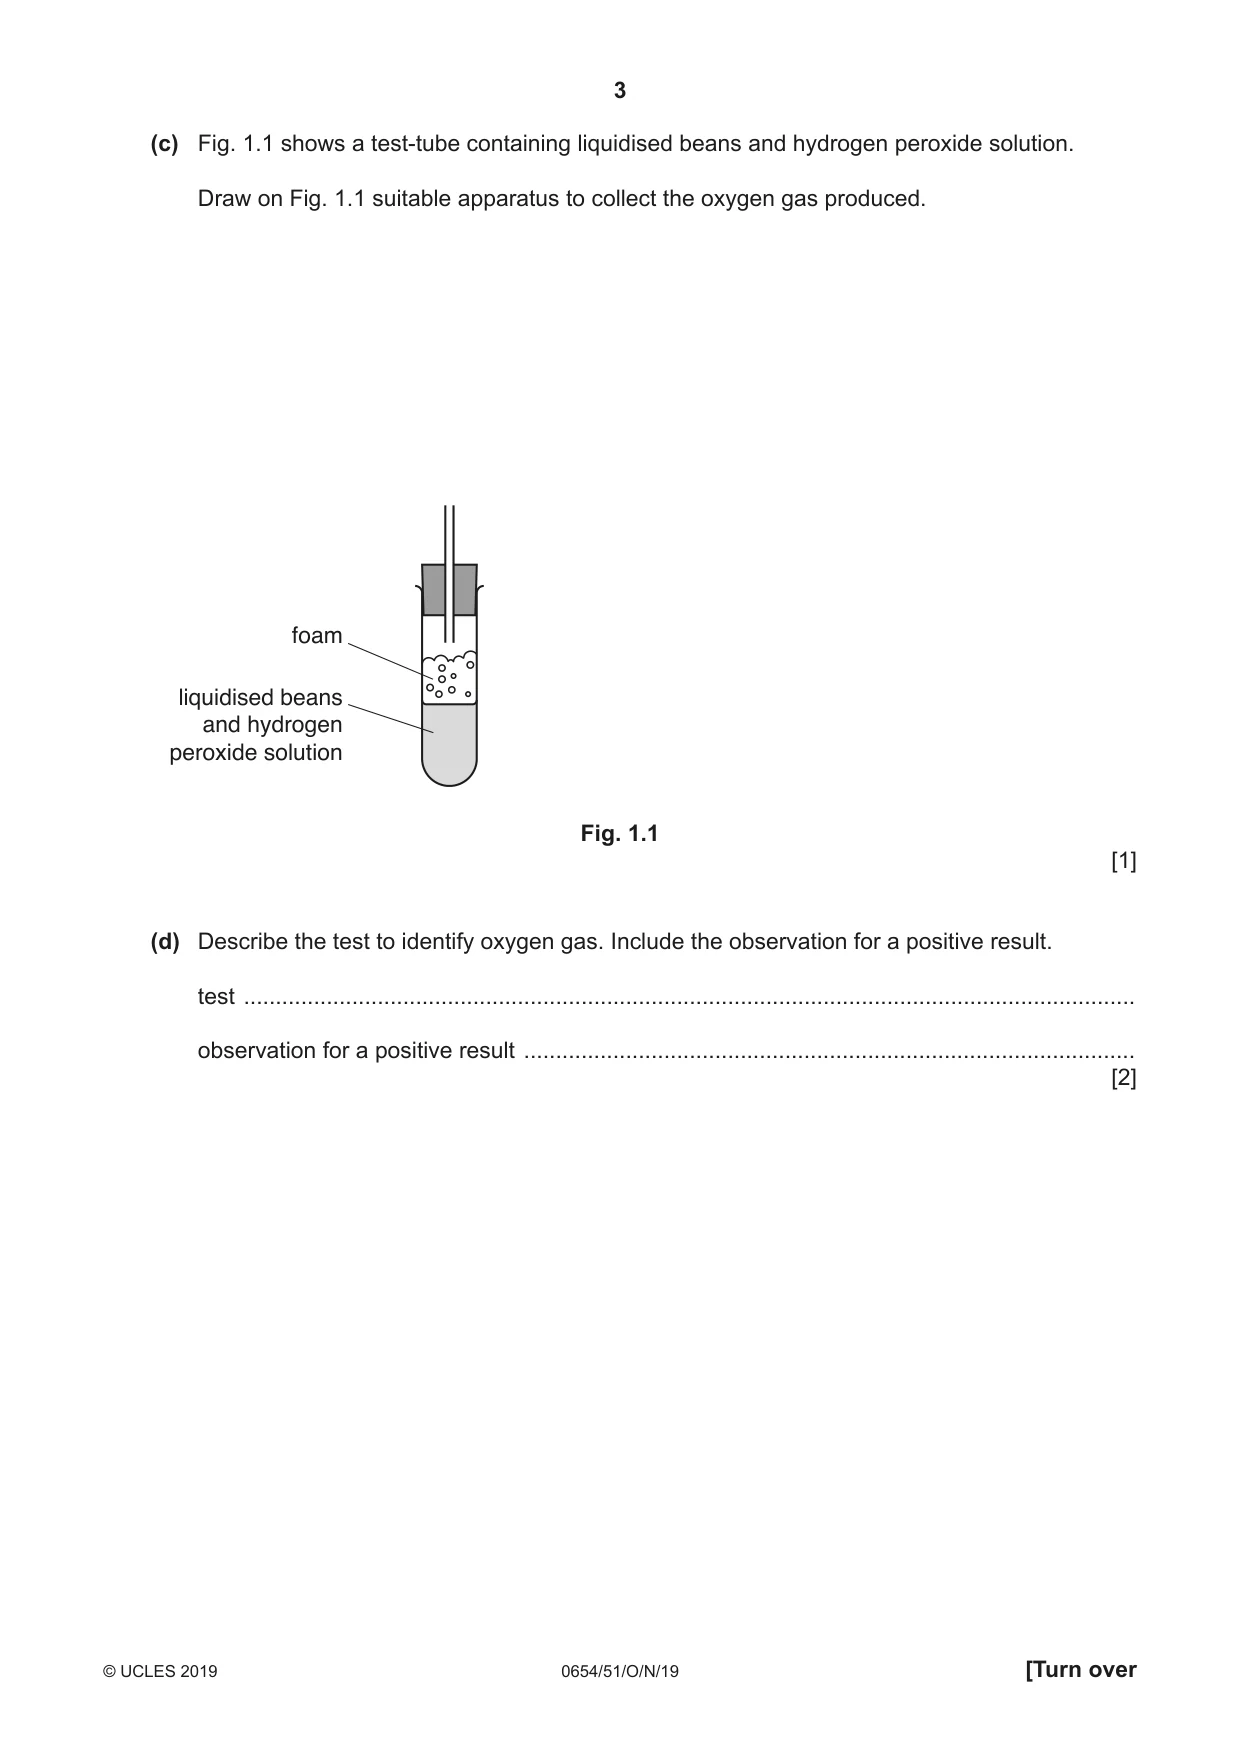
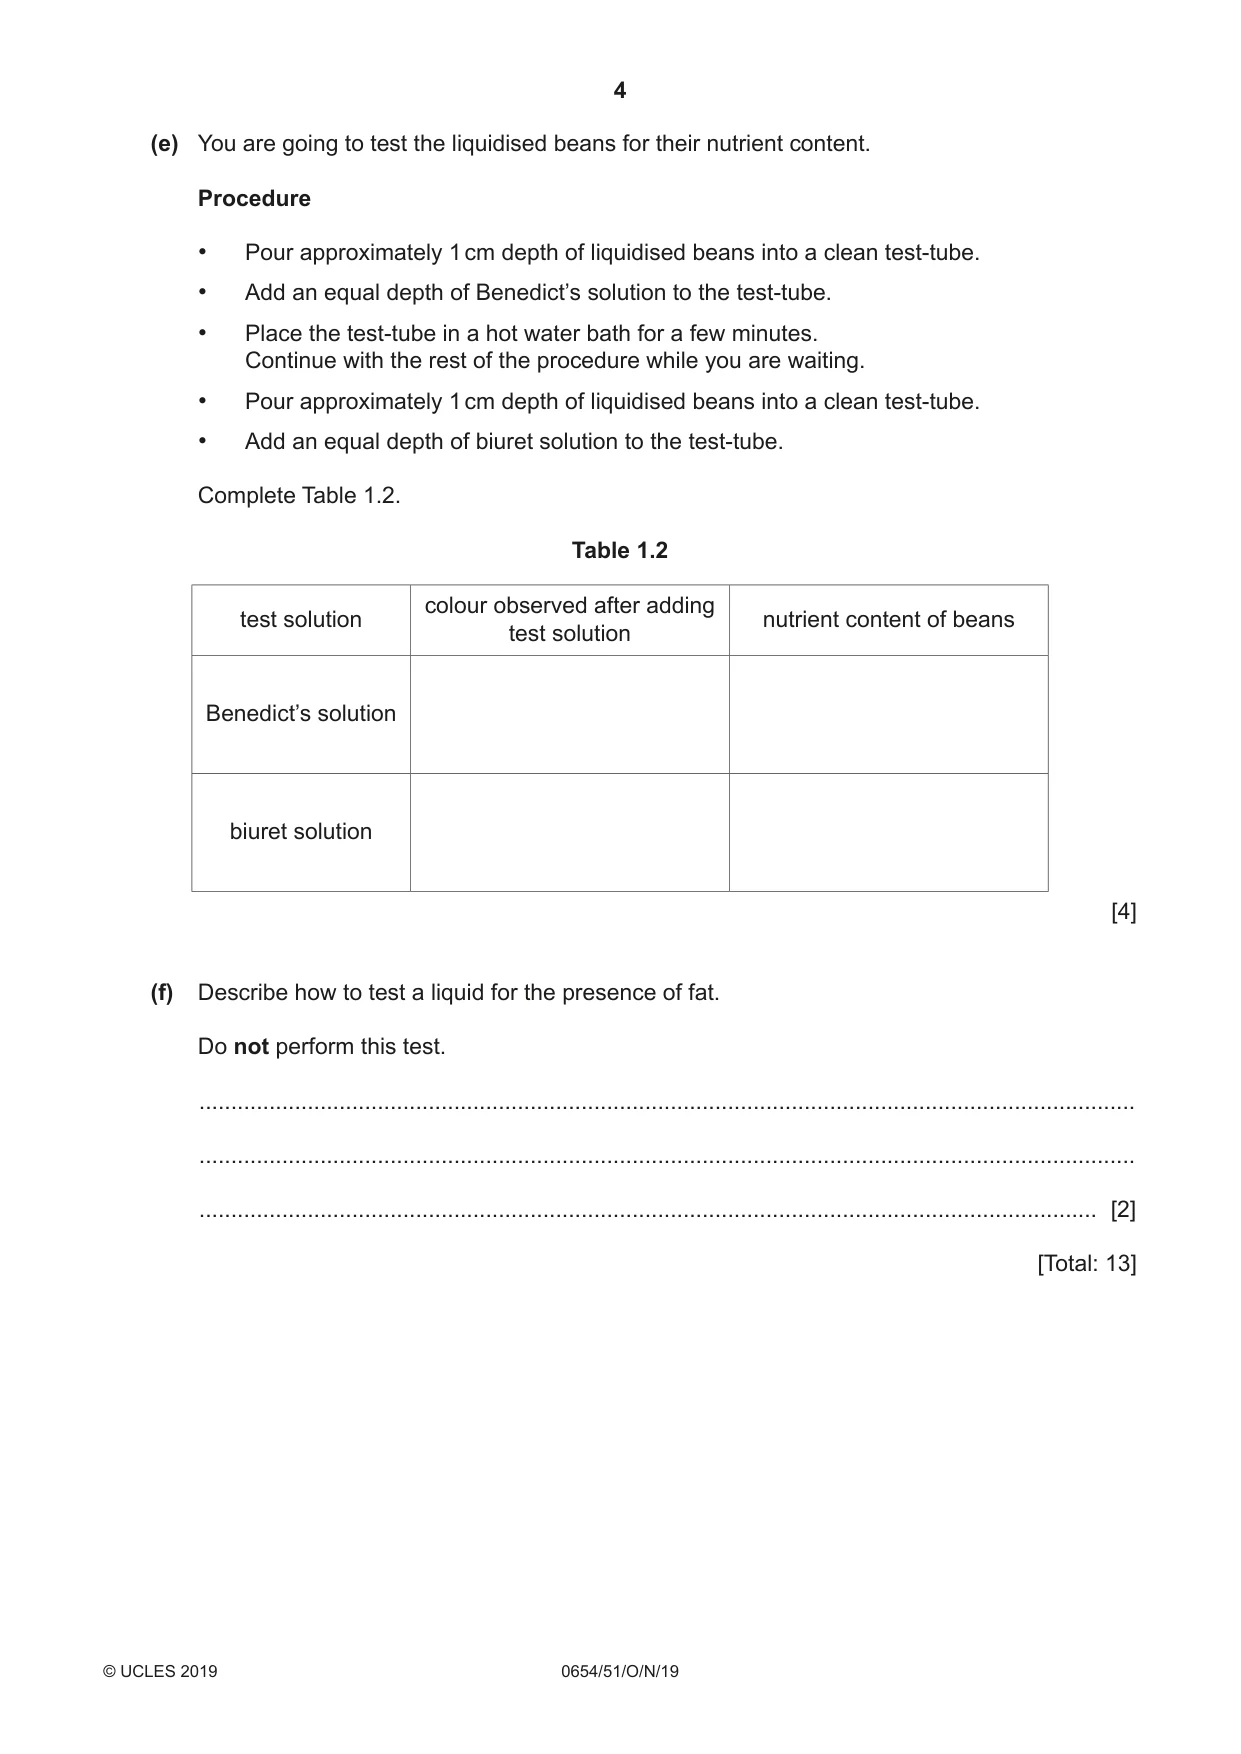
1 You are going to investigate an enzyme controlled reaction. Catalase is an enzyme that is found inside living cells, such as those found in beans. It catalyses the breakdown of hydrogen peroxide, releasing oxygen gas. You are provided with a sample of beans that has been liquidised. (a) Suggest why the beans have been liquidised. ............................................................................................................................................. [1] (b) Procedure • Place about 1 cm depth of the liquidised beans into a test-tube. • Add 1 cm3 hydrogen peroxide solution to the test-tube. • Immediately start the stopclock. • Measure the time it takes for the height of the foam produced to reach the top of the test- tube. • If the foam has not reached the top of the test-tube after 2 minutes, record the time as 120. (i) Record, in Table 1.1, this time for trial 1 to the nearest second. Table 1.1 time taken for foam to reach the top of the test-tube / s trial 1 trial 2 trial 3 average [1] (ii) Empty the test-tube into the beaker labelled waste, and rinse the test-tube with distilled water. Repeat the procedure in (b) two more times. Record, in Table 1.1, the results for trial 2 and trial 3. [1] (iii) Calculate the average time taken. Record, to the nearest second, this value in Table 1.1. [1] (c) Fig. 1.1 shows a test-tube containing liquidised beans and hydrogen peroxide solution. Draw on Fig. 1.1 suitable apparatus to collect the oxygen gas produced. foam liquidised beans and hydrogen peroxide solution Fig. 1.1 [1] (d) Describe the test to identify oxygen gas. Include the observation for a positive result. test ............................................................................................................................................ observation for a positive result ................................................................................................ [2] (e) You are going to test the liquidised beans for their nutrient content. Procedure • Pour approximately 1 cm depth of liquidised beans into a clean test-tube. • Add an equal depth of Benedict’s solution to the test-tube. • Place the test-tube in a hot water bath for a few minutes. Continue with the rest of the procedure while you are waiting. • Pour approximately 1 cm depth of liquidised beans into a clean test-tube. • Add an equal depth of biuret solution to the test-tube. Complete Table 1.2. Table 1.2 colour observed after adding test solution nutrient content of beans test solution Benedict’s solution biuret solution [4] (f) Describe how to test a liquid for the presence of fat. Do not perform this test. ................................................................................................................................................... ................................................................................................................................................... ............................................................................................................................................. [2] [Total: 13]
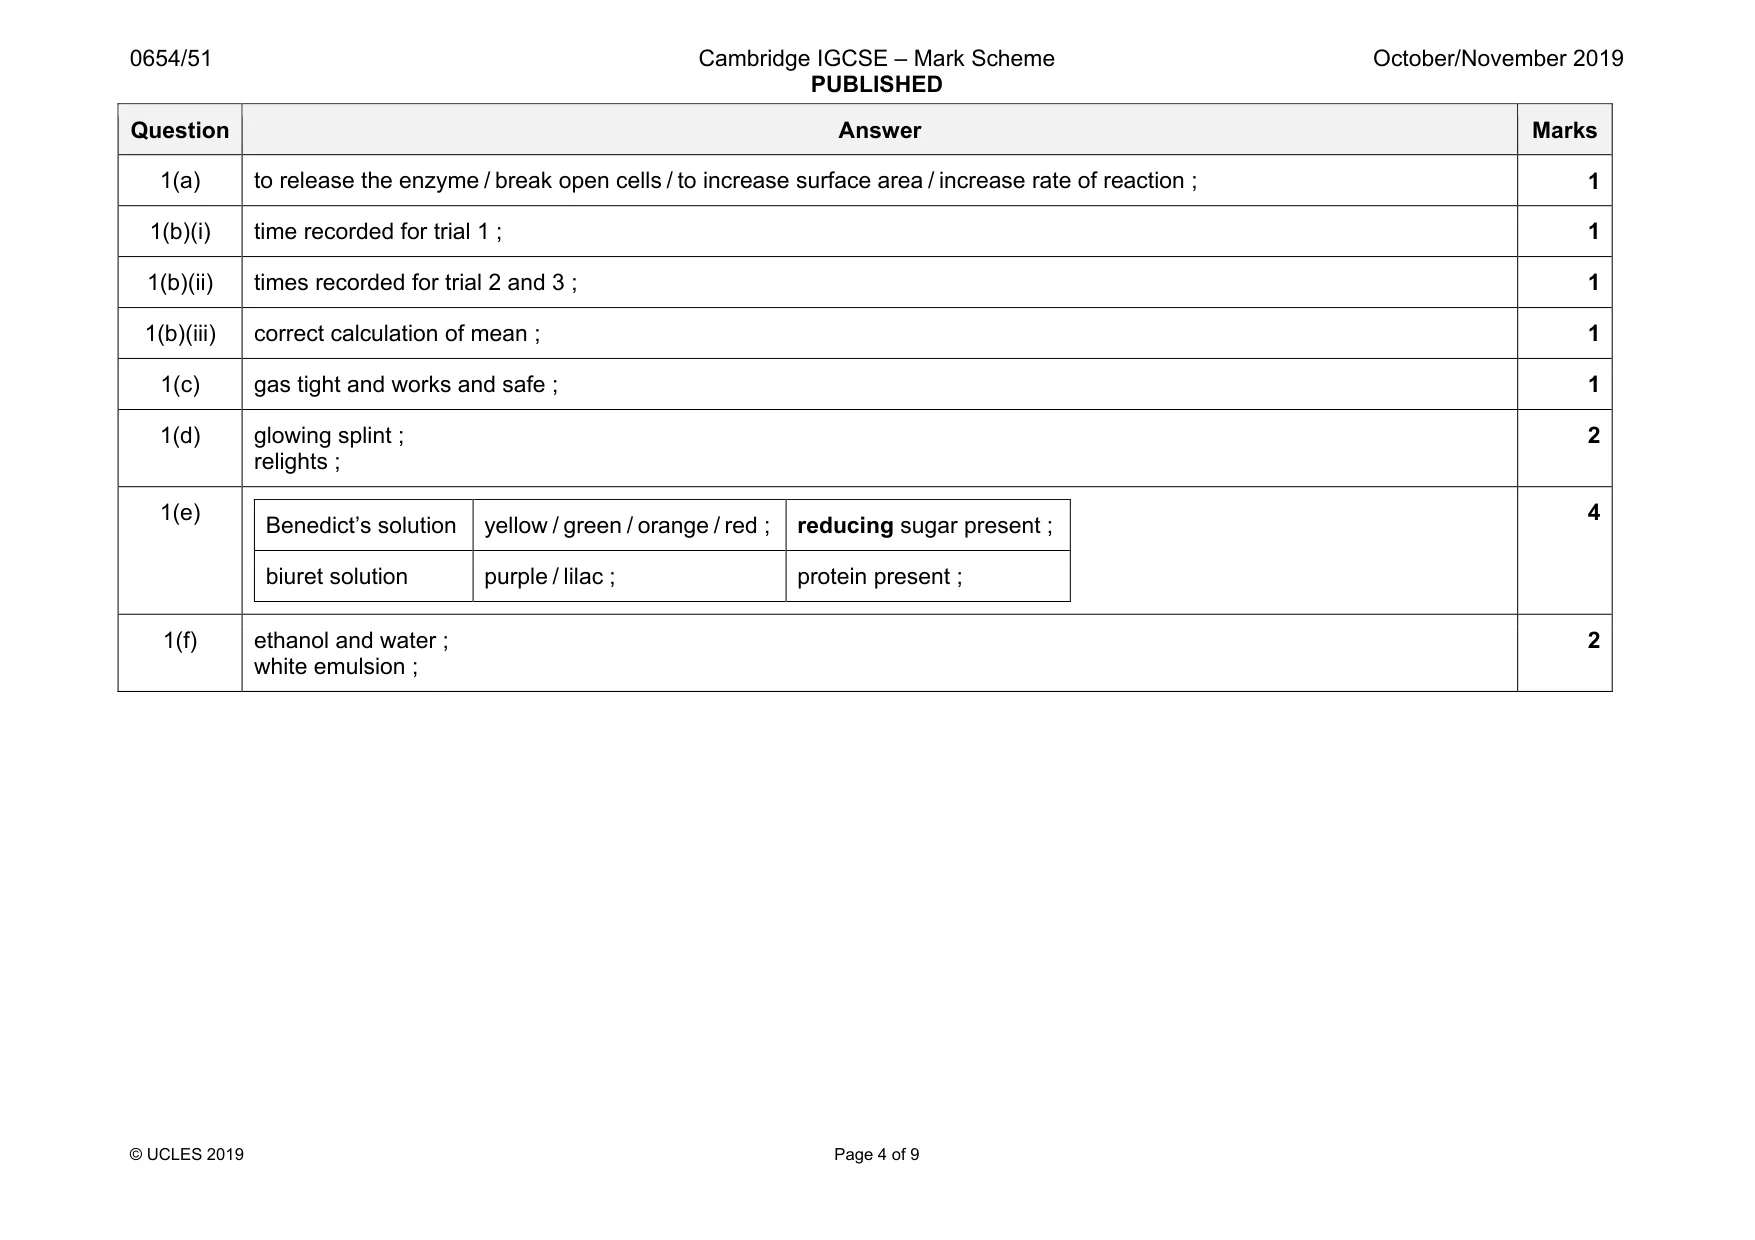
Mark scheme: 1(a) to release the enzyme / break open cells / to increase surface area / increase rate of reaction ; 1 1(b)(i) time recorded for trial 1 ; 1 1(b)(ii) times recorded for trial 2 and 3 ; 1 1(b)(iii) correct calculation of mean ; 1 1(c) gas tight and works and safe ; 1 1(d) glowing splint ; relights ; 2 1(e) Benedict’s solution yellow / green / orange / red ; reducing sugar present ; biuret solution purple / lilac ; protein present ; 4 1(f) ethanol and water ; white emulsion ; 2
Q2 · Photosynthesis takes place in aquatic plants (plants that live in water)
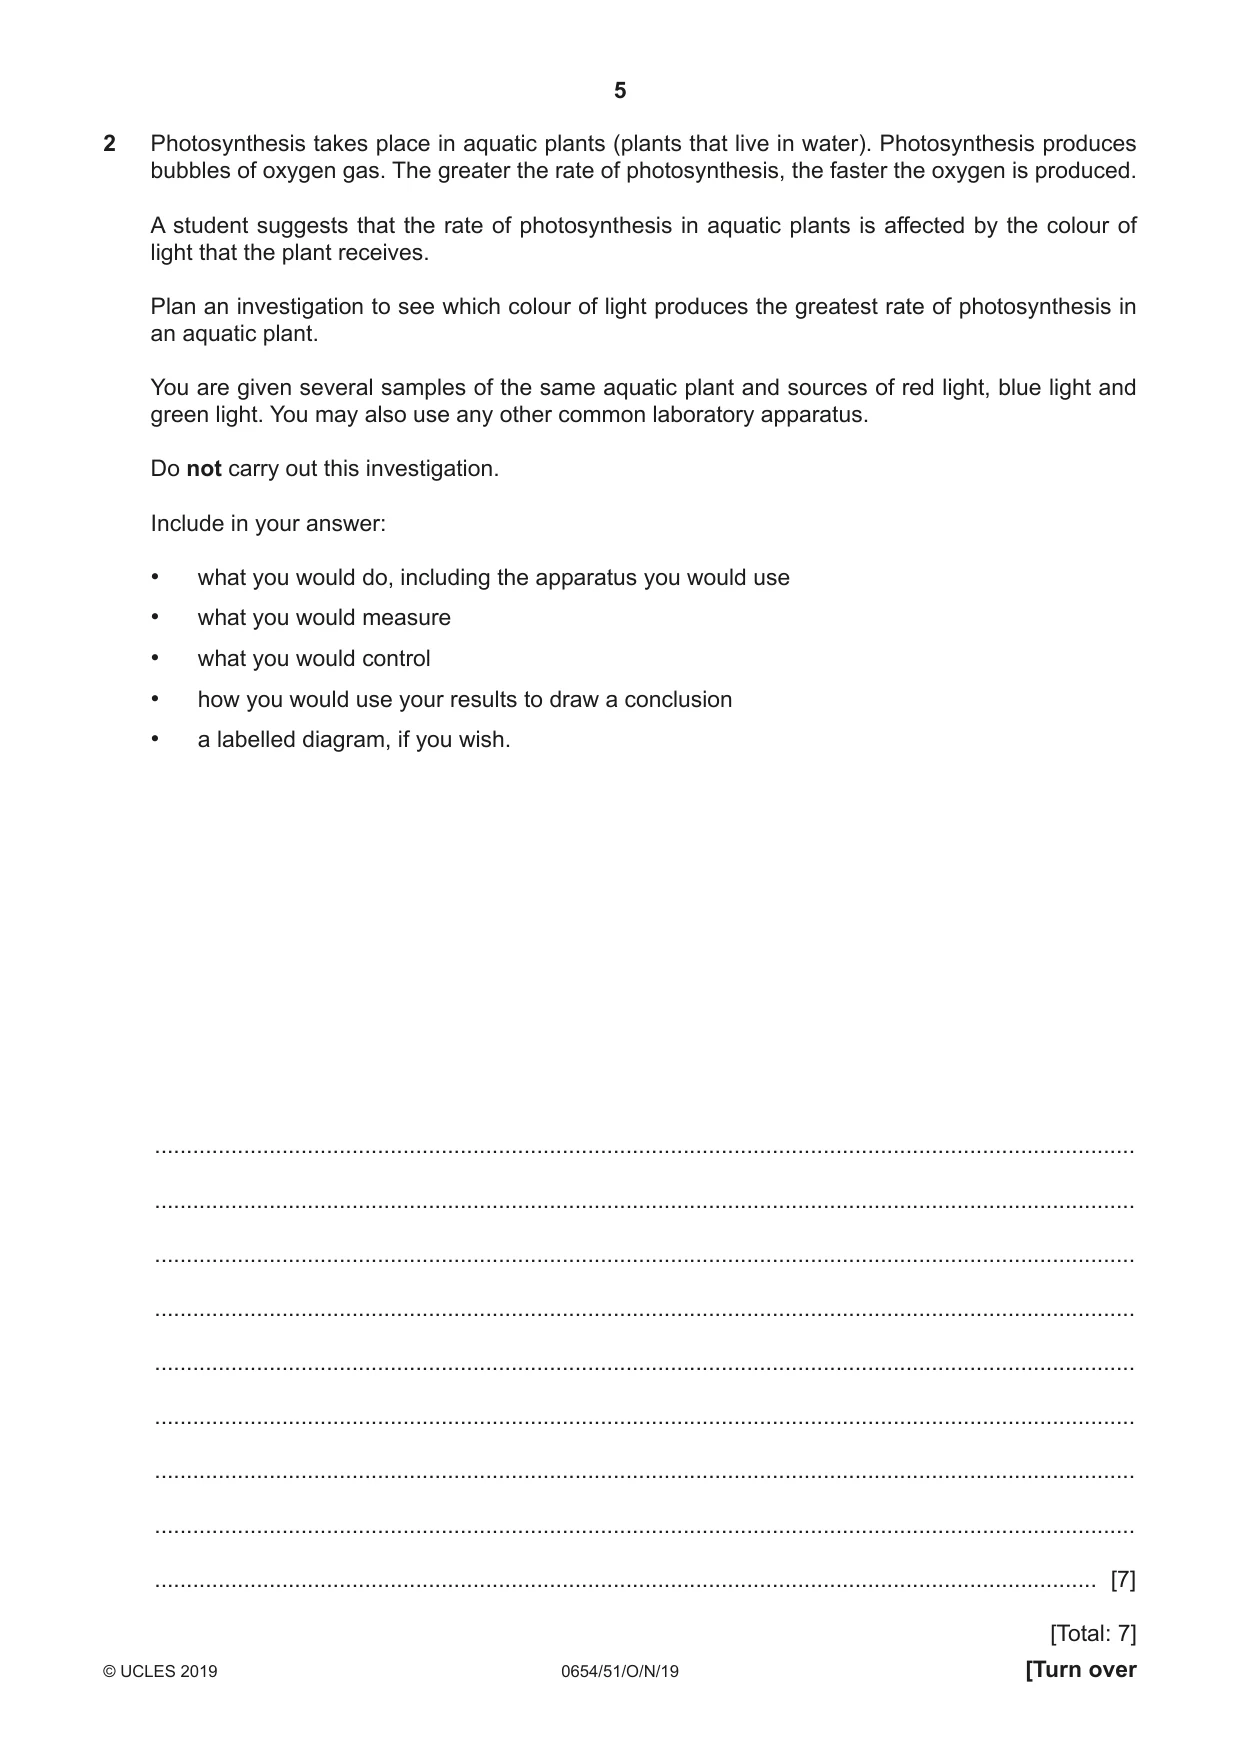
2 Photosynthesis takes place in aquatic plants (plants that live in water). Photosynthesis produces bubbles of oxygen gas. The greater the rate of photosynthesis, the faster the oxygen is produced. A student suggests that the rate of photosynthesis in aquatic plants is affected by the colour of light that the plant receives. Plan an investigation to see which colour of light produces the greatest rate of photosynthesis in an aquatic plant. You are given several samples of the same aquatic plant and sources of red light, blue light and green light. You may also use any other common laboratory apparatus. Do not carry out this investigation. Include in your answer: • what you would do, including the apparatus you would use • what you would measure • what you would control • how you would use your results to draw a conclusion • a labelled diagram, if you wish. .......................................................................................................................................................... .......................................................................................................................................................... .......................................................................................................................................................... .......................................................................................................................................................... .......................................................................................................................................................... .......................................................................................................................................................... .......................................................................................................................................................... .......................................................................................................................................................... .................................................................................................................................................... [7] [Total: 7]
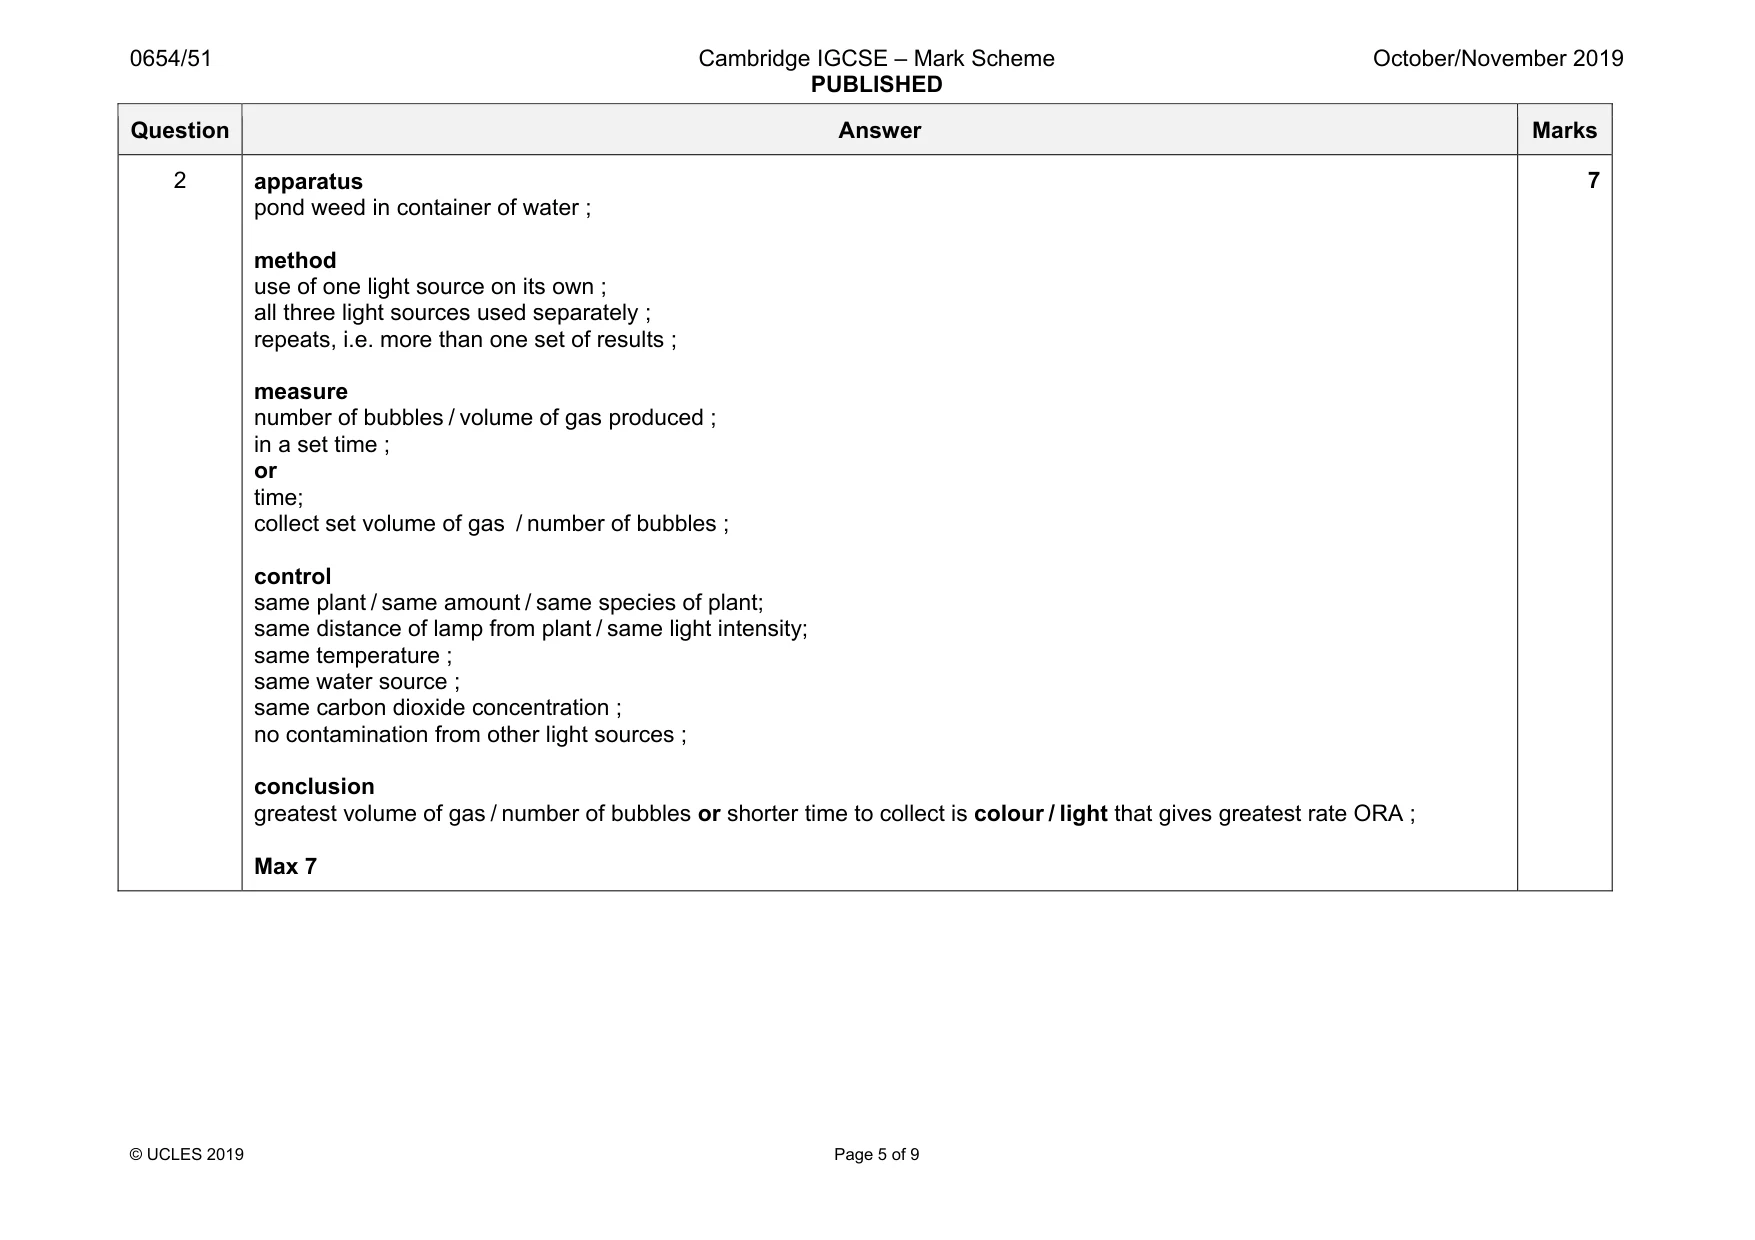
Mark scheme: 2 apparatus pond weed in container of water ; method use of one light source on its own ; all three light sources used separately ; repeats, i.e. more than one set of results ; measure number of bubbles / volume of gas produced ; in a set time ; or time; collect set volume of gas / number of bubbles ; control same plant / same amount / same species of plant; same distance of lamp from plant / same light intensity; same temperature ; same water source ; same carbon dioxide concentration ; no contamination from other light sources ; conclusion greatest volume of gas / number of bubbles or shorter time to collect is colour / light that gives greatest rate ORA ; Max 7 7
Q3 · You are going to investigate the effect of the surface area of a solid on the rate of a…
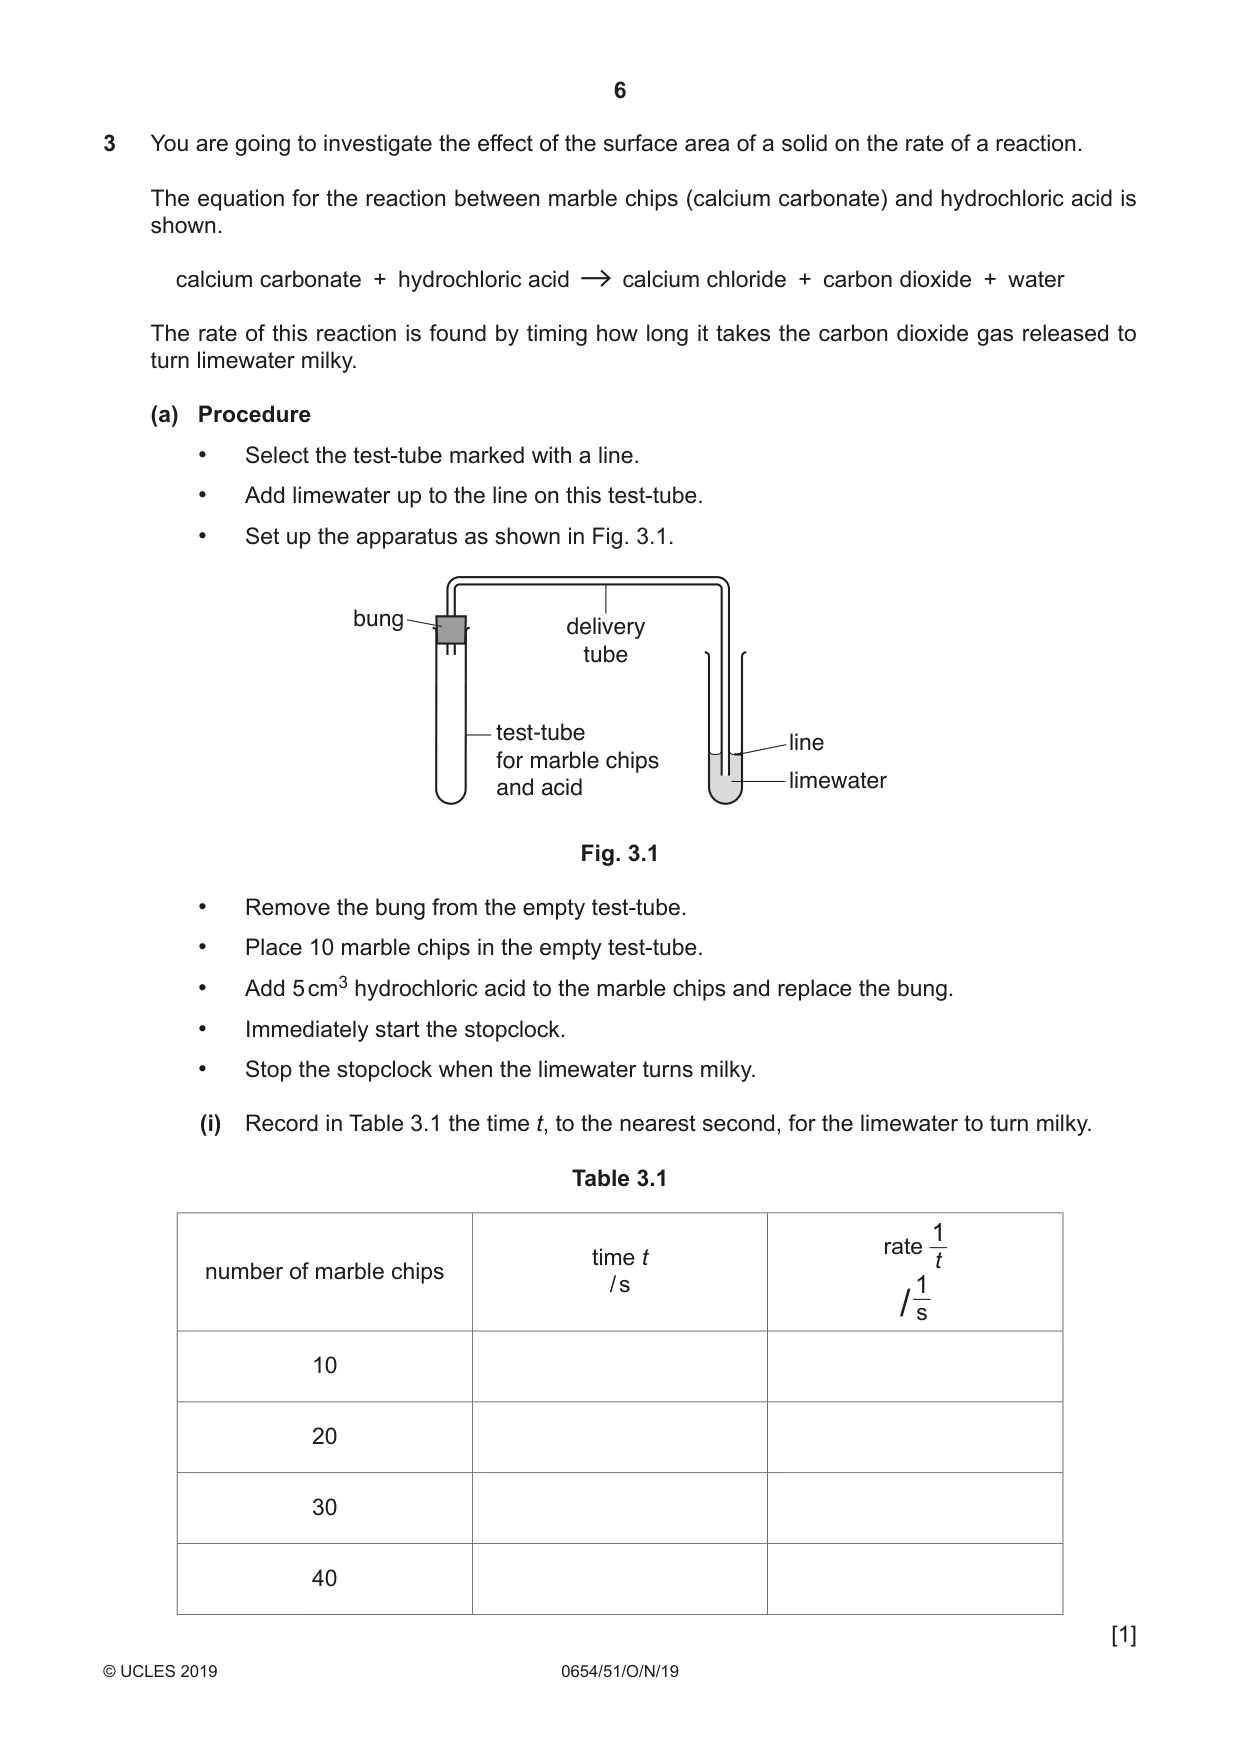
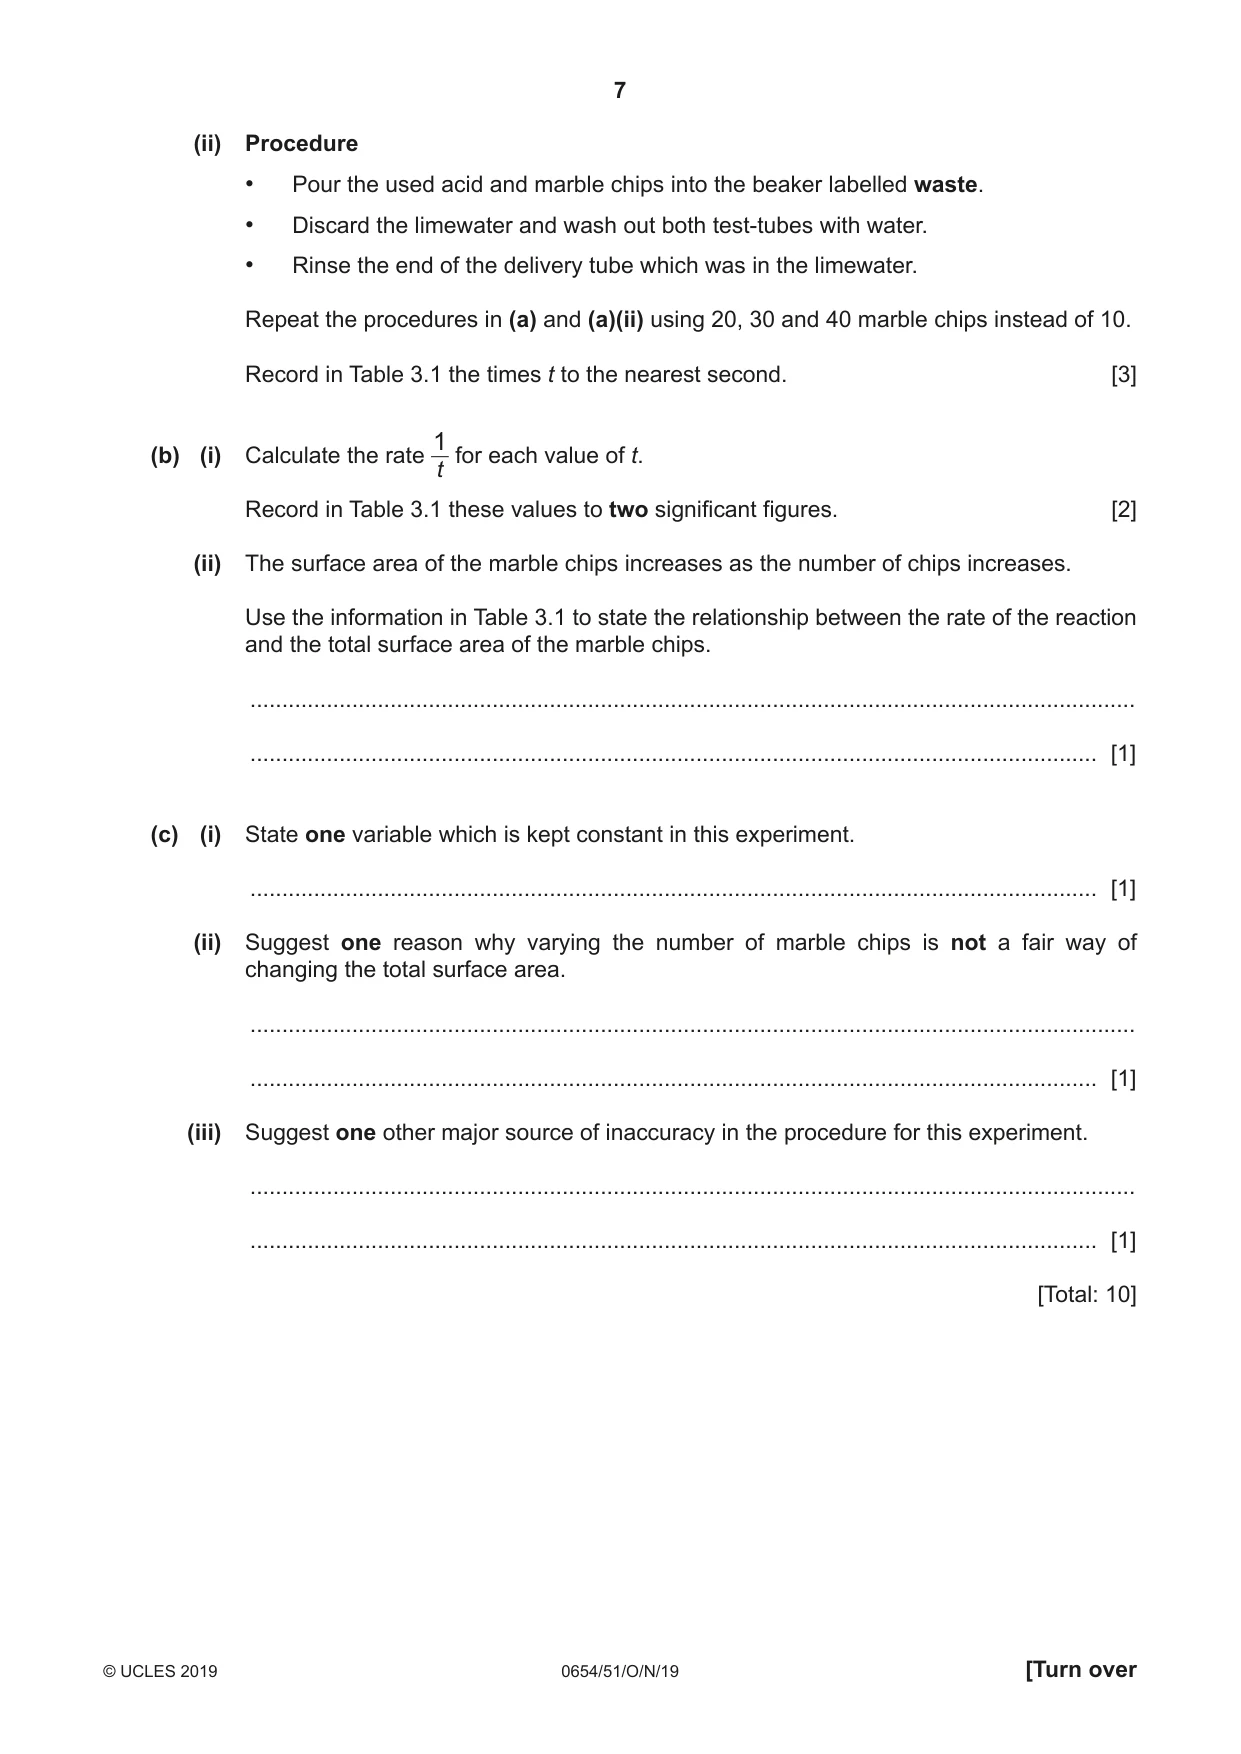
3 You are going to investigate the effect of the surface area of a solid on the rate of a reaction. The equation for the reaction between marble chips (calcium carbonate) and hydrochloric acid is shown. calcium carbonate + hydrochloric acid calcium chloride + carbon dioxide + water The rate of this reaction is found by timing how long it takes the carbon dioxide gas released to turn limewater milky. (a) Procedure • Select the test-tube marked with a line. • Add limewater up to the line on this test-tube. • Set up the apparatus as shown in Fig. 3.1. bung delivery tube test-tube line for marble chips limewater and acid Fig. 3.1 • Remove the bung from the empty test-tube. • Place 10 marble chips in the empty test-tube. • Add 5 cm3 hydrochloric acid to the marble chips and replace the bung. • Immediately start the stopclock. • Stop the stopclock when the limewater turns milky. (i) Record in Table 3.1 the time t, to the nearest second, for the limewater to turn milky. Table 3.1 1 rate time t t number of marble chips / s 1 / s 10 20 30 40 [1] (ii) Procedure • Pour the used acid and marble chips into the beaker labelled waste. • Discard the limewater and wash out both test-tubes with water. • Rinse the end of the delivery tube which was in the limewater. Repeat the procedures in (a) and (a)(ii) using 20, 30 and 40 marble chips instead of 10. Record in Table 3.1 the times t to the nearest second. [3] 1(b) (i) Calculate the rate for each value of t. t Record in Table 3.1 these values to two significant figures. [2] (ii) The surface area of the marble chips increases as the number of chips increases. Use the information in Table 3.1 to state the relationship between the rate of the reaction and the total surface area of the marble chips. ........................................................................................................................................... ..................................................................................................................................... [1] (c) (i) State one variable which is kept constant in this experiment. ..................................................................................................................................... [1] (ii) Suggest one reason why varying the number of marble chips is not a fair way of changing the total surface area. ........................................................................................................................................... ..................................................................................................................................... [1] (iii) Suggest one other major source of inaccuracy in the procedure for this experiment. ........................................................................................................................................... ..................................................................................................................................... [1] [Total: 10]
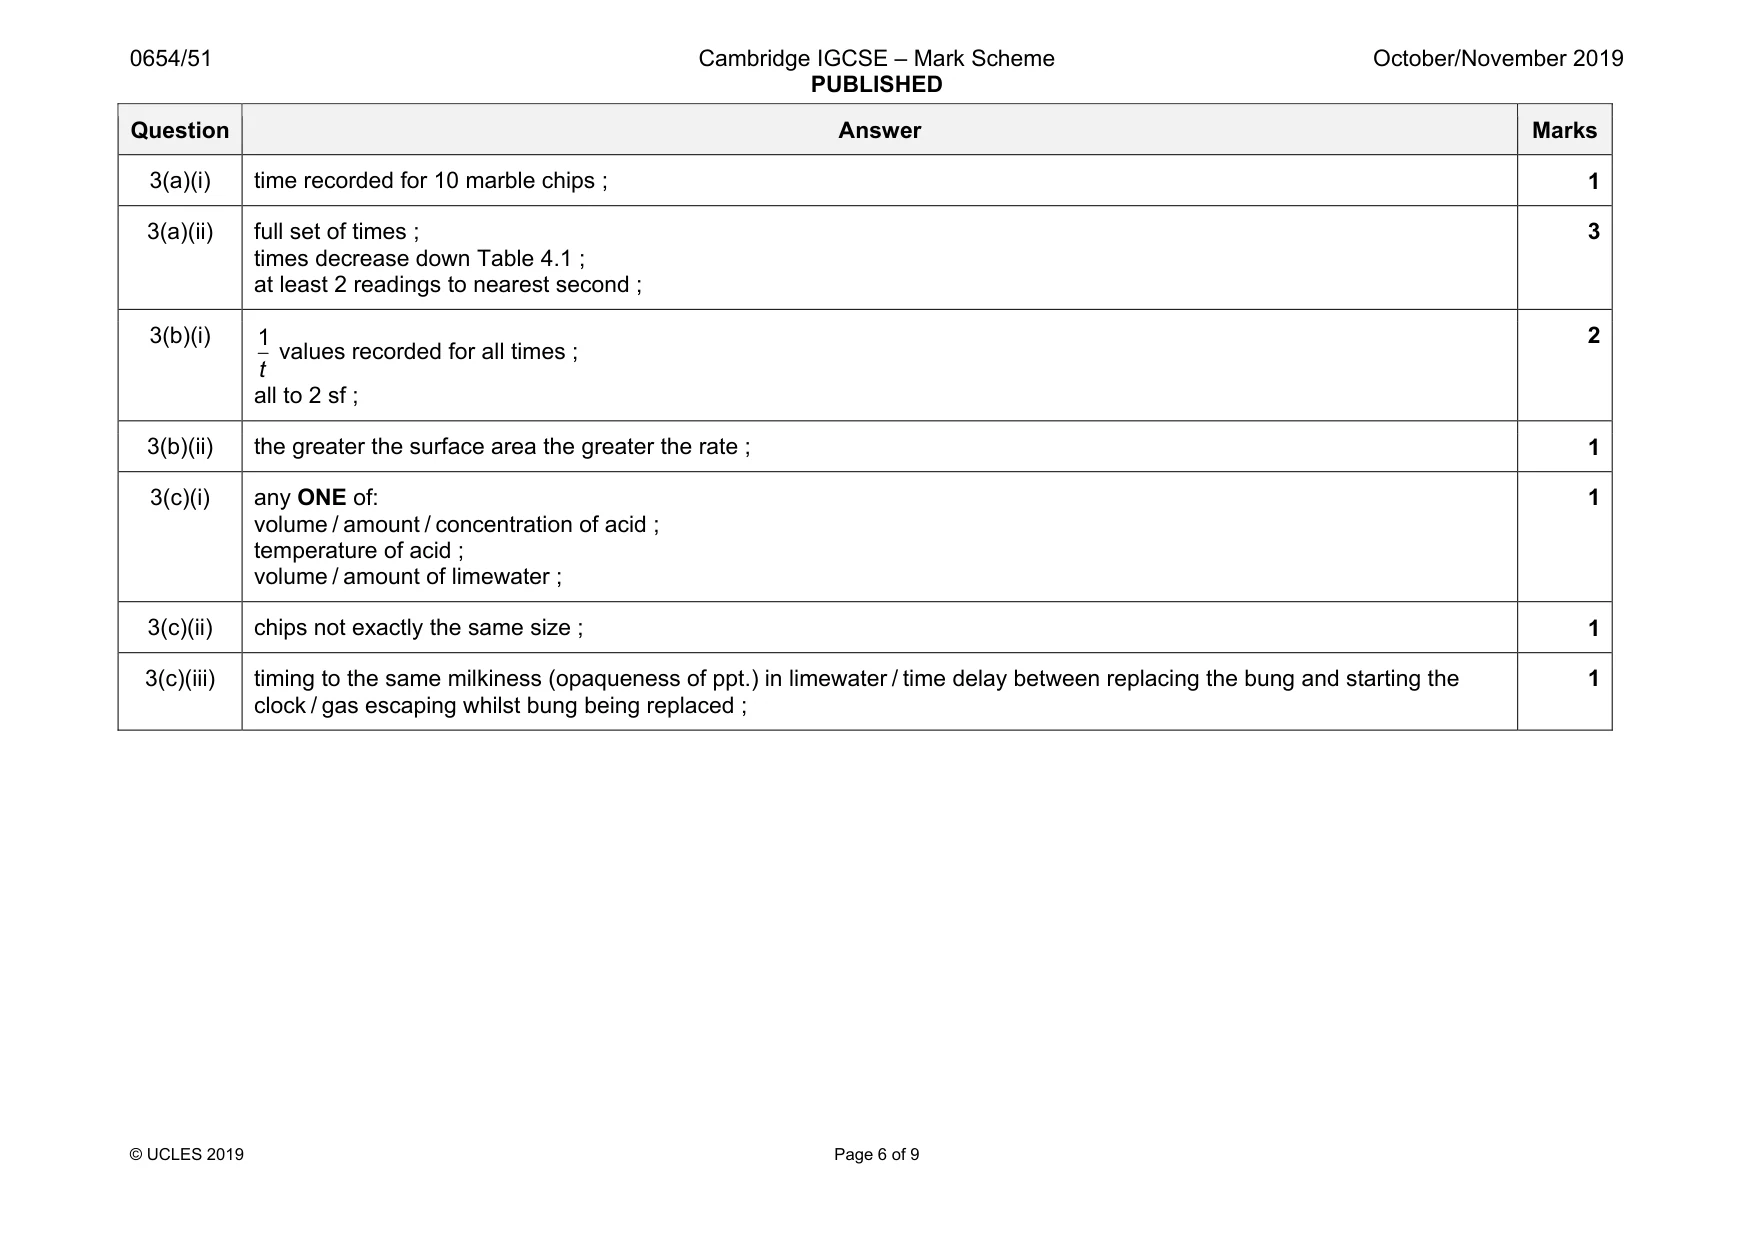
Mark scheme: 3(a)(i) time recorded for 10 marble chips ; 1 3(a)(ii) full set of times ; times decrease down Table 4.1 ; at least 2 readings to nearest second ; 3 3(b)(i) 1 t values recorded for all times ; all to 2 sf ; 2 3(b)(ii) the greater the surface area the greater the rate ; 1 3(c)(i) any ONE of: volume / amount / concentration of acid ; temperature of acid ; volume / amount of limewater ; 1 3(c)(ii) chips not exactly the same size ; 1 3(c)(iii) timing to the same milkiness (opaqueness of ppt.) in limewater / time delay between replacing the bung and starting the clock / gas escaping whilst bung being replaced ; 1
Q4 · You are going to investigate the properties of compound H and identify the anion in H
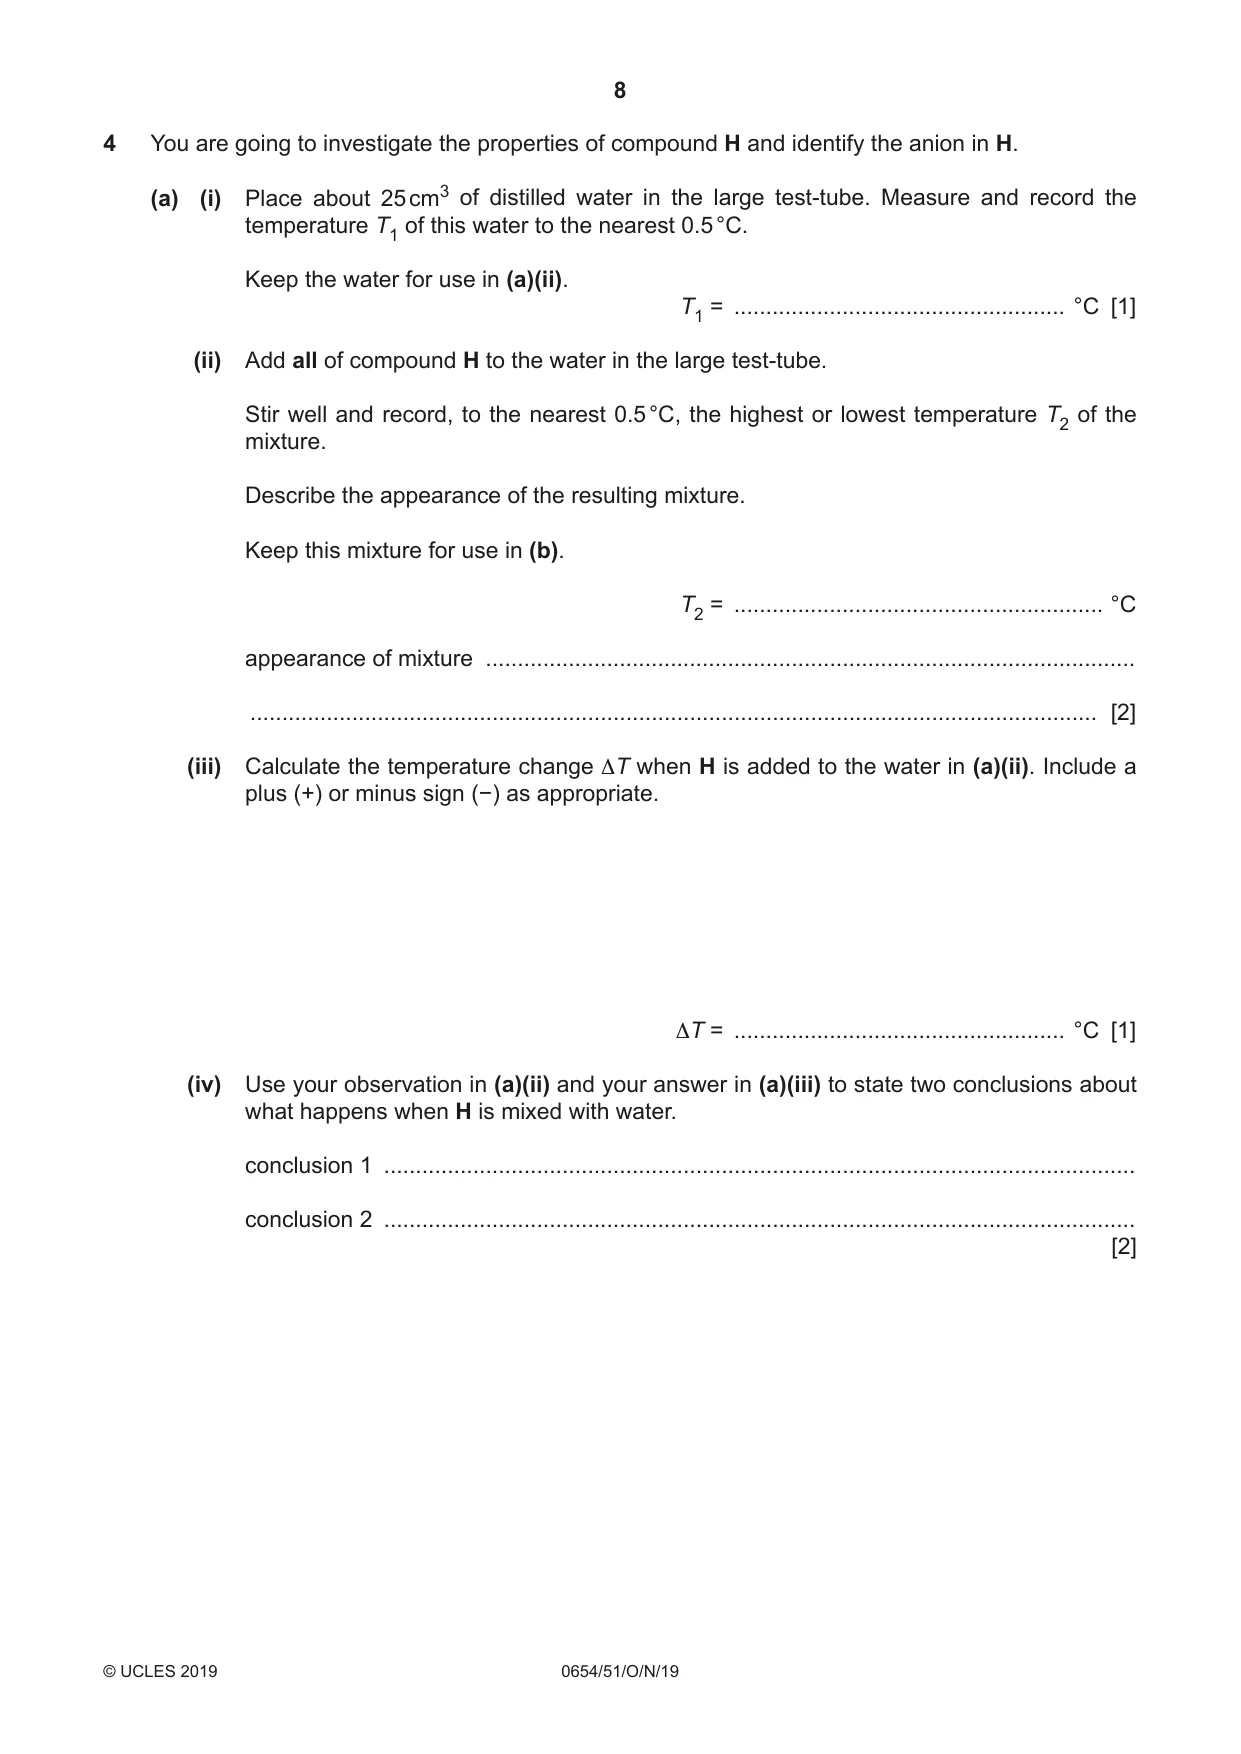
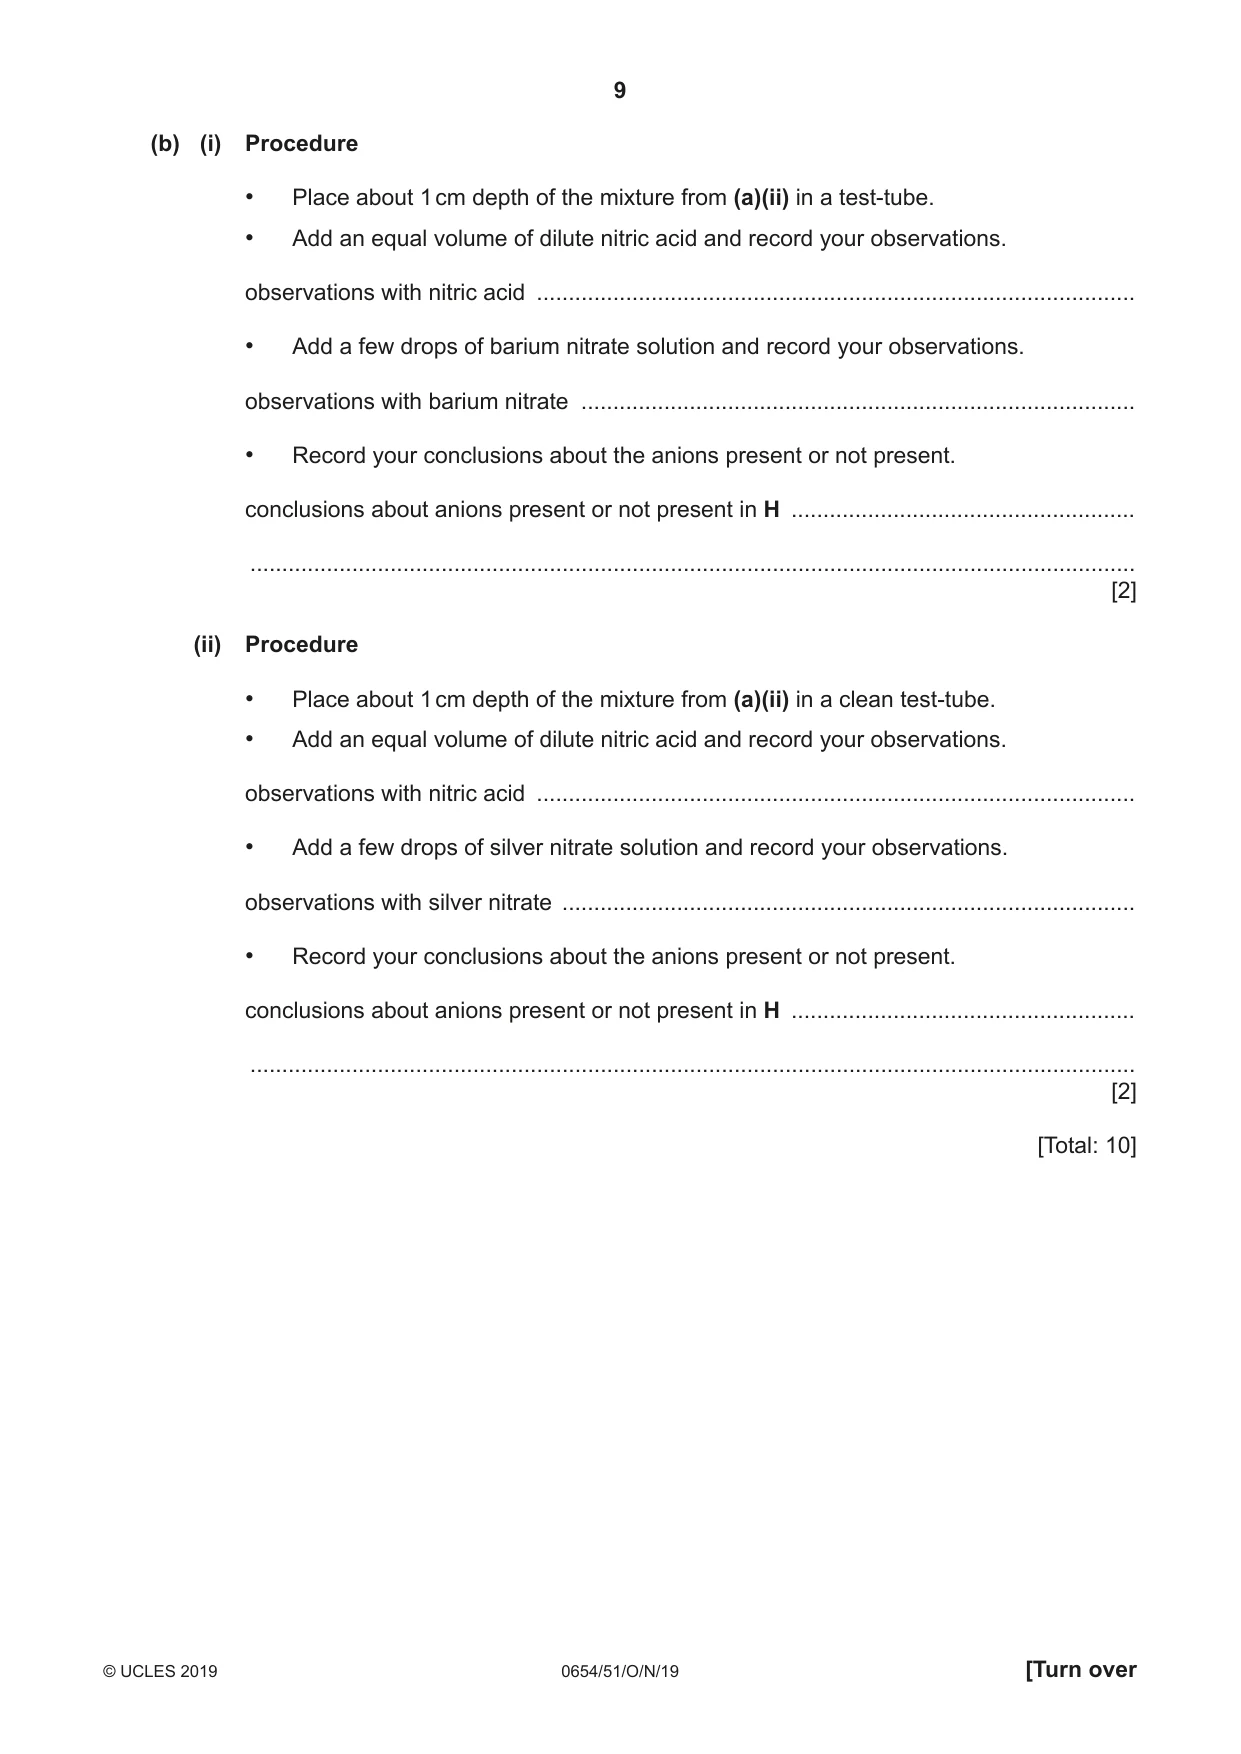
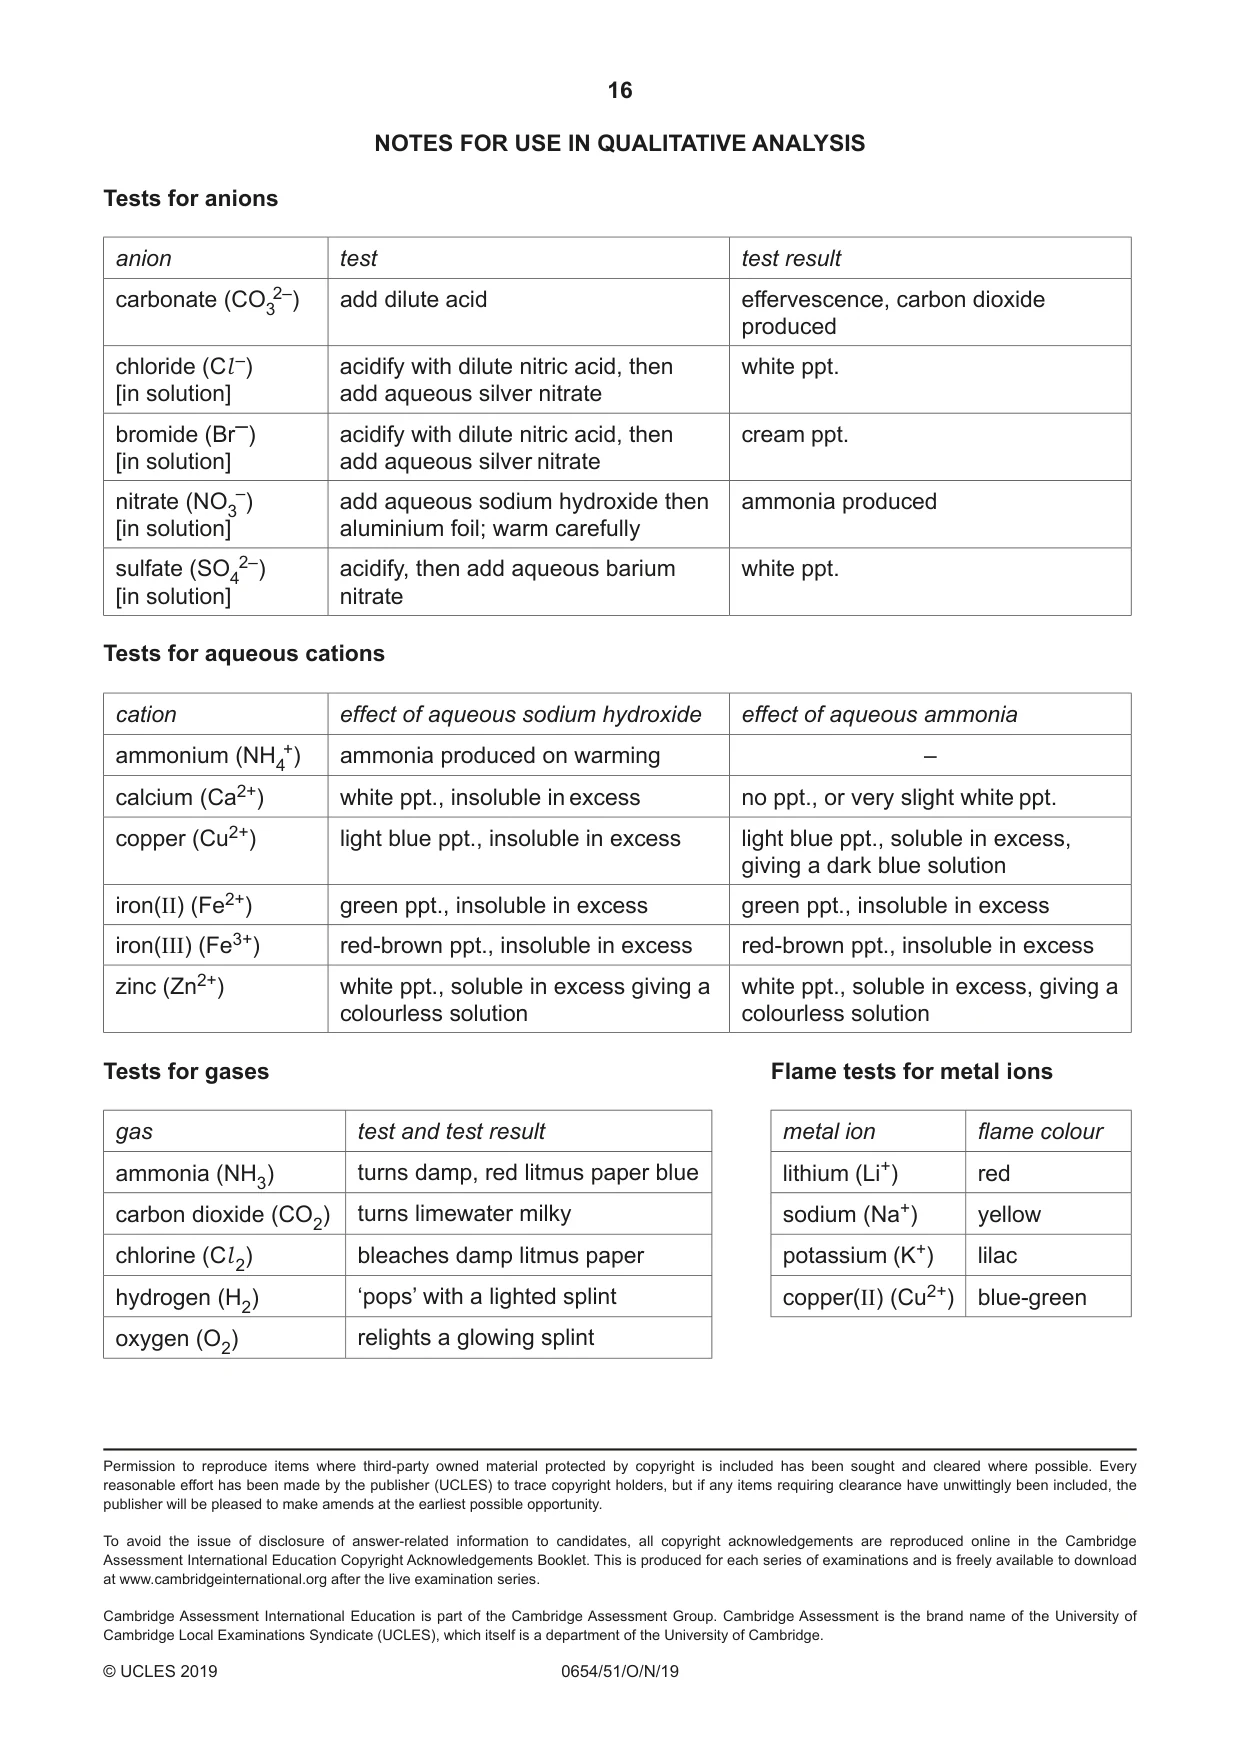
4 You are going to investigate the properties of compound H and identify the anion in H. (a) (i) Place about 25 cm3 of distilled water in the large test-tube. Measure and record the temperature T1 of this water to the nearest 0.5 °C. Keep the water for use in (a)(ii). T1 = .................................................... °C [1] (ii) Add all of compound H to the water in the large test-tube. Stir well and record, to the nearest 0.5 °C, the highest or lowest temperature T2 of the mixture. Describe the appearance of the resulting mixture. Keep this mixture for use in (b). T2 = .......................................................... °C appearance of mixture ...................................................................................................... ..................................................................................................................................... [2] (iii) Calculate the temperature change ΔT when H is added to the water in (a)(ii). Include a plus (+) or minus sign (−) as appropriate. ΔT = .................................................... °C [1] (iv) Use your observation in (a)(ii) and your answer in (a)(iii) to state two conclusions about what happens when H is mixed with water. conclusion 1 ...................................................................................................................... conclusion 2 ...................................................................................................................... [2] (b) (i) Procedure • Place about 1 cm depth of the mixture from (a)(ii) in a test-tube. • Add an equal volume of dilute nitric acid and record your observations. observations with nitric acid .............................................................................................. • Add a few drops of barium nitrate solution and record your observations. observations with barium nitrate ....................................................................................... • Record your conclusions about the anions present or not present. conclusions about anions present or not present in H ...................................................... ........................................................................................................................................... [2] (ii) Procedure • Place about 1 cm depth of the mixture from (a)(ii) in a clean test-tube. • Add an equal volume of dilute nitric acid and record your observations. observations with nitric acid .............................................................................................. • Add a few drops of silver nitrate solution and record your observations. observations with silver nitrate .......................................................................................... • Record your conclusions about the anions present or not present. conclusions about anions present or not present in H ...................................................... ........................................................................................................................................... [2] [Total: 10]
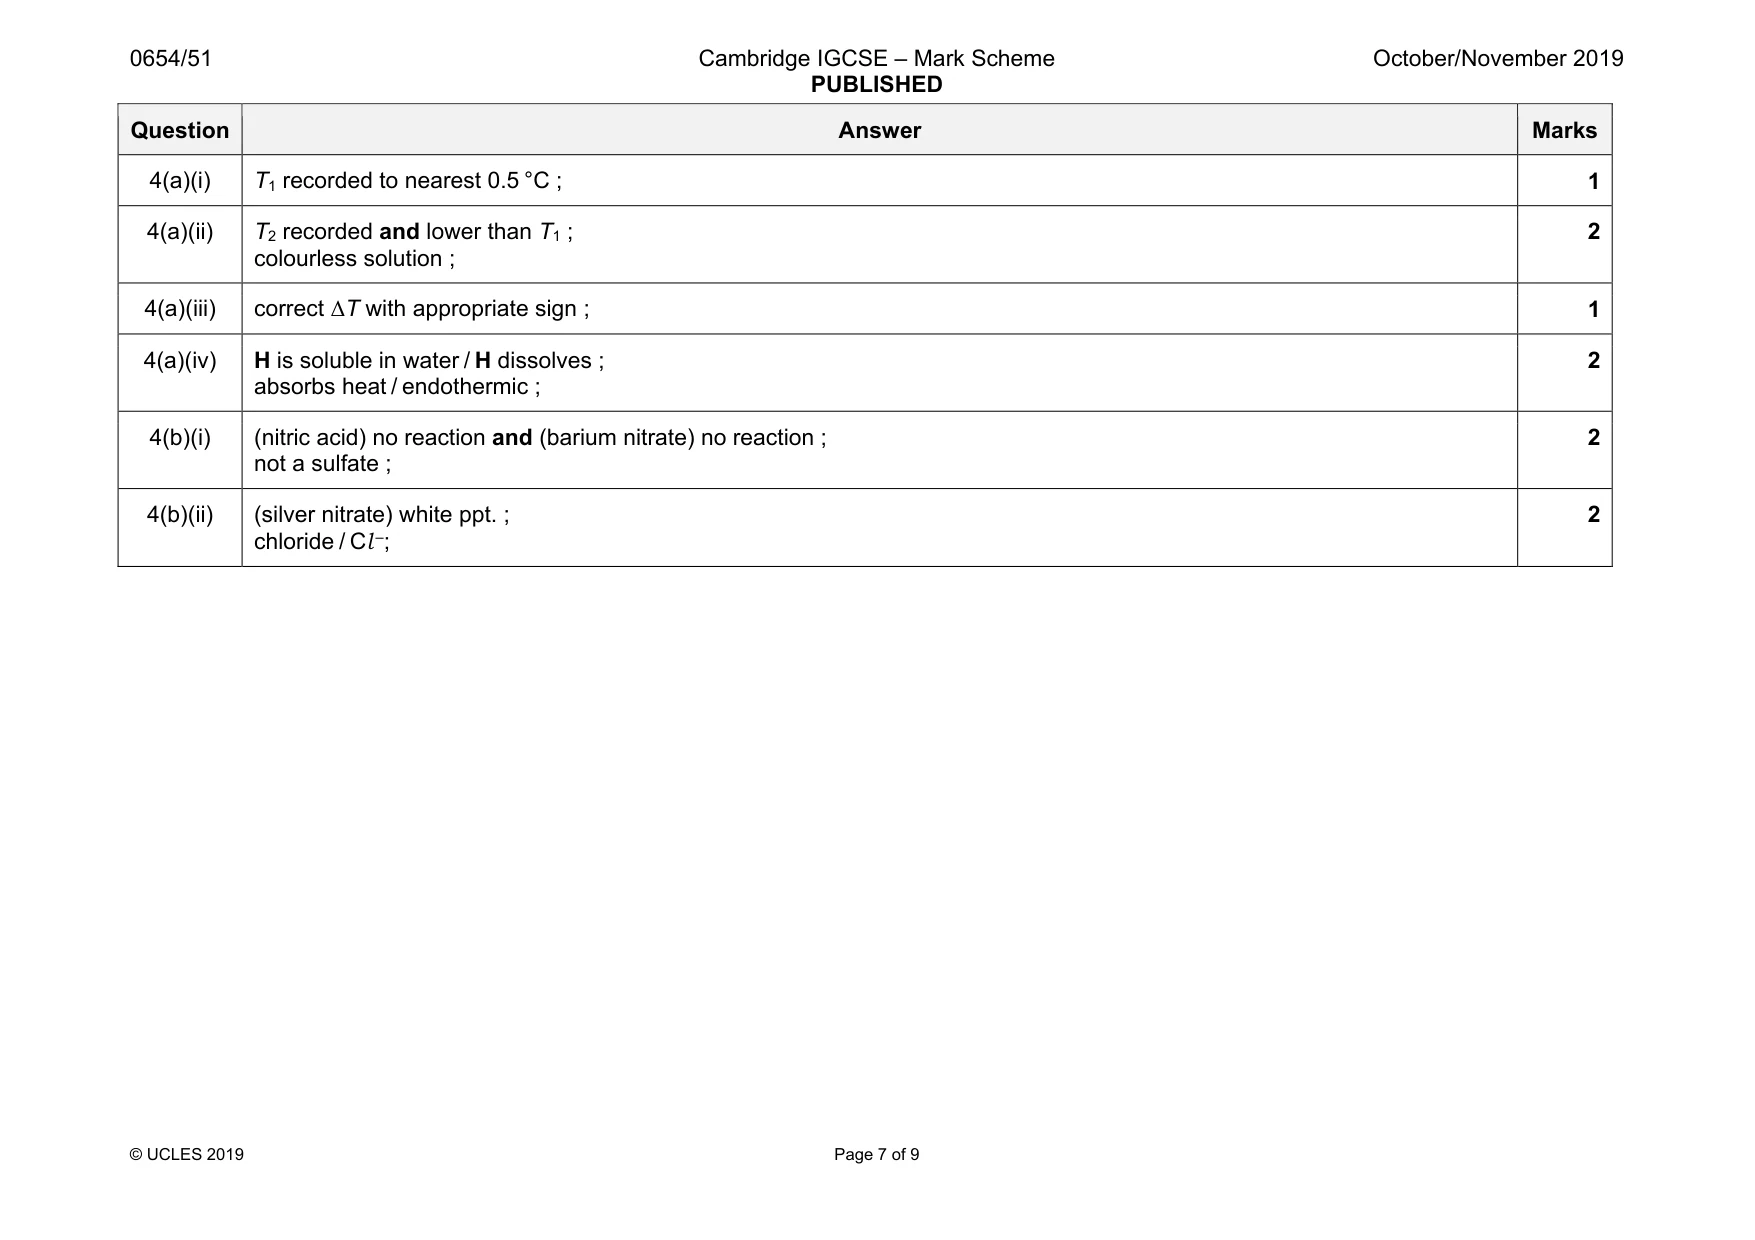
Mark scheme: 4(a)(i) T1 recorded to nearest 0.5 °C ; 1 4(a)(ii) T2 recorded and lower than T1 ; colourless solution ; 2 4(a)(iii) correct ∆T with appropriate sign ; 1 4(a)(iv) H is soluble in water / H dissolves ; absorbs heat / endothermic ; 2 4(b)(i) (nitric acid) no reaction and (barium nitrate) no reaction ; not a sulfate ; 2 4(b)(ii) (silver nitrate) white ppt. ; chloride / Cl –; 2
Q5 · You are going to calculate an approximate value for the density of modelling clay
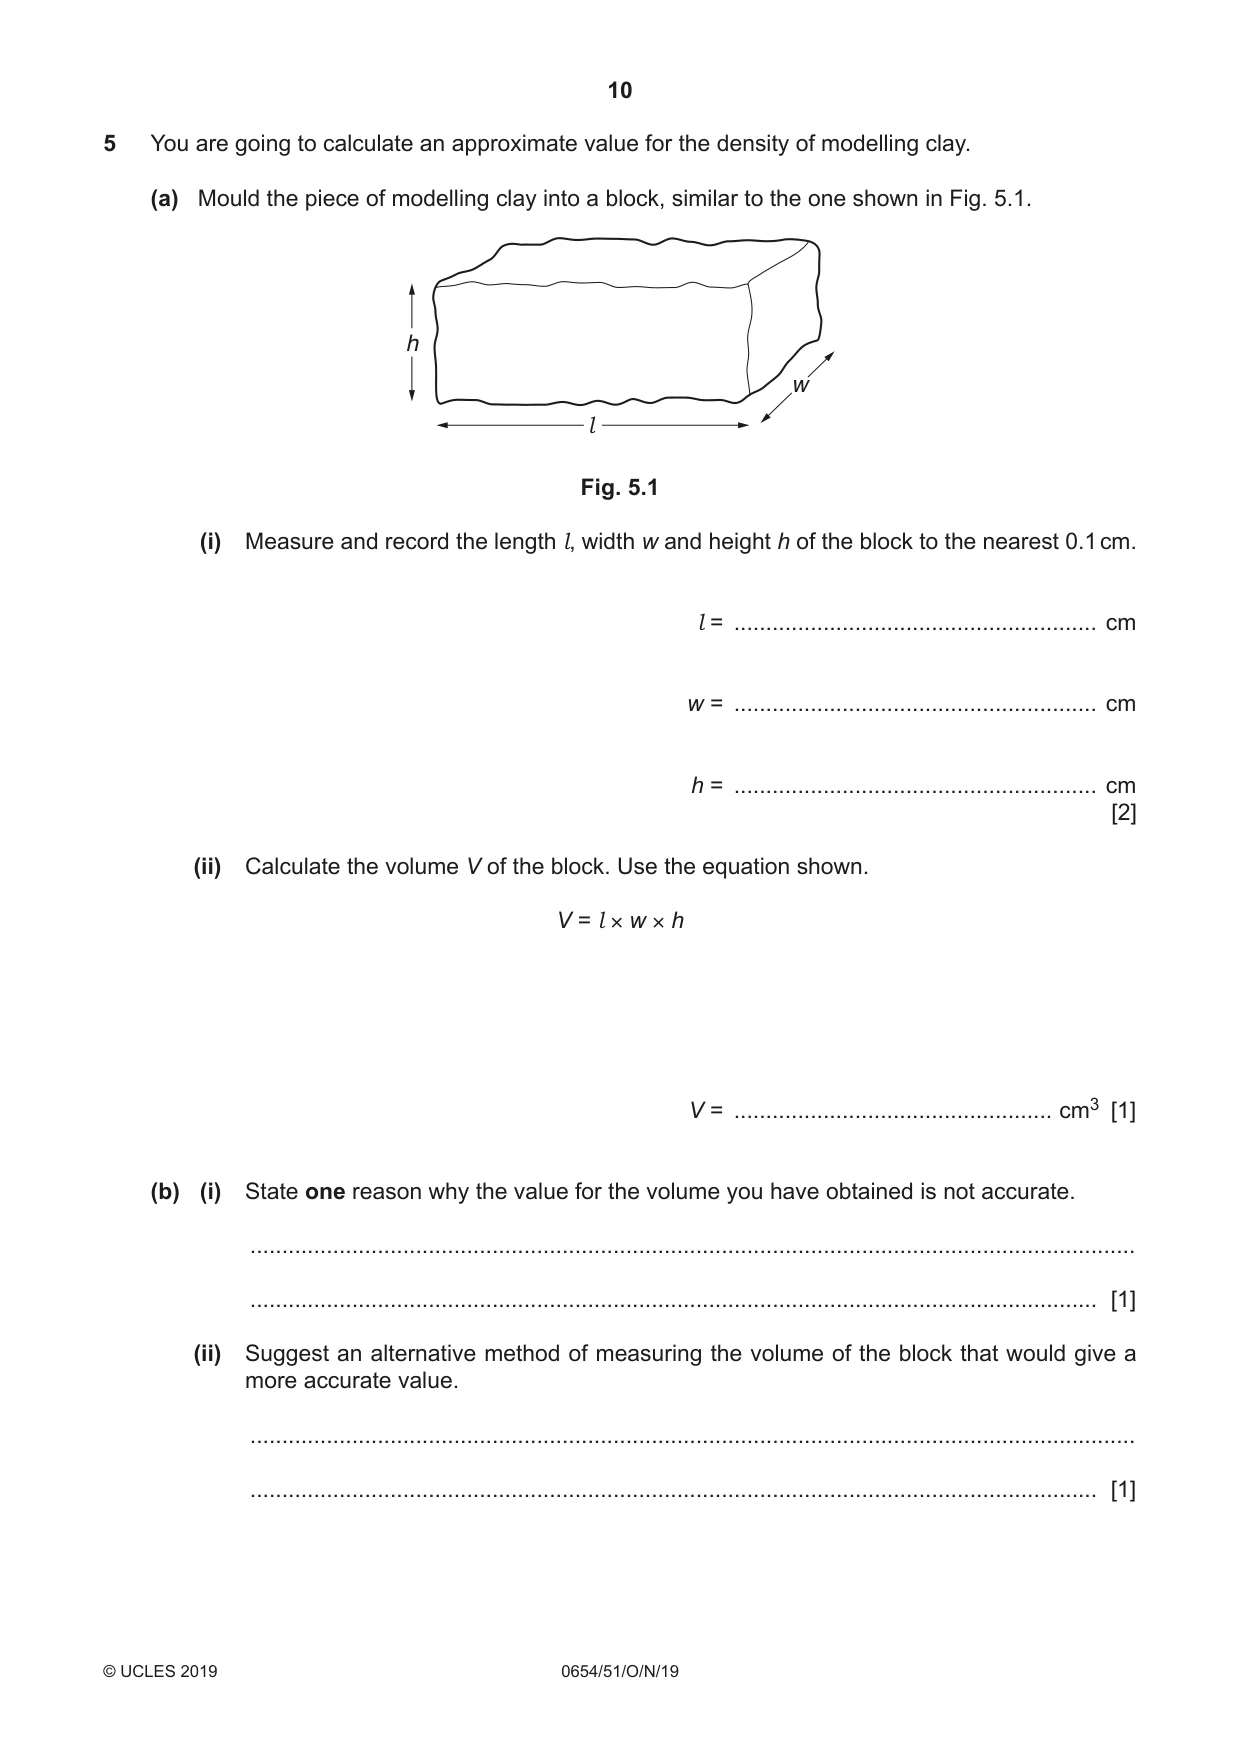
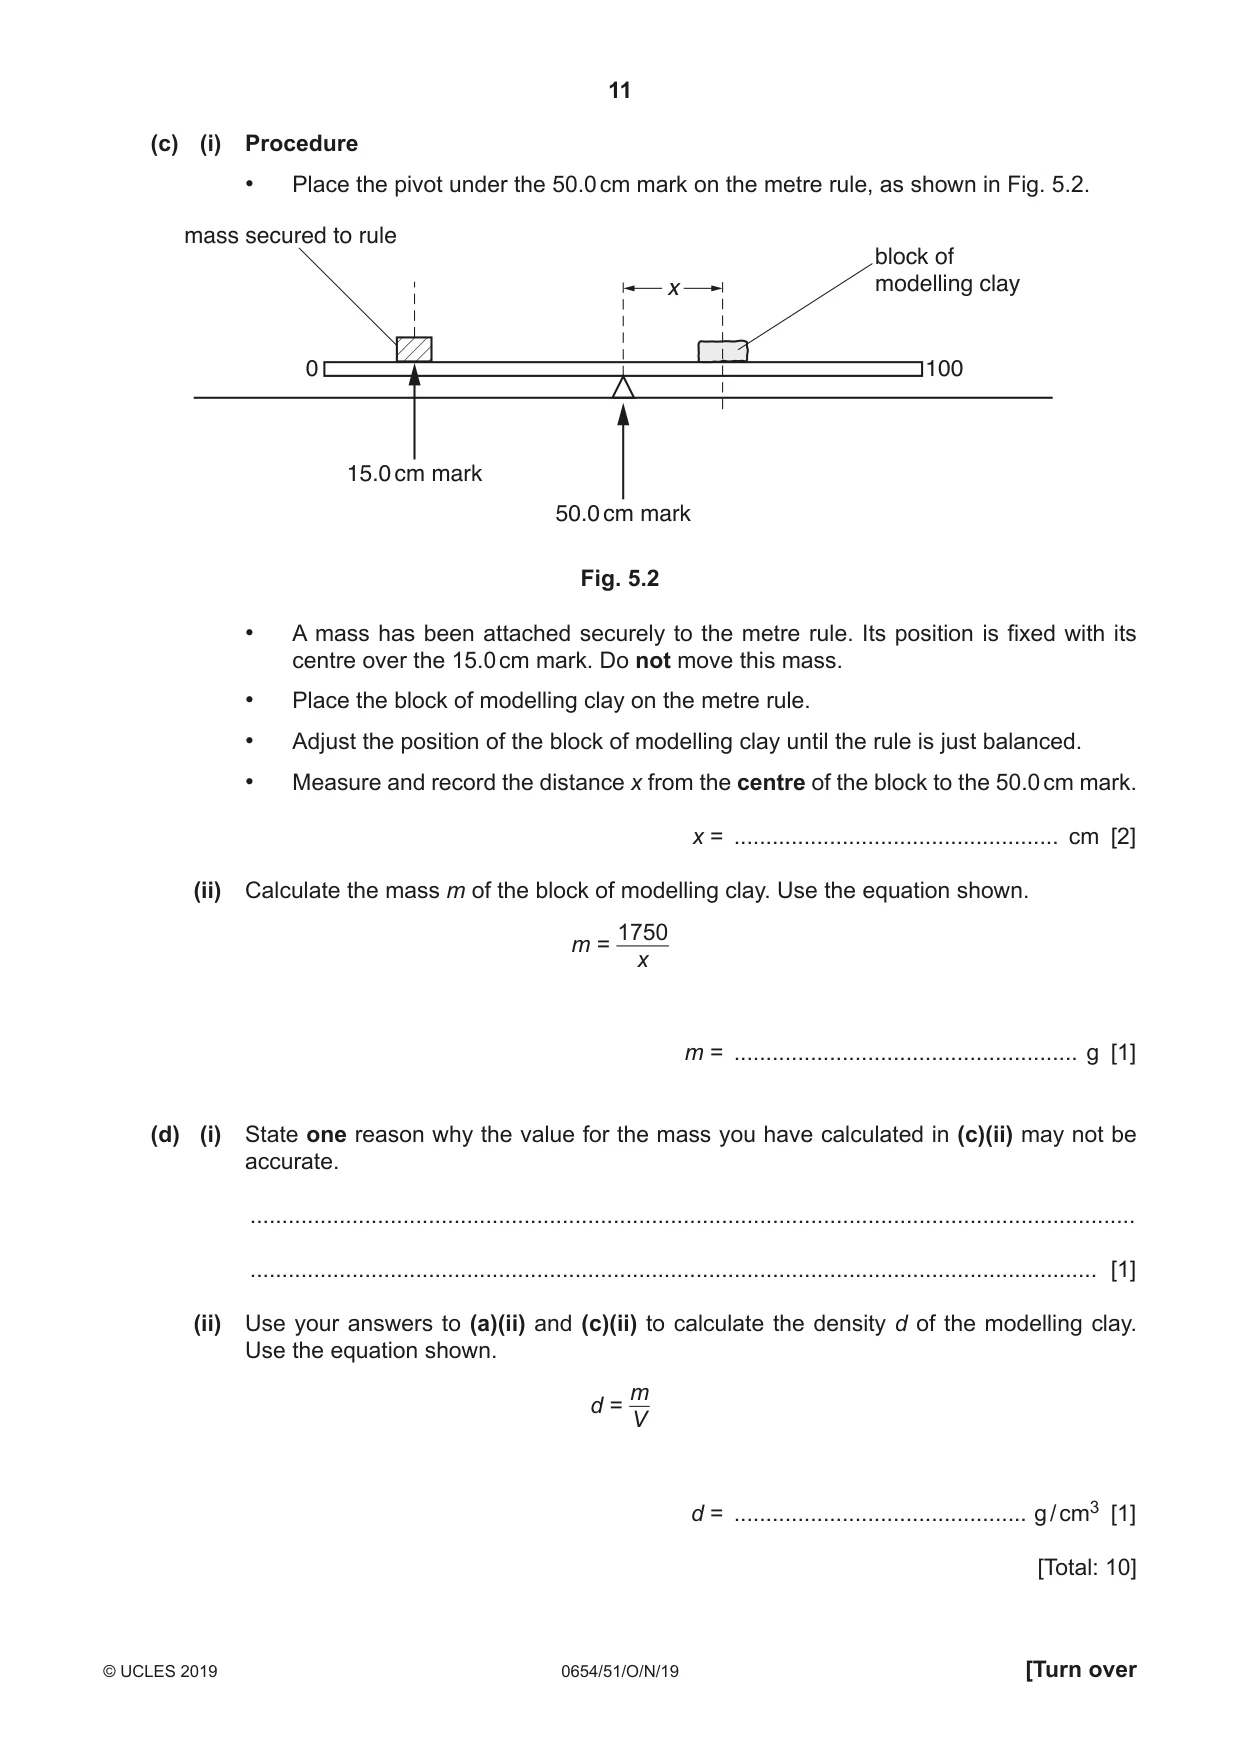
5 You are going to calculate an approximate value for the density of modelling clay. (a) Mould the piece of modelling clay into a block, similar to the one shown in Fig. 5.1. h w l Fig. 5.1 (i) Measure and record the length l, width w and height h of the block to the nearest 0.1 cm. l = ......................................................... cm w = ......................................................... cm h = ......................................................... cm [2] (ii) Calculate the volume V of the block. Use the equation shown. V = l × w × h V = .................................................. cm3 [1] (b) (i) State one reason why the value for the volume you have obtained is not accurate. ........................................................................................................................................... ..................................................................................................................................... [1] (ii) Suggest an alternative method of measuring the volume of the block that would give a more accurate value. ........................................................................................................................................... ..................................................................................................................................... [1] (c) (i) Procedure • Place the pivot under the 50.0 cm mark on the metre rule, as shown in Fig. 5.2. mass secured to rule block of x modelling clay 0 100 15.0 cm mark 50.0 cm mark Fig. 5.2 • A mass has been attached securely to the metre rule. Its position is fixed with its centre over the 15.0 cm mark. Do not move this mass. • Place the block of modelling clay on the metre rule. • Adjust the position of the block of modelling clay until the rule is just balanced. • Measure and record the distance x from the centre of the block to the 50.0 cm mark. x = ................................................... cm [2] (ii) Calculate the mass m of the block of modelling clay. Use the equation shown. 1750 m = x m = ...................................................... g [1] (d) (i) State one reason why the value for the mass you have calculated in (c)(ii) may not be accurate. ........................................................................................................................................... ..................................................................................................................................... [1] (ii) Use your answers to (a)(ii) and (c)(ii) to calculate the density d of the modelling clay. Use the equation shown. m d = V d = .............................................. g / cm3 [1] [Total: 10]
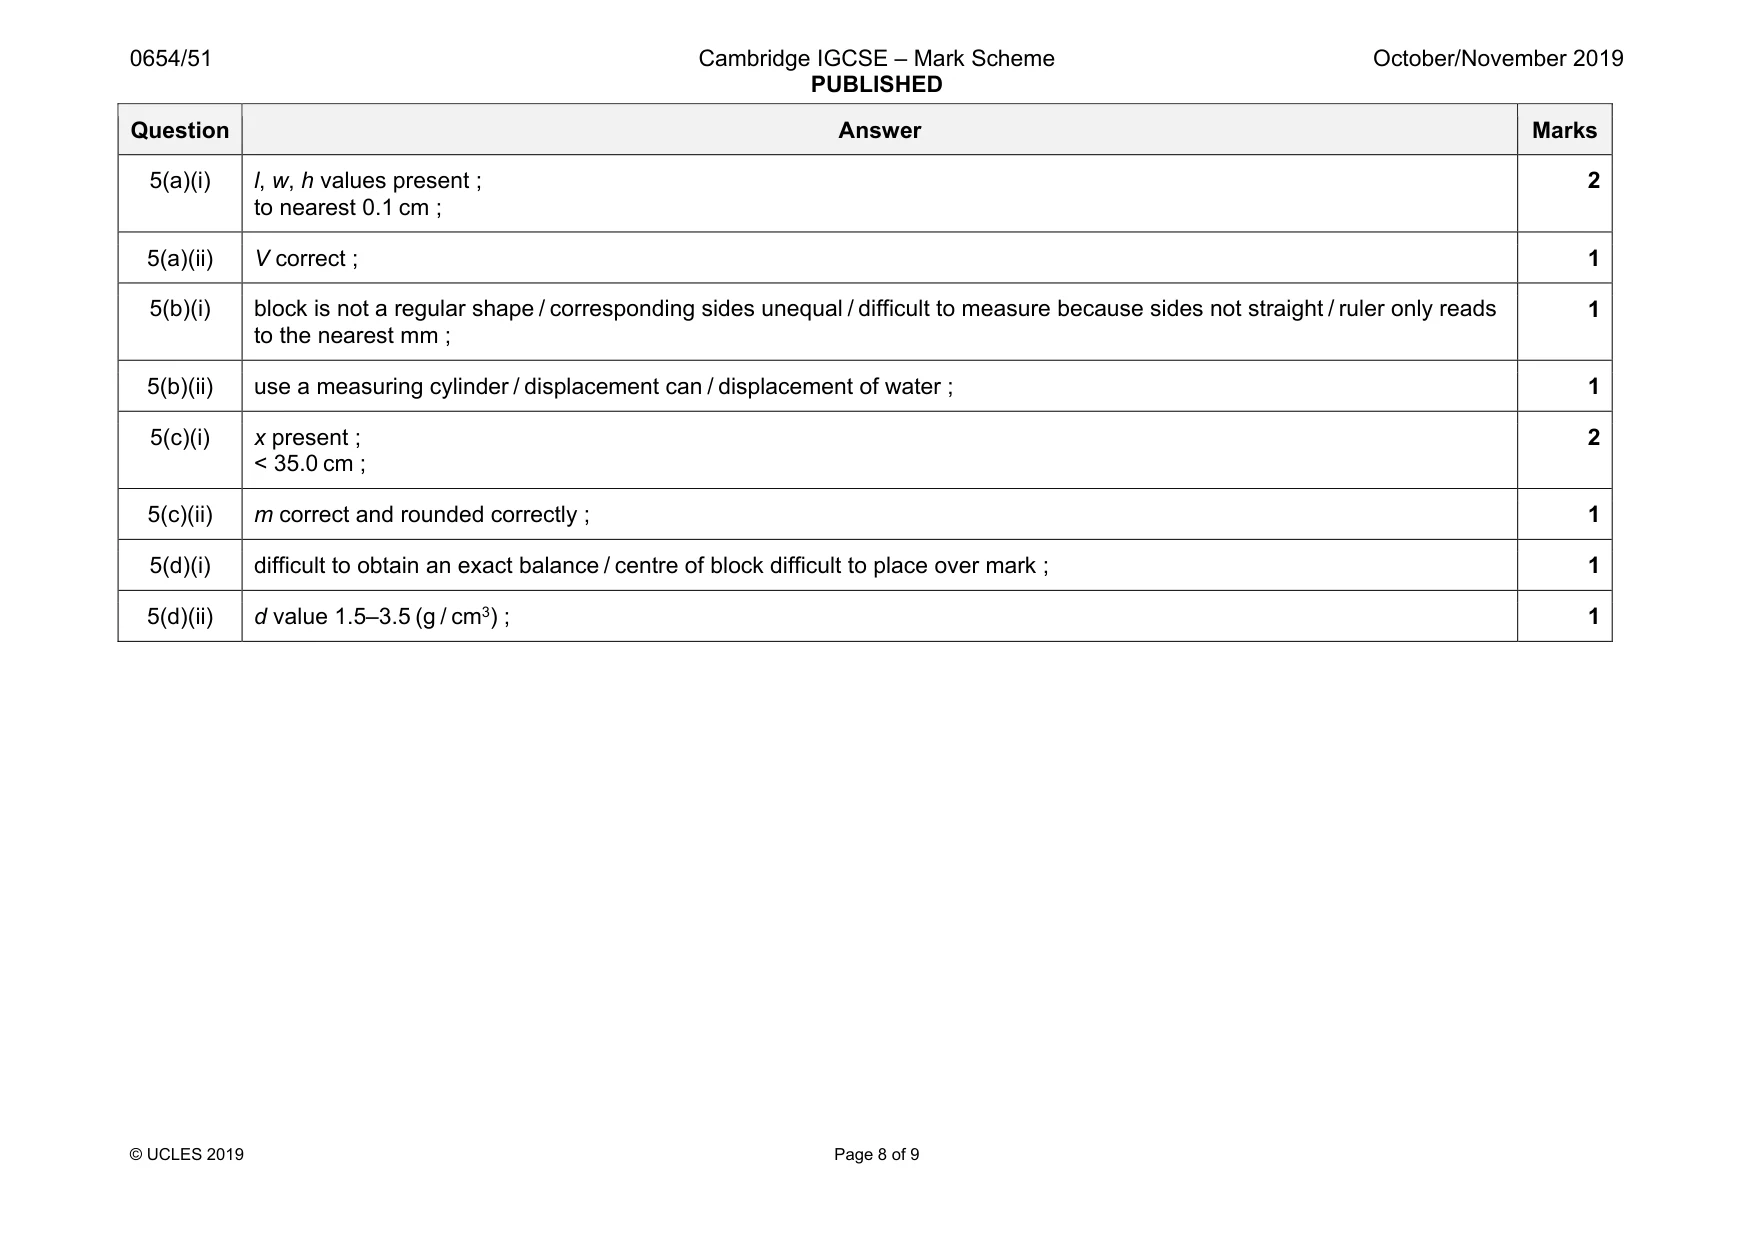
Mark scheme: 5(a)(i) l, w, h values present ; to nearest 0.1 cm ; 2 5(a)(ii) V correct ; 1 5(b)(i) block is not a regular shape / corresponding sides unequal / difficult to measure because sides not straight / ruler only reads to the nearest mm ; 1 5(b)(ii) use a measuring cylinder / displacement can / displacement of water ; 1 5(c)(i) x present ; < 35.0 cm ; 2 5(c)(ii) m correct and rounded correctly ; 1 5(d)(i) difficult to obtain an exact balance / centre of block difficult to place over mark ; 1 5(d)(ii) d value 1.5–3.5 (g / cm3) ; 1
Q6 · You are going to investigate how the resistance of a wire depends upon its length
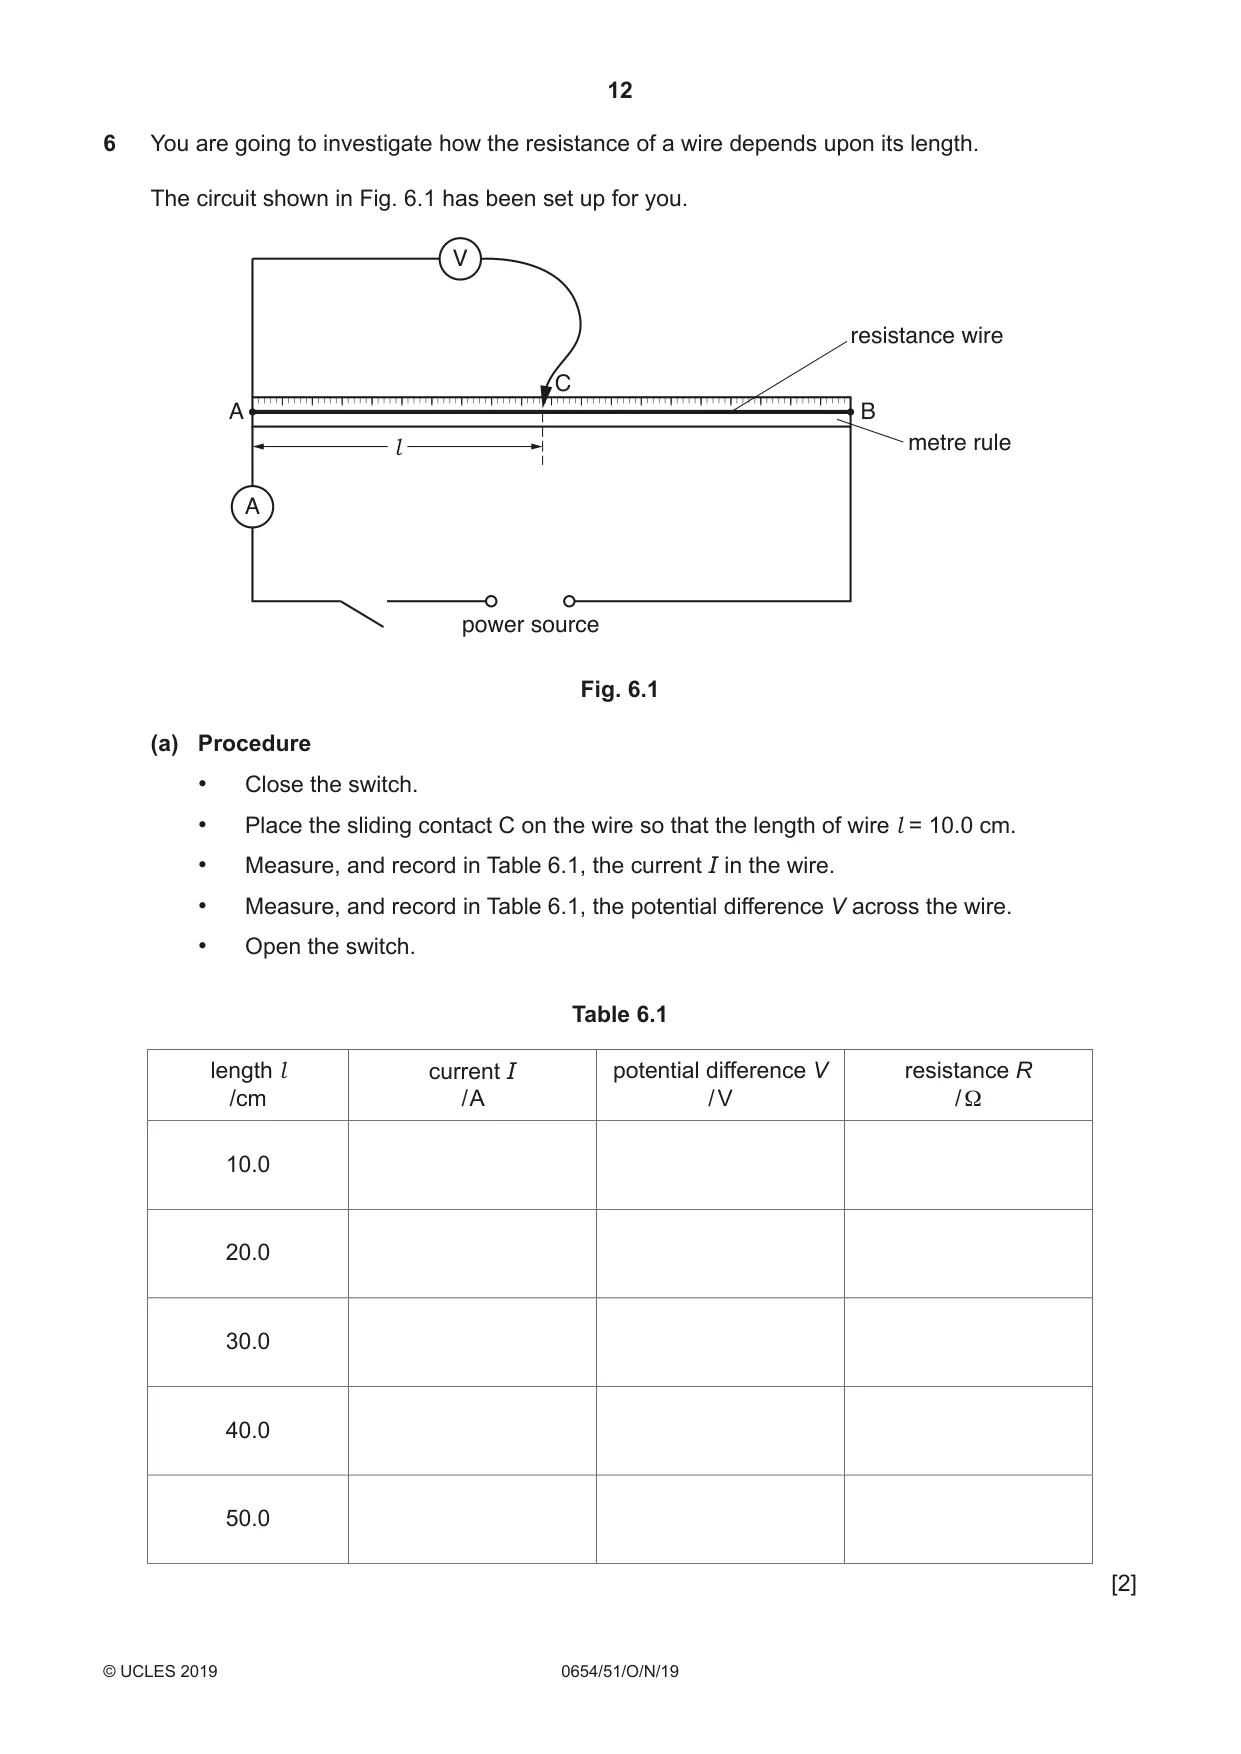
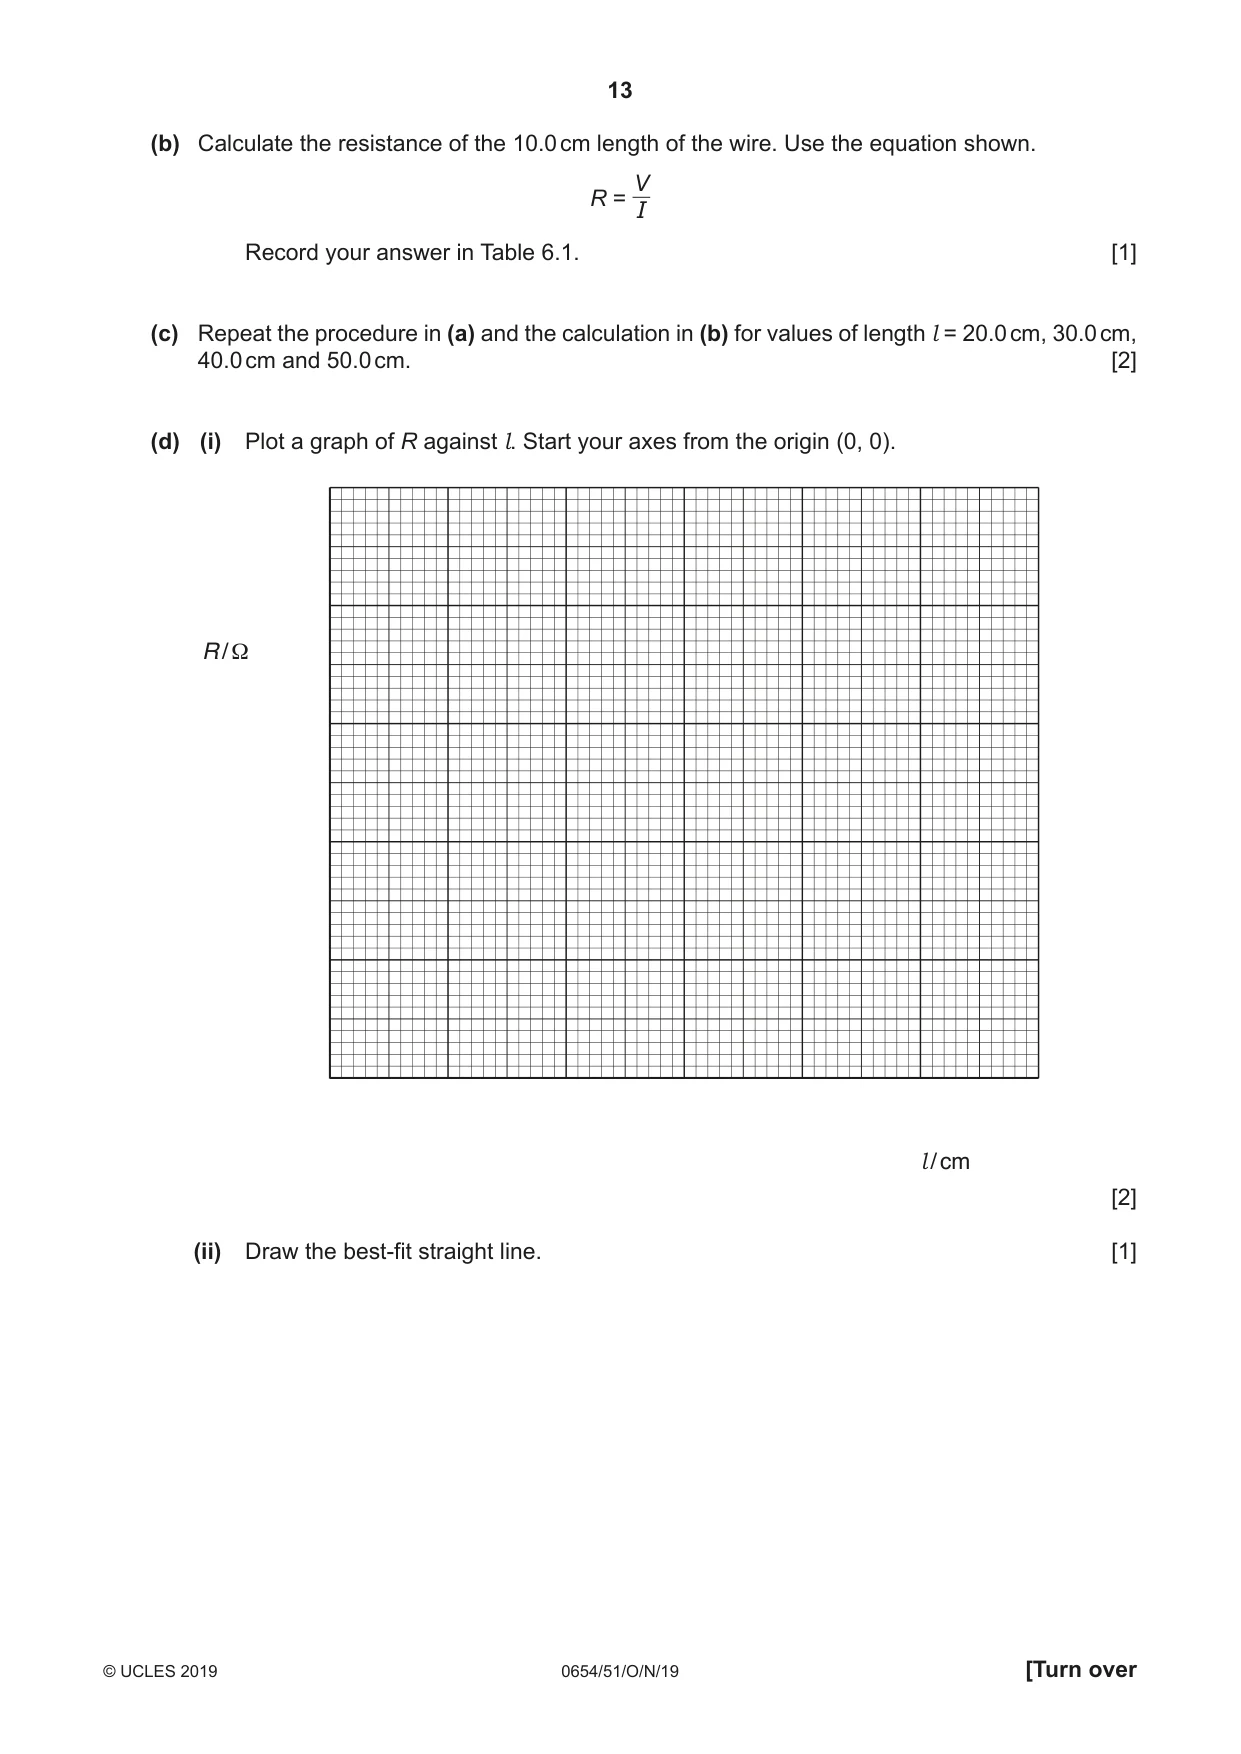
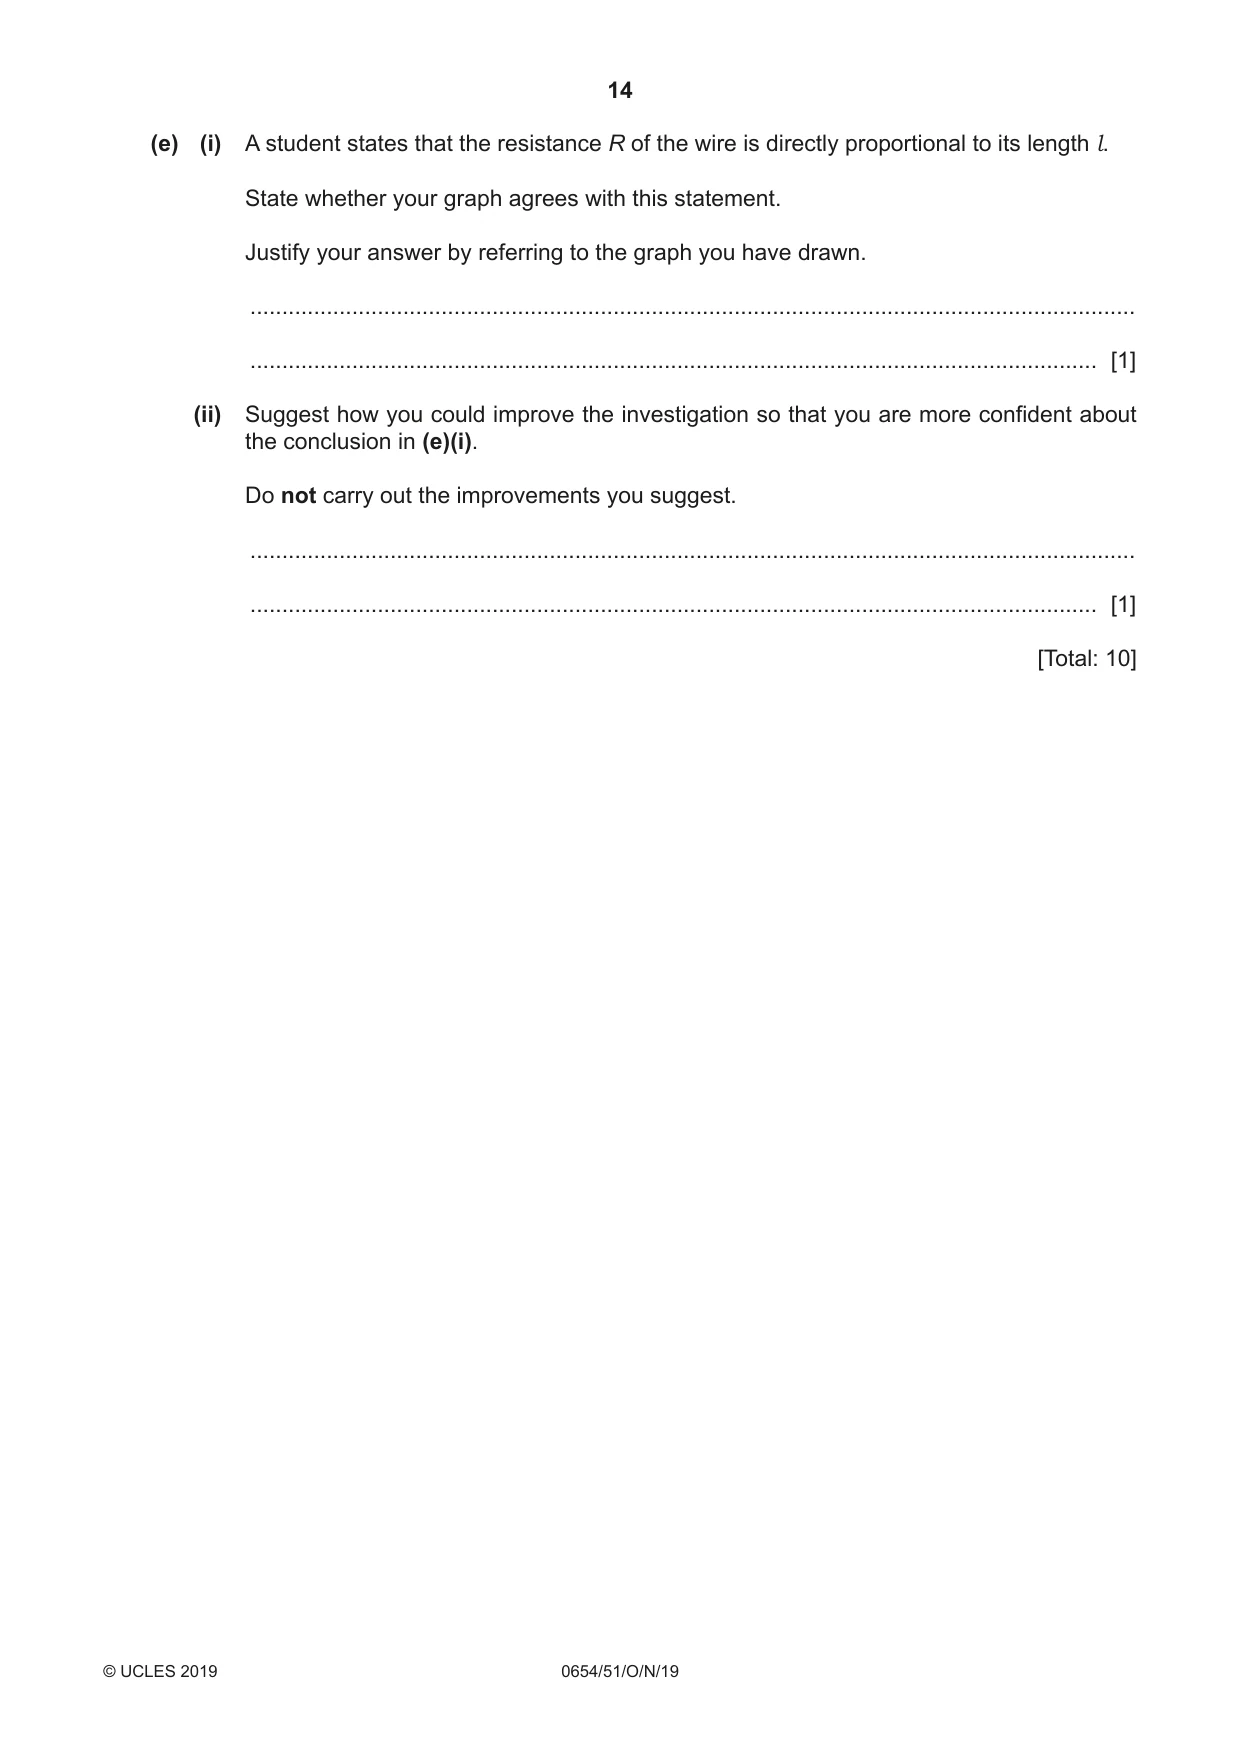
6 You are going to investigate how the resistance of a wire depends upon its length. The circuit shown in Fig. 6.1 has been set up for you. V resistance wire C A B l metre rule A power source Fig. 6.1 (a) Procedure • Close the switch. • Place the sliding contact C on the wire so that the length of wire l = 10.0 cm. • Measure, and record in Table 6.1, the current I in the wire. • Measure, and record in Table 6.1, the potential difference V across the wire. • Open the switch. Table 6.1 length l current I potential difference V resistance R /cm / A / V / Ω 10.0 20.0 30.0 40.0 50.0 [2] (b) Calculate the resistance of the 10.0 cm length of the wire. Use the equation shown. V R = I Record your answer in Table 6.1. [1] (c) Repeat the procedure in (a) and the calculation in (b) for values of length l = 20.0 cm, 30.0 cm, 40.0 cm and 50.0 cm. [2] (d) (i) Plot a graph of R against l. Start your axes from the origin (0, 0). R / Ω l / cm [2] (ii) Draw the best-fit straight line. [1] (e) (i) A student states that the resistance R of the wire is directly proportional to its length l. State whether your graph agrees with this statement. Justify your answer by referring to the graph you have drawn. ........................................................................................................................................... ..................................................................................................................................... [1] (ii) Suggest how you could improve the investigation so that you are more confident about the conclusion in (e)(i). Do not carry out the improvements you suggest. ........................................................................................................................................... ..................................................................................................................................... [1] [Total: 10]
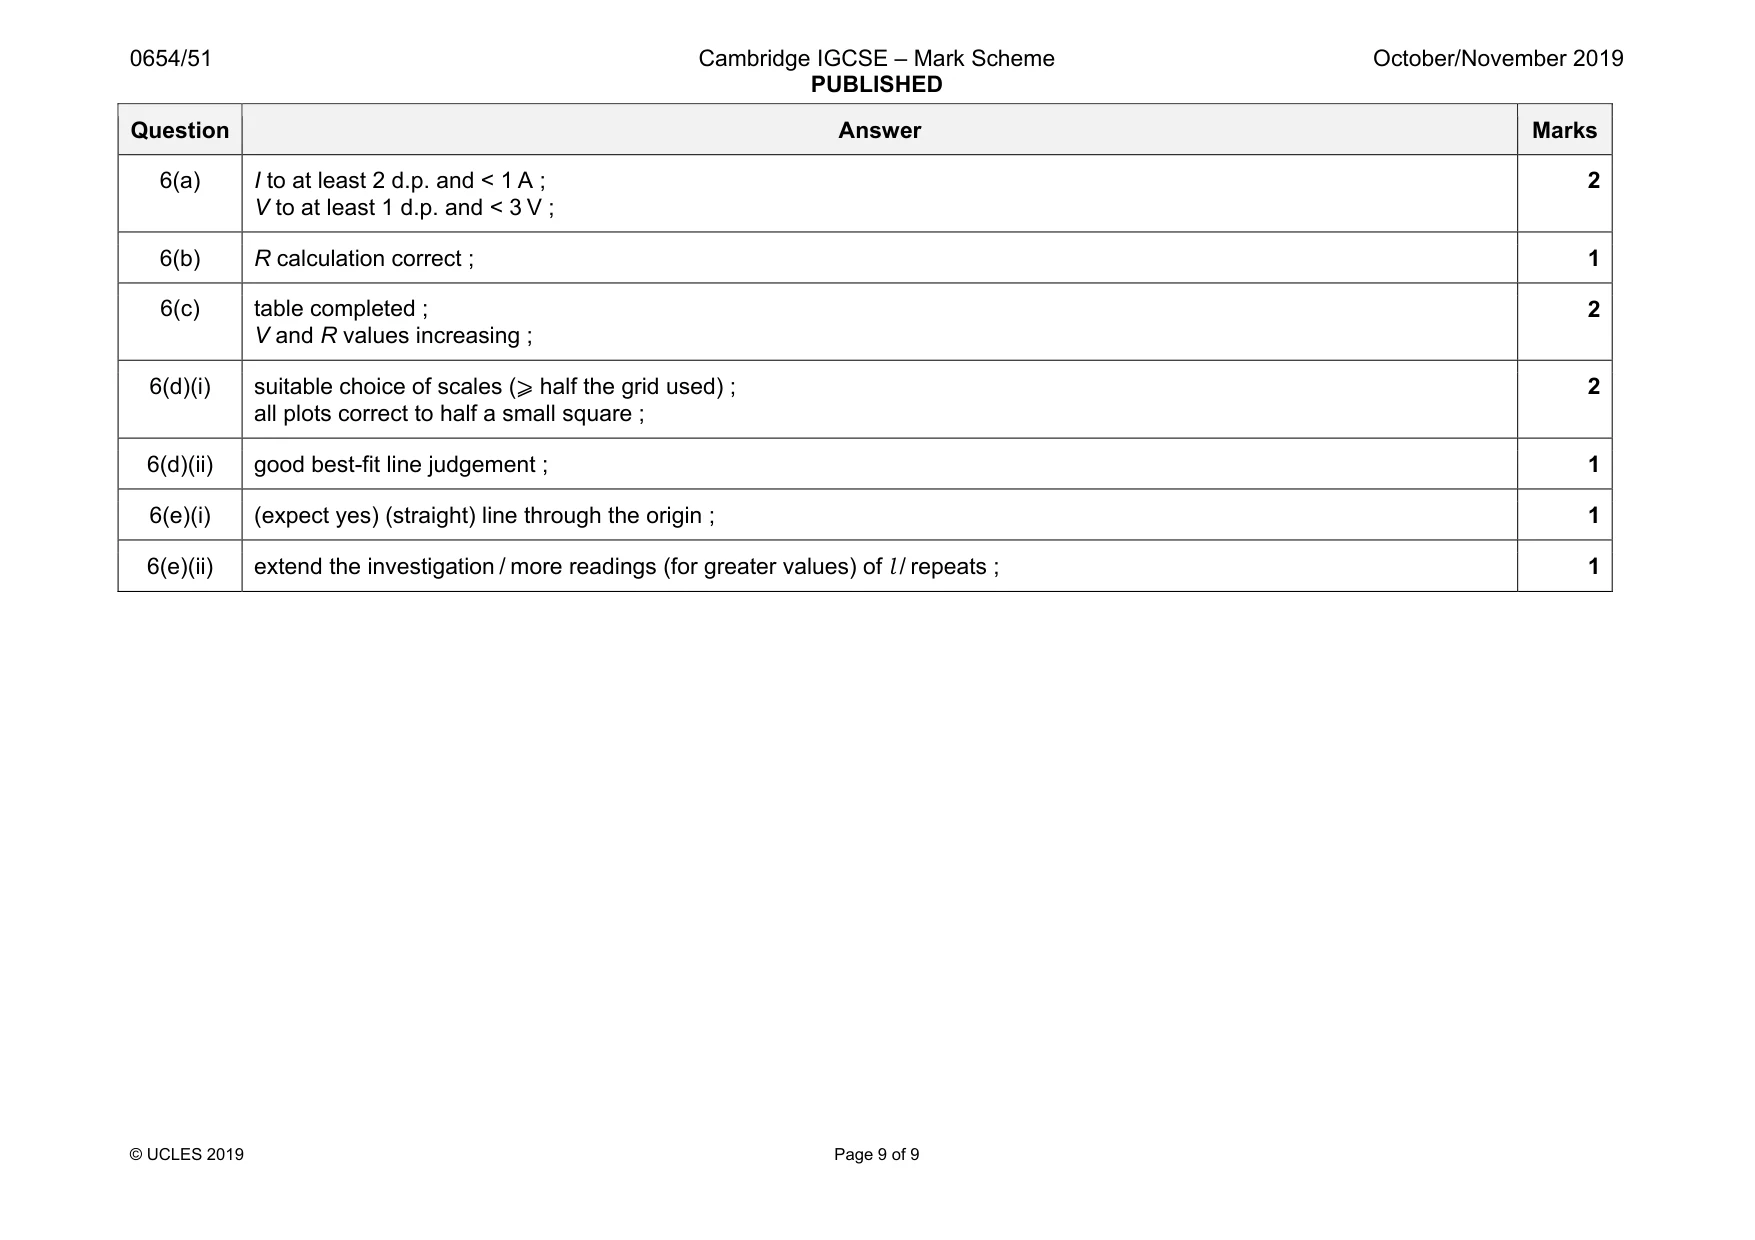
Mark scheme: 6(a) I to at least 2 d.p. and < 1 A ; V to at least 1 d.p. and < 3 V ; 2 6(b) R calculation correct ; 1 6(c) table completed ; V and R values increasing ; 2 6(d)(i) suitable choice of scales (⩾ half the grid used) ; all plots correct to half a small square ; 2 6(d)(ii) good best-fit line judgement ; 1 6(e)(i) (expect yes) (straight) line through the origin ; 1 6(e)(ii) extend the investigation / more readings (for greater values) of l / repeats ; 1
What was in this paper
The subtopics covered by these 6 questions, and how many questions each got. Open one in a new tab to see every Cambridge question on it.
What you needed in this session
Cambridge’s own grade thresholds for 2019 Oct/Nov, Paper 5 · Variant 1. A higher threshold means an easier paper — the bar moves with how the cohort did.