Cambridge IGCSE Sciences - Co-ordinated (Double) 0654 — 2017 Oct/Nov Paper 5 · Variant 3
0654/53/O/N/17 · 3 questions · 45 marks · ≈51 min
The question paper and its mark scheme, free to read here and free to download. This is Cambridge’s own paper, exactly as it was sat.
Question paper12 pages


Mark scheme5 pages
Answers below. Sit the paper first if you are practising.
Questions as text
Q1 · You are going to investigate an enzyme-catalysed reaction
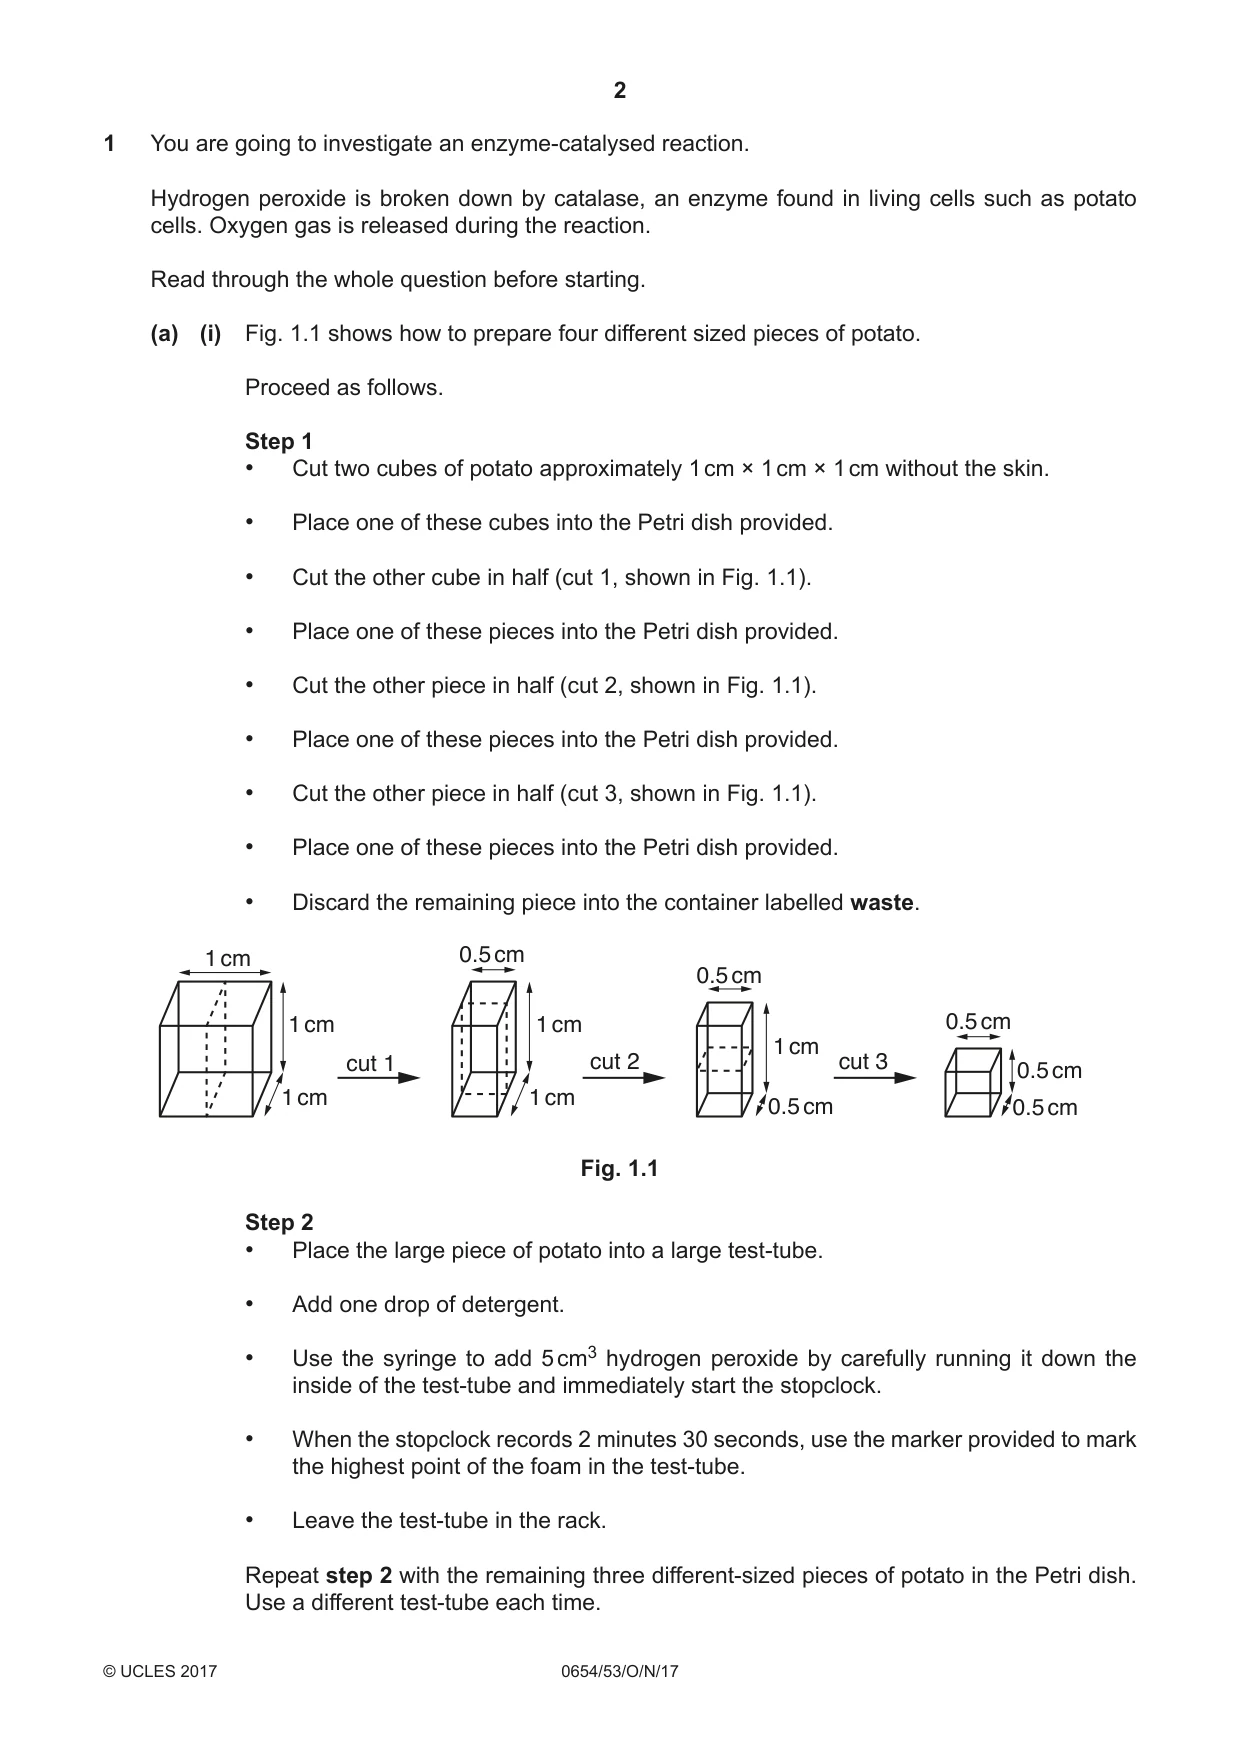
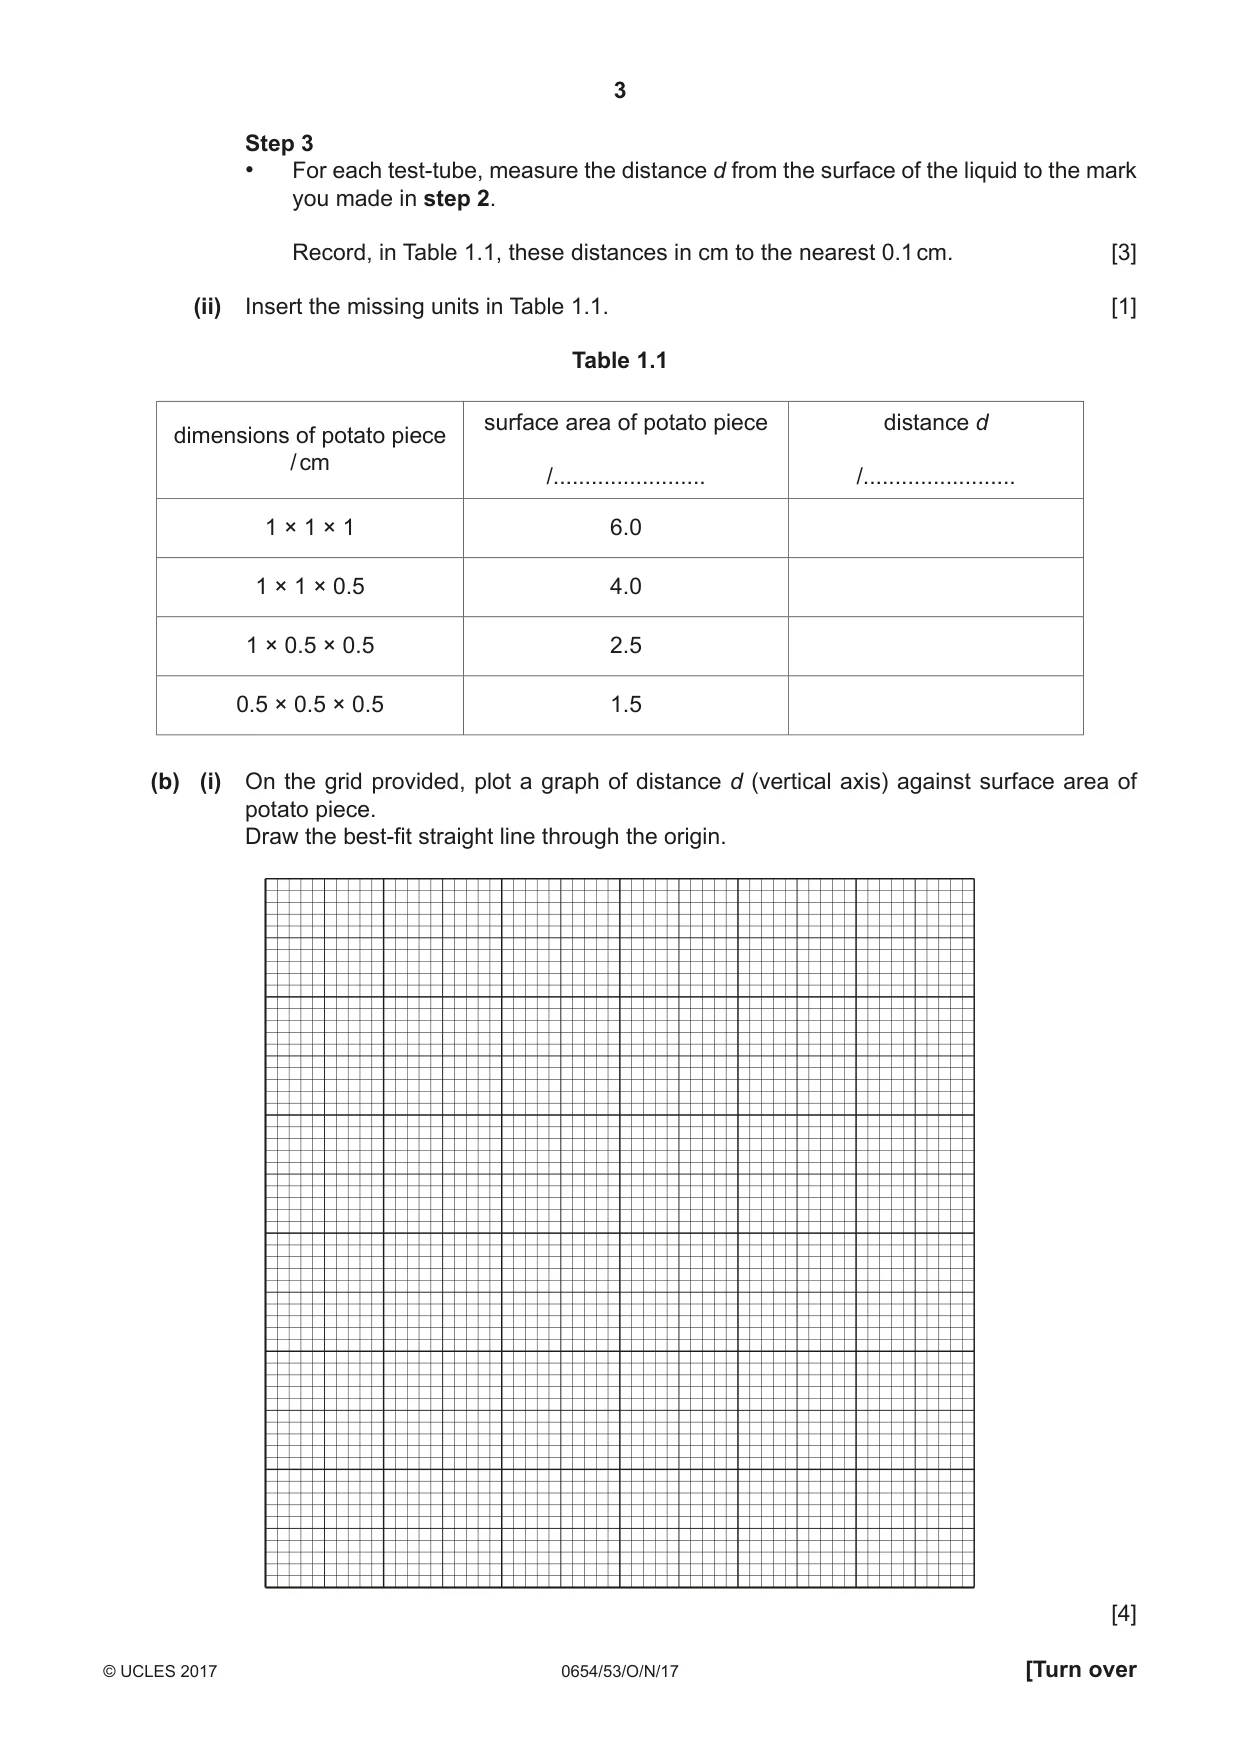
1 You are going to investigate an enzyme-catalysed reaction. Hydrogen peroxide is broken down by catalase, an enzyme found in living cells such as potato cells. Oxygen gas is released during the reaction. Read through the whole question before starting. (a) (i) Fig. 1.1 shows how to prepare four different sized pieces of potato. Proceed as follows. Step 1 • Cut two cubes of potato approximately 1 cm × 1 cm × 1 cm without the skin. • Place one of these cubes into the Petri dish provided. • Cut the other cube in half (cut 1, shown in Fig. 1.1). • Place one of these pieces into the Petri dish provided. • Cut the other piece in half (cut 2, shown in Fig. 1.1). • Place one of these pieces into the Petri dish provided. • Cut the other piece in half (cut 3, shown in Fig. 1.1). • Place one of these pieces into the Petri dish provided. • Discard the remaining piece into the container labelled waste. 1 cm 0.5 cm 0.5 cm 1 cm 1 cm 0.5 cm 1 cm cut 1 cut 2 cut 3 0.5 cm 1 cm 1 cm 0.5 cm 0.5 cm Fig. 1.1 Step 2 • Place the large piece of potato into a large test-tube. • Add one drop of detergent. • Use the syringe to add 5 cm3 hydrogen peroxide by carefully running it down the inside of the test-tube and immediately start the stopclock. • When the stopclock records 2 minutes 30 seconds, use the marker provided to mark the highest point of the foam in the test-tube. • Leave the test-tube in the rack. Repeat step 2 with the remaining three different-sized pieces of potato in the Petri dish. Use a different test-tube each time. Step 3 • For each test-tube, measure the distance d from the surface of the liquid to the mark you made in step 2. Record, in Table 1.1, these distances in cm to the nearest 0.1 cm. [3] (ii) Insert the missing units in Table 1.1. [1] Table 1.1 surface area of potato piece distance d dimensions of potato piece / cm /........................ /........................ 1 × 1 × 1 6.0 1 × 1 × 0.5 4.0 1 × 0.5 × 0.5 2.5 0.5 × 0.5 × 0.5 1.5 (b) (i) On the grid provided, plot a graph of distance d (vertical axis) against surface area of potato piece. Draw the best-fit straight line through the origin. [4] (ii) Use your graph to state the relationship between the amount of enzyme and the rate of reaction. ........................................................................................................................................... .......................................................................................................................................[1] (iii) Use your graph to predict the distance d for a piece of potato with a surface area of 3.0. Mark on the graph how you did this. d = ...........................................................[2] (c) Describe how you could confirm that the gas produced in this reaction is oxygen. test ............................................................................................................................................ observation ............................................................................................................................... [1] (d) During this experiment, the volume of hydrogen peroxide was kept constant for each piece of potato. Identify two other variables that should be kept constant. variable 1 .................................................................................................................................. variable 2 .................................................................................................................................. [2] (e) The rate of reaction is more dependent on the surface area of the potato than on its volume. Explain why. ................................................................................................................................................... ...............................................................................................................................................[1]
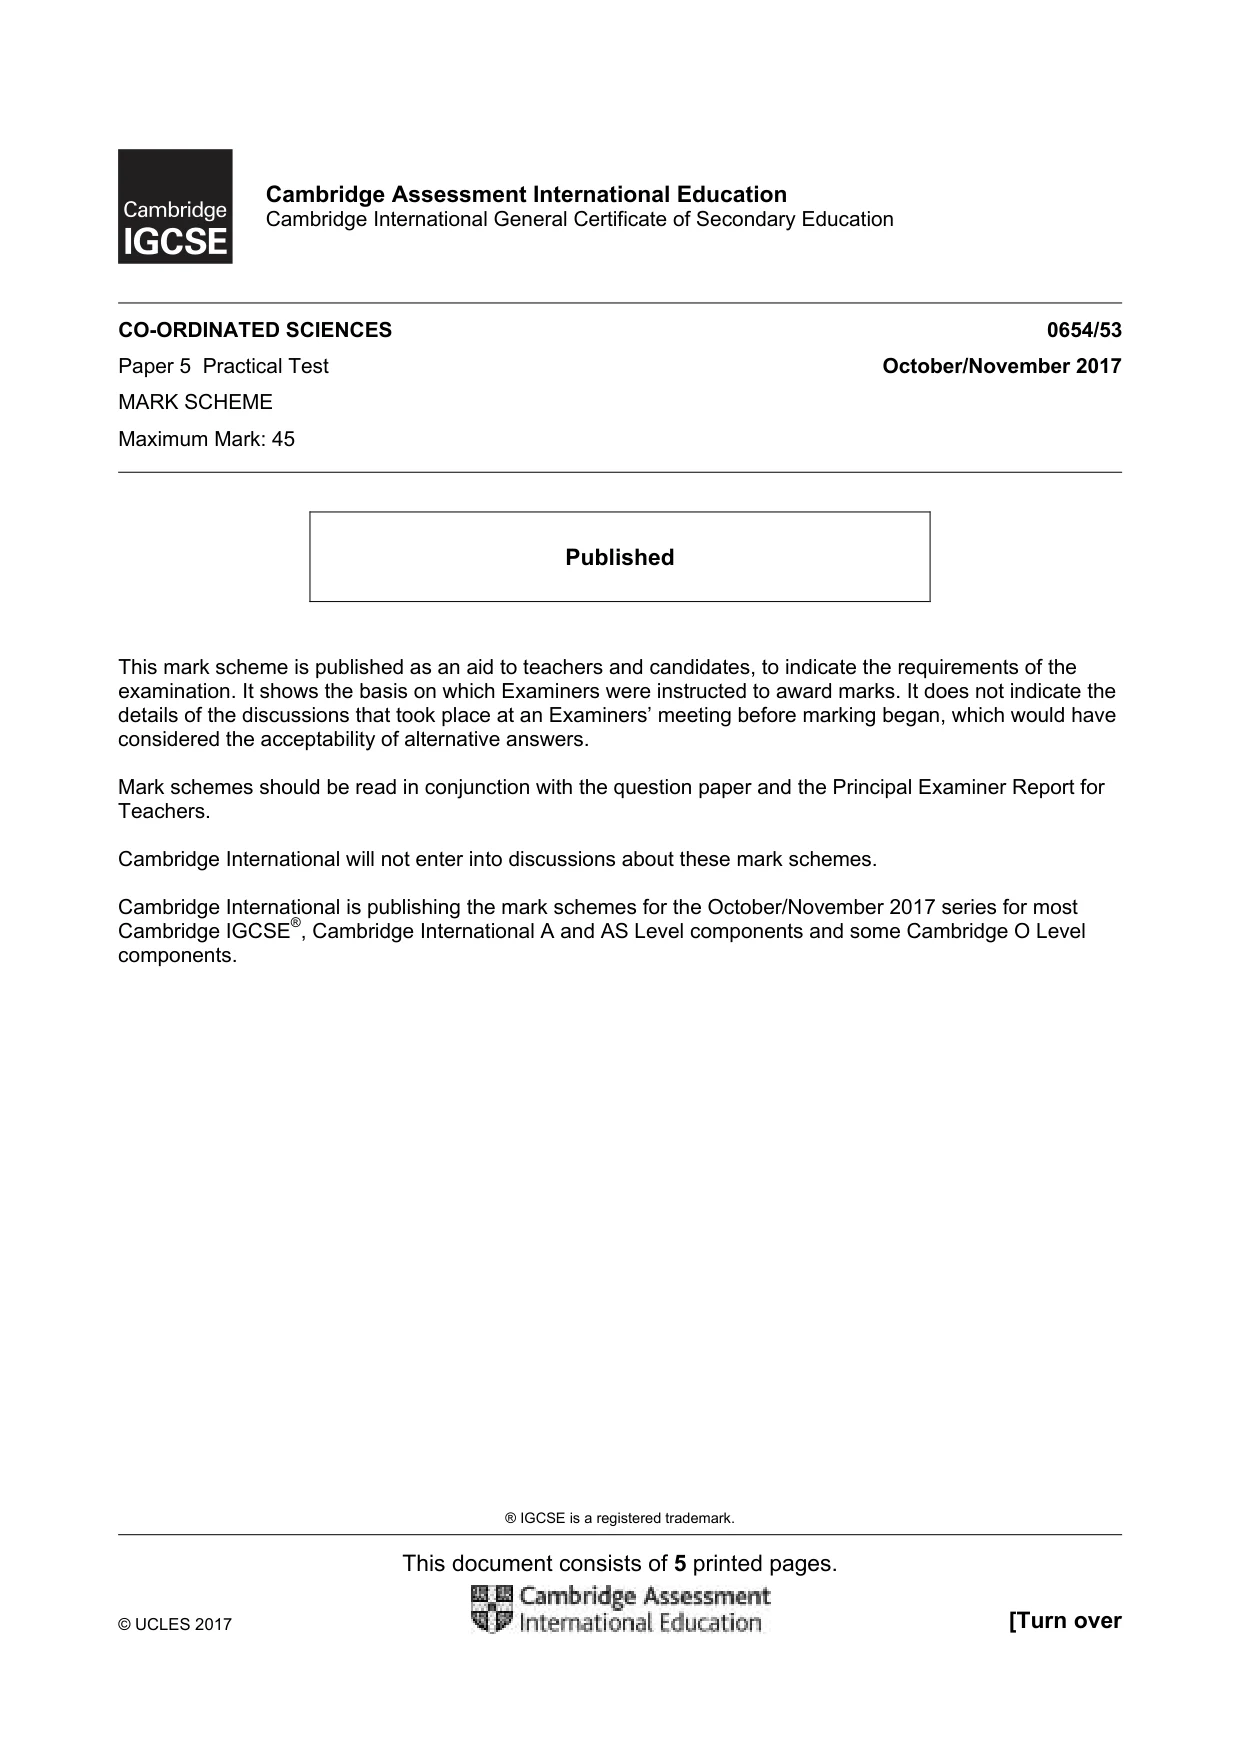
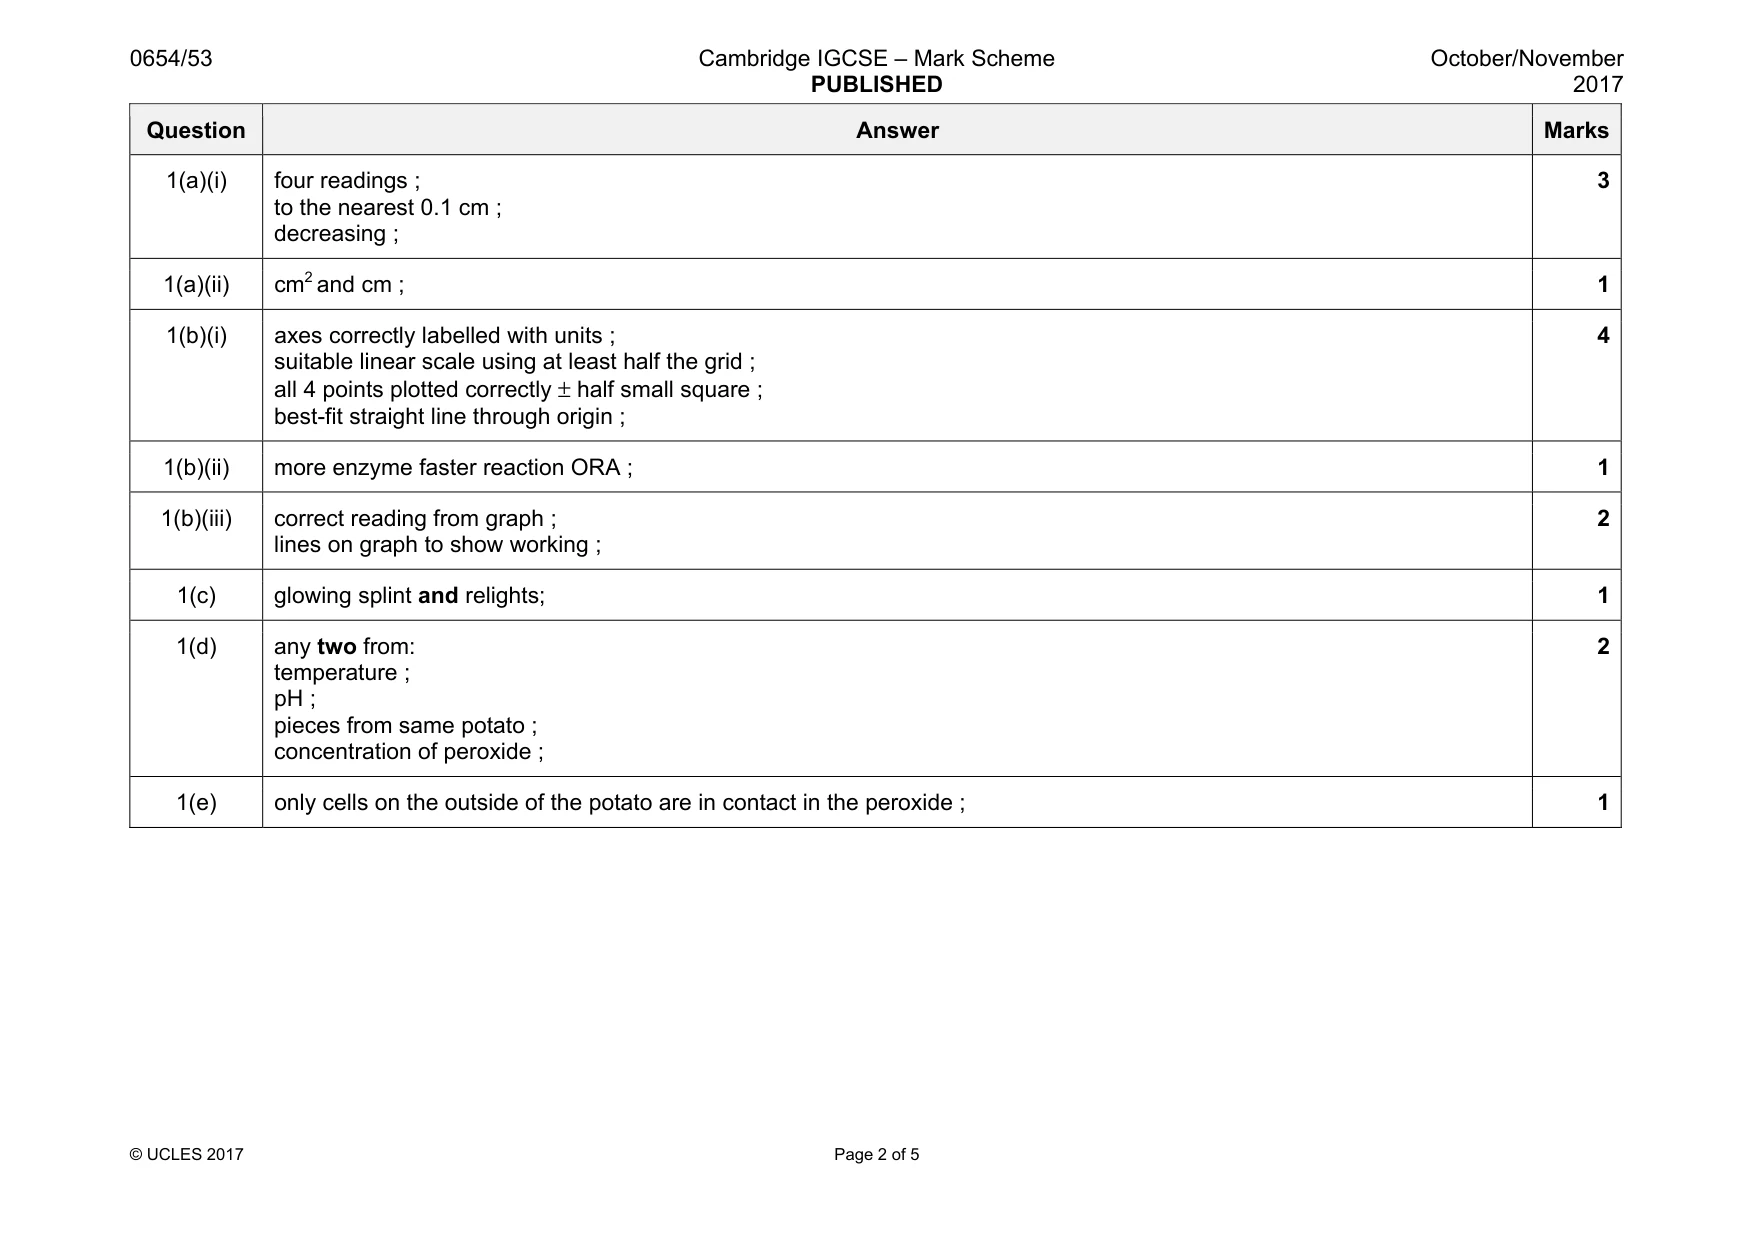
Mark scheme: 1(a)(i) four readings ; to the nearest 0.1 cm ; decreasing ; 3 1(a)(ii) cm2 and cm ; 1 1(b)(i) axes correctly labelled with units ; suitable linear scale using at least half the grid ; all 4 points plotted correctly ± half small square ; best-fit straight line through origin ; 4 1(b)(ii) more enzyme faster reaction ORA ; 1 1(b)(iii) correct reading from graph ; lines on graph to show working ; 2 1(c) glowing splint and relights; 1 1(d) any two from: temperature ; pH ; pieces from same potato ; concentration of peroxide ; 2 1(e) only cells on the outside of the potato are in contact in the peroxide ; 1
Q2 · Notes for use in Qualitative Analysis for this question are printed on page 12
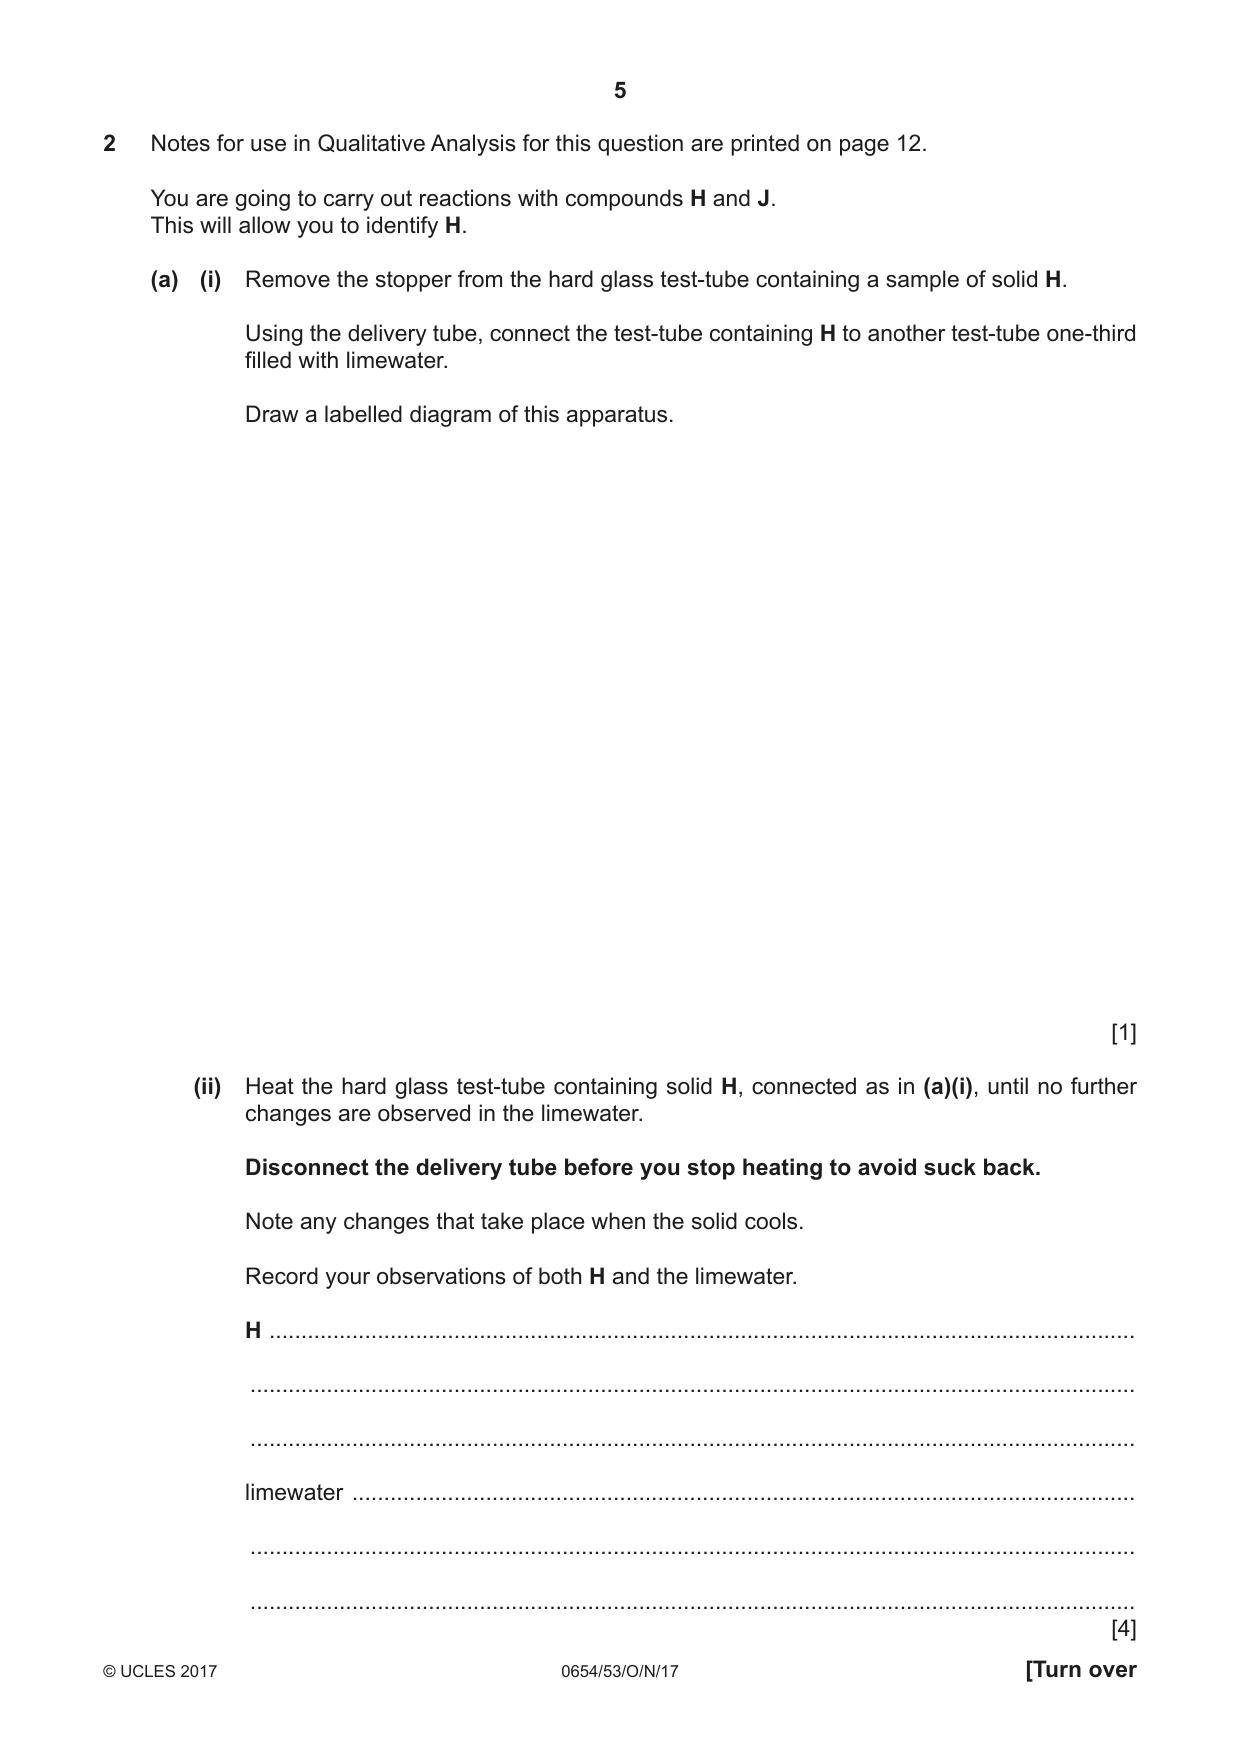
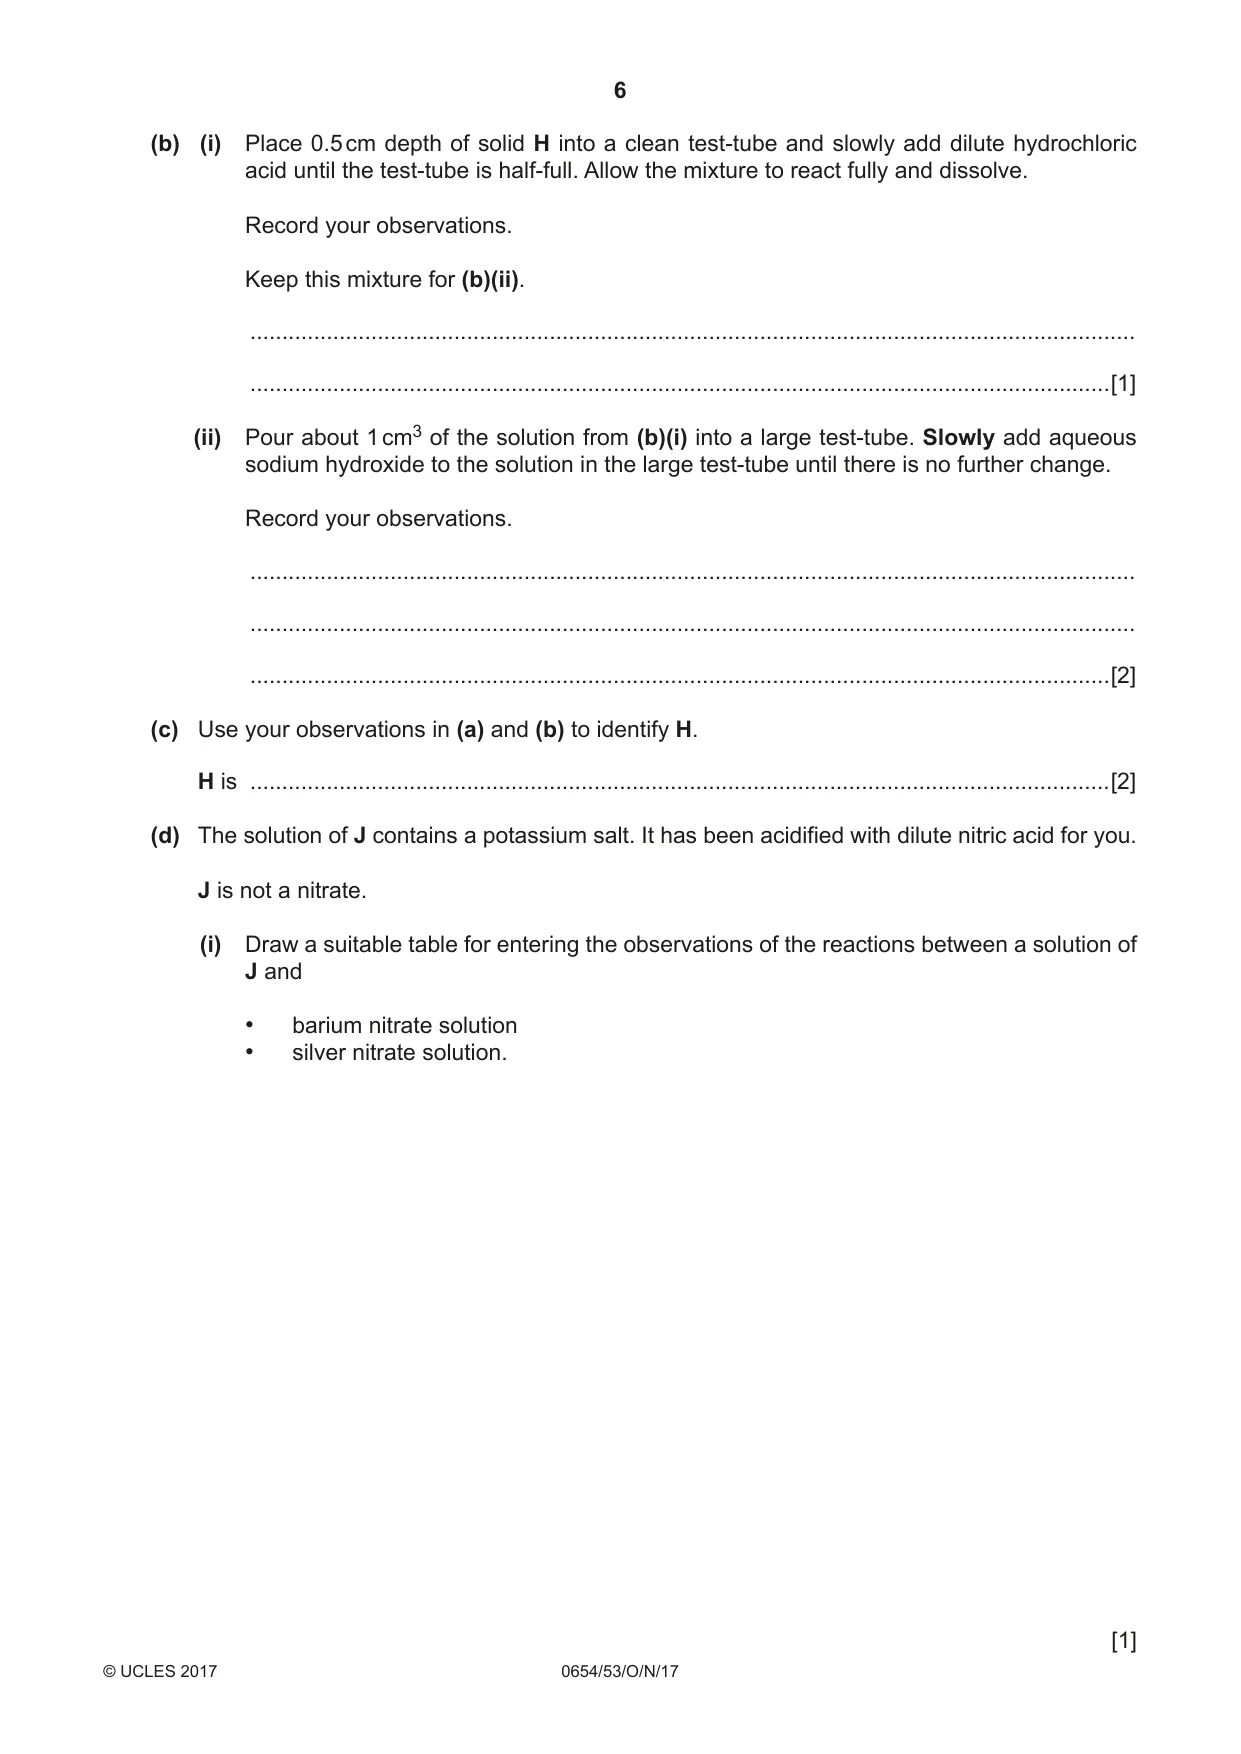
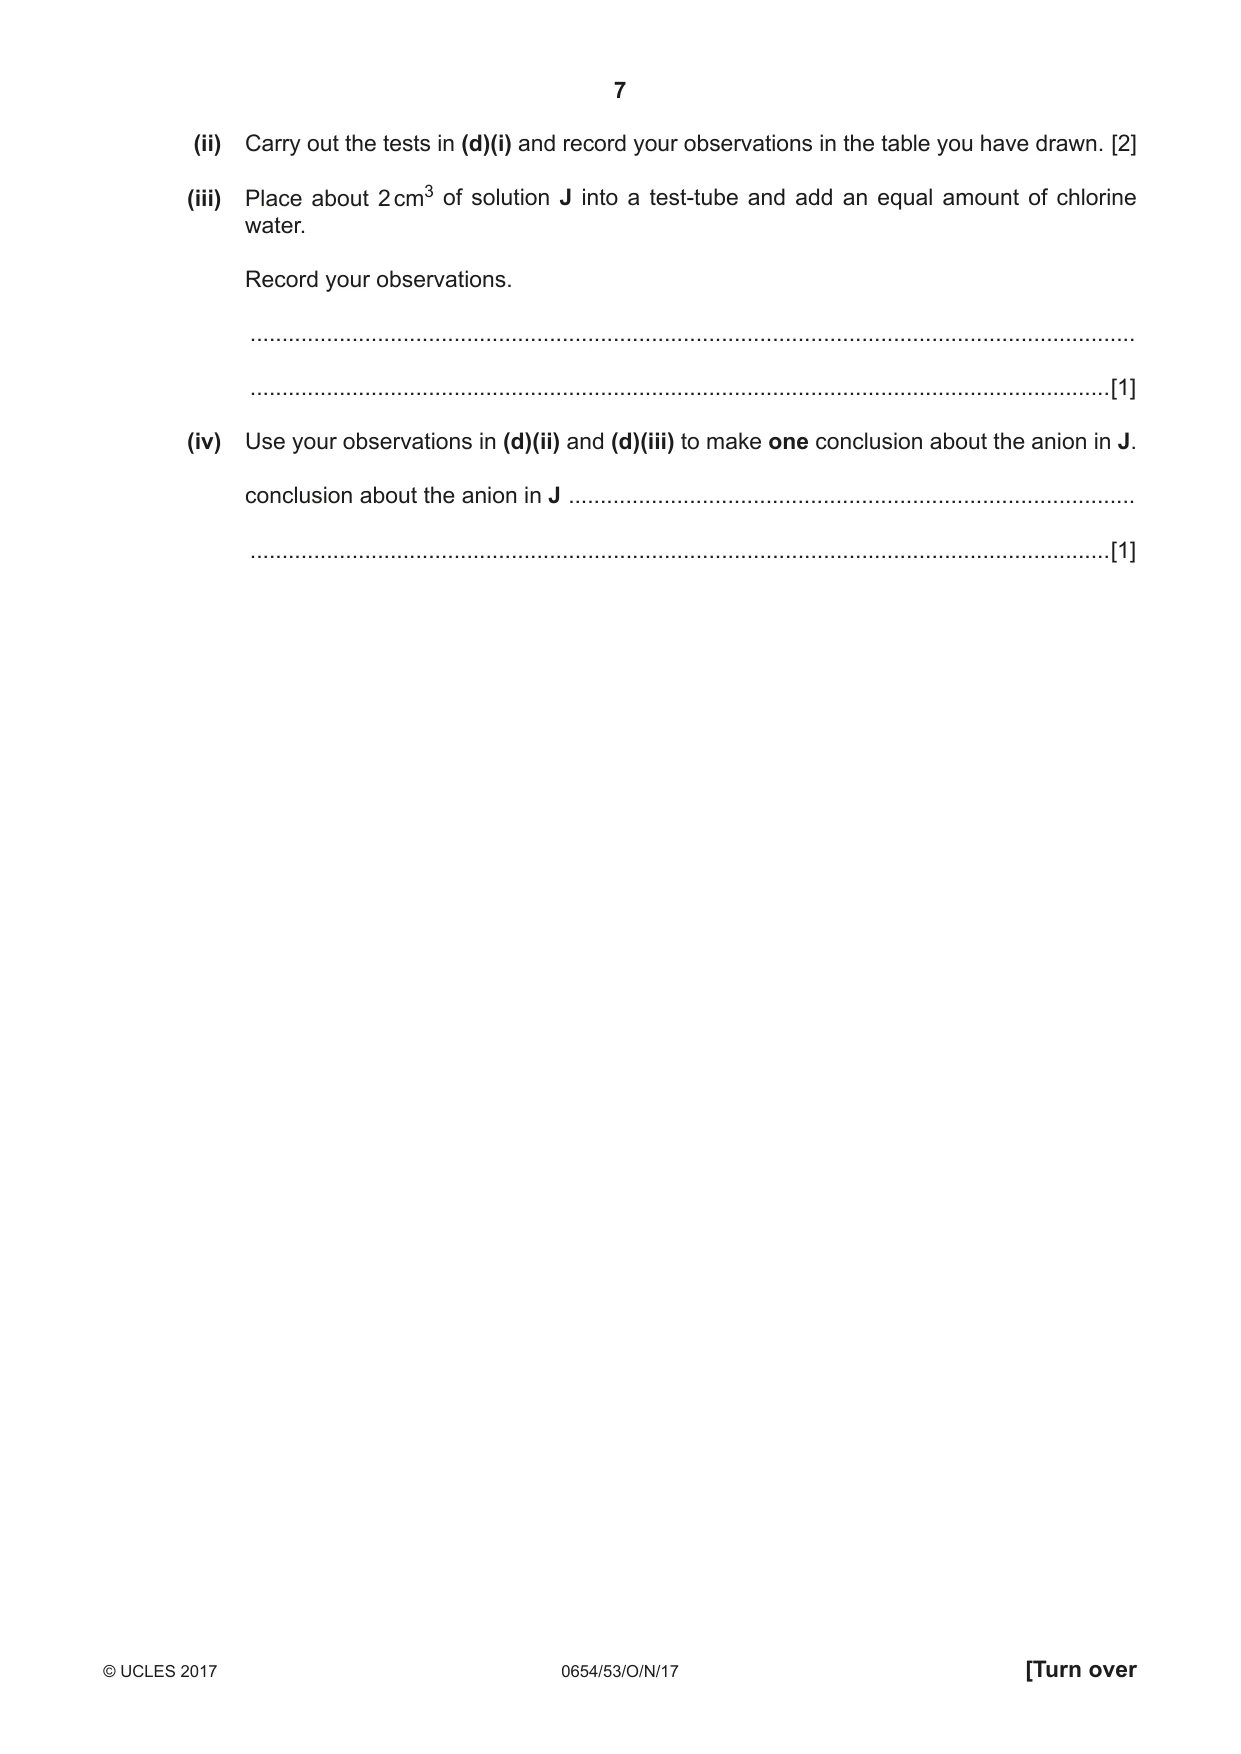
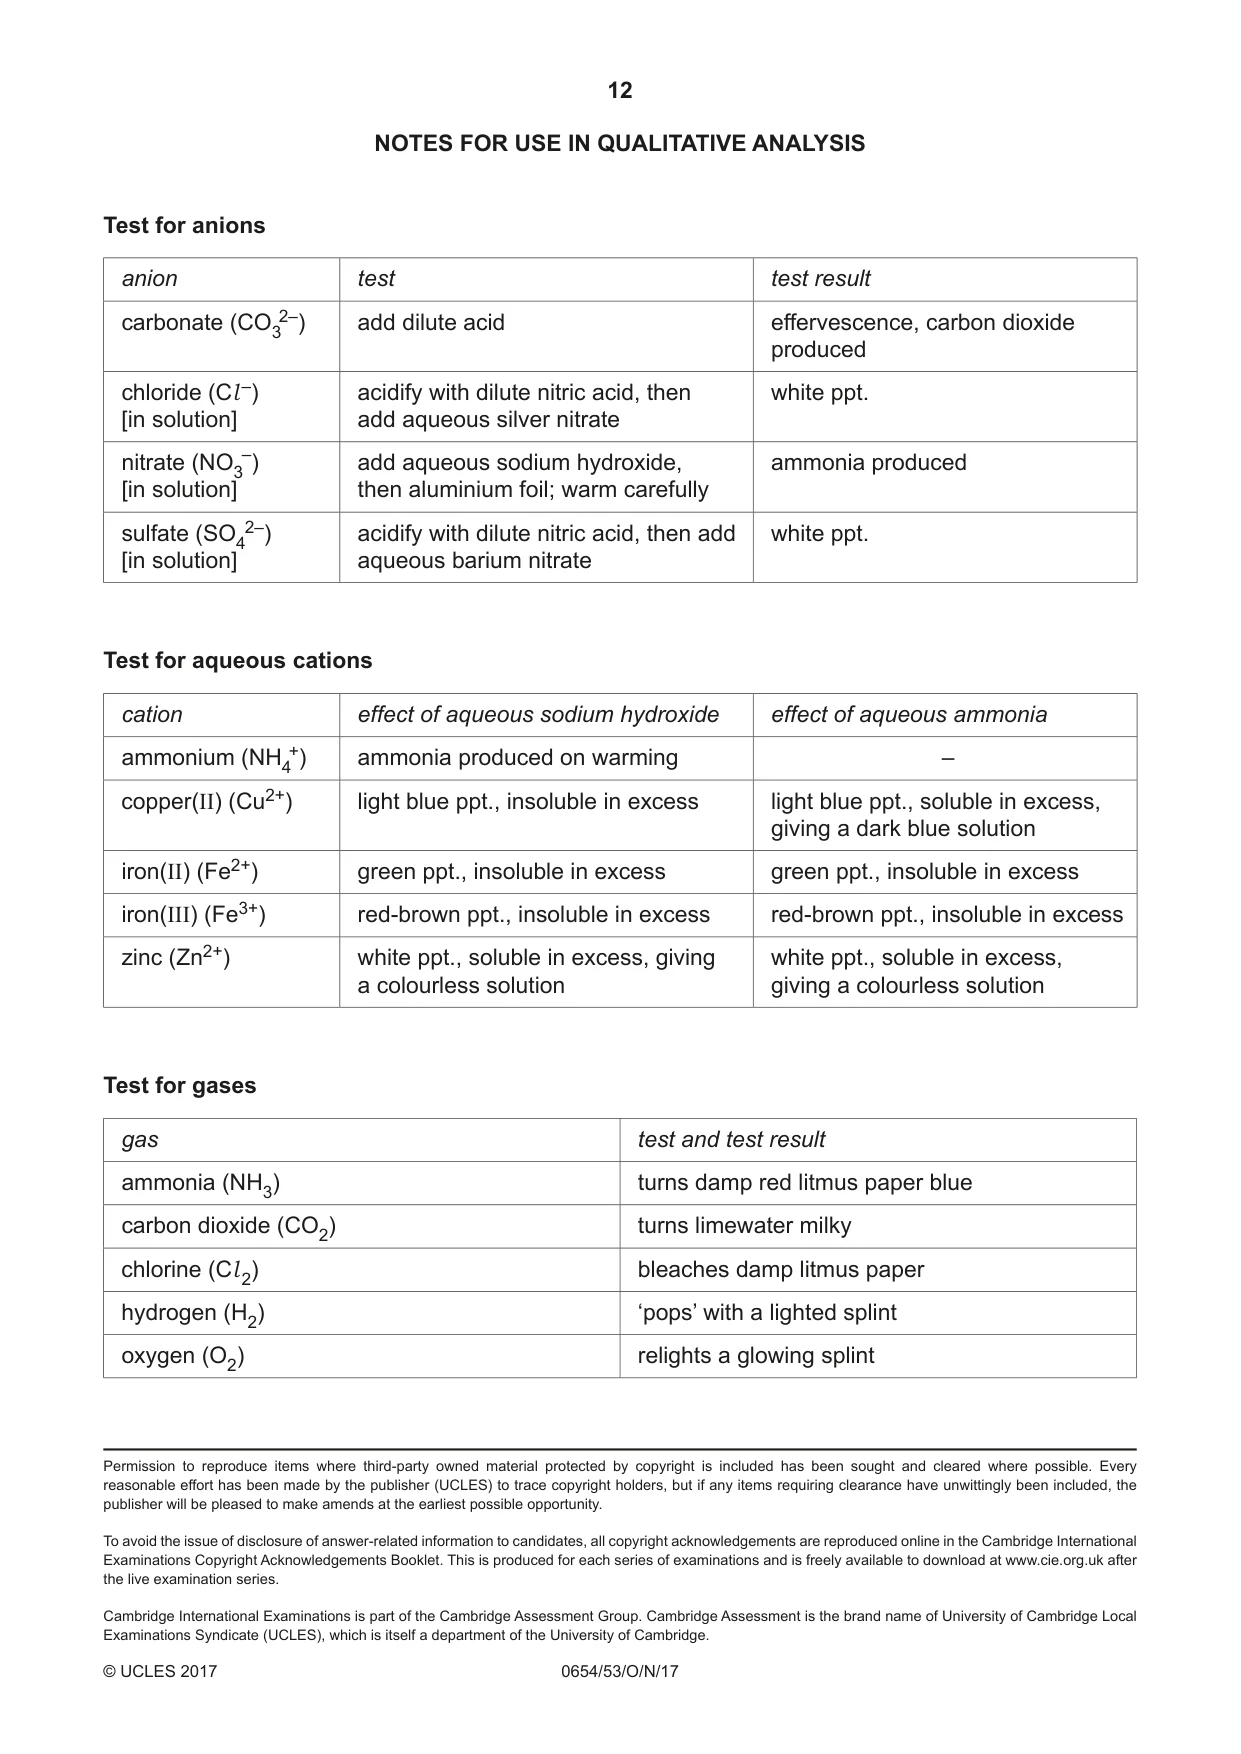
2 Notes for use in Qualitative Analysis for this question are printed on page 12. You are going to carry out reactions with compounds H and J. This will allow you to identify H. (a) (i) Remove the stopper from the hard glass test-tube containing a sample of solid H. Using the delivery tube, connect the test-tube containing H to another test-tube one-third filled with limewater. Draw a labelled diagram of this apparatus. [1] (ii) Heat the hard glass test-tube containing solid H, connected as in (a)(i), until no further changes are observed in the limewater. Disconnect the delivery tube before you stop heating to avoid suck back. Note any changes that take place when the solid cools. Record your observations of both H and the limewater. H ........................................................................................................................................ ........................................................................................................................................... ........................................................................................................................................... limewater ........................................................................................................................... ........................................................................................................................................... ........................................................................................................................................... [4] (b) (i) Place 0.5 cm depth of solid H into a clean test-tube and slowly add dilute hydrochloric acid until the test-tube is half-full. Allow the mixture to react fully and dissolve. Record your observations. Keep this mixture for (b)(ii). ........................................................................................................................................... .......................................................................................................................................[1] (ii) Pour about 1 cm3 of the solution from (b)(i) into a large test-tube. Slowly add aqueous sodium hydroxide to the solution in the large test-tube until there is no further change. Record your observations. ........................................................................................................................................... ........................................................................................................................................... .......................................................................................................................................[2] (c) Use your observations in (a) and (b) to identify H. H is .......................................................................................................................................[2] (d) The solution of J contains a potassium salt. It has been acidified with dilute nitric acid for you. J is not a nitrate. (i) Draw a suitable table for entering the observations of the reactions between a solution of J and • barium nitrate solution • silver nitrate solution. [1] (ii) Carry out the tests in (d)(i) and record your observations in the table you have drawn. [2] (iii) Place about 2 cm3 of solution J into a test-tube and add an equal amount of chlorine water. Record your observations. ........................................................................................................................................... .......................................................................................................................................[1] (iv) Use your observations in (d)(ii) and (d)(iii) to make one conclusion about the anion in J. conclusion about the anion in J ......................................................................................... .......................................................................................................................................[1]
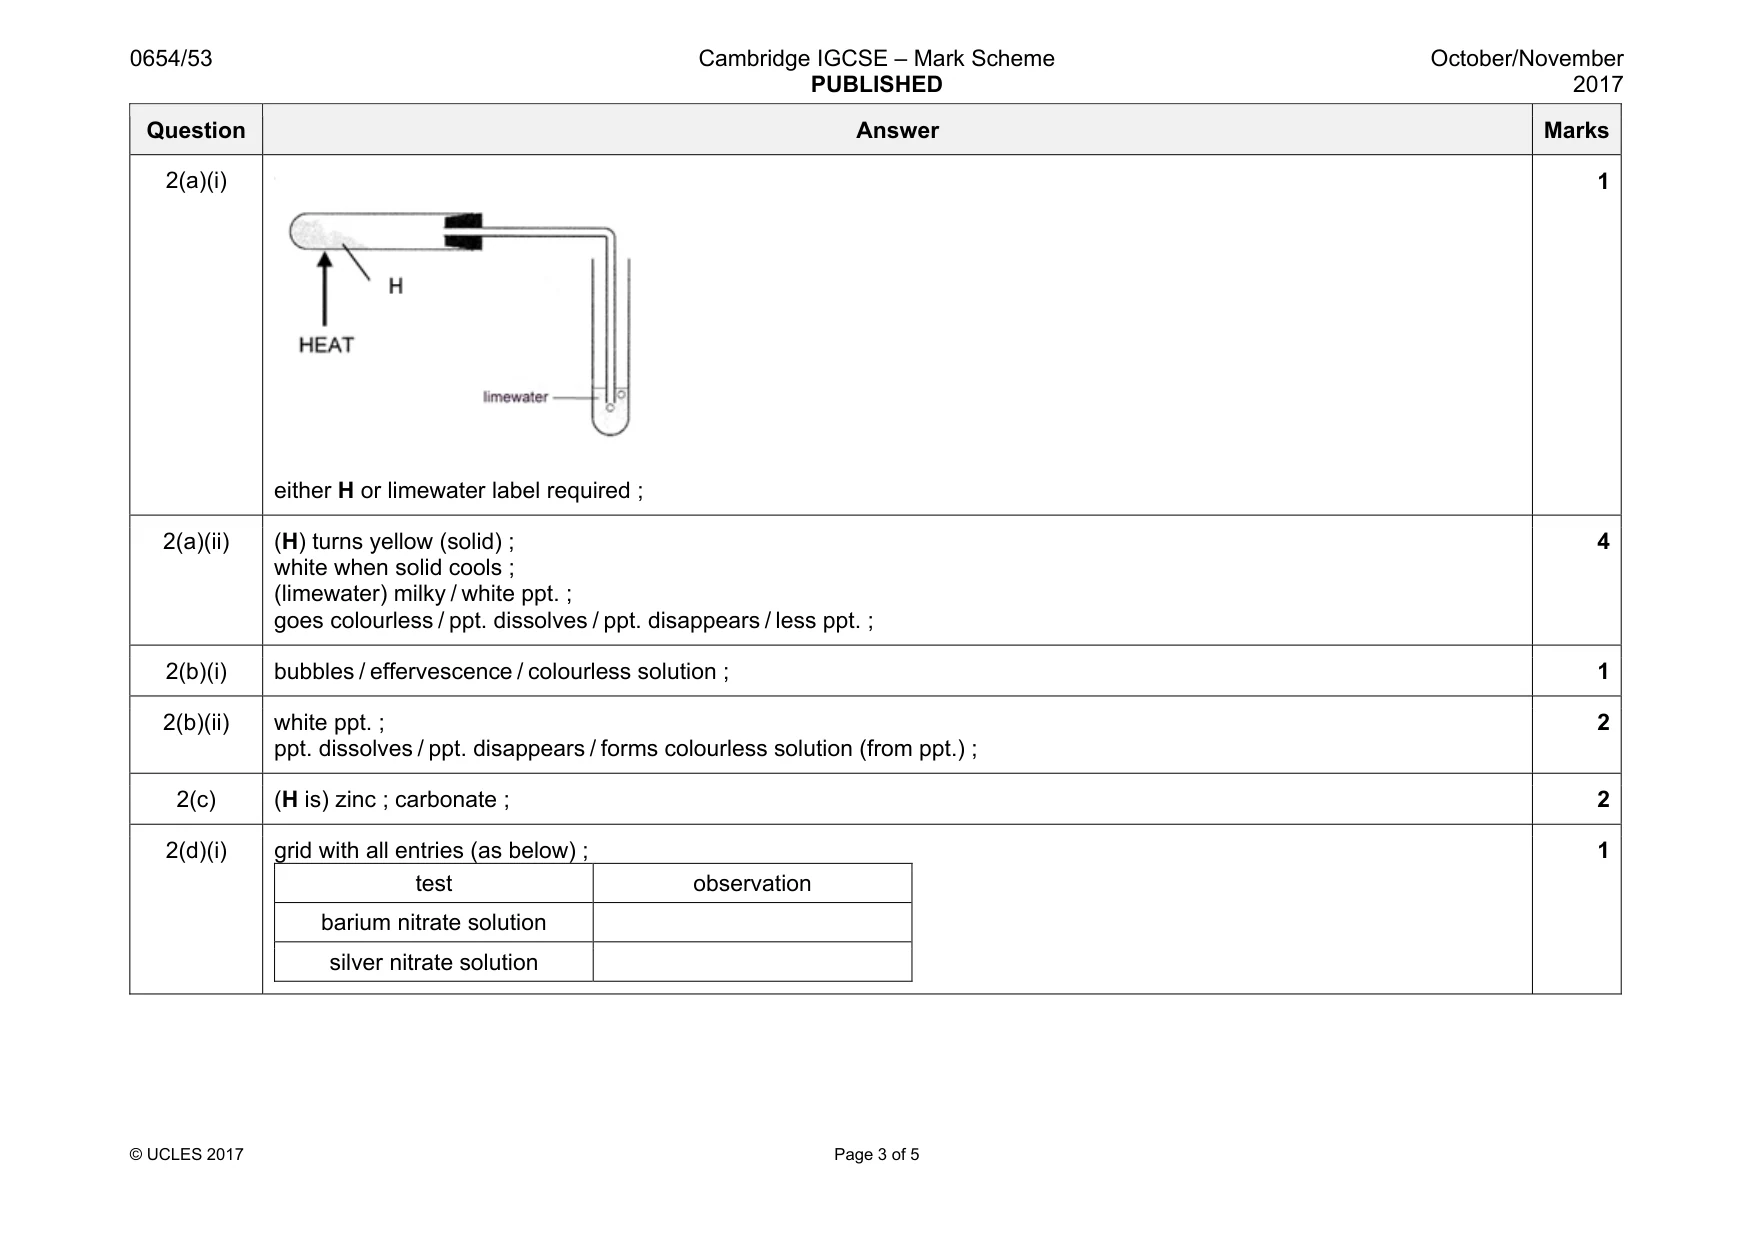
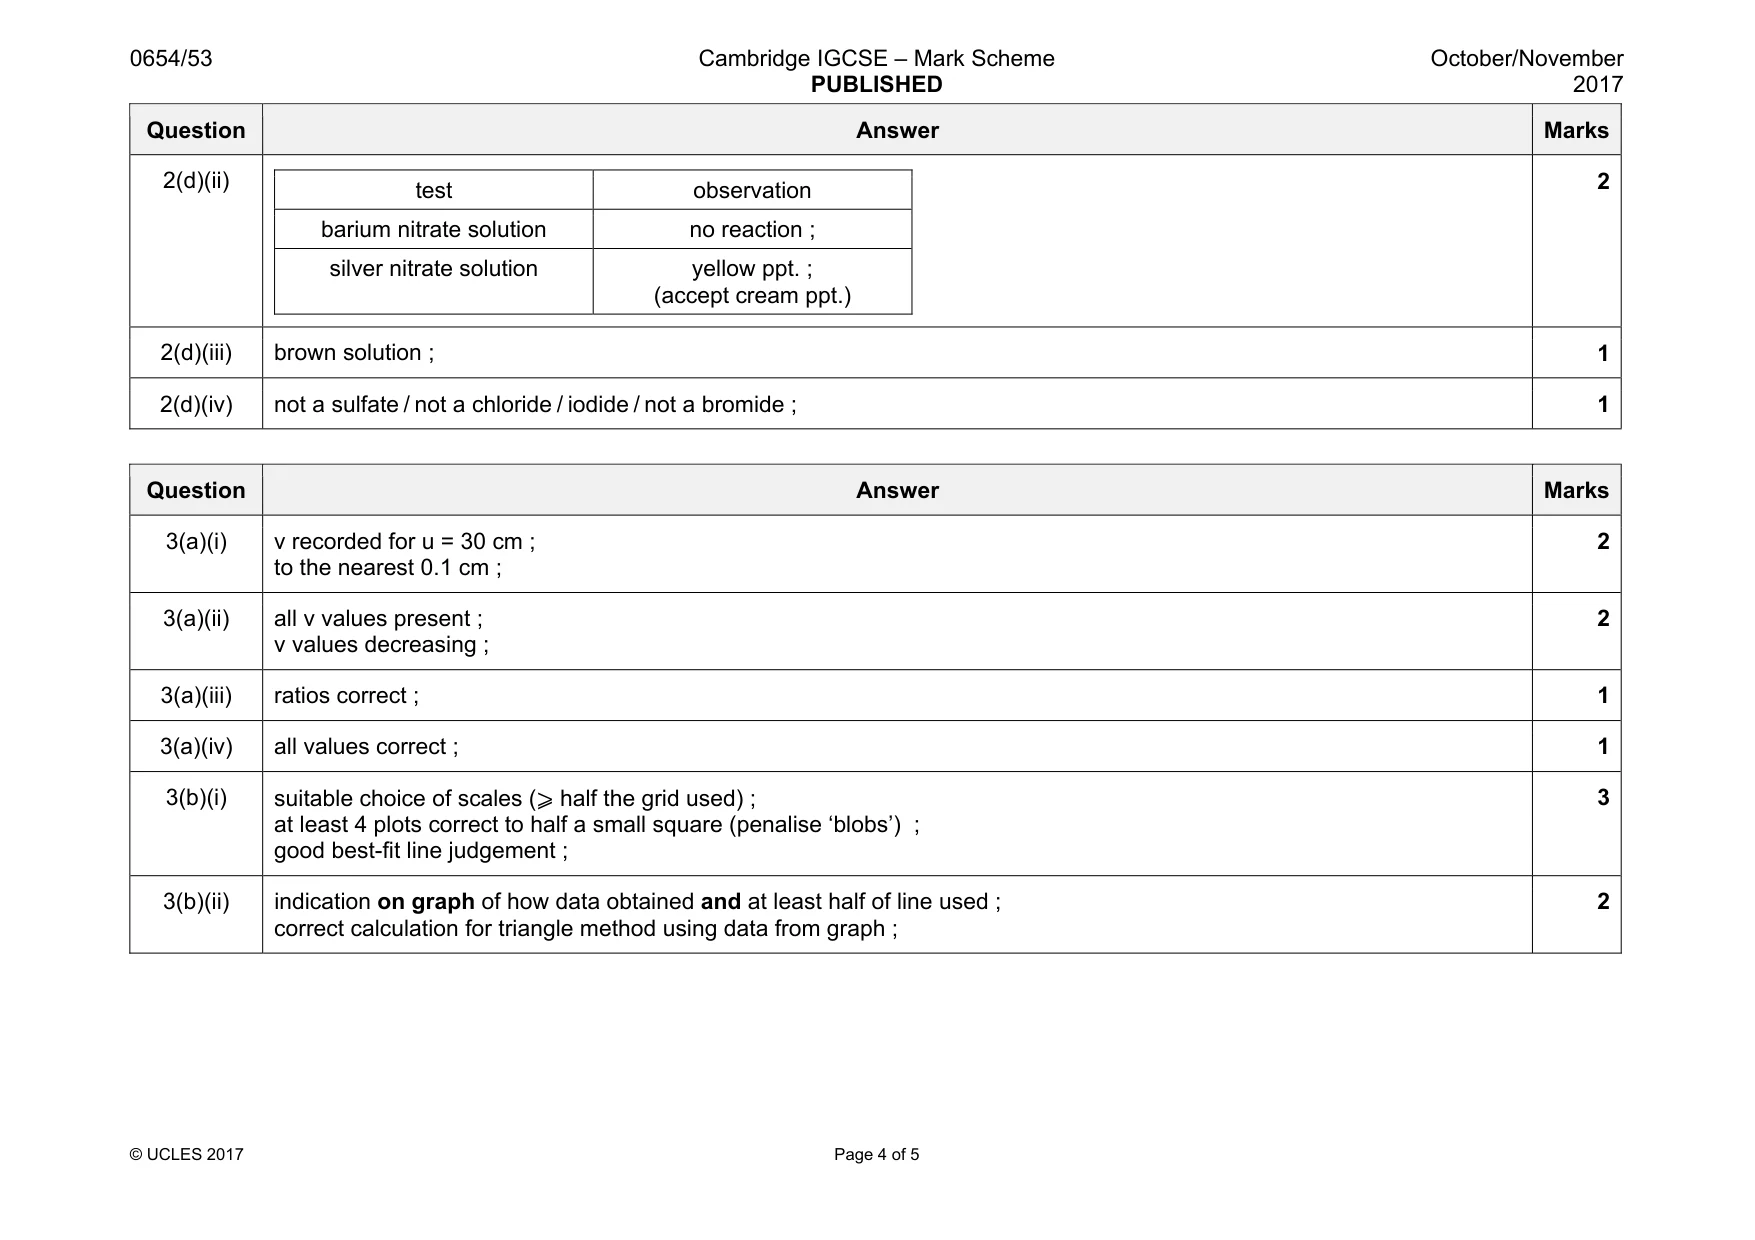
Mark scheme: 2(a)(i) either H or limewater label required ; 1 2(a)(ii) (H) turns yellow (solid) ; white when solid cools ; (limewater) milky / white ppt. ; goes colourless / ppt. dissolves / ppt. disappears / less ppt. ; 4 2(b)(i) bubbles / effervescence / colourless solution ; 1 2(b)(ii) white ppt. ; ppt. dissolves / ppt. disappears / forms colourless solution (from ppt.) ; 2 2(c) (H is) zinc ; carbonate ; 2 2(d)(i) grid with all entries (as below) ; test observation barium nitrate solution silver nitrate solution 1 Question Answer Marks 2(d)(ii) test observation barium nitrate solution no reaction ; silver nitrate solution yellow ppt. ; (accept cream ppt.) 2 2(d)(iii) brown solution ; 1 2(d)(iv) not a sulfate / not a chloride / iodide / not a bromide ; 1
Q3 · You are going to measure the focal length of a convex lens
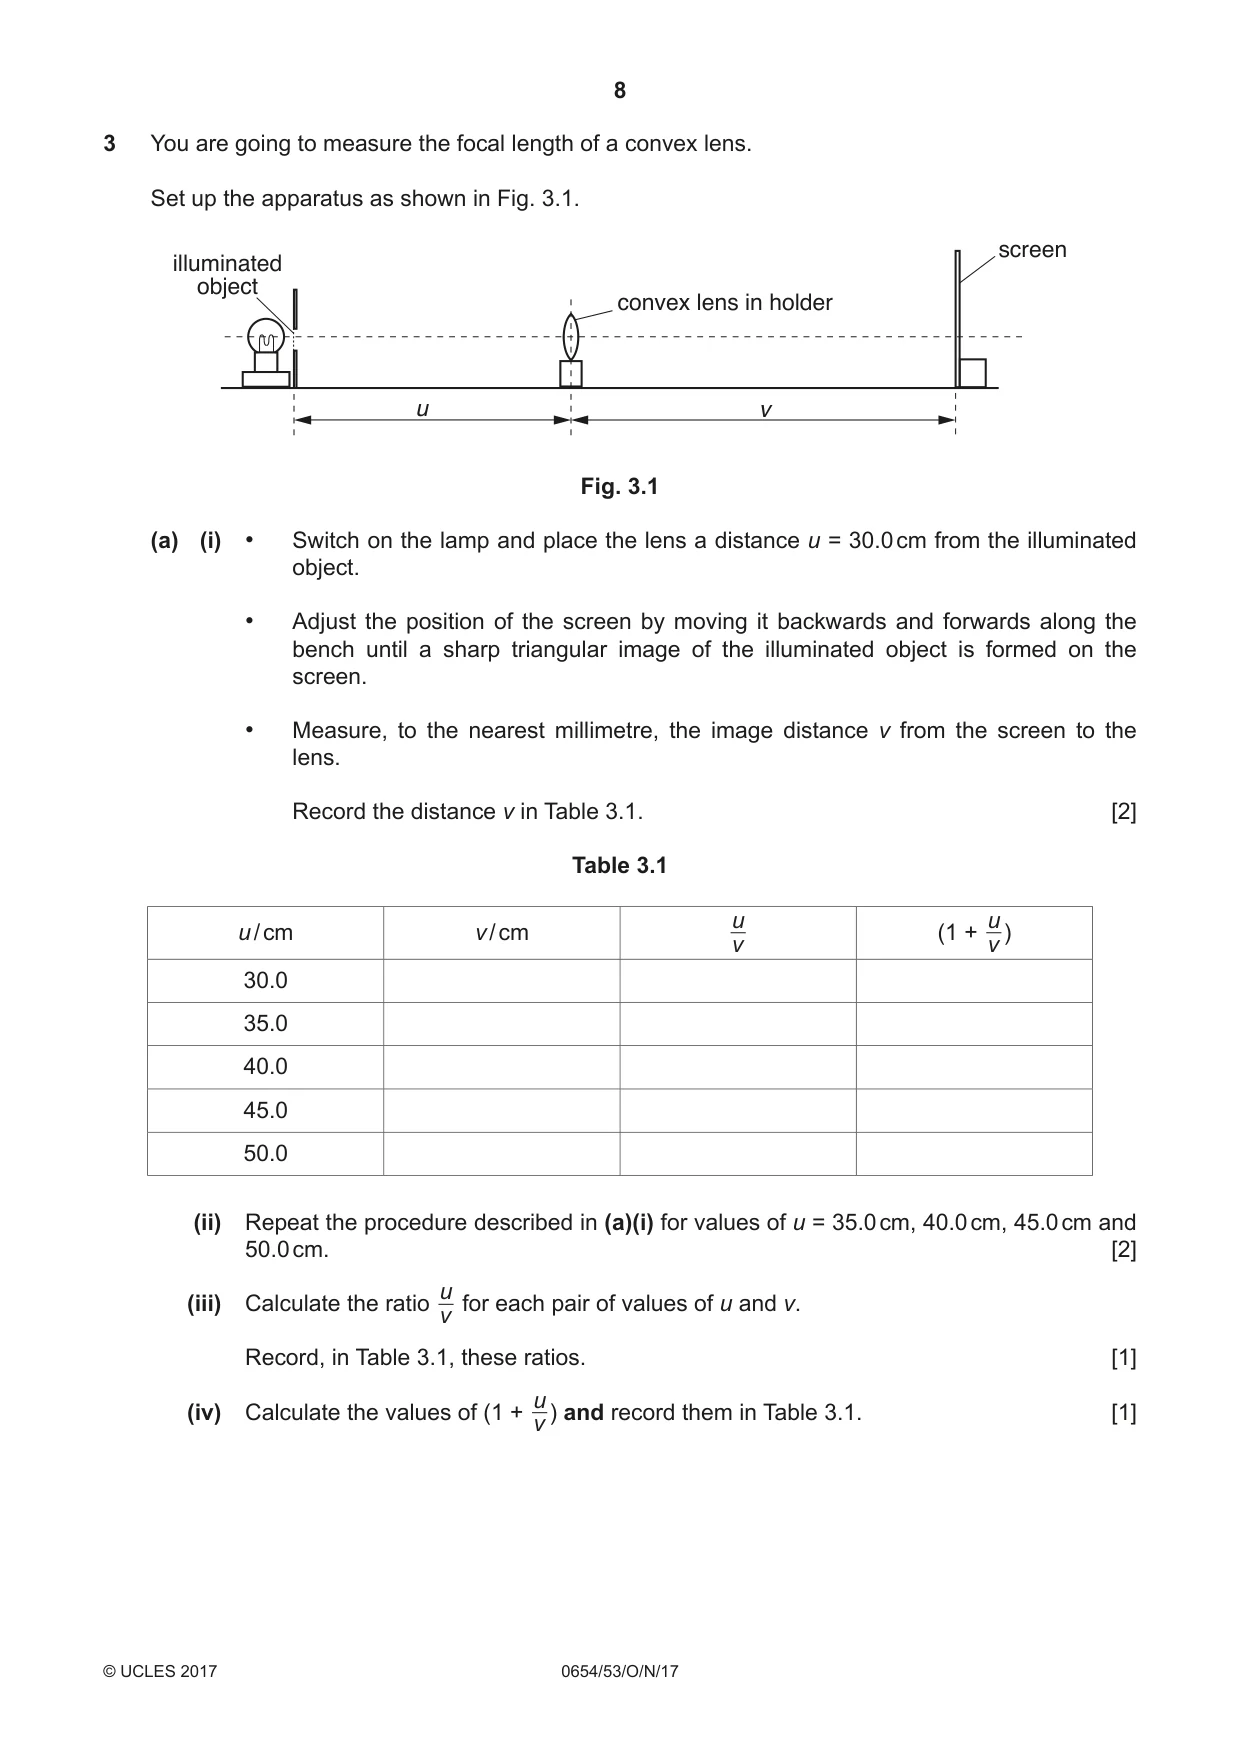
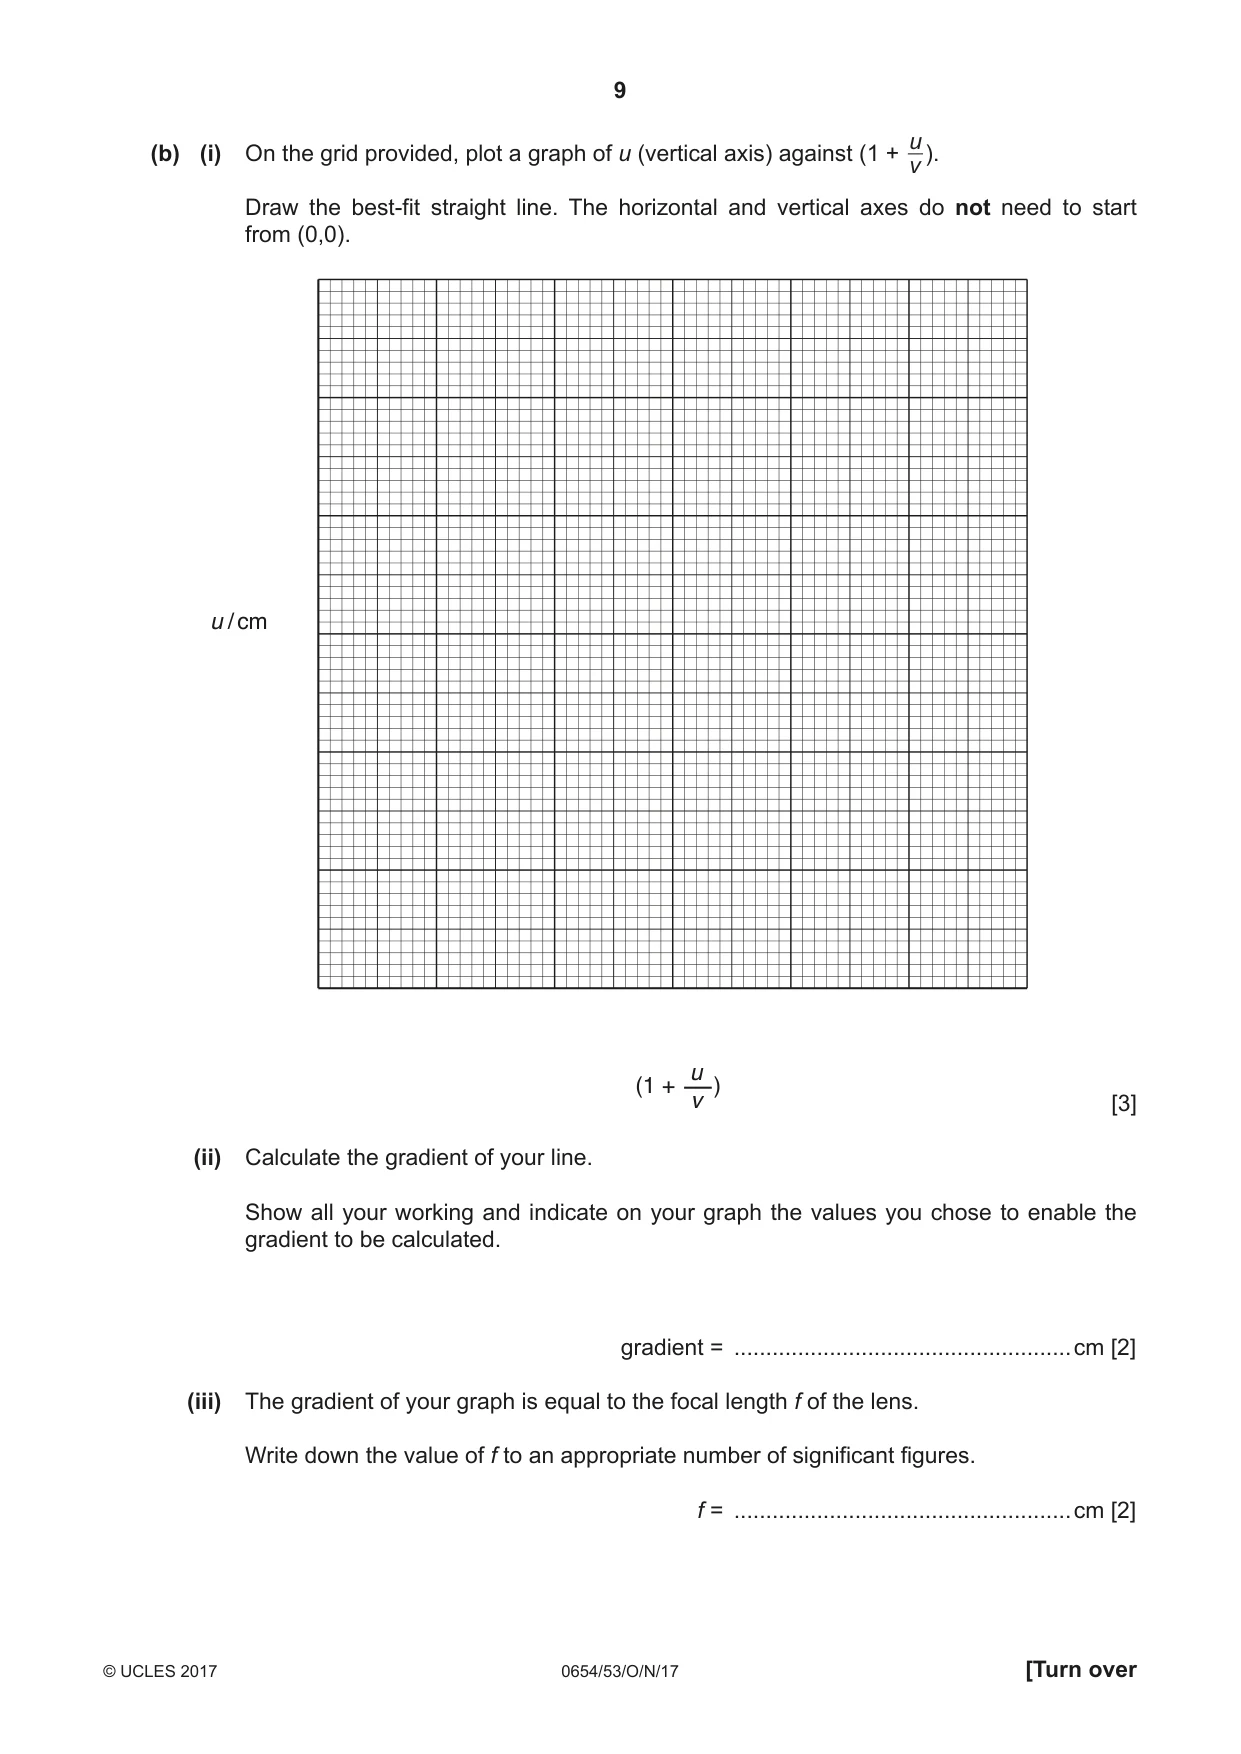
3 You are going to measure the focal length of a convex lens. Set up the apparatus as shown in Fig. 3.1. screen illuminated object convex lens in holder u v Fig. 3.1 (a) (i) • Switch on the lamp and place the lens a distance u = 30.0 cm from the illuminated object. • Adjust the position of the screen by moving it backwards and forwards along the bench until a sharp triangular image of the illuminated object is formed on the screen. • Measure, to the nearest millimetre, the image distance v from the screen to the lens. Record the distance v in Table 3.1. [2] Table 3.1 u u u / cm v / cm (1 + ) v v 30.0 35.0 40.0 45.0 50.0 (ii) Repeat the procedure described in (a)(i) for values of u = 35.0 cm, 40.0 cm, 45.0 cm and 50.0 cm. [2] u (iii) Calculate the ratio for each pair of values of u and v. v Record, in Table 3.1, these ratios. [1] u (iv) Calculate the values of (1 + ) and record them in Table 3.1. [1] v u(b) (i) On the grid provided, plot a graph of u (vertical axis) against (1 + ). v Draw the best-fit straight line. The horizontal and vertical axes do not need to start from (0,0). u / cm u (1 + ) v [3] (ii) Calculate the gradient of your line. Show all your working and indicate on your graph the values you chose to enable the gradient to be calculated. gradient = .....................................................cm [2] (iii) The gradient of your graph is equal to the focal length f of the lens. Write down the value of f to an appropriate number of significant figures. f = .....................................................cm [2] (c) State two precautions that you should take in this experiment to obtain reliable results. precaution 1 .............................................................................................................................. ................................................................................................................................................... precaution 2 .............................................................................................................................. ................................................................................................................................................... [2]
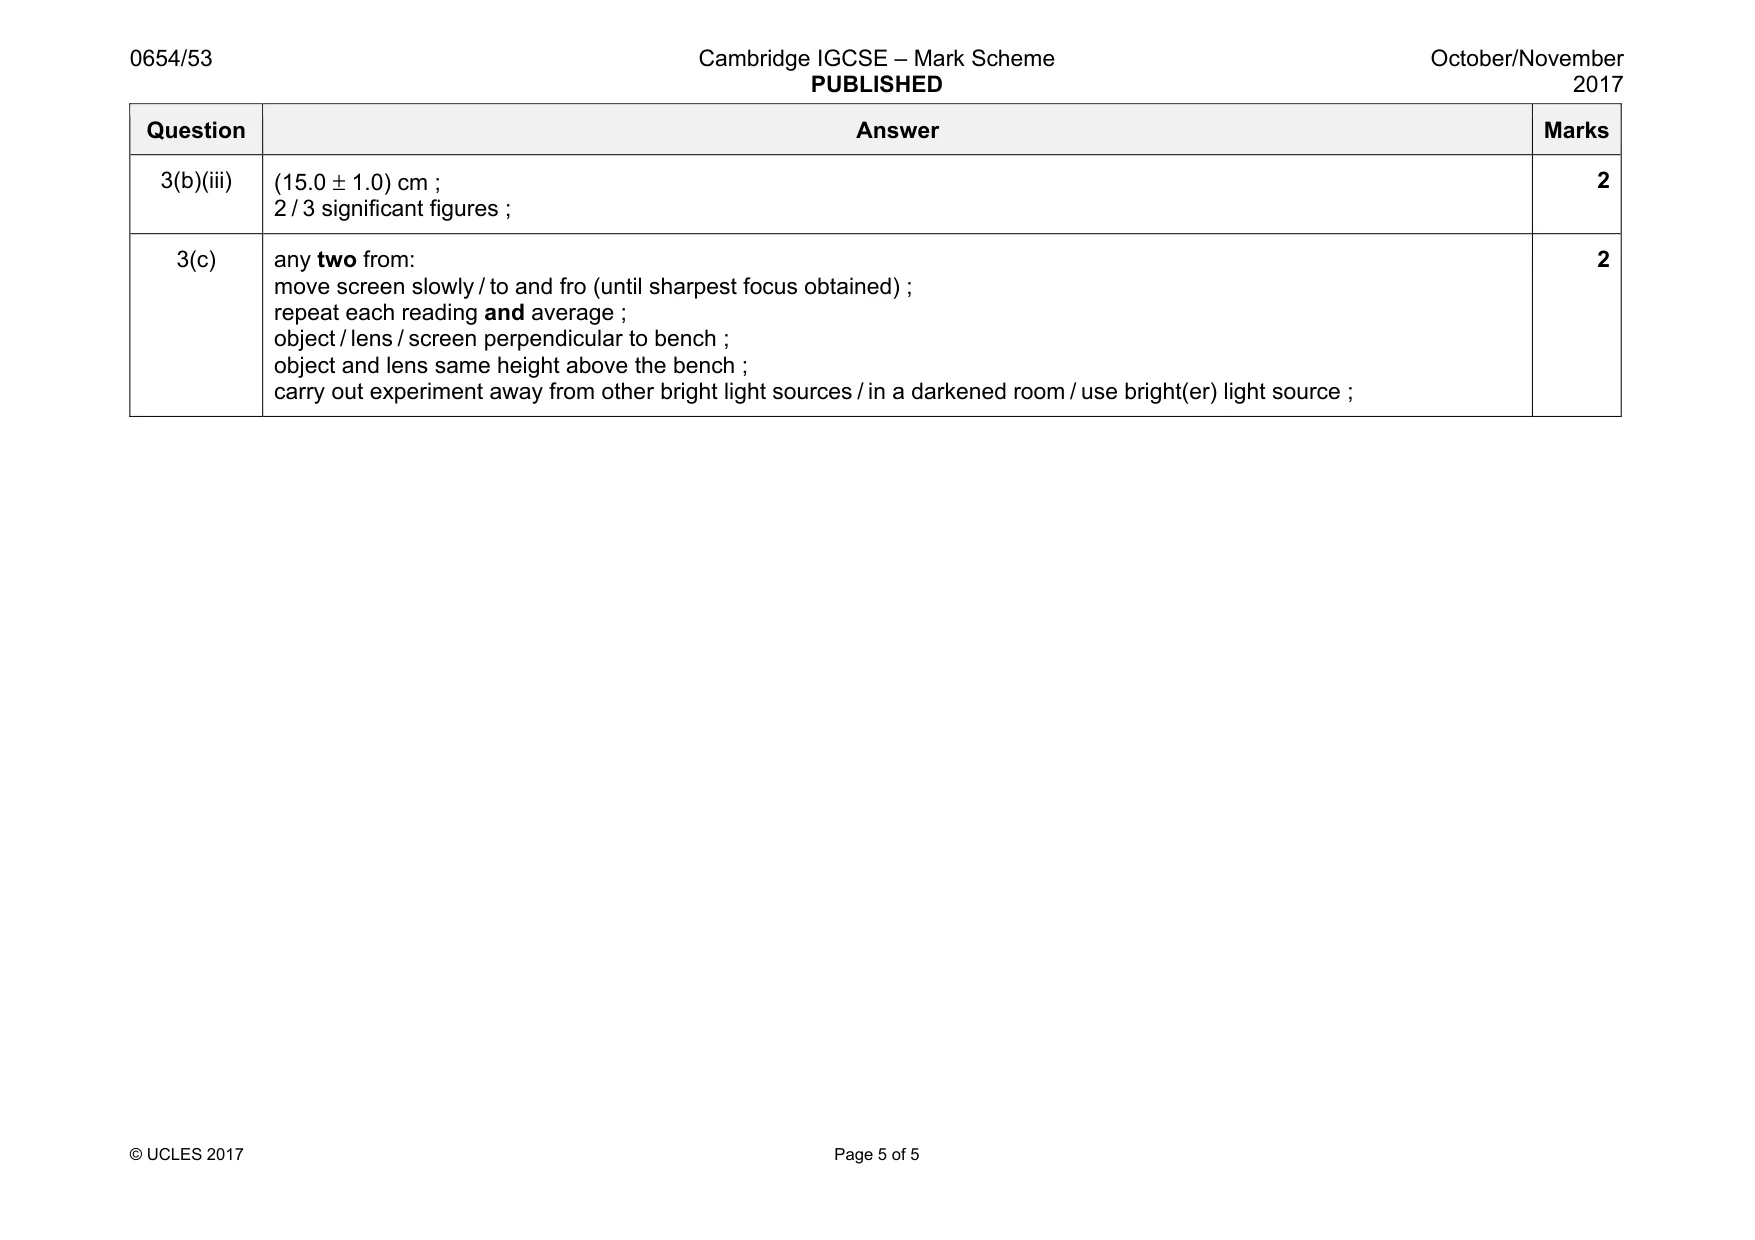
Mark scheme: 3(a)(i) v recorded for u = 30 cm ; to the nearest 0.1 cm ; 2 3(a)(ii) all v values present ; v values decreasing ; 2 3(a)(iii) ratios correct ; 1 3(a)(iv) all values correct ; 1 3(b)(i) suitable choice of scales (⩾ half the grid used) ; at least 4 plots correct to half a small square (penalise ‘blobs’) ; good best-fit line judgement ; 3 3(b)(ii) indication on graph of how data obtained and at least half of line used ; correct calculation for triangle method using data from graph ; 2 Question Answer Marks 3(b)(iii) (15.0 ± 1.0) cm ; 2 / 3 significant figures ; 2 3(c) any two from: move screen slowly / to and fro (until sharpest focus obtained) ; repeat each reading and average ; object / lens / screen perpendicular to bench ; object and lens same height above the bench ; carry out experiment away from other bright light sources / in a darkened room / use bright(er) light source ; 2
What was in this paper
The subtopics covered by these 3 questions, and how many questions each got. Open one in a new tab to see every Cambridge question on it.
What you needed in this session
Cambridge’s own grade thresholds for 2017 Oct/Nov, Paper 5 · Variant 3. A higher threshold means an easier paper — the bar moves with how the cohort did.