Cambridge IGCSE Sciences - Co-ordinated (Double) 0654 — 2017 May/June Paper 5 · Variant 2
0654/52/M/J/17 · 3 questions · 45 marks · ≈51 min
The question paper and its mark scheme, free to read here and free to download. This is Cambridge’s own paper, exactly as it was sat.
Question paper12 pages

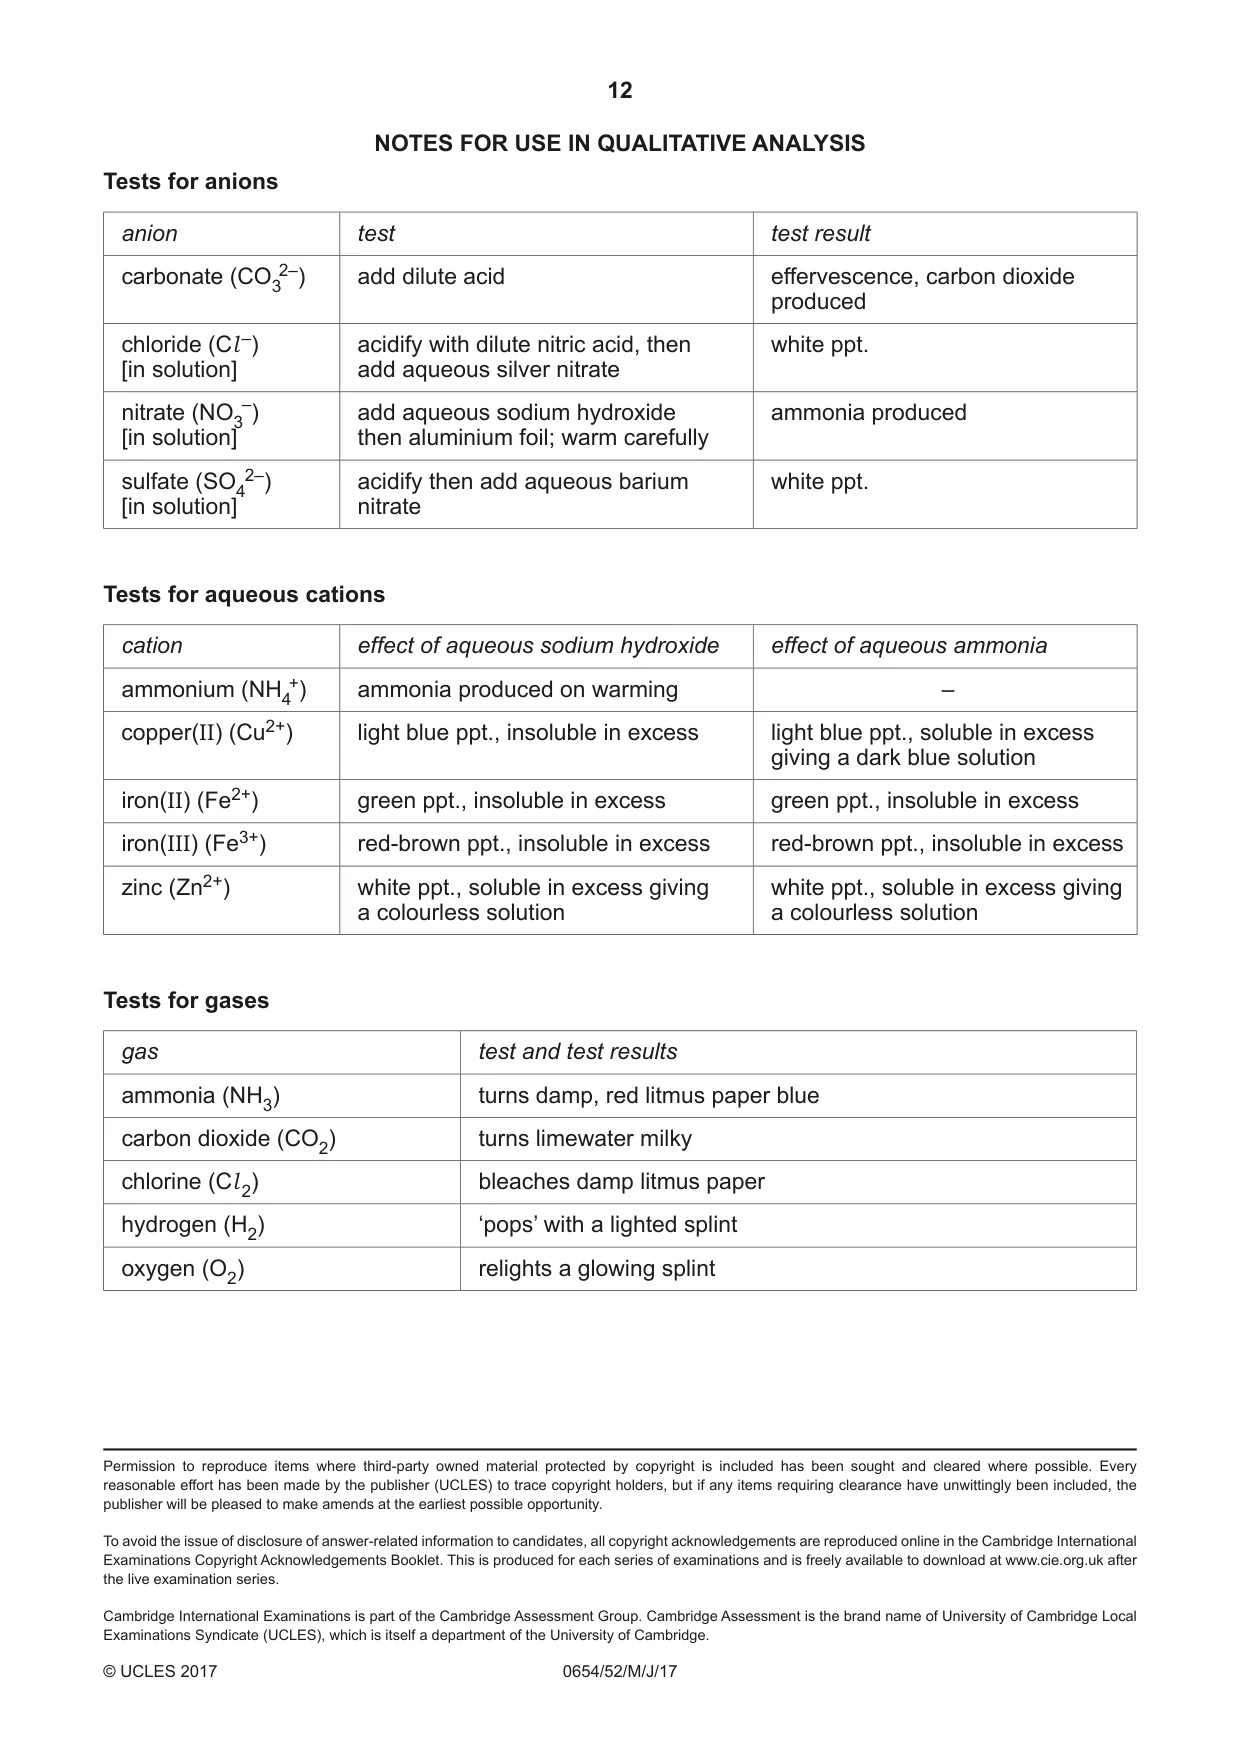
Mark scheme4 pages
Answers below. Sit the paper first if you are practising.
Questions as text
Q1 · You are provided with a flower
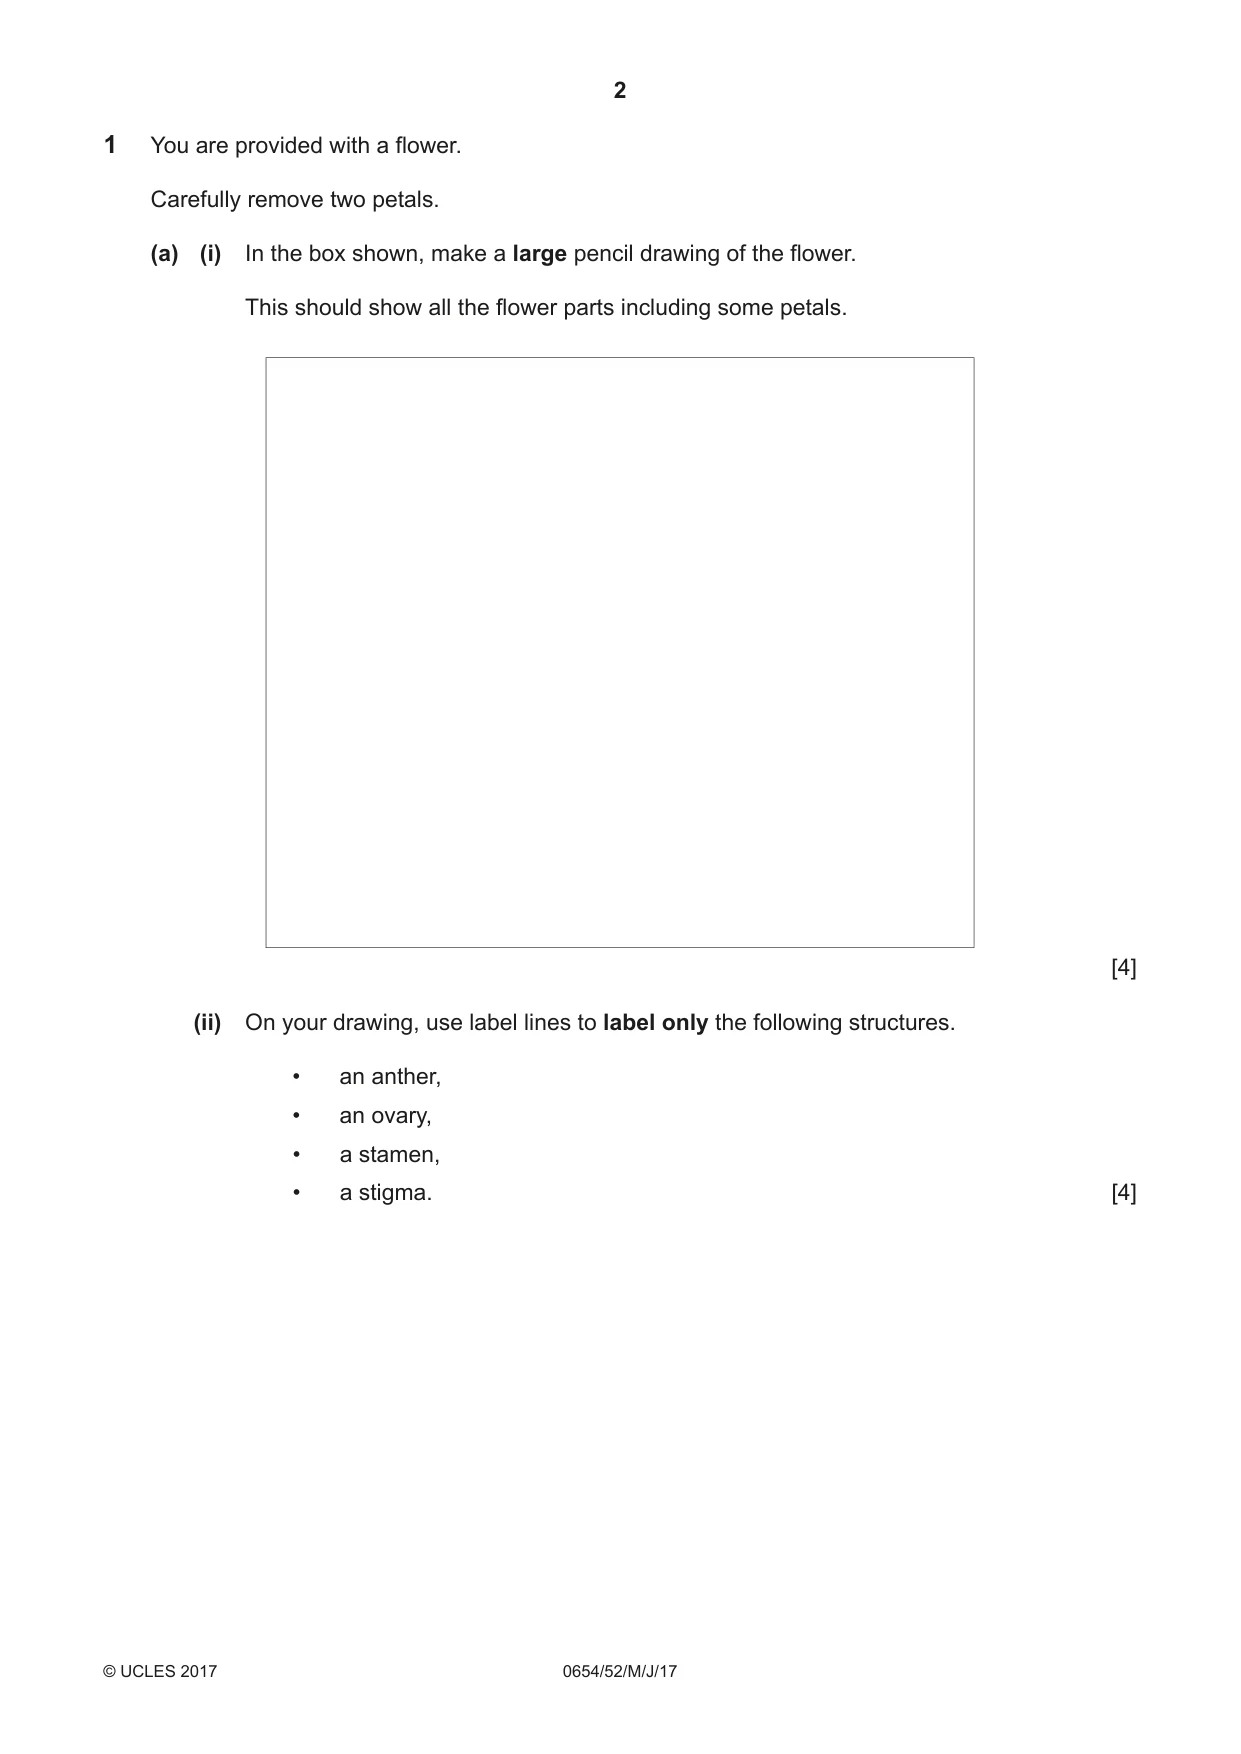
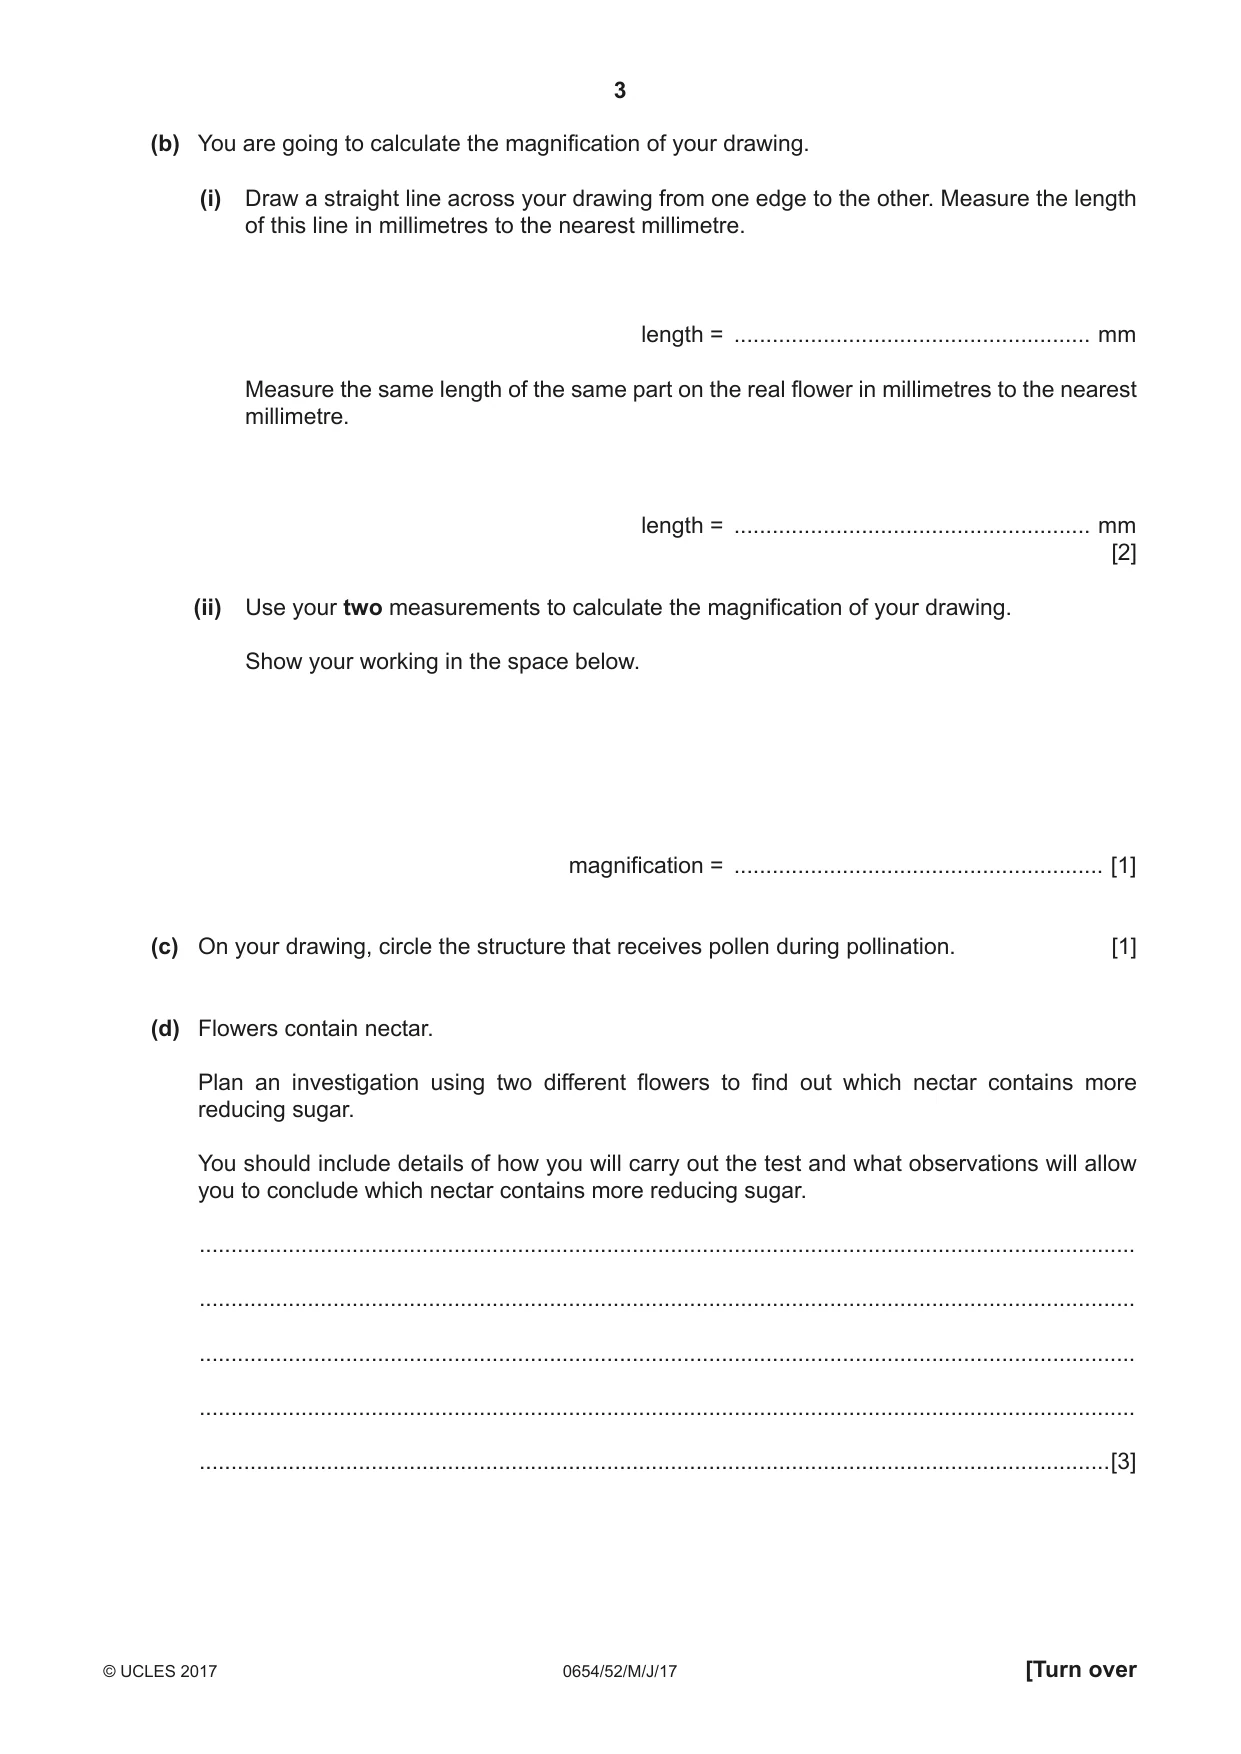
1 You are provided with a flower. Carefully remove two petals. (a) (i) In the box shown, make a large pencil drawing of the flower. This should show all the flower parts including some petals. [4] (ii) On your drawing, use label lines to label only the following structures. • an anther, • an ovary, • a stamen, • a stigma. [4] (b) You are going to calculate the magnification of your drawing. (i) Draw a straight line across your drawing from one edge to the other. Measure the length of this line in millimetres to the nearest millimetre. length = ........................................................ mm Measure the same length of the same part on the real flower in millimetres to the nearest millimetre. length = ........................................................ mm [2] (ii) Use your two measurements to calculate the magnification of your drawing. Show your working in the space below. magnification = .......................................................... [1] (c) On your drawing, circle the structure that receives pollen during pollination. [1] (d) Flowers contain nectar. Plan an investigation using two different flowers to find out which nectar contains more reducing sugar. You should include details of how you will carry out the test and what observations will allow you to conclude which nectar contains more reducing sugar. ................................................................................................................................................... ................................................................................................................................................... ................................................................................................................................................... ................................................................................................................................................... ...............................................................................................................................................[3]
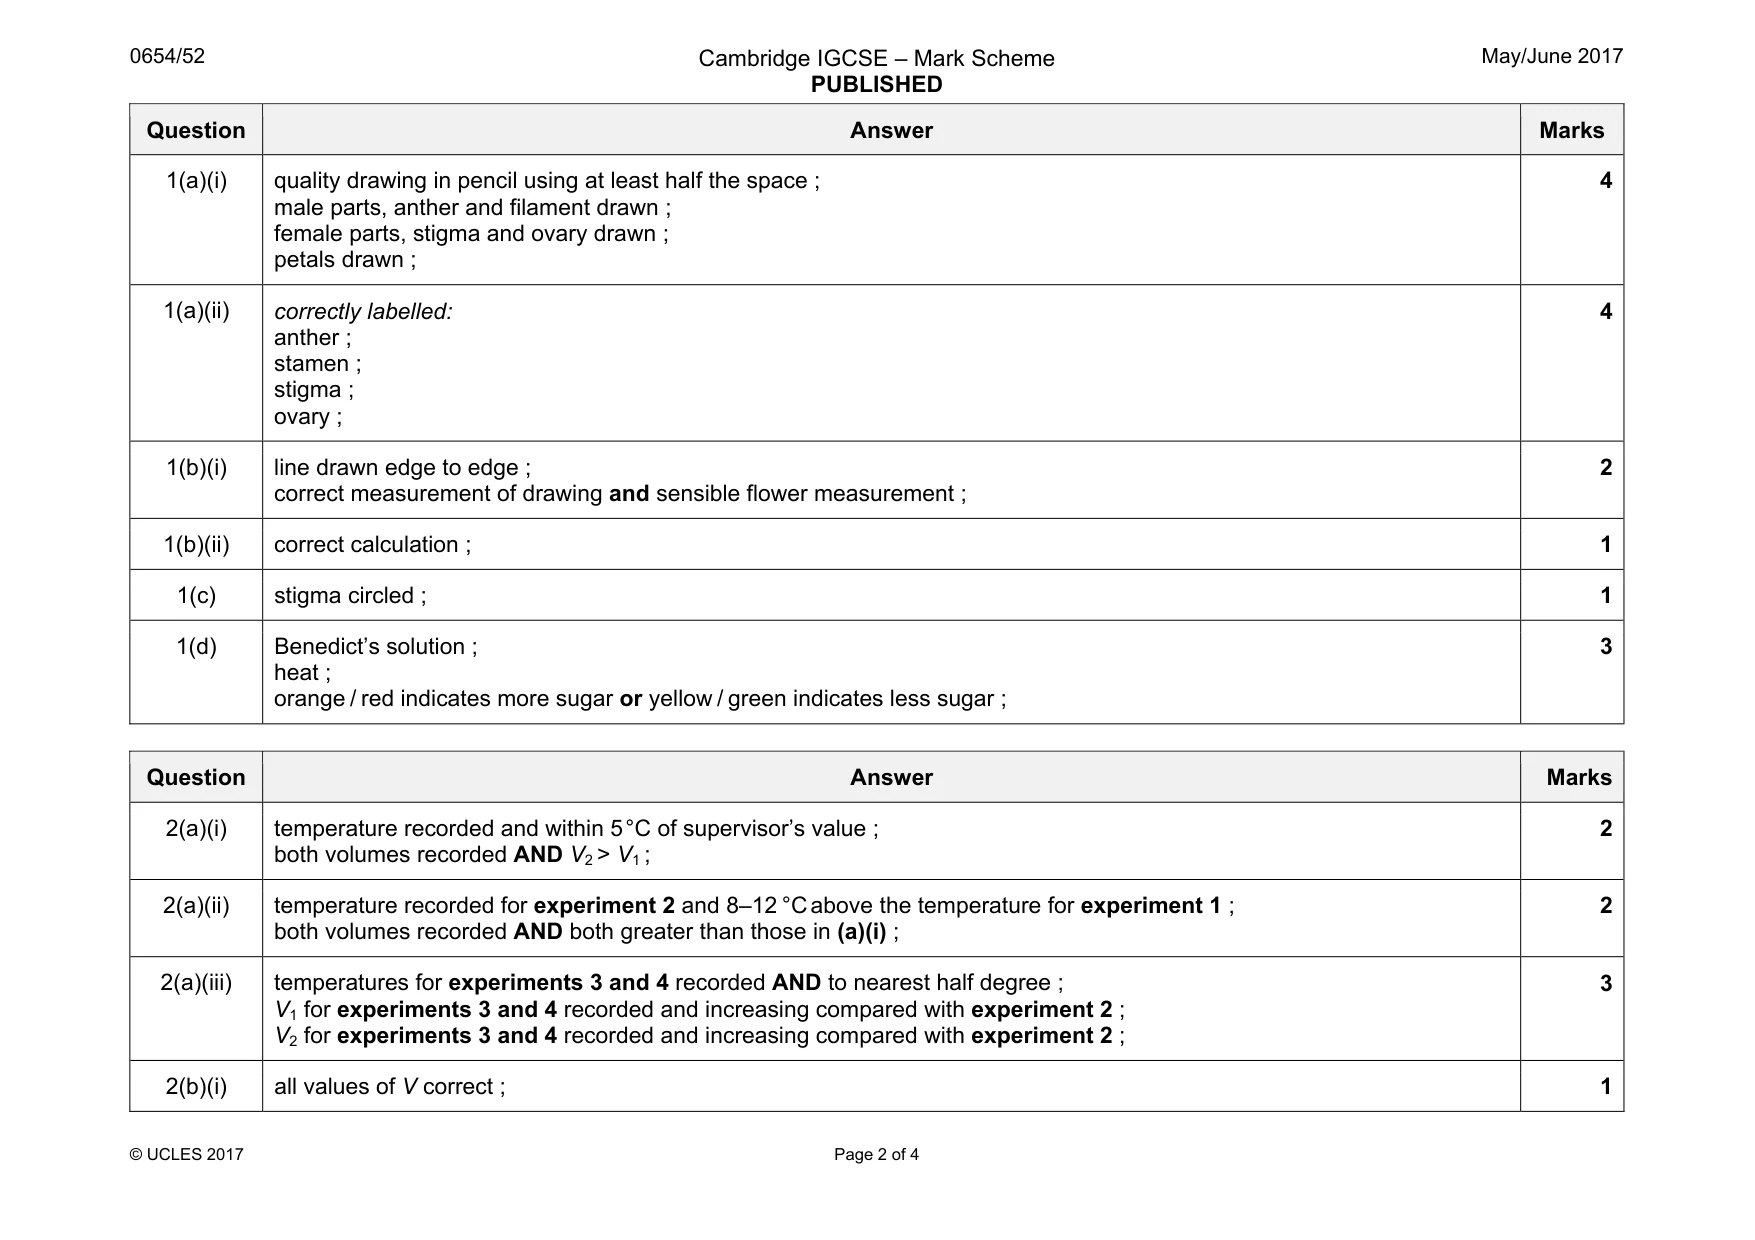
Mark scheme: 1(a)(i) quality drawing in pencil using at least half the space ; male parts, anther and filament drawn ; female parts, stigma and ovary drawn ; petals drawn ; 4 1(a)(ii) correctly labelled: anther ; stamen ; stigma ; ovary ; 4 1(b)(i) line drawn edge to edge ; correct measurement of drawing and sensible flower measurement ; 2 1(b)(ii) correct calculation ; 1 1(c) stigma circled ; 1 1(d) Benedict’s solution ; heat ; orange / red indicates more sugar or yellow / green indicates less sugar ; 3
Q2 · You are going to investigate how the temperature of a reactant affects the rate of…
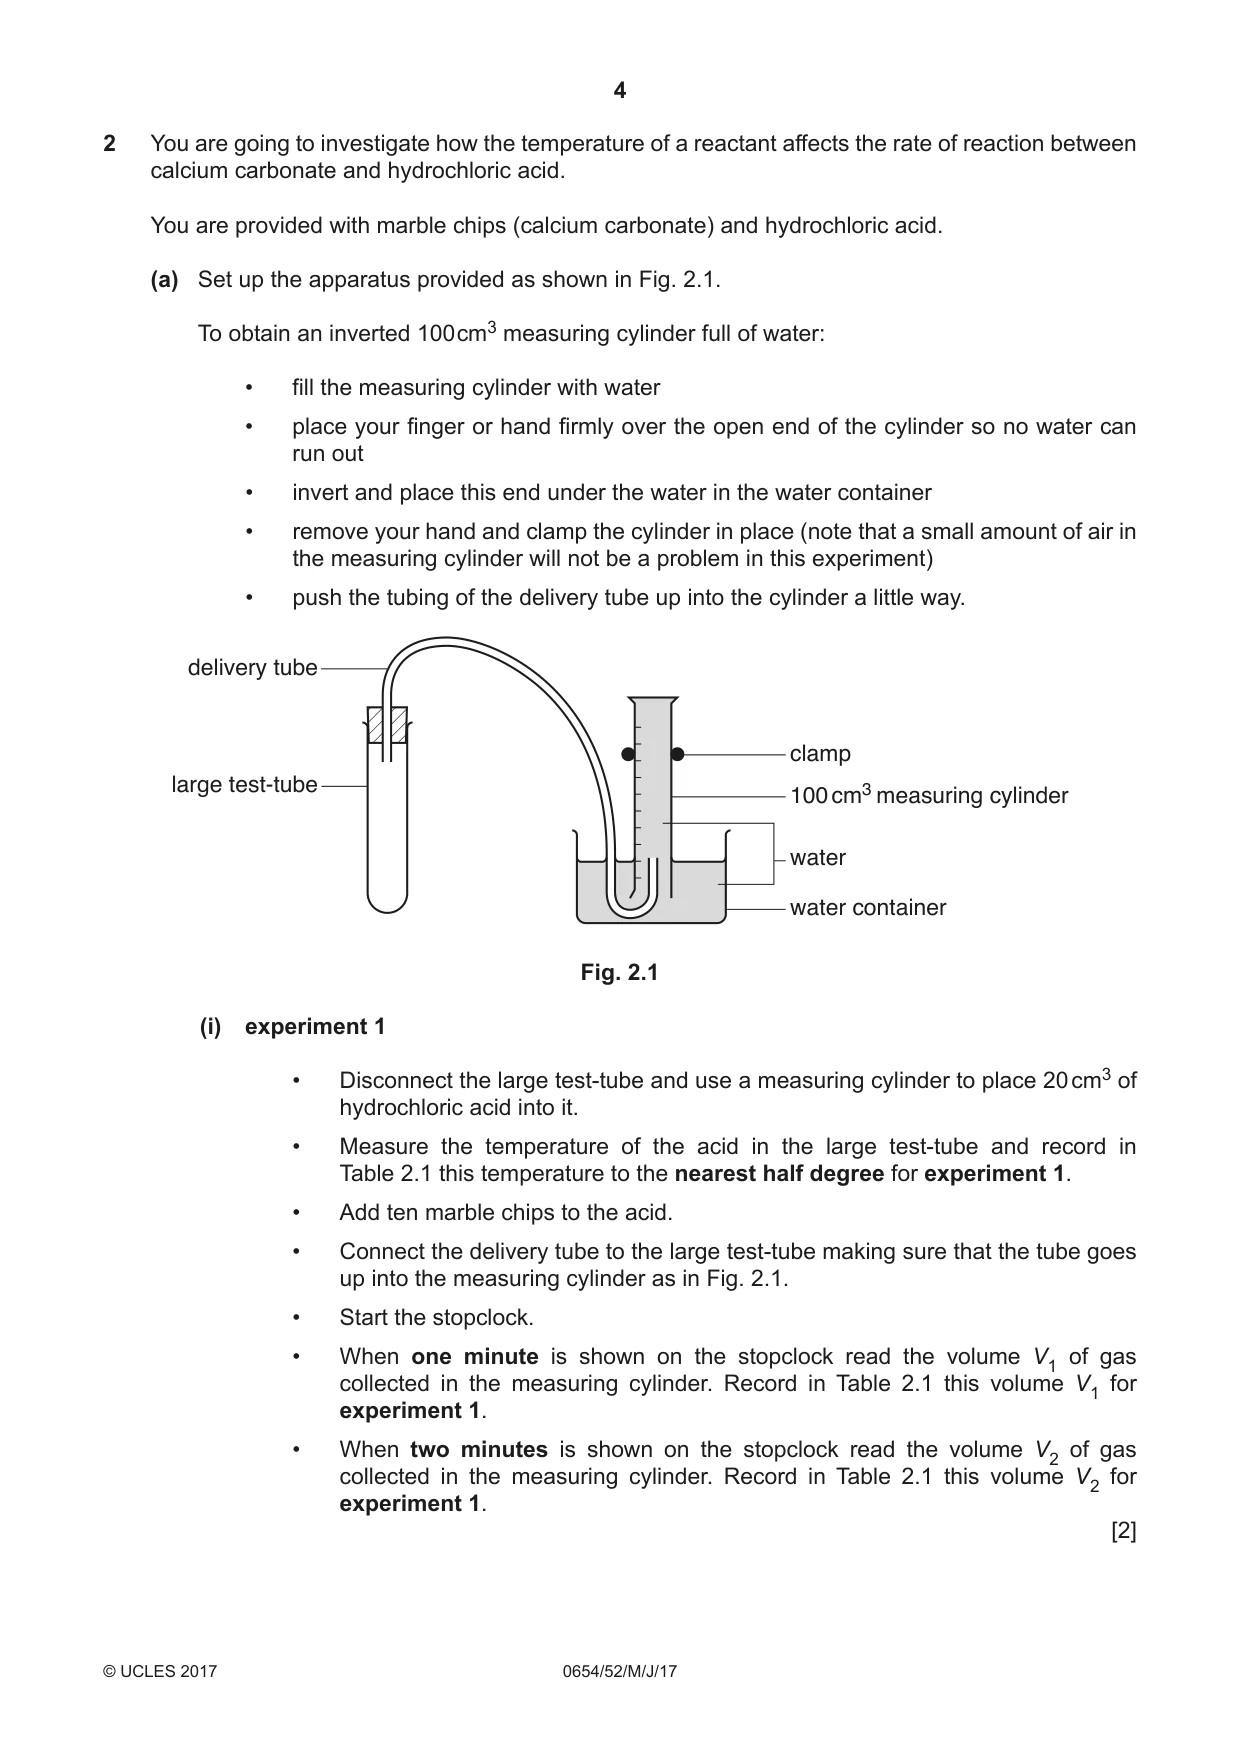
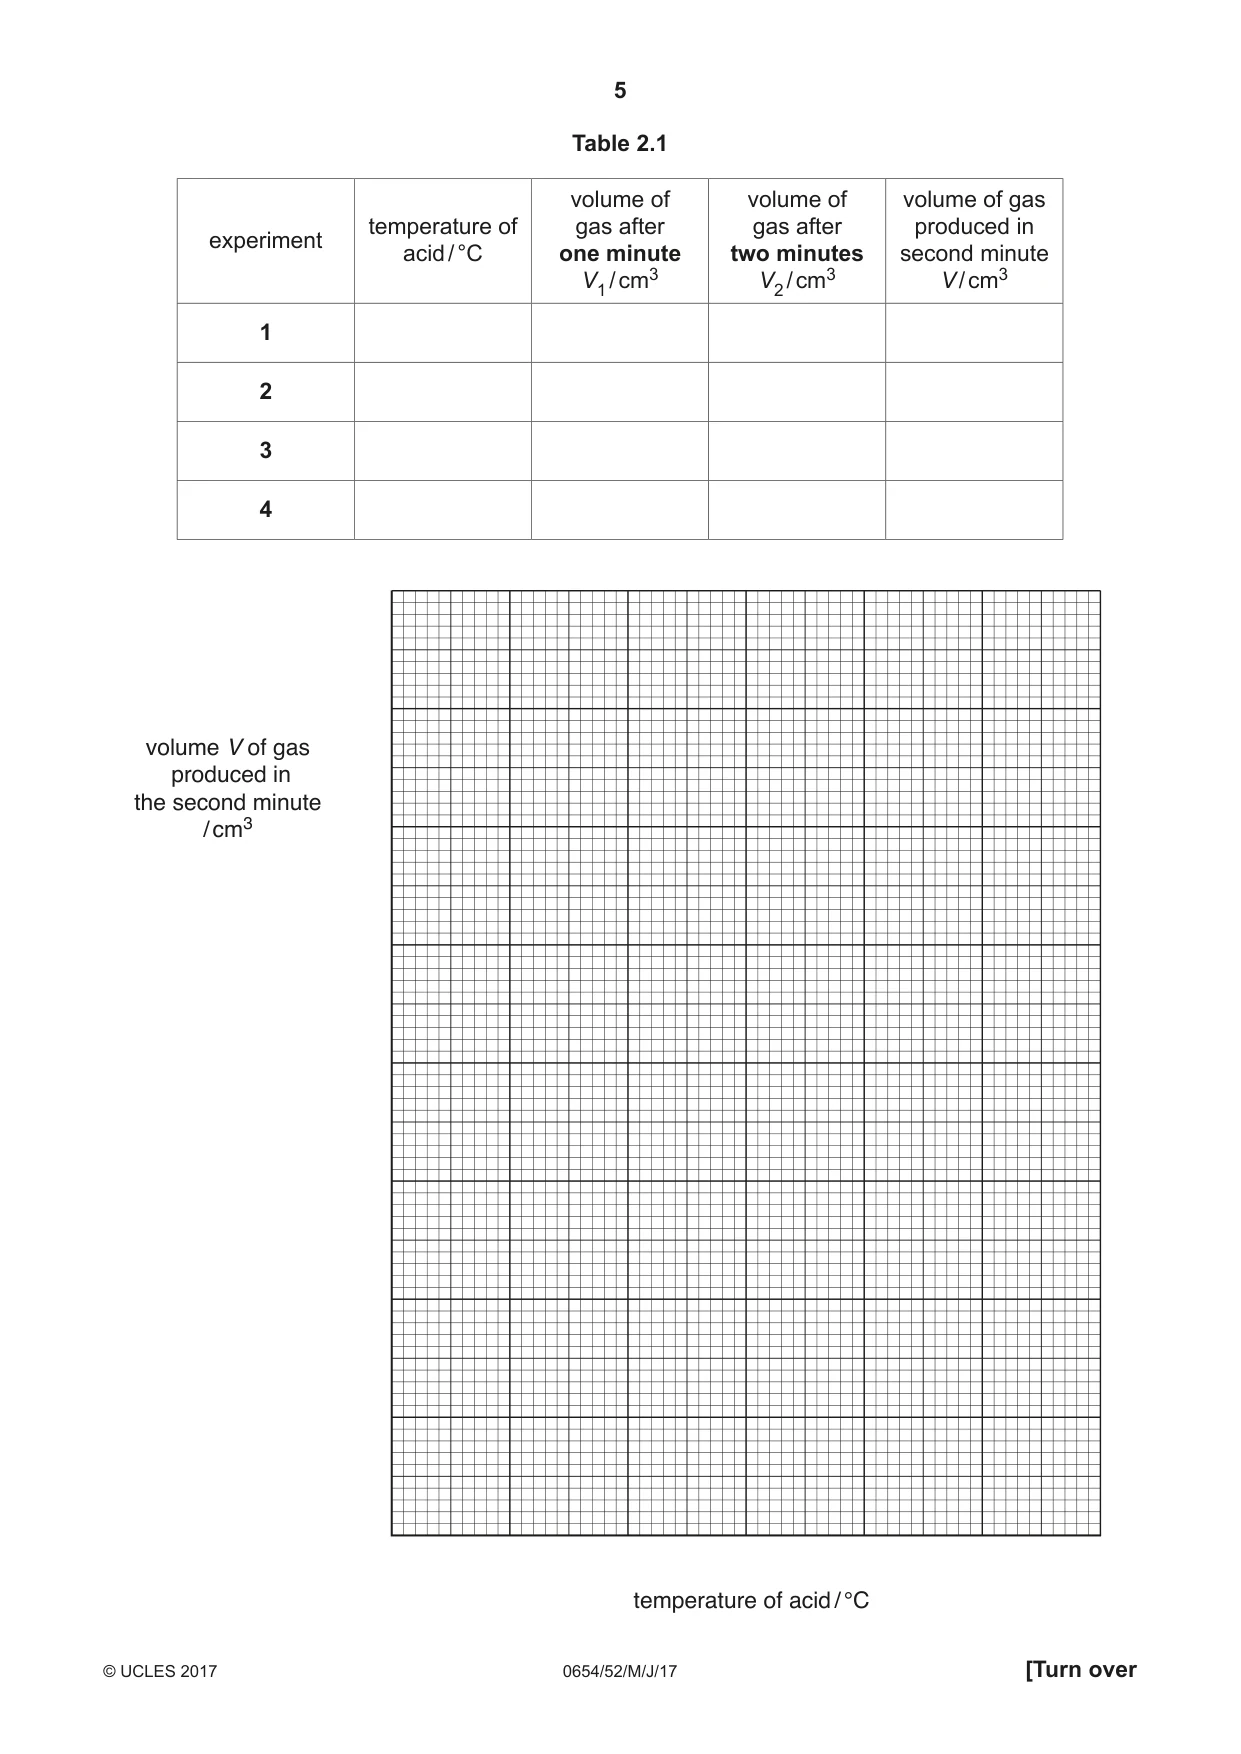
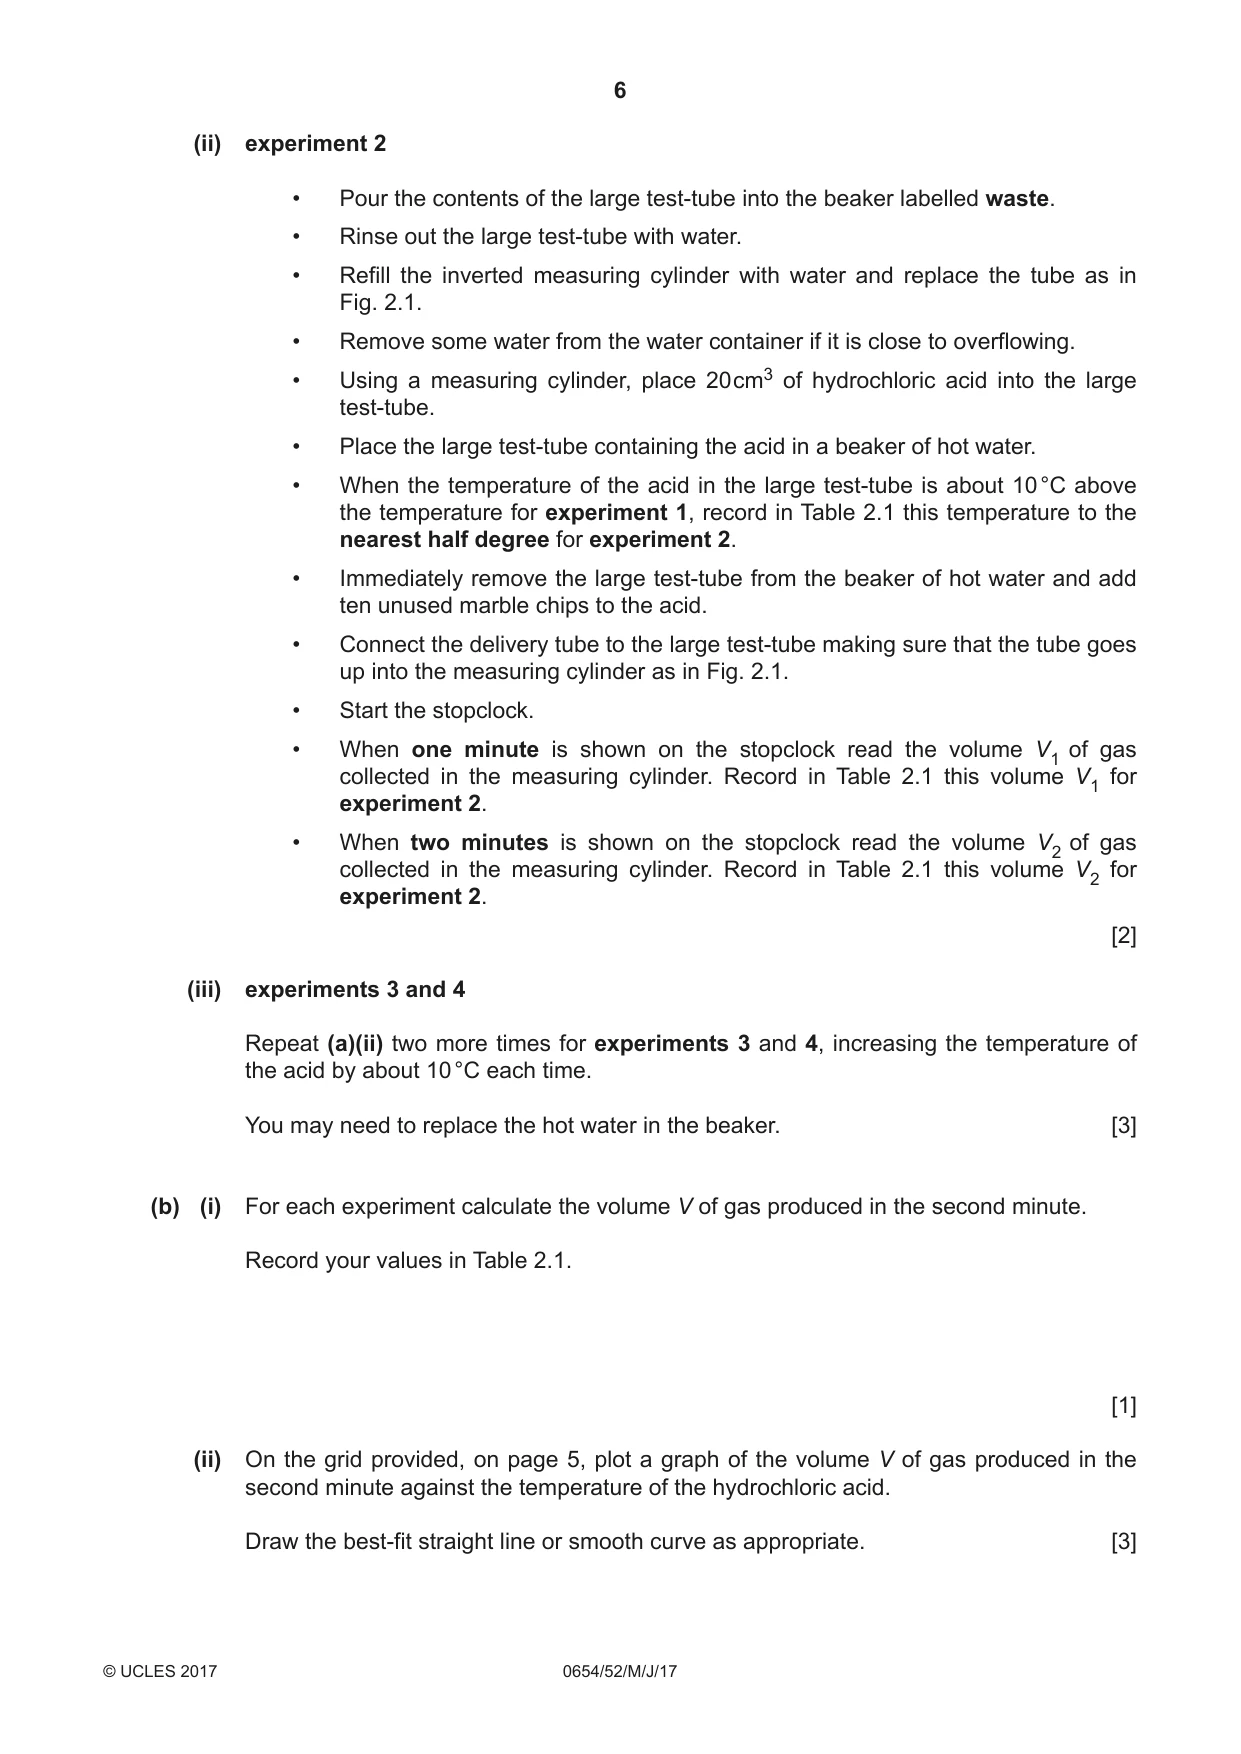
2 You are going to investigate how the temperature of a reactant affects the rate of reaction between calcium carbonate and hydrochloric acid. You are provided with marble chips (calcium carbonate) and hydrochloric acid. (a) Set up the apparatus provided as shown in Fig. 2.1. To obtain an inverted 100 cm3 measuring cylinder full of water: • fill the measuring cylinder with water • place your finger or hand firmly over the open end of the cylinder so no water can run out • invert and place this end under the water in the water container • remove your hand and clamp the cylinder in place (note that a small amount of air in the measuring cylinder will not be a problem in this experiment) • push the tubing of the delivery tube up into the cylinder a little way. delivery tube clamp large test-tube 100 cm3 measuring cylinder water water container Fig. 2.1 (i) experiment 1 • Disconnect the large test-tube and use a measuring cylinder to place 20 cm3 of hydrochloric acid into it. • Measure the temperature of the acid in the large test-tube and record in Table 2.1 this temperature to the nearest half degree for experiment 1. • Add ten marble chips to the acid. • Connect the delivery tube to the large test-tube making sure that the tube goes up into the measuring cylinder as in Fig. 2.1. • Start the stopclock. • When one minute is shown on the stopclock read the volume V1 of gas collected in the measuring cylinder. Record in Table 2.1 this volume V1 for experiment 1. • When two minutes is shown on the stopclock read the volume V2 of gas collected in the measuring cylinder. Record in Table 2.1 this volume V2 for experiment 1. [2] Table 2.1 volume of volume of volume of gas temperature of gas after gas after produced in experiment acid / °C one minute two minutes second minute V1 / cm3 V2 / cm3 V / cm3 1 2 3 4 volume V of gas produced in the second minute / cm3 temperature of acid / °C (ii) experiment 2 • Pour the contents of the large test-tube into the beaker labelled waste. • Rinse out the large test-tube with water. • Refill the inverted measuring cylinder with water and replace the tube as in Fig. 2.1. • Remove some water from the water container if it is close to overflowing. • Using a measuring cylinder, place 20 cm3 of hydrochloric acid into the large test-tube. • Place the large test-tube containing the acid in a beaker of hot water. • When the temperature of the acid in the large test-tube is about 10 °C above the temperature for experiment 1, record in Table 2.1 this temperature to the nearest half degree for experiment 2. • Immediately remove the large test-tube from the beaker of hot water and add ten unused marble chips to the acid. • Connect the delivery tube to the large test-tube making sure that the tube goes up into the measuring cylinder as in Fig. 2.1. • Start the stopclock. • When one minute is shown on the stopclock read the volume V1 of gas collected in the measuring cylinder. Record in Table 2.1 this volume V1 for experiment 2. • When two minutes is shown on the stopclock read the volume V2 of gas collected in the measuring cylinder. Record in Table 2.1 this volume V2 for experiment 2. [2] (iii) experiments 3 and 4 Repeat (a)(ii) two more times for experiments 3 and 4, increasing the temperature of the acid by about 10 °C each time. You may need to replace the hot water in the beaker. [3] (b) (i) For each experiment calculate the volume V of gas produced in the second minute. Record your values in Table 2.1. [1] (ii) On the grid provided, on page 5, plot a graph of the volume V of gas produced in the second minute against the temperature of the hydrochloric acid. Draw the best-fit straight line or smooth curve as appropriate. [3] (c) Use your graph to describe the relationship between the temperature of the acid and the rate of the reaction. ................................................................................................................................................... ...............................................................................................................................................[1] (d) (i) Suggest one reason why it is more accurate to compare the volumes of gas produced in the second minute rather than in the first minute. ........................................................................................................................................... .......................................................................................................................................[1] (ii) Suggest an alternative method for measuring the rate of reaction between marble chips and acid. You may draw a labelled diagram but you must state what is being measured. ........................................................................................................................................... ........................................................................................................................................... ........................................................................................................................................... .......................................................................................................................................[2]
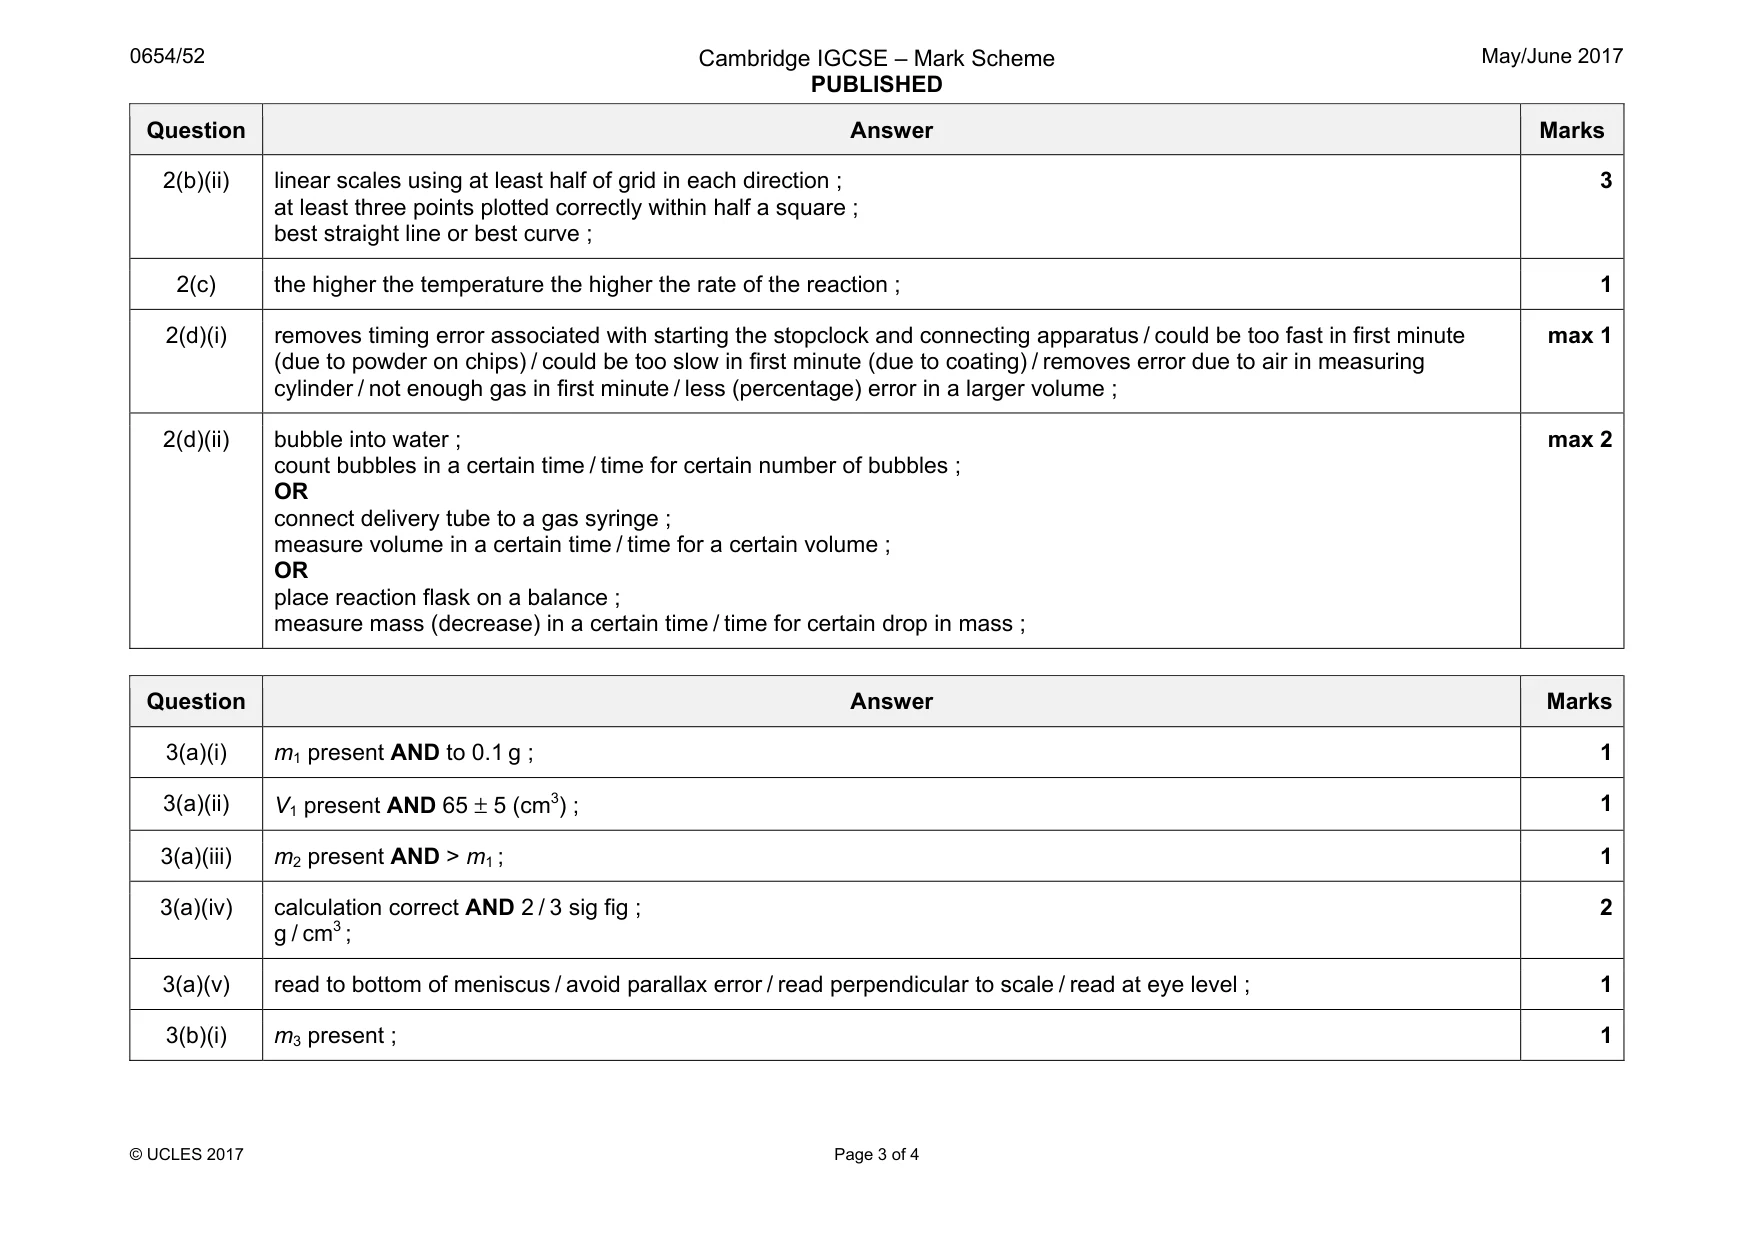
Mark scheme: 2(a)(i) temperature recorded and within 5 °C of supervisor’s value ; both volumes recorded AND V2 > V1 ; 2 2(a)(ii) temperature recorded for experiment 2 and 8–12 °C above the temperature for experiment 1 ; both volumes recorded AND both greater than those in (a)(i) ; 2 2(a)(iii) temperatures for experiments 3 and 4 recorded AND to nearest half degree ; V1 for experiments 3 and 4 recorded and increasing compared with experiment 2 ; V2 for experiments 3 and 4 recorded and increasing compared with experiment 2 ; 3 2(b)(i) all values of V correct ; 1 Question Answer Marks 2(b)(ii) linear scales using at least half of grid in each direction ; at least three points plotted correctly within half a square ; best straight line or best curve ; 3 2(c) the higher the temperature the higher the rate of the reaction ; 1 2(d)(i) removes timing error associated with starting the stopclock and connecting apparatus / could be too fast in first minute (due to powder on chips) / could be too slow in first minute (due to coating) / removes error due to air in measuring cylinder / not enough gas in first minute / less (percentage) error in a larger volume ; max 1 2(d)(ii) bubble into water ; count bubbles in a certain time / time for certain number of bubbles ; OR connect delivery tube to a gas syringe ; measure volume in a certain time / time for a certain volume ; OR place reaction flask on a balance ; measure mass (decrease) in a certain time / time for certain drop in mass ; max 2
Q3 · You are going to find the density of water by two different methods
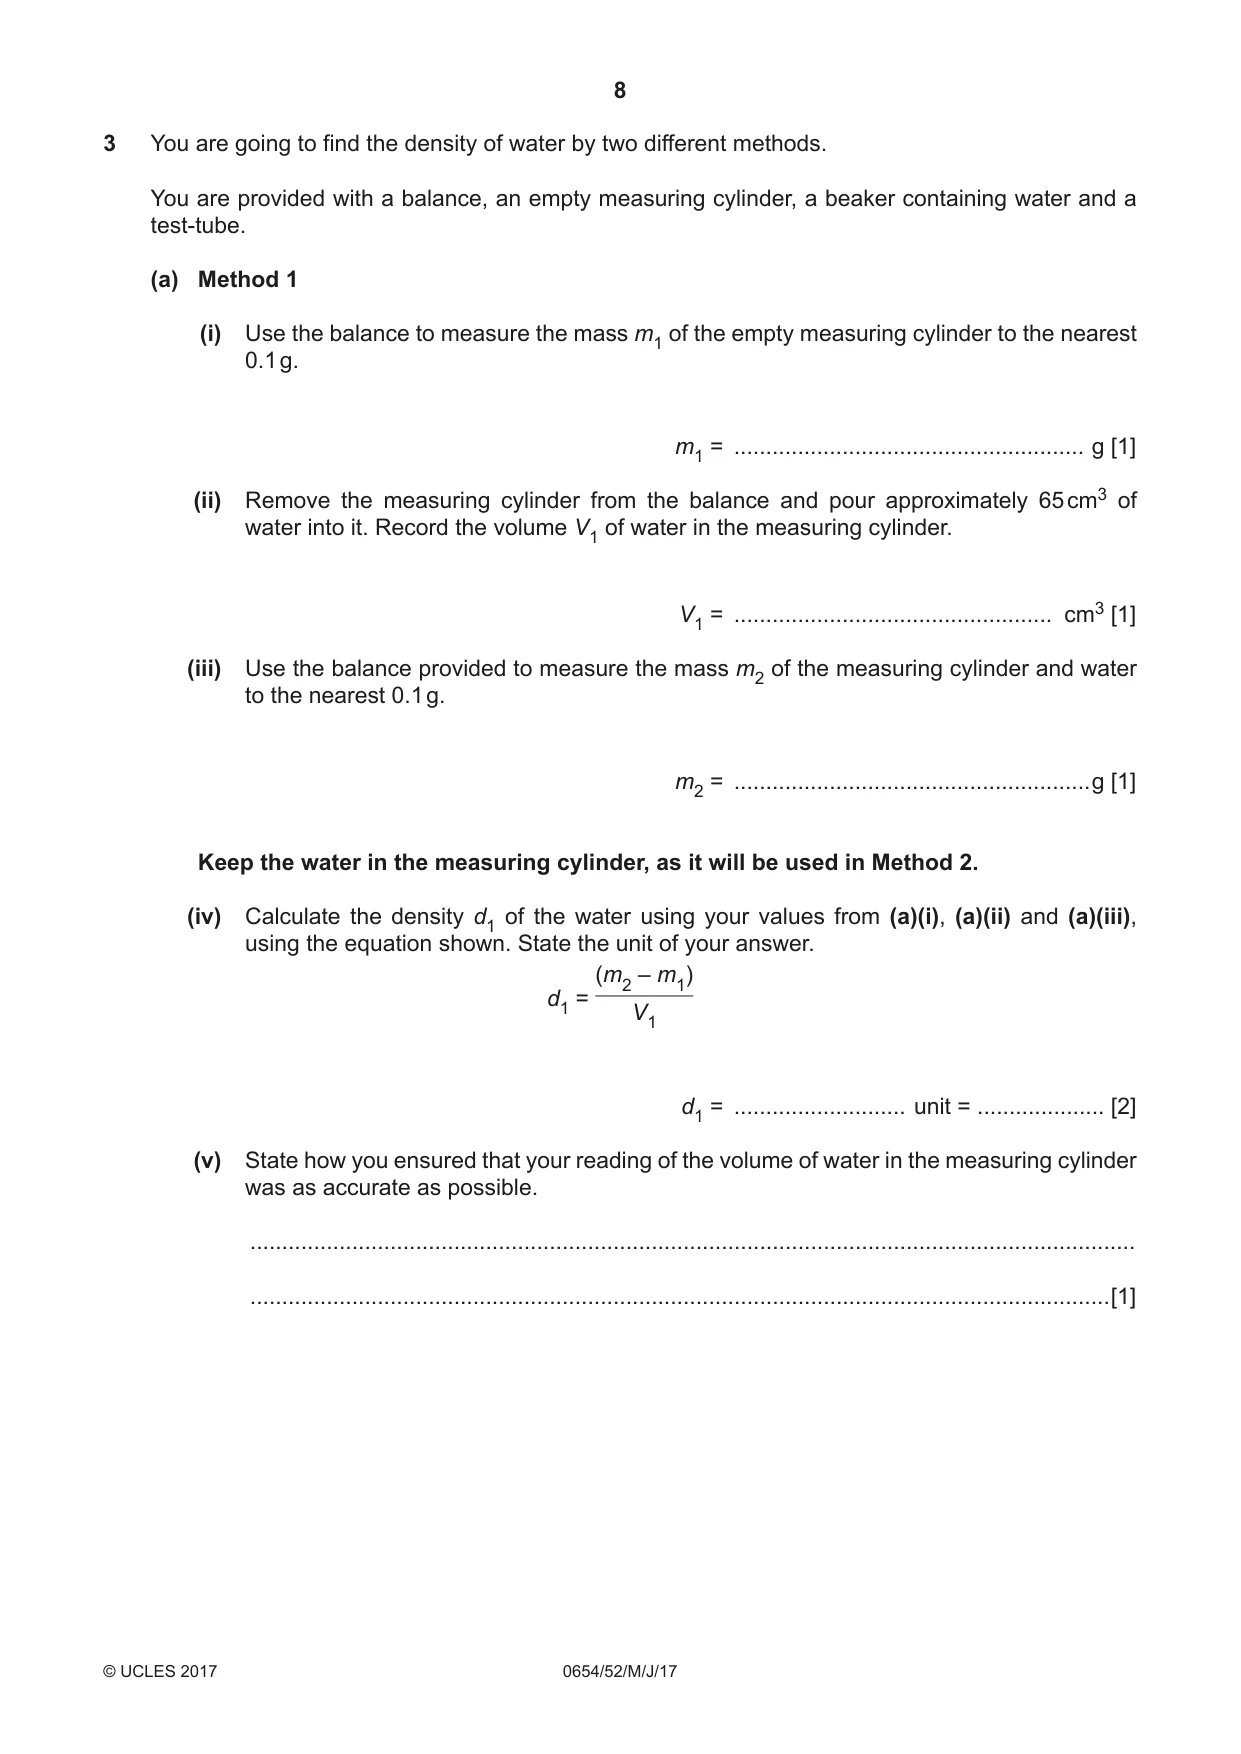
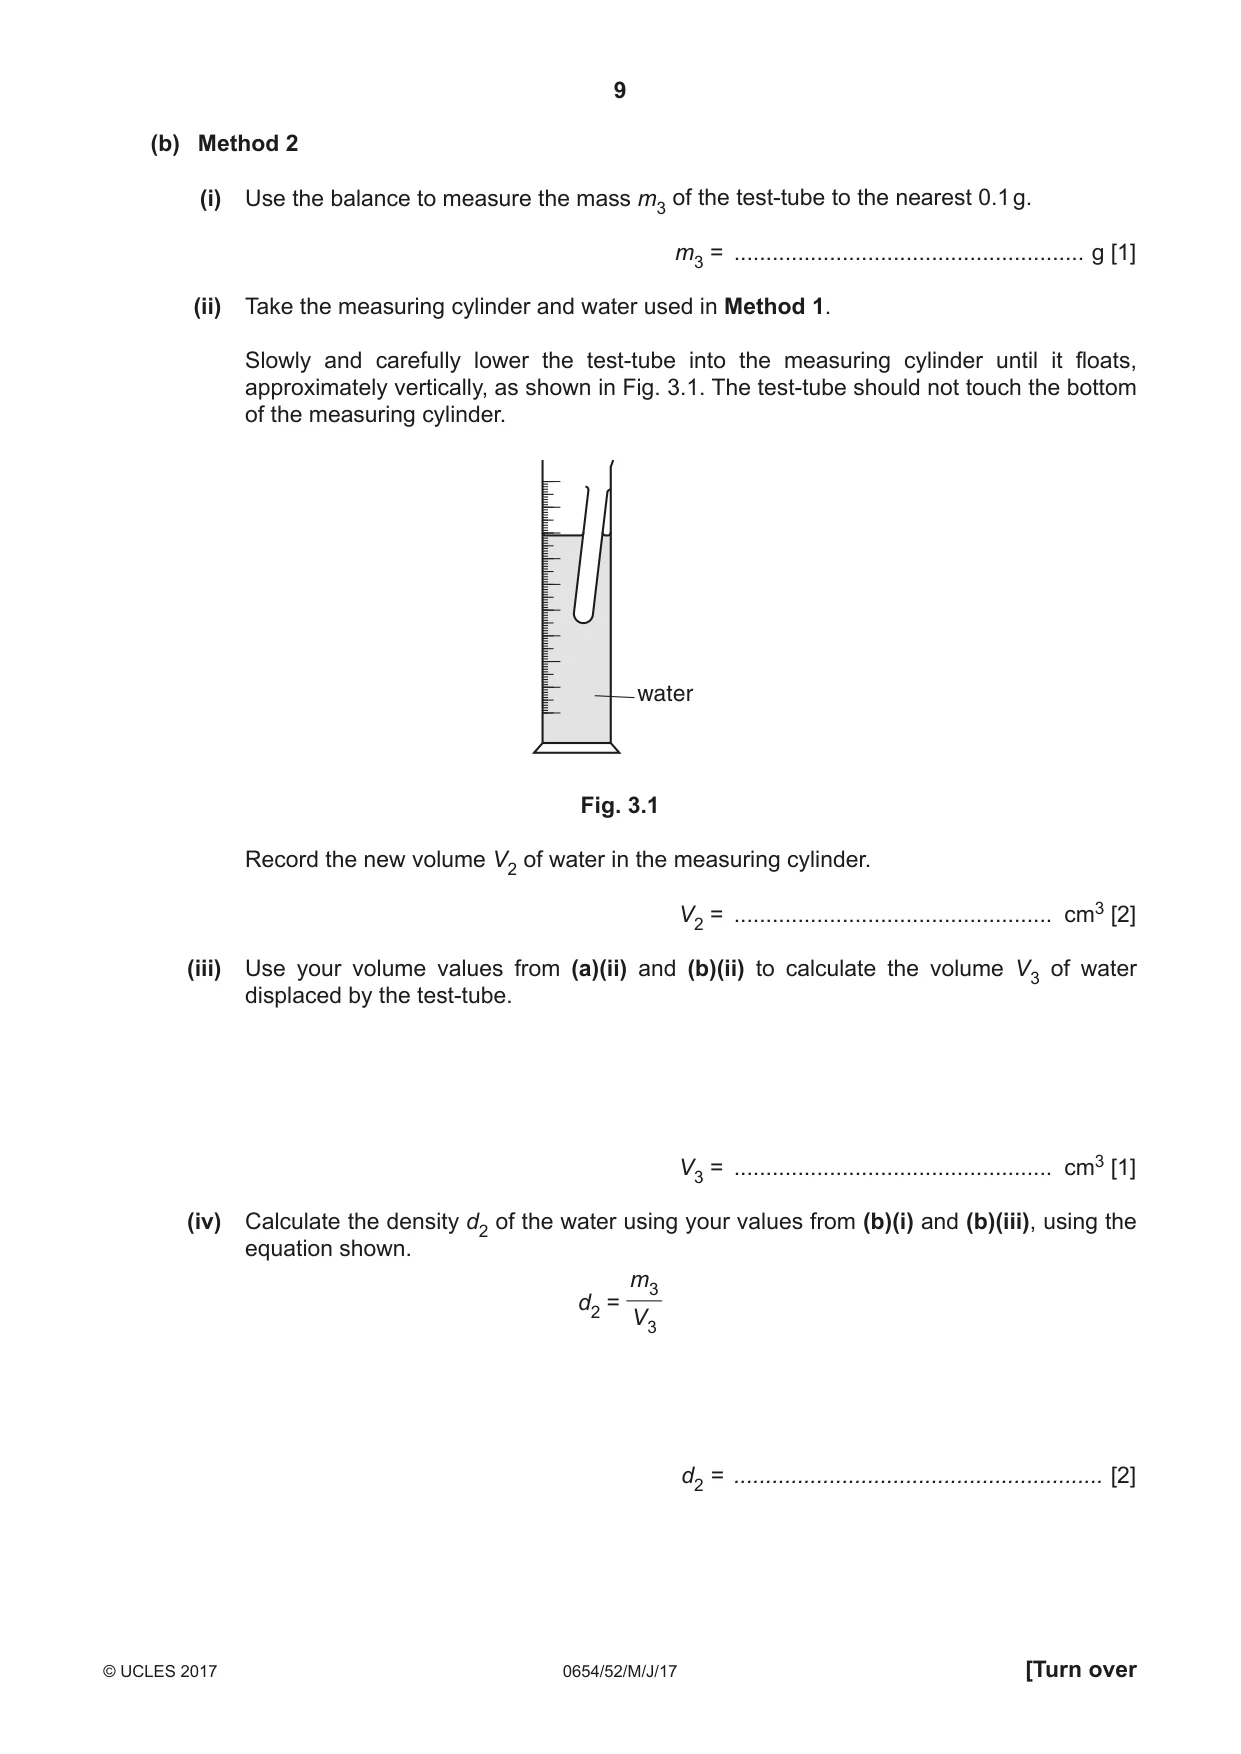
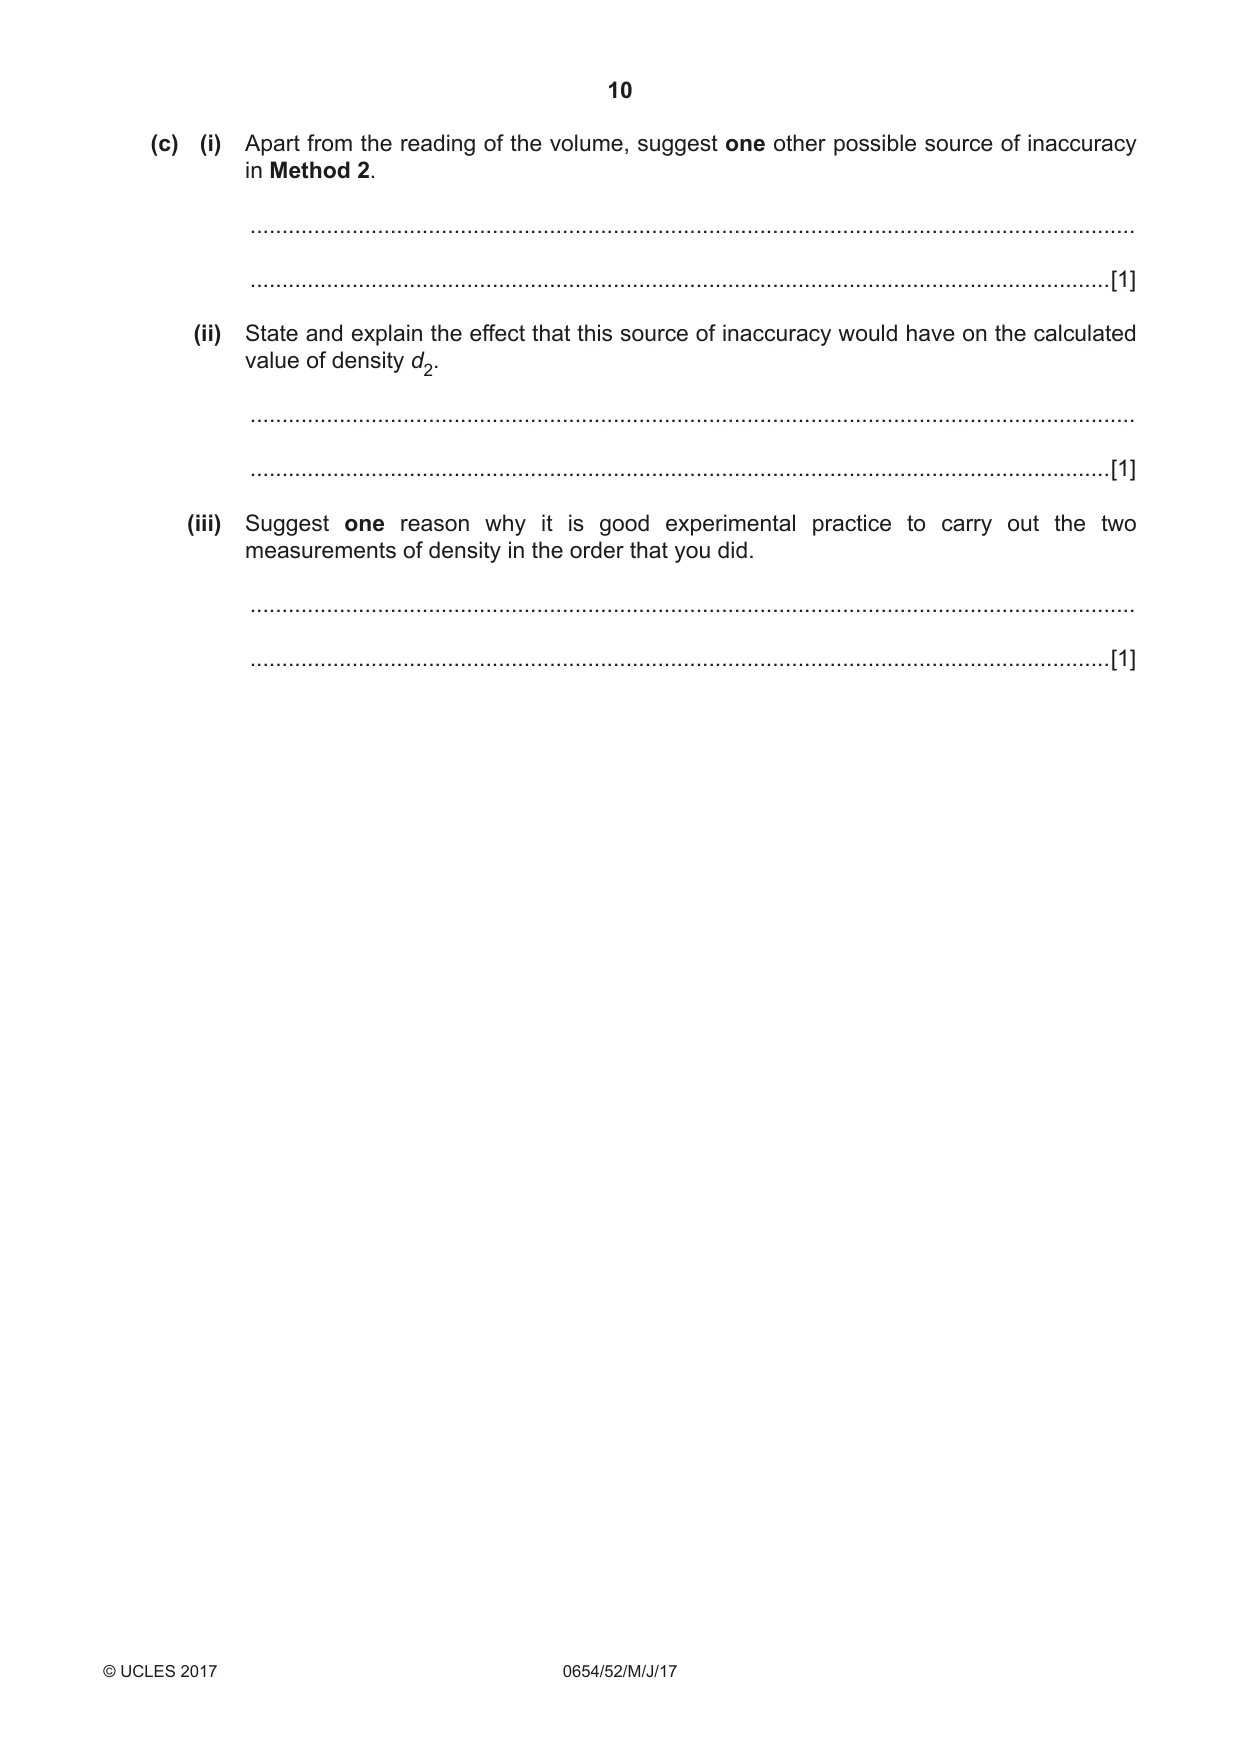
3 You are going to find the density of water by two different methods. You are provided with a balance, an empty measuring cylinder, a beaker containing water and a test-tube. (a) Method 1 (i) Use the balance to measure the mass m1 of the empty measuring cylinder to the nearest 0.1 g. m1 = ....................................................... g [1] (ii) Remove the measuring cylinder from the balance and pour approximately 65 cm3 of water into it. Record the volume V1 of water in the measuring cylinder. V1 = .................................................. cm3 [1] (iii) Use the balance provided to measure the mass m2 of the measuring cylinder and water to the nearest 0.1 g. m2 = ........................................................g [1] Keep the water in the measuring cylinder, as it will be used in Method 2. (iv) Calculate the density d1 of the water using your values from (a)(i), (a)(ii) and (a)(iii), using the equation shown. State the unit of your answer. (m2 – m1) d1 = V1 d1 = ........................... unit = .................... [2] (v) State how you ensured that your reading of the volume of water in the measuring cylinder was as accurate as possible. ........................................................................................................................................... .......................................................................................................................................[1] (b) Method 2 (i) Use the balance to measure the mass m3 of the test-tube to the nearest 0.1 g. m3 = ....................................................... g [1] (ii) Take the measuring cylinder and water used in Method 1. Slowly and carefully lower the test-tube into the measuring cylinder until it floats, approximately vertically, as shown in Fig. 3.1. The test-tube should not touch the bottom of the measuring cylinder. water Fig. 3.1 Record the new volume V2 of water in the measuring cylinder. V2 = .................................................. cm3 [2] (iii) Use your volume values from (a)(ii) and (b)(ii) to calculate the volume V3 of water displaced by the test-tube. V3 = .................................................. cm3 [1] (iv) Calculate the density d2 of the water using your values from (b)(i) and (b)(iii), using the equation shown. m3 d2 = V3 d2 = .......................................................... [2] (c) (i) Apart from the reading of the volume, suggest one other possible source of inaccuracy in Method 2. ........................................................................................................................................... .......................................................................................................................................[1] (ii) State and explain the effect that this source of inaccuracy would have on the calculated value of density d2. ........................................................................................................................................... .......................................................................................................................................[1] (iii) Suggest one reason why it is good experimental practice to carry out the two measurements of density in the order that you did. ........................................................................................................................................... .......................................................................................................................................[1]
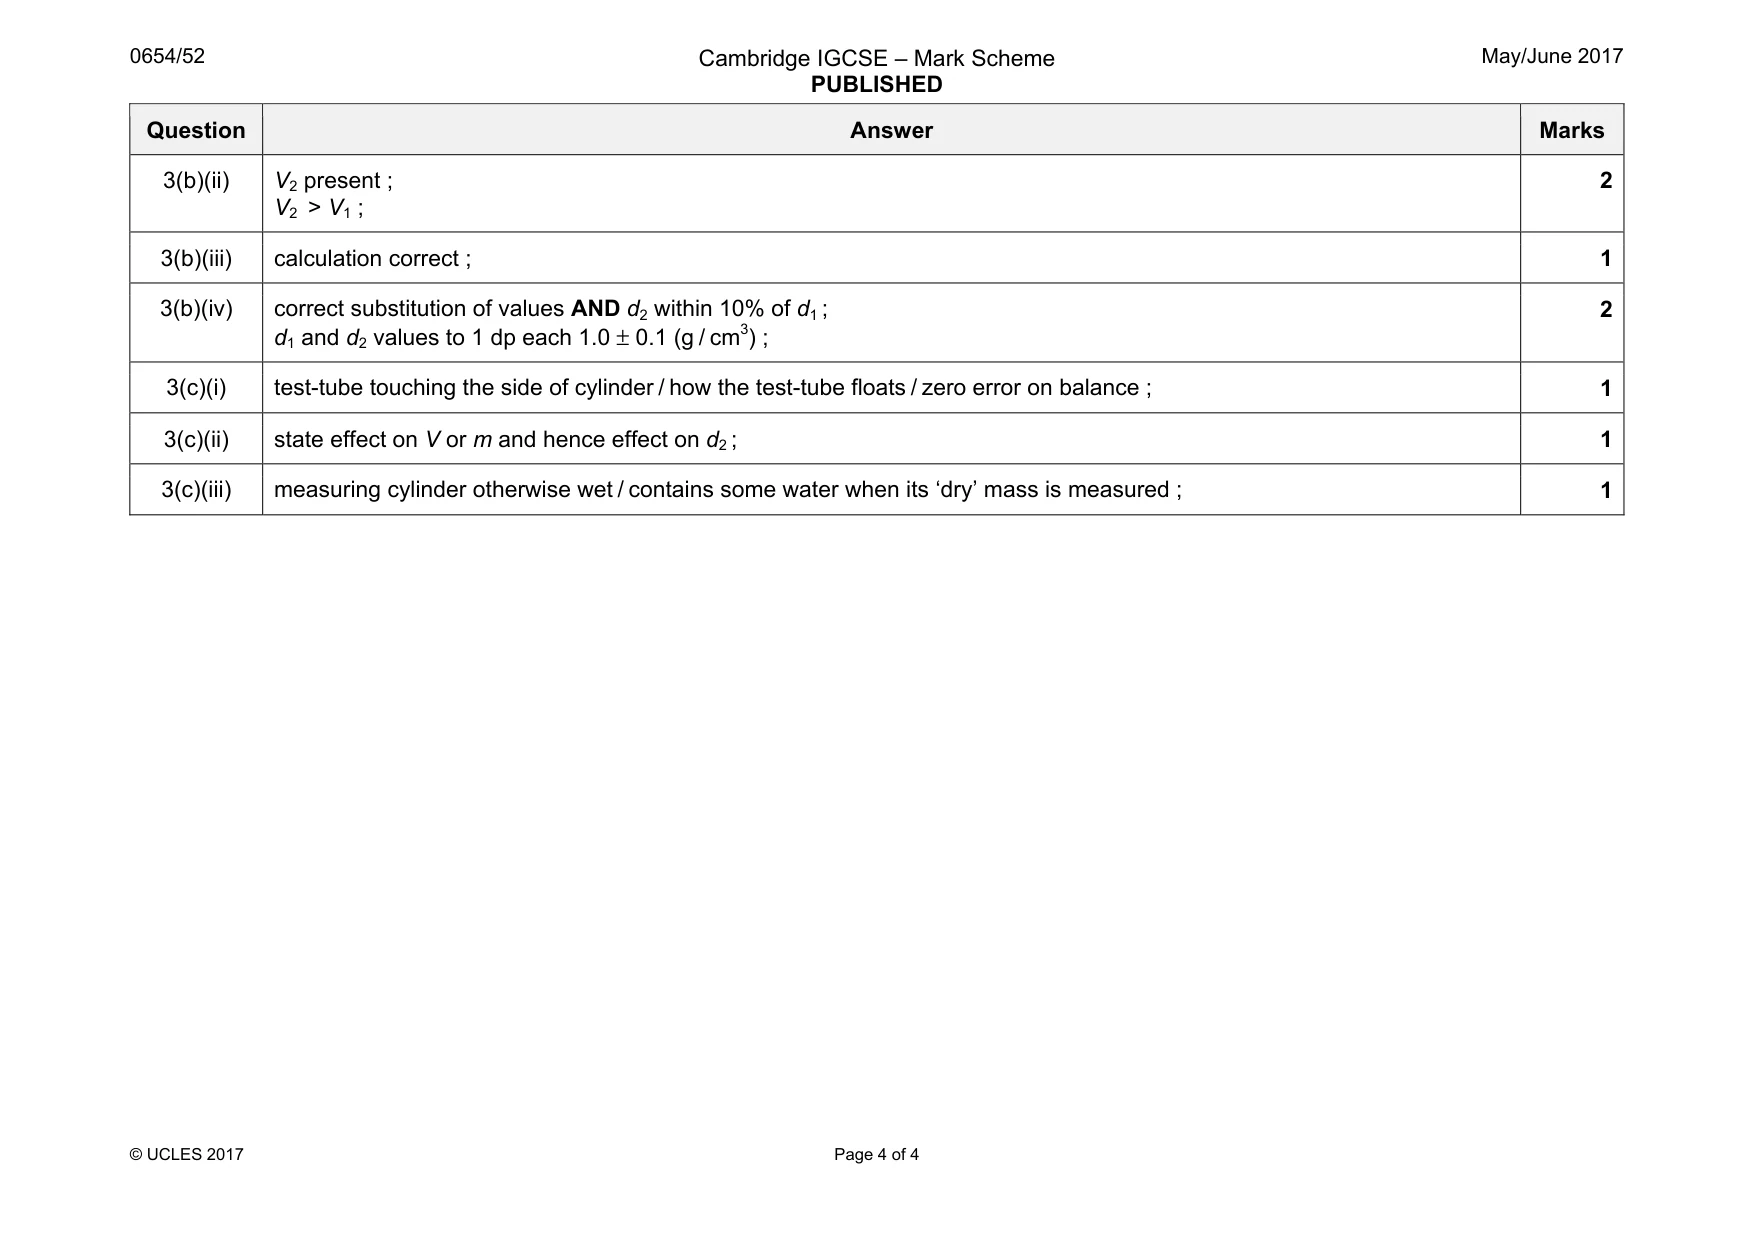
Mark scheme: 3(a)(i) m1 present AND to 0.1 g ; 1 3(a)(ii) V1 present AND 65 ± 5 (cm3) ; 1 3(a)(iii) m2 present AND > m1 ; 1 3(a)(iv) calculation correct AND 2 / 3 sig fig ; g / cm3 ; 2 3(a)(v) read to bottom of meniscus / avoid parallax error / read perpendicular to scale / read at eye level ; 1 3(b)(i) m3 present ; 1 Question Answer Marks 3(b)(ii) V2 present ; V2 > V1 ; 2 3(b)(iii) calculation correct ; 1 3(b)(iv) correct substitution of values AND d2 within 10% of d1 ; d1 and d2 values to 1 dp each 1.0 ± 0.1 (g / cm3) ; 2 3(c)(i) test-tube touching the side of cylinder / how the test-tube floats / zero error on balance ; 1 3(c)(ii) state effect on V or m and hence effect on d2 ; 1 3(c)(iii) measuring cylinder otherwise wet / contains some water when its ‘dry’ mass is measured ; 1
What was in this paper
The subtopics covered by these 3 questions, and how many questions each got. Open one in a new tab to see every Cambridge question on it.
What you needed in this session
Cambridge’s own grade thresholds for 2017 May/June, Paper 5 · Variant 2. A higher threshold means an easier paper — the bar moves with how the cohort did.