Cambridge IGCSE Sciences - Co-ordinated (Double) 0654 — 2011 Oct/Nov Paper 5 · Variant 3
0654/53/O/N/11 · 45 marks · ≈51 min
The question paper and its mark scheme, free to read here and free to download. This is Cambridge’s own paper, exactly as it was sat.
Question paper12 pages

Mark scheme3 pages
Answers below. Sit the paper first if you are practising.
Paper as text
Question paper, page 1
This document consists of 11 printed pages and 1 blank page. IB11 11_0654_53/7RP © UCLES 2011 [Turn over *4251872531* For Examiner's Use 1 2 3 Total UNIVERSITY OF CAMBRIDGE INTERNATIONAL EXAMINATIONS International General Certificate of Secondary Education CO-ORDINATED SCIENCES 0654/53 Paper 5 Practical Test October/November 2011 2 hours Candidates answer on the Question Paper. Additional Materials: As listed in Instructions to Supervisors READ THESE INSTRUCTIONS FIRST Write your Centre number, candidate number and name on all the work you hand in. Write in dark blue or black pen. You may use a pencil for any diagrams, graphs or rough working. Do not use staples, paper clips, highlighters, glue or correction fluid. DO NOT WRITE IN ANY BARCODES. Answer all questions. Chemistry practical notes for this paper are printed on page 12. At the end of the examination, fasten all your work securely together. The number of marks is given in brackets [ ] at the end of each question or part question. www.XtremePapers.com
Question paper, page 2
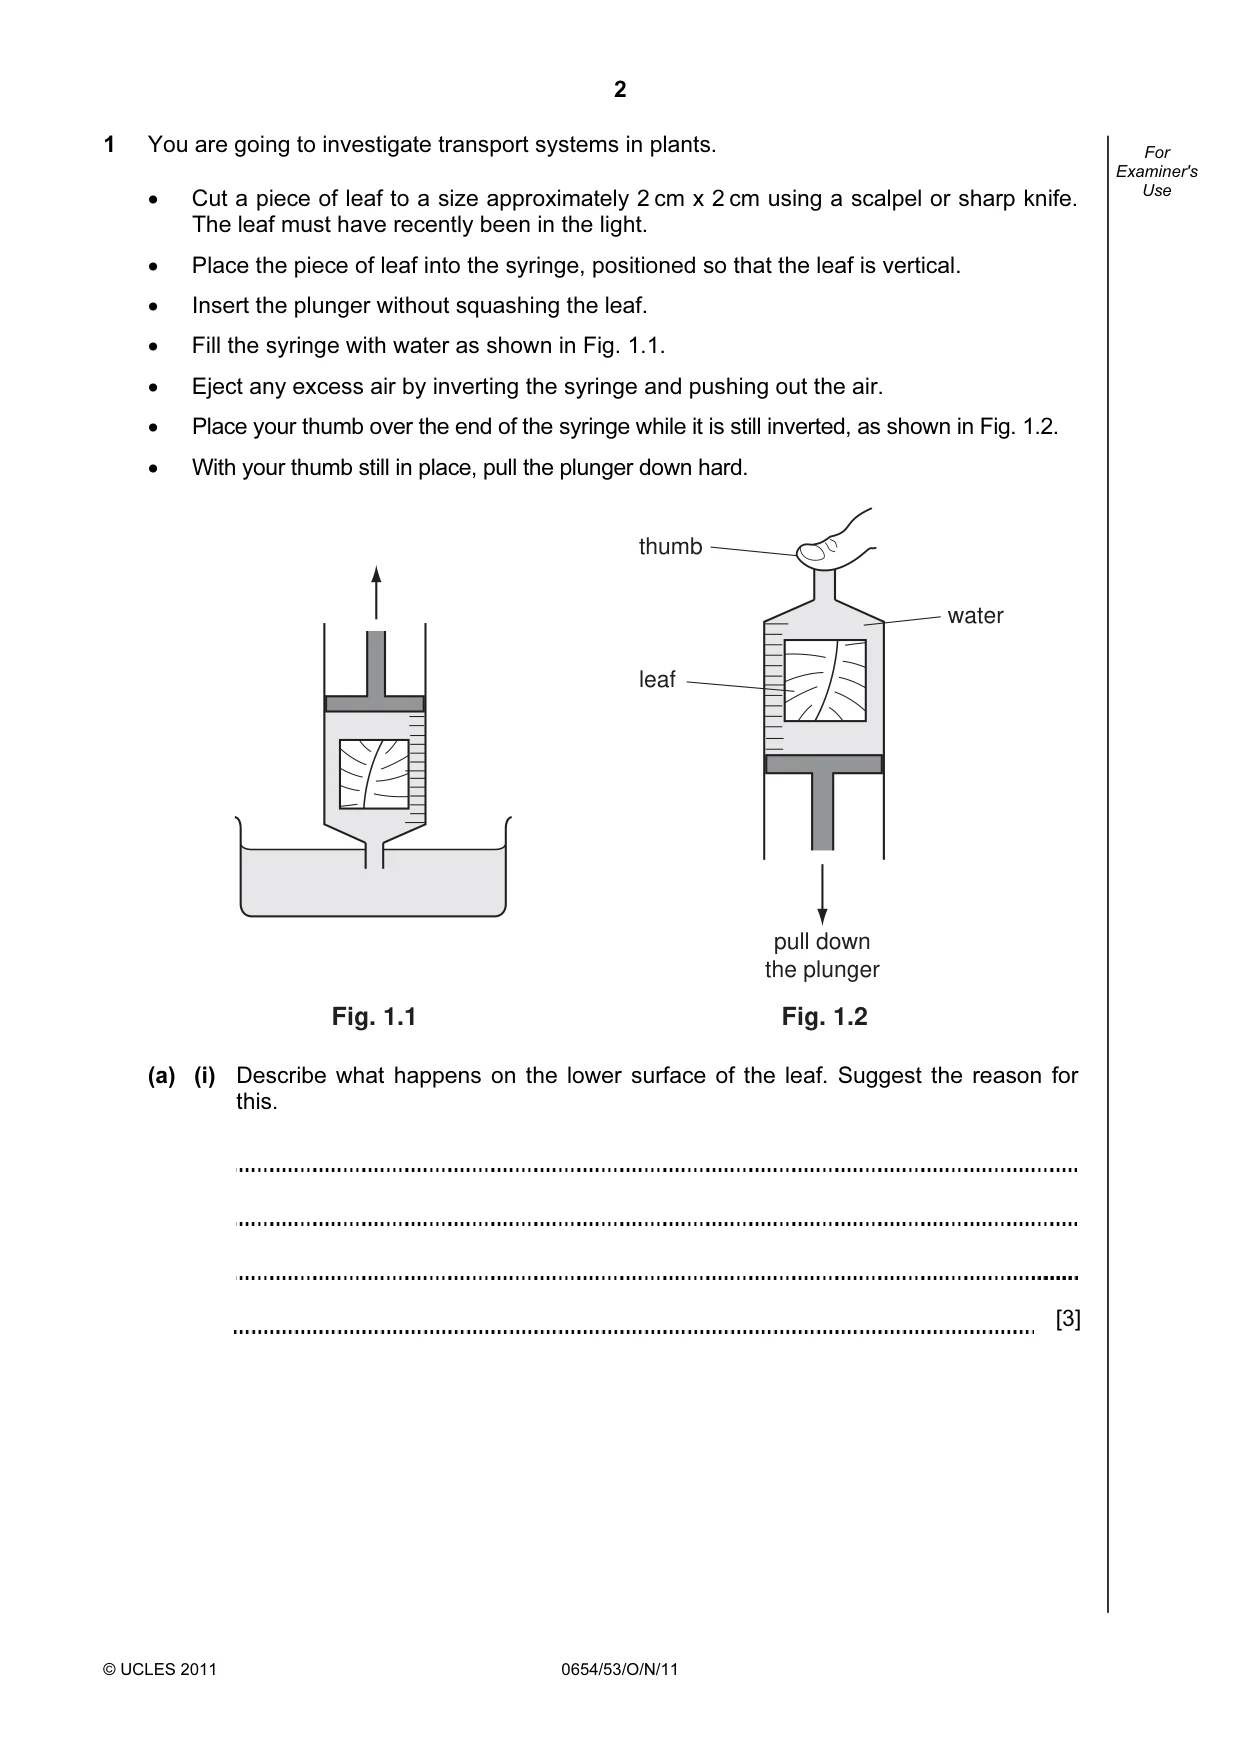
2 © UCLES 2011 0654/53/O/N/11 For Examiner's Use 1 You are going to investigate transport systems in plants. • Cut a piece of leaf to a size approximately 2 cm x 2 cm using a scalpel or sharp knife. The leaf must have recently been in the light. • Place the piece of leaf into the syringe, positioned so that the leaf is vertical. • Insert the plunger without squashing the leaf. • Fill the syringe with water as shown in Fig. 1.1. • Eject any excess air by inverting the syringe and pushing out the air. • Place your thumb over the end of the syringe while it is still inverted, as shown in Fig. 1.2. • With your thumb still in place, pull the plunger down hard. pull down the plunger thumb water leaf Fig. 1.2 Fig. 1.1 (a) (i) Describe what happens on the lower surface of the leaf. Suggest the reason for this. [3]
Question paper, page 3
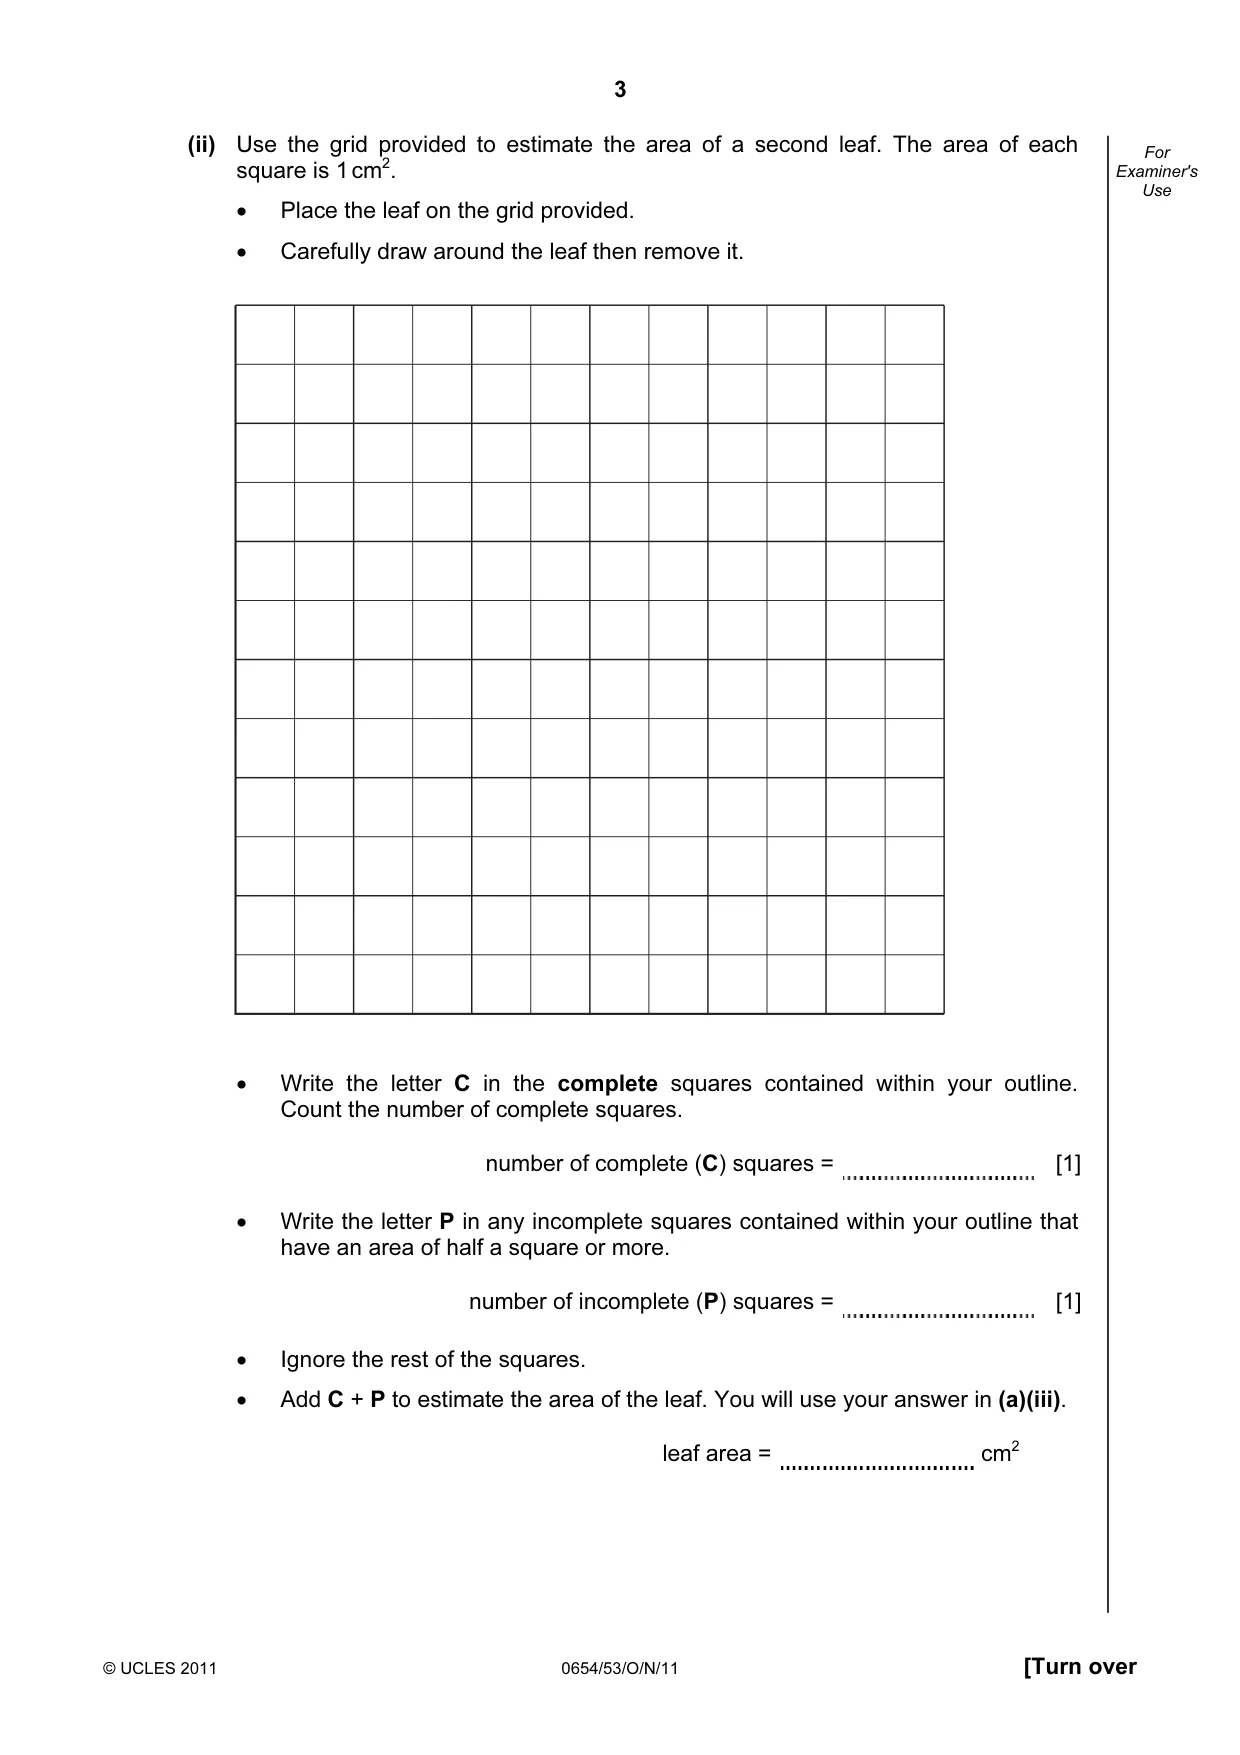
3 © UCLES 2011 0654/53/O/N/11 [Turn over For Examiner's Use (ii) Use the grid provided to estimate the area of a second leaf. The area of each square is 1 cm2. • Place the leaf on the grid provided. • Carefully draw around the leaf then remove it. • Write the letter C in the complete squares contained within your outline. Count the number of complete squares. number of complete (C) squares = [1] • Write the letter P in any incomplete squares contained within your outline that have an area of half a square or more. number of incomplete (P) squares = [1] • Ignore the rest of the squares. • Add C + P to estimate the area of the leaf. You will use your answer in (a)(iii). leaf area = cm2
Question paper, page 4
4 © UCLES 2011 0654/53/O/N/11 For Examiner's Use (iii) There are usually about 100 stomata in every square millimetre of the lower surface of a leaf. Using the surface area you determined in (a)(ii), calculate the total number of stomata found on the lower surface of the leaf. number of stomata = [2] (iv) The number of stomata on the upper surface of a leaf is usually fewer than on the lower surface. Explain why this is of benefit to the plant. [3] (b) (i) You have been given a piece of plant stem that has been placed in red dye for 2 hours. Cut a horizontal section through the stem. Draw a cross section of the stem showing clearly the position of the red dye. Name and label the tissue where the red dye is found on the diagram. [3]
Question paper, page 5
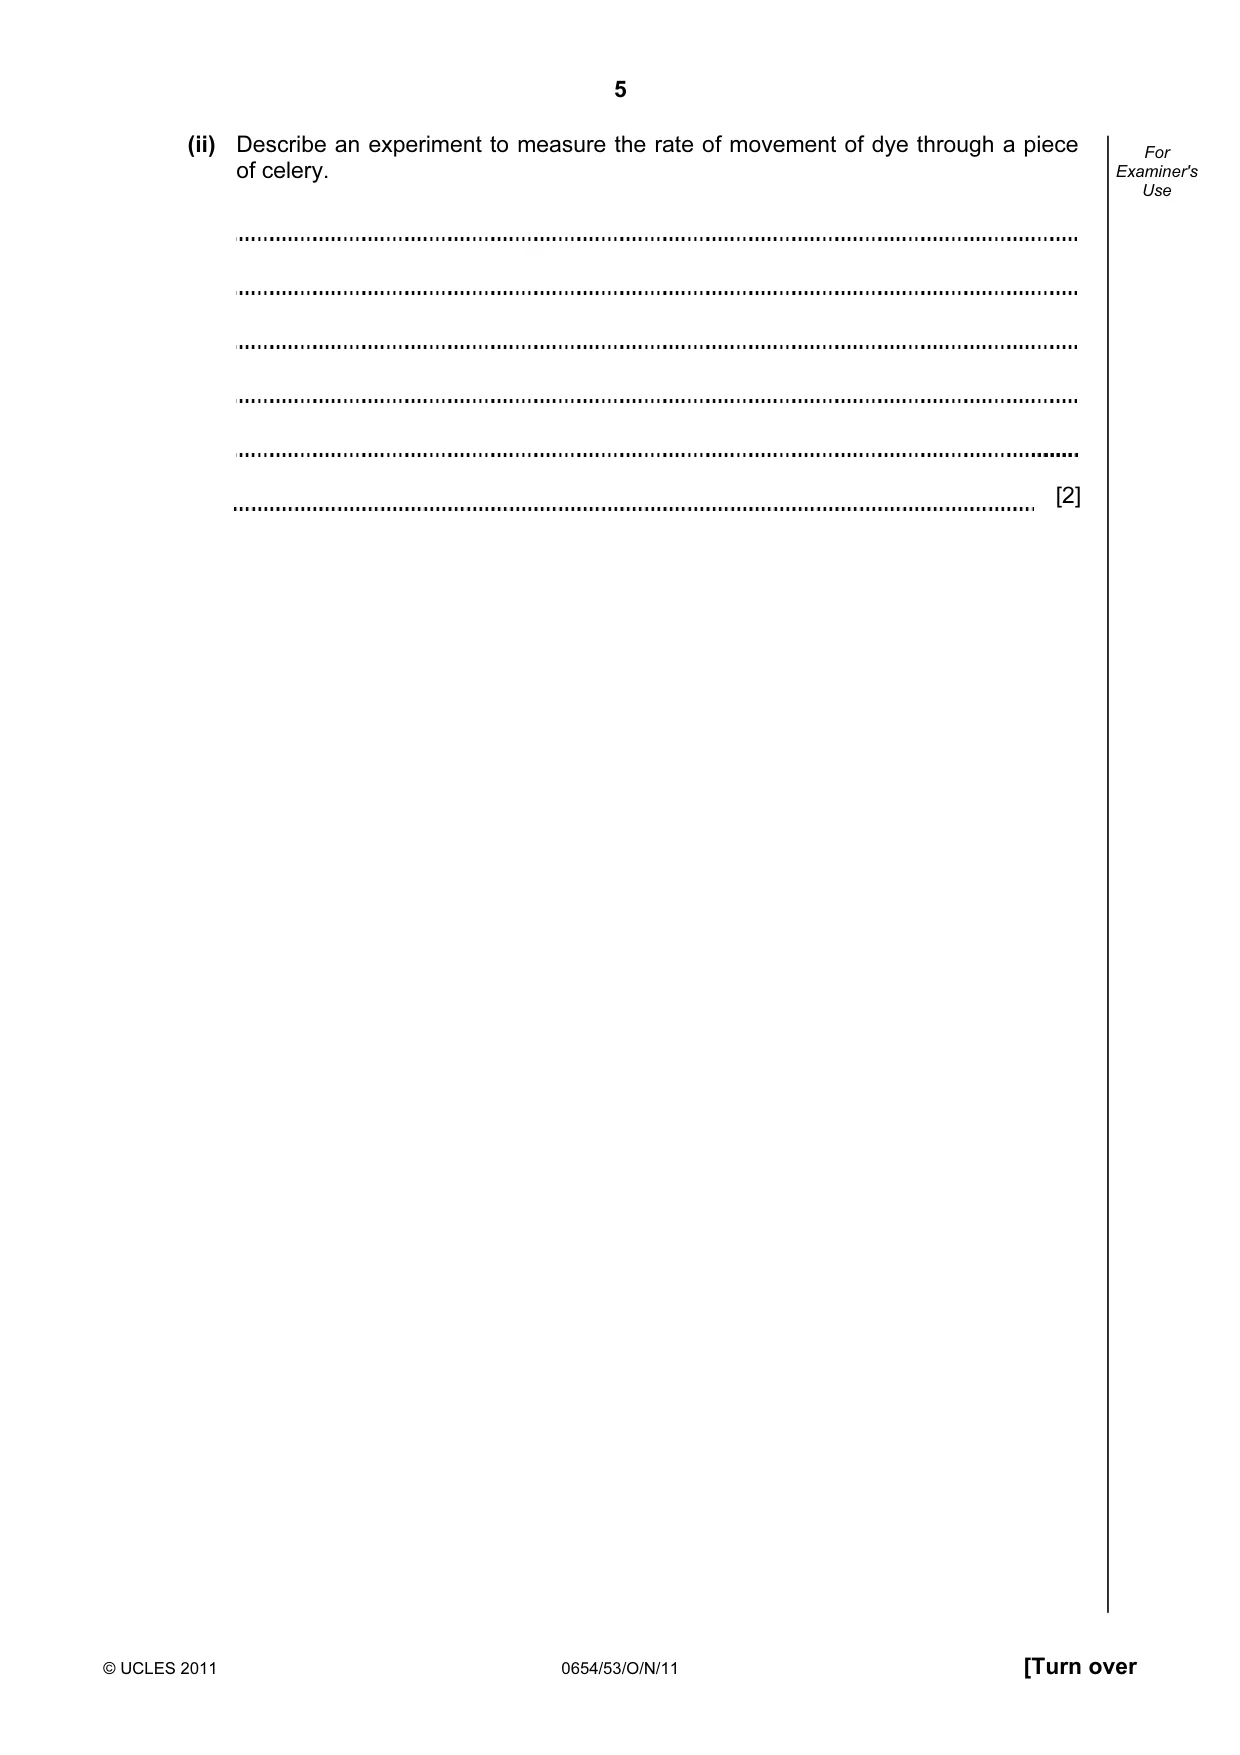
5 © UCLES 2011 0654/53/O/N/11 [Turn over For Examiner's Use (ii) Describe an experiment to measure the rate of movement of dye through a piece of celery. [2]
Question paper, page 6
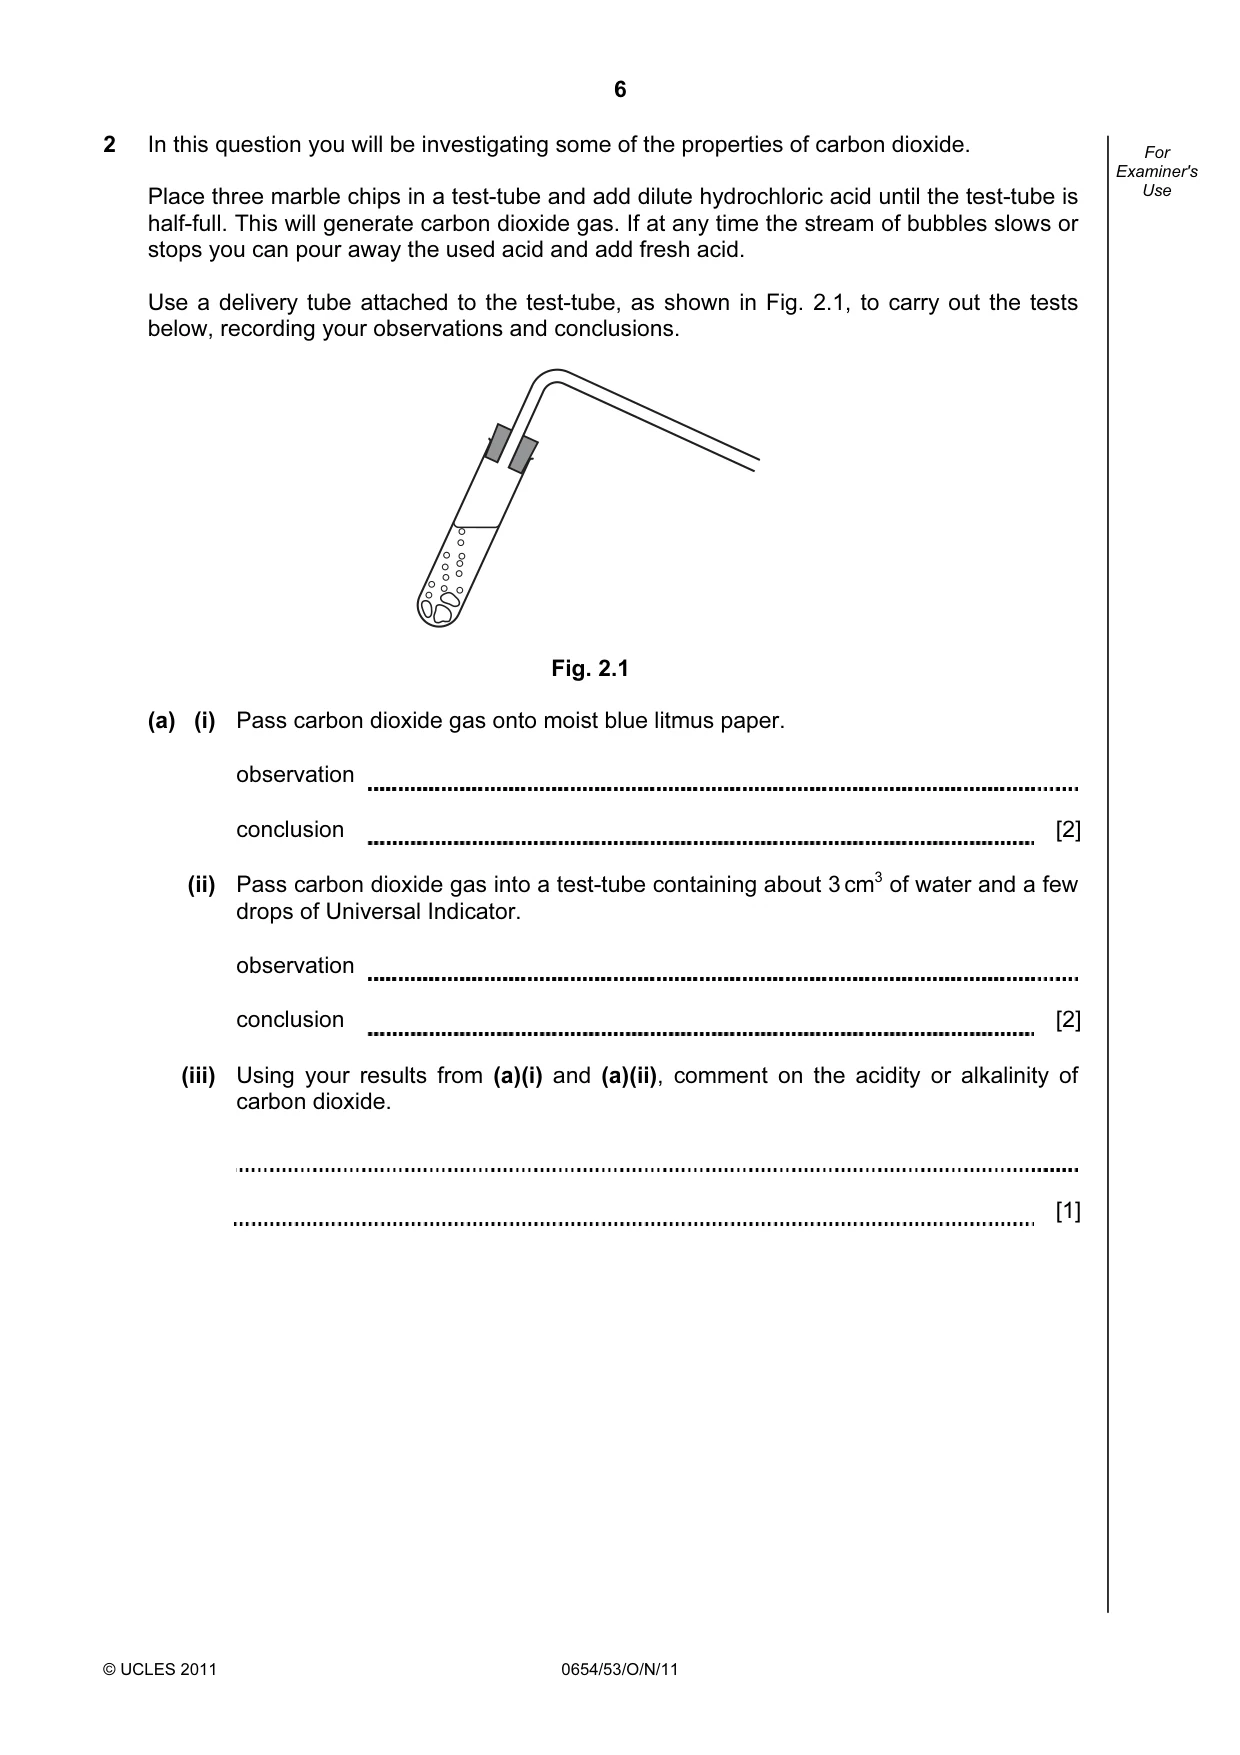
6 © UCLES 2011 0654/53/O/N/11 For Examiner's Use 2 In this question you will be investigating some of the properties of carbon dioxide. Place three marble chips in a test-tube and add dilute hydrochloric acid until the test-tube is half-full. This will generate carbon dioxide gas. If at any time the stream of bubbles slows or stops you can pour away the used acid and add fresh acid. Use a delivery tube attached to the test-tube, as shown in Fig. 2.1, to carry out the tests below, recording your observations and conclusions. Fig. 2.1 (a) (i) Pass carbon dioxide gas onto moist blue litmus paper. observation conclusion [2] (ii) Pass carbon dioxide gas into a test-tube containing about 3 cm3 of water and a few drops of Universal Indicator. observation conclusion [2] (iii) Using your results from (a)(i) and (a)(ii), comment on the acidity or alkalinity of carbon dioxide. [1]
Question paper, page 7
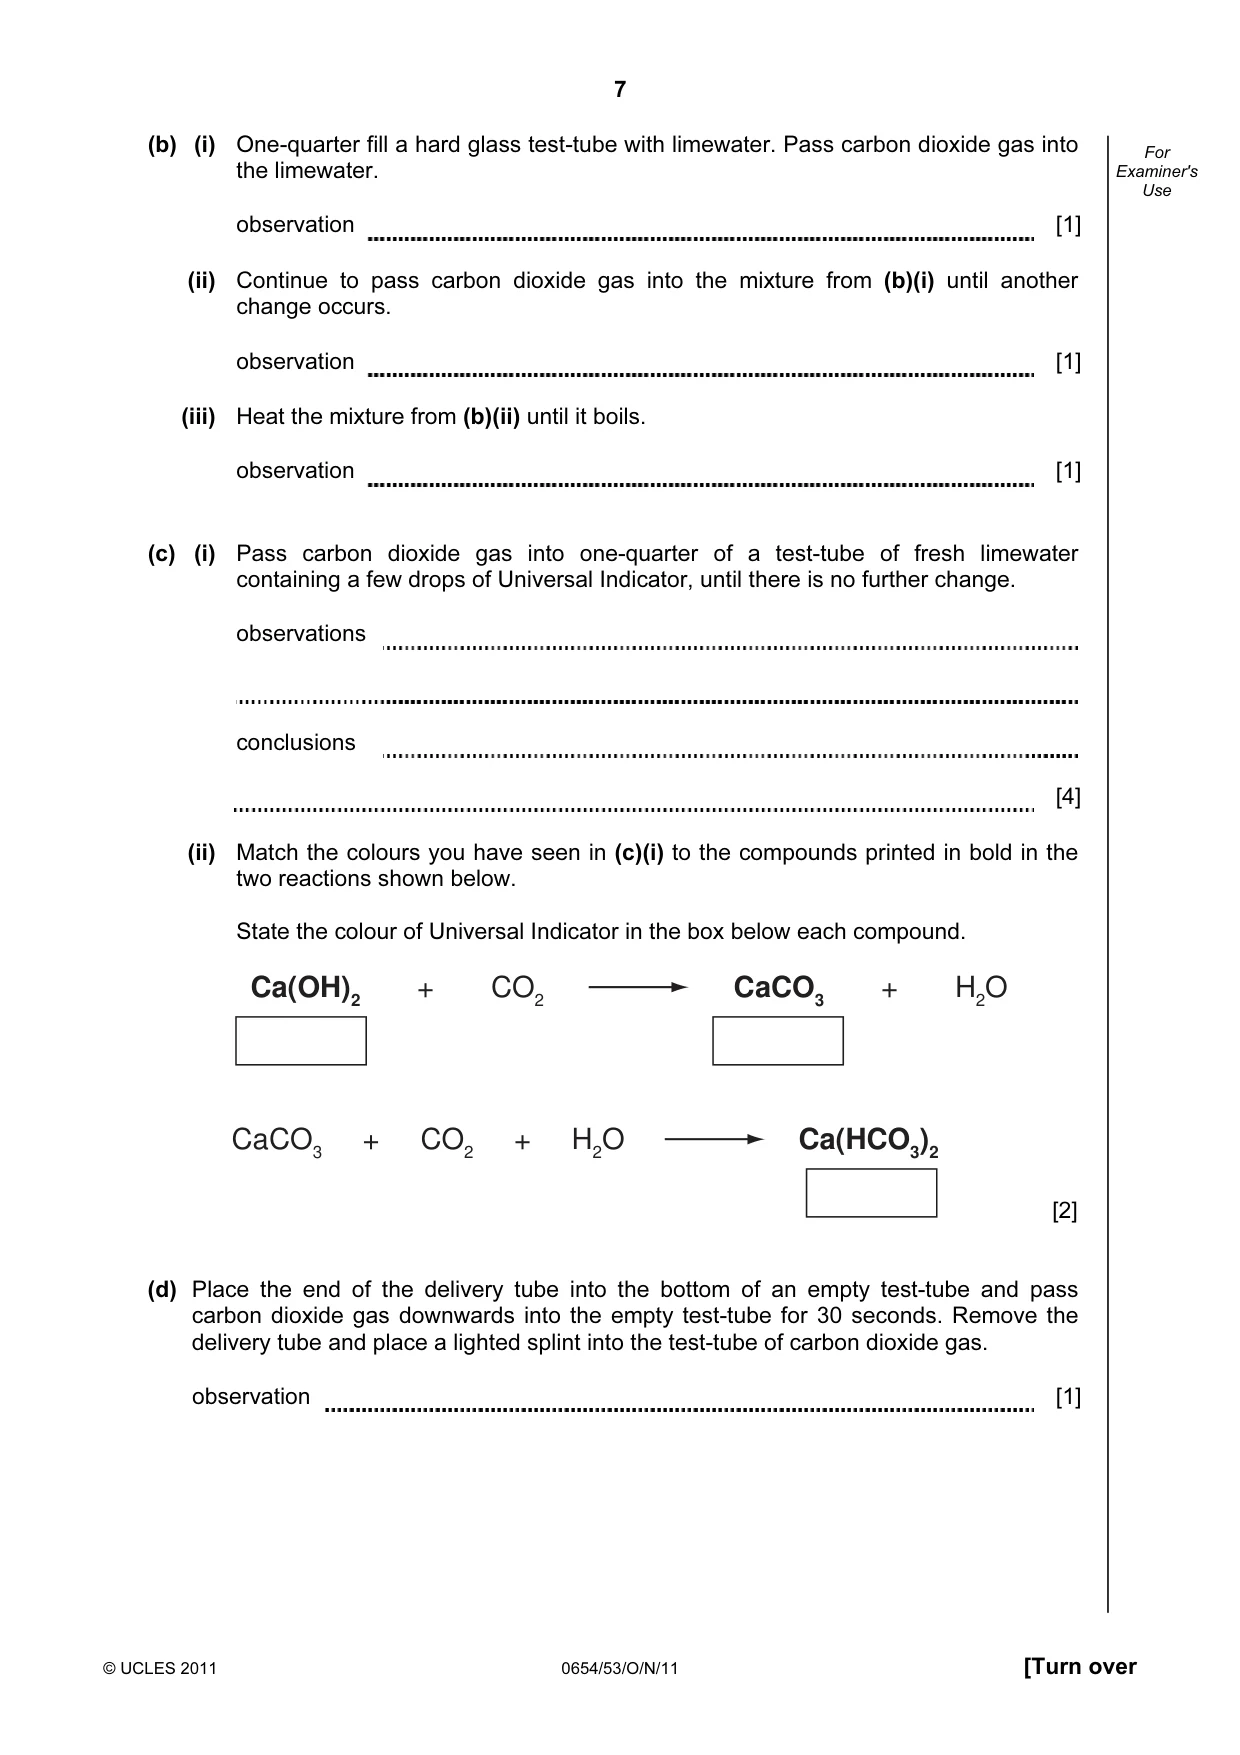
7 © UCLES 2011 0654/53/O/N/11 [Turn over For Examiner's Use (b) (i) One-quarter fill a hard glass test-tube with limewater. Pass carbon dioxide gas into the limewater. observation [1] (ii) Continue to pass carbon dioxide gas into the mixture from (b)(i) until another change occurs. observation [1] (iii) Heat the mixture from (b)(ii) until it boils. observation [1] (c) (i) Pass carbon dioxide gas into one-quarter of a test-tube of fresh limewater containing a few drops of Universal Indicator, until there is no further change. observations conclusions [4] (ii) Match the colours you have seen in (c)(i) to the compounds printed in bold in the two reactions shown below. State the colour of Universal Indicator in the box below each compound. CaCO3 + CO2 + H2O Ca(OH)2 + CO2 CaCO3 + H2O Ca(HCO3)2 [2] (d) Place the end of the delivery tube into the bottom of an empty test-tube and pass carbon dioxide gas downwards into the empty test-tube for 30 seconds. Remove the delivery tube and place a lighted splint into the test-tube of carbon dioxide gas. observation [1]
Question paper, page 8
8 © UCLES 2011 0654/53/O/N/11 BLANK PAGE
Question paper, page 9
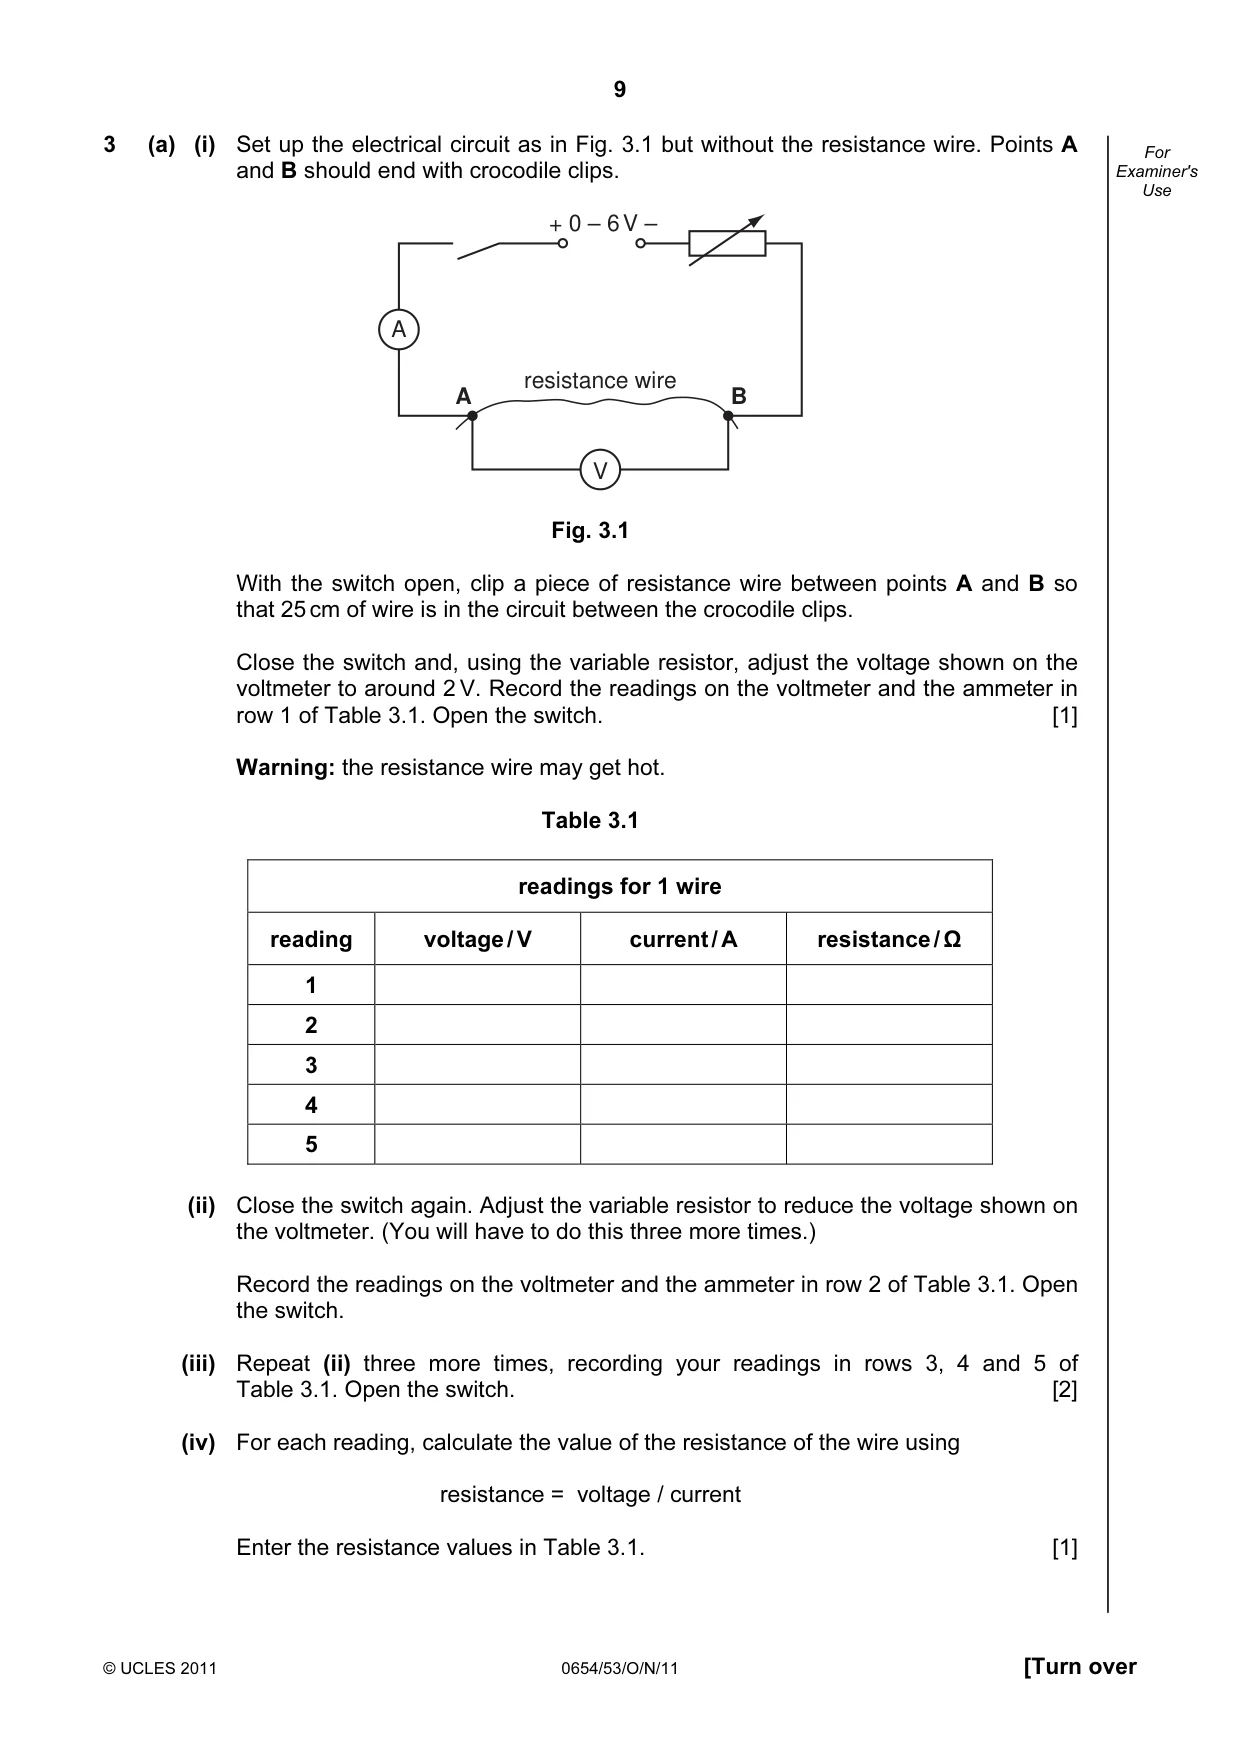
9 © UCLES 2011 0654/53/O/N/11 [Turn over For Examiner's Use 3 (a) (i) Set up the electrical circuit as in Fig. 3.1 but without the resistance wire. Points A and B should end with crocodile clips. + 0 – 6 V – V A resistance wire A B Fig. 3.1 With the switch open, clip a piece of resistance wire between points A and B so that 25 cm of wire is in the circuit between the crocodile clips. Close the switch and, using the variable resistor, adjust the voltage shown on the voltmeter to around 2 V. Record the readings on the voltmeter and the ammeter in row 1 of Table 3.1. Open the switch. [1] Warning: the resistance wire may get hot. Table 3.1 readings for 1 wire reading voltage / V current / A resistance / Ω 1 2 3 4 5 (ii) Close the switch again. Adjust the variable resistor to reduce the voltage shown on the voltmeter. (You will have to do this three more times.) Record the readings on the voltmeter and the ammeter in row 2 of Table 3.1. Open the switch. (iii) Repeat (ii) three more times, recording your readings in rows 3, 4 and 5 of Table 3.1. Open the switch. [2] (iv) For each reading, calculate the value of the resistance of the wire using resistance = voltage / current Enter the resistance values in Table 3.1. [1]
Question paper, page 10
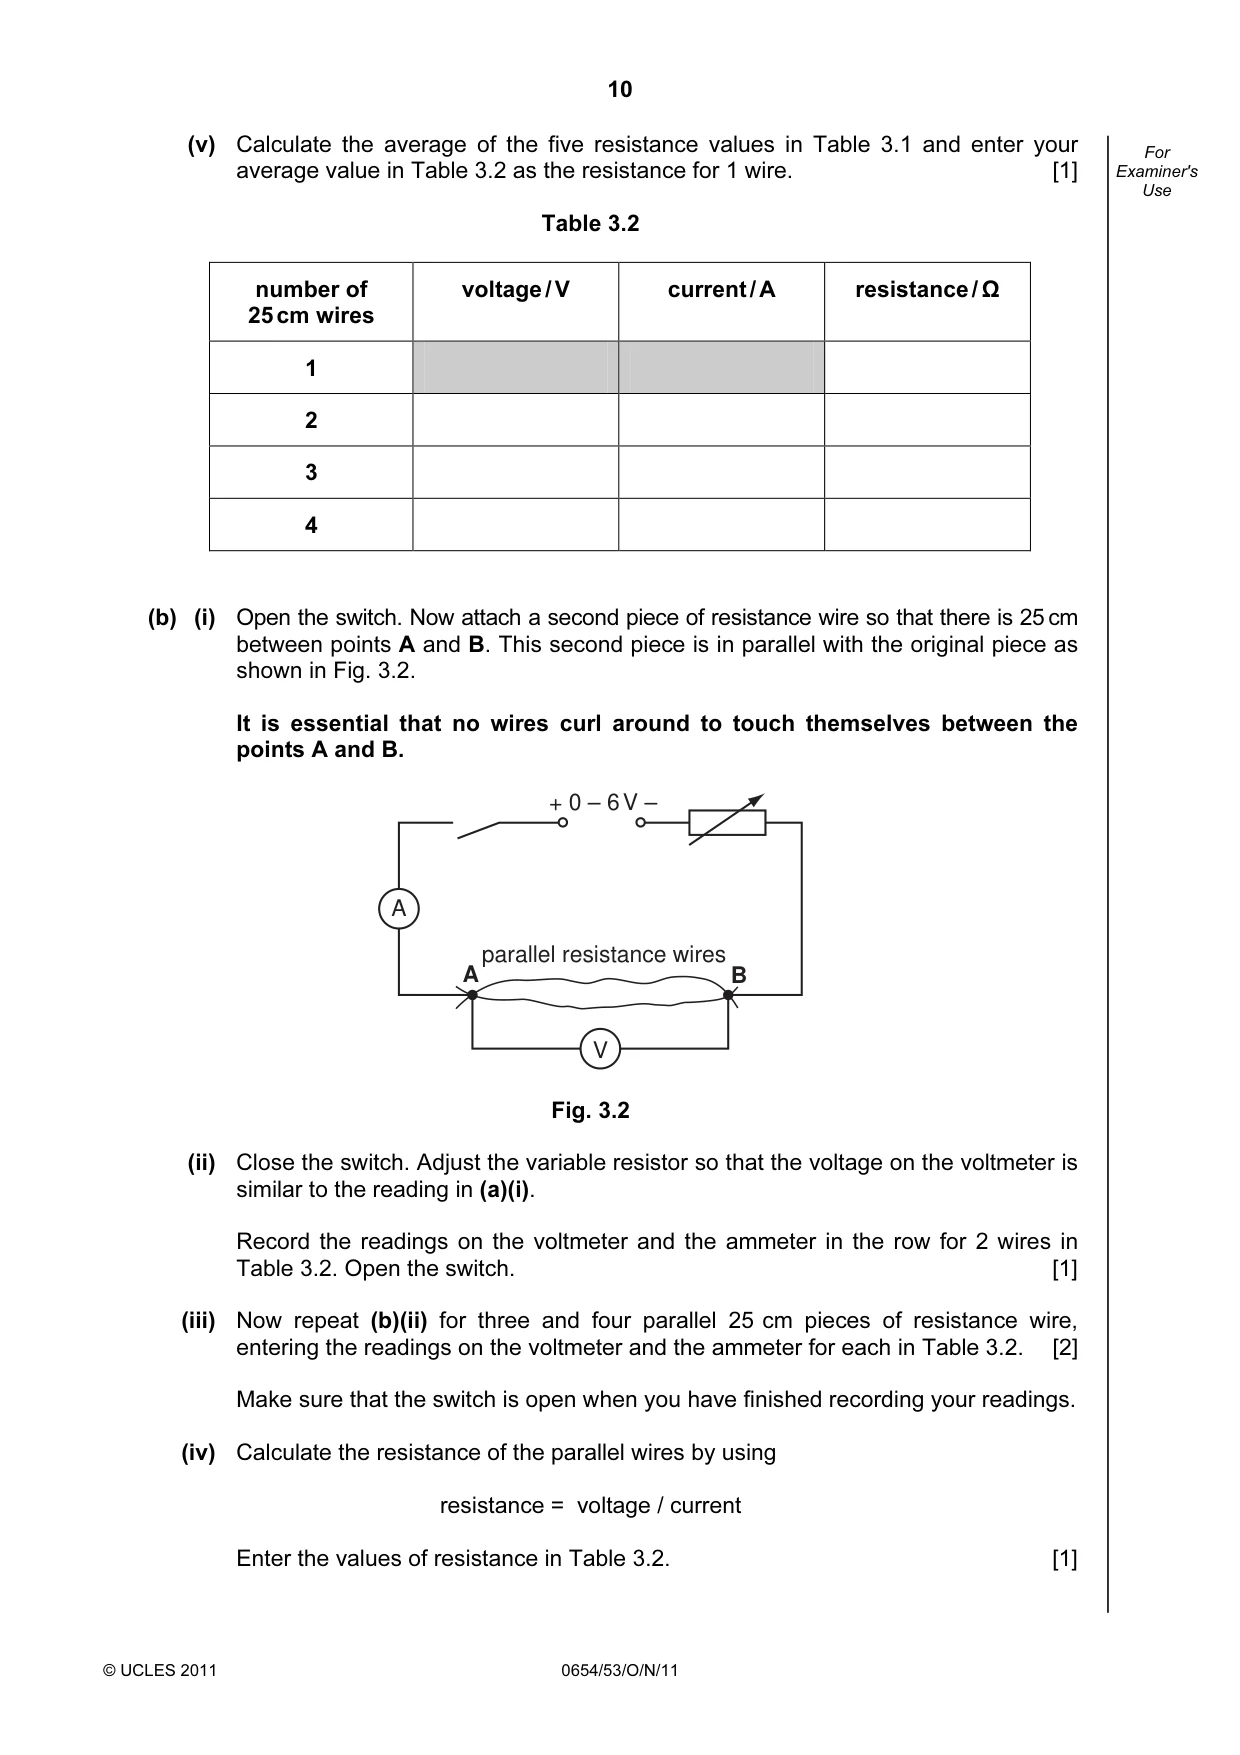
10 © UCLES 2011 0654/53/O/N/11 For Examiner's Use (v) Calculate the average of the five resistance values in Table 3.1 and enter your average value in Table 3.2 as the resistance for 1 wire. [1] Table 3.2 number of 25 cm wires voltage / V current / A resistance / Ω 1 2 3 4 (b) (i) Open the switch. Now attach a second piece of resistance wire so that there is 25 cm between points A and B. This second piece is in parallel with the original piece as shown in Fig. 3.2. It is essential that no wires curl around to touch themselves between the points A and B. V A + 0 – 6 V – parallel resistance wires A B Fig. 3.2 (ii) Close the switch. Adjust the variable resistor so that the voltage on the voltmeter is similar to the reading in (a)(i). Record the readings on the voltmeter and the ammeter in the row for 2 wires in Table 3.2. Open the switch. [1] (iii) Now repeat (b)(ii) for three and four parallel 25 cm pieces of resistance wire, entering the readings on the voltmeter and the ammeter for each in Table 3.2. [2] Make sure that the switch is open when you have finished recording your readings. (iv) Calculate the resistance of the parallel wires by using resistance = voltage / current Enter the values of resistance in Table 3.2. [1]
Question paper, page 11
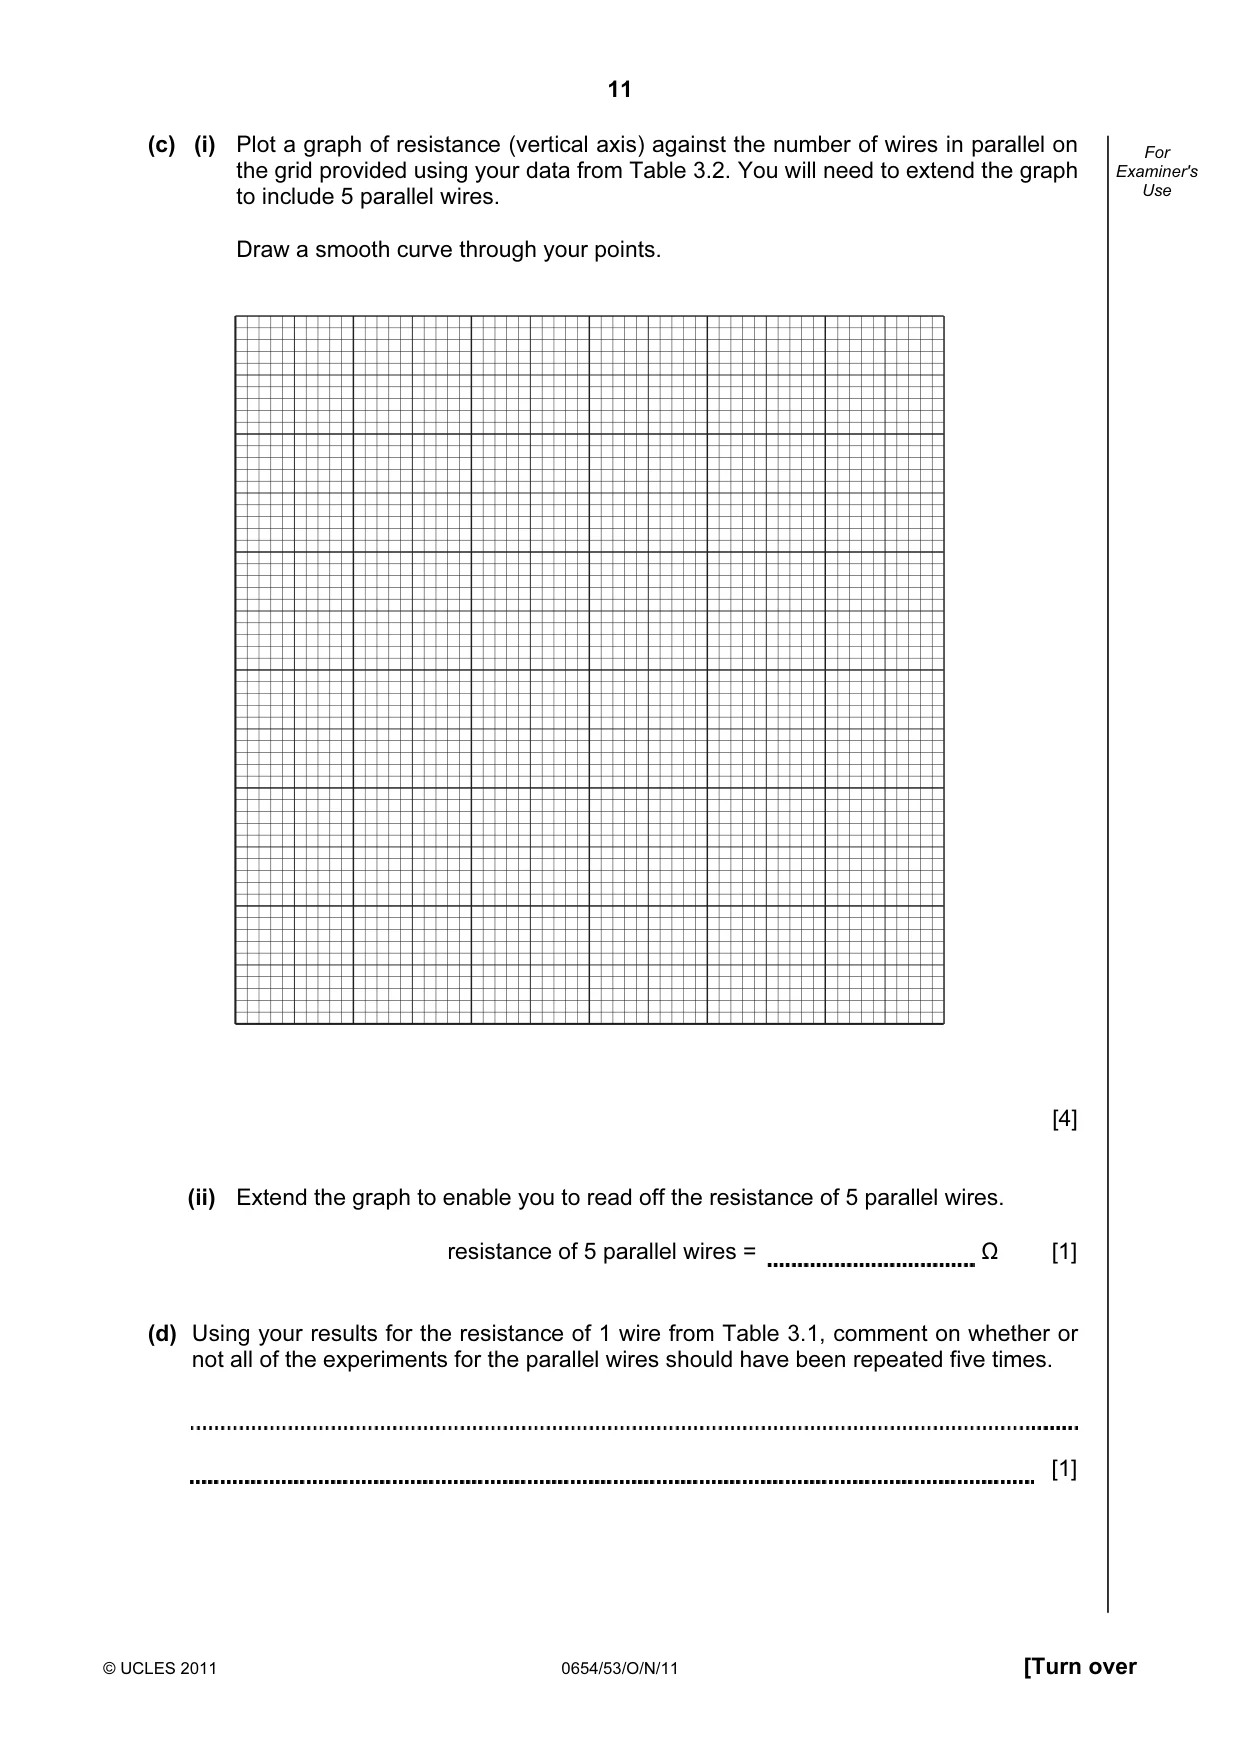
11 © UCLES 2011 0654/53/O/N/11 [Turn over For Examiner's Use (c) (i) Plot a graph of resistance (vertical axis) against the number of wires in parallel on the grid provided using your data from Table 3.2. You will need to extend the graph to include 5 parallel wires. Draw a smooth curve through your points. [4] (ii) Extend the graph to enable you to read off the resistance of 5 parallel wires. resistance of 5 parallel wires = Ω [1] (d) Using your results for the resistance of 1 wire from Table 3.1, comment on whether or not all of the experiments for the parallel wires should have been repeated five times. [1]
Question paper, page 12
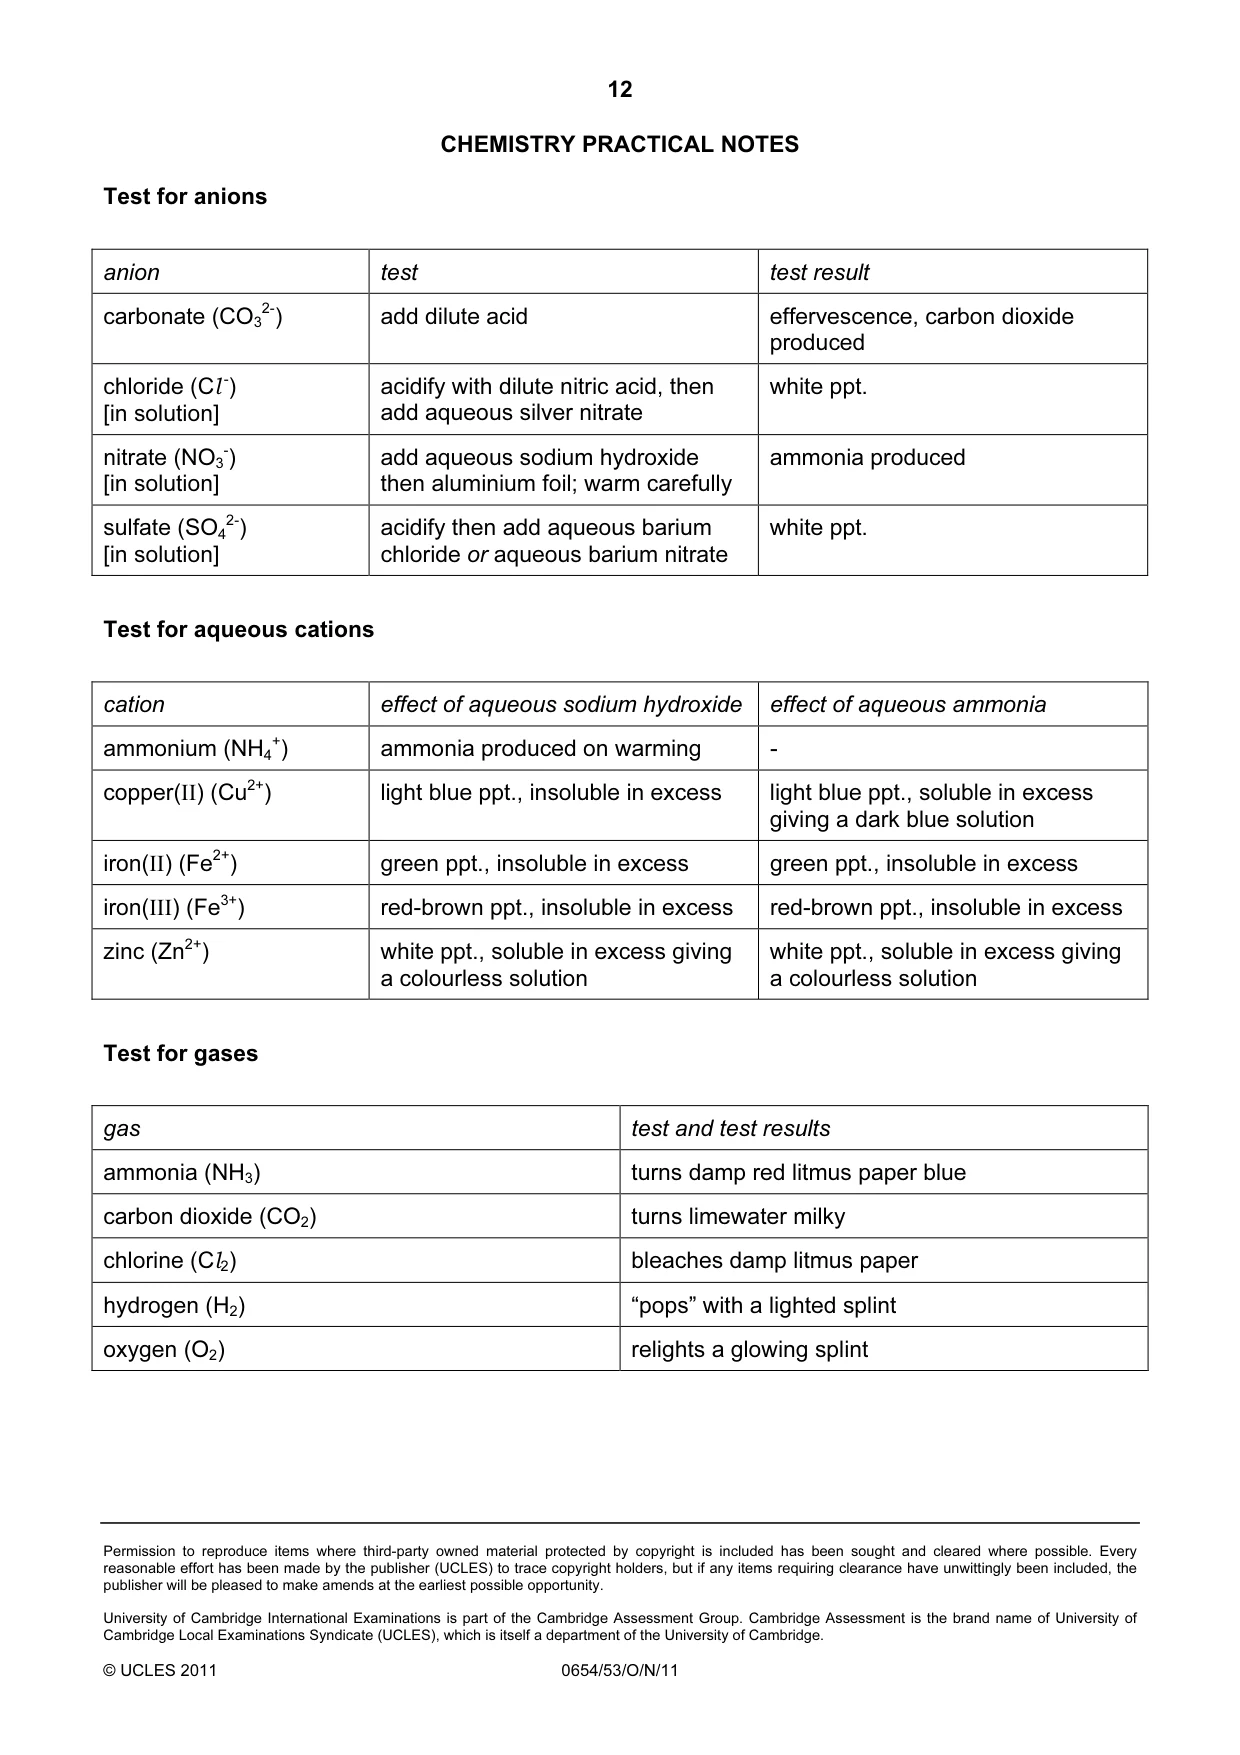
12 Permission to reproduce items where third-party owned material protected by copyright is included has been sought and cleared where possible. Every reasonable effort has been made by the publisher (UCLES) to trace copyright holders, but if any items requiring clearance have unwittingly been included, the publisher will be pleased to make amends at the earliest possible opportunity. University of Cambridge International Examinations is part of the Cambridge Assessment Group. Cambridge Assessment is the brand name of University of Cambridge Local Examinations Syndicate (UCLES), which is itself a department of the University of Cambridge. © UCLES 2011 0654/53/O/N/11 CHEMISTRY PRACTICAL NOTES Test for anions anion test test result carbonate (CO3 2-) add dilute acid effervescence, carbon dioxide produced chloride (Cl -) [in solution] acidify with dilute nitric acid, then add aqueous silver nitrate white ppt. nitrate (NO3 -) [in solution] add aqueous sodium hydroxide then aluminium foil; warm carefully ammonia produced sulfate (SO4 2-) [in solution] acidify then add aqueous barium chloride or aqueous barium nitrate white ppt. Test for aqueous cations cation effect of aqueous sodium hydroxide effect of aqueous ammonia ammonium (NH4 +) ammonia produced on warming - copper(II) (Cu2+) light blue ppt., insoluble in excess light blue ppt., soluble in excess giving a dark blue solution iron(II) (Fe2+) green ppt., insoluble in excess green ppt., insoluble in excess iron(III) (Fe3+) red-brown ppt., insoluble in excess red-brown ppt., insoluble in excess zinc (Zn2+) white ppt., soluble in excess giving a colourless solution white ppt., soluble in excess giving a colourless solution Test for gases gas test and test results ammonia (NH3) turns damp red litmus paper blue carbon dioxide (CO2) turns limewater milky chlorine (Cl2) bleaches damp litmus paper hydrogen (H2) “pops” with a lighted splint oxygen (O2) relights a glowing splint
Mark scheme, page 1
UNIVERSITY OF CAMBRIDGE INTERNATIONAL EXAMINATIONS International General Certificate of Secondary Education MARK SCHEME for the October/November 2011 question paper for the guidance of teachers 0654 CO-ORDINATED SCIENCES 0654/53 Paper 5 (Practical), maximum raw mark 45 This mark scheme is published as an aid to teachers and candidates, to indicate the requirements of the examination. It shows the basis on which Examiners were instructed to award marks. It does not indicate the details of the discussions that took place at an Examiners’ meeting before marking began, which would have considered the acceptability of alternative answers. Mark schemes must be read in conjunction with the question papers and the report on the examination. • Cambridge will not enter into discussions or correspondence in connection with these mark schemes. Cambridge is publishing the mark schemes for the October/November 2011 question papers for most IGCSE, GCE Advanced Level and Advanced Subsidiary Level syllabuses and some Ordinary Level syllabuses. www.XtremePapers.com
Mark scheme, page 2
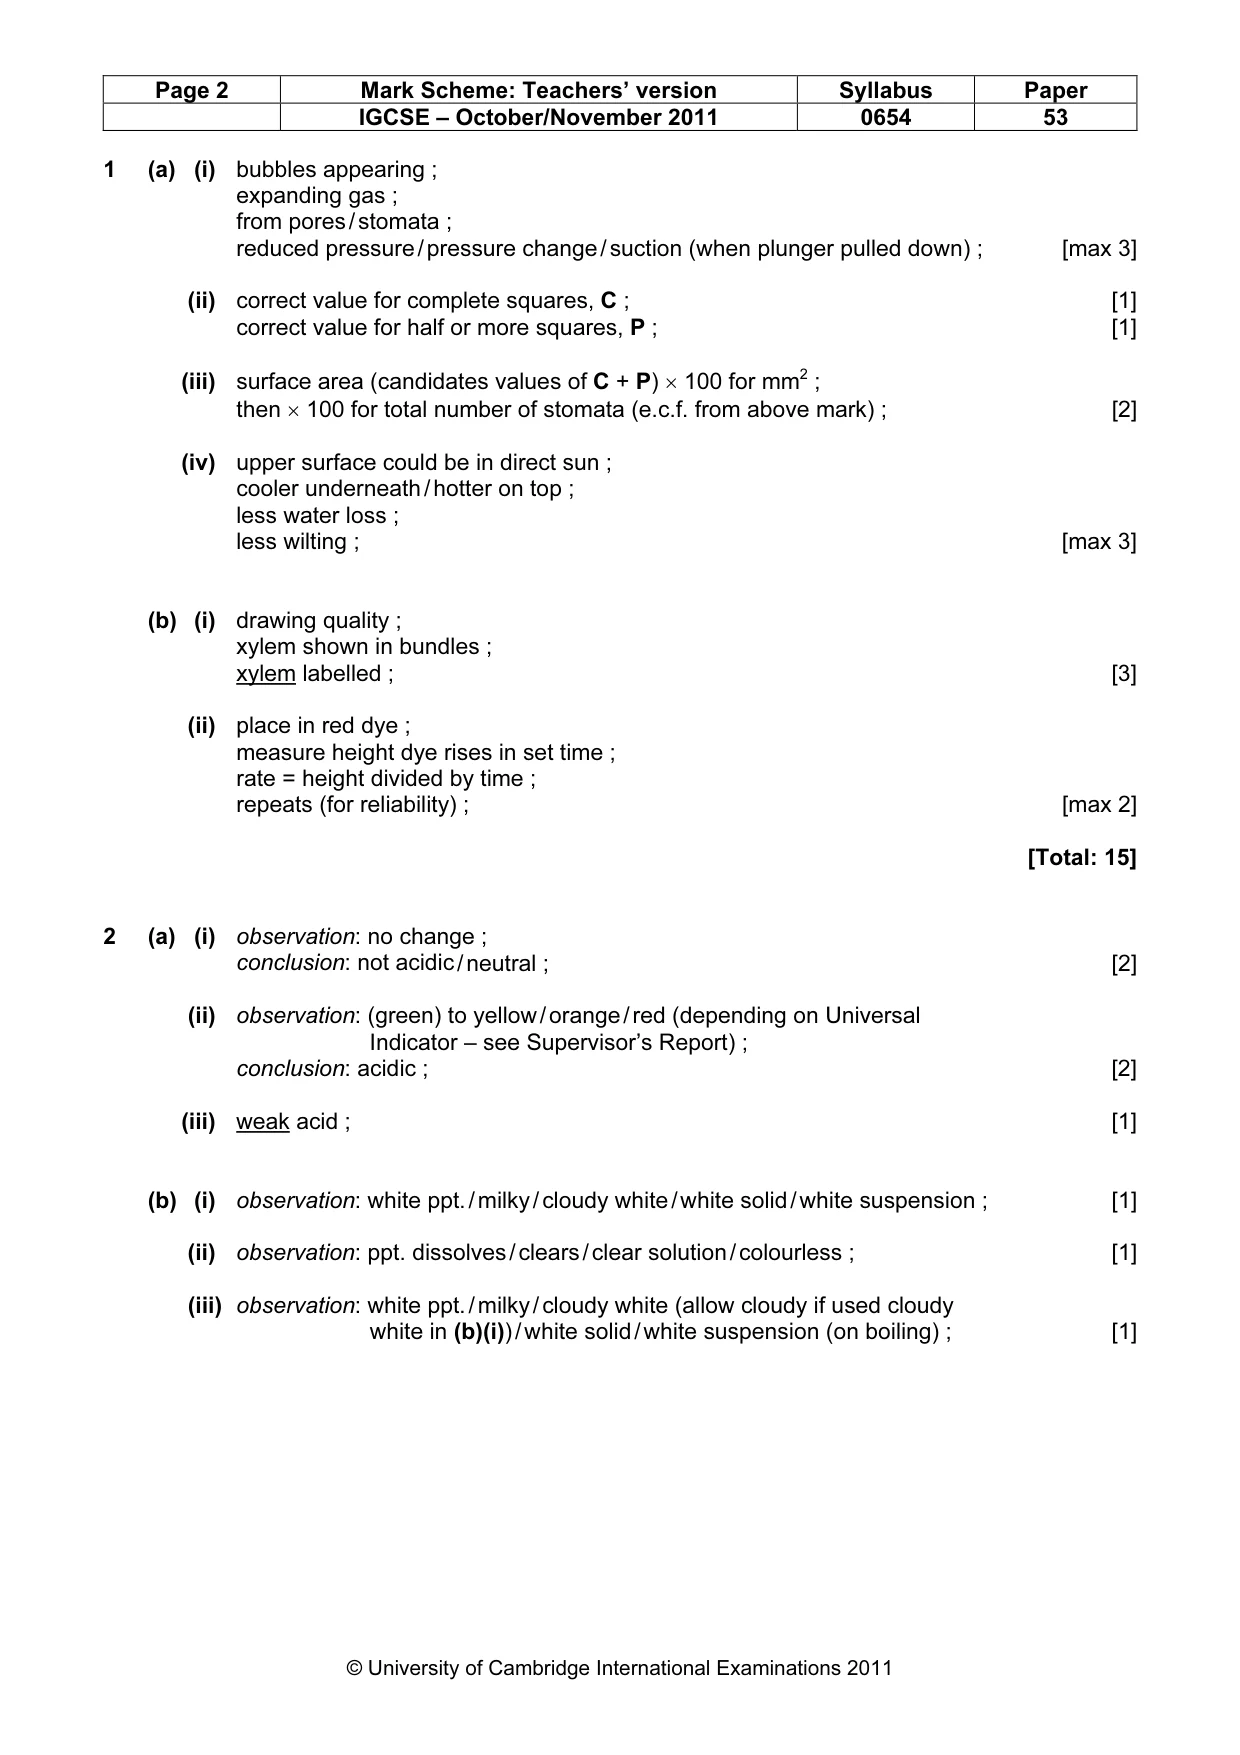
Page 2 Mark Scheme: Teachers’ version Syllabus Paper IGCSE – October/November 2011 0654 53 © University of Cambridge International Examinations 2011 1 (a) (i) bubbles appearing ; expanding gas ; from pores / stomata ; reduced pressure / pressure change / suction (when plunger pulled down) ; [max 3] (ii) correct value for complete squares, C ; [1] correct value for half or more squares, P ; [1] (iii) surface area (candidates values of C + P) × 100 for mm2 ; then × 100 for total number of stomata (e.c.f. from above mark) ; [2] (iv) upper surface could be in direct sun ; cooler underneath / hotter on top ; less water loss ; less wilting ; [max 3] (b) (i) drawing quality ; xylem shown in bundles ; xylem labelled ; [3] (ii) place in red dye ; measure height dye rises in set time ; rate = height divided by time ; repeats (for reliability) ; [max 2] [Total: 15] 2 (a) (i) observation: no change ; conclusion: not acidic / neutral ; [2] (ii) observation: (green) to yellow / orange / red (depending on Universal Indicator – see Supervisor’s Report) ; conclusion: acidic ; [2] (iii) weak acid ; [1] (b) (i) observation: white ppt. / milky / cloudy white / white solid / white suspension ; [1] (ii) observation: ppt. dissolves / clears / clear solution / colourless ; [1] (iii) observation: white ppt. / milky / cloudy white (allow cloudy if used cloudy white in (b)(i)) / white solid / white suspension (on boiling) ; [1]
Mark scheme, page 3
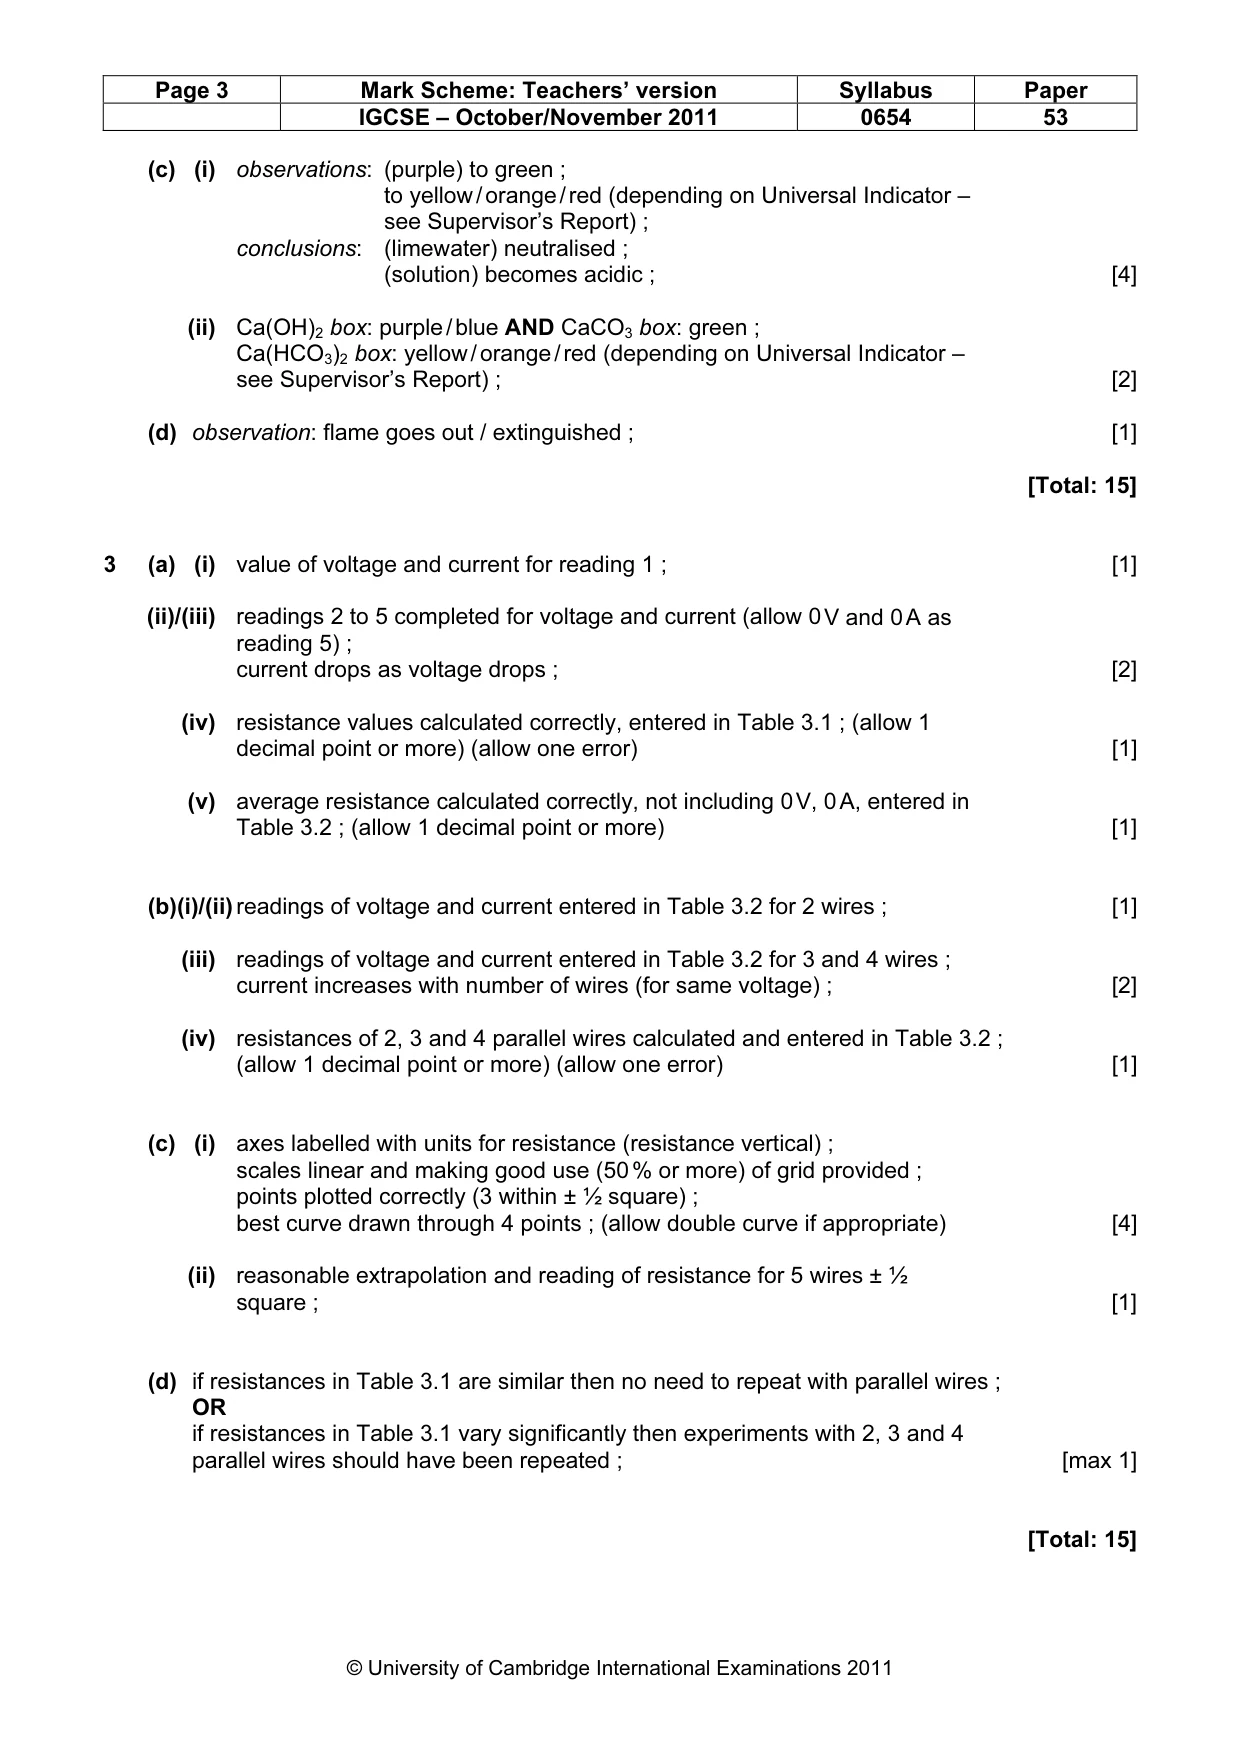
Page 3 Mark Scheme: Teachers’ version Syllabus Paper IGCSE – October/November 2011 0654 53 © University of Cambridge International Examinations 2011 (c) (i) observations: (purple) to green ; to yellow / orange / red (depending on Universal Indicator – see Supervisor’s Report) ; conclusions: (limewater) neutralised ; (solution) becomes acidic ; [4] (ii) Ca(OH)2 box: purple / blue AND CaCO3 box: green ; Ca(HCO3)2 box: yellow / orange / red (depending on Universal Indicator – see Supervisor’s Report) ; [2] (d) observation: flame goes out / extinguished ; [1] [Total: 15] 3 (a) (i) value of voltage and current for reading 1 ; [1] (ii)/(iii) readings 2 to 5 completed for voltage and current (allow 0 V and 0 A as reading 5) ; current drops as voltage drops ; [2] (iv) resistance values calculated correctly, entered in Table 3.1 ; (allow 1 decimal point or more) (allow one error) [1] (v) average resistance calculated correctly, not including 0 V, 0 A, entered in Table 3.2 ; (allow 1 decimal point or more) [1] (b)(i)/(ii) readings of voltage and current entered in Table 3.2 for 2 wires ; [1] (iii) readings of voltage and current entered in Table 3.2 for 3 and 4 wires ; current increases with number of wires (for same voltage) ; [2] (iv) resistances of 2, 3 and 4 parallel wires calculated and entered in Table 3.2 ; (allow 1 decimal point or more) (allow one error) [1] (c) (i) axes labelled with units for resistance (resistance vertical) ; scales linear and making good use (50 % or more) of grid provided ; points plotted correctly (3 within ± ½ square) ; best curve drawn through 4 points ; (allow double curve if appropriate) [4] (ii) reasonable extrapolation and reading of resistance for 5 wires ± ½ square ; [1] (d) if resistances in Table 3.1 are similar then no need to repeat with parallel wires ; OR if resistances in Table 3.1 vary significantly then experiments with 2, 3 and 4 parallel wires should have been repeated ; [max 1] [Total: 15]
What you needed in this session
Cambridge’s own grade thresholds for 2011 Oct/Nov, Paper 5 · Variant 3. A higher threshold means an easier paper — the bar moves with how the cohort did.