Cambridge IGCSE Sciences - Co-ordinated (Double) 0654 — 2011 May/June Paper 6 · Variant 1
0654/61/M/J/11 · 60 marks · ≈68 min
The question paper and its mark scheme, free to read here and free to download. This is Cambridge’s own paper, exactly as it was sat.
Question paper20 pages


Mark scheme4 pages
Answers below. Sit the paper first if you are practising.
Paper as text
Question paper, page 1
This document consists of 18 printed pages and 2 blank pages. IB11 06_0654_61/FP © UCLES 2011 [Turn over *9306643295* For Examiner's Use 1 2 3 4 5 6 Total UNIVERSITY OF CAMBRIDGE INTERNATIONAL EXAMINATIONS International General Certificate of Secondary Education CO-ORDINATED SCIENCES 0654/61 Paper 6 Alternative to Practical May/June 2011 1 hour Candidates answer on the Question paper No Additional Materials are required. READ THESE INSTRUCTIONS FIRST Write your Centre number, candidate number and name on all the work you hand in. Write in dark blue or black pen. You may use a soft pencil for any diagrams, graphs, tables or rough working. Do not use staples, paper clips, highlighters, glue or correction fluid. DO NOT WRITE IN ANY BARCODES. Answer all questions. At the end of the examination, fasten all your work securely together. The number of marks is given in brackets [ ] at the end of each question or part question. www.XtremePapers.com
Question paper, page 2
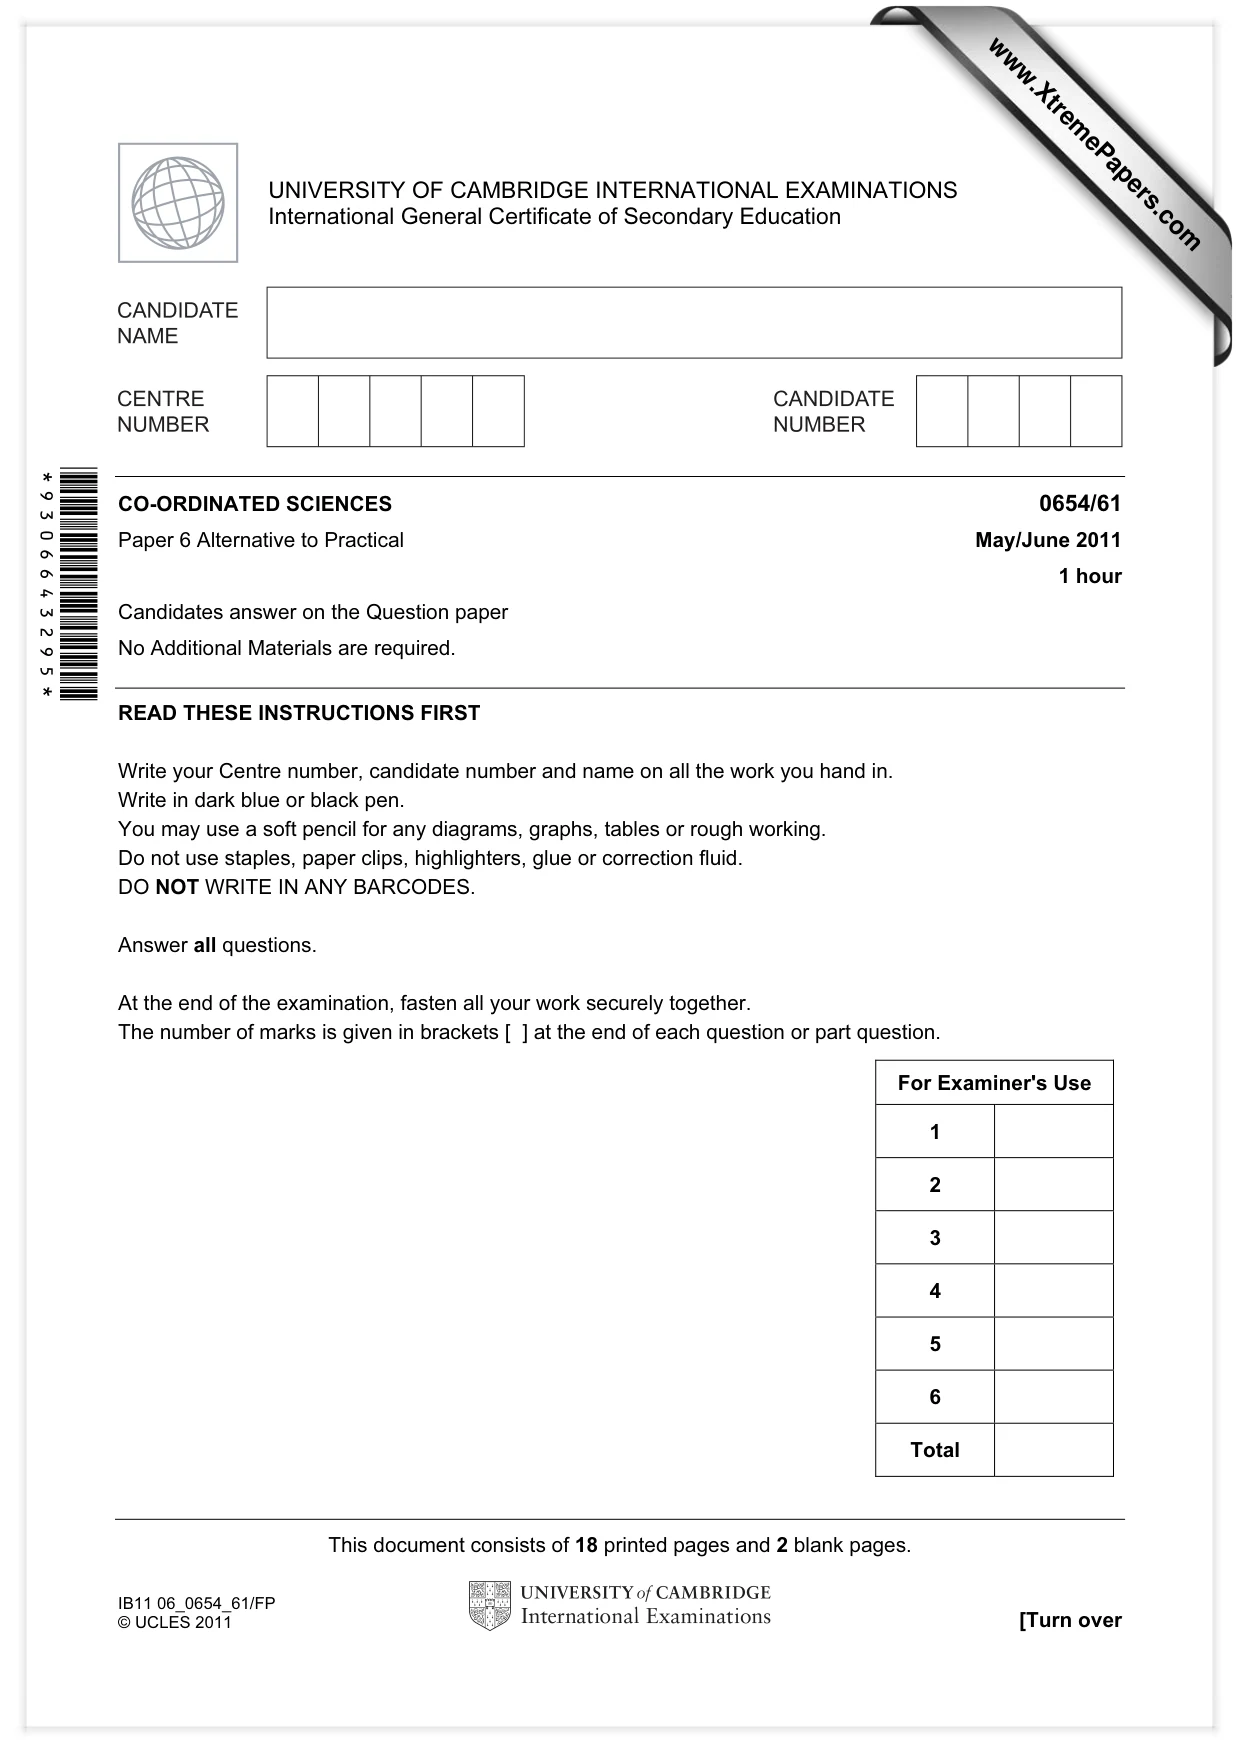
2 © UCLES 2011 0654/61/M/J/11 For Examiner's Use 1 (a) A student carried out experiments to investigate the composition of inhaled and exhaled air. Analysis of inhaled air. glass beaker candle heat proof tile bench Fig. 1.1 • A student took a 500 cm3 glass beaker. • A candle was lit and placed onto a heat proof tile. • A timer was set to zero. • The beaker was placed over the candle and the timer started (see Fig. 1.1). • The timer was stopped when the flame went out. • The experiment was then repeated. Analysis of exhaled air. blow straw glass beaker bowl water Fig. 1.2 • The 500 cm3 beaker was filled with water, inverted and placed into a bowl of water (see Fig. 1.2). • The student blew through a tube until the beaker was full of exhaled air. • He lit a candle and placed it onto a heat proof tile. • The timer was set to zero. • The beaker (of exhaled air) was placed over the candle and the timer started. • The timer was stopped when the flame went out. • He then repeated the experiment.
Question paper, page 3
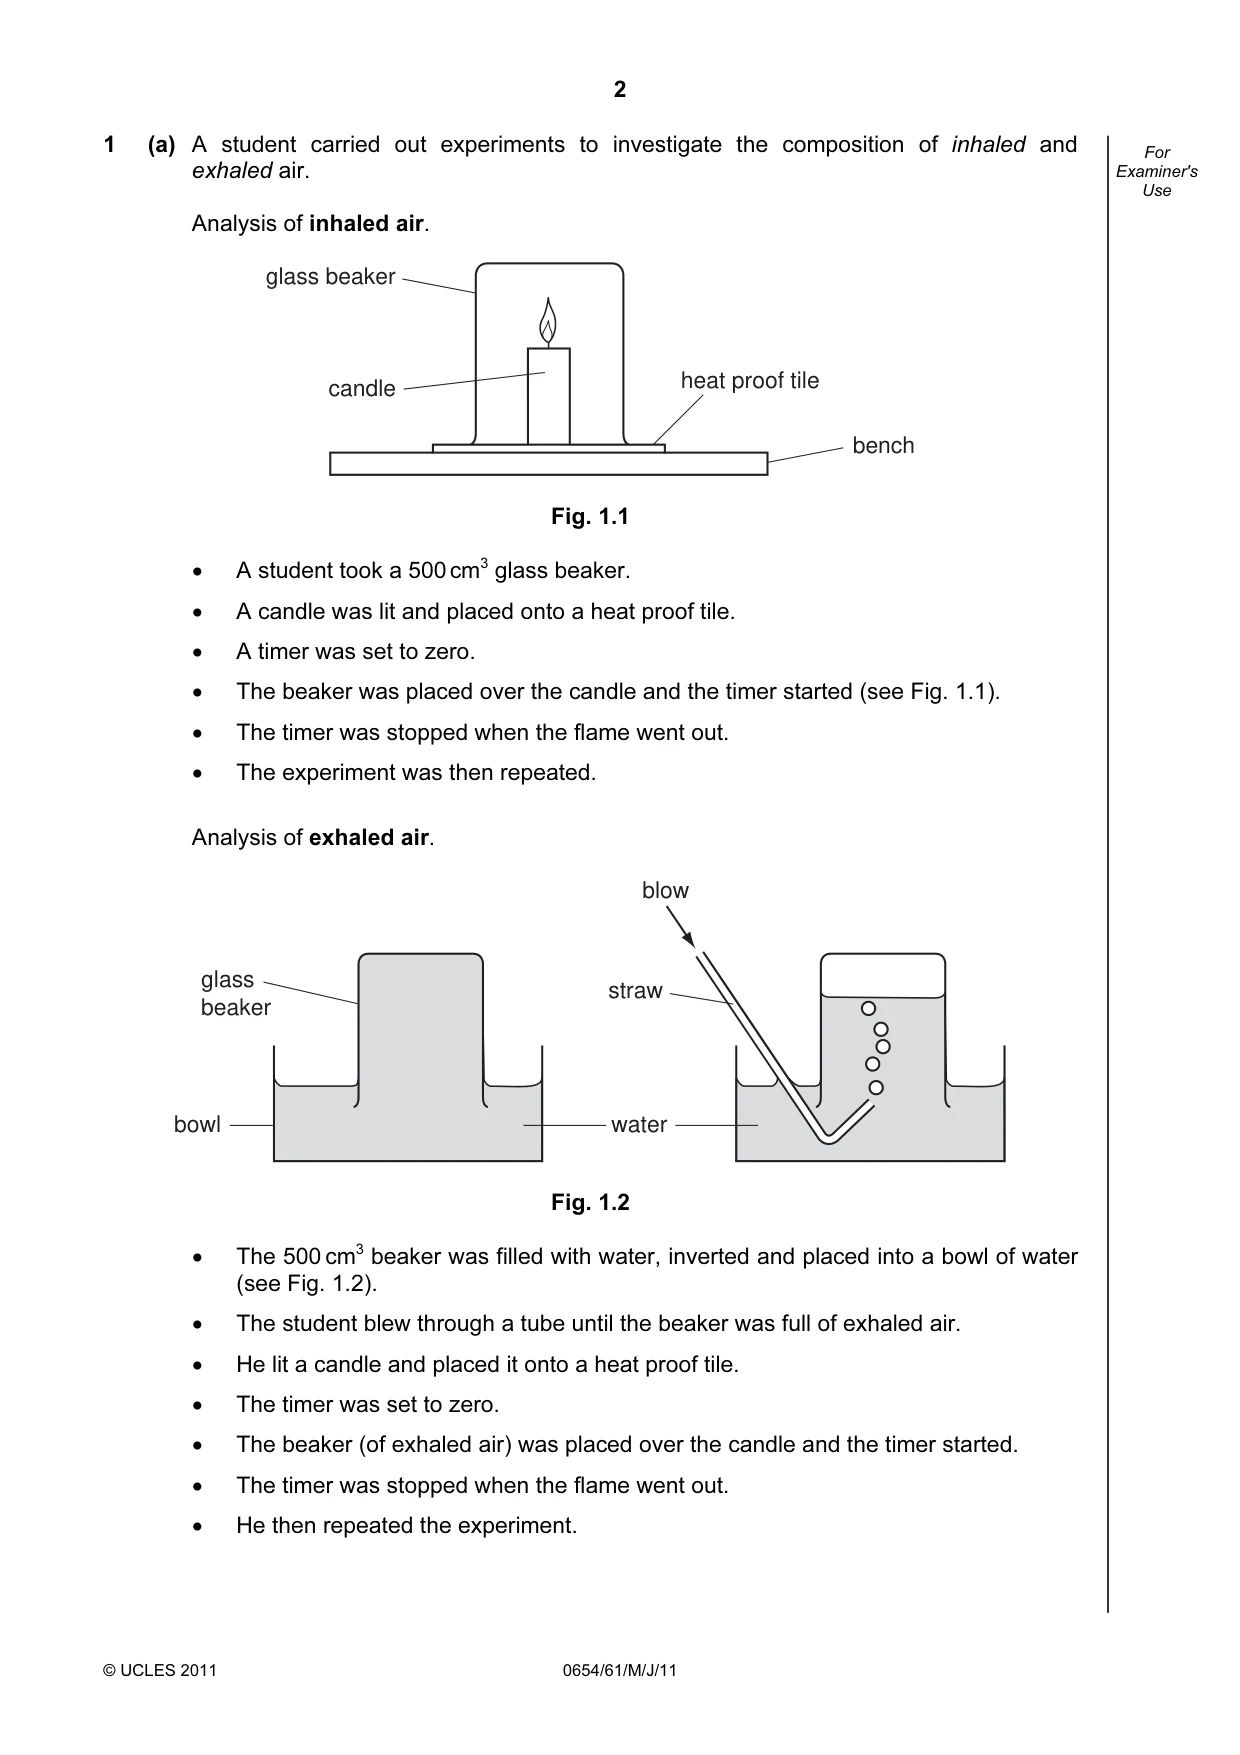
3 © UCLES 2011 0654/61/M/J/11 [Turn over For Examiner's Use Fig. 1.3 shows the times for the flames to go out. experiment 1 2 3 4 inhaled air exhaled air Fig. 1.3 (i) Use Fig. 1.3 to record in Table 1.1, the times taken in seconds for the flame to go out in each experiment. Table 1.1 inhaled air exhaled air experiment number 1 2 3 4 time taken / s [2] (ii) Is the data reliable? Explain your answer. [1] (iii) Calculate the average times for the flame to go out in inhaled air and exhaled air. Show your working. average time taken for flame to go out in inhaled air = s average time taken for flame to go out in exhaled air = s [3]
Question paper, page 4
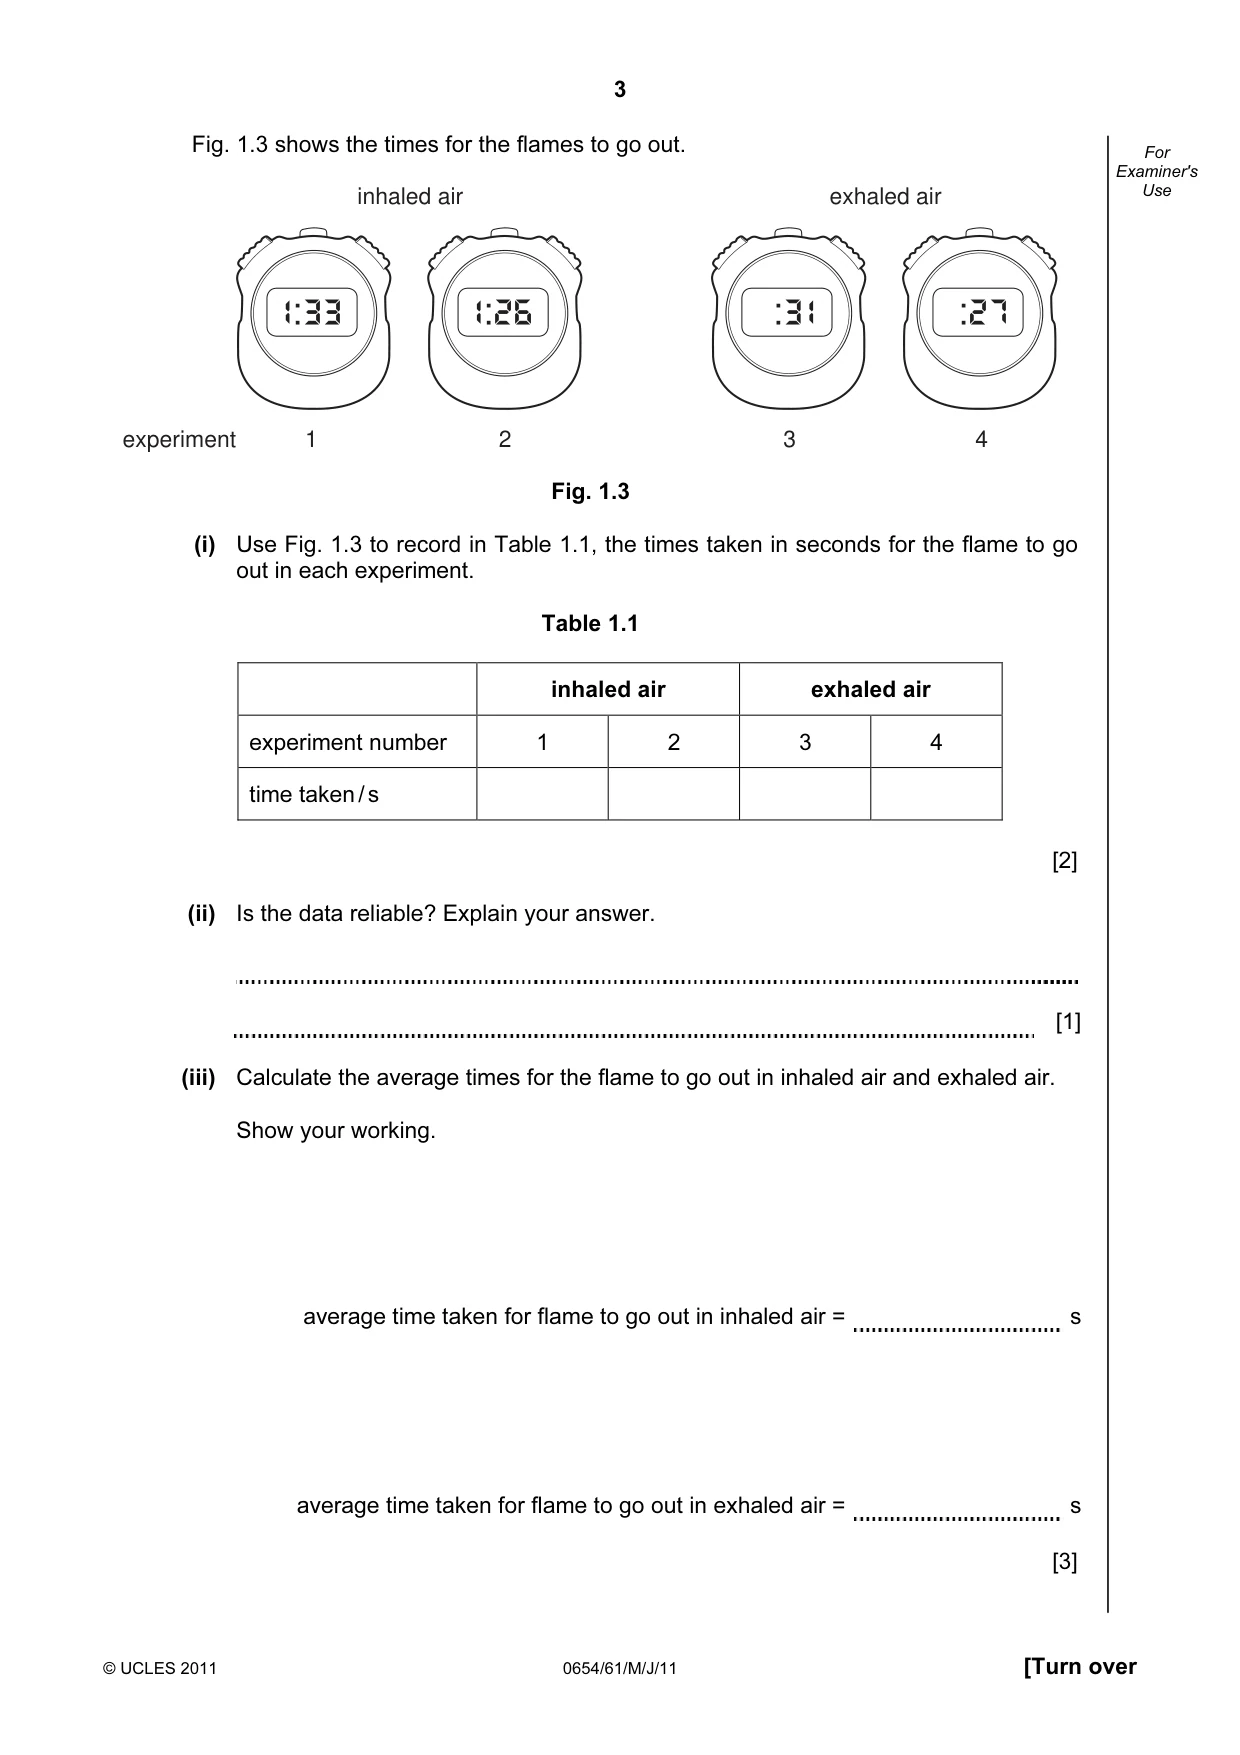
4 © UCLES 2011 0654/61/M/J/11 For Examiner's Use (iv) Describe and explain the difference between the results for inhaled and exhaled air. [2] (b) In a separate experiment inhaled air was bubbled through tube A containing limewater for 30 seconds and the appearance of the limewater recorded. Exhaled air was bubbled through tube B containing limewater for 30 seconds. Fig. 1.4 shows the appearance of the limewater in tubes A and B after 30 seconds. tube A tube B Fig. 1.4 Explain the difference between the appearance of the limewater in tube A and tube B. [2]
Question paper, page 5
5 © UCLES 2011 0654/61/M/J/11 [Turn over BLANK PAGE Please turn over for Question 2.
Question paper, page 6
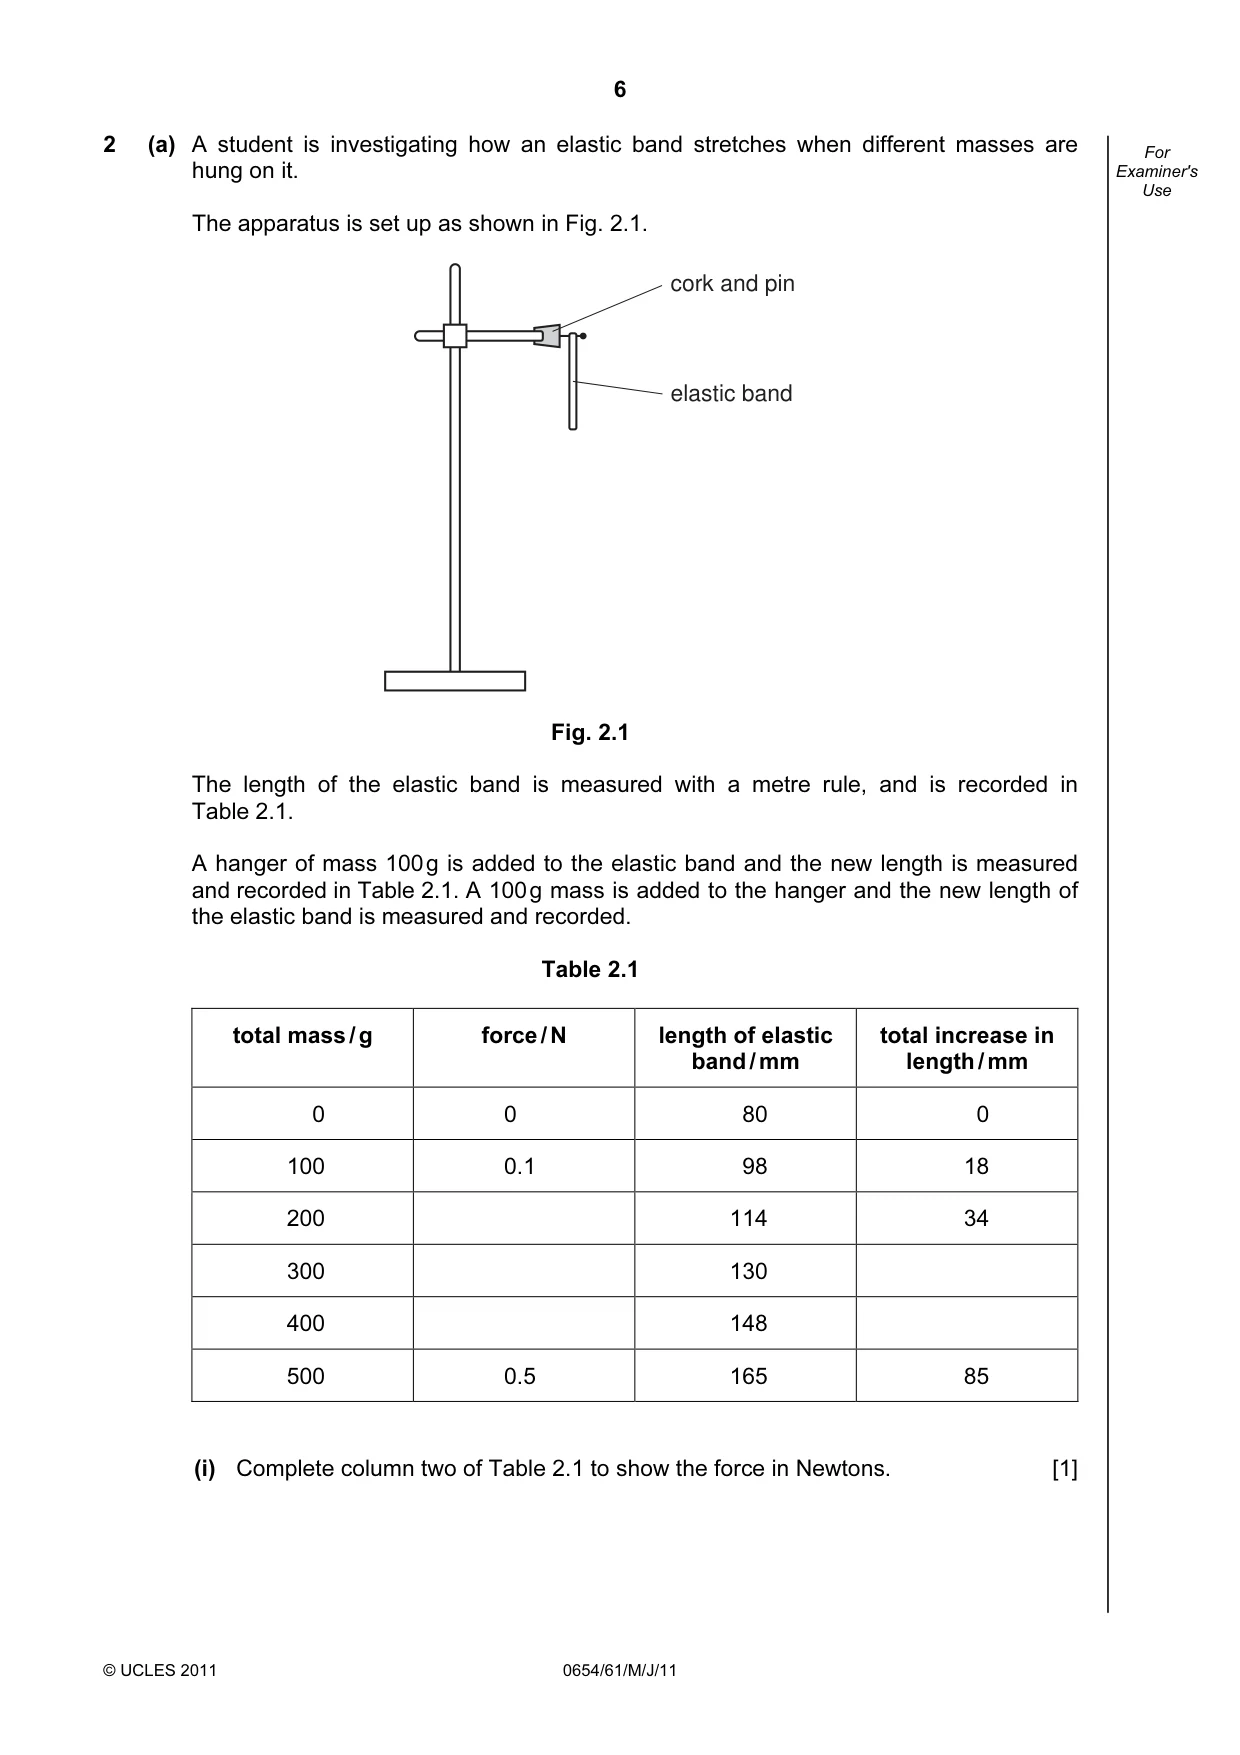
6 © UCLES 2011 0654/61/M/J/11 For Examiner's Use 2 (a) A student is investigating how an elastic band stretches when different masses are hung on it. The apparatus is set up as shown in Fig. 2.1. cork and pin elastic band Fig. 2.1 The length of the elastic band is measured with a metre rule, and is recorded in Table 2.1. A hanger of mass 100 g is added to the elastic band and the new length is measured and recorded in Table 2.1. A 100 g mass is added to the hanger and the new length of the elastic band is measured and recorded. Table 2.1 total mass / g force / N length of elastic band / mm total increase in length / mm 0 0 80 0 100 0.1 98 18 200 114 34 300 130 400 148 500 0.5 165 85 (i) Complete column two of Table 2.1 to show the force in Newtons. [1]
Question paper, page 7
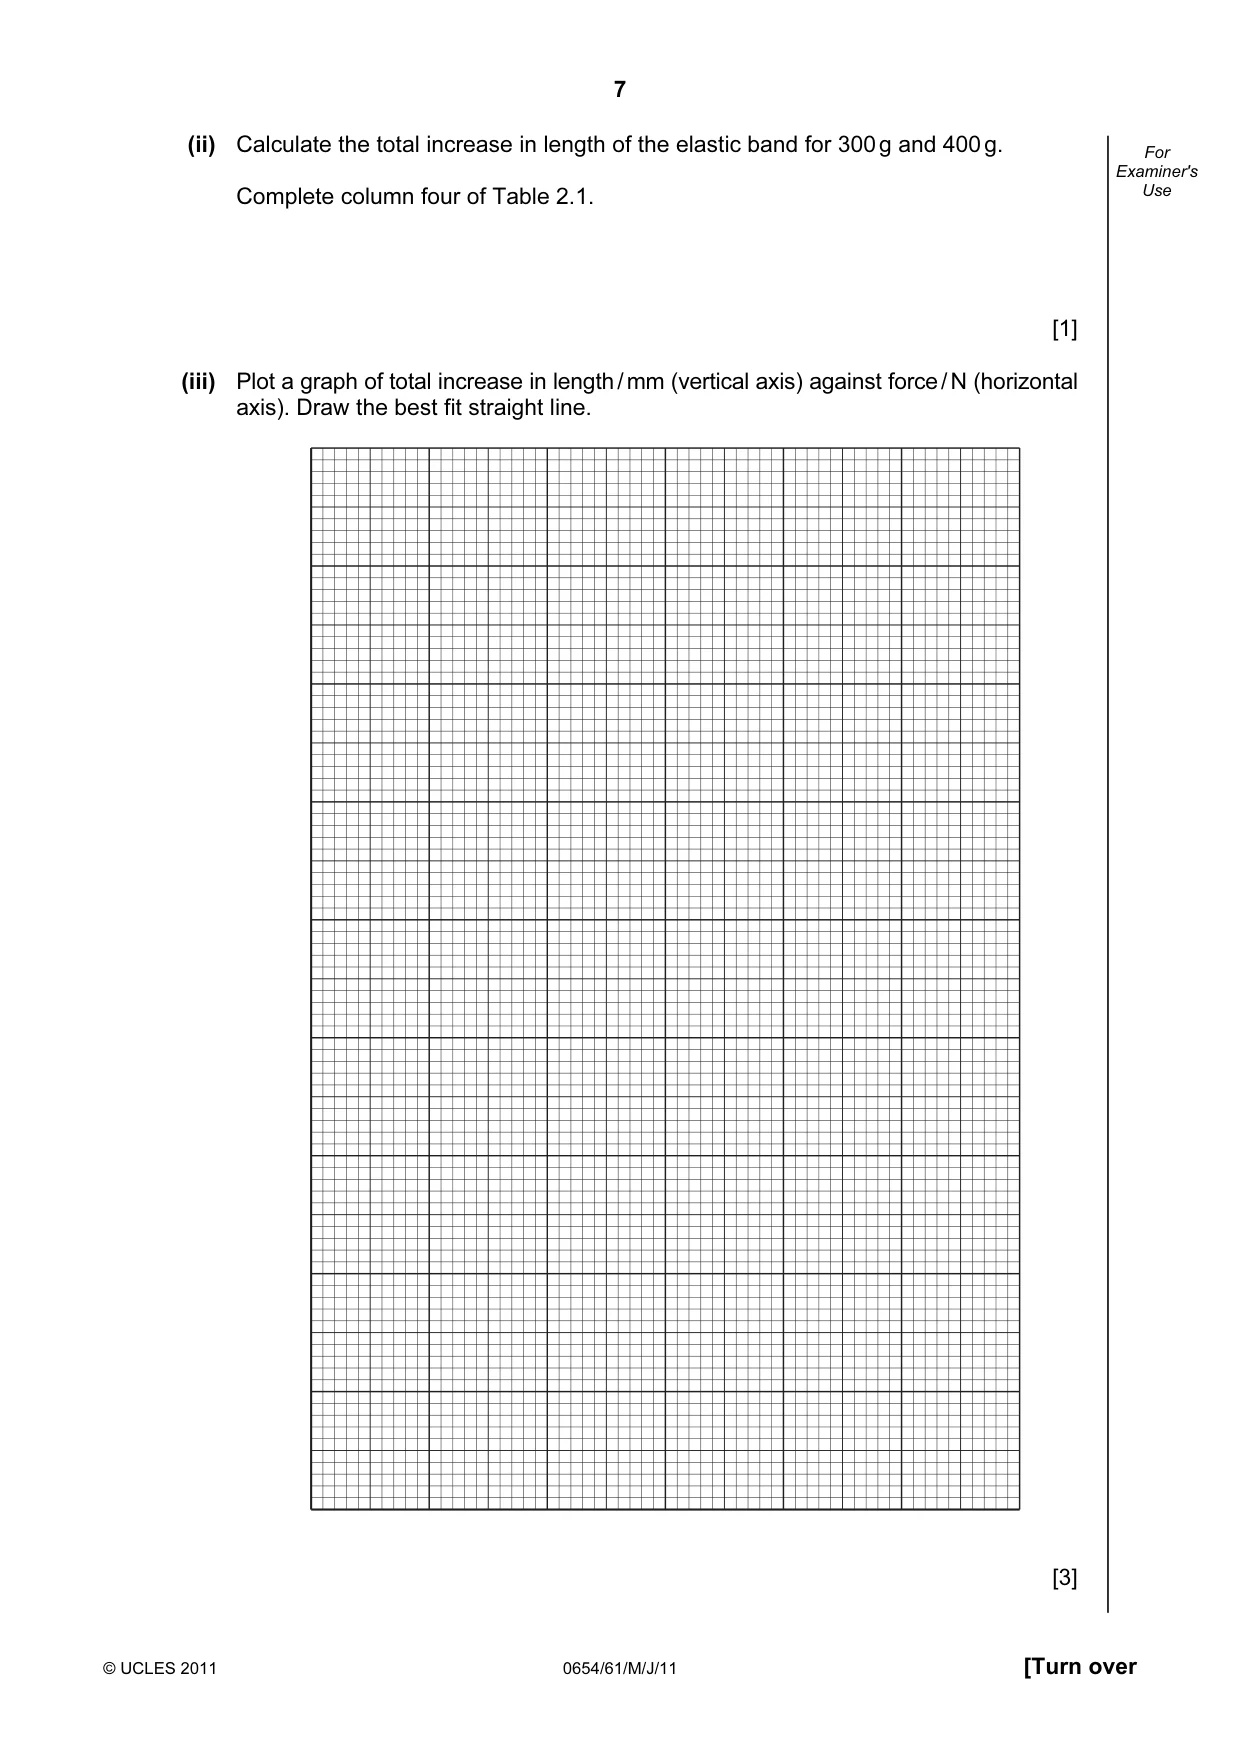
7 © UCLES 2011 0654/61/M/J/11 [Turn over For Examiner's Use (ii) Calculate the total increase in length of the elastic band for 300 g and 400 g. Complete column four of Table 2.1. [1] (iii) Plot a graph of total increase in length / mm (vertical axis) against force / N (horizontal axis). Draw the best fit straight line. [3]
Question paper, page 8
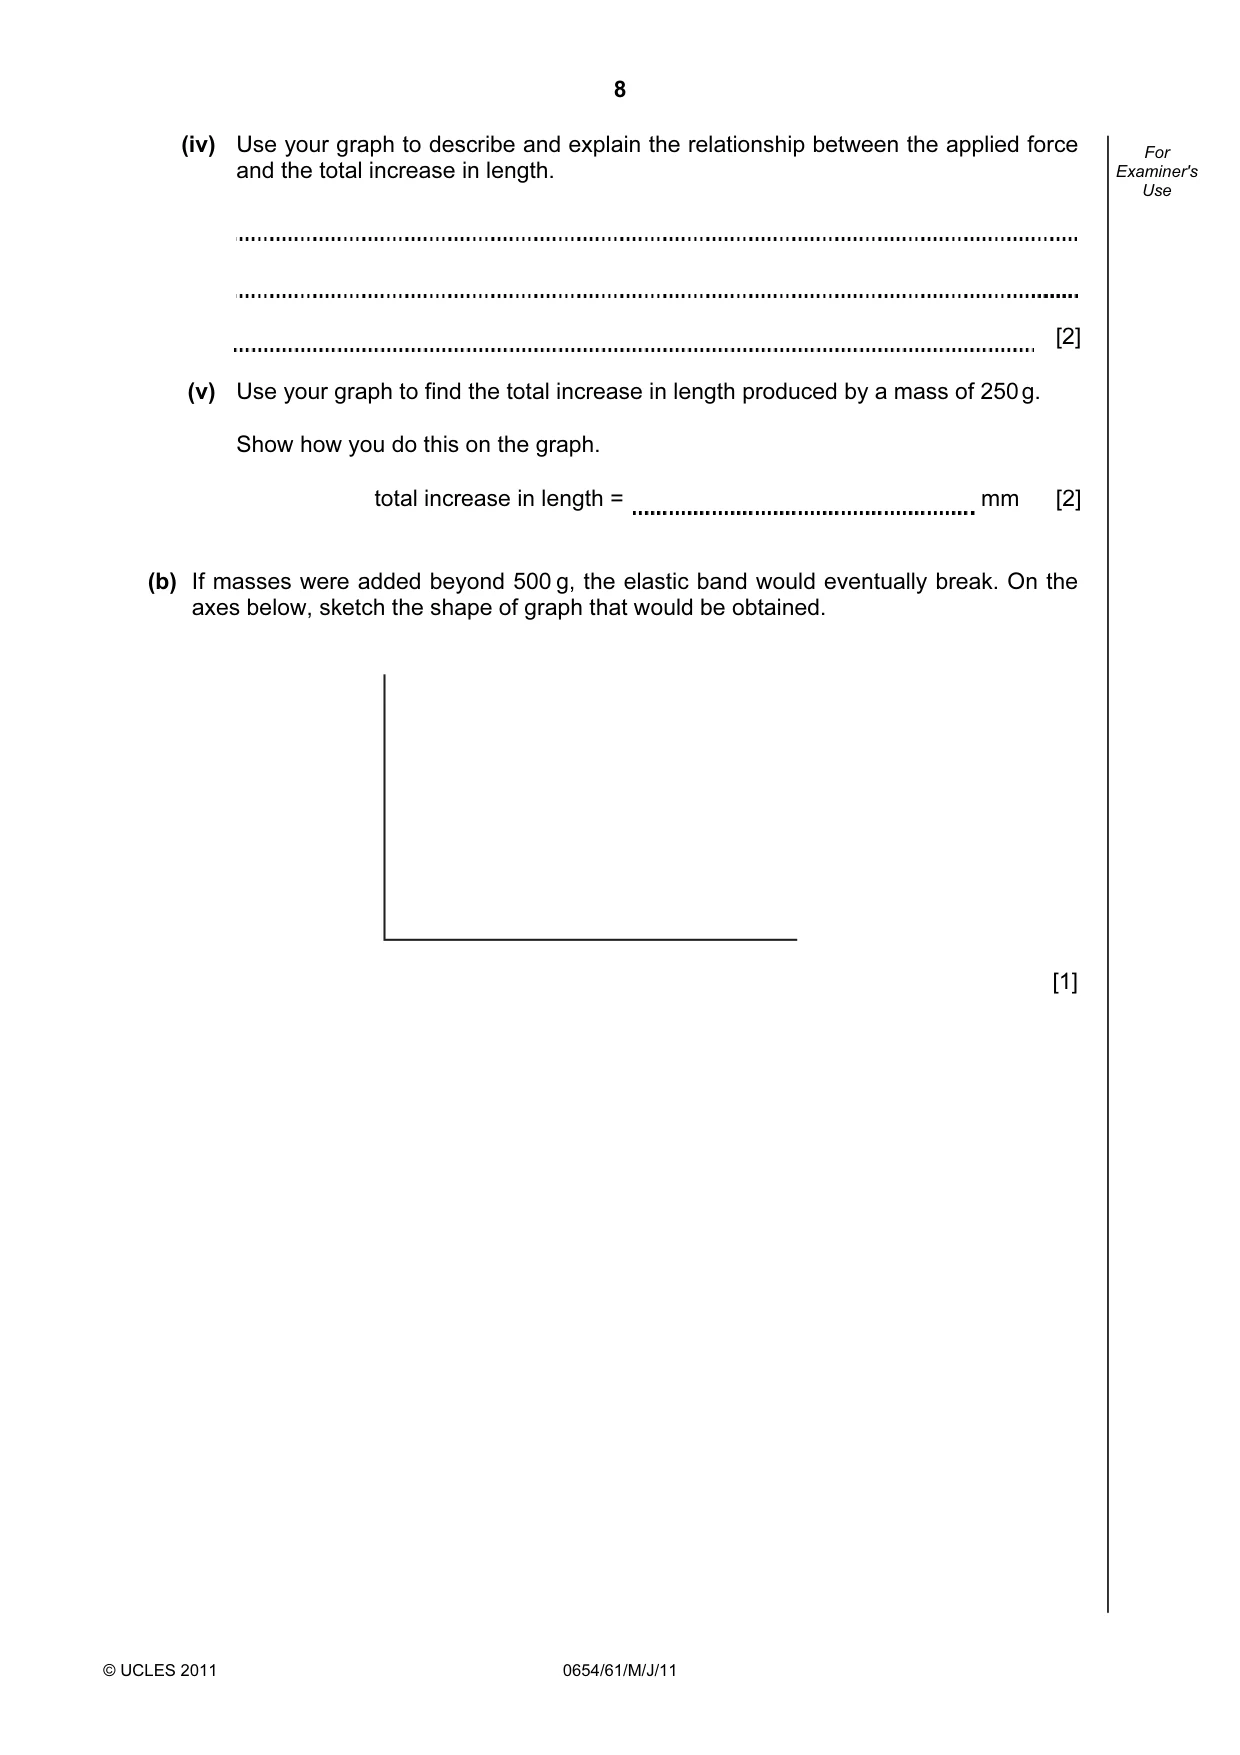
8 © UCLES 2011 0654/61/M/J/11 For Examiner's Use (iv) Use your graph to describe and explain the relationship between the applied force and the total increase in length. [2] (v) Use your graph to find the total increase in length produced by a mass of 250 g. Show how you do this on the graph. total increase in length = mm [2] (b) If masses were added beyond 500 g, the elastic band would eventually break. On the axes below, sketch the shape of graph that would be obtained. [1]
Question paper, page 9
9 © UCLES 2011 0654/61/M/J/11 [Turn over BLANK PAGE Please turn over for Question 3.
Question paper, page 10
10 © UCLES 2011 0654/61/M/J/11 For Examiner's Use 3 (a) A student is provided with a salt Z that contains two cations and one anion. She places a sample of Z in a hard glass test-tube and heats strongly. There is an alkaline gas given off. (i) What test does she use and what observation is seen that proves the gas is alkaline? test observation [2] (ii) Suggest a name for the cation that produces this alkaline gas. [1] (b) Another sample of Z is dissolved in water, and the solution is divided equally into three test-tubes. (i) In one test-tube aqueous sodium hydroxide is added drop by drop, until alkaline. A reddish-brown precipitate is produced. Name the cation that causes this precipitate. [1] (ii) In the second test-tube of solution Z she tests for chloride ions. Describe how she does this, naming any chemicals used and the observations for a positive test and a negative test. [3] The test for chloride ions proved negative. (iii) In the third test-tube of solution Z she adds a few drops of hydrochloric acid, followed by a few drops of aqueous barium chloride. A white precipitate is produced. Name the anion that produces this precipitate. [1]
Question paper, page 11
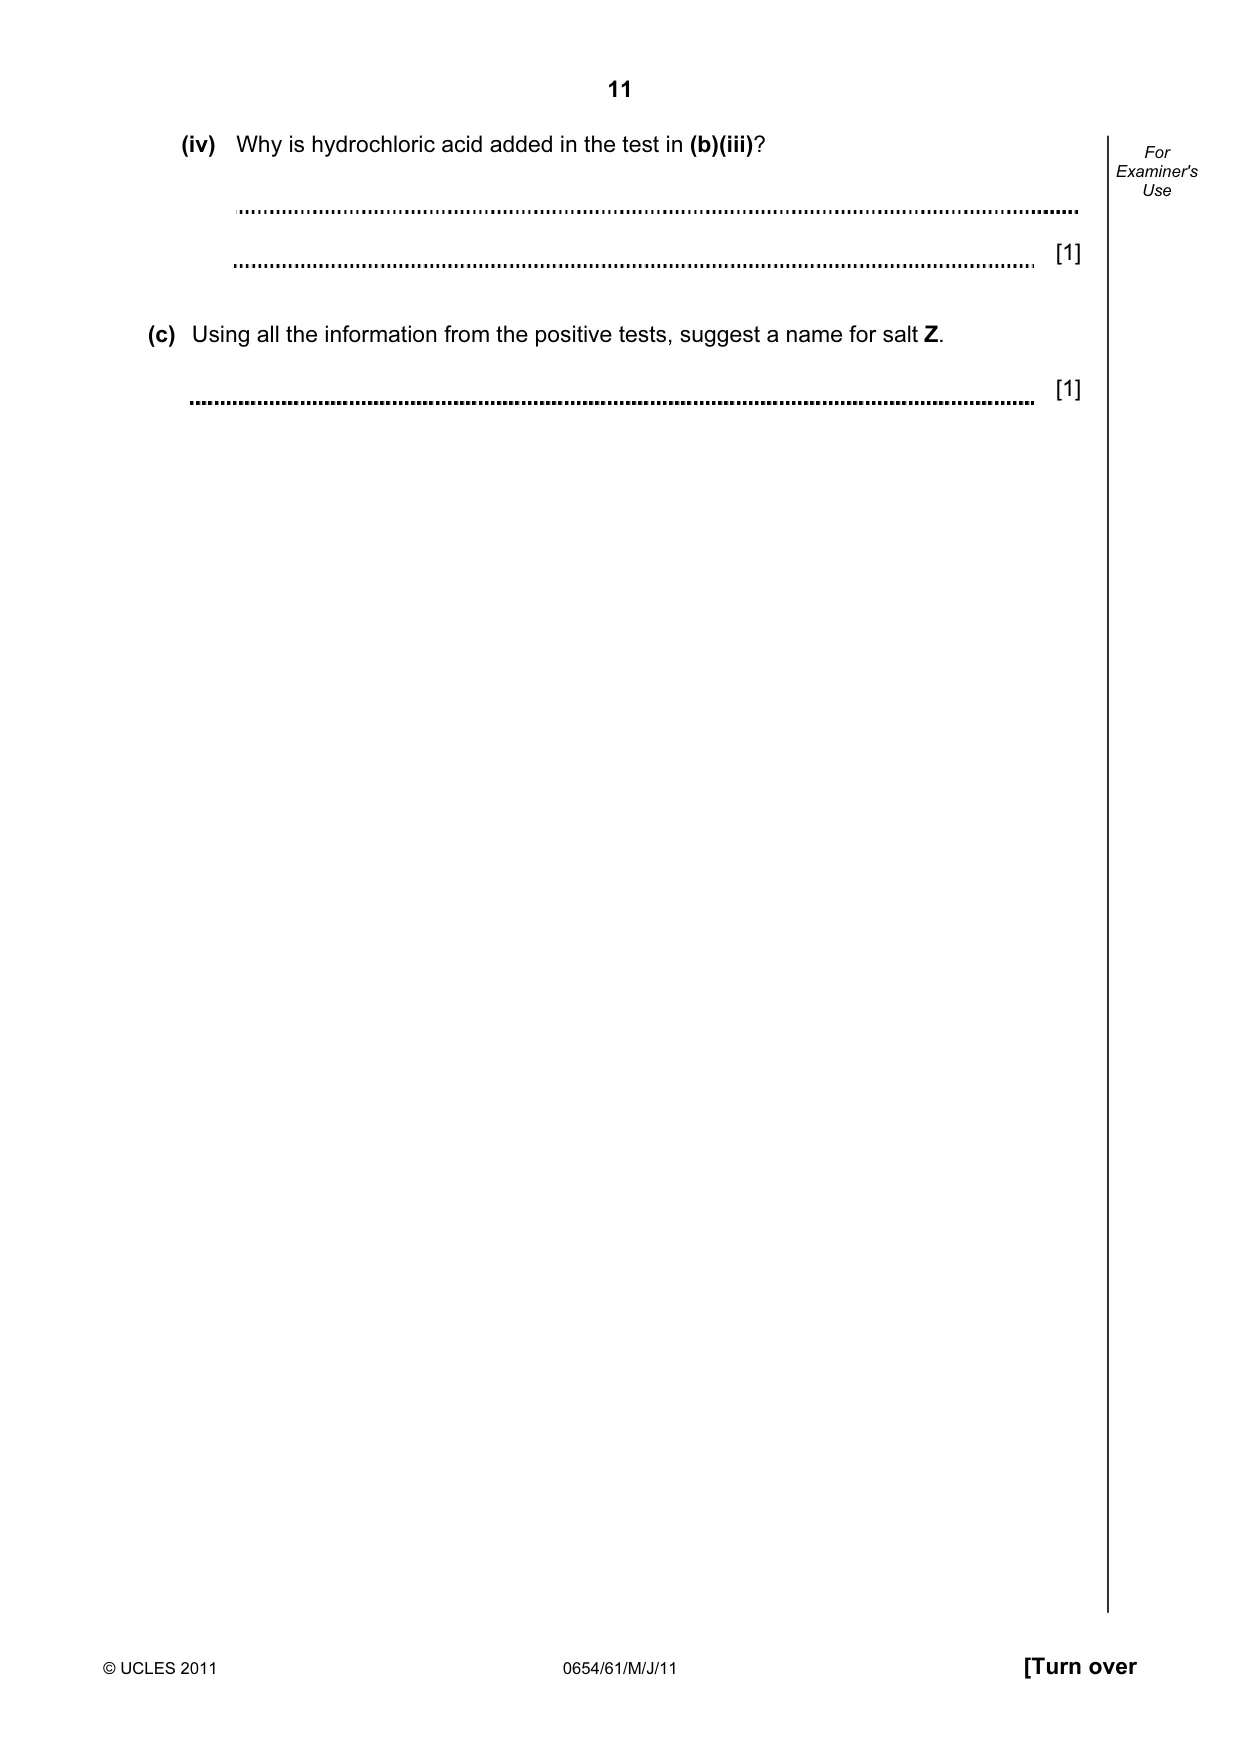
11 © UCLES 2011 0654/61/M/J/11 [Turn over For Examiner's Use (iv) Why is hydrochloric acid added in the test in (b)(iii)? [1] (c) Using all the information from the positive tests, suggest a name for salt Z. [1]
Question paper, page 12
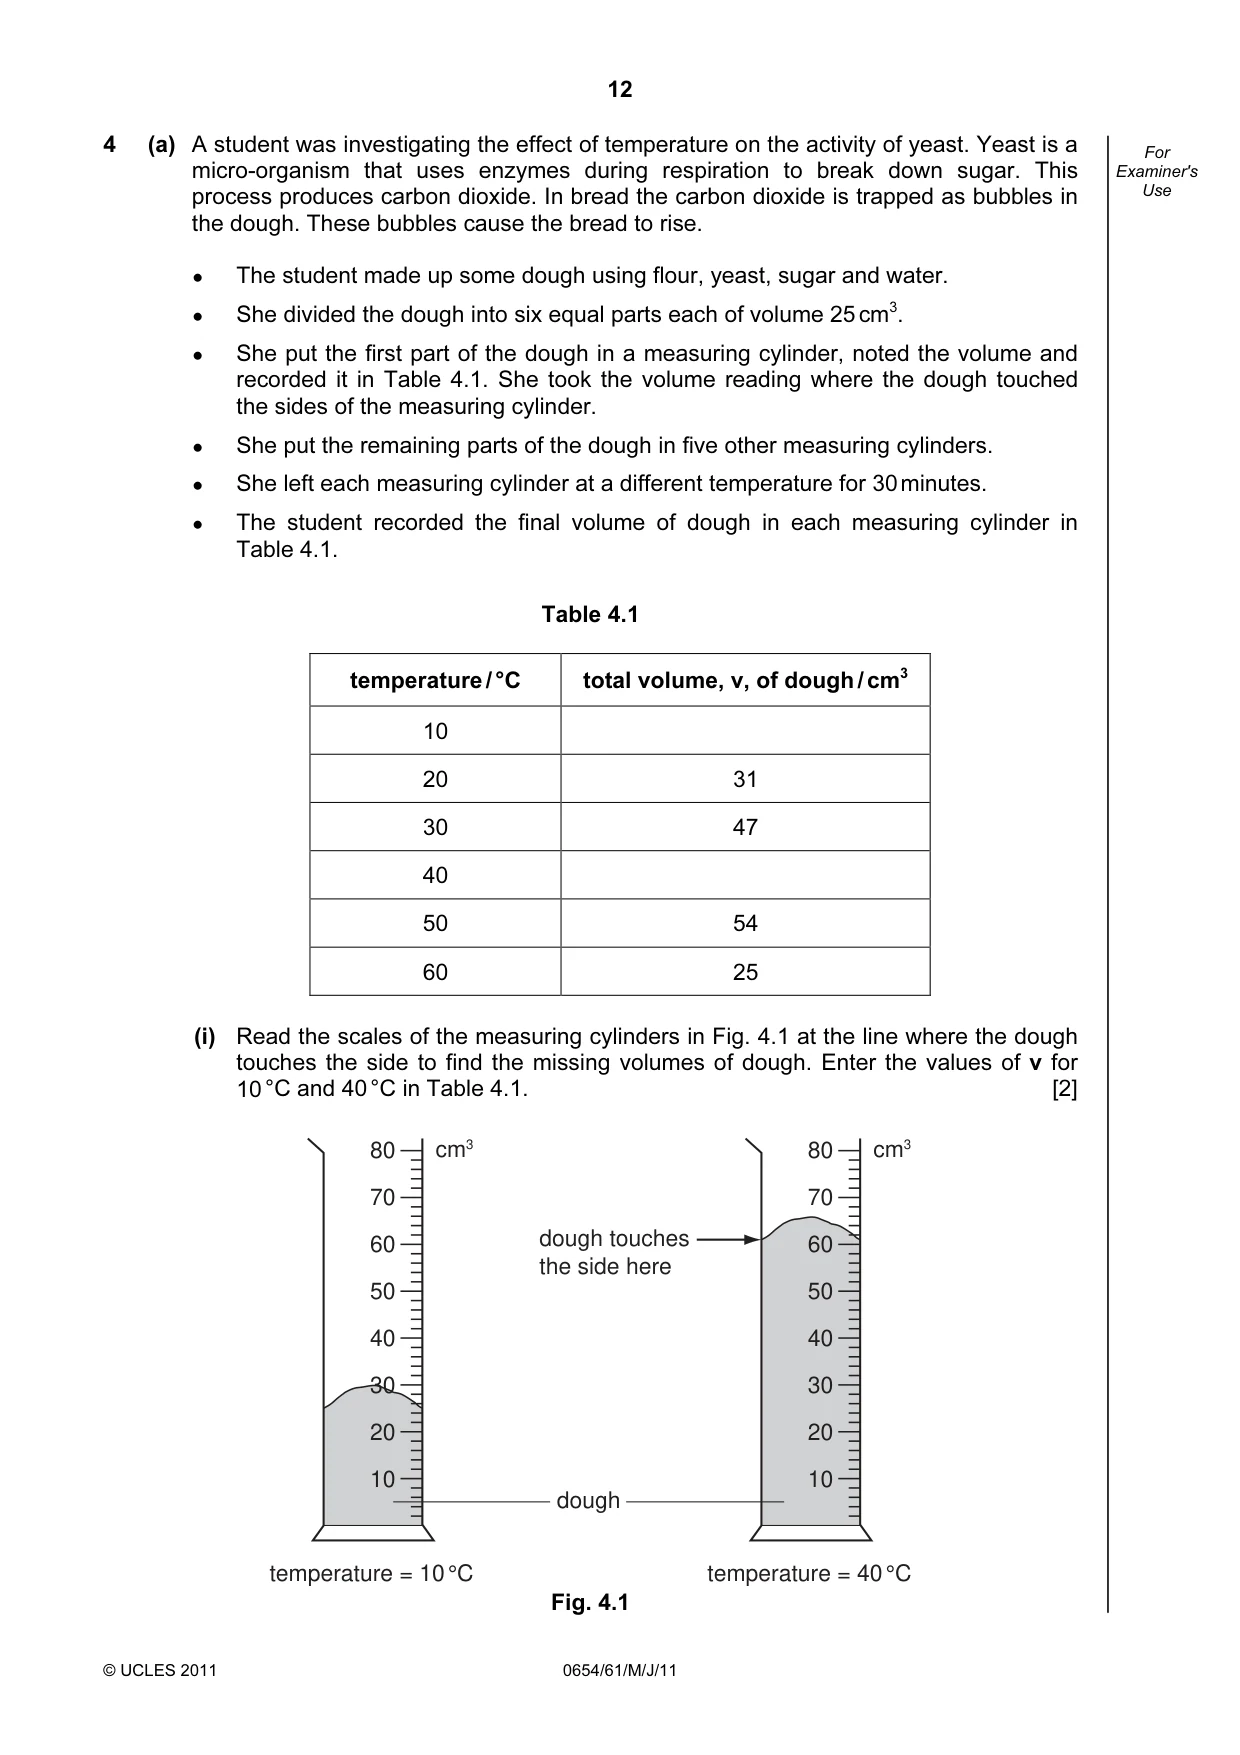
12 © UCLES 2011 0654/61/M/J/11 For Examiner's Use 4 (a) A student was investigating the effect of temperature on the activity of yeast. Yeast is a micro-organism that uses enzymes during respiration to break down sugar. This process produces carbon dioxide. In bread the carbon dioxide is trapped as bubbles in the dough. These bubbles cause the bread to rise. ● The student made up some dough using flour, yeast, sugar and water. ● She divided the dough into six equal parts each of volume 25 cm3. ● She put the first part of the dough in a measuring cylinder, noted the volume and recorded it in Table 4.1. She took the volume reading where the dough touched the sides of the measuring cylinder. ● She put the remaining parts of the dough in five other measuring cylinders. ● She left each measuring cylinder at a different temperature for 30 minutes. ● The student recorded the final volume of dough in each measuring cylinder in Table 4.1. Table 4.1 temperature / °C total volume, v, of dough / cm3 10 20 31 30 47 40 50 54 60 25 (i) Read the scales of the measuring cylinders in Fig. 4.1 at the line where the dough touches the side to find the missing volumes of dough. Enter the values of v for 10 °C and 40 °C in Table 4.1. [2] 80 70 60 50 40 30 20 10 temperature = 10 °C cm3 80 70 60 50 40 30 20 10 temperature = 40 °C cm3 dough touches the side here dough dough dough Fig. 4.1
Question paper, page 13
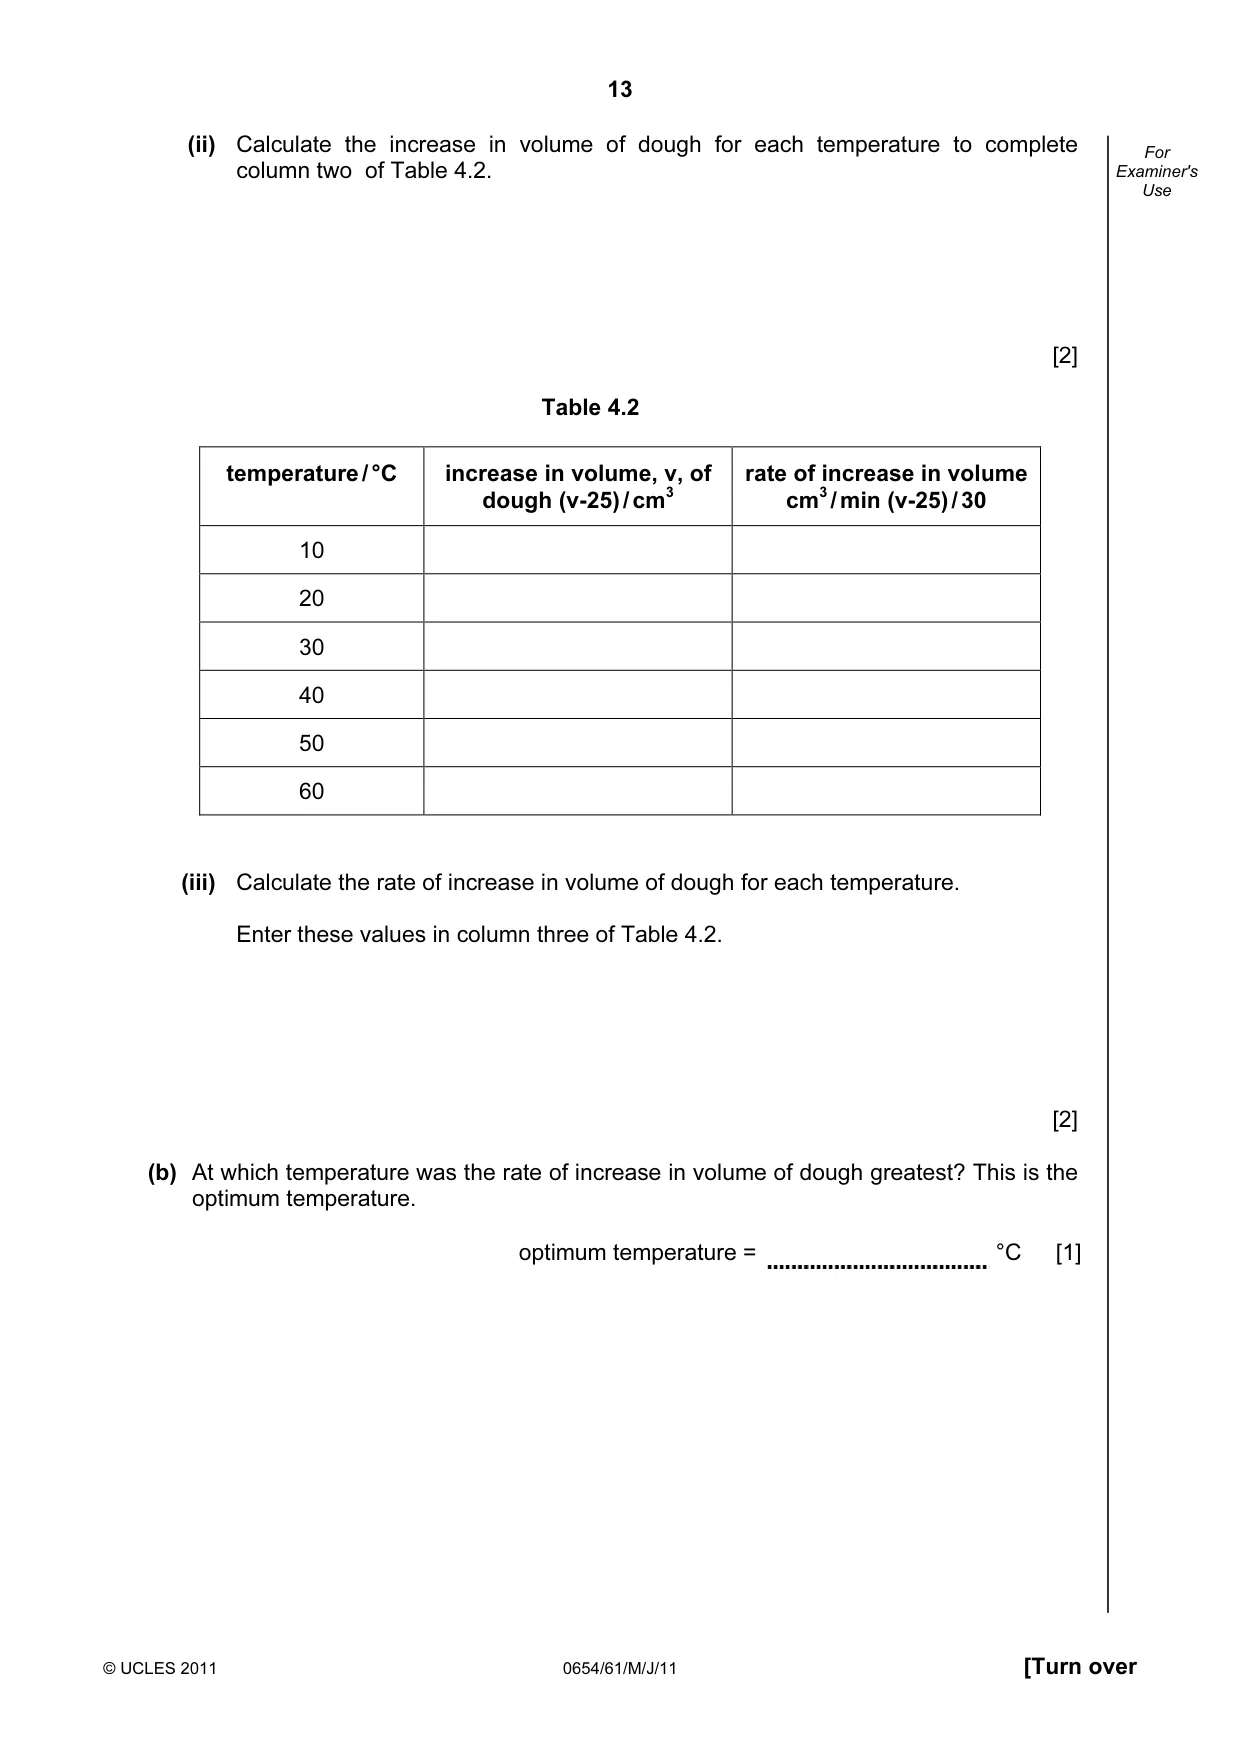
13 © UCLES 2011 0654/61/M/J/11 [Turn over For Examiner's Use (ii) Calculate the increase in volume of dough for each temperature to complete column two of Table 4.2. [2] Table 4.2 temperature / °C increase in volume, v, of dough (v-25) / cm3 rate of increase in volume cm3 / min (v-25) / 30 10 20 30 40 50 60 (iii) Calculate the rate of increase in volume of dough for each temperature. Enter these values in column three of Table 4.2. [2] (b) At which temperature was the rate of increase in volume of dough greatest? This is the optimum temperature. optimum temperature = °C [1]
Question paper, page 14
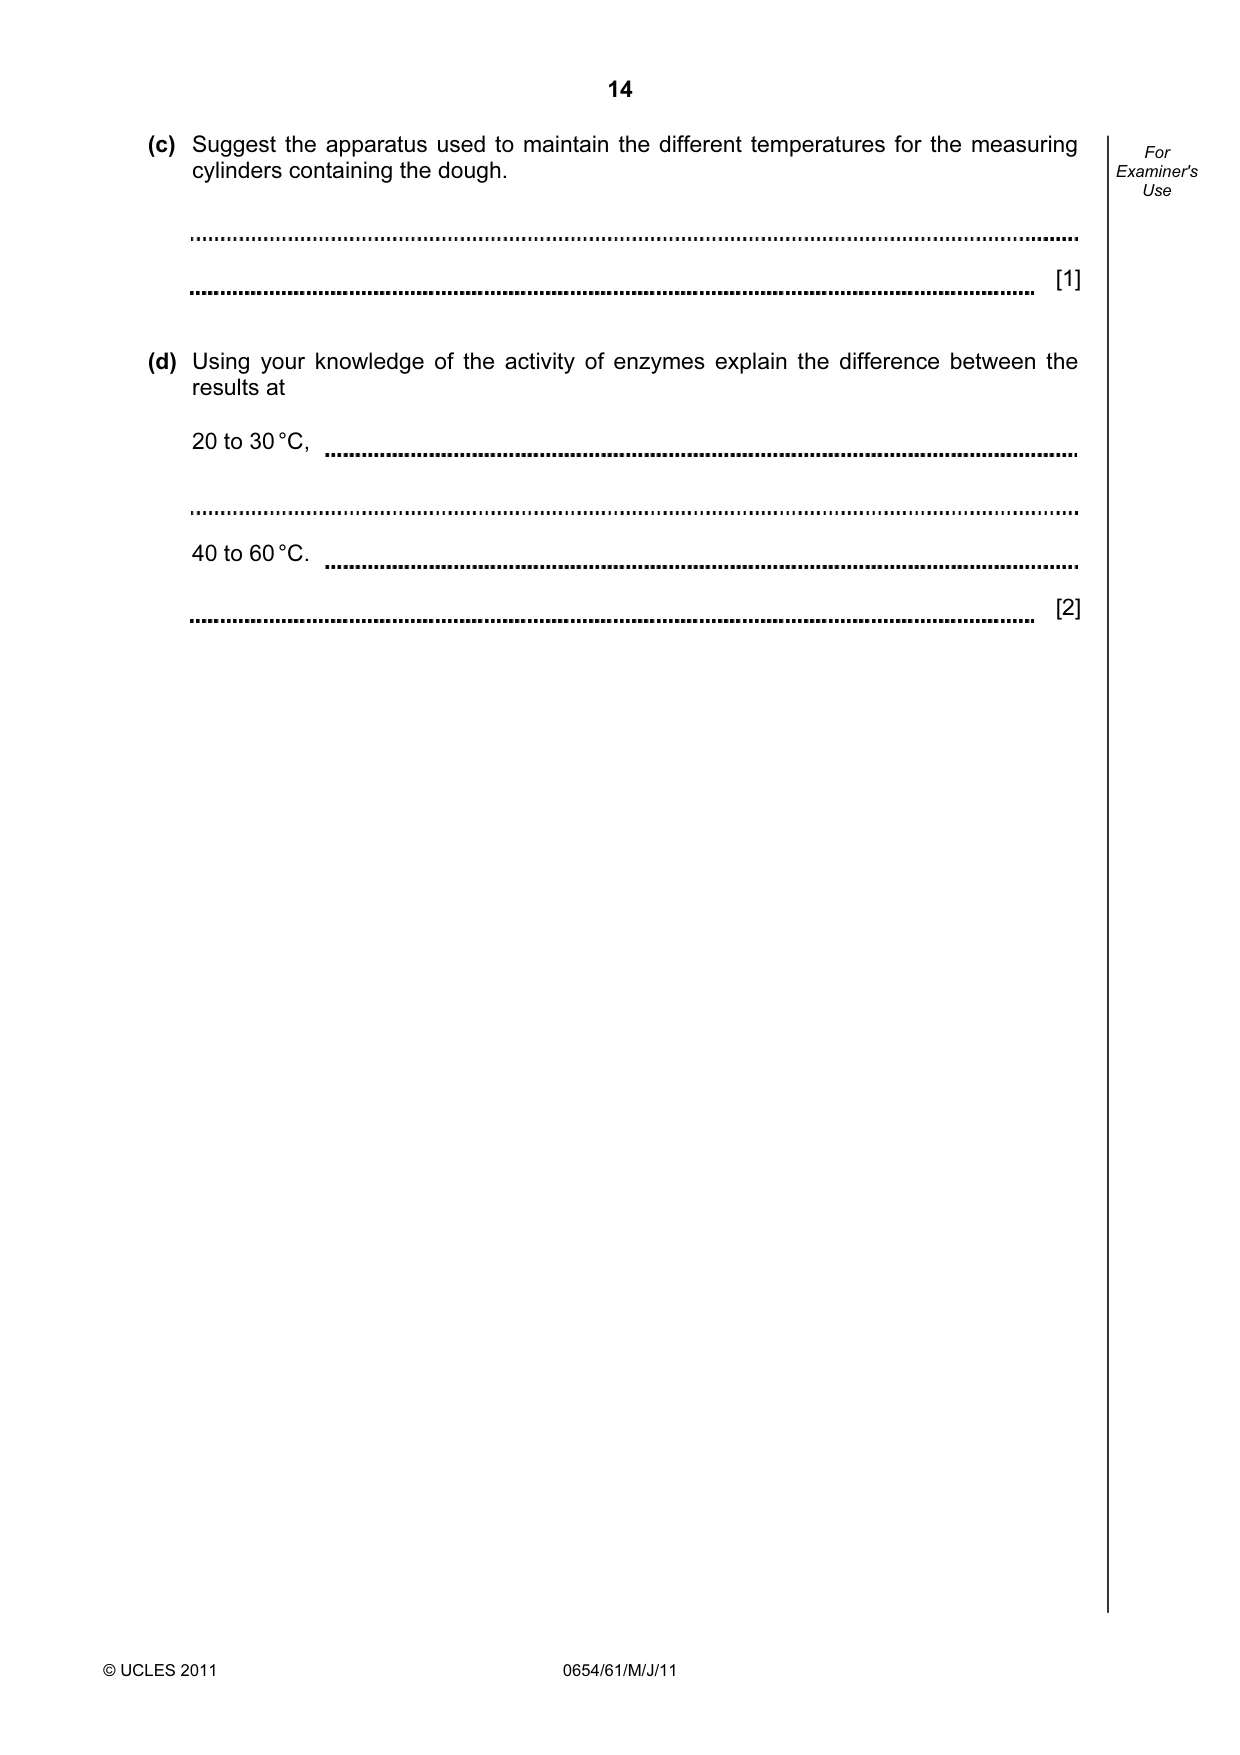
14 © UCLES 2011 0654/61/M/J/11 For Examiner's Use (c) Suggest the apparatus used to maintain the different temperatures for the measuring cylinders containing the dough. [1] (d) Using your knowledge of the activity of enzymes explain the difference between the results at 20 to 30 °C, 40 to 60 °C. [2]
Question paper, page 15
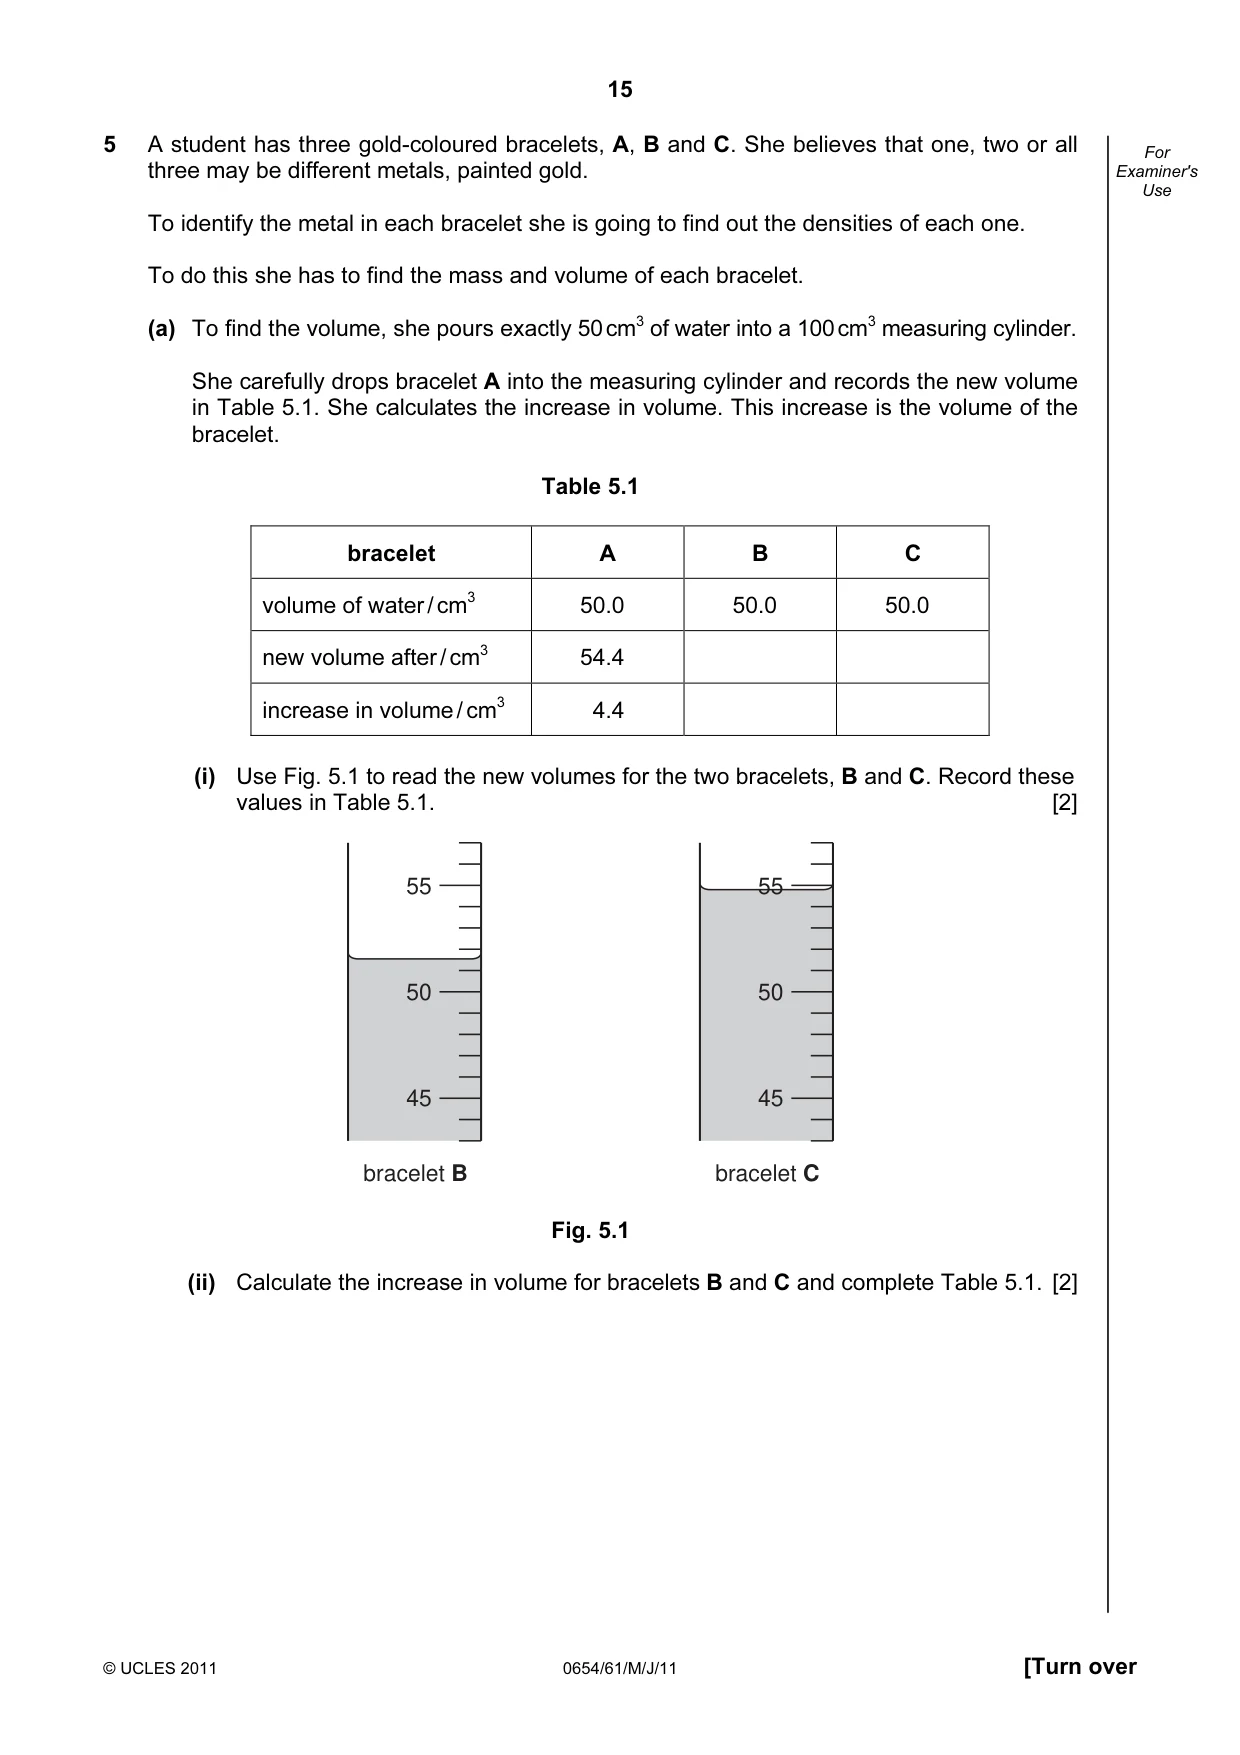
15 © UCLES 2011 0654/61/M/J/11 [Turn over For Examiner's Use 5 A student has three gold-coloured bracelets, A, B and C. She believes that one, two or all three may be different metals, painted gold. To identify the metal in each bracelet she is going to find out the densities of each one. To do this she has to find the mass and volume of each bracelet. (a) To find the volume, she pours exactly 50 cm3 of water into a 100 cm3 measuring cylinder. She carefully drops bracelet A into the measuring cylinder and records the new volume in Table 5.1. She calculates the increase in volume. This increase is the volume of the bracelet. Table 5.1 bracelet A B C volume of water / cm3 50.0 50.0 50.0 new volume after / cm3 54.4 increase in volume / cm3 4.4 (i) Use Fig. 5.1 to read the new volumes for the two bracelets, B and C. Record these values in Table 5.1. [2] 55 50 45 bracelet B 55 50 45 bracelet C Fig. 5.1 (ii) Calculate the increase in volume for bracelets B and C and complete Table 5.1. [2]
Question paper, page 16
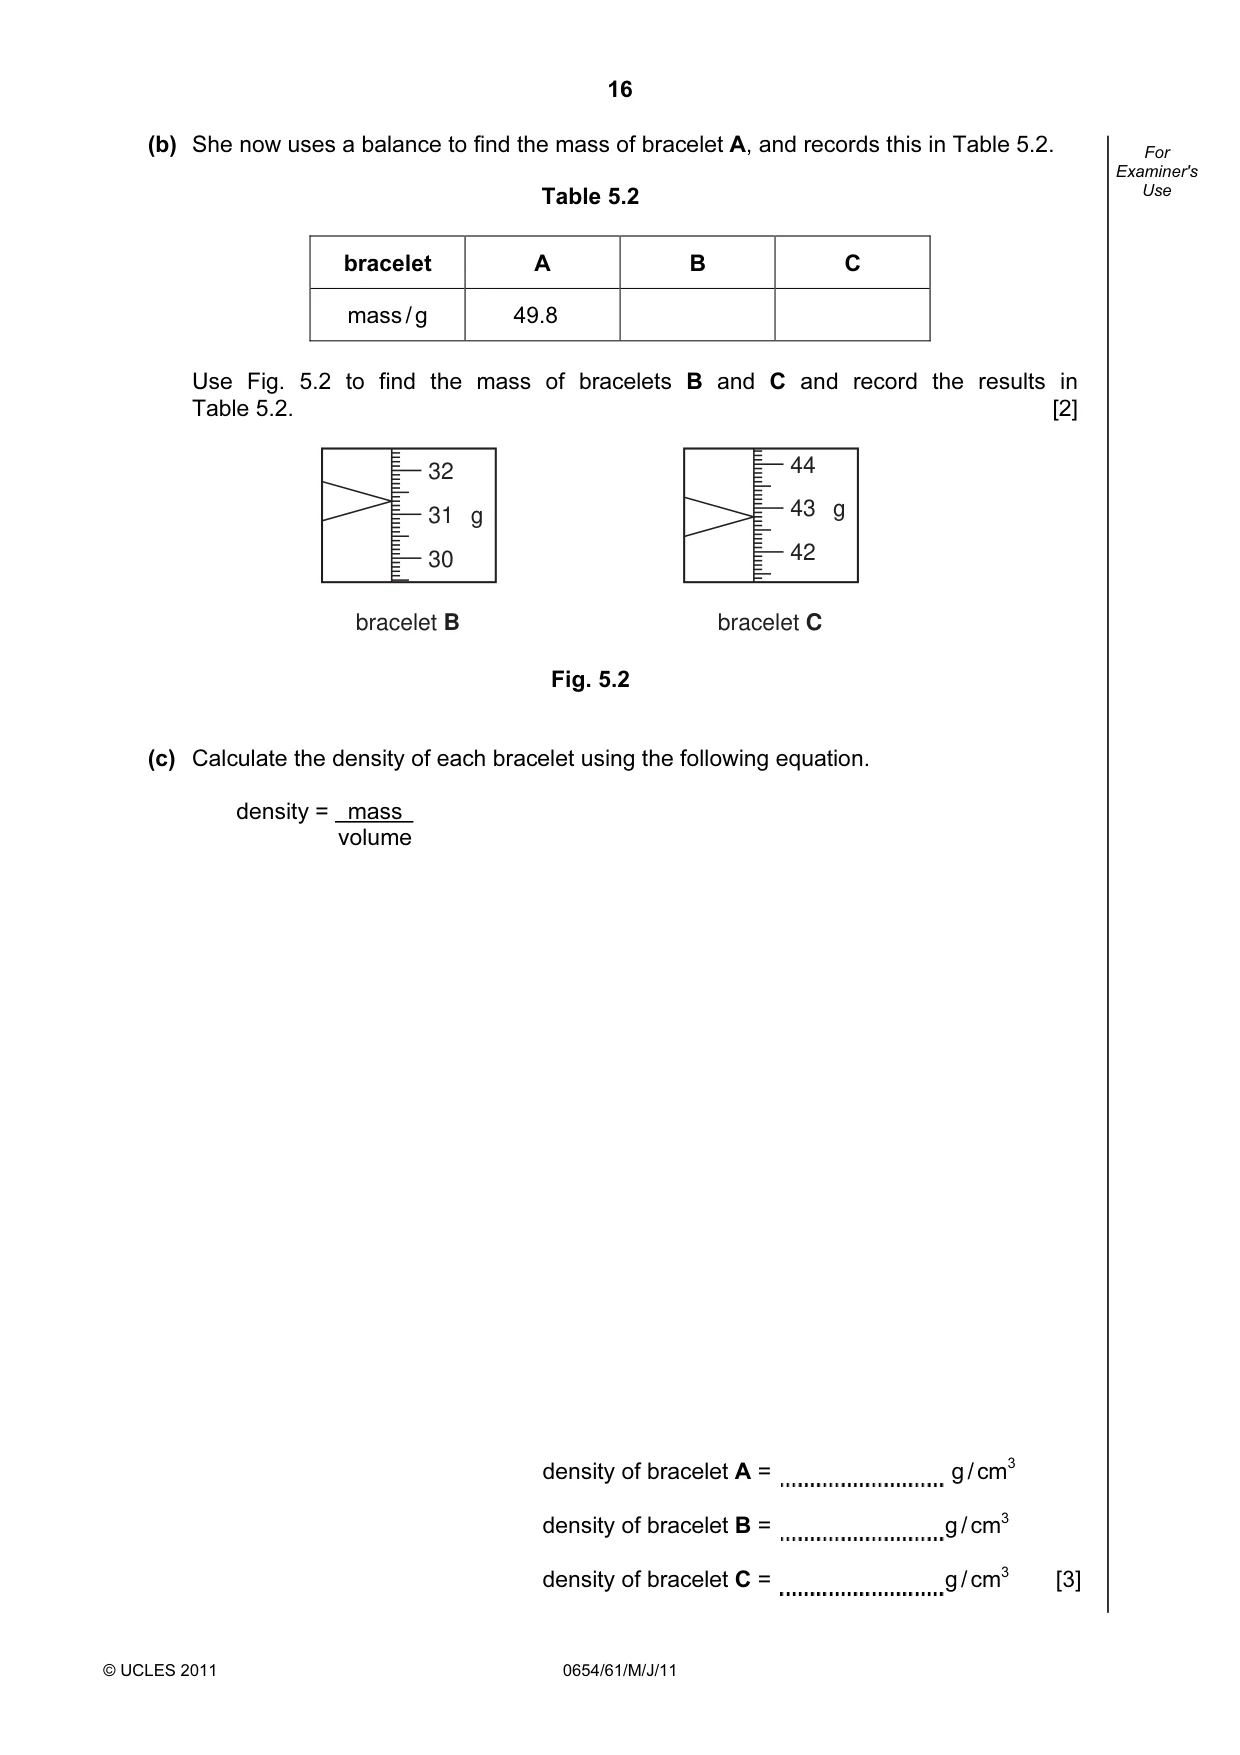
16 © UCLES 2011 0654/61/M/J/11 For Examiner's Use (b) She now uses a balance to find the mass of bracelet A, and records this in Table 5.2. Table 5.2 bracelet A B C mass / g 49.8 Use Fig. 5.2 to find the mass of bracelets B and C and record the results in Table 5.2. [2] 32 31 30 g bracelet B 44 43 42 g bracelet C Fig. 5.2 (c) Calculate the density of each bracelet using the following equation. density = mass volume density of bracelet A = g / cm3 density of bracelet B = g / cm3 density of bracelet C = g / cm3 [3]
Question paper, page 17
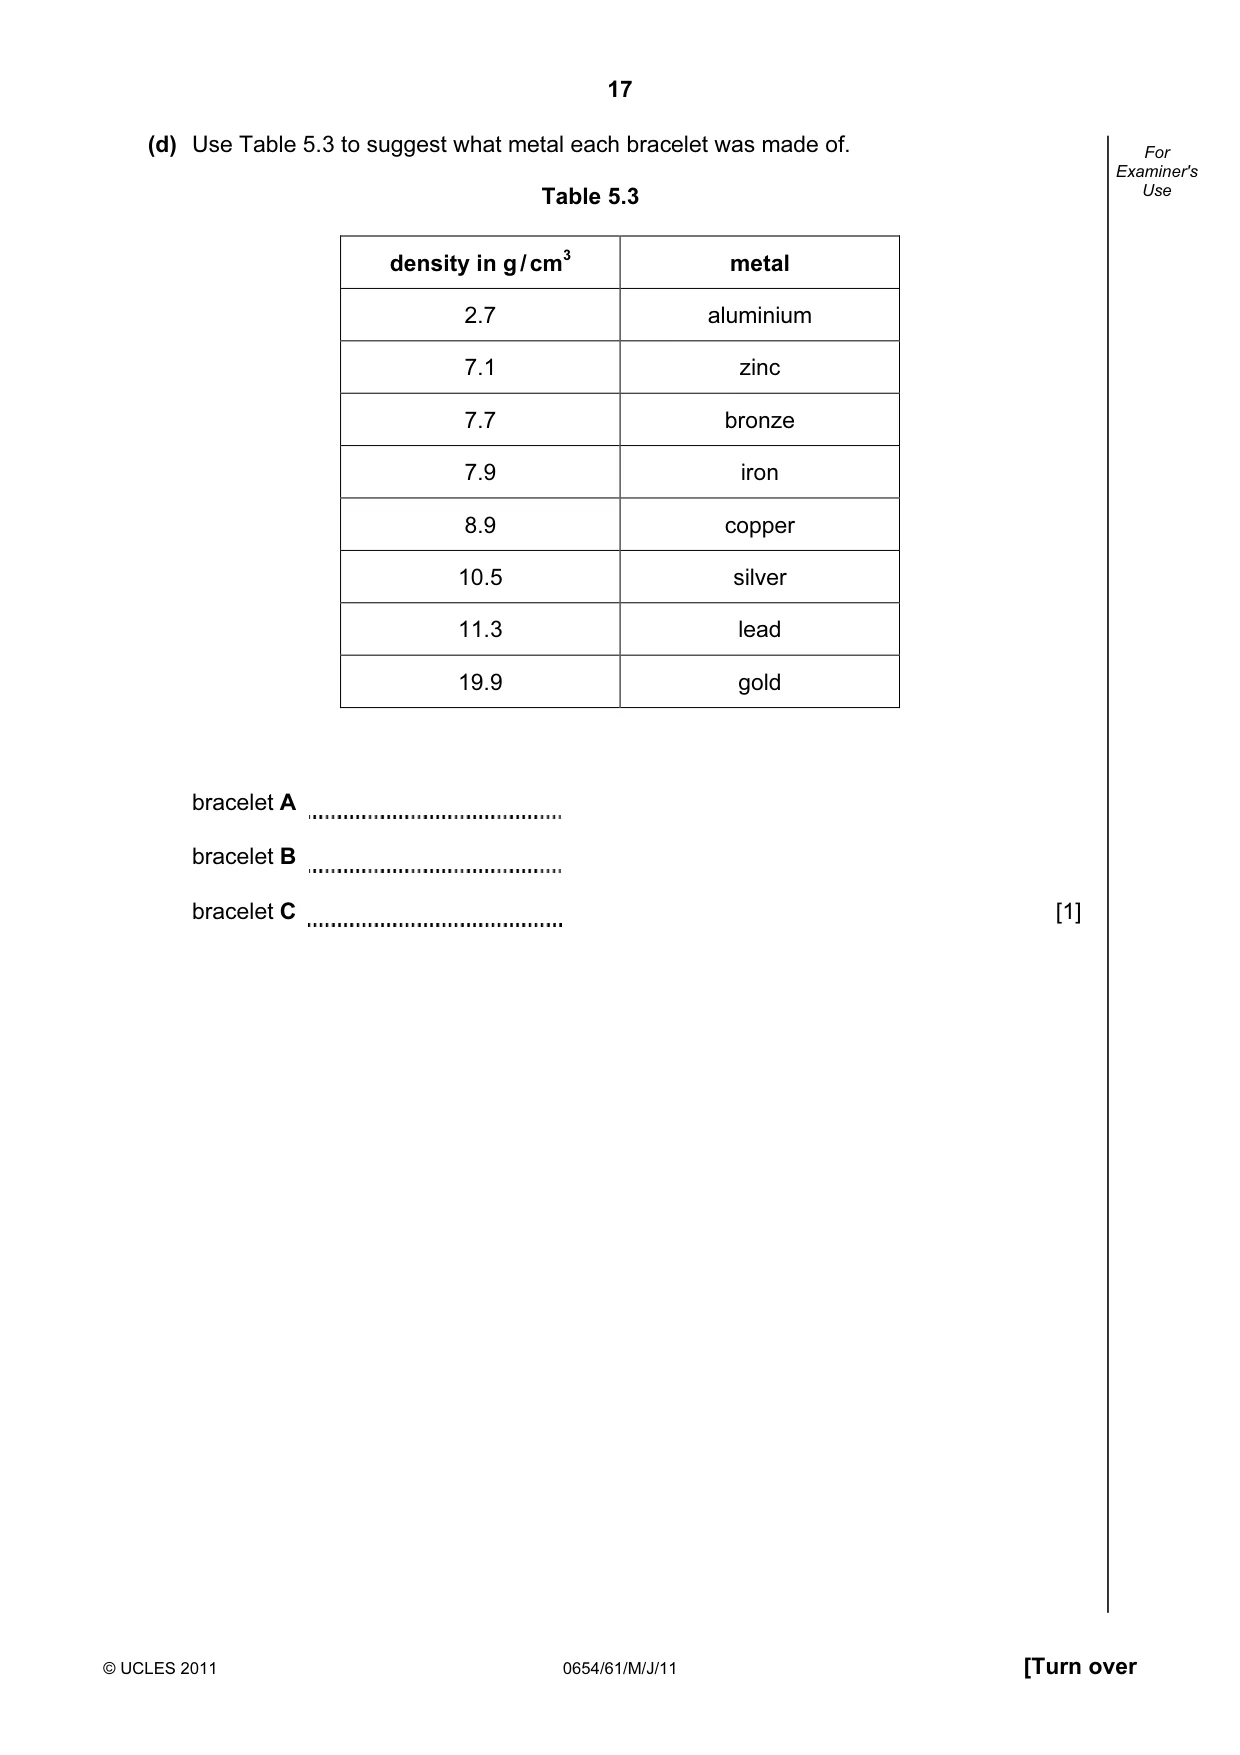
17 © UCLES 2011 0654/61/M/J/11 [Turn over For Examiner's Use (d) Use Table 5.3 to suggest what metal each bracelet was made of. Table 5.3 density in g / cm3 metal 2.7 aluminium 7.1 zinc 7.7 bronze 7.9 iron 8.9 copper 10.5 silver 11.3 lead 19.9 gold bracelet A bracelet B bracelet C [1]
Question paper, page 18
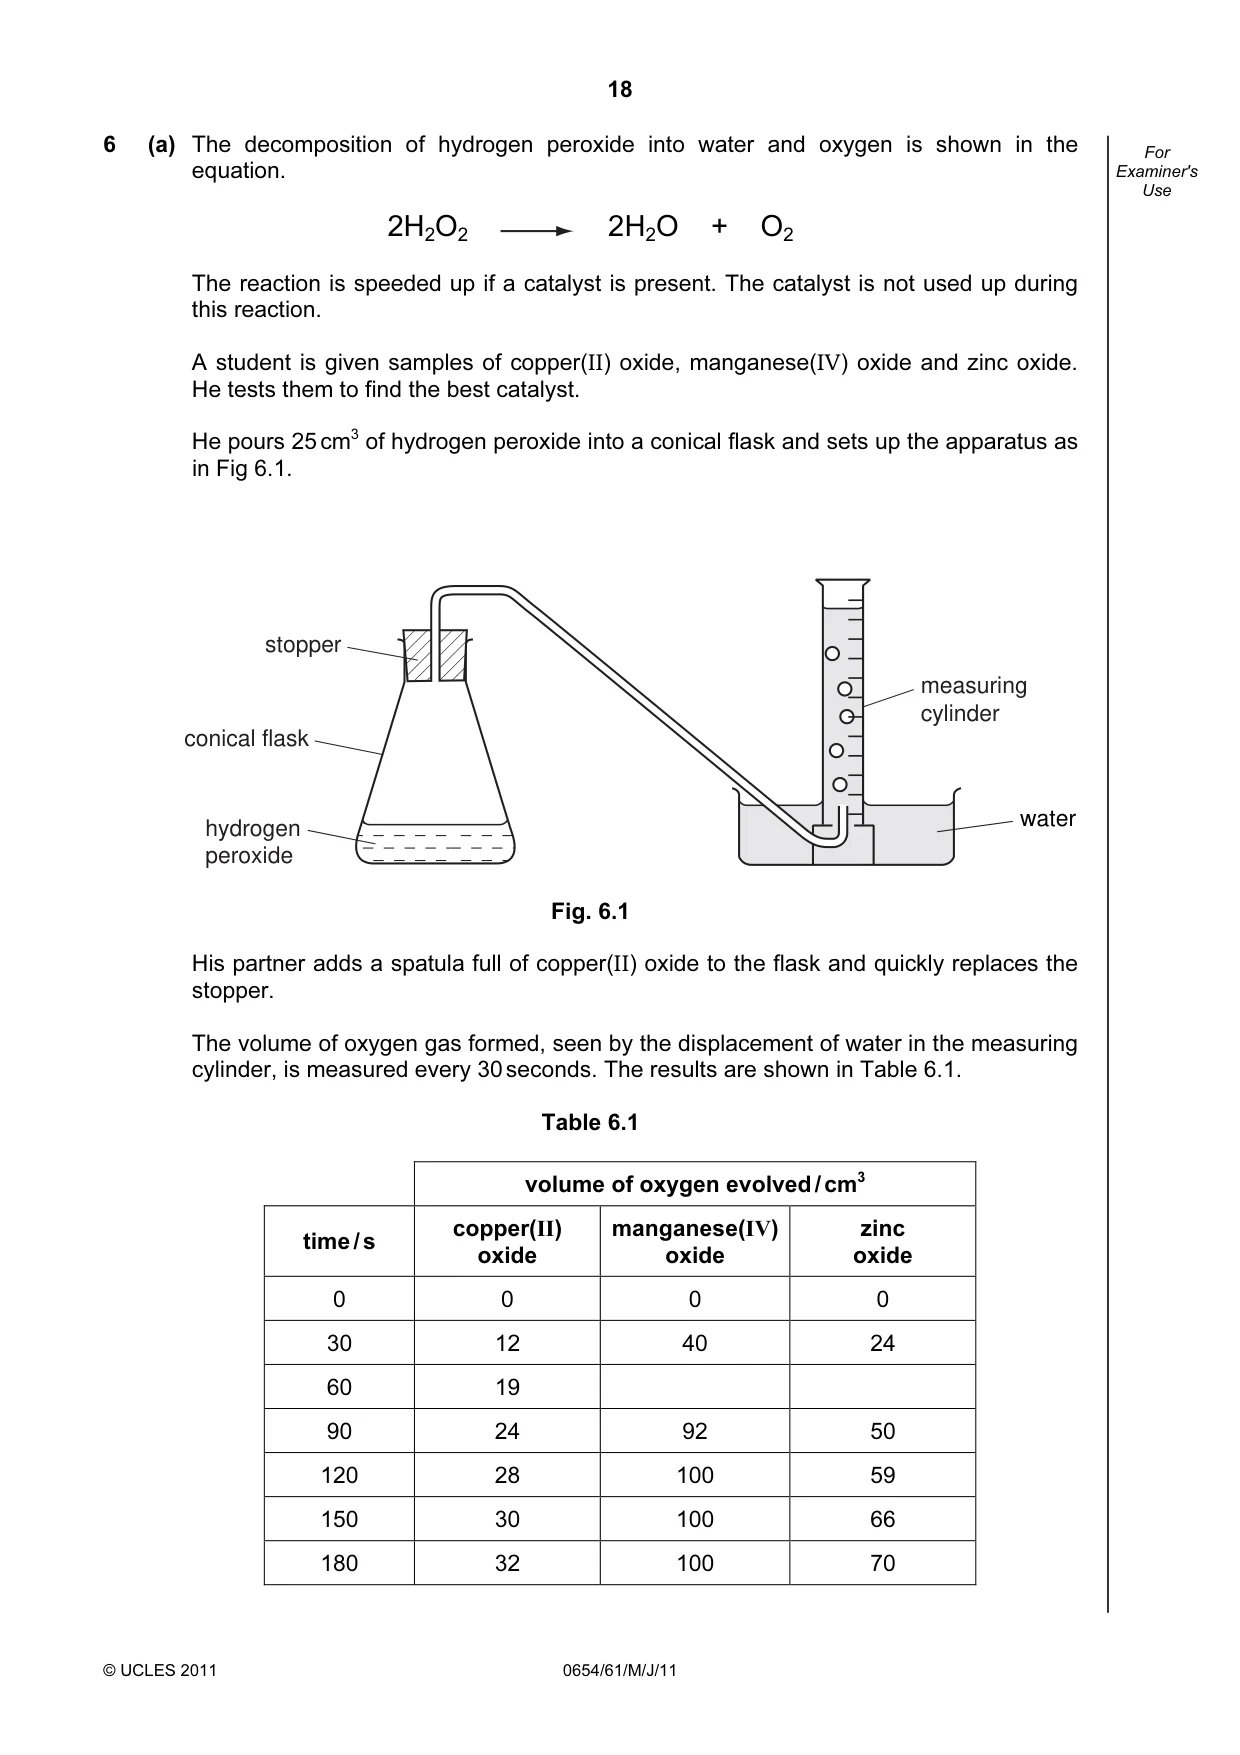
18 © UCLES 2011 0654/61/M/J/11 For Examiner's Use 6 (a) The decomposition of hydrogen peroxide into water and oxygen is shown in the equation. 2H2O2 2H2O + O2 The reaction is speeded up if a catalyst is present. The catalyst is not used up during this reaction. A student is given samples of copper(II) oxide, manganese(IV) oxide and zinc oxide. He tests them to find the best catalyst. He pours 25 cm3 of hydrogen peroxide into a conical flask and sets up the apparatus as in Fig 6.1. water measuring cylinder hydrogen peroxide stopper conical flask Fig. 6.1 His partner adds a spatula full of copper(II) oxide to the flask and quickly replaces the stopper. The volume of oxygen gas formed, seen by the displacement of water in the measuring cylinder, is measured every 30 seconds. The results are shown in Table 6.1. Table 6.1 volume of oxygen evolved / cm3 time / s copper(II) oxide manganese(IV) oxide zinc oxide 0 0 0 0 30 12 40 24 60 19 90 24 92 50 120 28 100 59 150 30 100 66 180 32 100 70
Question paper, page 19
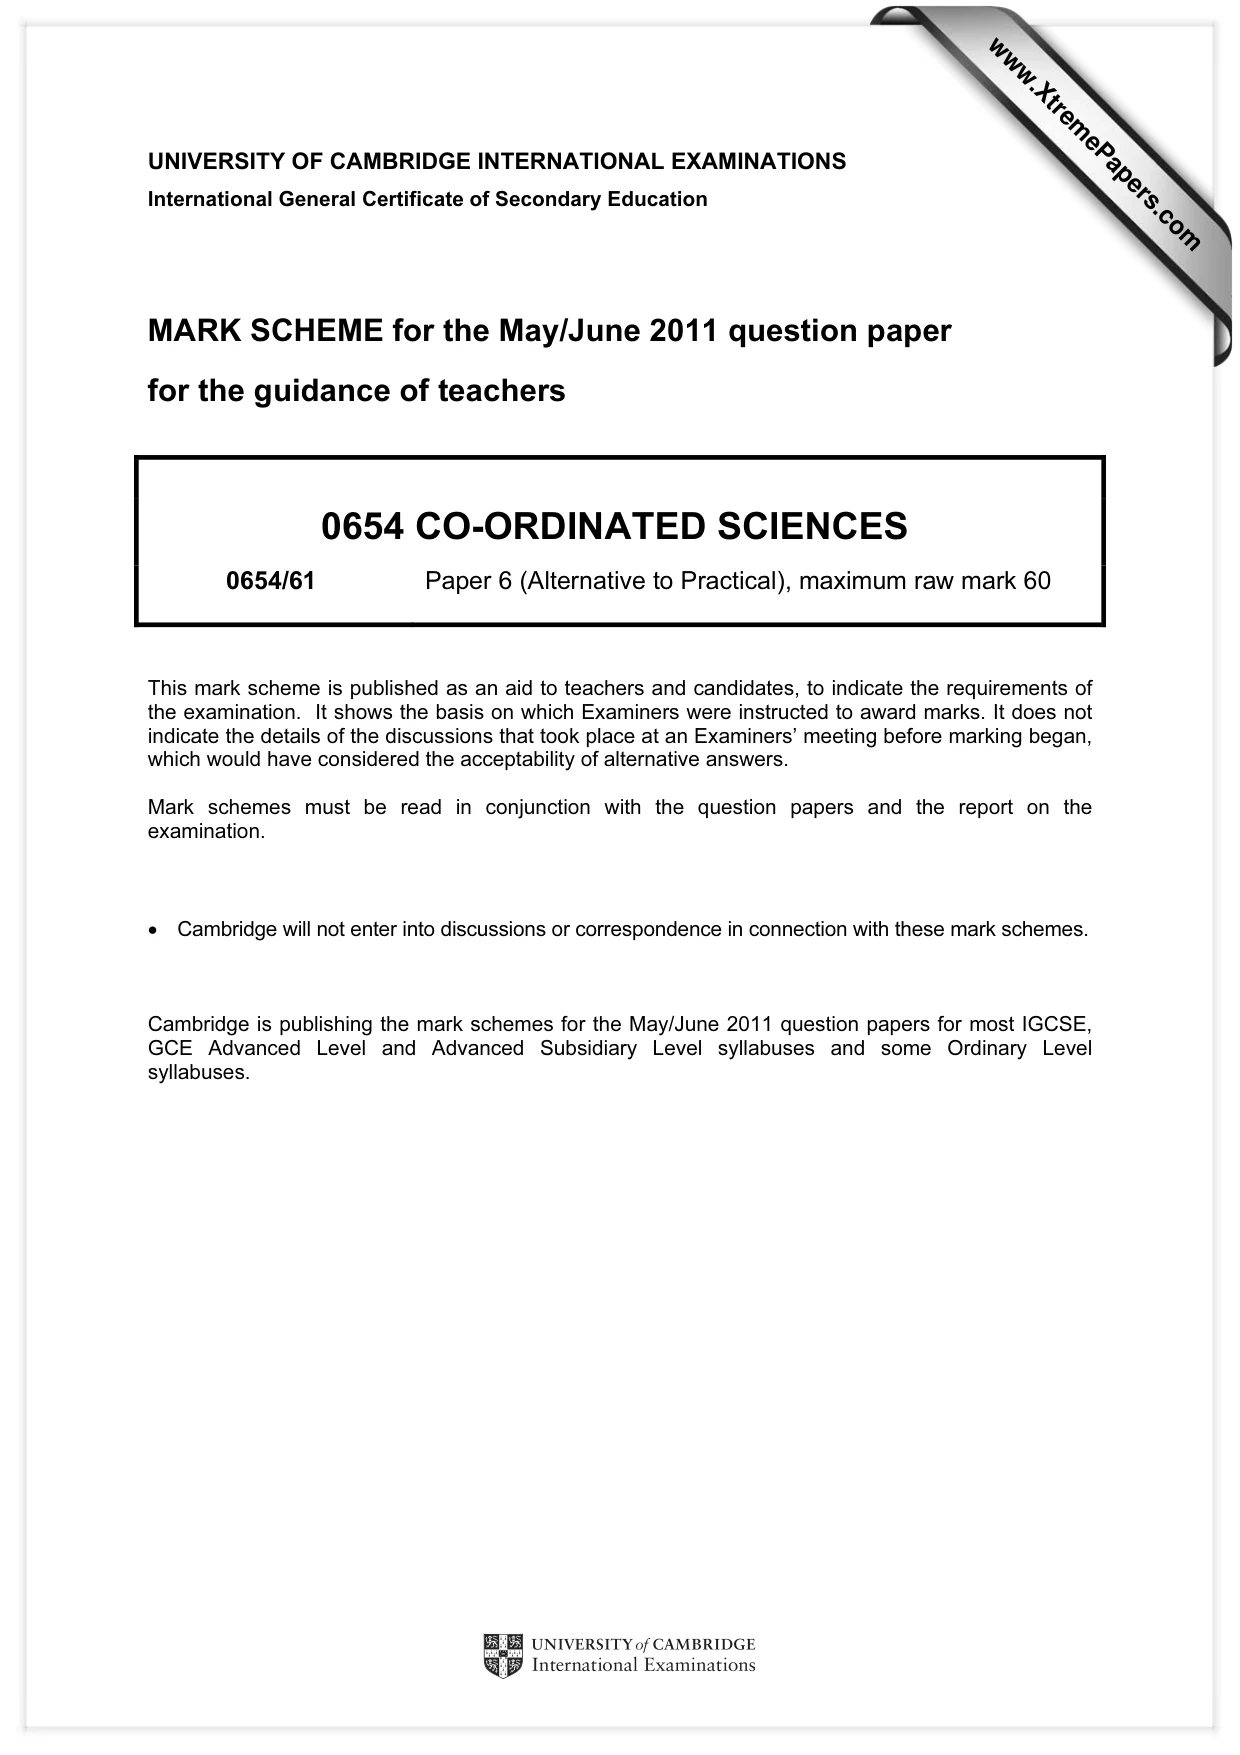
19 © UCLES 2011 0654/61/M/J/11 [Turn over For Examiner's Use (i) He now repeats the experiment with the same volume of fresh hydrogen peroxide, using manganese(IV) oxide instead of copper(II) oxide. The results are recorded in Table 6.1. With another sample of hydrogen peroxide he uses zinc oxide. The results are recorded in Table 6.1. Use Fig. 6.2, to read the volume of gas produced in each measuring cylinder after 60 seconds. Complete Table 6.1. [2] 90 80 70 60 manganese(IV) oxide 50 40 30 20 zinc oxide Fig. 6.2 (ii) On the grid plot a graph of volume of oxygen evolved / cm3 against time / s for manganese(IV) oxide and zinc oxide. Draw a smooth curve for each oxide and label them both clearly. 100 80 60 40 20 0 0 30 60 90 time / s volume of oxygen evolved / cm3 120 150 180 copper(II) oxide [4]
Question paper, page 20
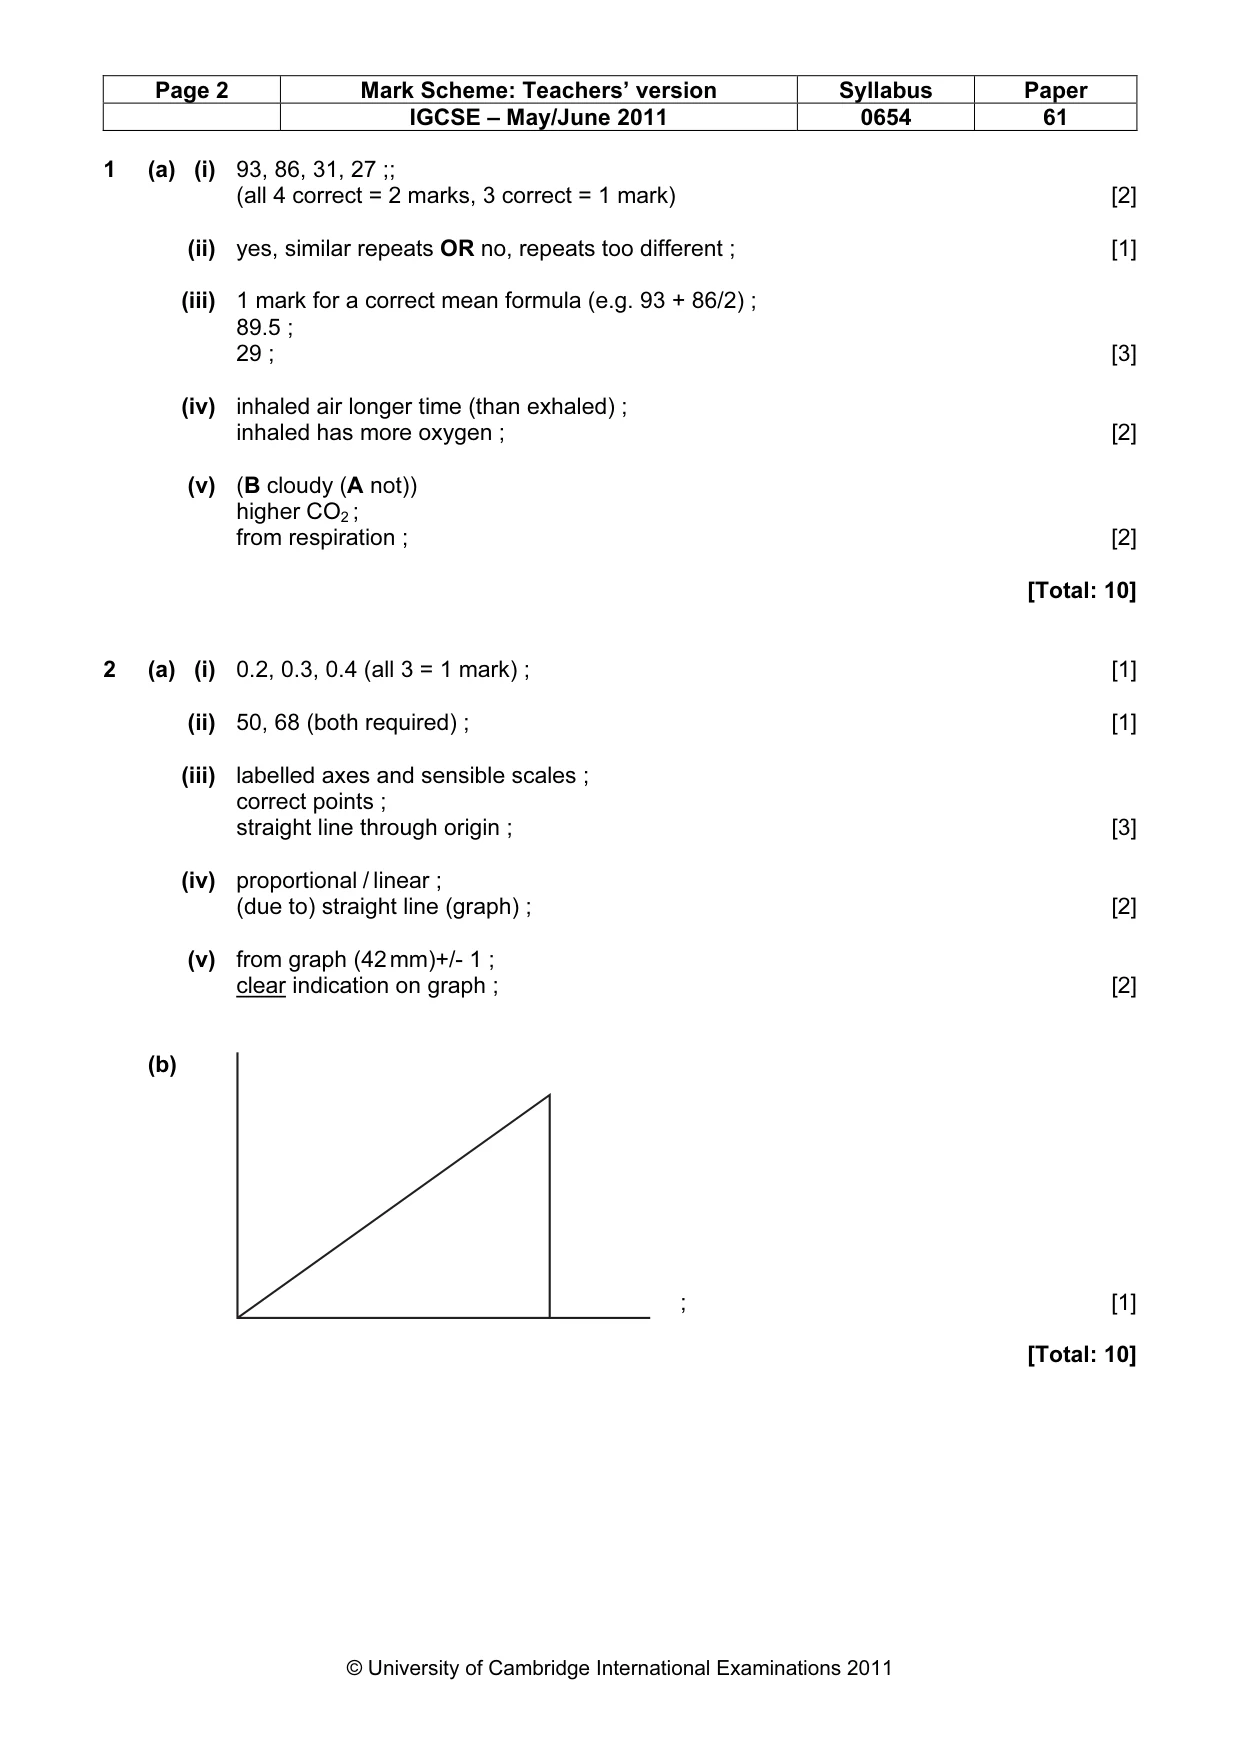
20 Permission to reproduce items where third-party owned material protected by copyright is included has been sought and cleared where possible. Every reasonable effort has been made by the publisher (UCLES) to trace copyright holders, but if any items requiring clearance have unwittingly been included, the publisher will be pleased to make amends at the earliest possible opportunity. University of Cambridge International Examinations is part of the Cambridge Assessment Group. Cambridge Assessment is the brand name of University of Cambridge Local Examinations Syndicate (UCLES), which is itself a department of the University of Cambridge. © UCLES 2011 0654/61/M/J/11 For Examiner's Use (iii) Use your graph to suggest which metal oxide makes the best catalyst. Explain your answer. [1] (b) Suggest one source of error in the experiment. [1] (c) How can you prove that the metal oxide you have named in (a)(iii) is a catalyst? [2]
Mark scheme, page 1
UNIVERSITY OF CAMBRIDGE INTERNATIONAL EXAMINATIONS International General Certificate of Secondary Education MARK SCHEME for the May/June 2011 question paper for the guidance of teachers 0654 CO-ORDINATED SCIENCES 0654/61 Paper 6 (Alternative to Practical), maximum raw mark 60 This mark scheme is published as an aid to teachers and candidates, to indicate the requirements of the examination. It shows the basis on which Examiners were instructed to award marks. It does not indicate the details of the discussions that took place at an Examiners’ meeting before marking began, which would have considered the acceptability of alternative answers. Mark schemes must be read in conjunction with the question papers and the report on the examination. • Cambridge will not enter into discussions or correspondence in connection with these mark schemes. Cambridge is publishing the mark schemes for the May/June 2011 question papers for most IGCSE, GCE Advanced Level and Advanced Subsidiary Level syllabuses and some Ordinary Level syllabuses. www.XtremePapers.com
Mark scheme, page 2
Page 2 Mark Scheme: Teachers’ version Syllabus Paper IGCSE – May/June 2011 0654 61 © University of Cambridge International Examinations 2011 1 (a) (i) 93, 86, 31, 27 ;; (all 4 correct = 2 marks, 3 correct = 1 mark) [2] (ii) yes, similar repeats OR no, repeats too different ; [1] (iii) 1 mark for a correct mean formula (e.g. 93 + 86/2) ; 89.5 ; 29 ; [3] (iv) inhaled air longer time (than exhaled) ; inhaled has more oxygen ; [2] (v) (B cloudy (A not)) higher CO2 ; from respiration ; [2] [Total: 10] 2 (a) (i) 0.2, 0.3, 0.4 (all 3 = 1 mark) ; [1] (ii) 50, 68 (both required) ; [1] (iii) labelled axes and sensible scales ; correct points ; straight line through origin ; [3] (iv) proportional / linear ; (due to) straight line (graph) ; [2] (v) from graph (42 mm)+/- 1 ; clear indication on graph ; [2] (b) ; [1] [Total: 10]
Mark scheme, page 3
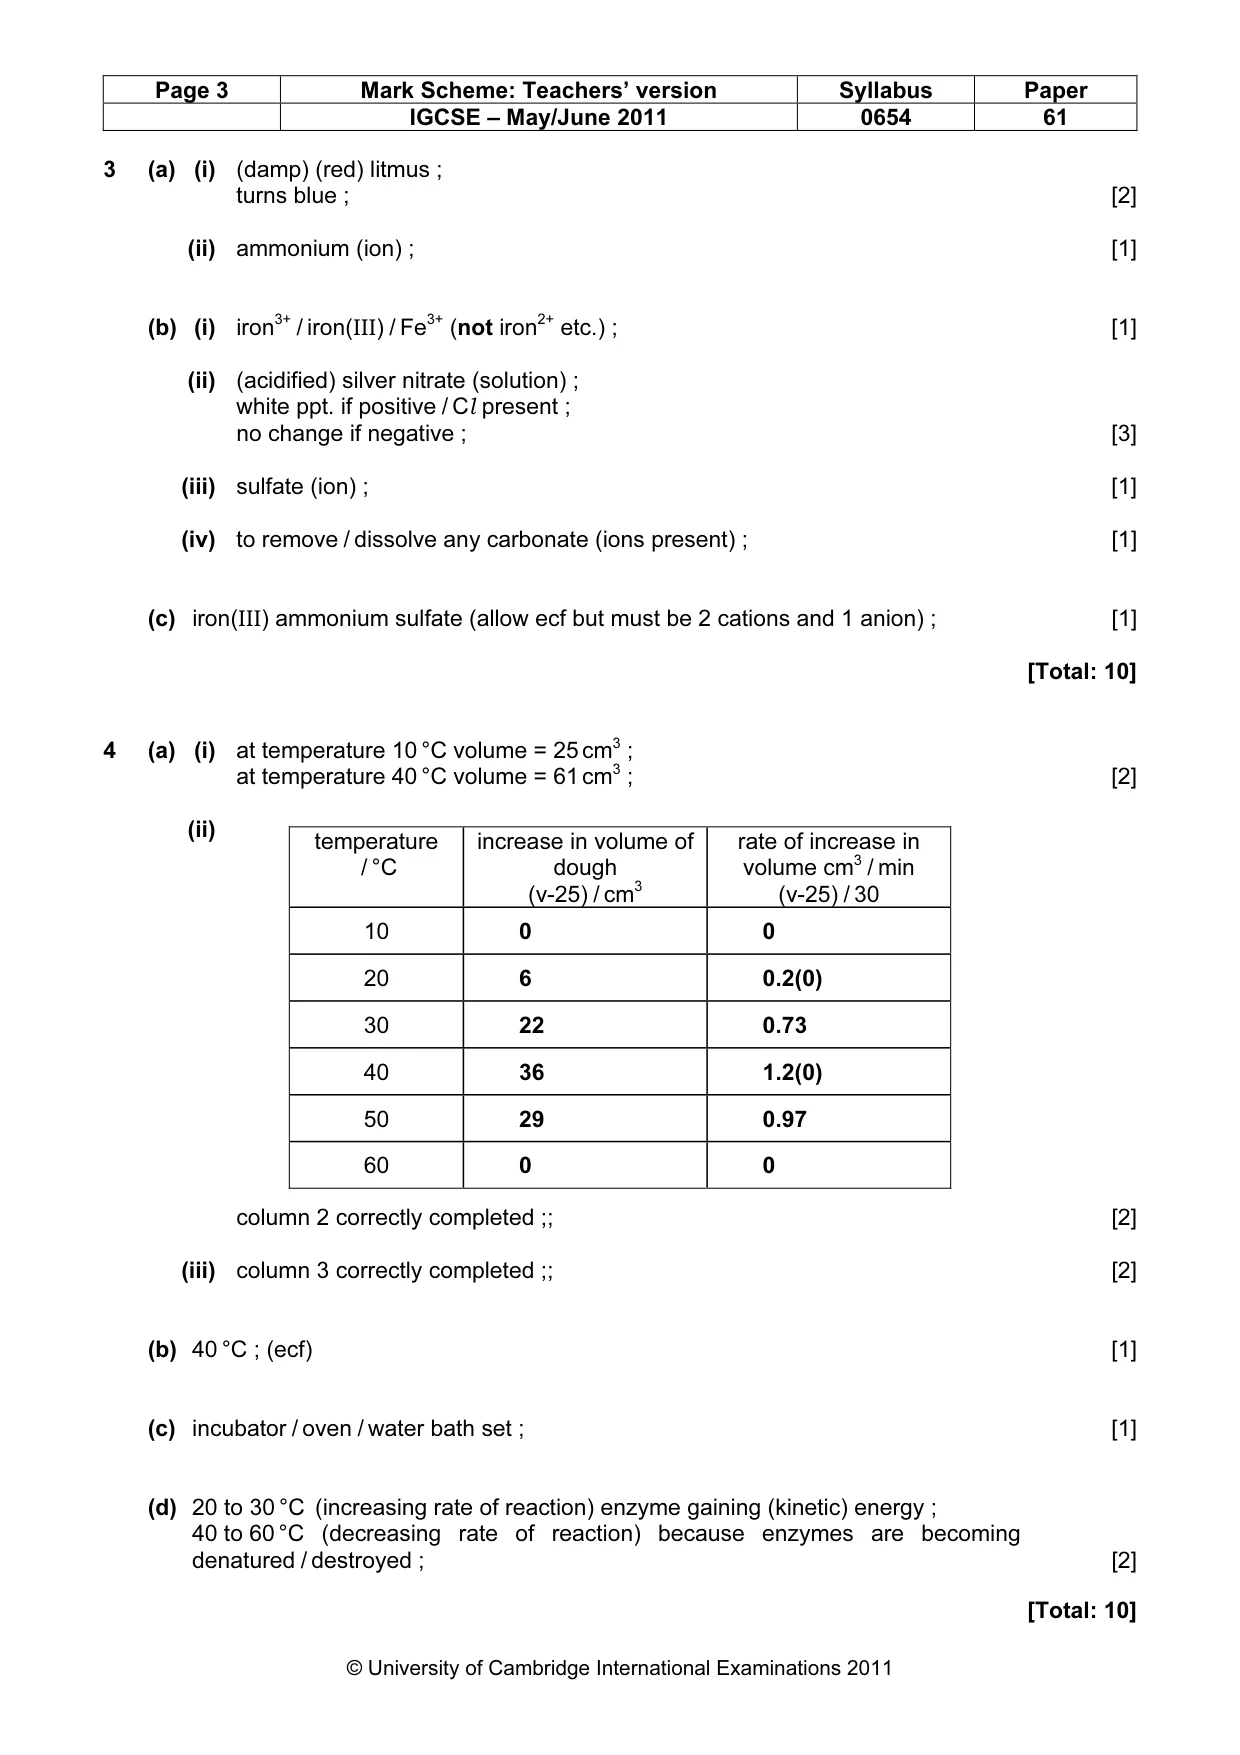
Page 3 Mark Scheme: Teachers’ version Syllabus Paper IGCSE – May/June 2011 0654 61 © University of Cambridge International Examinations 2011 3 (a) (i) (damp) (red) litmus ; turns blue ; [2] (ii) ammonium (ion) ; [1] (b) (i) iron3+ / iron(III) / Fe3+ (not iron2+ etc.) ; [1] (ii) (acidified) silver nitrate (solution) ; white ppt. if positive / Cl present ; no change if negative ; [3] (iii) sulfate (ion) ; [1] (iv) to remove / dissolve any carbonate (ions present) ; [1] (c) iron(III) ammonium sulfate (allow ecf but must be 2 cations and 1 anion) ; [1] [Total: 10] 4 (a) (i) at temperature 10 °C volume = 25 cm3 ; at temperature 40 °C volume = 61 cm3 ; [2] (ii) column 2 correctly completed ;; [2] (iii) column 3 correctly completed ;; [2] (b) 40 °C ; (ecf) [1] (c) incubator / oven / water bath set ; [1] (d) 20 to 30 °C (increasing rate of reaction) enzyme gaining (kinetic) energy ; 40 to 60 °C (decreasing rate of reaction) because enzymes are becoming denatured / destroyed ; [2] [Total: 10] temperature / °C increase in volume of dough (v-25) / cm3 rate of increase in volume cm3 / min (v-25) / 30 10 0 0 20 6 0.2(0) 30 22 0.73 40 36 1.2(0) 50 29 0.97 60 0 0
Mark scheme, page 4
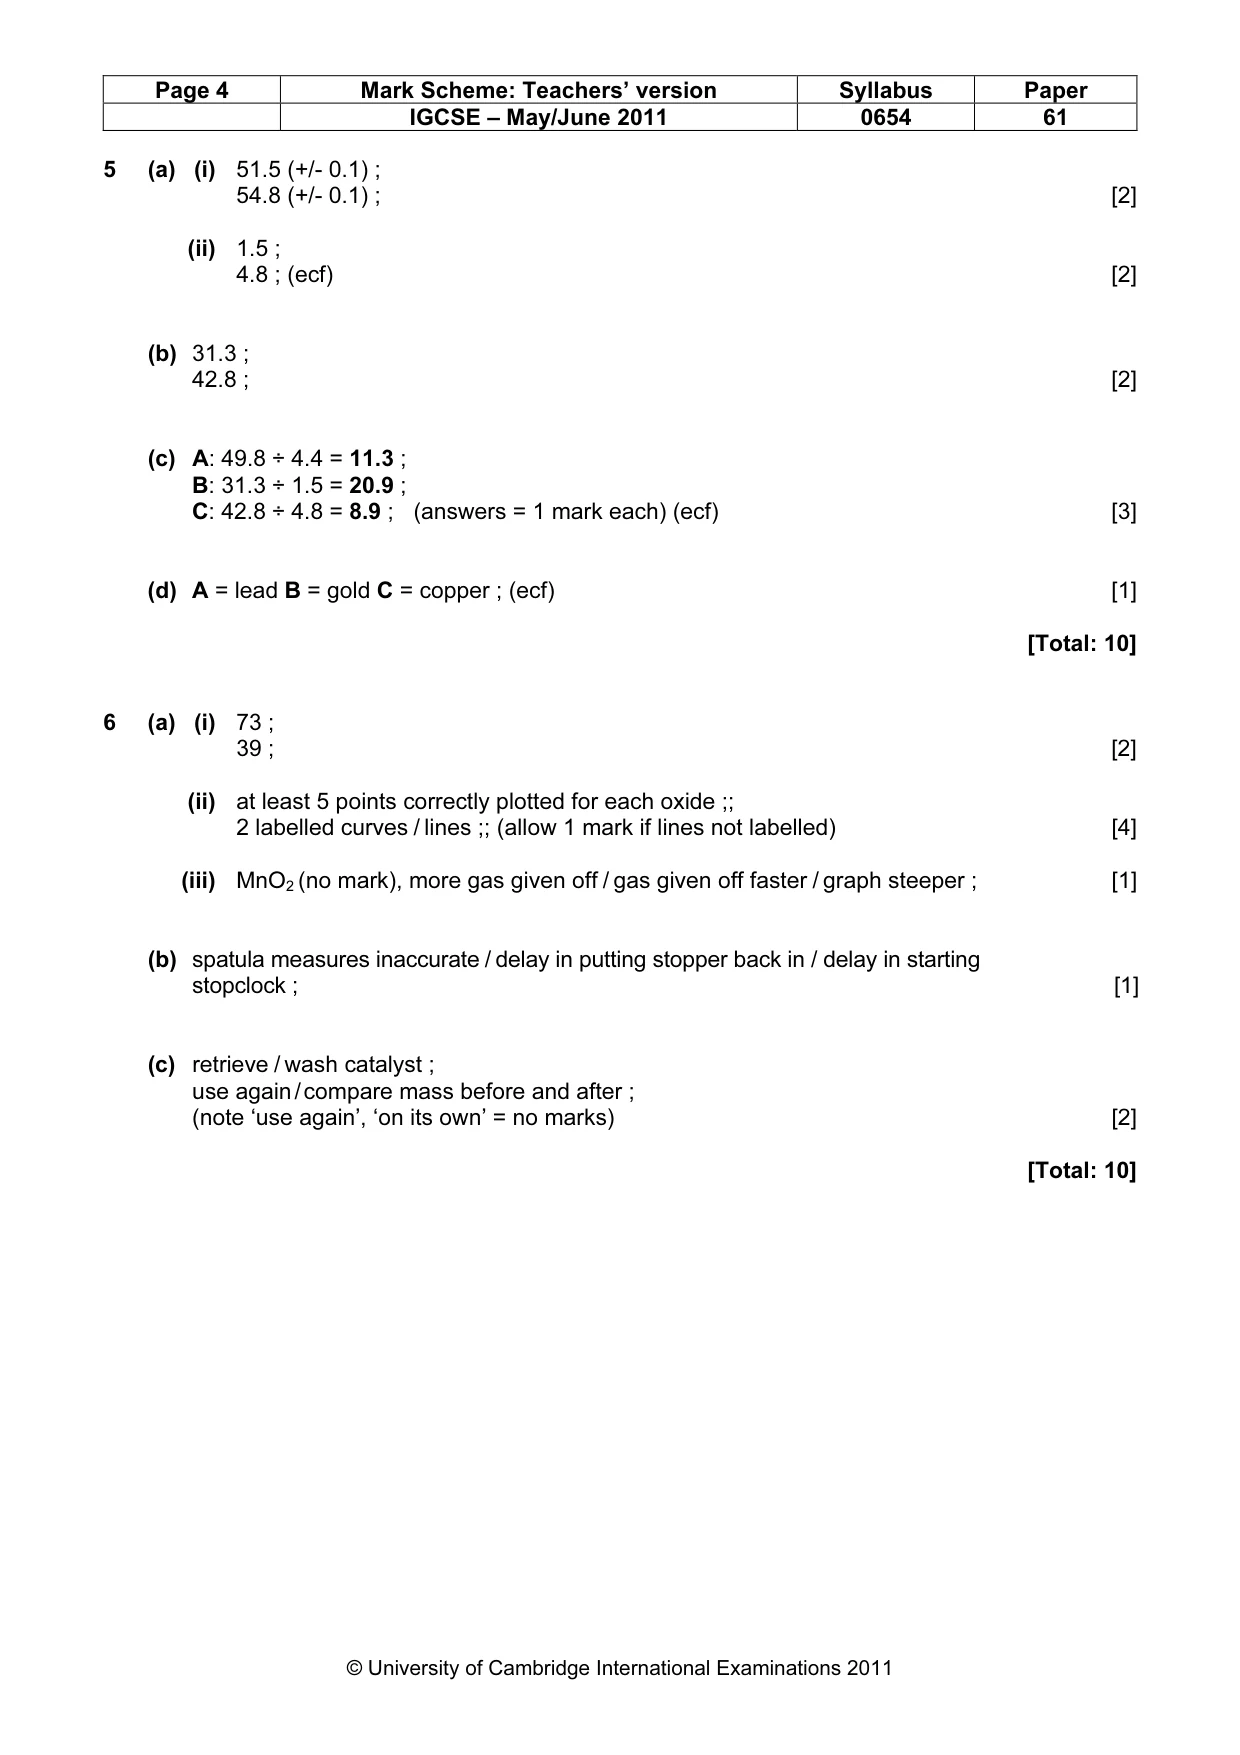
Page 4 Mark Scheme: Teachers’ version Syllabus Paper IGCSE – May/June 2011 0654 61 © University of Cambridge International Examinations 2011 5 (a) (i) 51.5 (+/- 0.1) ; 54.8 (+/- 0.1) ; [2] (ii) 1.5 ; 4.8 ; (ecf) [2] (b) 31.3 ; 42.8 ; [2] (c) A: 49.8 ÷ 4.4 = 11.3 ; B: 31.3 ÷ 1.5 = 20.9 ; C: 42.8 ÷ 4.8 = 8.9 ; (answers = 1 mark each) (ecf) [3] (d) A = lead B = gold C = copper ; (ecf) [1] [Total: 10] 6 (a) (i) 73 ; 39 ; [2] (ii) at least 5 points correctly plotted for each oxide ;; 2 labelled curves / lines ;; (allow 1 mark if lines not labelled) [4] (iii) MnO2 (no mark), more gas given off / gas given off faster / graph steeper ; [1] (b) spatula measures inaccurate / delay in putting stopper back in / delay in starting stopclock ; [1] (c) retrieve / wash catalyst ; use again / compare mass before and after ; (note ‘use again’, ‘on its own’ = no marks) [2] [Total: 10]
What you needed in this session
Cambridge’s own grade thresholds for 2011 May/June, Paper 6 · Variant 1. A higher threshold means an easier paper — the bar moves with how the cohort did.