Cambridge IGCSE Sciences - Co-ordinated (Double) 0654 — 2010 Oct/Nov Paper 5 · Variant 3
0654/53/O/N/10 · 45 marks · ≈51 min
The question paper and its mark scheme, free to read here and free to download. This is Cambridge’s own paper, exactly as it was sat.
Question paper16 pages



Mark scheme
No mark scheme is in the library for this paper.
Paper as text
Question paper, page 1
This document consists of 13 printed pages and 3 blank pages. IB10 11_0654_53/7RP © UCLES 2010 [Turn over *3360809502* For Examiner's Use 1 2 3 Total UNIVERSITY OF CAMBRIDGE INTERNATIONAL EXAMINATIONS International General Certificate of Secondary Education CO-ORDINATED SCIENCES 0654/53 Paper 5 Practical Test October/November 2010 2 hours Candidates answer on the Question Paper. Additional Materials: As listed in Instructions to Supervisors READ THESE INSTRUCTIONS FIRST Write your Centre number, candidate number and name on all the work you hand in. Write in dark blue or black pen. You may use a pencil for any diagrams, graphs or rough working. Do not use staples, paper clips, highlighters, glue or correction fluid. DO NOT WRITE IN ANY BARCODES. Answer all questions. Chemistry practical notes for this paper are printed on page 16. At the end of the examination, fasten all your work securely together. The number of marks is given in brackets [ ] at the end of each question or part question. www.XtremePapers.com
Question paper, page 2
2 © UCLES 2010 0654/53/O/N/10 BLANK PAGE
Question paper, page 3
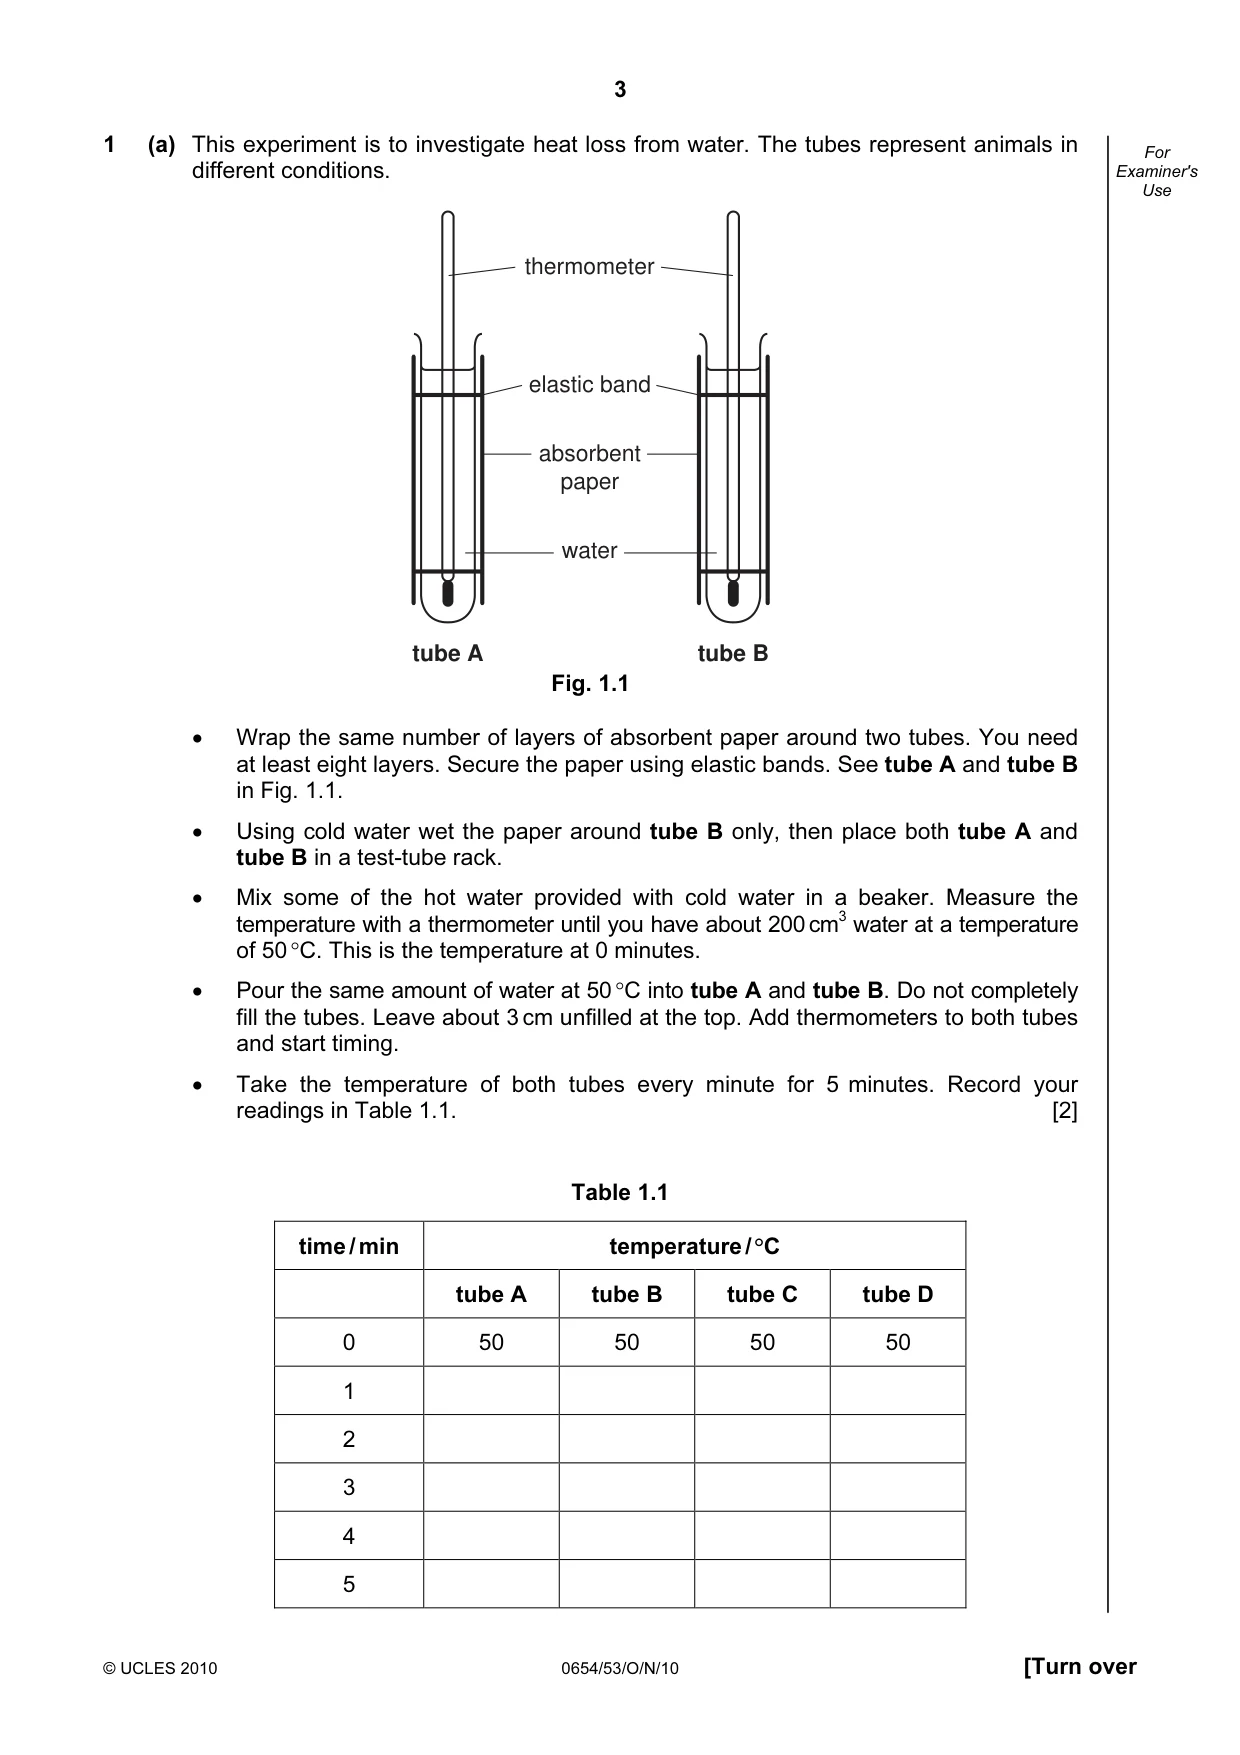
3 © UCLES 2010 0654/53/O/N/10 [Turn over For Examiner's Use 1 (a) This experiment is to investigate heat loss from water. The tubes represent animals in different conditions. tube A tube B thermometer elastic band absorbent paper water Fig. 1.1 • Wrap the same number of layers of absorbent paper around two tubes. You need at least eight layers. Secure the paper using elastic bands. See tube A and tube B in Fig. 1.1. • Using cold water wet the paper around tube B only, then place both tube A and tube B in a test-tube rack. • Mix some of the hot water provided with cold water in a beaker. Measure the temperature with a thermometer until you have about 200 cm3 water at a temperature of 50 °C. This is the temperature at 0 minutes. • Pour the same amount of water at 50 °C into tube A and tube B. Do not completely fill the tubes. Leave about 3 cm unfilled at the top. Add thermometers to both tubes and start timing. • Take the temperature of both tubes every minute for 5 minutes. Record your readings in Table 1.1. [2] Table 1.1 time / min temperature / °C tube A tube B tube C tube D 0 50 50 50 50 1 2 3 4 5
Question paper, page 4
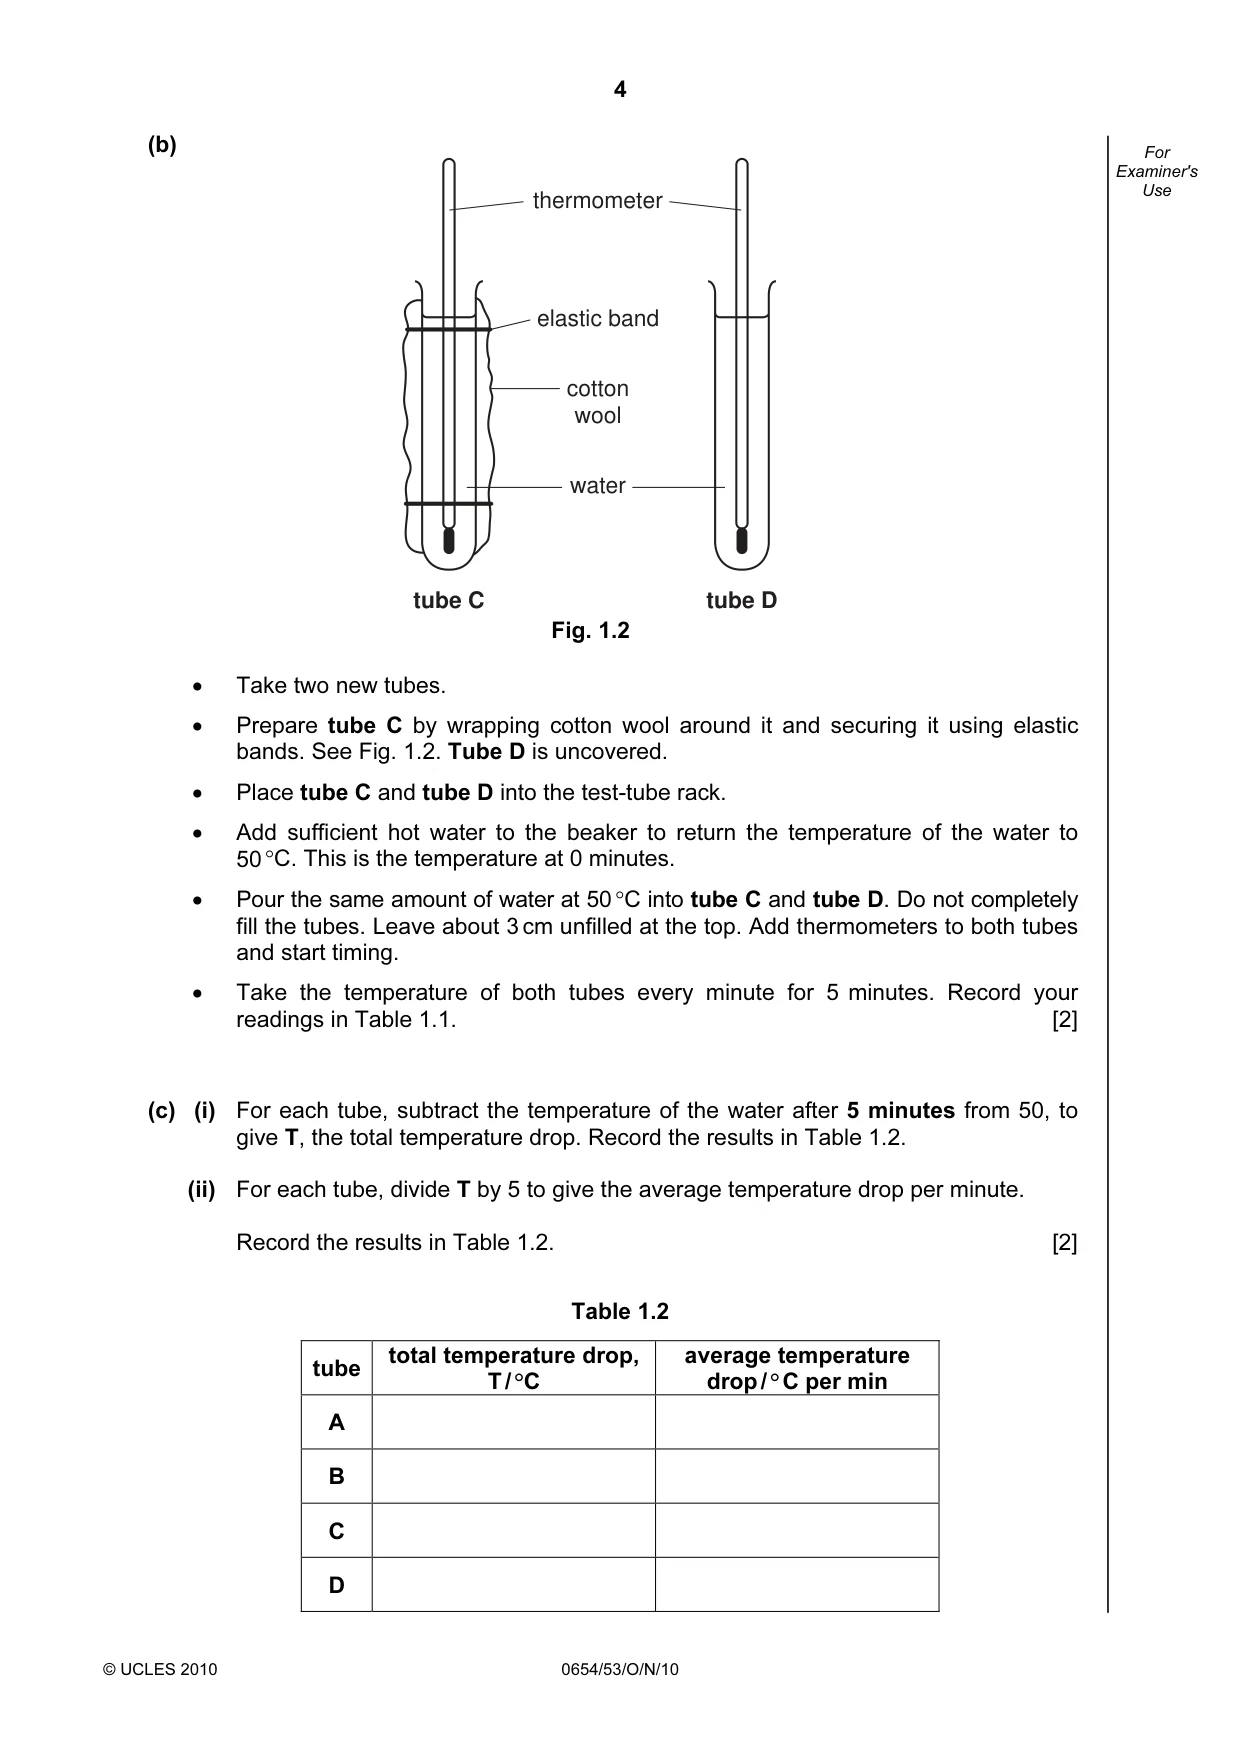
4 © UCLES 2010 0654/53/O/N/10 For Examiner's Use (b) tube C tube D thermometer elastic band cotton wool water Fig. 1.2 • Take two new tubes. • Prepare tube C by wrapping cotton wool around it and securing it using elastic bands. See Fig. 1.2. Tube D is uncovered. • Place tube C and tube D into the test-tube rack. • Add sufficient hot water to the beaker to return the temperature of the water to 50 °C. This is the temperature at 0 minutes. • Pour the same amount of water at 50 °C into tube C and tube D. Do not completely fill the tubes. Leave about 3 cm unfilled at the top. Add thermometers to both tubes and start timing. • Take the temperature of both tubes every minute for 5 minutes. Record your readings in Table 1.1. [2] (c) (i) For each tube, subtract the temperature of the water after 5 minutes from 50, to give T, the total temperature drop. Record the results in Table 1.2. (ii) For each tube, divide T by 5 to give the average temperature drop per minute. Record the results in Table 1.2. [2] Table 1.2 tube total temperature drop, T / °C average temperature drop / ° C per min A B C D
Question paper, page 5
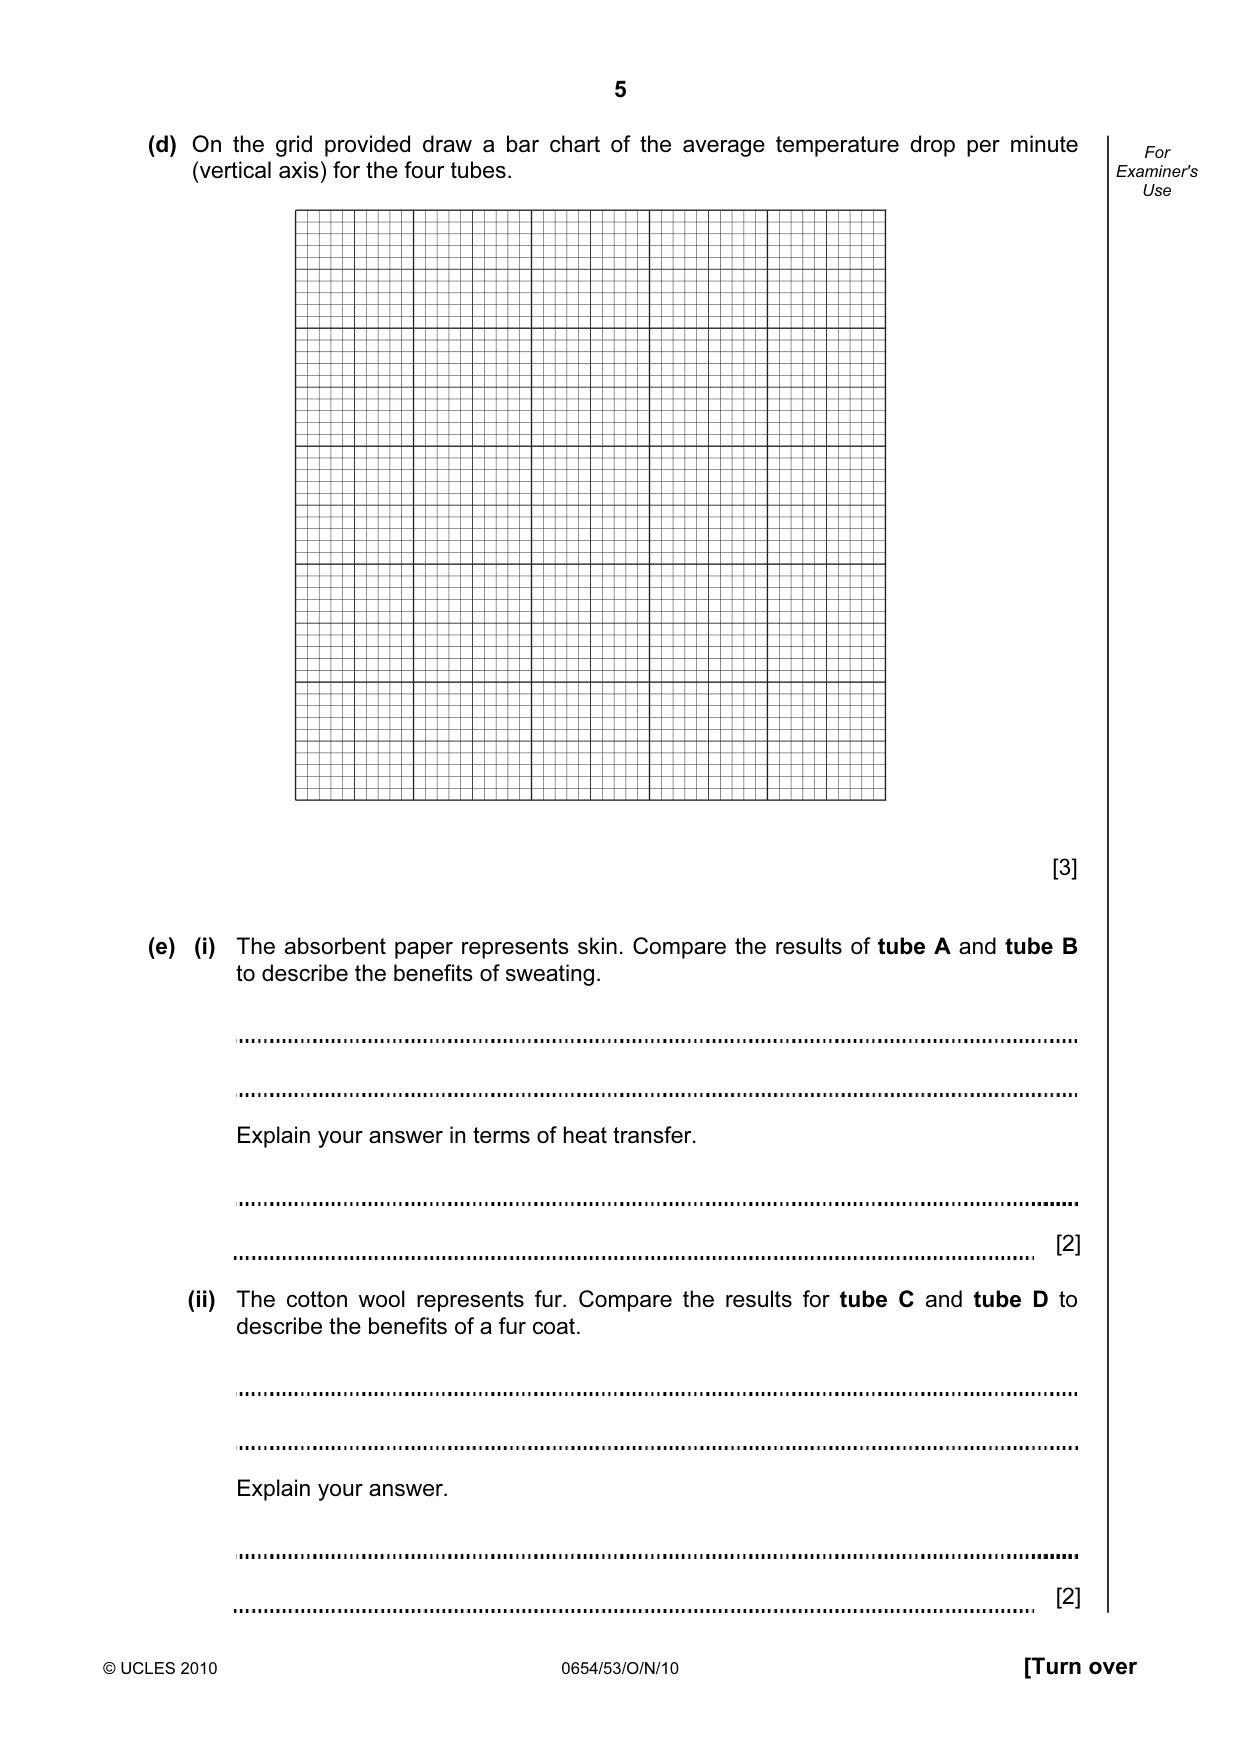
5 © UCLES 2010 0654/53/O/N/10 [Turn over For Examiner's Use (d) On the grid provided draw a bar chart of the average temperature drop per minute (vertical axis) for the four tubes. [3] (e) (i) The absorbent paper represents skin. Compare the results of tube A and tube B to describe the benefits of sweating. Explain your answer in terms of heat transfer. [2] (ii) The cotton wool represents fur. Compare the results for tube C and tube D to describe the benefits of a fur coat. Explain your answer. [2]
Question paper, page 6
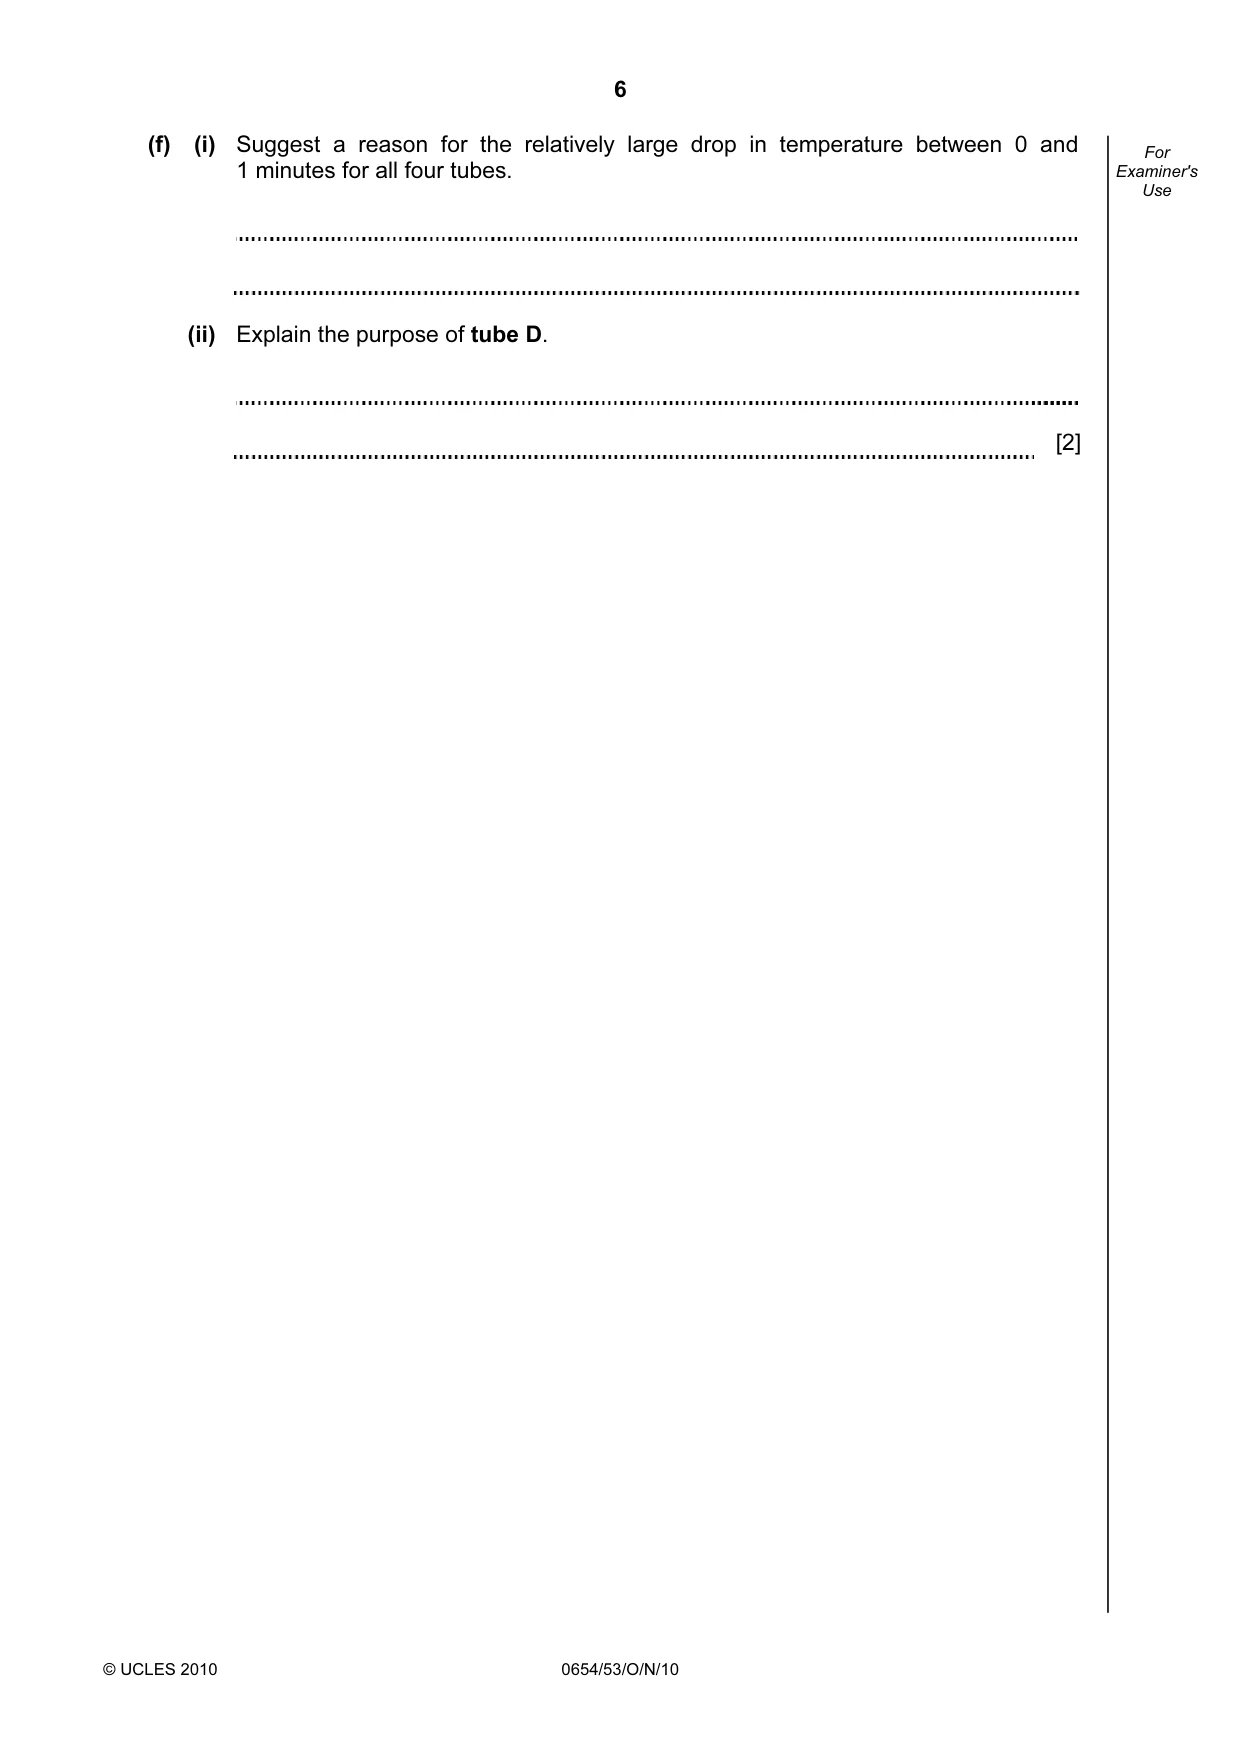
6 © UCLES 2010 0654/53/O/N/10 For Examiner's Use (f) (i) Suggest a reason for the relatively large drop in temperature between 0 and 1 minutes for all four tubes. (ii) Explain the purpose of tube D. [2]
Question paper, page 7
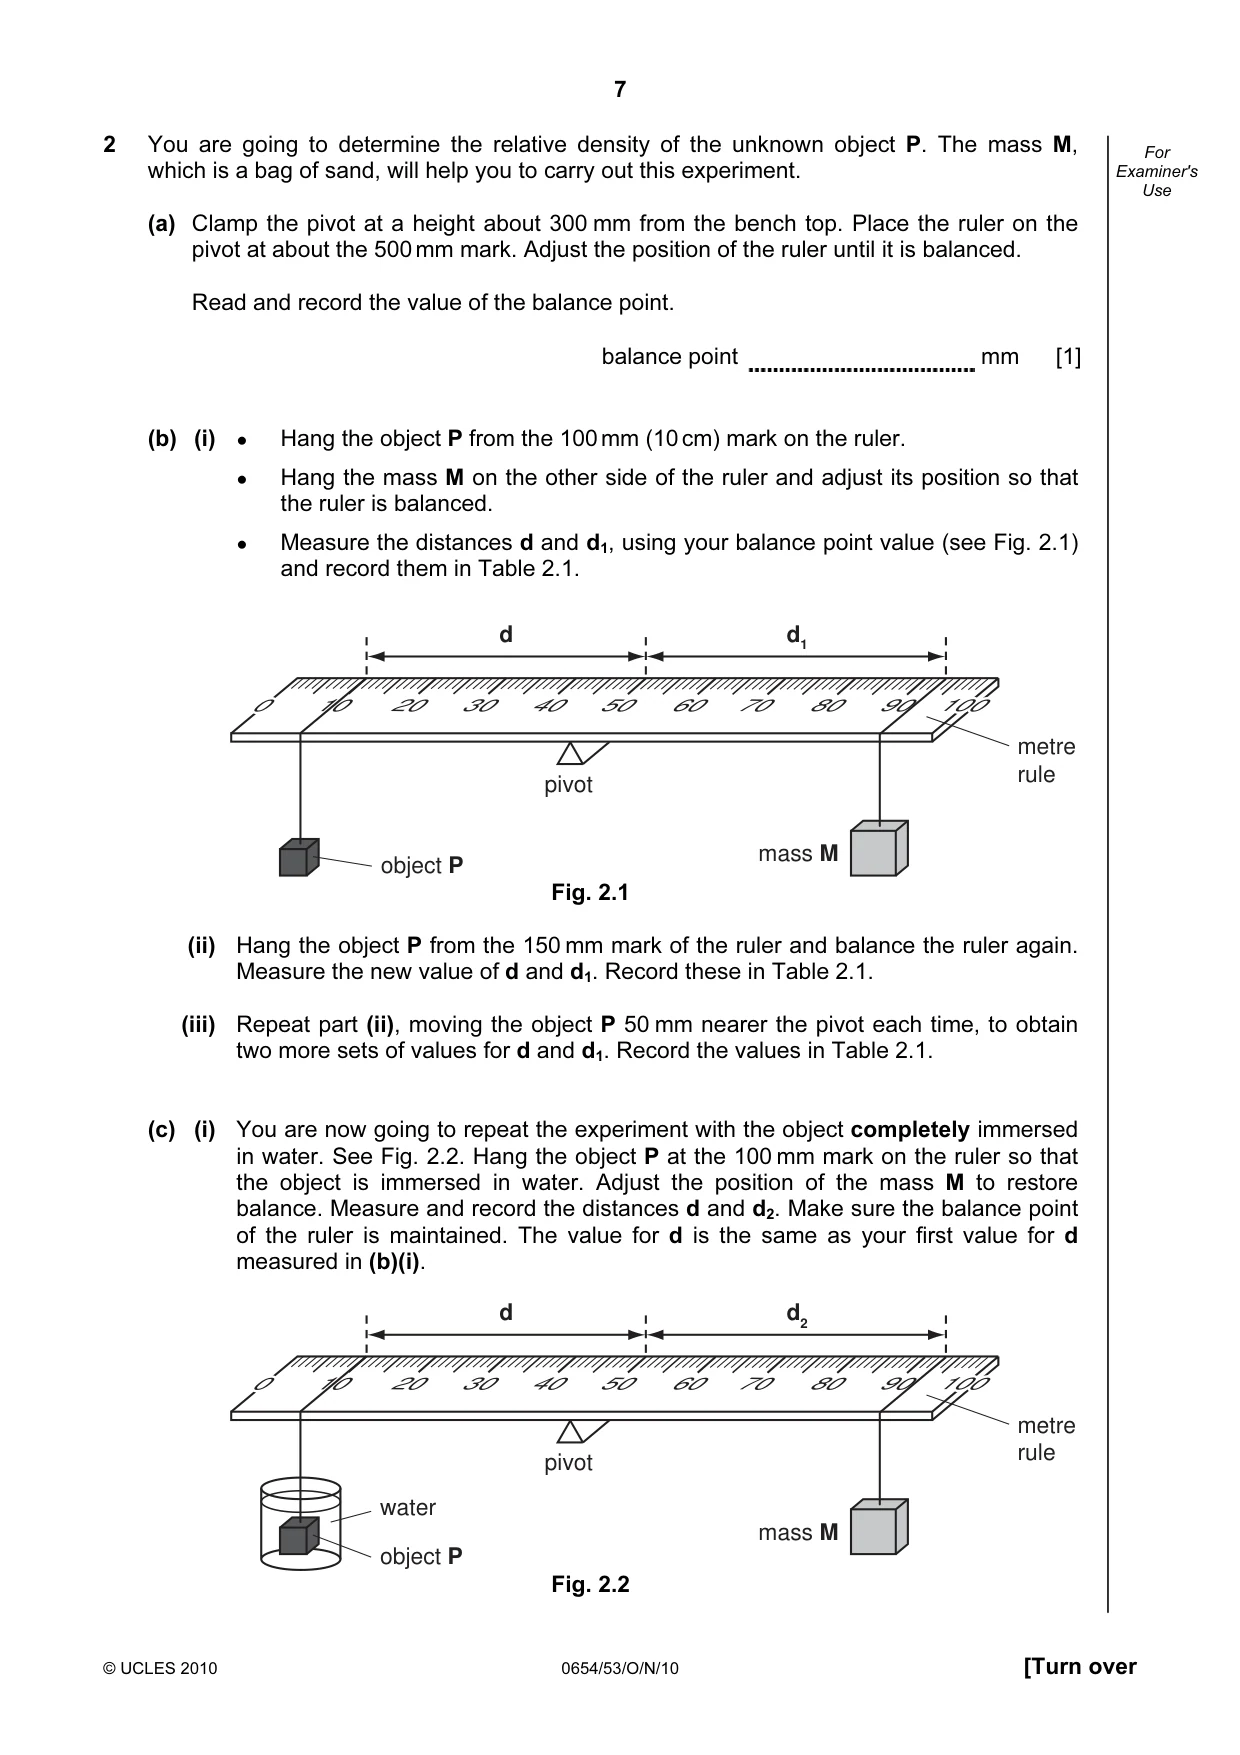
7 © UCLES 2010 0654/53/O/N/10 [Turn over For Examiner's Use 2 You are going to determine the relative density of the unknown object P. The mass M, which is a bag of sand, will help you to carry out this experiment. (a) Clamp the pivot at a height about 300 mm from the bench top. Place the ruler on the pivot at about the 500 mm mark. Adjust the position of the ruler until it is balanced. Read and record the value of the balance point. balance point mm [1] (b) (i) ● Hang the object P from the 100 mm (10 cm) mark on the ruler. ● Hang the mass M on the other side of the ruler and adjust its position so that the ruler is balanced. ● Measure the distances d and d1, using your balance point value (see Fig. 2.1) and record them in Table 2.1. 100 100 0 10 20 30 40 50 60 70 80 90 100 0 d d1 pivot metre rule object P mass M Fig. 2.1 (ii) Hang the object P from the 150 mm mark of the ruler and balance the ruler again. Measure the new value of d and d1. Record these in Table 2.1. (iii) Repeat part (ii), moving the object P 50 mm nearer the pivot each time, to obtain two more sets of values for d and d1. Record the values in Table 2.1. (c) (i) You are now going to repeat the experiment with the object completely immersed in water. See Fig. 2.2. Hang the object P at the 100 mm mark on the ruler so that the object is immersed in water. Adjust the position of the mass M to restore balance. Measure and record the distances d and d2. Make sure the balance point of the ruler is maintained. The value for d is the same as your first value for d measured in (b)(i). 100 100 0 10 20 30 40 50 60 70 80 90 100 0 d d2 pivot metre rule object P mass M water Fig. 2.2
Question paper, page 8
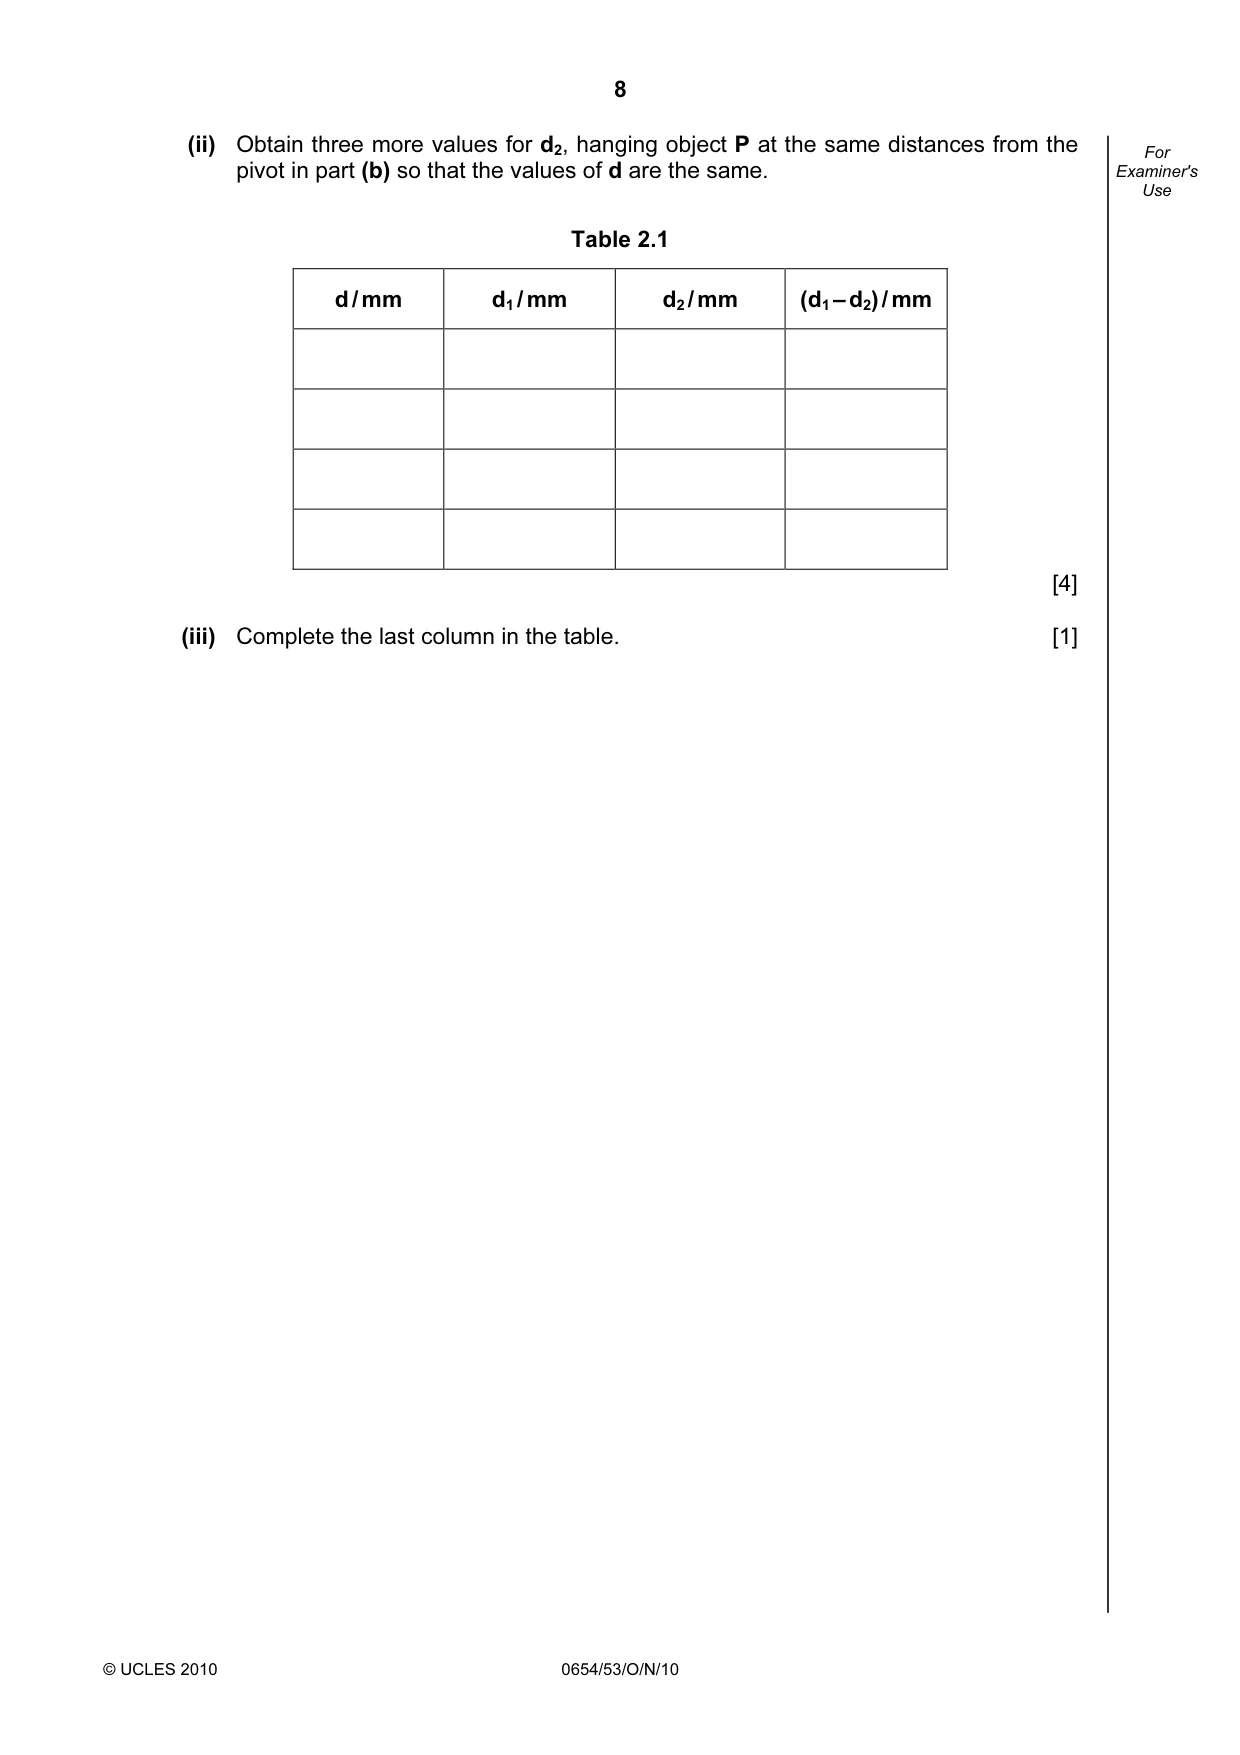
8 © UCLES 2010 0654/53/O/N/10 For Examiner's Use (ii) Obtain three more values for d2, hanging object P at the same distances from the pivot in part (b) so that the values of d are the same. Table 2.1 d / mm d1 / mm d2 / mm (d1 – d2) / mm [4] (iii) Complete the last column in the table. [1]
Question paper, page 9
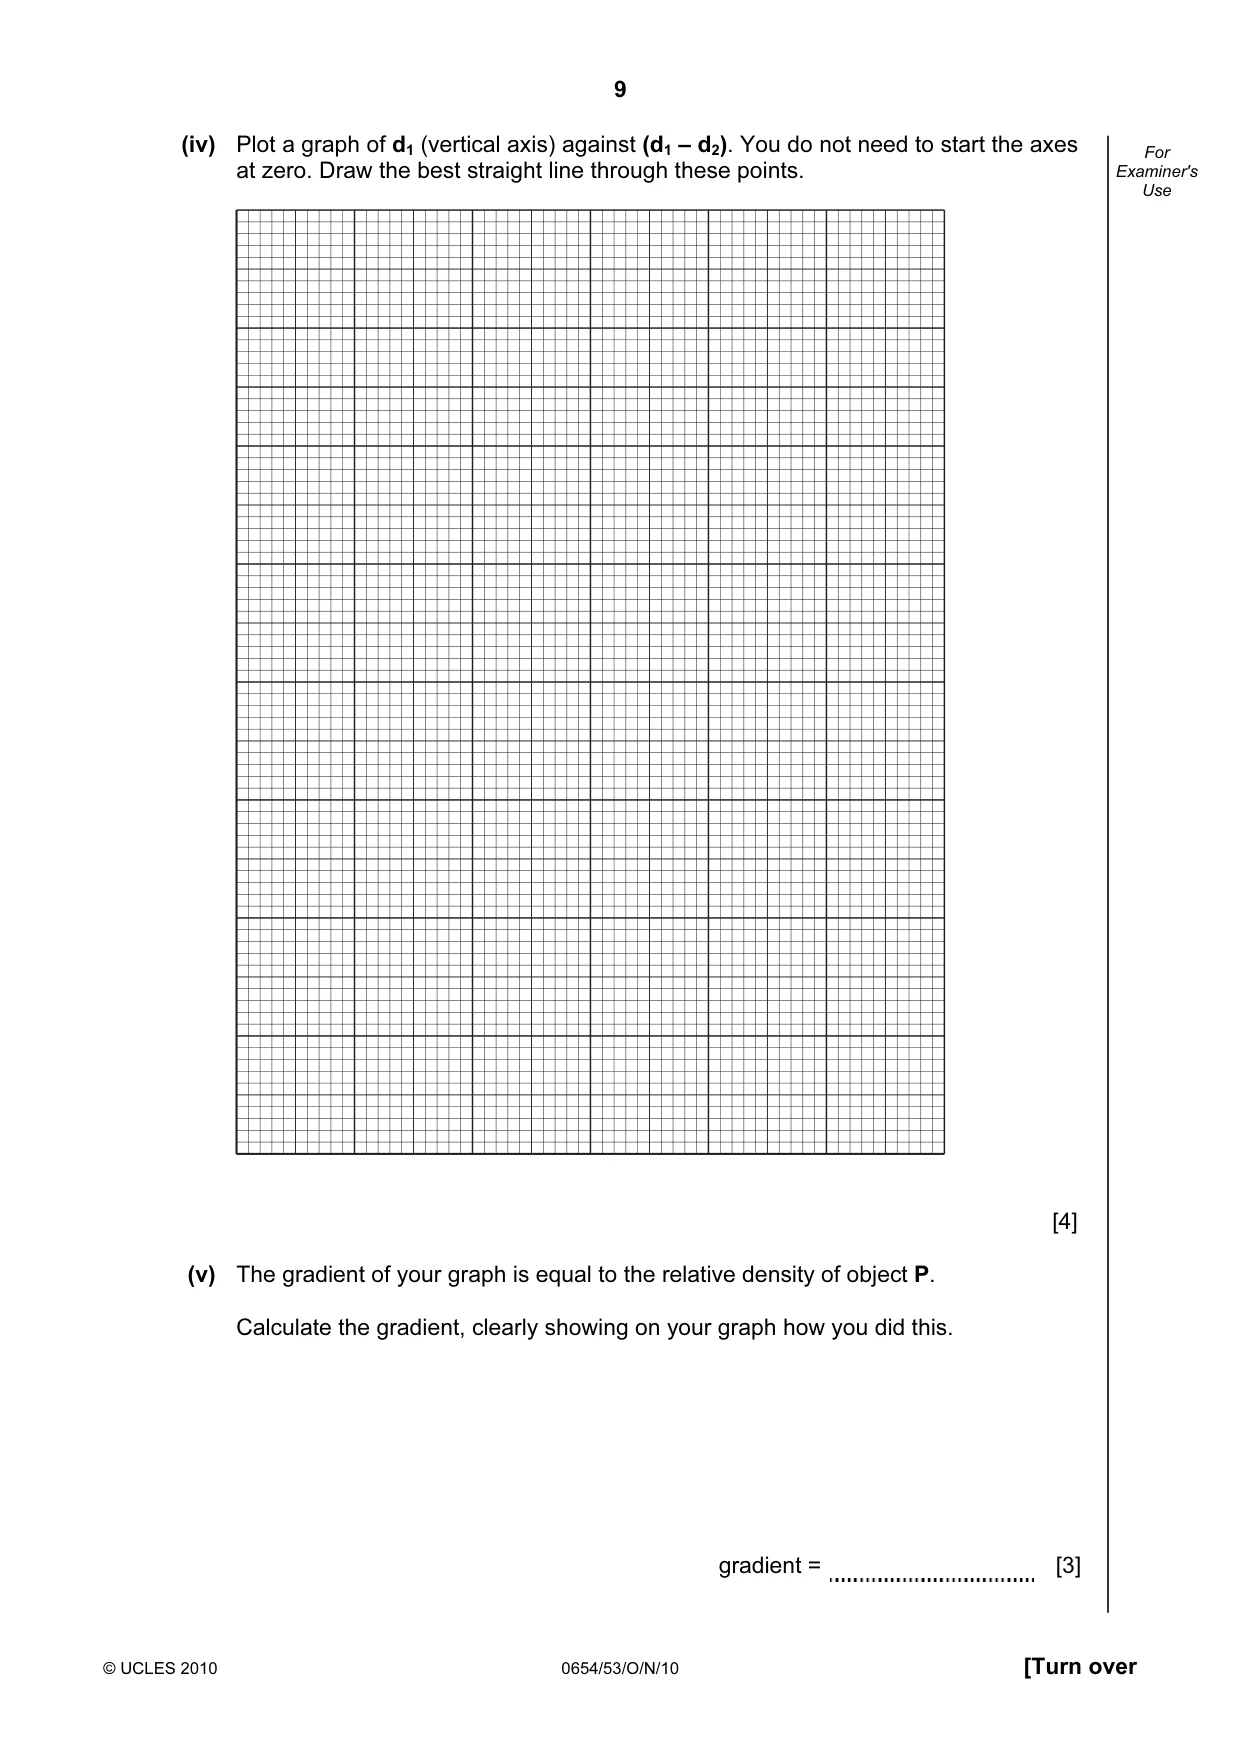
9 © UCLES 2010 0654/53/O/N/10 [Turn over For Examiner's Use (iv) Plot a graph of d1 (vertical axis) against (d1 – d2). You do not need to start the axes at zero. Draw the best straight line through these points. [4] (v) The gradient of your graph is equal to the relative density of object P. Calculate the gradient, clearly showing on your graph how you did this. gradient = [3]
Question paper, page 10
10 © UCLES 2010 0654/53/O/N/10 For Examiner's Use (d) The density is mass per unit volume and there is an easier method for finding the density of object P than the experiment carried out. Briefly describe such a method. [2]
Question paper, page 11
11 © UCLES 2010 0654/53/O/N/10 [Turn over BLANK PAGE Please turn over for Question 3.
Question paper, page 12
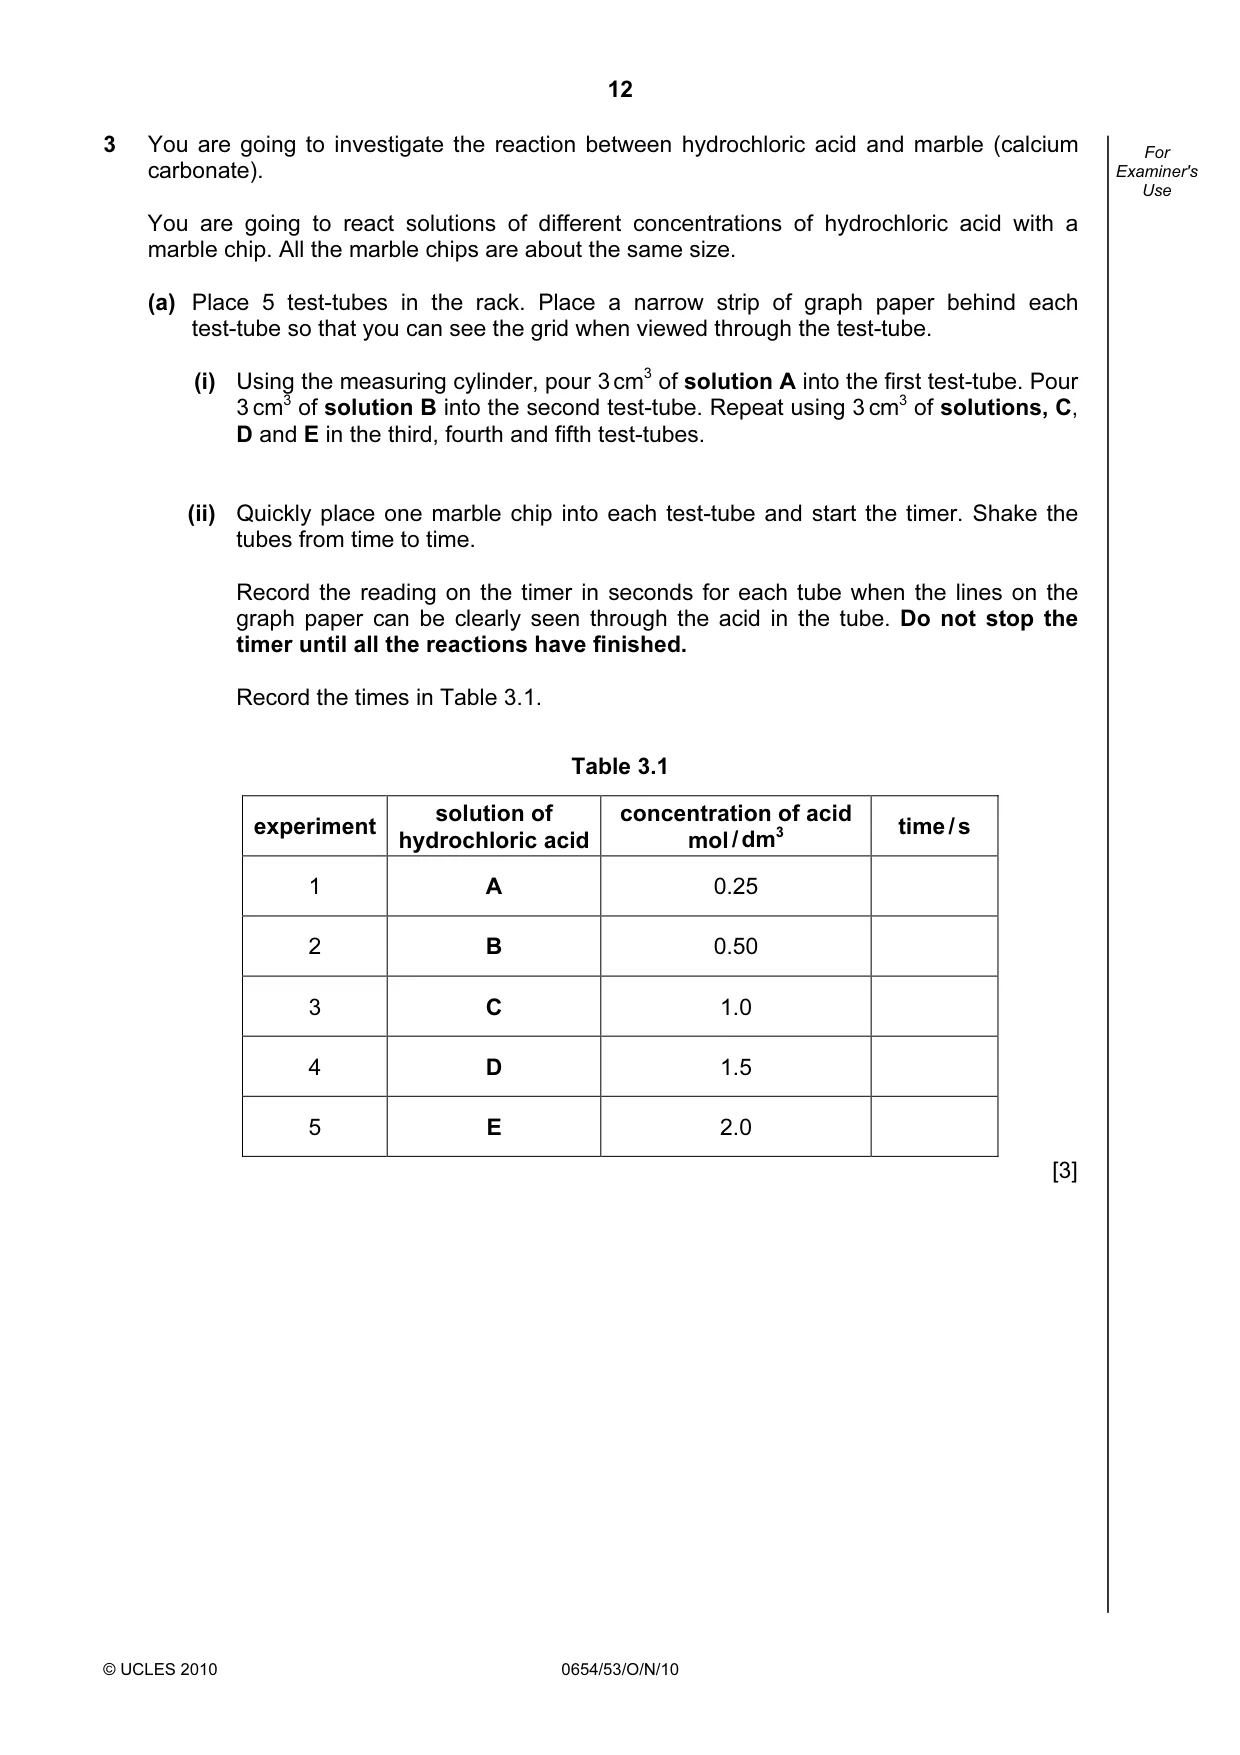
12 © UCLES 2010 0654/53/O/N/10 For Examiner's Use 3 You are going to investigate the reaction between hydrochloric acid and marble (calcium carbonate). You are going to react solutions of different concentrations of hydrochloric acid with a marble chip. All the marble chips are about the same size. (a) Place 5 test-tubes in the rack. Place a narrow strip of graph paper behind each test-tube so that you can see the grid when viewed through the test-tube. (i) Using the measuring cylinder, pour 3 cm3 of solution A into the first test-tube. Pour 3 cm3 of solution B into the second test-tube. Repeat using 3 cm3 of solutions, C, D and E in the third, fourth and fifth test-tubes. (ii) Quickly place one marble chip into each test-tube and start the timer. Shake the tubes from time to time. Record the reading on the timer in seconds for each tube when the lines on the graph paper can be clearly seen through the acid in the tube. Do not stop the timer until all the reactions have finished. Record the times in Table 3.1. Table 3.1 experiment solution of hydrochloric acid concentration of acid mol / dm3 time / s 1 A 0.25 2 B 0.50 3 C 1.0 4 D 1.5 5 E 2.0 [3]
Question paper, page 13
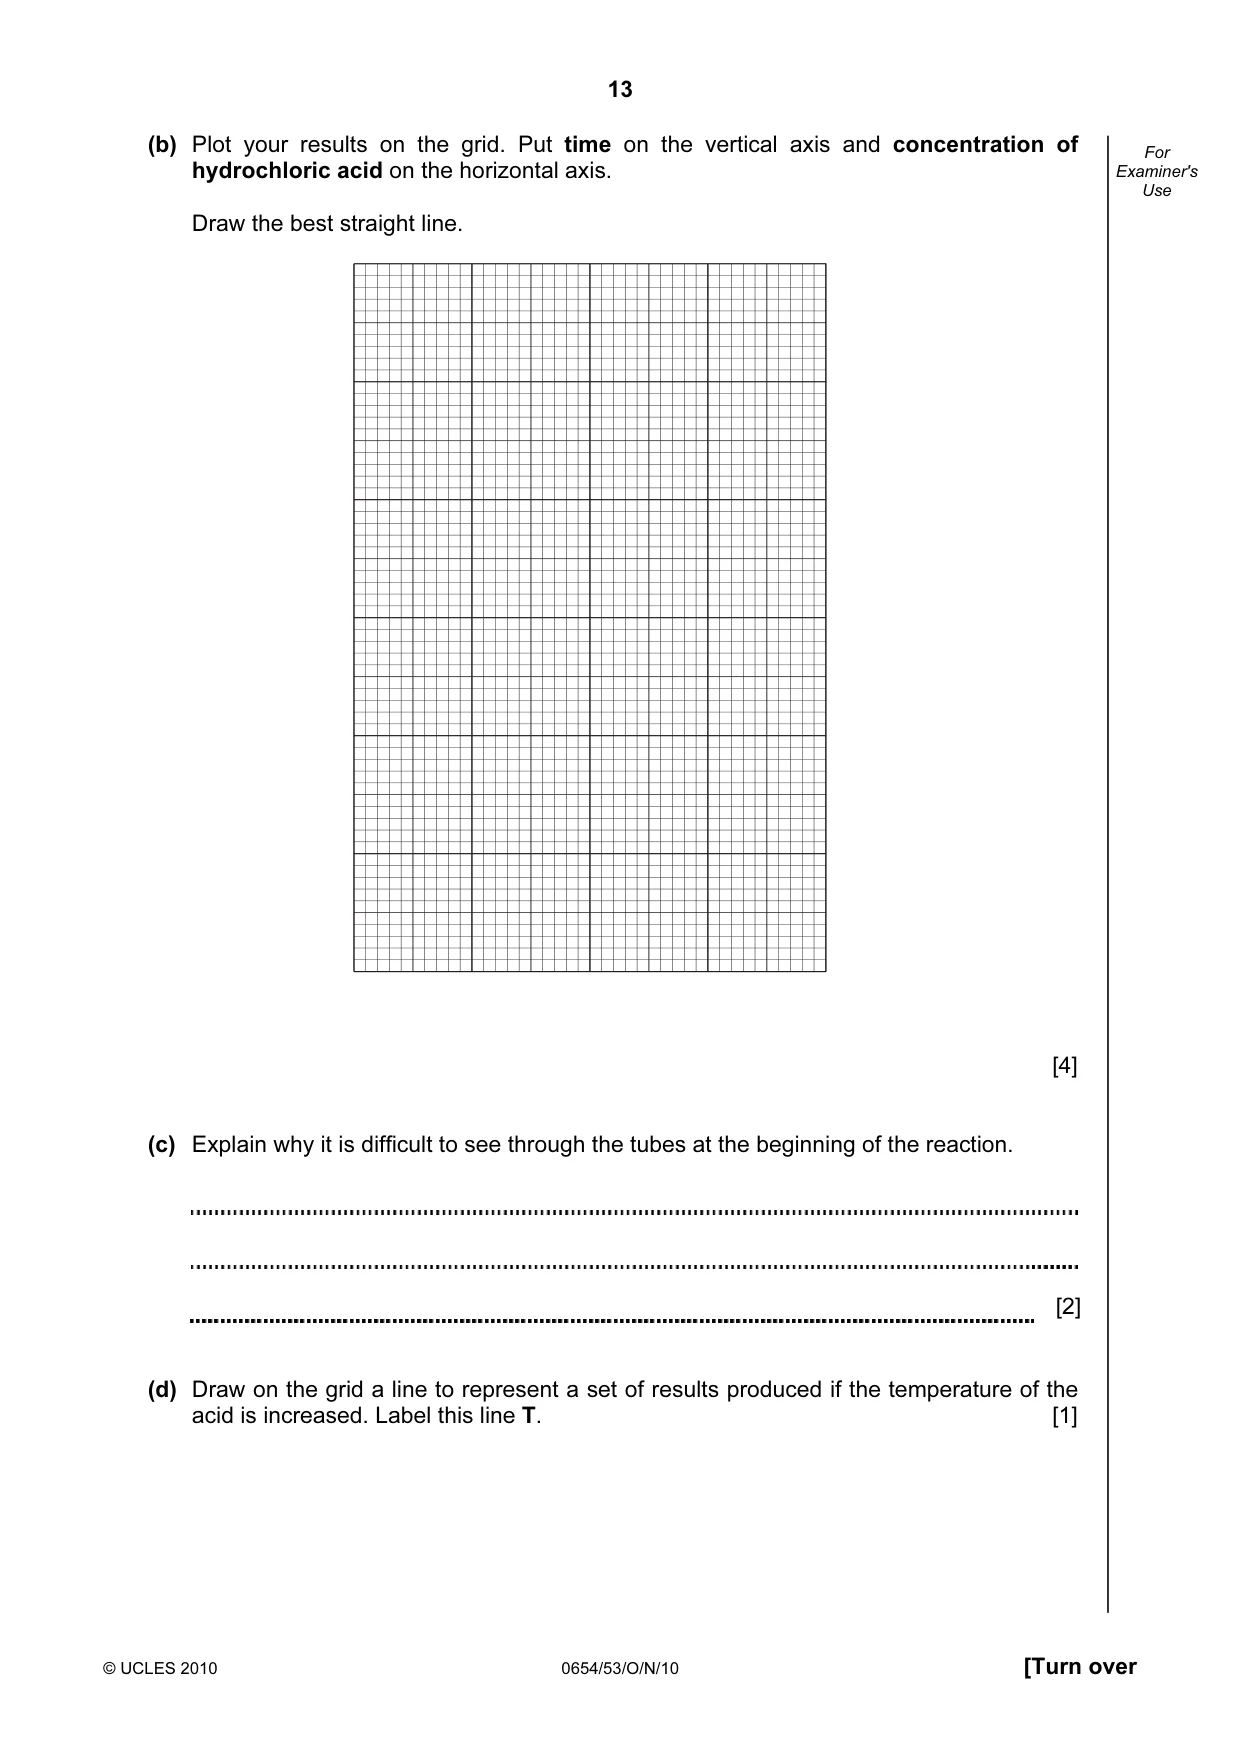
13 © UCLES 2010 0654/53/O/N/10 [Turn over For Examiner's Use (b) Plot your results on the grid. Put time on the vertical axis and concentration of hydrochloric acid on the horizontal axis. Draw the best straight line. [4] (c) Explain why it is difficult to see through the tubes at the beginning of the reaction. [2] (d) Draw on the grid a line to represent a set of results produced if the temperature of the acid is increased. Label this line T. [1]
Question paper, page 14
14 © UCLES 2010 0654/53/O/N/10 For Examiner's Use (e) Which of the reactants is in excess in these experiments? Explain your answer. [2] (f) State two sources of error in the experiments. 1 2 [2] (g) Suggest an improvement to reduce the source of one of the errors. [1]
Question paper, page 15
15 © UCLES 2010 0654/53/O/N/10 BLANK PAGE
Question paper, page 16
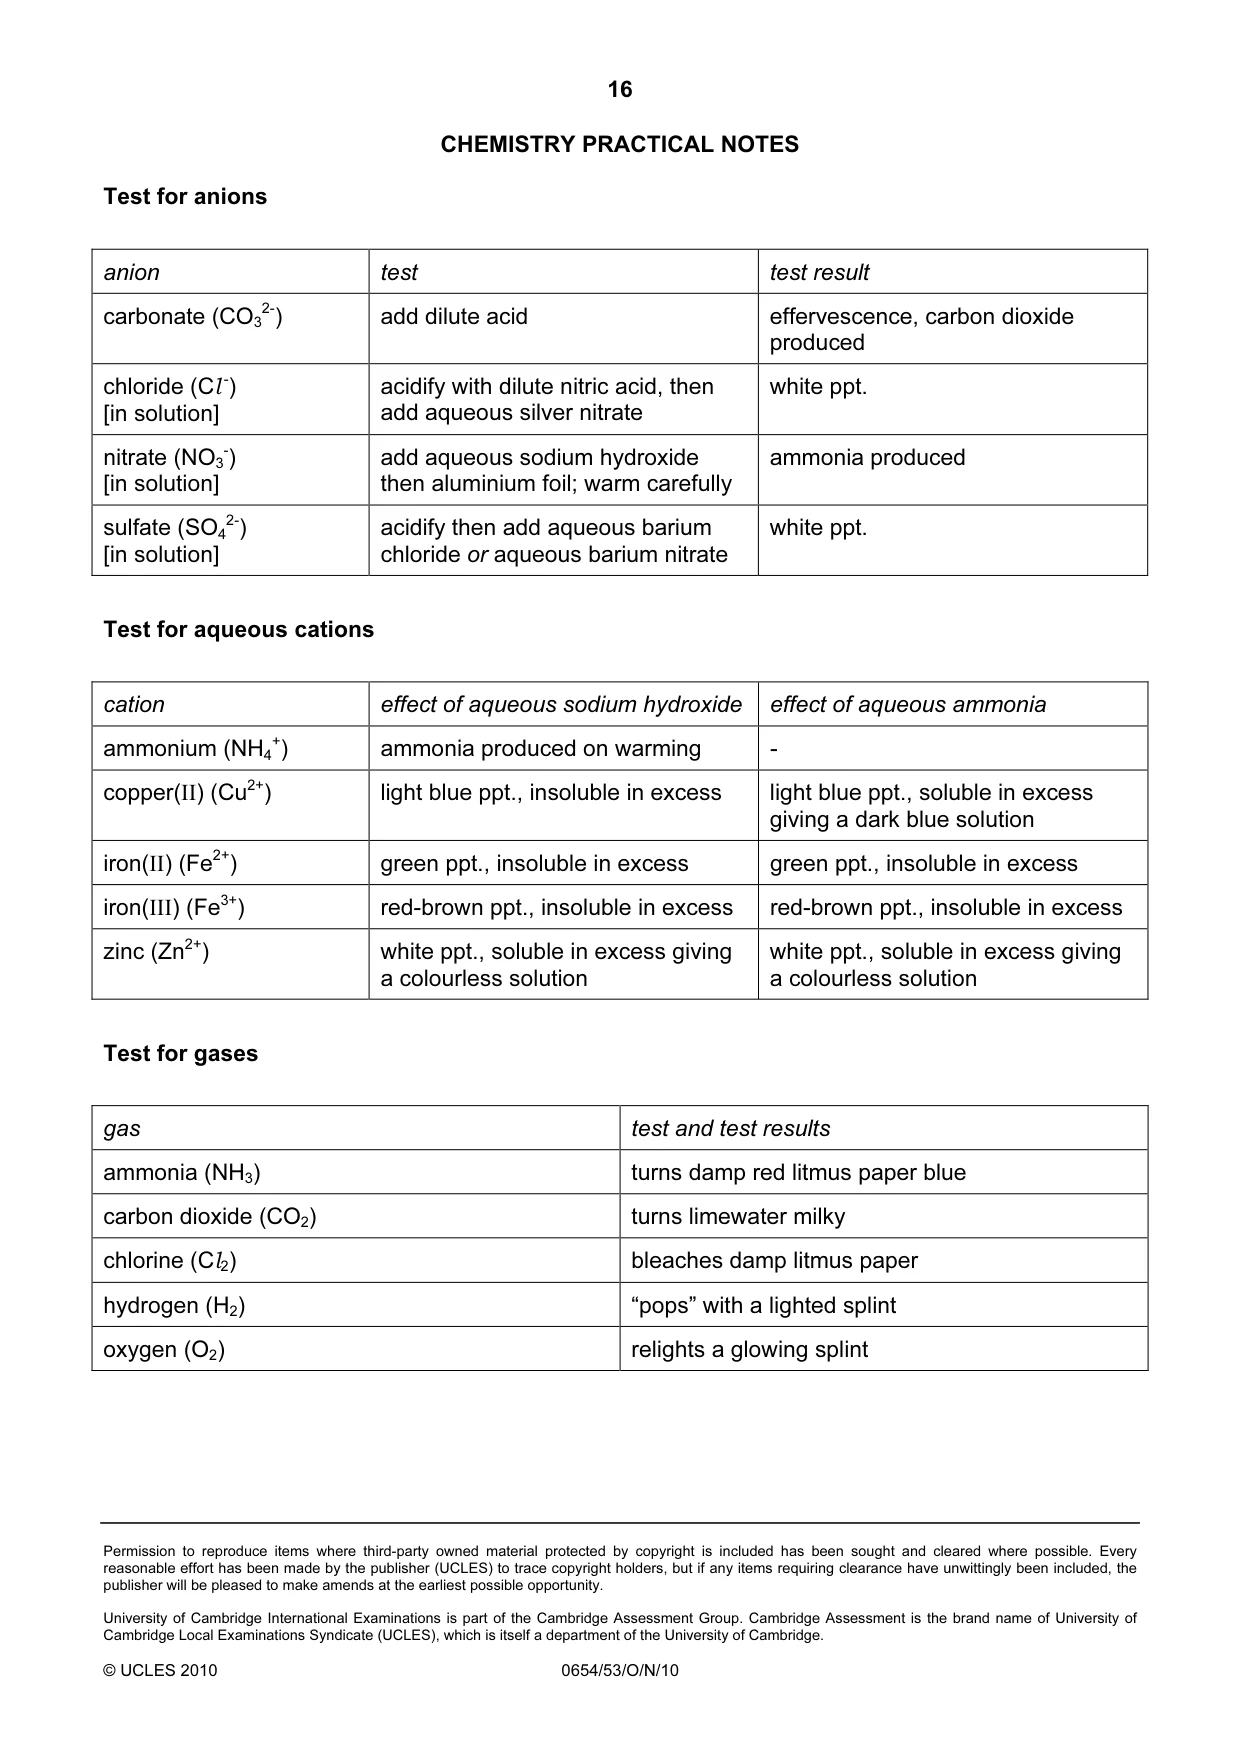
16 Permission to reproduce items where third-party owned material protected by copyright is included has been sought and cleared where possible. Every reasonable effort has been made by the publisher (UCLES) to trace copyright holders, but if any items requiring clearance have unwittingly been included, the publisher will be pleased to make amends at the earliest possible opportunity. University of Cambridge International Examinations is part of the Cambridge Assessment Group. Cambridge Assessment is the brand name of University of Cambridge Local Examinations Syndicate (UCLES), which is itself a department of the University of Cambridge. © UCLES 2010 0654/53/O/N/10 CHEMISTRY PRACTICAL NOTES Test for anions anion test test result carbonate (CO3 2-) add dilute acid effervescence, carbon dioxide produced chloride (Cl -) [in solution] acidify with dilute nitric acid, then add aqueous silver nitrate white ppt. nitrate (NO3 -) [in solution] add aqueous sodium hydroxide then aluminium foil; warm carefully ammonia produced sulfate (SO4 2-) [in solution] acidify then add aqueous barium chloride or aqueous barium nitrate white ppt. Test for aqueous cations cation effect of aqueous sodium hydroxide effect of aqueous ammonia ammonium (NH4 +) ammonia produced on warming - copper(II) (Cu2+) light blue ppt., insoluble in excess light blue ppt., soluble in excess giving a dark blue solution iron(II) (Fe2+) green ppt., insoluble in excess green ppt., insoluble in excess iron(III) (Fe3+) red-brown ppt., insoluble in excess red-brown ppt., insoluble in excess zinc (Zn2+) white ppt., soluble in excess giving a colourless solution white ppt., soluble in excess giving a colourless solution Test for gases gas test and test results ammonia (NH3) turns damp red litmus paper blue carbon dioxide (CO2) turns limewater milky chlorine (Cl2) bleaches damp litmus paper hydrogen (H2) “pops” with a lighted splint oxygen (O2) relights a glowing splint
What you needed in this session
Cambridge’s own grade thresholds for 2010 Oct/Nov, Paper 5 · Variant 3. A higher threshold means an easier paper — the bar moves with how the cohort did.