Cambridge IGCSE Sciences - Co-ordinated (Double) 0654 — 2009 May/June Paper 6 · Variant 1
0654/61/M/J/09 · 60 marks · ≈68 min
The question paper and its mark scheme, free to read here and free to download. This is Cambridge’s own paper, exactly as it was sat.
Question paper20 pages


Mark scheme4 pages
Answers below. Sit the paper first if you are practising.
Paper as text
Question paper, page 1
This document consists of 18 printed pages and 2 blank pages. IB09 06_0653_06/3RP © UCLES 2009 [Turn over *8621469522* For Examiner's Use 1 2 3 4 5 6 Total UNIVERSITY OF CAMBRIDGE INTERNATIONAL EXAMINATIONS International General Certificate of Secondary Education COMBINED SCIENCE 0653/06 CO-ORDINATED SCIENCES 0654/06 Paper 6 Alternative to Practical May/June 2009 1 hour Candidates answer on the Question paper No Additional Materials are required. READ THESE INSTRUCTIONS FIRST Write your Centre number, candidate number and name on all the work you hand in. Write in dark blue or black pen. You may use a soft pencil for any diagrams, graphs, tables or rough working. Do not use staples, paper clips, highlighters, glue or correction fluid. DO NOT WRITE IN ANY BARCODES. Answer all questions. At the end of the examination, fasten all your work securely together. The number of marks is given in brackets [ ] at the end of each question or part question. www.XtremePapers.com
Question paper, page 3
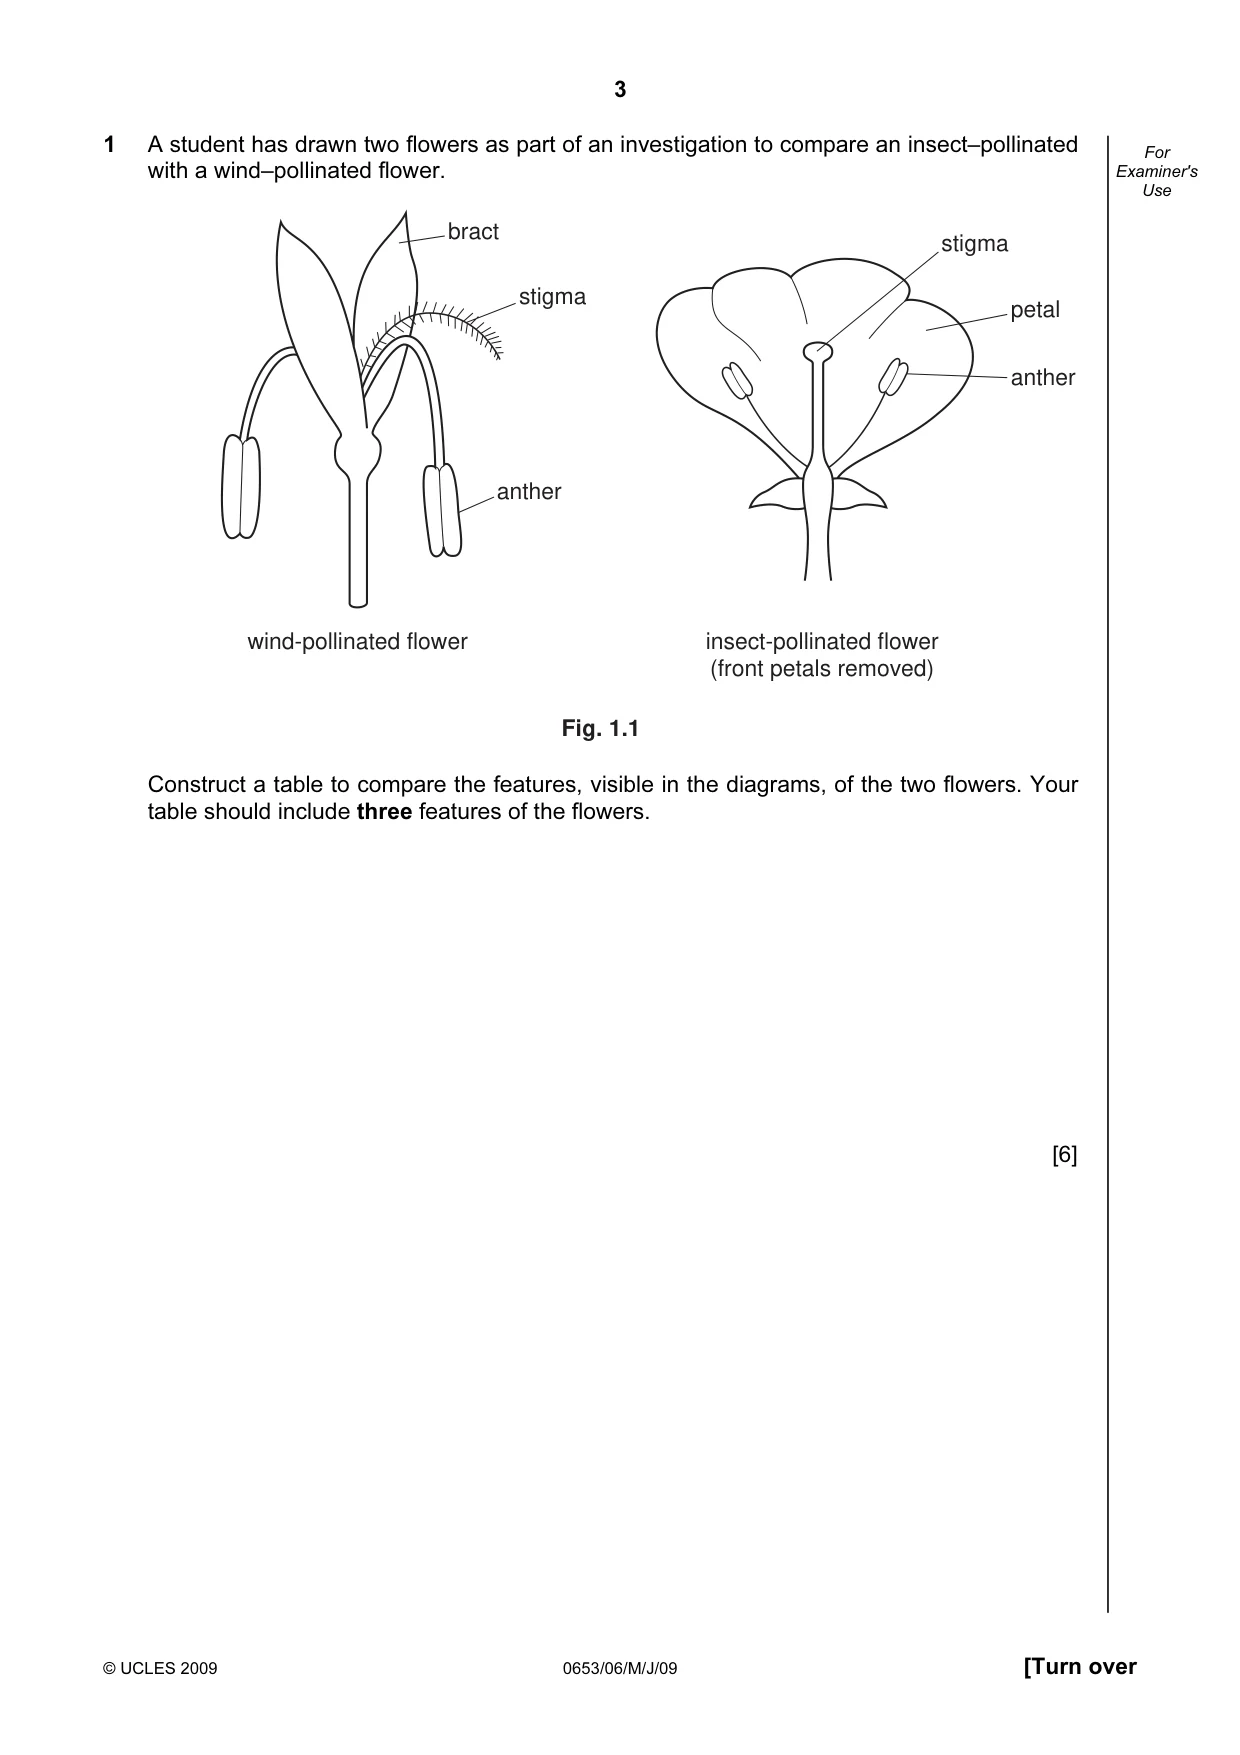
3 © UCLES 2009 0653/06/M/J/09 [Turn over For Examiner's Use 1 A student has drawn two flowers as part of an investigation to compare an insect–pollinated with a wind–pollinated flower. anther stigma bract anther petal stigma wind-pollinated flower insect-pollinated flower (front petals removed) Fig. 1.1 Construct a table to compare the features, visible in the diagrams, of the two flowers. Your table should include three features of the flowers. [6]
Question paper, page 4
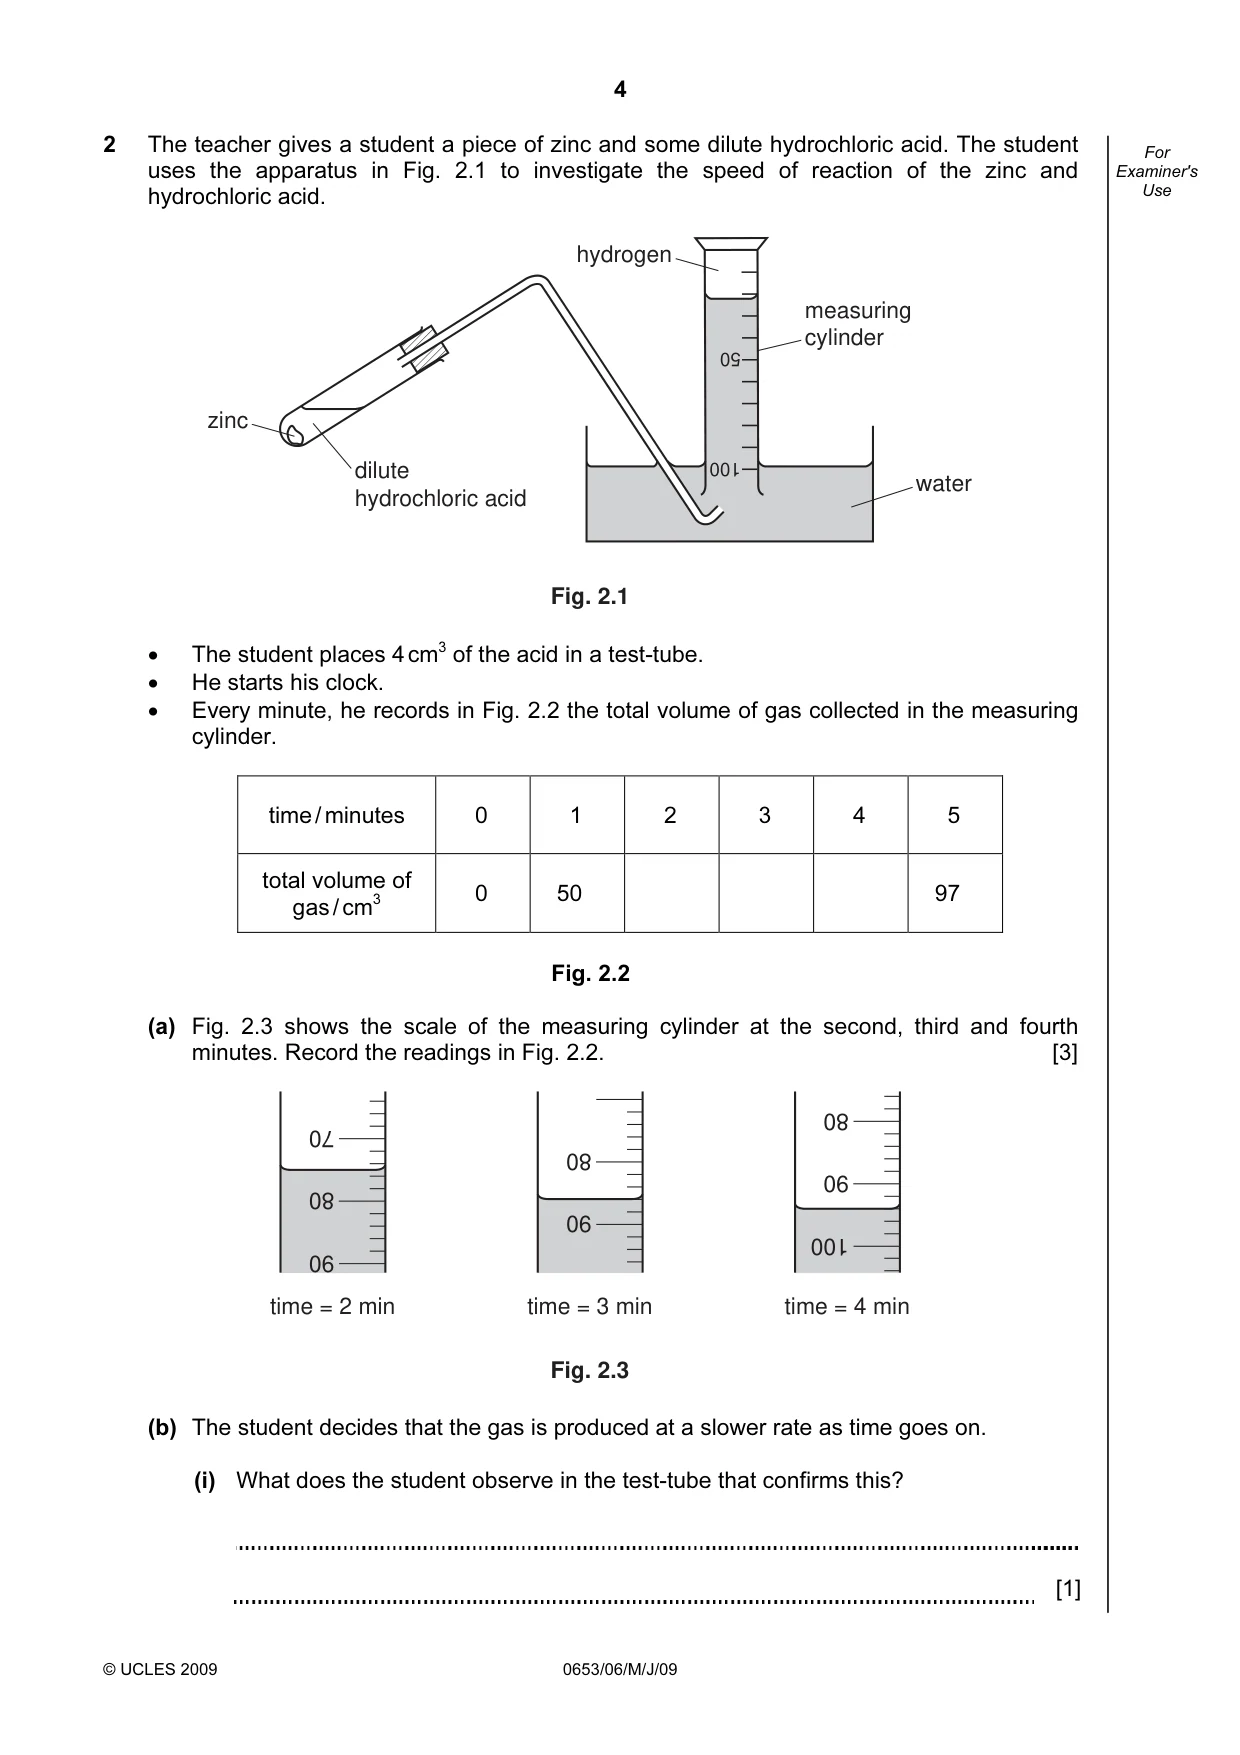
4 © UCLES 2009 0653/06/M/J/09 For Examiner's Use 2 The teacher gives a student a piece of zinc and some dilute hydrochloric acid. The student uses the apparatus in Fig. 2.1 to investigate the speed of reaction of the zinc and hydrochloric acid. 100 50 zinc hydrogen dilute hydrochloric acid measuring cylinder water Fig. 2.1 • The student places 4 cm3 of the acid in a test-tube. • He starts his clock. • Every minute, he records in Fig. 2.2 the total volume of gas collected in the measuring cylinder. time / minutes 0 1 2 3 4 5 total volume of gas / cm3 0 50 97 Fig. 2.2 (a) Fig. 2.3 shows the scale of the measuring cylinder at the second, third and fourth minutes. Record the readings in Fig. 2.2. [3] 90 80 70 time = 2 min 90 80 time = 3 min Fig. 2.3 100 90 80 time = 4 min (b) The student decides that the gas is produced at a slower rate as time goes on. (i) What does the student observe in the test-tube that confirms this? [1]
Question paper, page 5
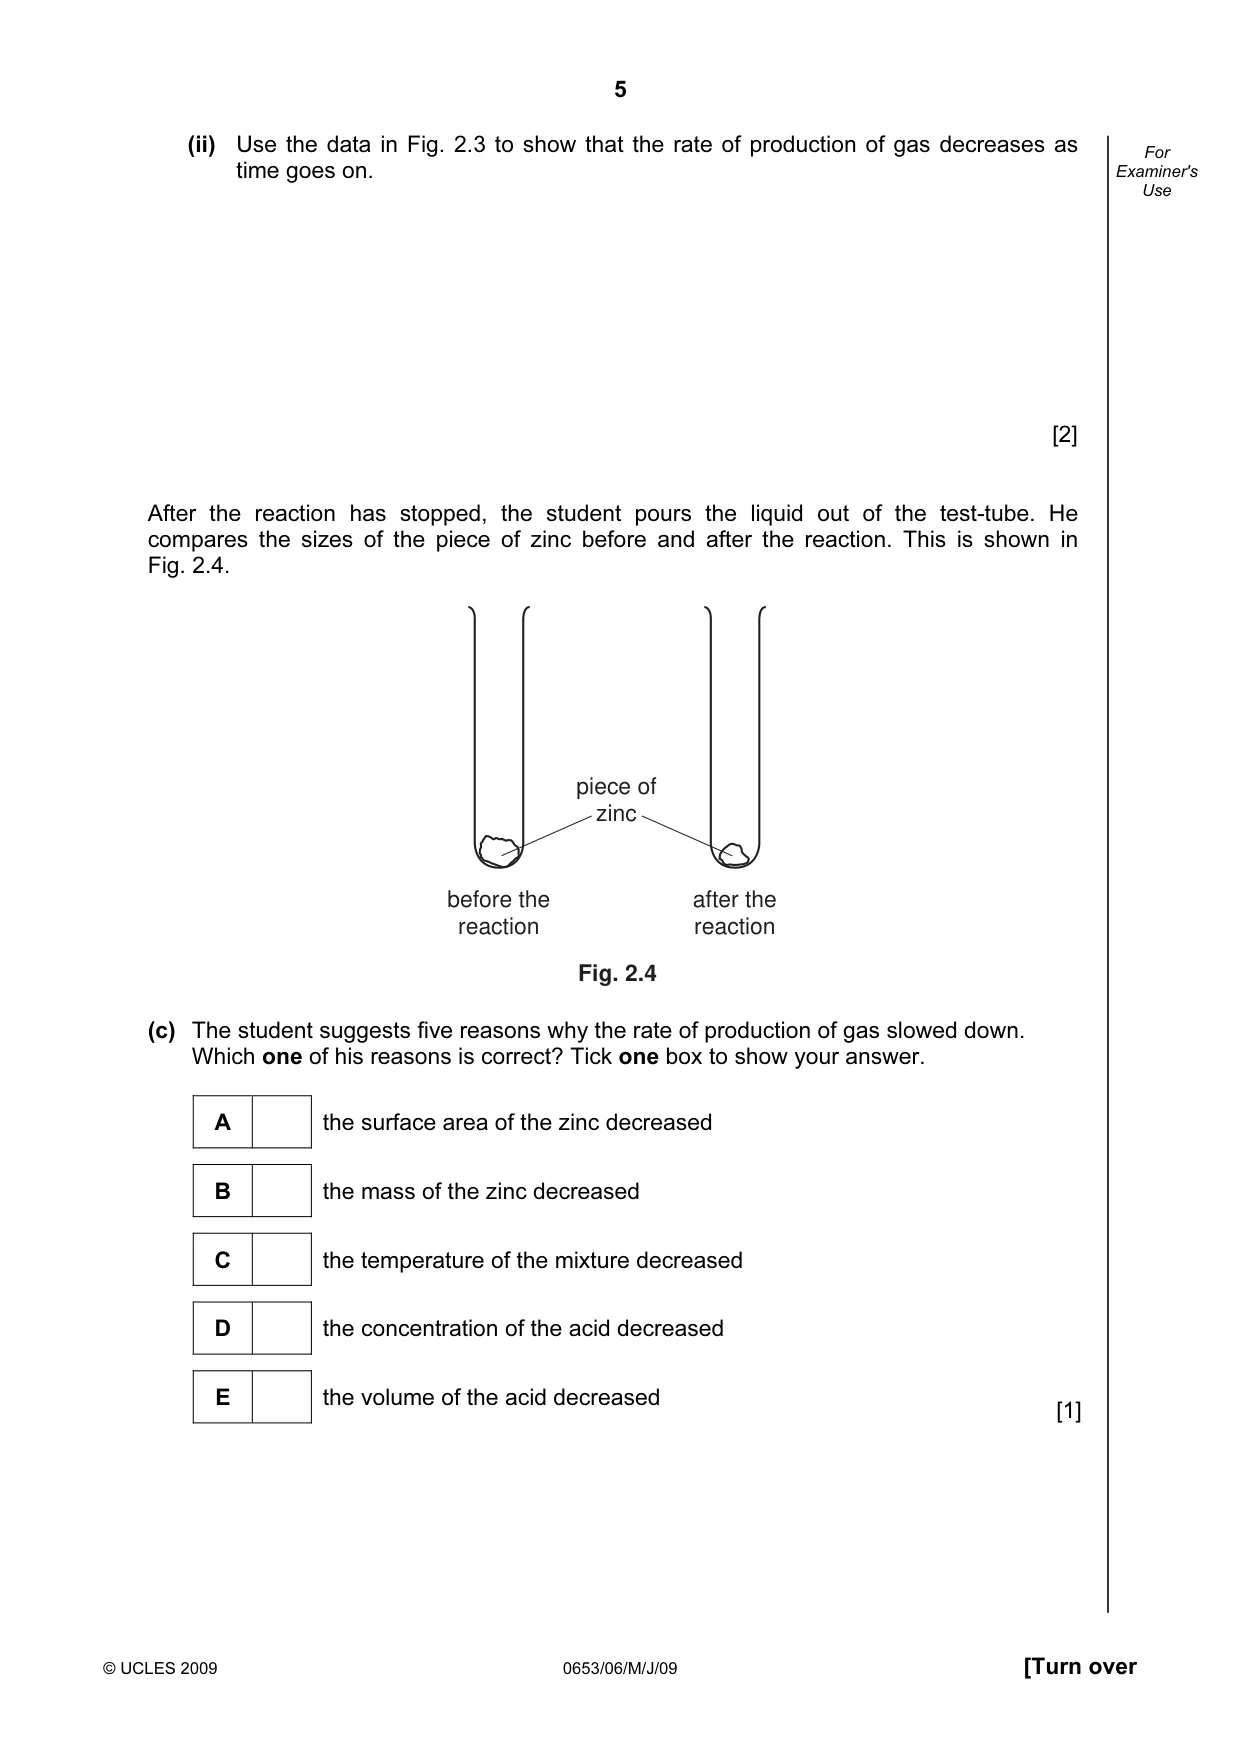
5 © UCLES 2009 0653/06/M/J/09 [Turn over For Examiner's Use (ii) Use the data in Fig. 2.3 to show that the rate of production of gas decreases as time goes on. [2] After the reaction has stopped, the student pours the liquid out of the test-tube. He compares the sizes of the piece of zinc before and after the reaction. This is shown in Fig. 2.4. before the reaction after the reaction piece of zinc Fig. 2.4 (c) The student suggests five reasons why the rate of production of gas slowed down. Which one of his reasons is correct? Tick one box to show your answer. A the surface area of the zinc decreased B the mass of the zinc decreased C the temperature of the mixture decreased D the concentration of the acid decreased E the volume of the acid decreased [1]
Question paper, page 6
6 © UCLES 2009 0653/06/M/J/09 For Examiner's Use (d) (i) Describe how the student can show that the gas in the measuring cylinder is hydrogen. [2] (ii) Write a word equation for the reaction of the hydrogen gas in the test you have described in (d)(i). [1]
Question paper, page 7
7 0653/06/M/J/09 [Turn over BLANK PAGE Please turn over for Question 3.
Question paper, page 8
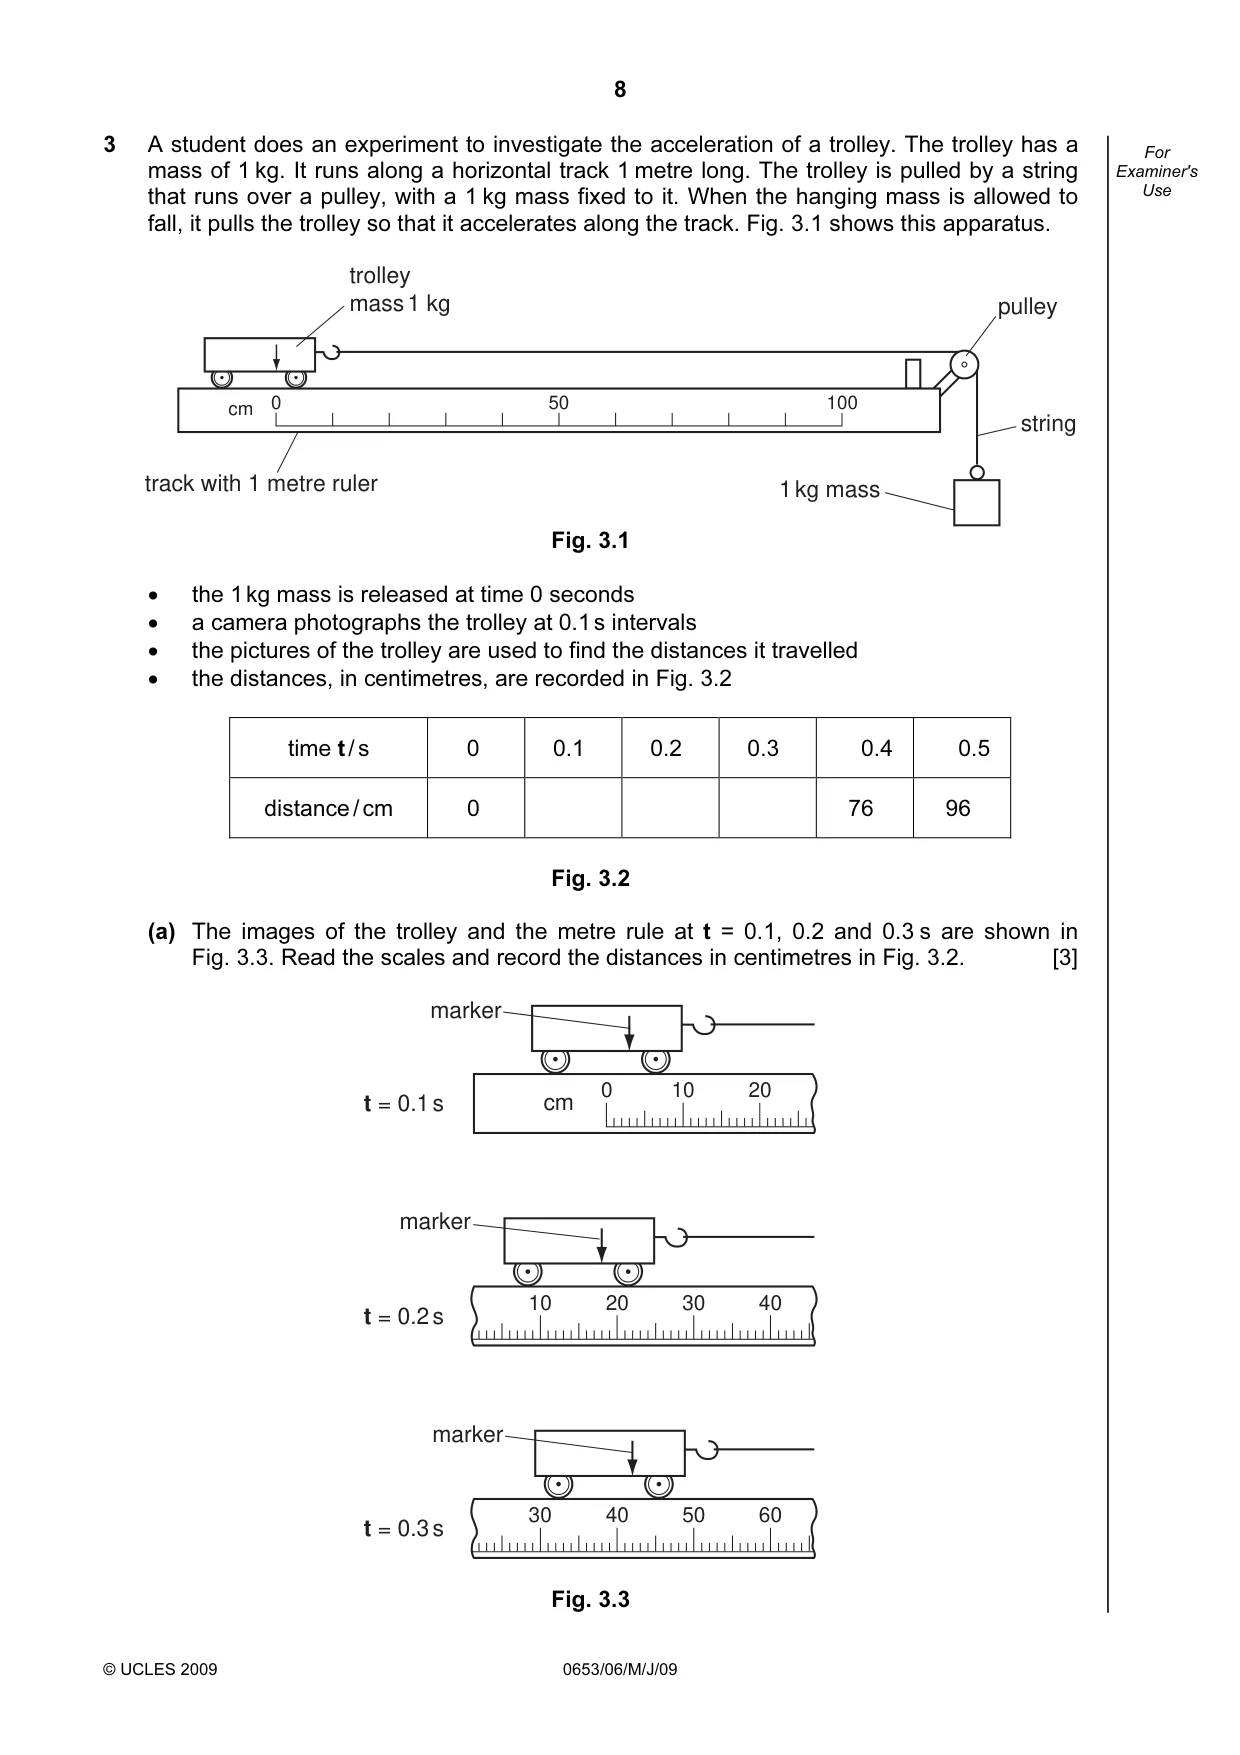
8 © UCLES 2009 0653/06/M/J/09 For Examiner's Use 3 A student does an experiment to investigate the acceleration of a trolley. The trolley has a mass of 1 kg. It runs along a horizontal track 1 metre long. The trolley is pulled by a string that runs over a pulley, with a 1 kg mass fixed to it. When the hanging mass is allowed to fall, it pulls the trolley so that it accelerates along the track. Fig. 3.1 shows this apparatus. 0 cm 50 100 trolley mass 1 kg track with 1 metre ruler pulley 1 kg mass string Fig. 3.1 • the 1 kg mass is released at time 0 seconds • a camera photographs the trolley at 0.1 s intervals • the pictures of the trolley are used to find the distances it travelled • the distances, in centimetres, are recorded in Fig. 3.2 time t / s 0 0.1 0.2 0.3 0.4 0.5 distance / cm 0 76 96 Fig. 3.2 (a) The images of the trolley and the metre rule at t = 0.1, 0.2 and 0.3 s are shown in Fig. 3.3. Read the scales and record the distances in centimetres in Fig. 3.2. [3] 0 10 20 cm t = 0.1 s 10 20 30 40 t = 0.2 s 30 40 50 60 t = 0.3 s marker marker marker Fig. 3.3
Question paper, page 9
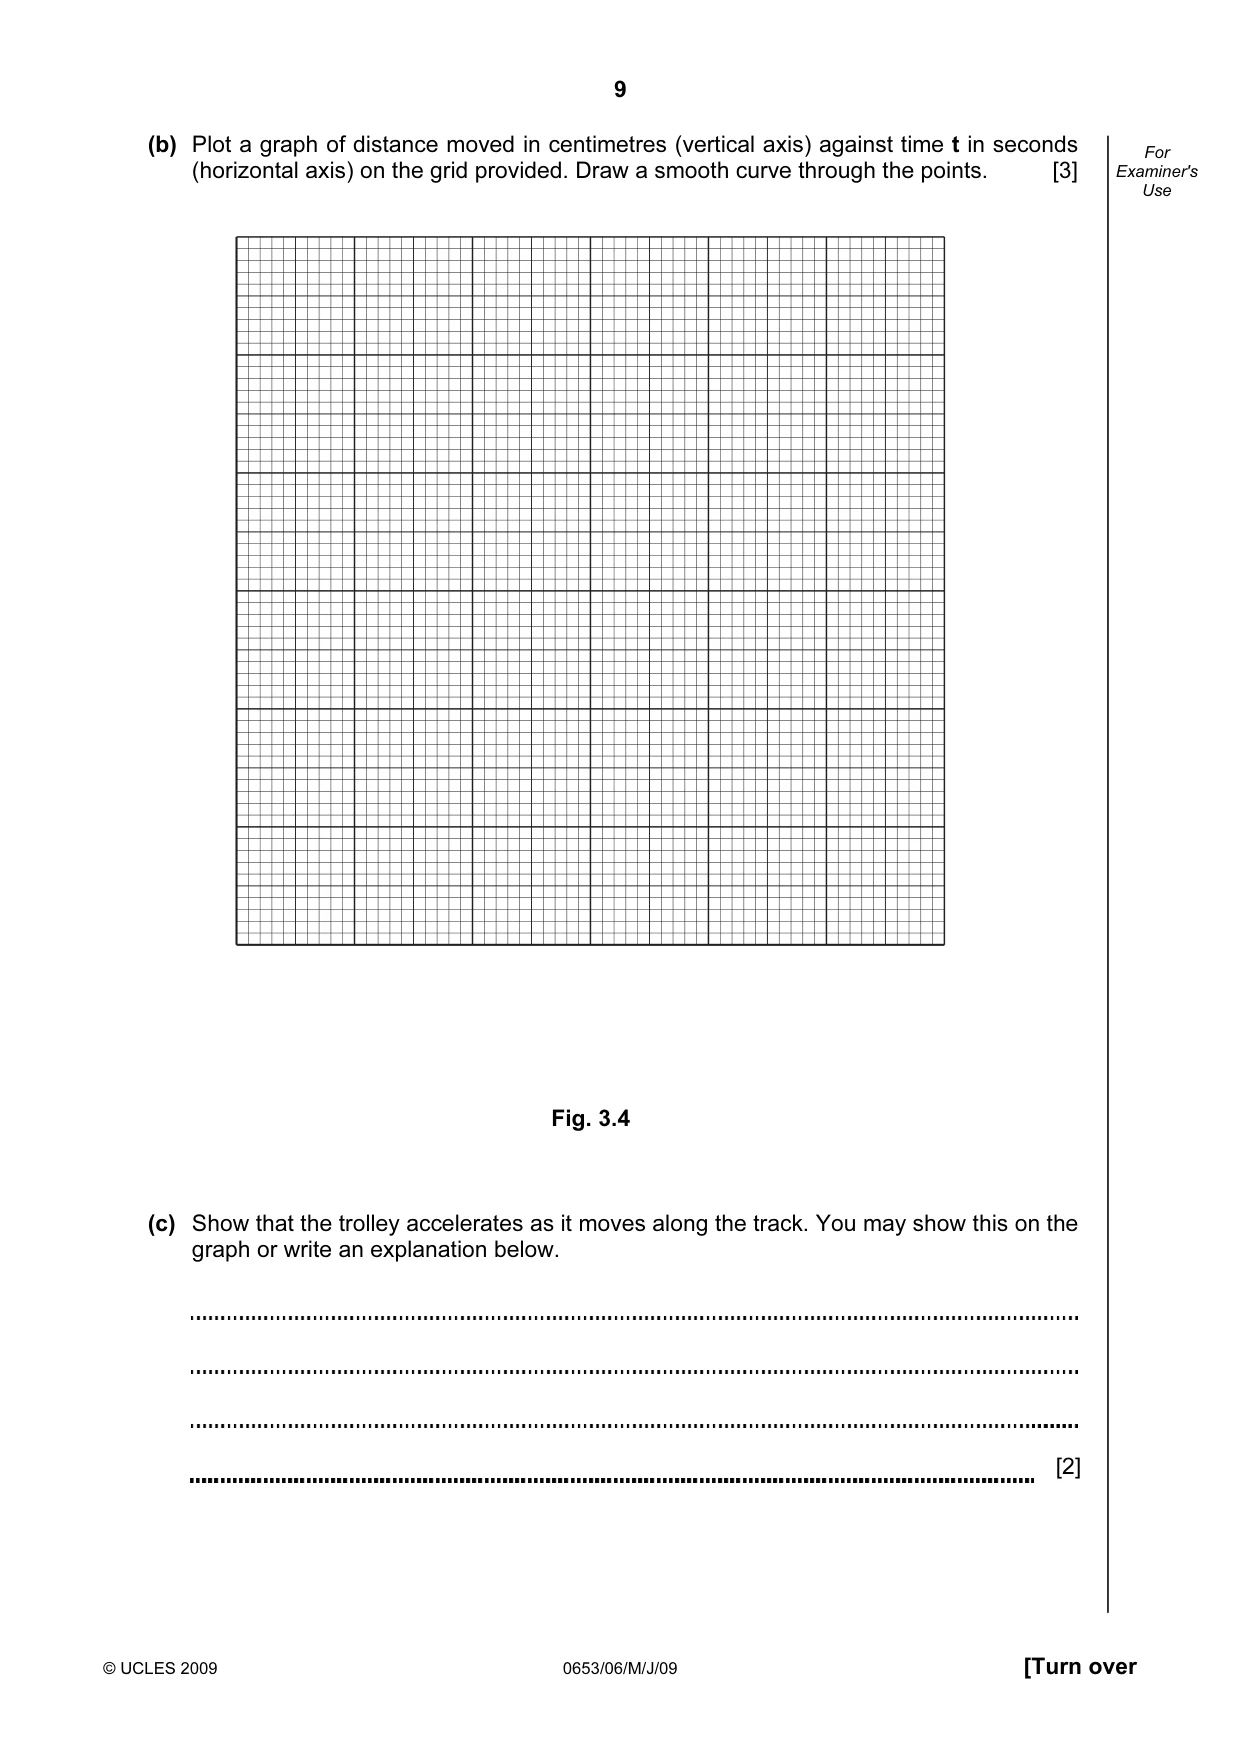
9 © UCLES 2009 0653/06/M/J/09 [Turn over For Examiner's Use (b) Plot a graph of distance moved in centimetres (vertical axis) against time t in seconds (horizontal axis) on the grid provided. Draw a smooth curve through the points. [3] Fig. 3.4 (c) Show that the trolley accelerates as it moves along the track. You may show this on the graph or write an explanation below. [2]
Question paper, page 10
10 © UCLES 2009 0653/06/M/J/09 For Examiner's Use (d) The student wants to change the mass of the trolley and the 1 kg mass. Suggest how the results will change if (i) the trolley has a mass of 2 kg instead of 1 kg, [1] (ii) the 1 kg hanging mass is replaced by a 2 kg mass. [1]
Question paper, page 11
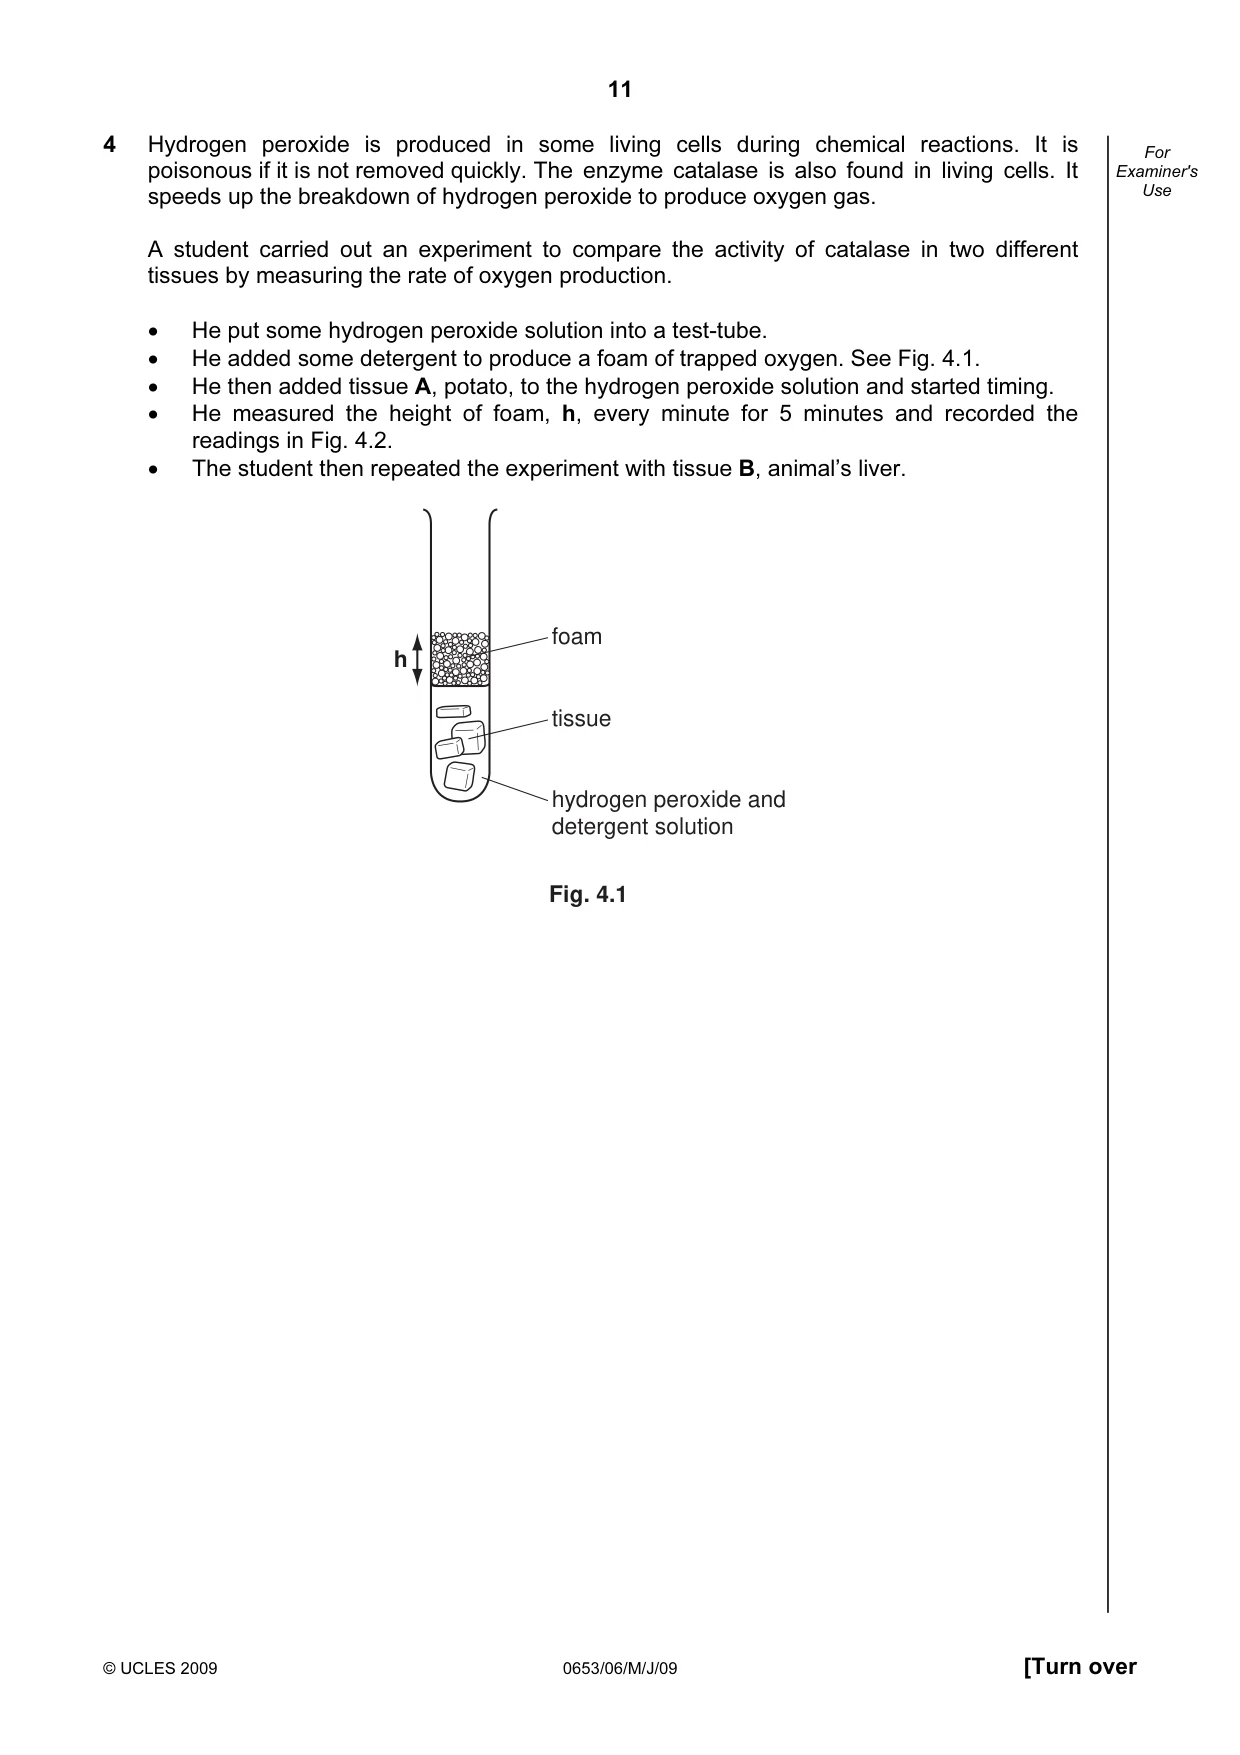
11 © UCLES 2009 0653/06/M/J/09 [Turn over For Examiner's Use 4 Hydrogen peroxide is produced in some living cells during chemical reactions. It is poisonous if it is not removed quickly. The enzyme catalase is also found in living cells. It speeds up the breakdown of hydrogen peroxide to produce oxygen gas. A student carried out an experiment to compare the activity of catalase in two different tissues by measuring the rate of oxygen production. • He put some hydrogen peroxide solution into a test-tube. • He added some detergent to produce a foam of trapped oxygen. See Fig. 4.1. • He then added tissue A, potato, to the hydrogen peroxide solution and started timing. • He measured the height of foam, h, every minute for 5 minutes and recorded the readings in Fig. 4.2. • The student then repeated the experiment with tissue B, animal’s liver. foam hydrogen peroxide and detergent solution tissue h Fig. 4.1
Question paper, page 12
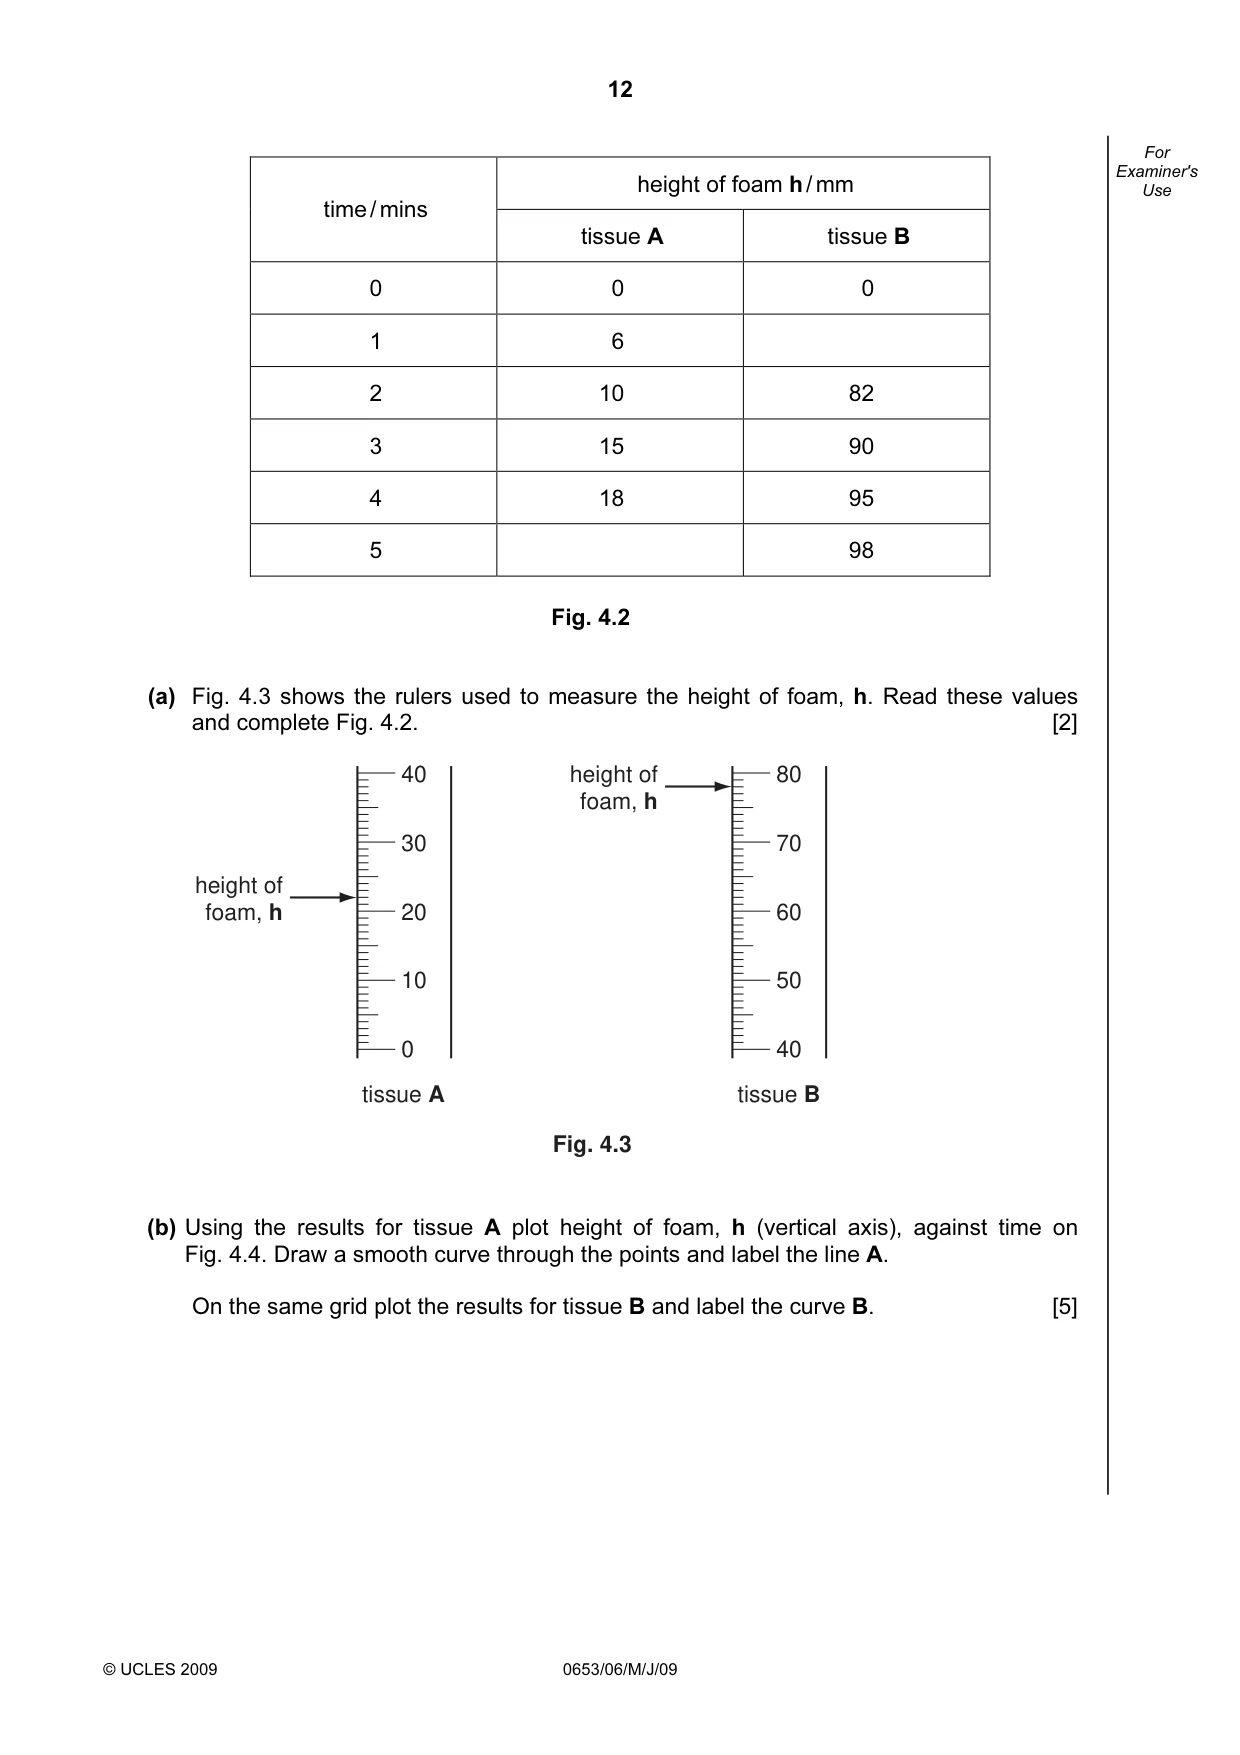
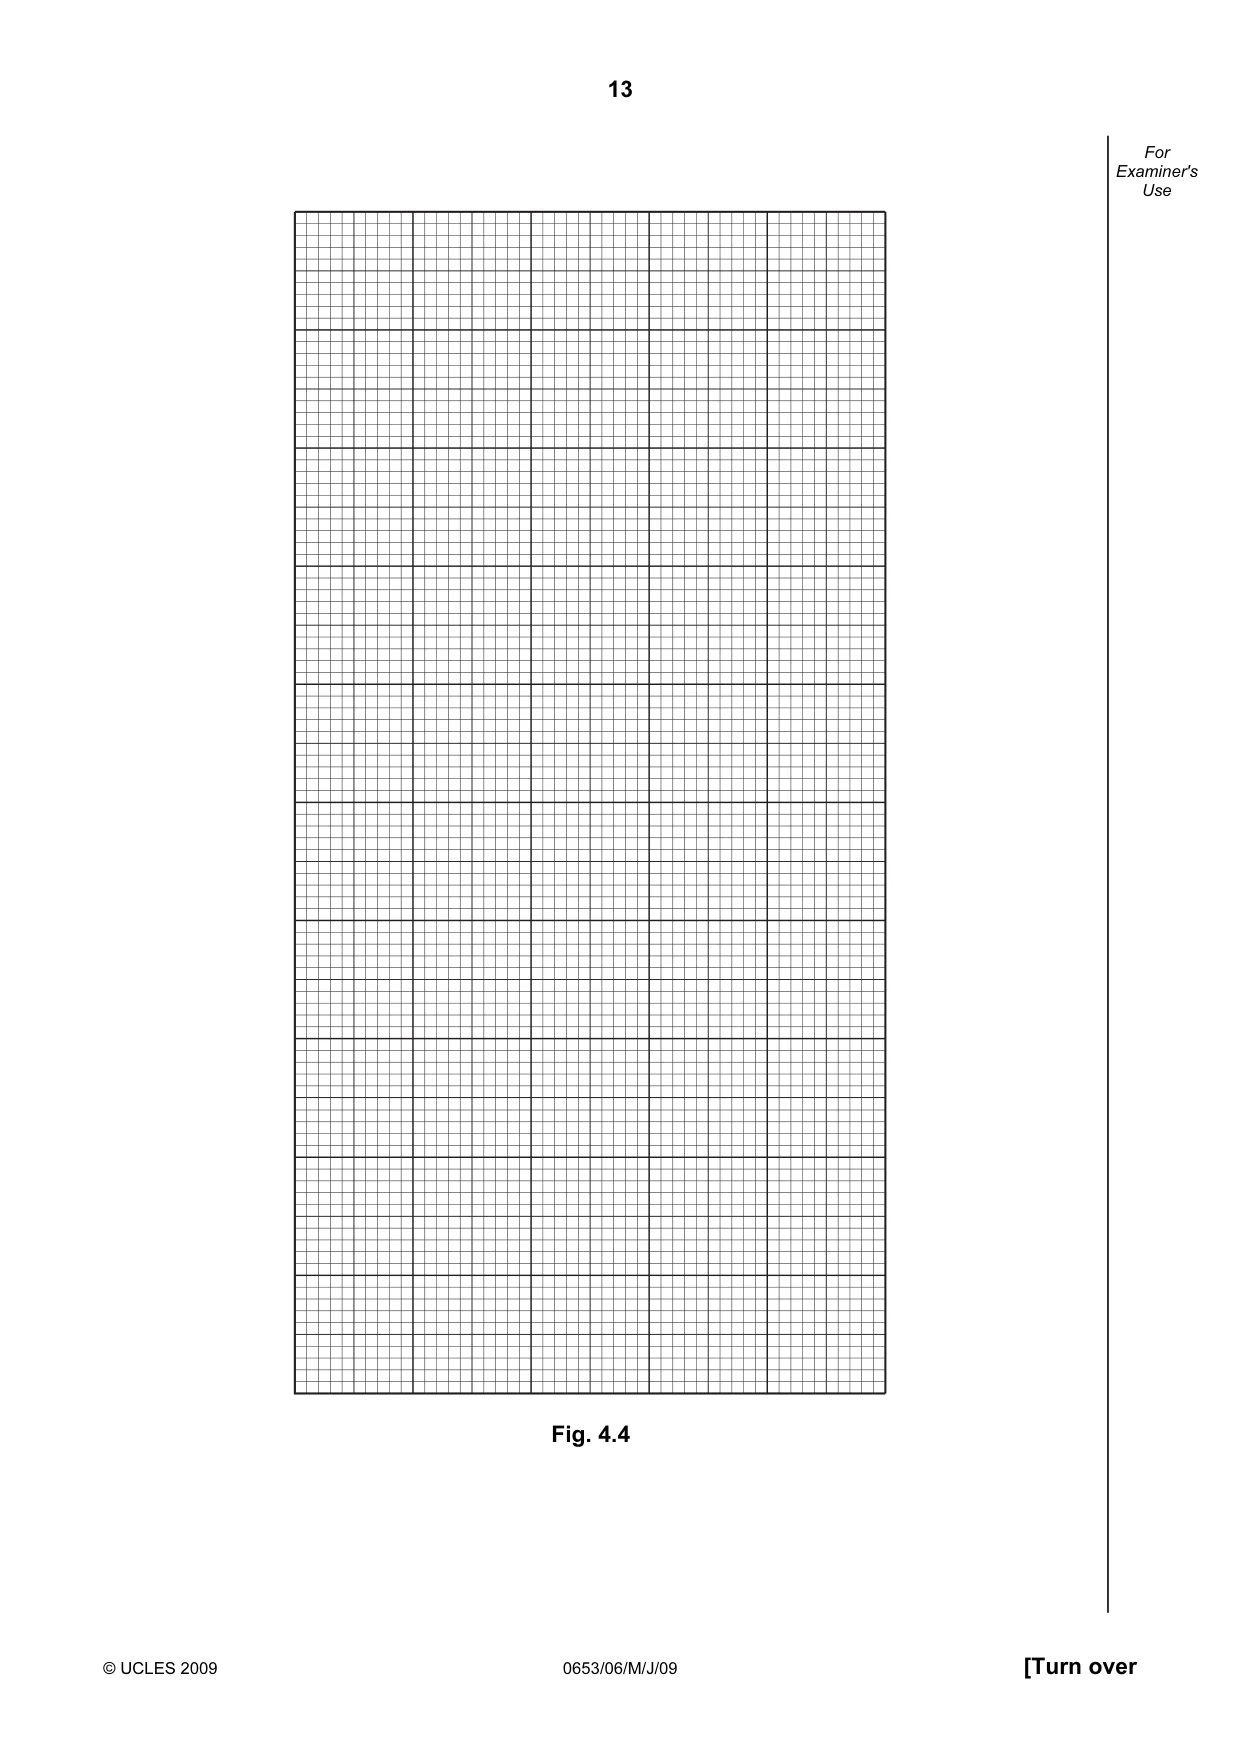
12 © UCLES 2009 0653/06/M/J/09 For Examiner's Use height of foam h / mm time / mins tissue A tissue B 0 0 0 1 6 2 10 82 3 15 90 4 18 95 5 98 Fig. 4.2 (a) Fig. 4.3 shows the rulers used to measure the height of foam, h. Read these values and complete Fig. 4.2. [2] 40 30 20 10 0 height of foam, h 80 70 60 50 40 height of foam, h tissue A tissue B Fig. 4.3 (b) Using the results for tissue A plot height of foam, h (vertical axis), against time on Fig. 4.4. Draw a smooth curve through the points and label the line A. On the same grid plot the results for tissue B and label the curve B. [5]
Question paper, page 13
13 © UCLES 2009 0653/06/M/J/09 [Turn over For Examiner's Use Fig. 4.4
Question paper, page 14
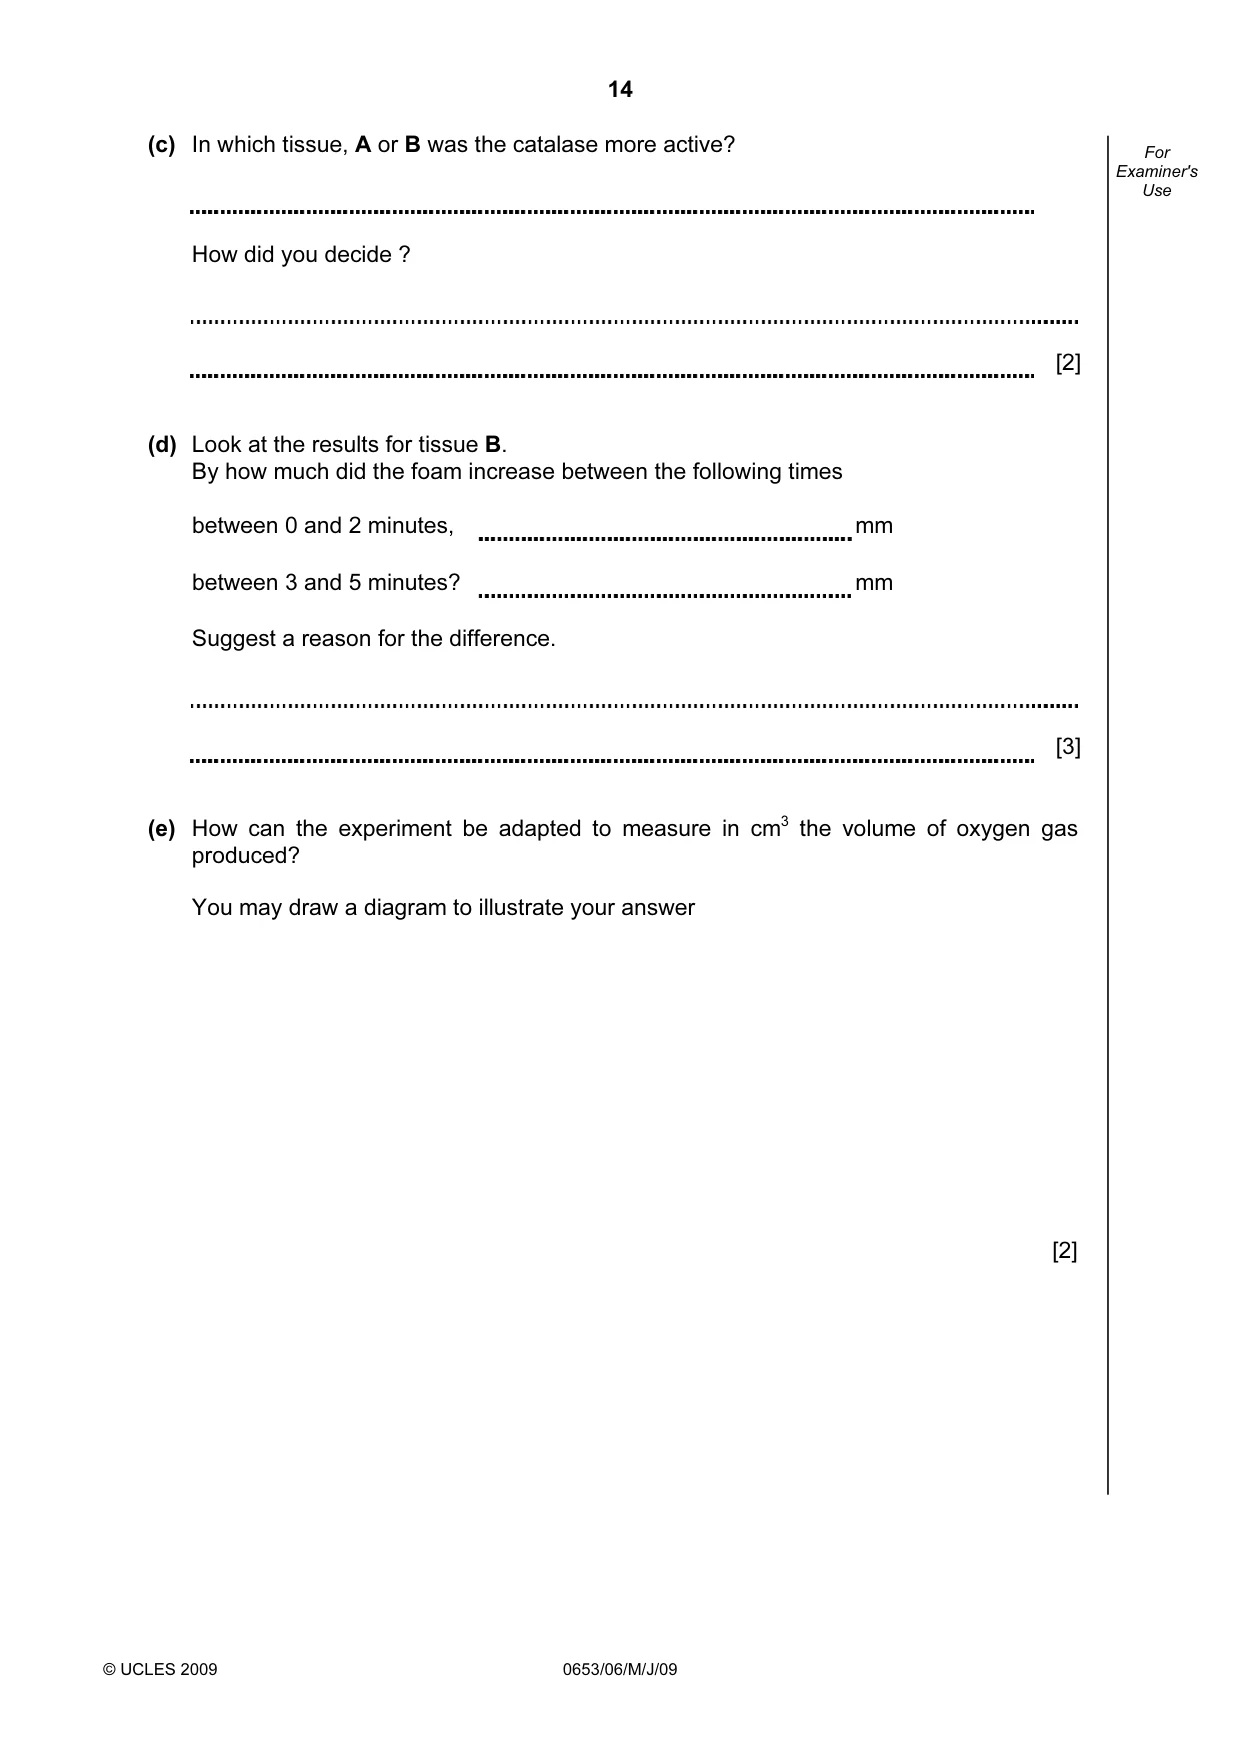
14 © UCLES 2009 0653/06/M/J/09 For Examiner's Use (c) In which tissue, A or B was the catalase more active? How did you decide ? [2] (d) Look at the results for tissue B. By how much did the foam increase between the following times between 0 and 2 minutes, mm between 3 and 5 minutes? mm Suggest a reason for the difference. [3] (e) How can the experiment be adapted to measure in cm3 the volume of oxygen gas produced? You may draw a diagram to illustrate your answer [2]
Question paper, page 15
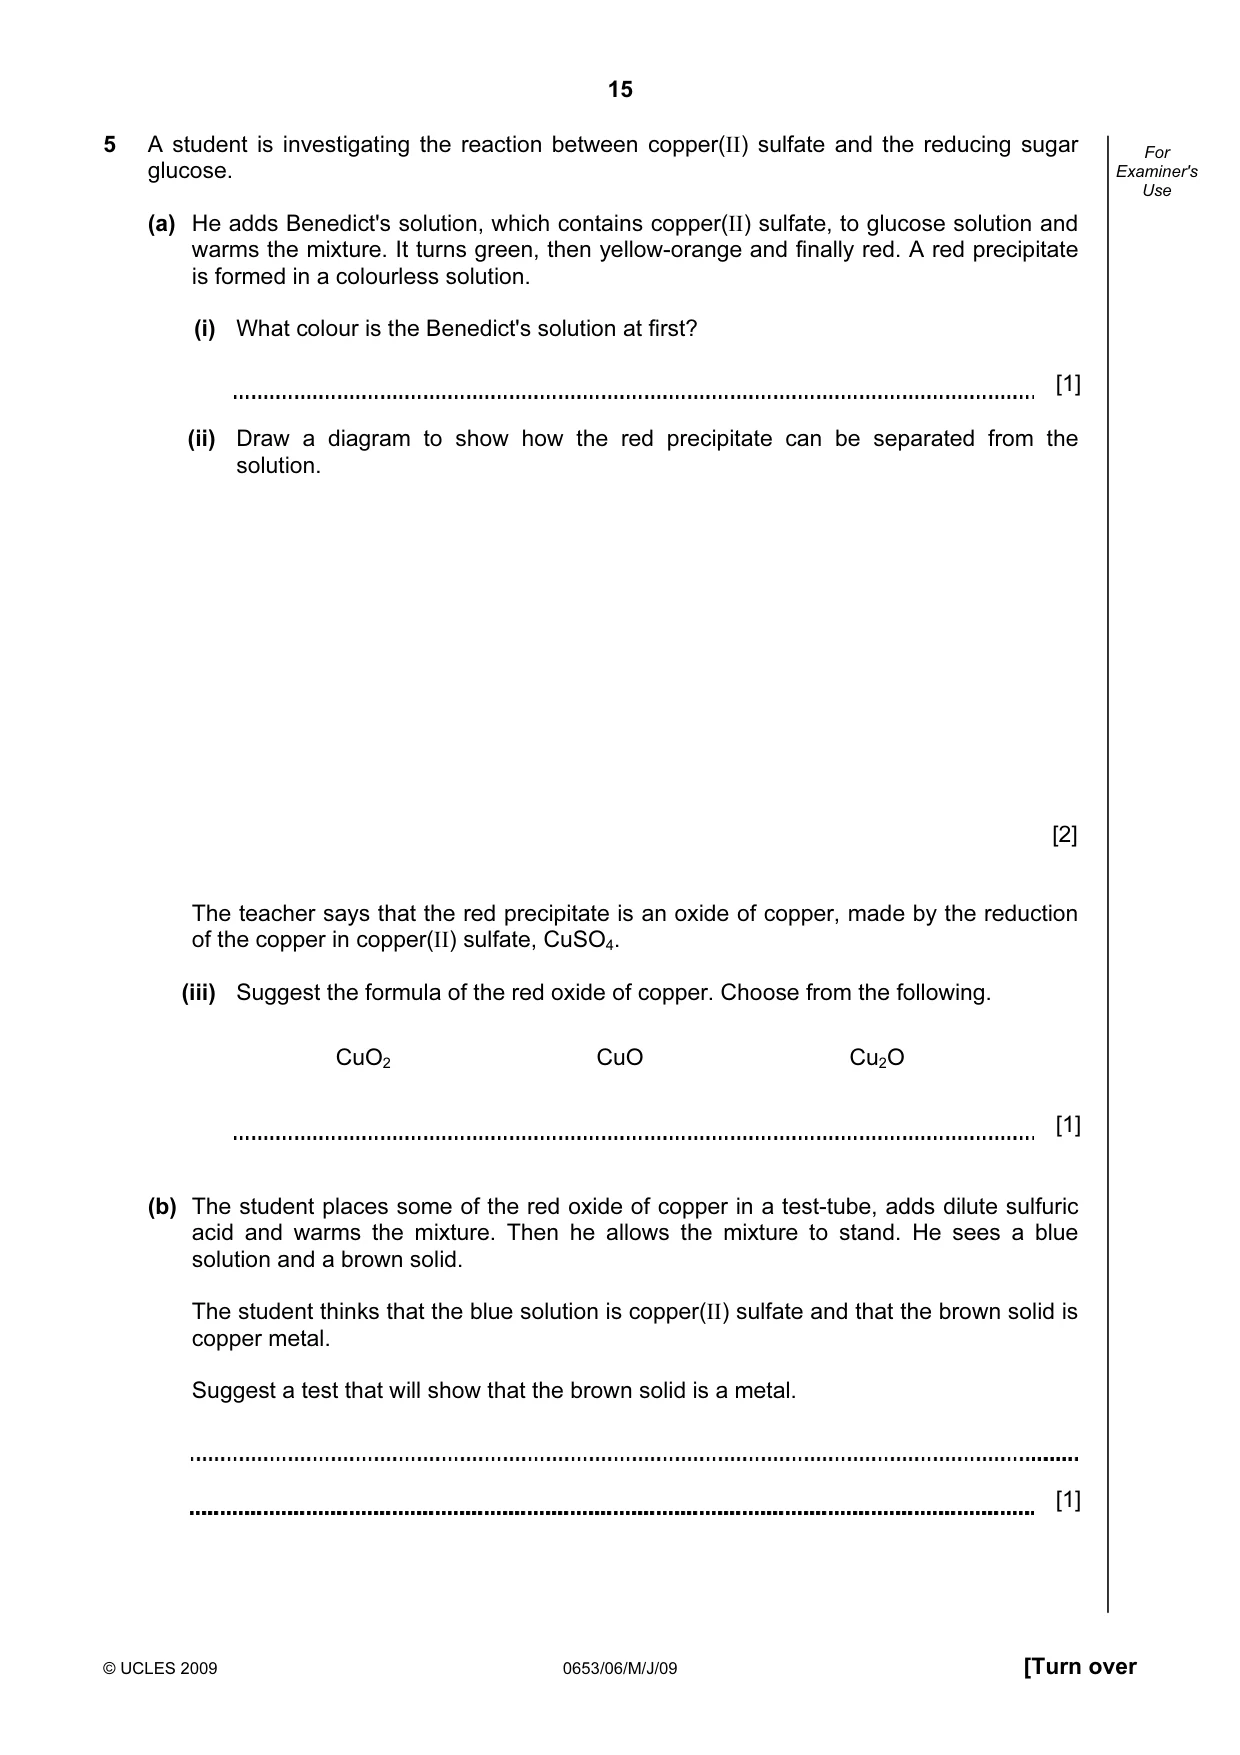
15 © UCLES 2009 0653/06/M/J/09 [Turn over For Examiner's Use 5 A student is investigating the reaction between copper(II) sulfate and the reducing sugar glucose. (a) He adds Benedict's solution, which contains copper(II) sulfate, to glucose solution and warms the mixture. It turns green, then yellow-orange and finally red. A red precipitate is formed in a colourless solution. (i) What colour is the Benedict's solution at first? [1] (ii) Draw a diagram to show how the red precipitate can be separated from the solution. [2] The teacher says that the red precipitate is an oxide of copper, made by the reduction of the copper in copper(II) sulfate, CuSO4. (iii) Suggest the formula of the red oxide of copper. Choose from the following. CuO2 CuO Cu2O [1] (b) The student places some of the red oxide of copper in a test-tube, adds dilute sulfuric acid and warms the mixture. Then he allows the mixture to stand. He sees a blue solution and a brown solid. The student thinks that the blue solution is copper(II) sulfate and that the brown solid is copper metal. Suggest a test that will show that the brown solid is a metal. [1]
Question paper, page 16
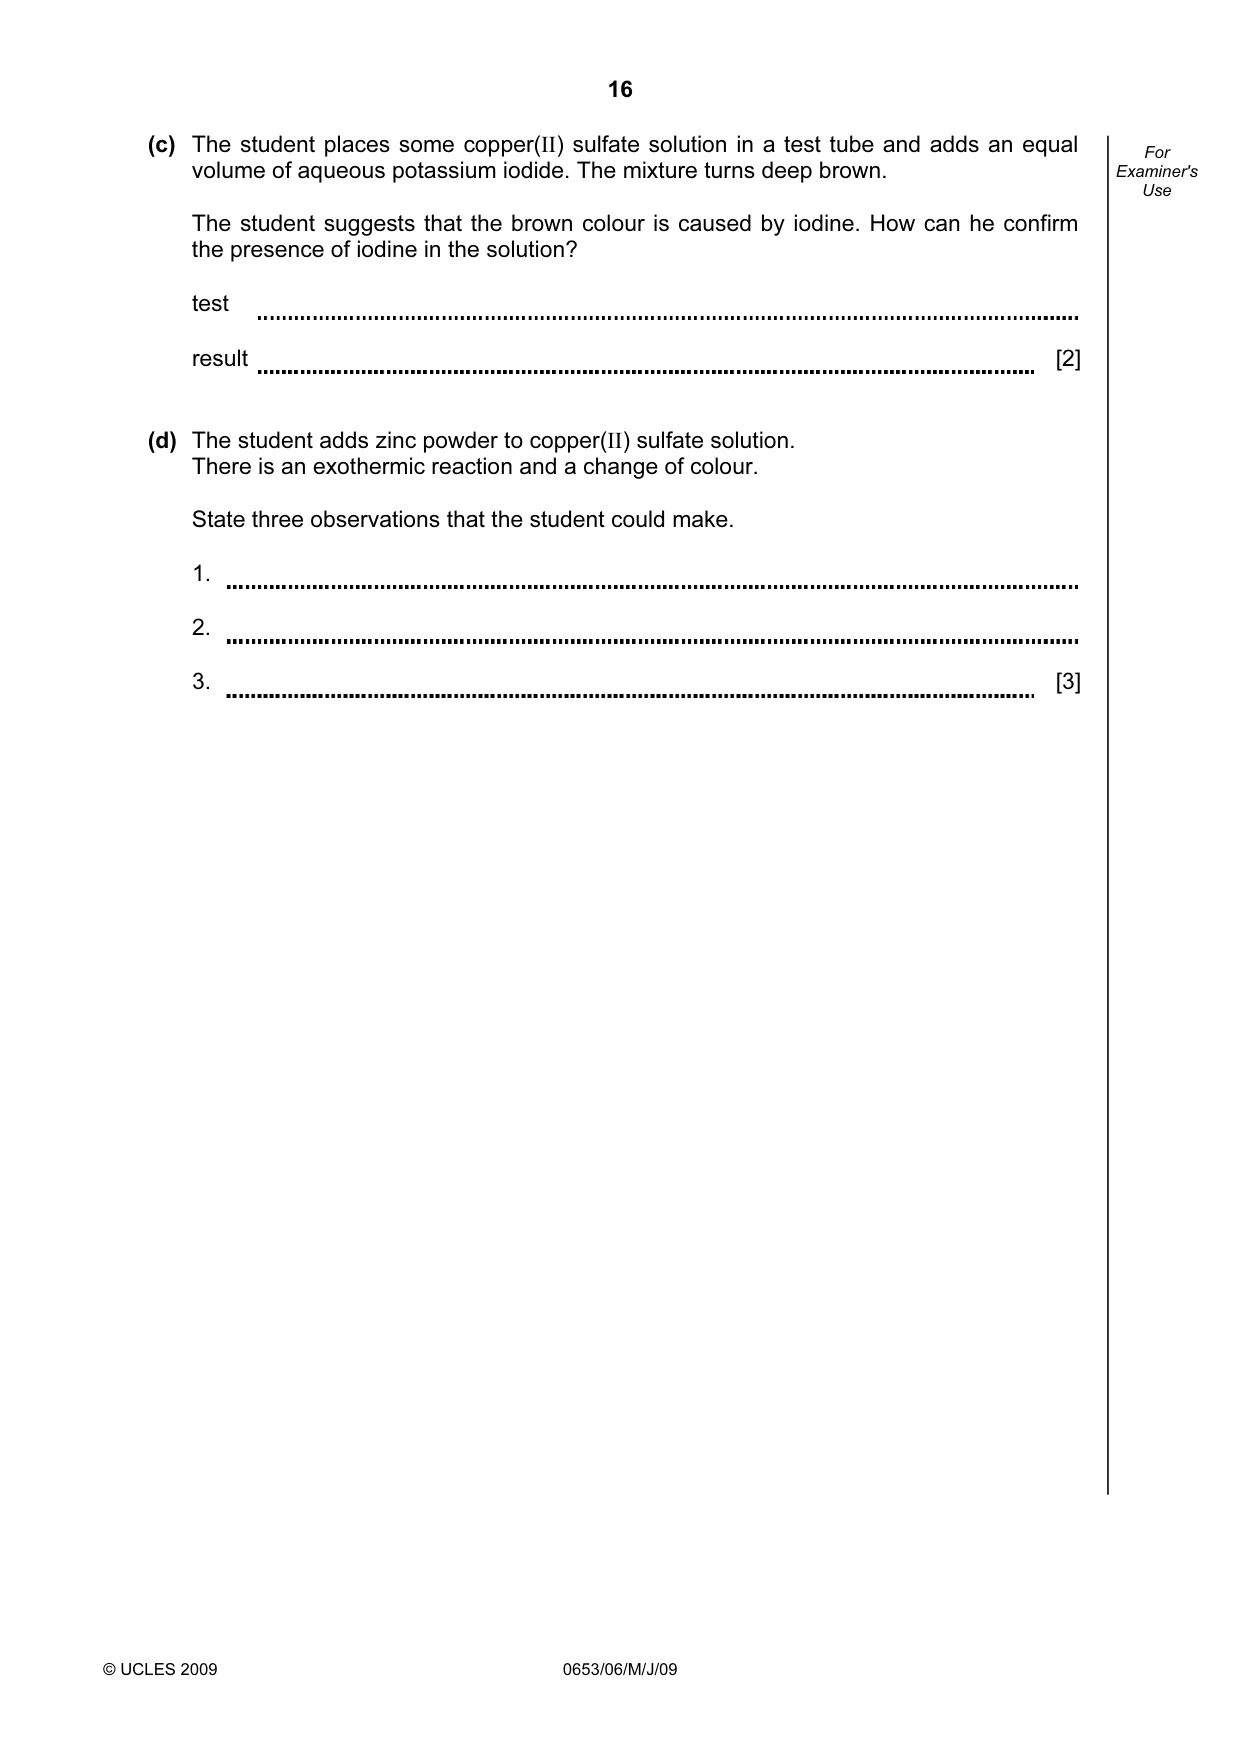
16 © UCLES 2009 0653/06/M/J/09 For Examiner's Use (c) The student places some copper(II) sulfate solution in a test tube and adds an equal volume of aqueous potassium iodide. The mixture turns deep brown. The student suggests that the brown colour is caused by iodine. How can he confirm the presence of iodine in the solution? test result [2] (d) The student adds zinc powder to copper(II) sulfate solution. There is an exothermic reaction and a change of colour. State three observations that the student could make. 1. 2. 3. [3]
Question paper, page 17
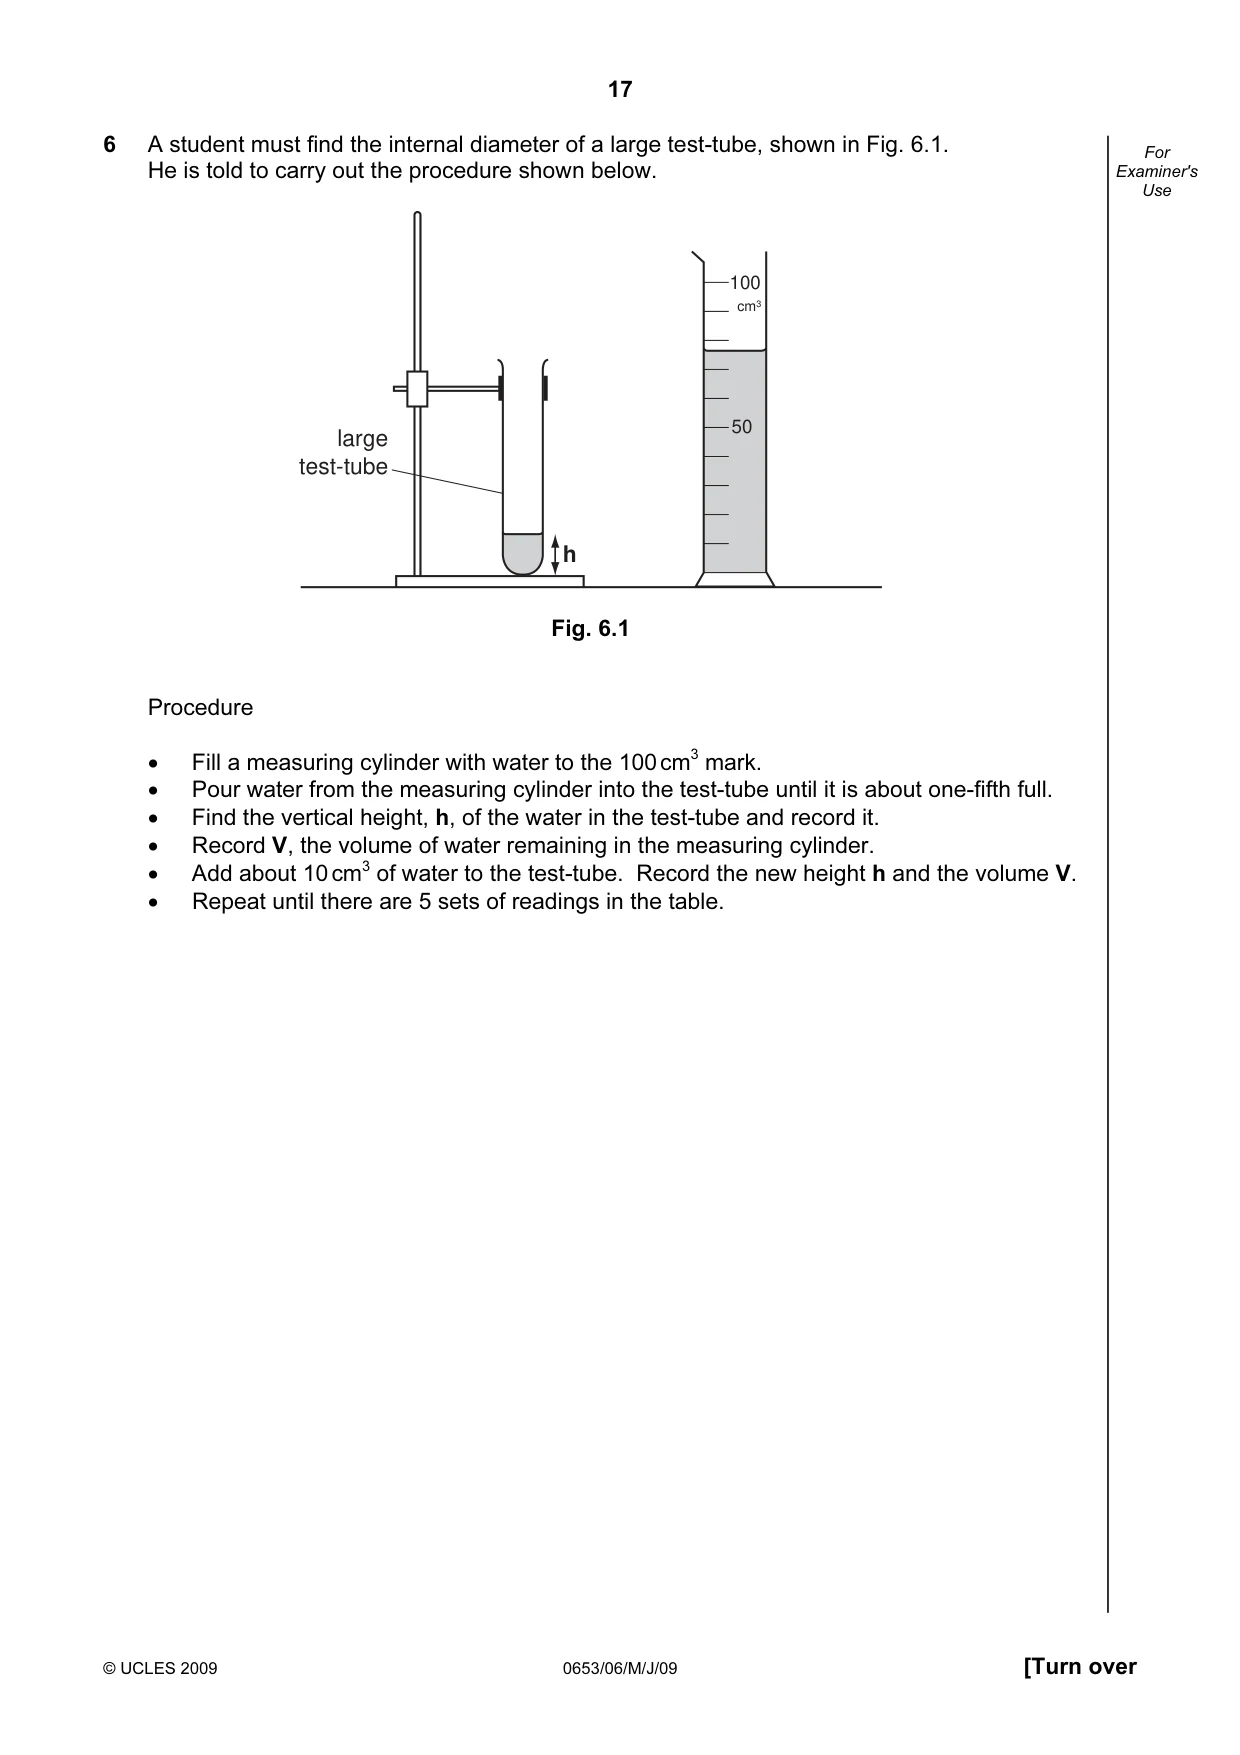
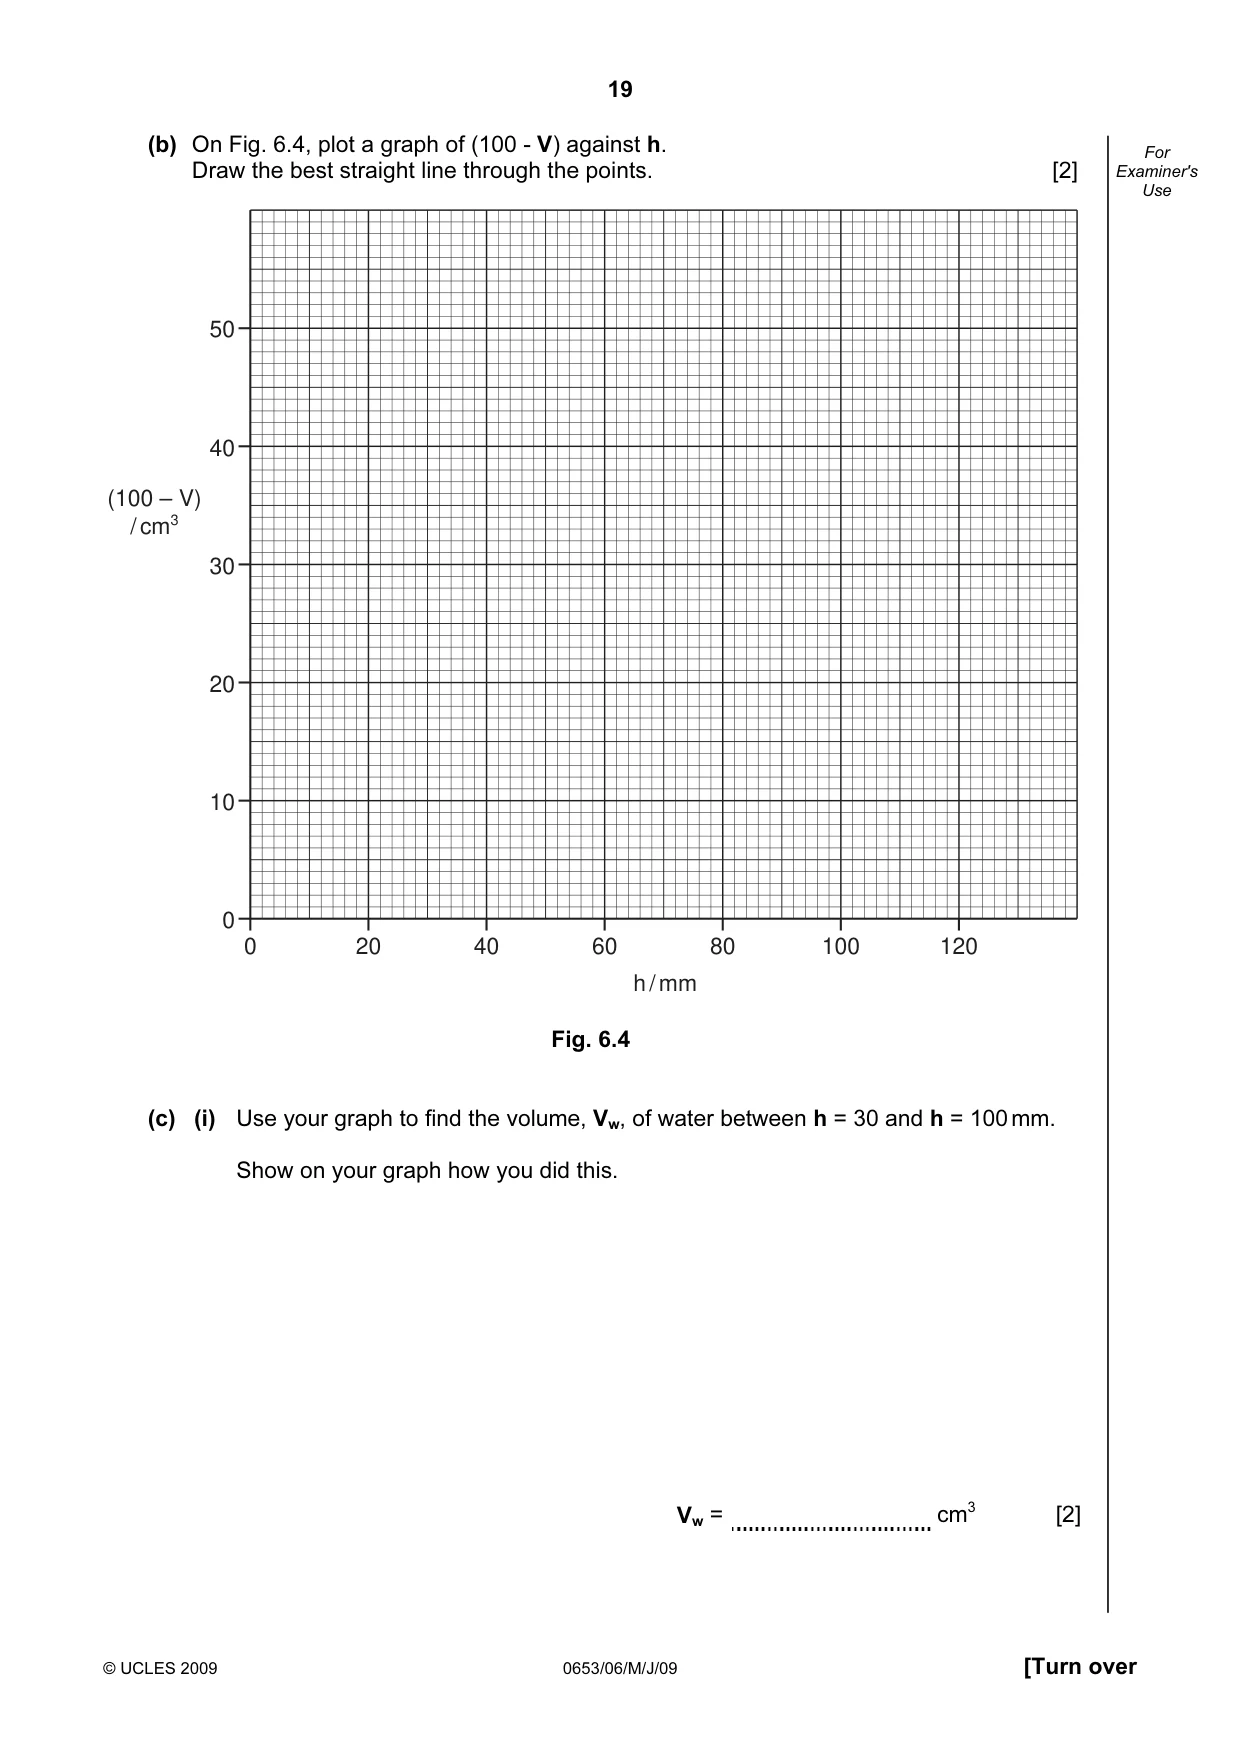
17 © UCLES 2009 0653/06/M/J/09 [Turn over For Examiner's Use 6 A student must find the internal diameter of a large test-tube, shown in Fig. 6.1. He is told to carry out the procedure shown below. h large test-tube 100 50 cm3 Fig. 6.1 Procedure • Fill a measuring cylinder with water to the 100 cm3 mark. • Pour water from the measuring cylinder into the test-tube until it is about one-fifth full. • Find the vertical height, h, of the water in the test-tube and record it. • Record V, the volume of water remaining in the measuring cylinder. • Add about 10 cm3 of water to the test-tube. Record the new height h and the volume V. • Repeat until there are 5 sets of readings in the table.
Question paper, page 18
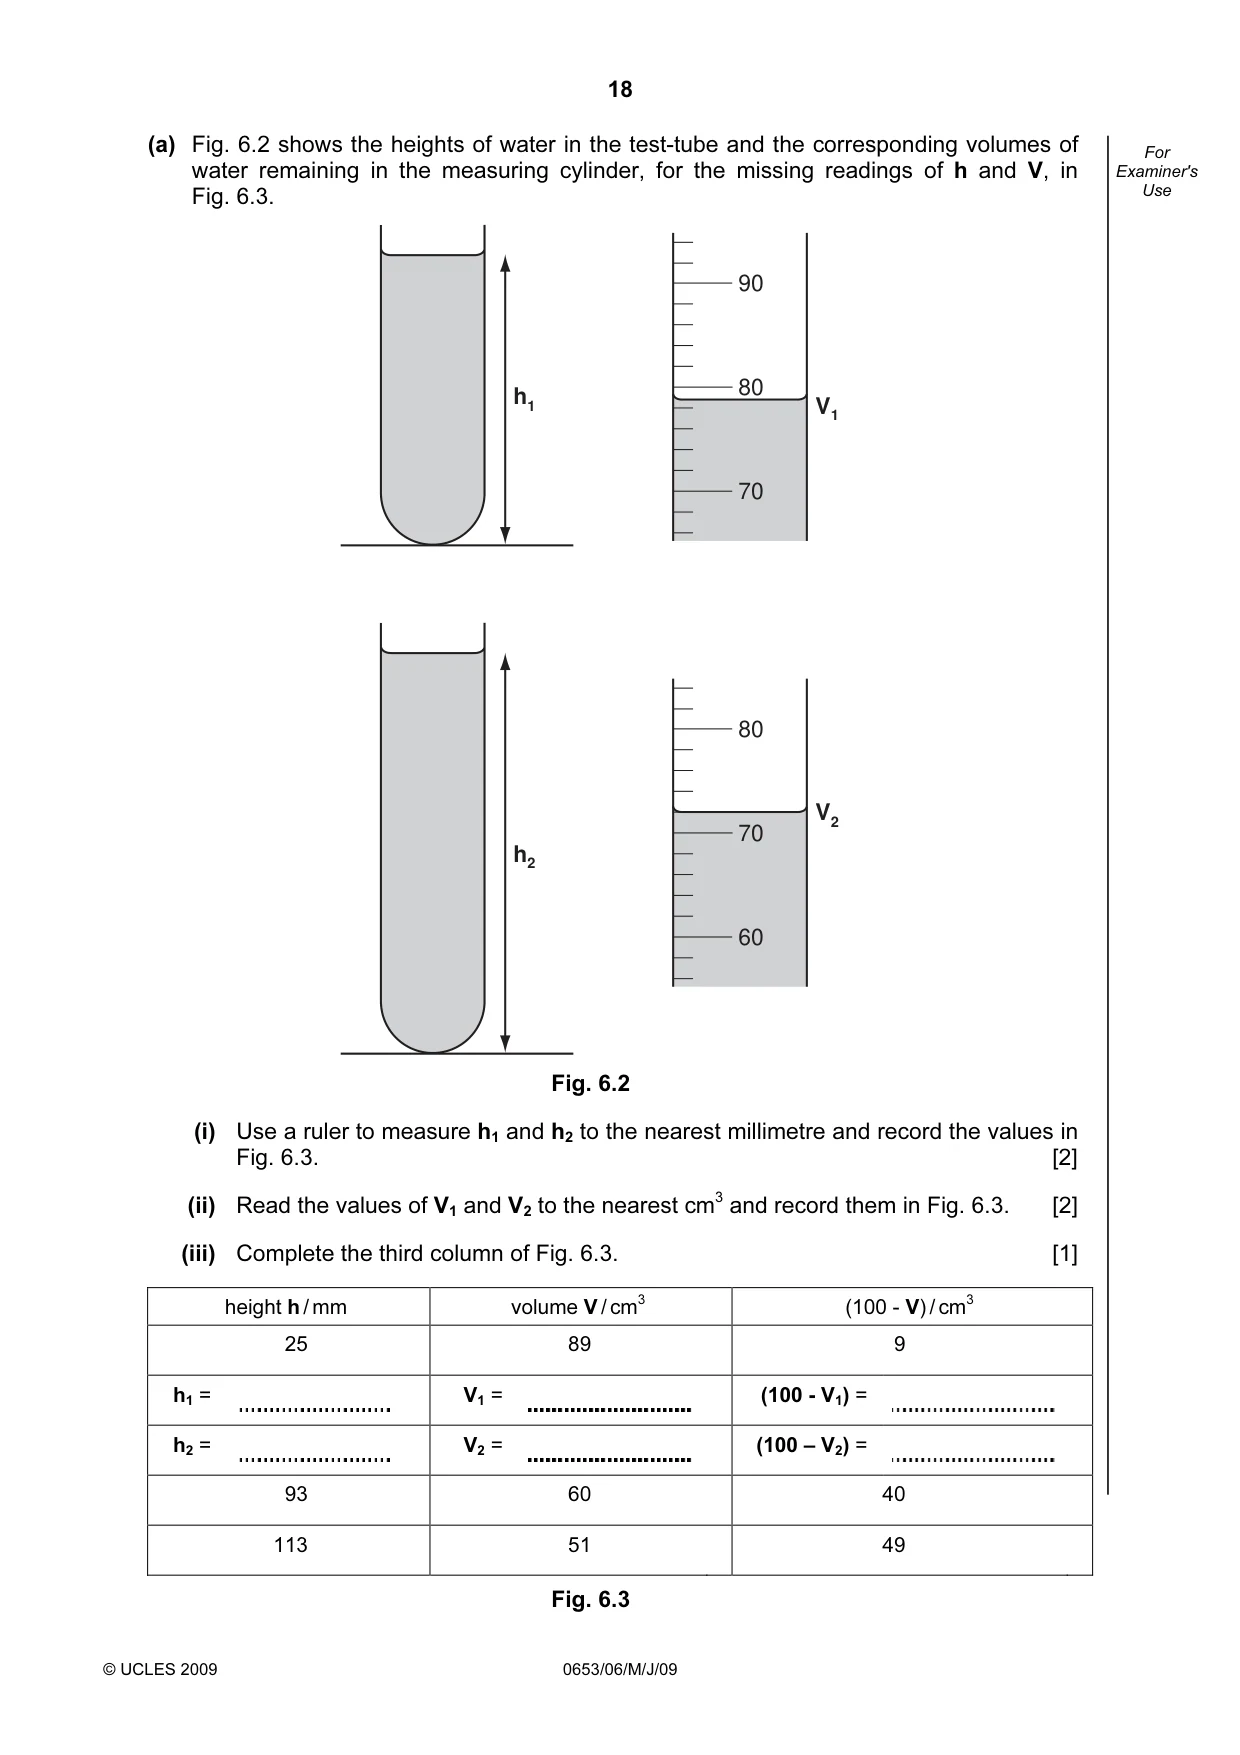
18 © UCLES 2009 0653/06/M/J/09 For Examiner's Use (a) Fig. 6.2 shows the heights of water in the test-tube and the corresponding volumes of water remaining in the measuring cylinder, for the missing readings of h and V, in Fig. 6.3. 90 80 70 h1 V1 80 70 60 h2 V2 Fig. 6.2 (i) Use a ruler to measure h1 and h2 to the nearest millimetre and record the values in Fig. 6.3. [2] (ii) Read the values of V1 and V2 to the nearest cm3 and record them in Fig. 6.3. [2] (iii) Complete the third column of Fig. 6.3. [1] height h / mm volume V / cm3 (100 - V) / cm3 25 89 9 h1 = V1 = (100 - V1) = h2 = V2 = (100 – V2) = 93 60 40 113 51 49 Fig. 6.3
Question paper, page 19
19 © UCLES 2009 0653/06/M/J/09 [Turn over For Examiner's Use (b) On Fig. 6.4, plot a graph of (100 - V) against h. Draw the best straight line through the points. [2] 50 40 30 20 10 0 0 20 40 60 80 100 120 h / mm (100 – V) / cm3 Fig. 6.4 (c) (i) Use your graph to find the volume, Vw, of water between h = 30 and h = 100 mm. Show on your graph how you did this. Vw = cm3 [2]
Question paper, page 20
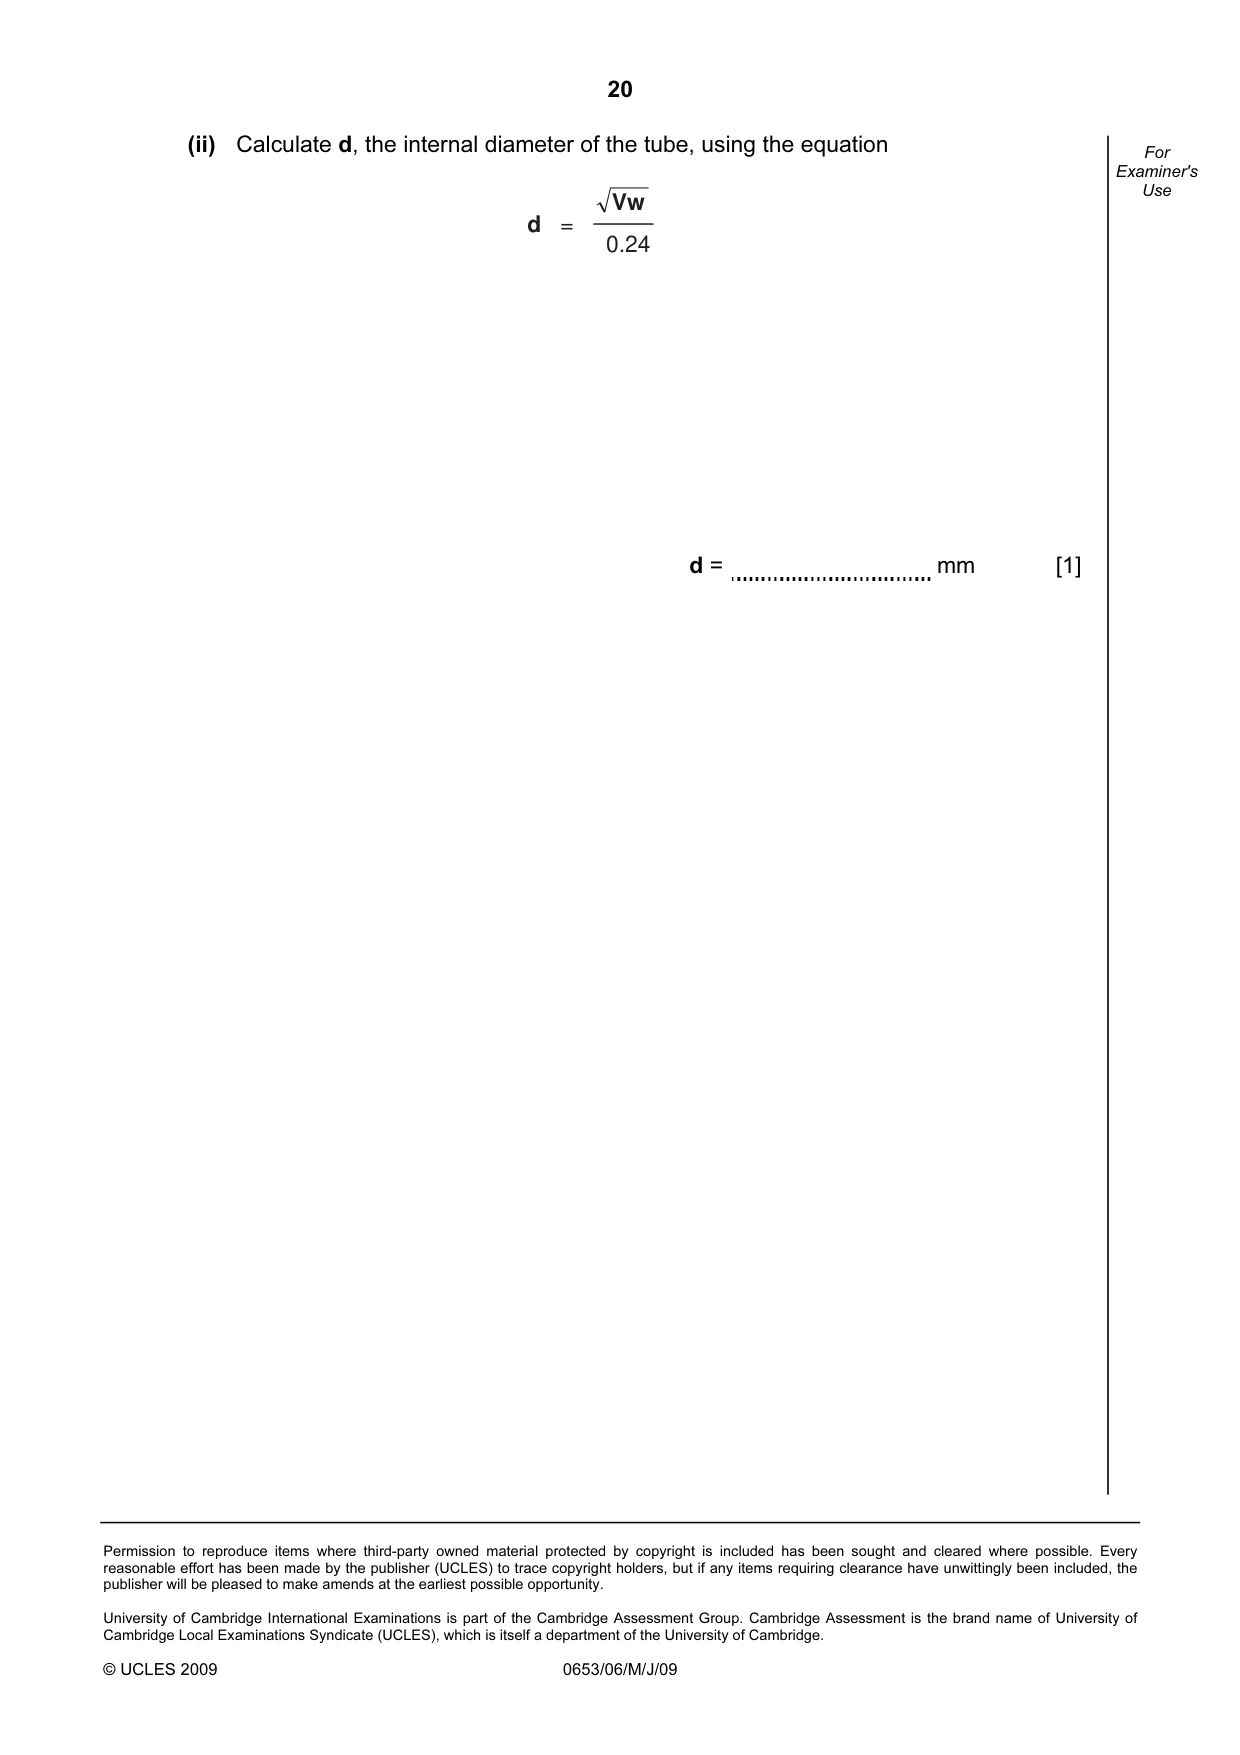
20 Permission to reproduce items where third-party owned material protected by copyright is included has been sought and cleared where possible. Every reasonable effort has been made by the publisher (UCLES) to trace copyright holders, but if any items requiring clearance have unwittingly been included, the publisher will be pleased to make amends at the earliest possible opportunity. University of Cambridge International Examinations is part of the Cambridge Assessment Group. Cambridge Assessment is the brand name of University of Cambridge Local Examinations Syndicate (UCLES), which is itself a department of the University of Cambridge. © UCLES 2009 0653/06/M/J/09 For Examiner's Use (ii) Calculate d, the internal diameter of the tube, using the equation Vw 0.24 d = d = mm [1]
Mark scheme, page 1
UNIVERSITY OF CAMBRIDGE INTERNATIONAL EXAMINATIONS International General Certificate of Secondary Education MARK SCHEME for the May/June 2009 question paper for the guidance of teachers 0653/0654 COMBINED SCIENCE 0653/06 and 0654/06 Paper 6 (Alternative to Practical), maximum raw mark 60 This mark scheme is published as an aid to teachers and candidates, to indicate the requirements of the examination. It shows the basis on which Examiners were instructed to award marks. It does not indicate the details of the discussions that took place at an Examiners’ meeting before marking began, which would have considered the acceptability of alternative answers. Mark schemes must be read in conjunction with the question papers and the report on the examination. • CIE will not enter into discussions or correspondence in connection with these mark schemes. CIE is publishing the mark schemes for the May/June 2009 question papers for most IGCSE, GCE Advanced Level and Advanced Subsidiary Level syllabuses and some Ordinary Level syllabuses. www.XtremePapers.com
Mark scheme, page 2
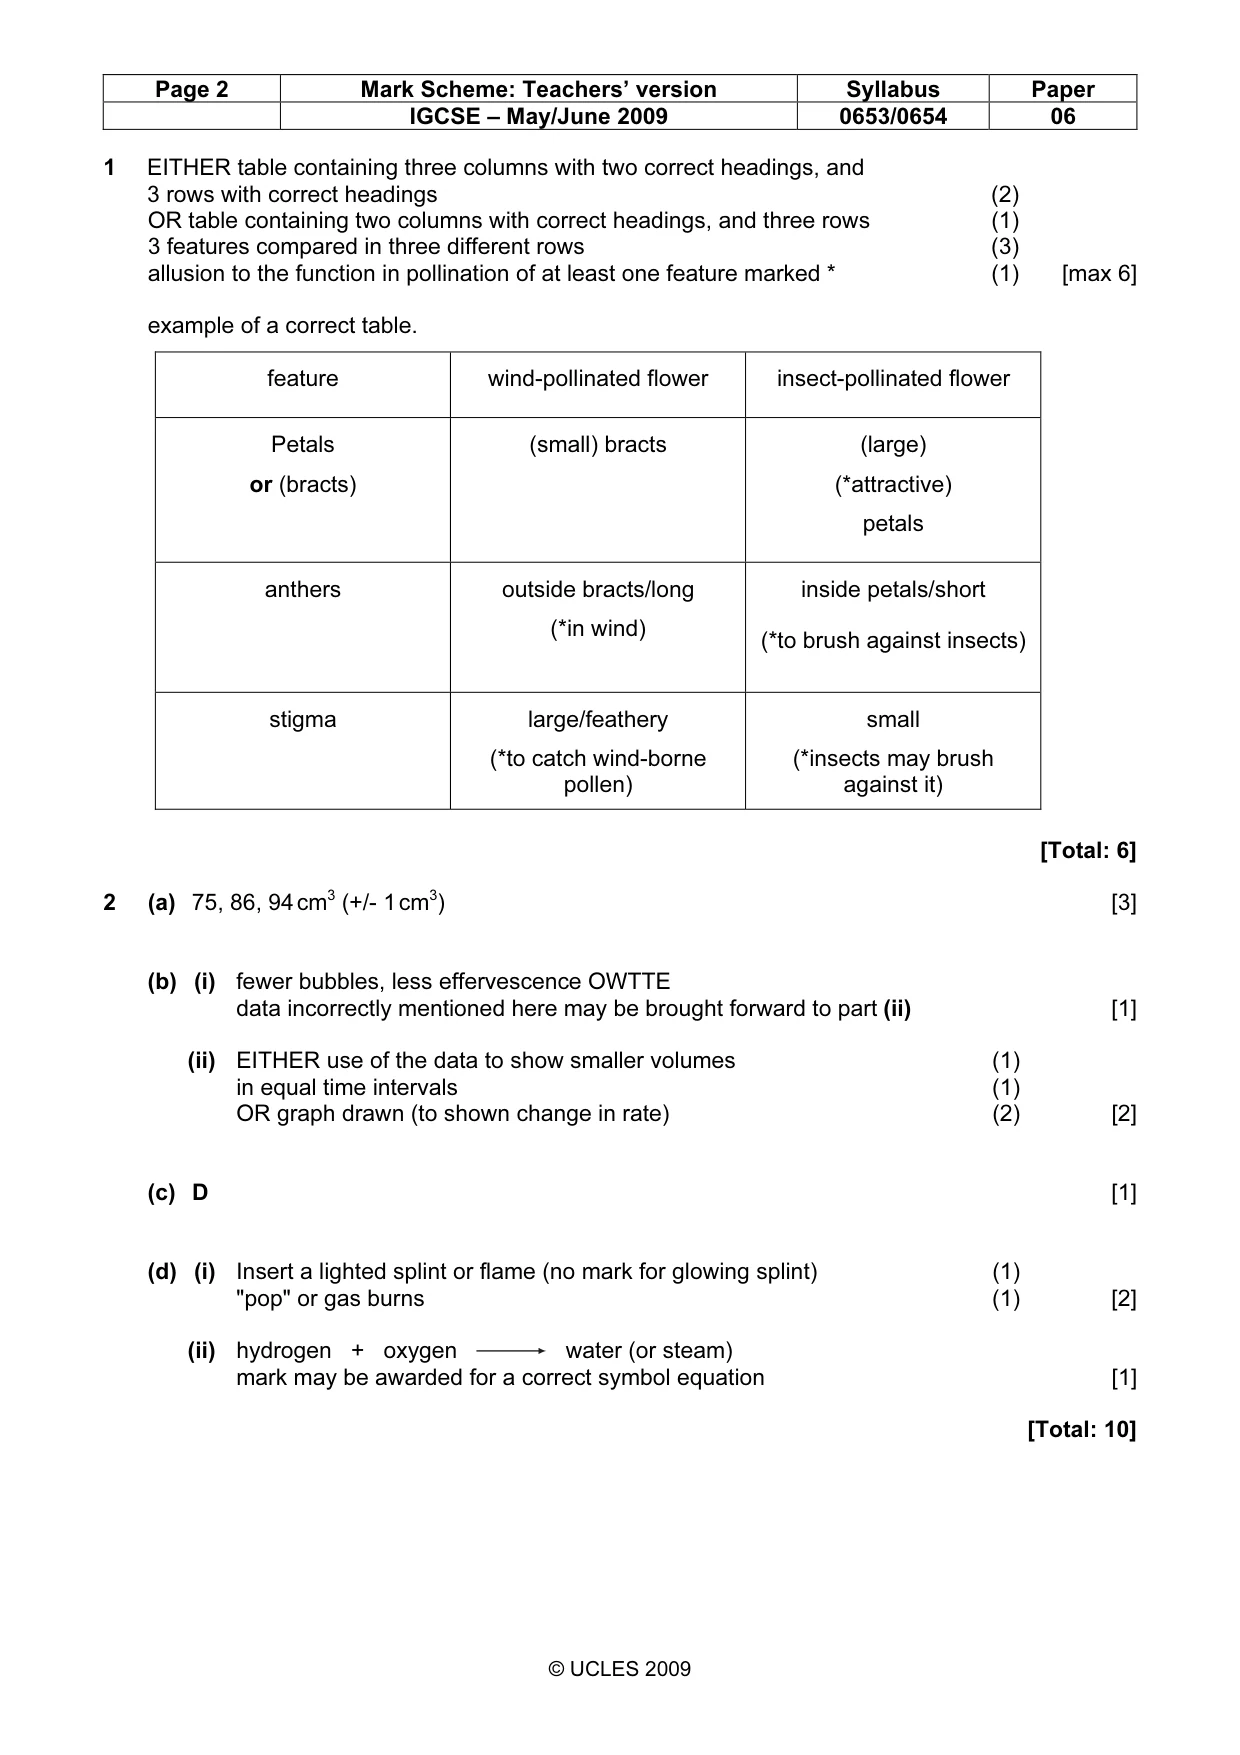
Page 2 Mark Scheme: Teachers’ version Syllabus Paper IGCSE – May/June 2009 0653/0654 06 © UCLES 2009 1 EITHER table containing three columns with two correct headings, and 3 rows with correct headings (2) OR table containing two columns with correct headings, and three rows (1) 3 features compared in three different rows (3) allusion to the function in pollination of at least one feature marked * (1) [max 6] example of a correct table. feature wind-pollinated flower insect-pollinated flower Petals or (bracts) (small) bracts (large) (*attractive) petals anthers outside bracts/long (*in wind) inside petals/short (*to brush against insects) stigma large/feathery (*to catch wind-borne pollen) small (*insects may brush against it) [Total: 6] 2 (a) 75, 86, 94 cm3 (+/- 1 cm3) [3] (b) (i) fewer bubbles, less effervescence OWTTE data incorrectly mentioned here may be brought forward to part (ii) [1] (ii) EITHER use of the data to show smaller volumes (1) in equal time intervals (1) OR graph drawn (to shown change in rate) (2) [2] (c) D [1] (d) (i) Insert a lighted splint or flame (no mark for glowing splint) (1) "pop" or gas burns (1) [2] (ii) hydrogen + oxygen water (or steam) mark may be awarded for a correct symbol equation [1] [Total: 10]
Mark scheme, page 3
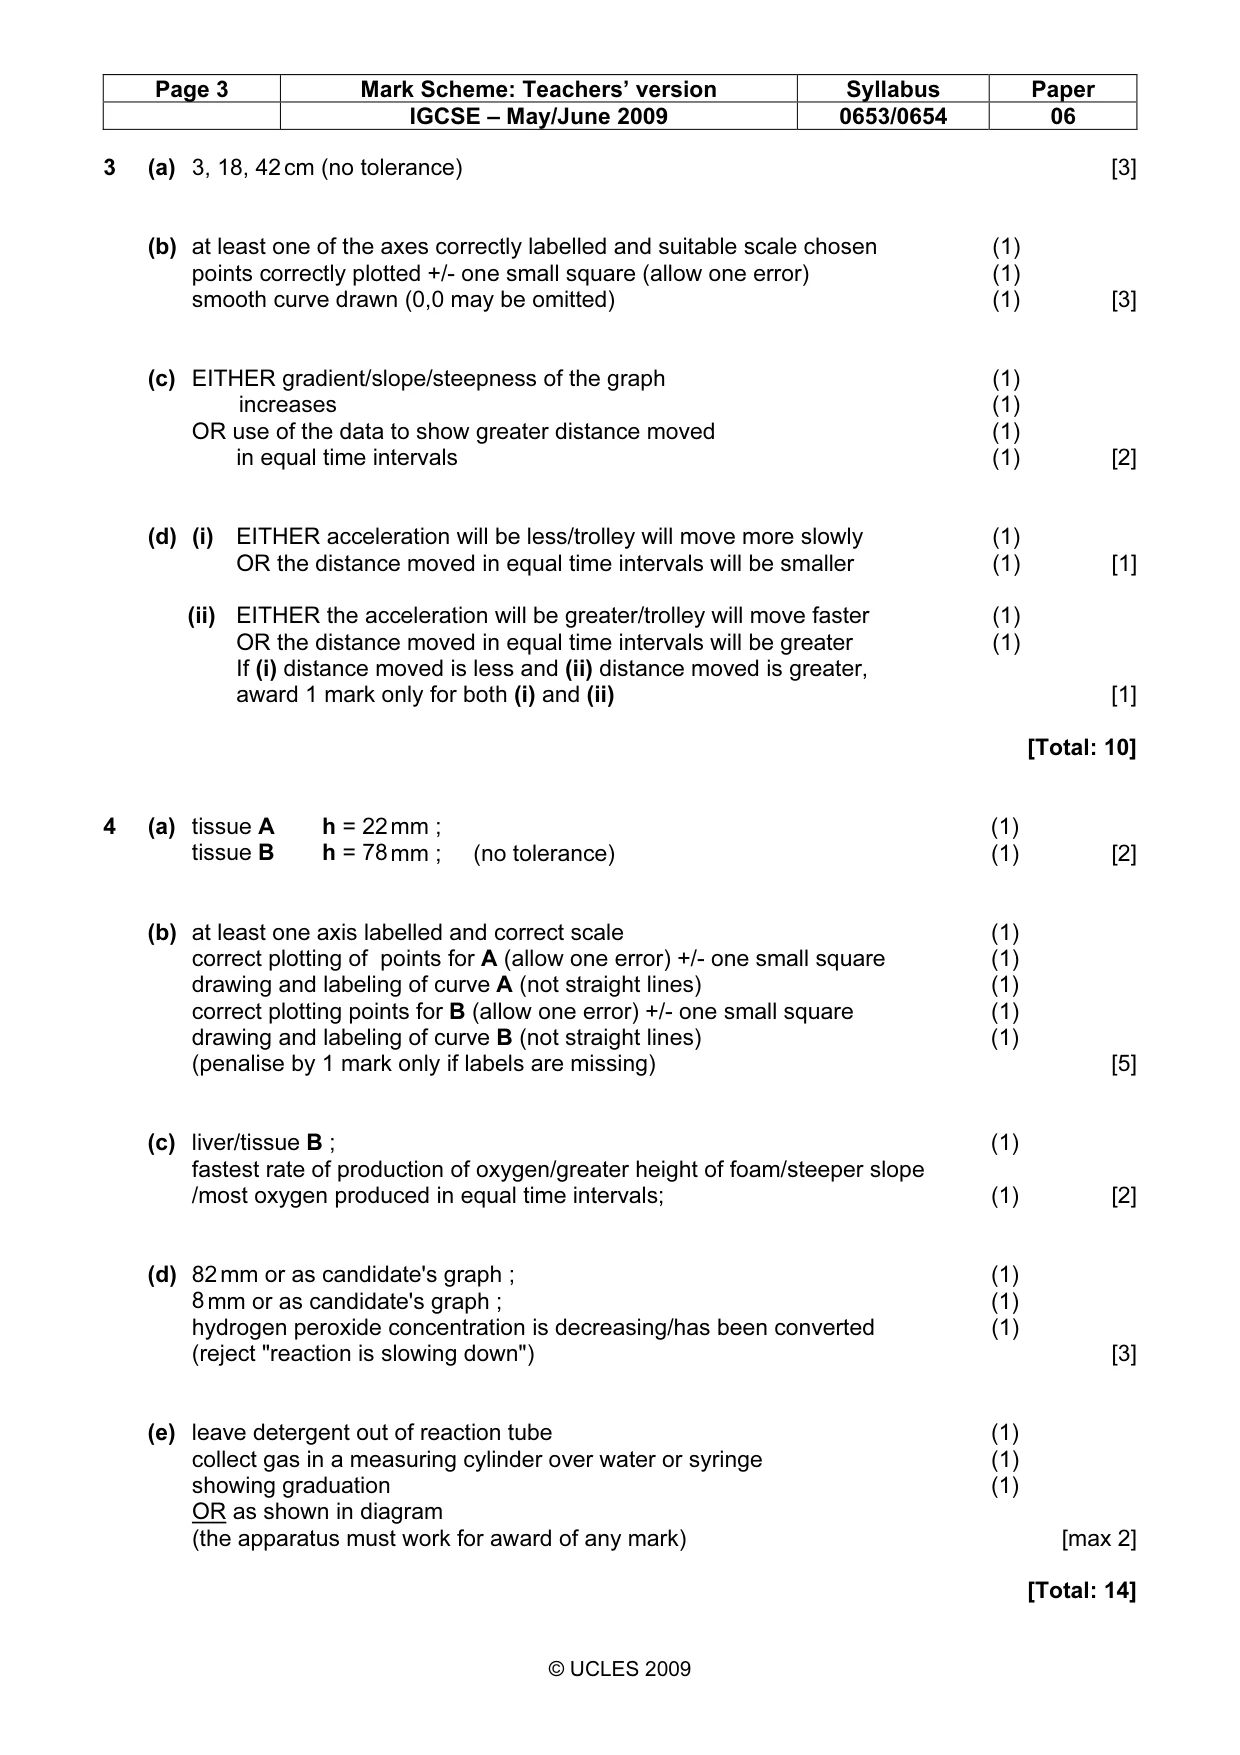
Page 3 Mark Scheme: Teachers’ version Syllabus Paper IGCSE – May/June 2009 0653/0654 06 © UCLES 2009 3 (a) 3, 18, 42 cm (no tolerance) [3] (b) at least one of the axes correctly labelled and suitable scale chosen (1) points correctly plotted +/- one small square (allow one error) (1) smooth curve drawn (0,0 may be omitted) (1) [3] (c) EITHER gradient/slope/steepness of the graph (1) increases (1) OR use of the data to show greater distance moved (1) in equal time intervals (1) [2] (d) (i) EITHER acceleration will be less/trolley will move more slowly (1) OR the distance moved in equal time intervals will be smaller (1) [1] (ii) EITHER the acceleration will be greater/trolley will move faster (1) OR the distance moved in equal time intervals will be greater (1) If (i) distance moved is less and (ii) distance moved is greater, award 1 mark only for both (i) and (ii) [1] [Total: 10] 4 (a) tissue A h = 22 mm ; (1) tissue B h = 78 mm ; (no tolerance) (1) [2] (b) at least one axis labelled and correct scale (1) correct plotting of points for A (allow one error) +/- one small square (1) drawing and labeling of curve A (not straight lines) (1) correct plotting points for B (allow one error) +/- one small square (1) drawing and labeling of curve B (not straight lines) (1) (penalise by 1 mark only if labels are missing) [5] (c) liver/tissue B ; (1) fastest rate of production of oxygen/greater height of foam/steeper slope /most oxygen produced in equal time intervals; (1) [2] (d) 82 mm or as candidate's graph ; (1) 8 mm or as candidate's graph ; (1) hydrogen peroxide concentration is decreasing/has been converted (1) (reject "reaction is slowing down") [3] (e) leave detergent out of reaction tube (1) collect gas in a measuring cylinder over water or syringe (1) showing graduation (1) OR as shown in diagram (the apparatus must work for award of any mark) [max 2] [Total: 14]
Mark scheme, page 4
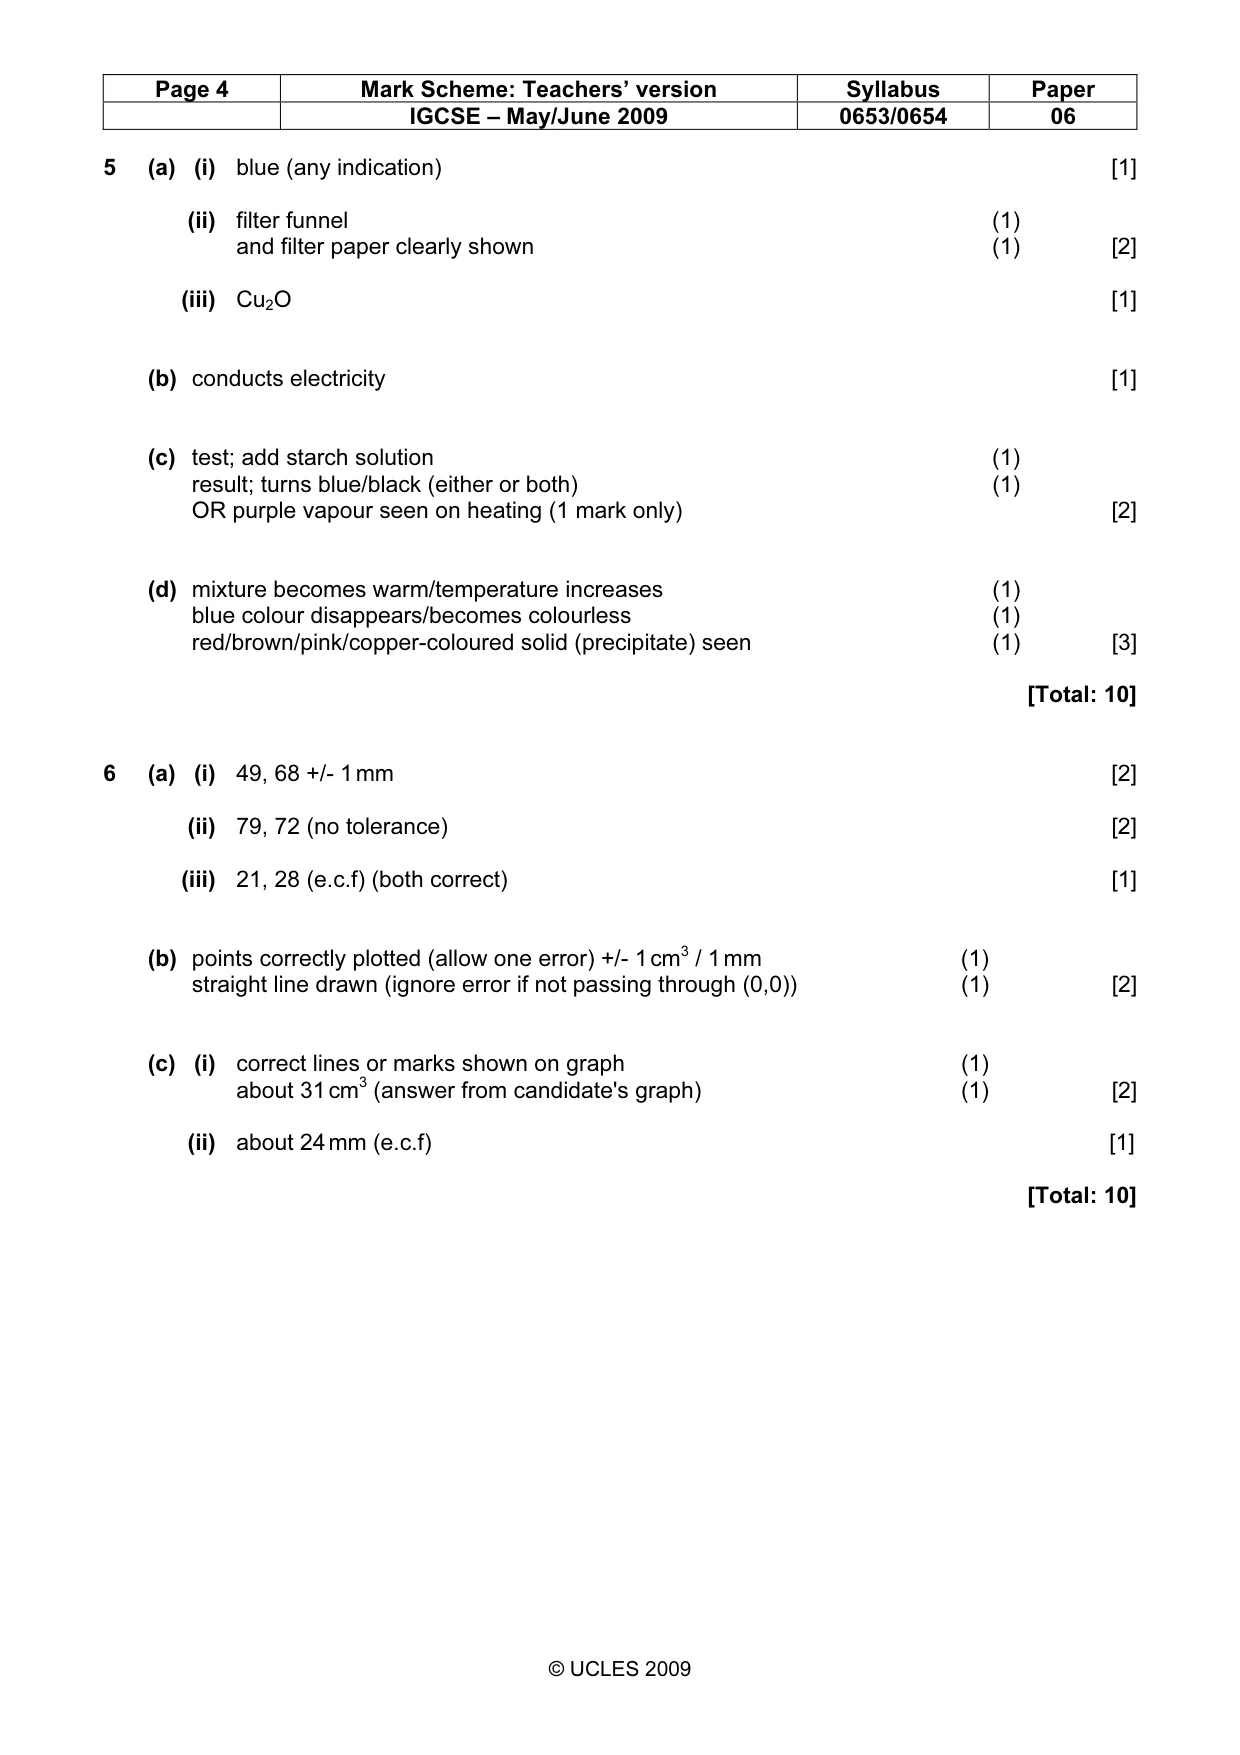
Page 4 Mark Scheme: Teachers’ version Syllabus Paper IGCSE – May/June 2009 0653/0654 06 © UCLES 2009 5 (a) (i) blue (any indication) [1] (ii) filter funnel (1) and filter paper clearly shown (1) [2] (iii) Cu2O [1] (b) conducts electricity [1] (c) test; add starch solution (1) result; turns blue/black (either or both) (1) OR purple vapour seen on heating (1 mark only) [2] (d) mixture becomes warm/temperature increases (1) blue colour disappears/becomes colourless (1) red/brown/pink/copper-coloured solid (precipitate) seen (1) [3] [Total: 10] 6 (a) (i) 49, 68 +/- 1 mm [2] (ii) 79, 72 (no tolerance) [2] (iii) 21, 28 (e.c.f) (both correct) [1] (b) points correctly plotted (allow one error) +/- 1 cm3 / 1 mm (1) straight line drawn (ignore error if not passing through (0,0)) (1) [2] (c) (i) correct lines or marks shown on graph (1) about 31 cm3 (answer from candidate's graph) (1) [2] (ii) about 24 mm (e.c.f) [1] [Total: 10]
What you needed in this session
Cambridge’s own grade thresholds for 2009 May/June, Paper 6 · Variant 1. A higher threshold means an easier paper — the bar moves with how the cohort did.