Cambridge IGCSE Sciences - Co-ordinated (Double) 0654 — 2008 May/June Paper 6 · Variant 1
0654/61/M/J/08 · 60 marks · ≈68 min
The question paper and its mark scheme, free to read here and free to download. This is Cambridge’s own paper, exactly as it was sat.
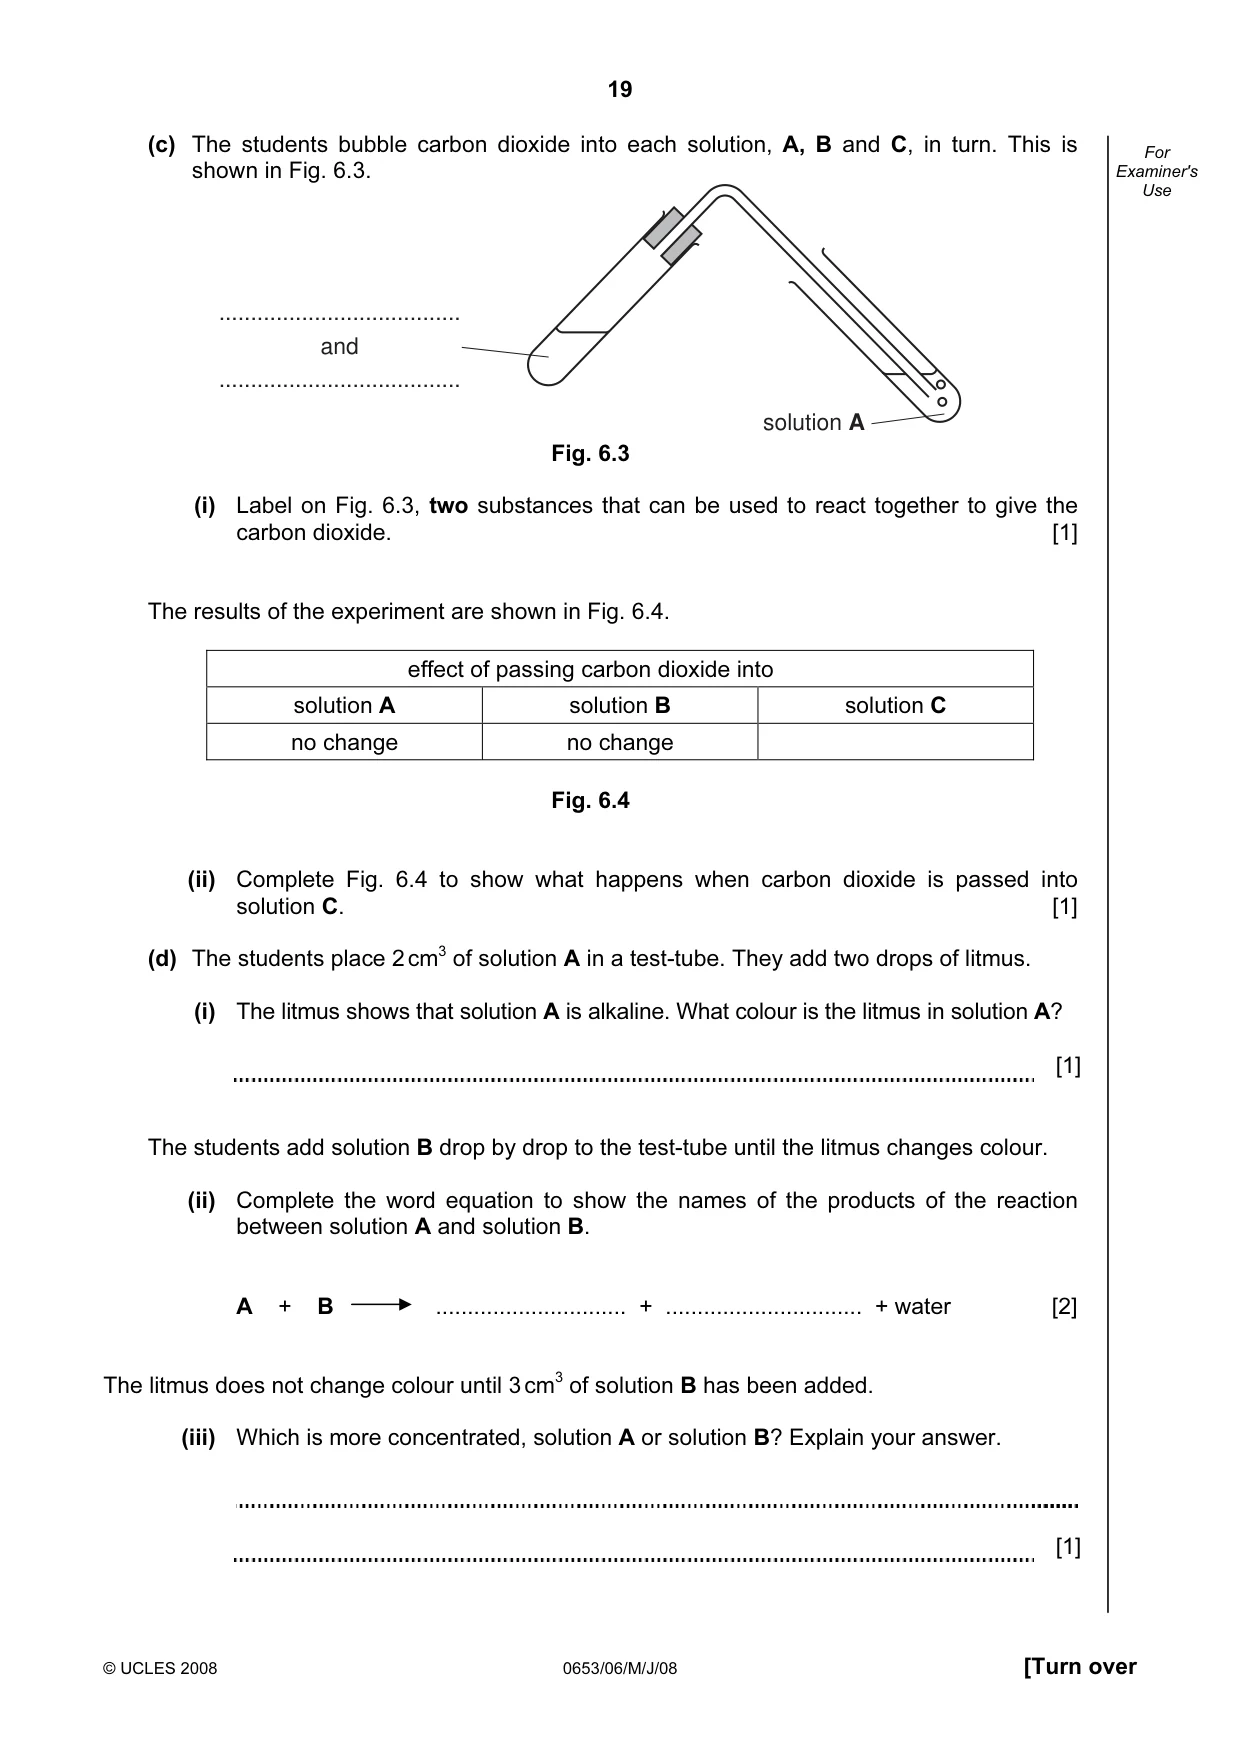
Question paper20 pages


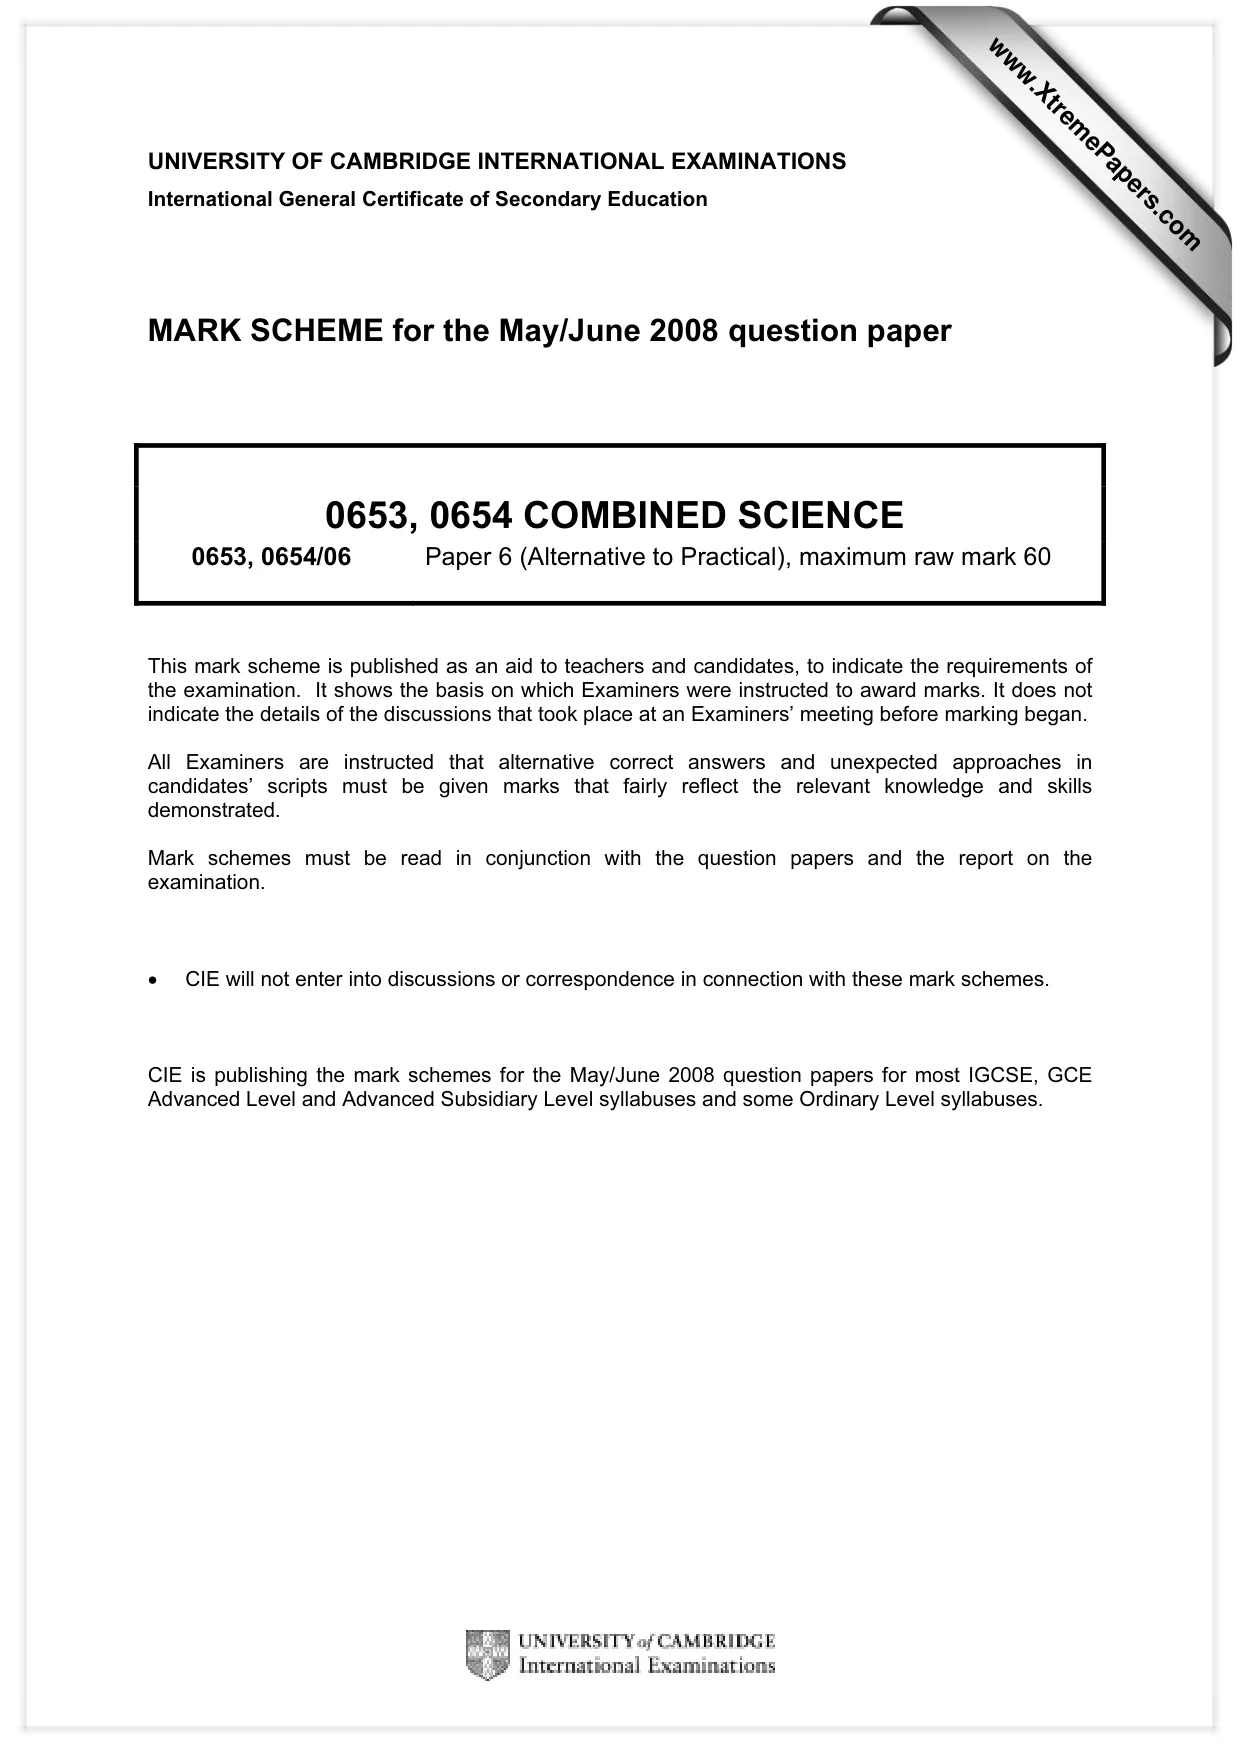
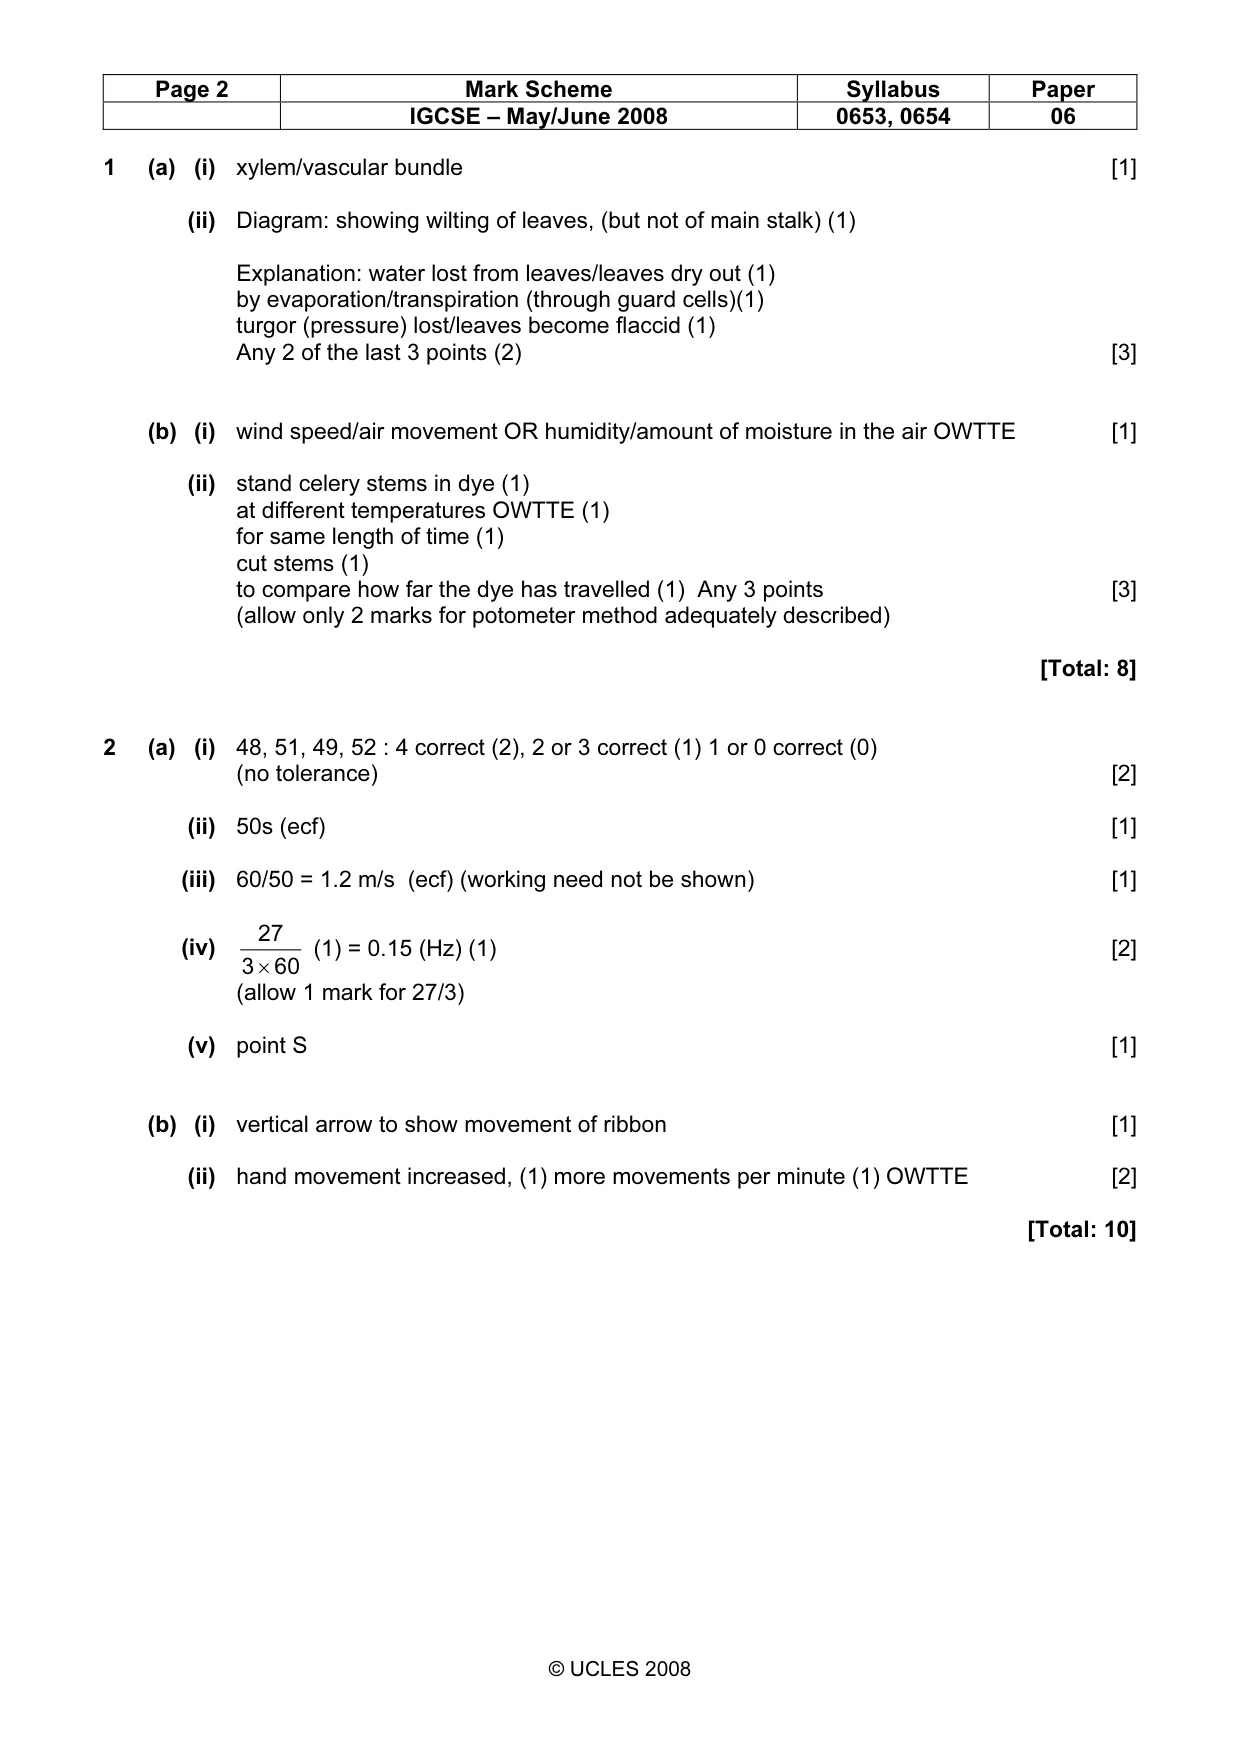
Mark scheme4 pages
Answers below. Sit the paper first if you are practising.
Paper as text
Question paper, page 1
This document consists of 17 printed pages and 3 blank pages. IB08 06_0653_06/3RP © UCLES 2008 [Turn over *9662530651* For Examiner's Use 1 2 3 4 5 6 Total UNIVERSITY OF CAMBRIDGE INTERNATIONAL EXAMINATIONS International General Certificate of Secondary Education COMBINED SCIENCE 0653/06 CO-ORDINATED SCIENCES 0654/06 Paper 6 Alternative to Practical May/June 2008 1 hour Candidates answer on the Question paper Additional Materials: No Additional Materials are required. READ THESE INSTRUCTIONS FIRST Write your Centre number, candidate number and name on all the work you hand in. Write in dark blue or black pen. You may use a soft pencil for any diagrams, graphs, tables or rough working. Do not use staples, paper clips, highlighters, glue or correction fluid. DO NOT WRITE IN ANY BARCODES. Answer all questions. At the end of the examination, fasten all your work securely together. The number of marks is given in brackets [ ] at the end of each question or part question. www.XtremePapers.com
Question paper, page 2
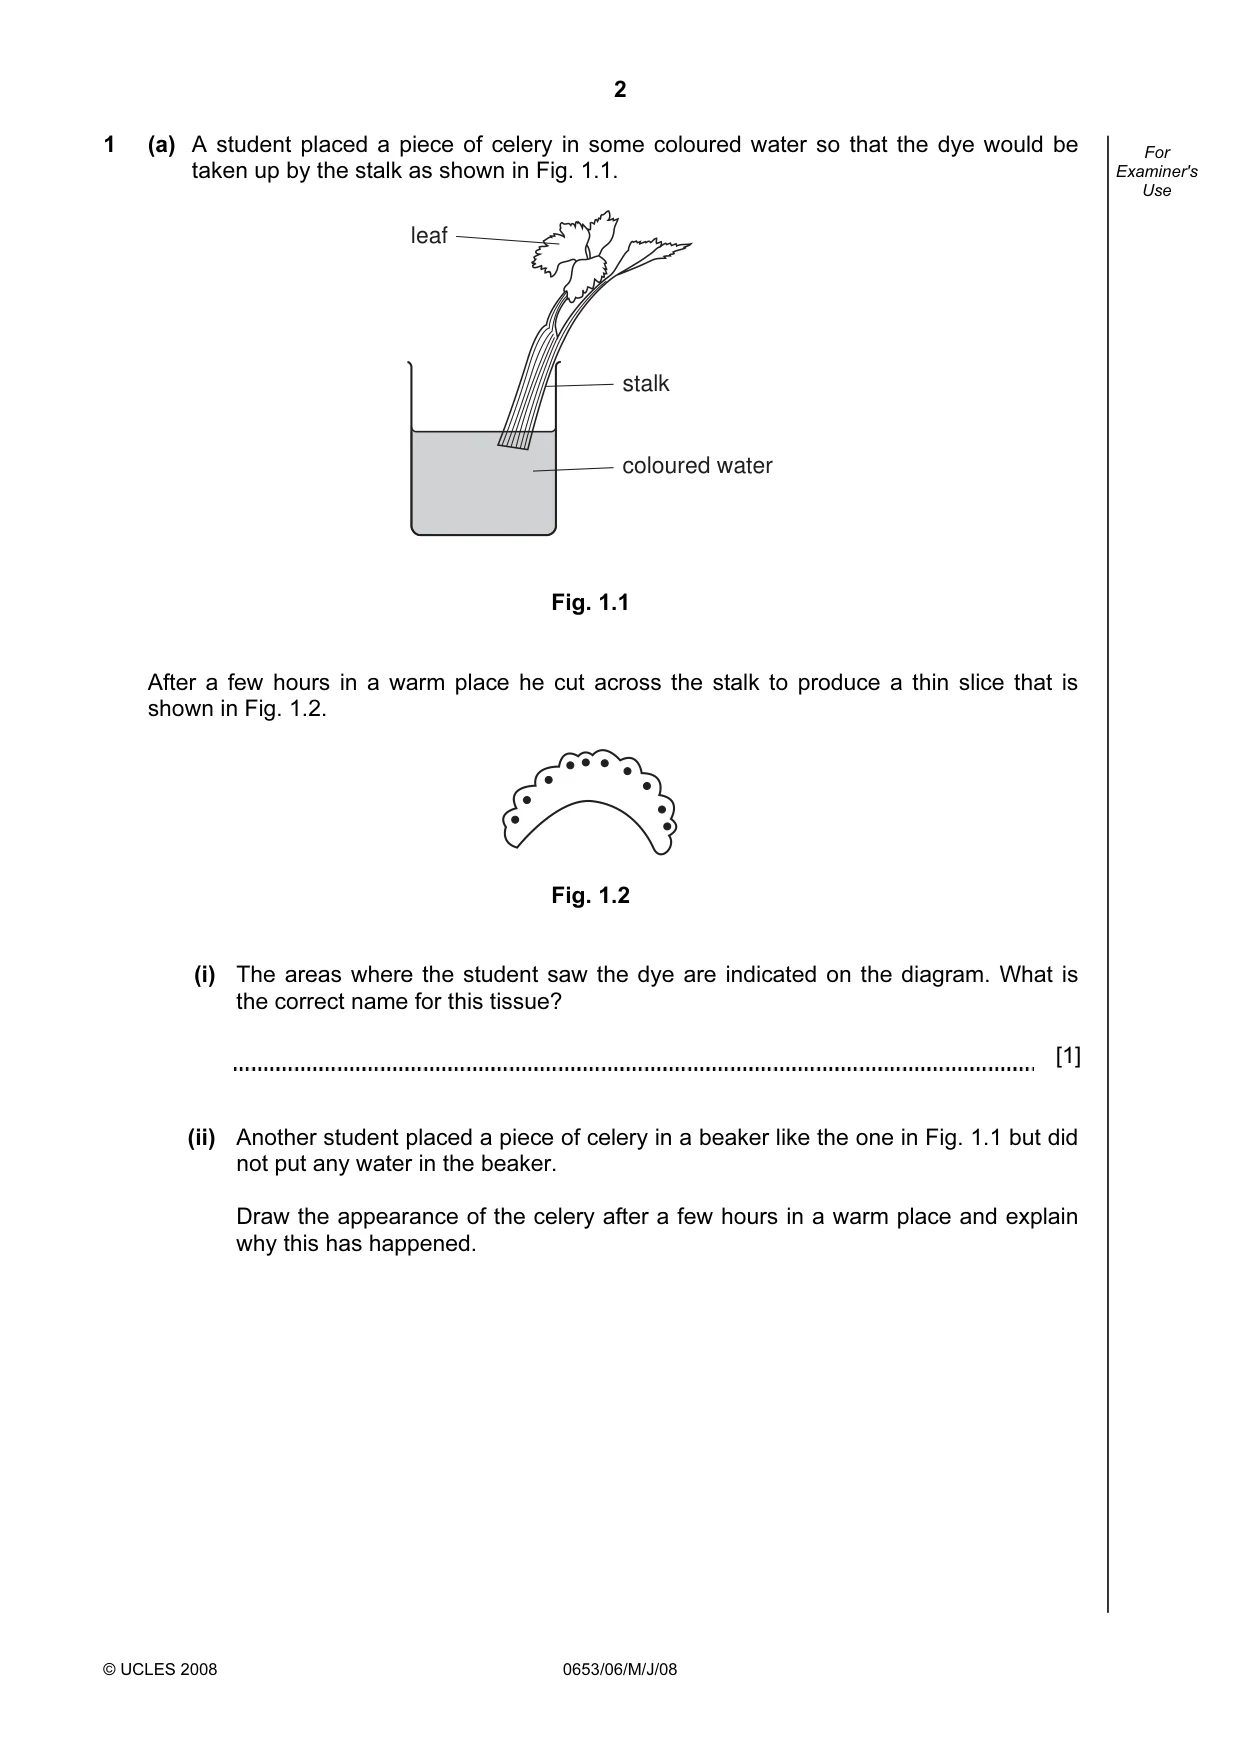
2 © UCLES 2008 0653/06/M/J/08 For Examiner's Use 1 (a) A student placed a piece of celery in some coloured water so that the dye would be taken up by the stalk as shown in Fig. 1.1. leaf stalk coloured water Fig. 1.1 After a few hours in a warm place he cut across the stalk to produce a thin slice that is shown in Fig. 1.2. Fig. 1.2 (i) The areas where the student saw the dye are indicated on the diagram. What is the correct name for this tissue? [1] (ii) Another student placed a piece of celery in a beaker like the one in Fig. 1.1 but did not put any water in the beaker. Draw the appearance of the celery after a few hours in a warm place and explain why this has happened.
Question paper, page 3
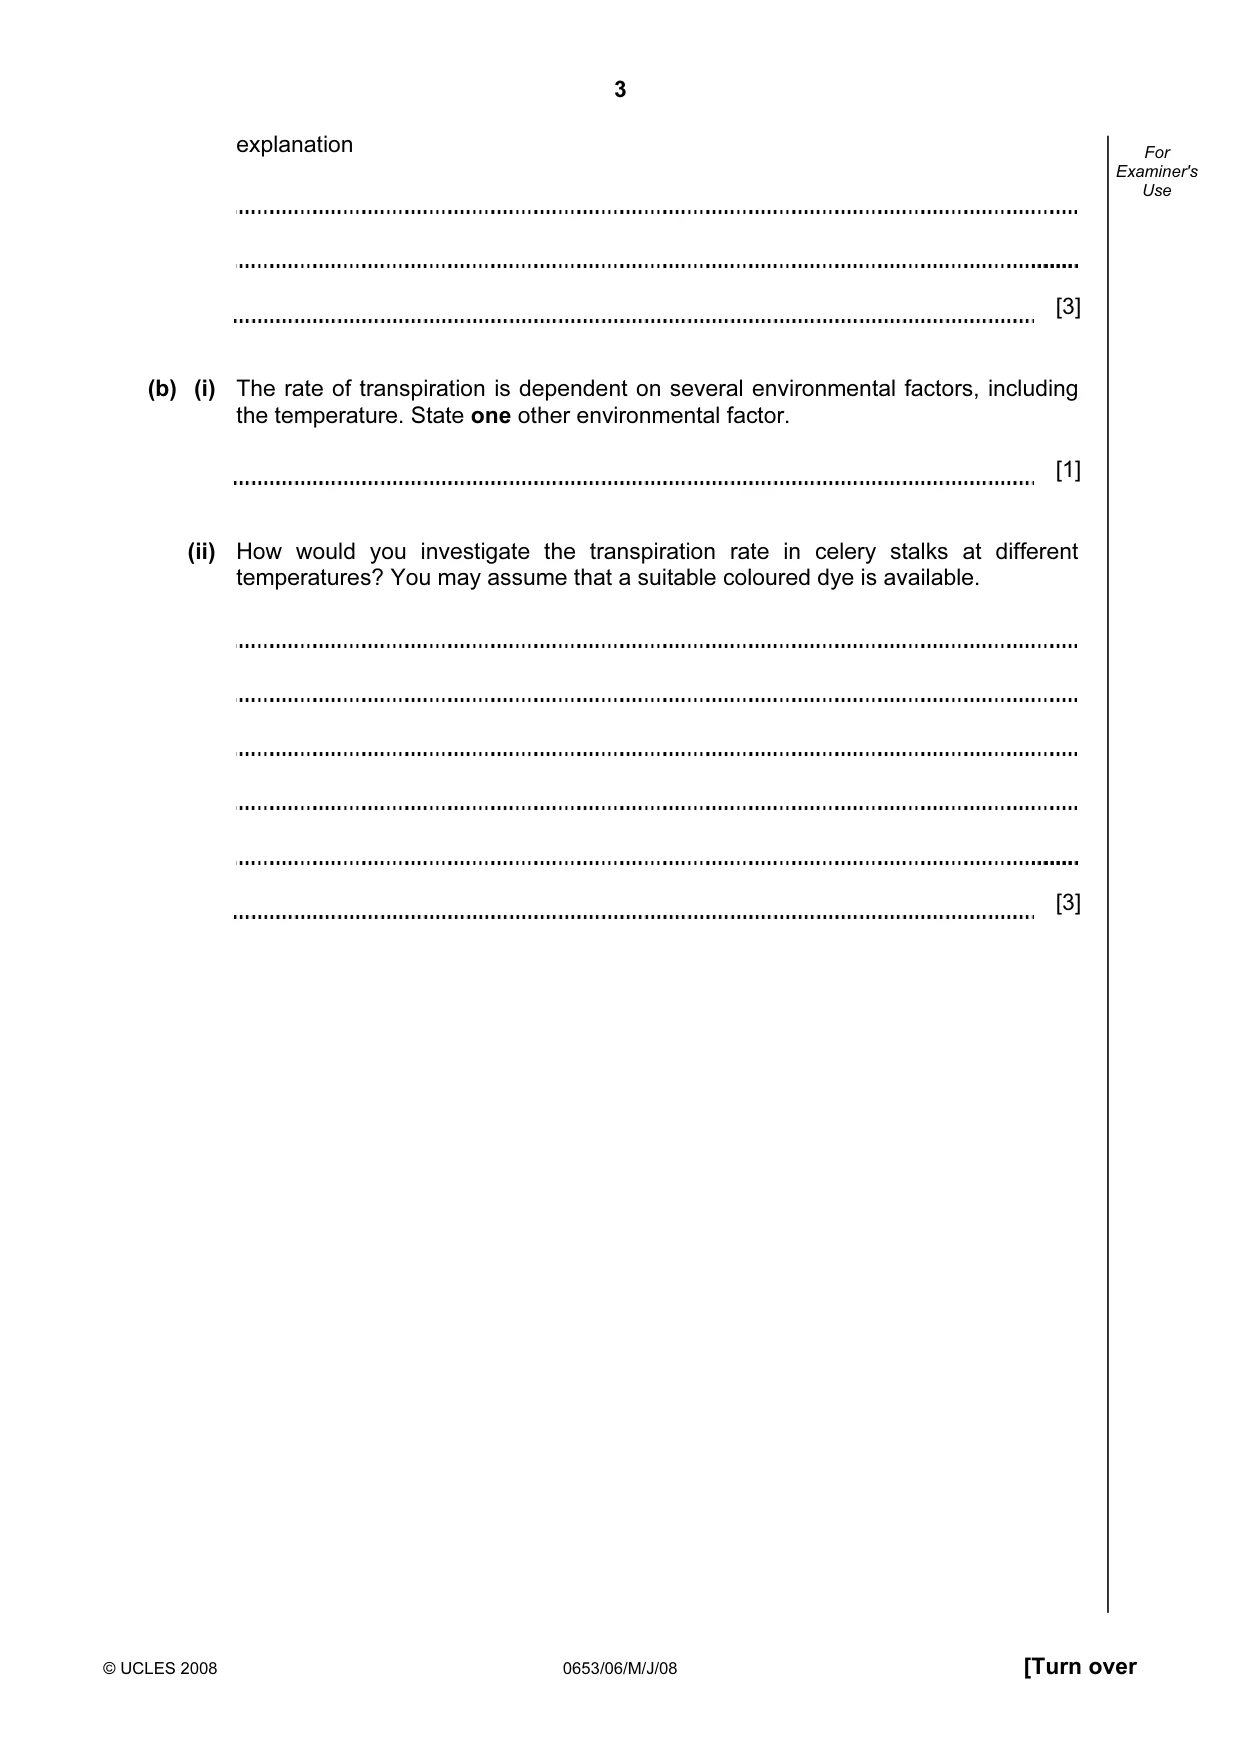
3 © UCLES 2008 0653/06/M/J/08 [Turn over For Examiner's Use explanation [3] (b) (i) The rate of transpiration is dependent on several environmental factors, including the temperature. State one other environmental factor. [1] (ii) How would you investigate the transpiration rate in celery stalks at different temperatures? You may assume that a suitable coloured dye is available. [3]
Question paper, page 4
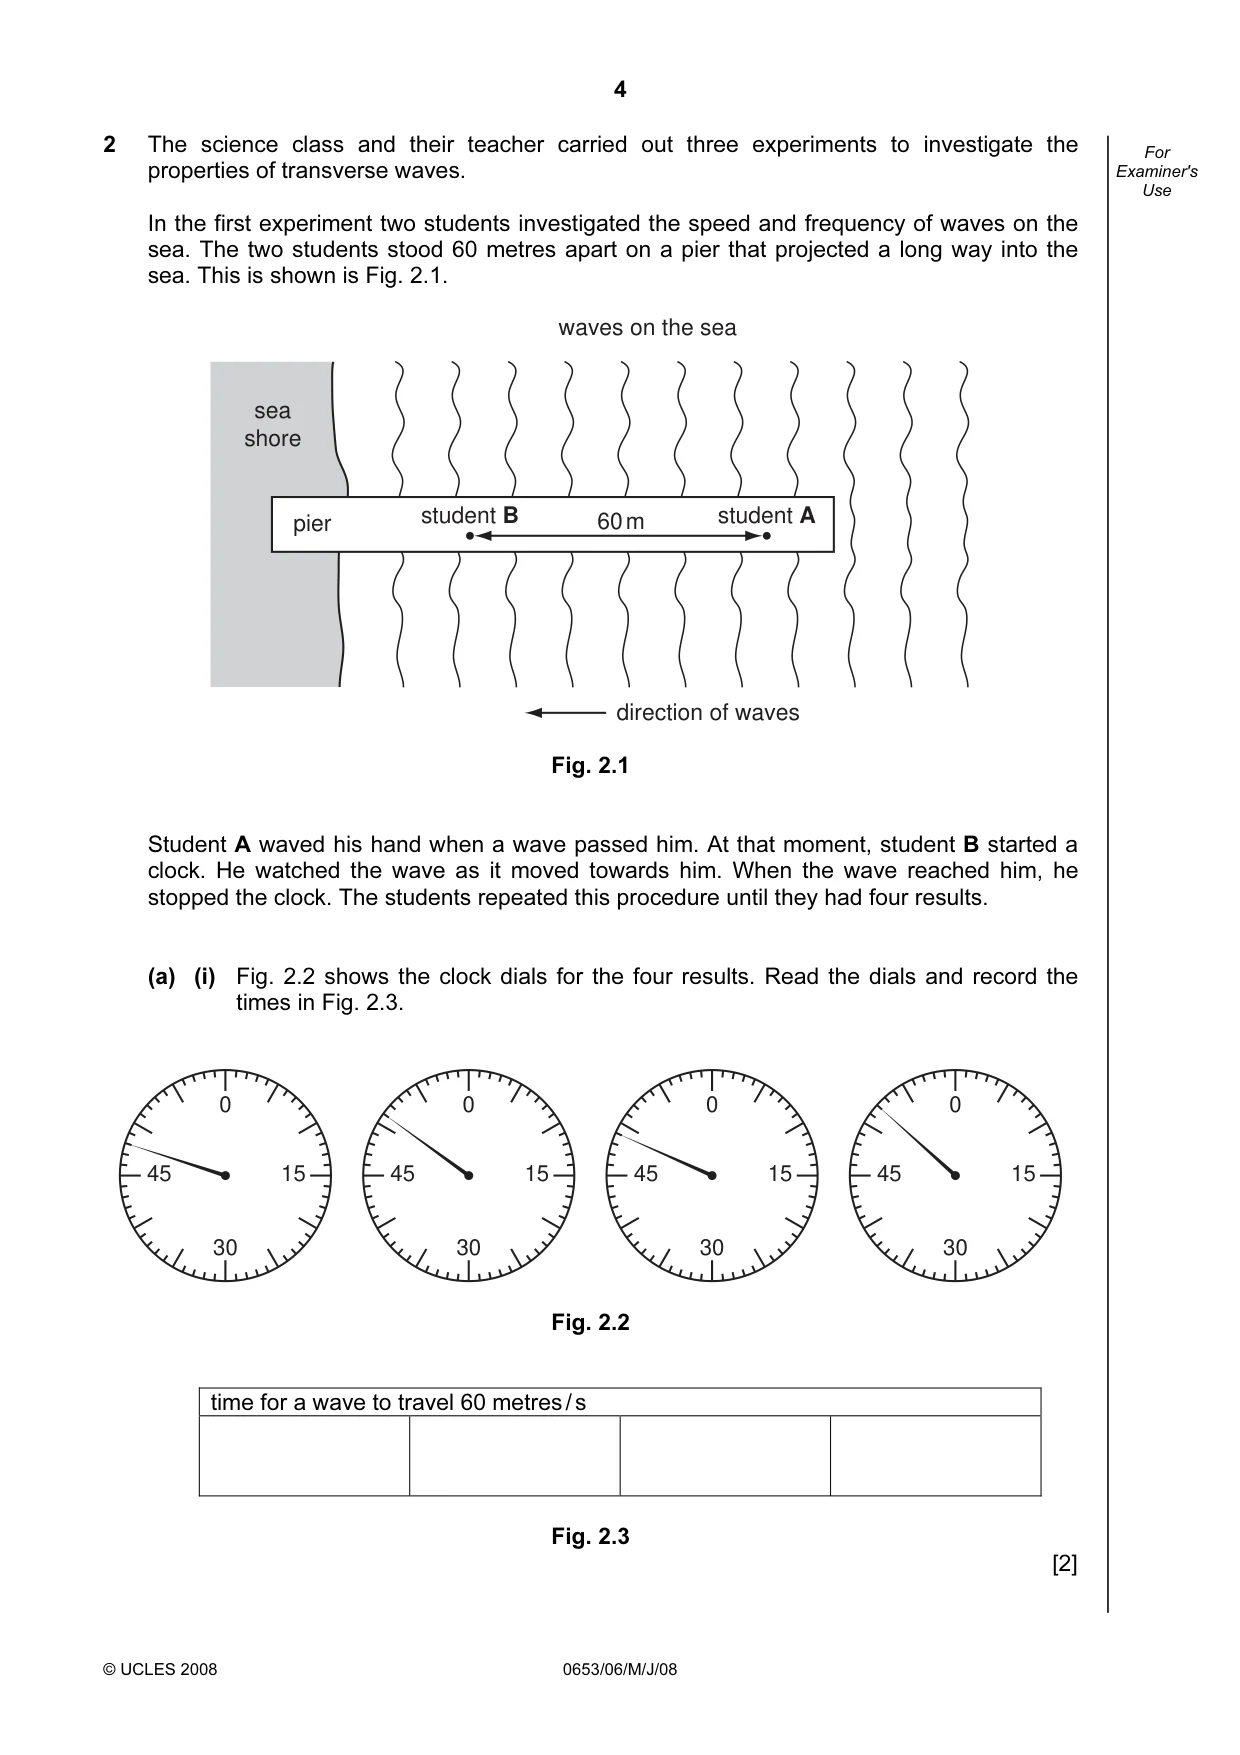
4 © UCLES 2008 0653/06/M/J/08 For Examiner's Use 2 The science class and their teacher carried out three experiments to investigate the properties of transverse waves. In the first experiment two students investigated the speed and frequency of waves on the sea. The two students stood 60 metres apart on a pier that projected a long way into the sea. This is shown is Fig. 2.1. sea shore pier waves on the sea direction of waves student B student A 60 m Fig. 2.1 Student A waved his hand when a wave passed him. At that moment, student B started a clock. He watched the wave as it moved towards him. When the wave reached him, he stopped the clock. The students repeated this procedure until they had four results. (a) (i) Fig. 2.2 shows the clock dials for the four results. Read the dials and record the times in Fig. 2.3. 0 30 45 15 0 30 45 15 0 30 45 15 0 30 45 15 Fig. 2.2 time for a wave to travel 60 metres / s Fig. 2.3 [2]
Question paper, page 5
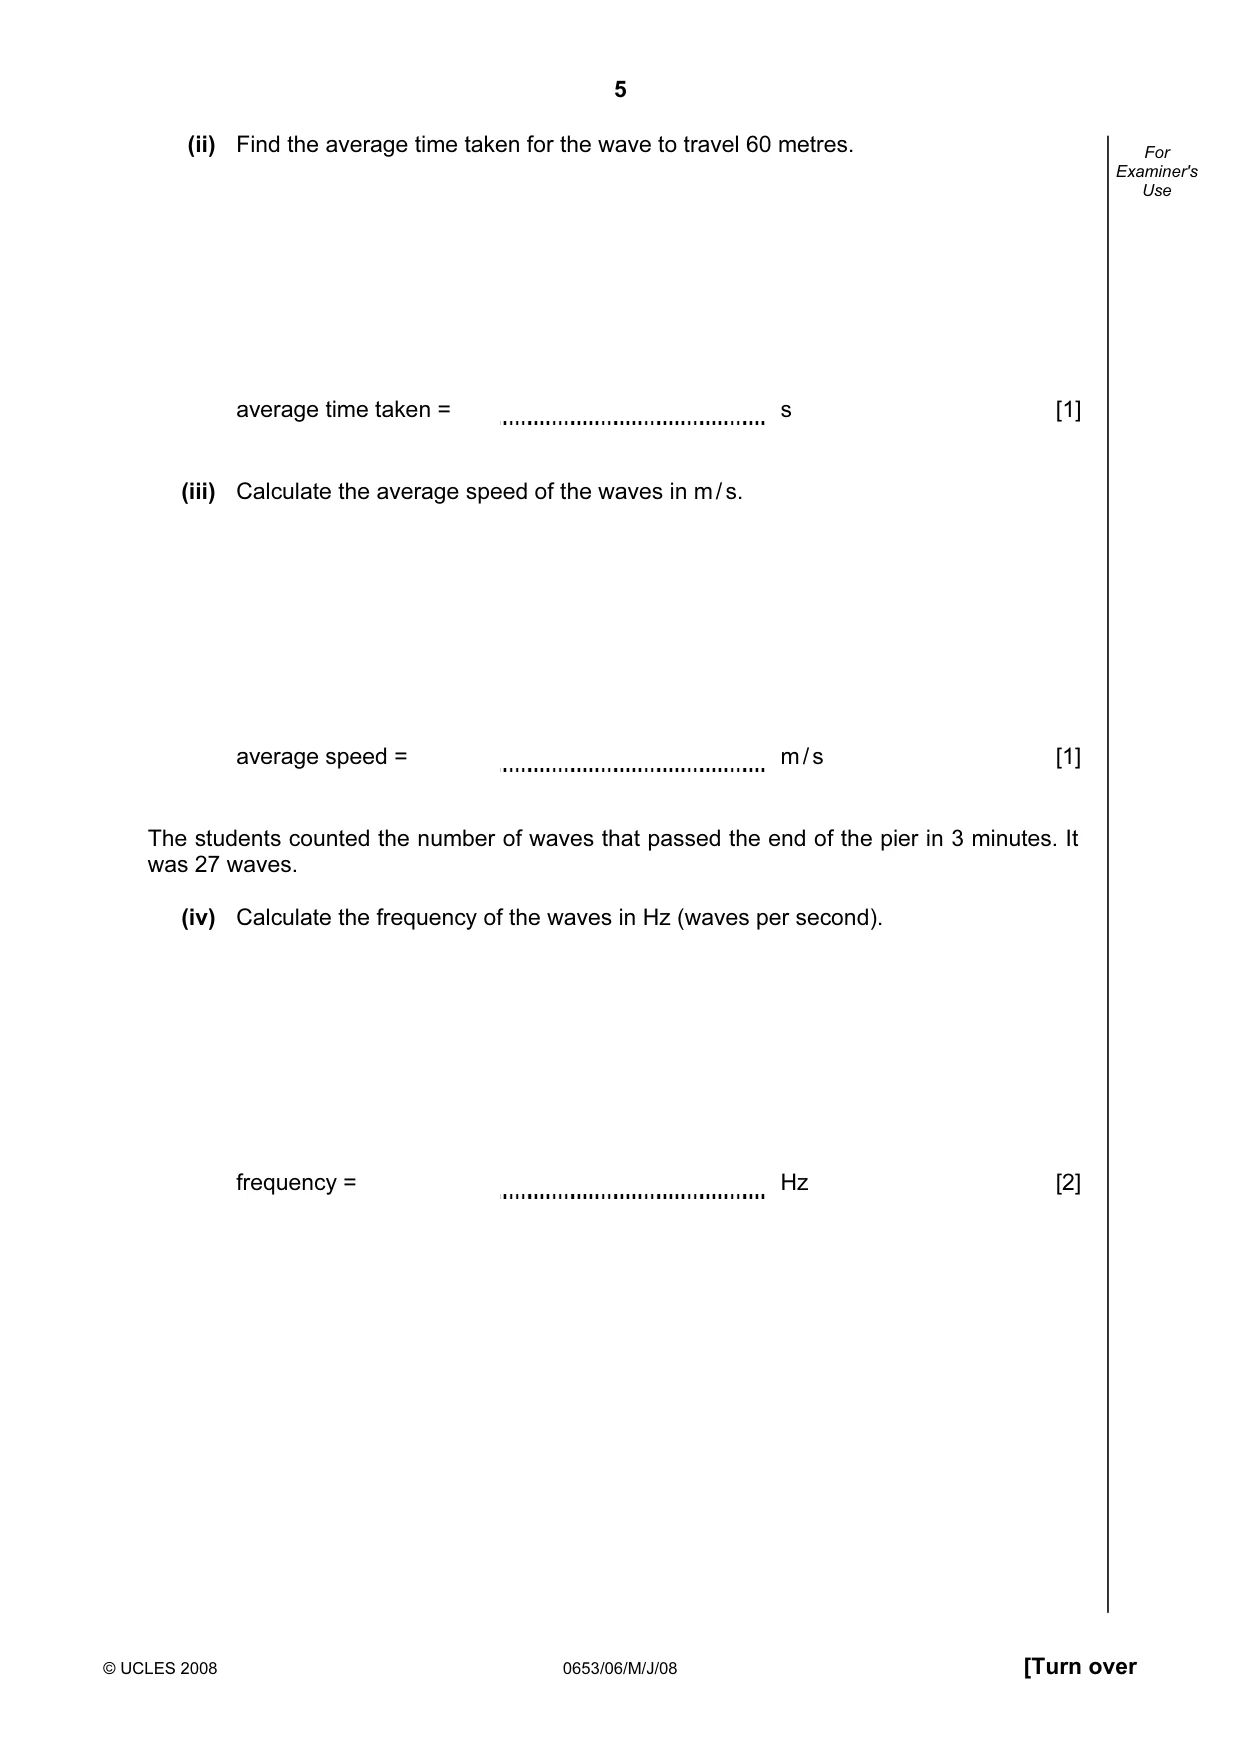
5 © UCLES 2008 0653/06/M/J/08 [Turn over For Examiner's Use (ii) Find the average time taken for the wave to travel 60 metres. average time taken = s [1] (iii) Calculate the average speed of the waves in m / s. average speed = m / s [1] The students counted the number of waves that passed the end of the pier in 3 minutes. It was 27 waves. (iv) Calculate the frequency of the waves in Hz (waves per second). frequency = Hz [2]
Question paper, page 6
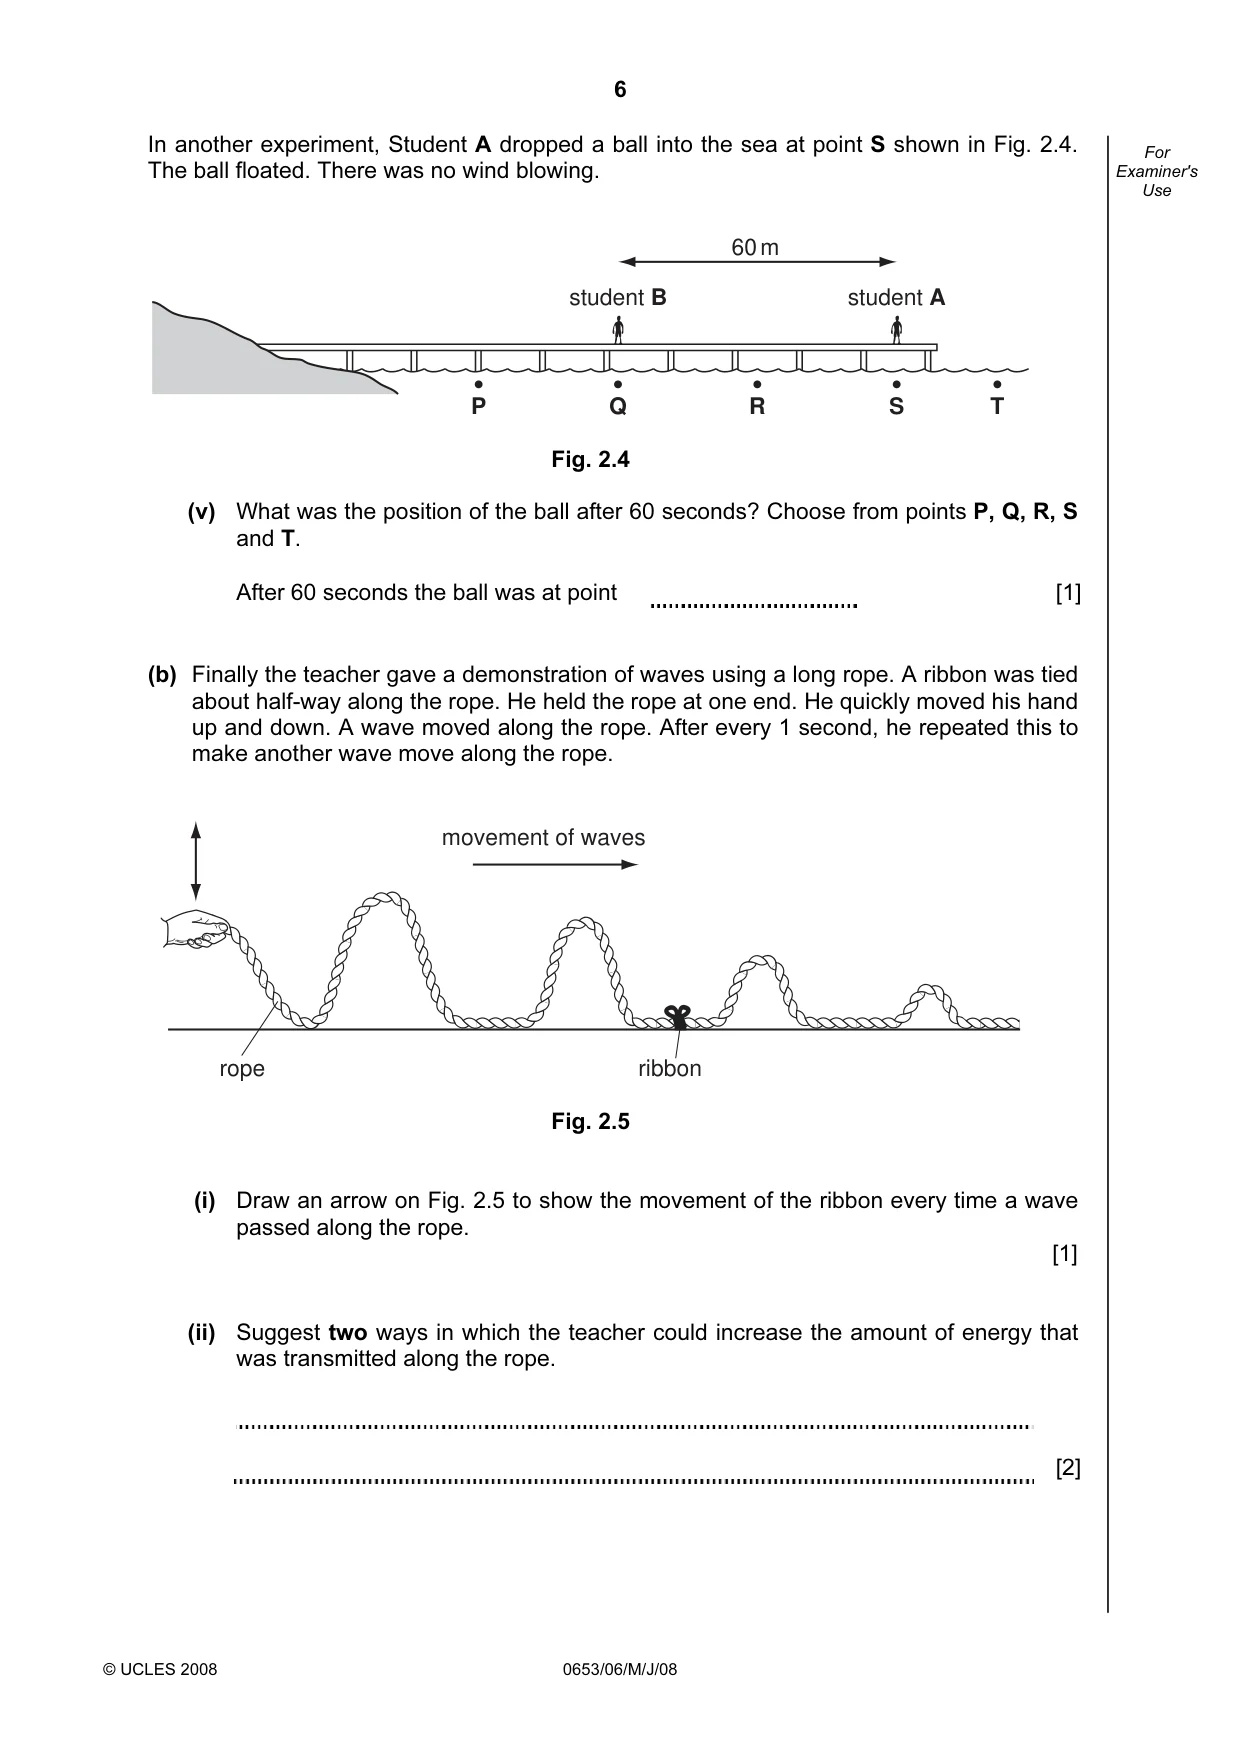
6 © UCLES 2008 0653/06/M/J/08 For Examiner's Use In another experiment, Student A dropped a ball into the sea at point S shown in Fig. 2.4. The ball floated. There was no wind blowing. 60 m student A student B S T R Q P Fig. 2.4 (v) What was the position of the ball after 60 seconds? Choose from points P, Q, R, S and T. After 60 seconds the ball was at point [1] (b) Finally the teacher gave a demonstration of waves using a long rope. A ribbon was tied about half-way along the rope. He held the rope at one end. He quickly moved his hand up and down. A wave moved along the rope. After every 1 second, he repeated this to make another wave move along the rope. rope ribbon movement of waves Fig. 2.5 (i) Draw an arrow on Fig. 2.5 to show the movement of the ribbon every time a wave passed along the rope. [1] (ii) Suggest two ways in which the teacher could increase the amount of energy that was transmitted along the rope. [2]
Question paper, page 8
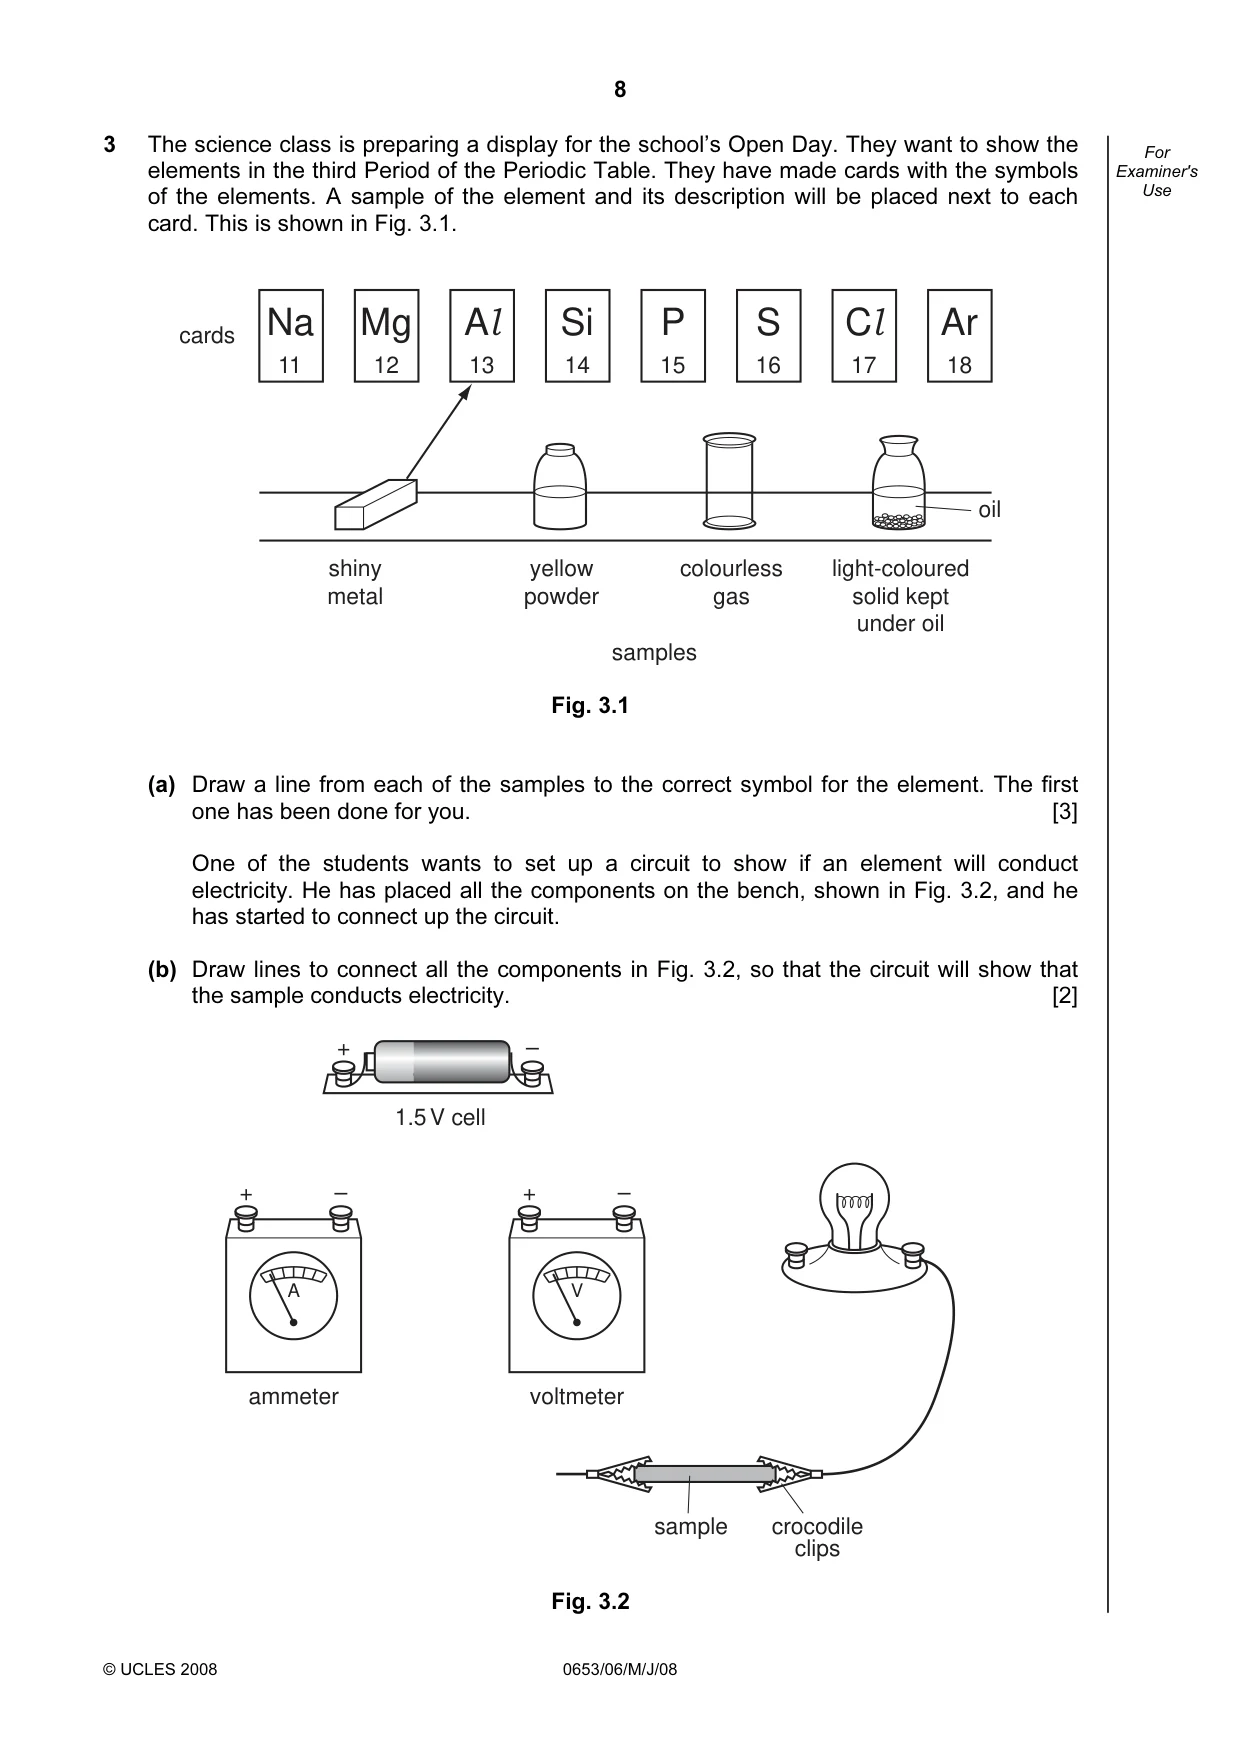
8 © UCLES 2008 0653/06/M/J/08 For Examiner's Use 3 The science class is preparing a display for the school’s Open Day. They want to show the elements in the third Period of the Periodic Table. They have made cards with the symbols of the elements. A sample of the element and its description will be placed next to each card. This is shown in Fig. 3.1. Na Mg Al Si P S Cl Ar 11 12 13 14 15 16 17 18 cards shiny metal yellow powder colourless gas light-coloured solid kept under oil oil samples Fig. 3.1 (a) Draw a line from each of the samples to the correct symbol for the element. The first one has been done for you. [3] One of the students wants to set up a circuit to show if an element will conduct electricity. He has placed all the components on the bench, shown in Fig. 3.2, and he has started to connect up the circuit. (b) Draw lines to connect all the components in Fig. 3.2, so that the circuit will show that the sample conducts electricity. [2] sample crocodile clips V voltmeter + – A ammeter + – + – 1.5 V cell Fig. 3.2
Question paper, page 9
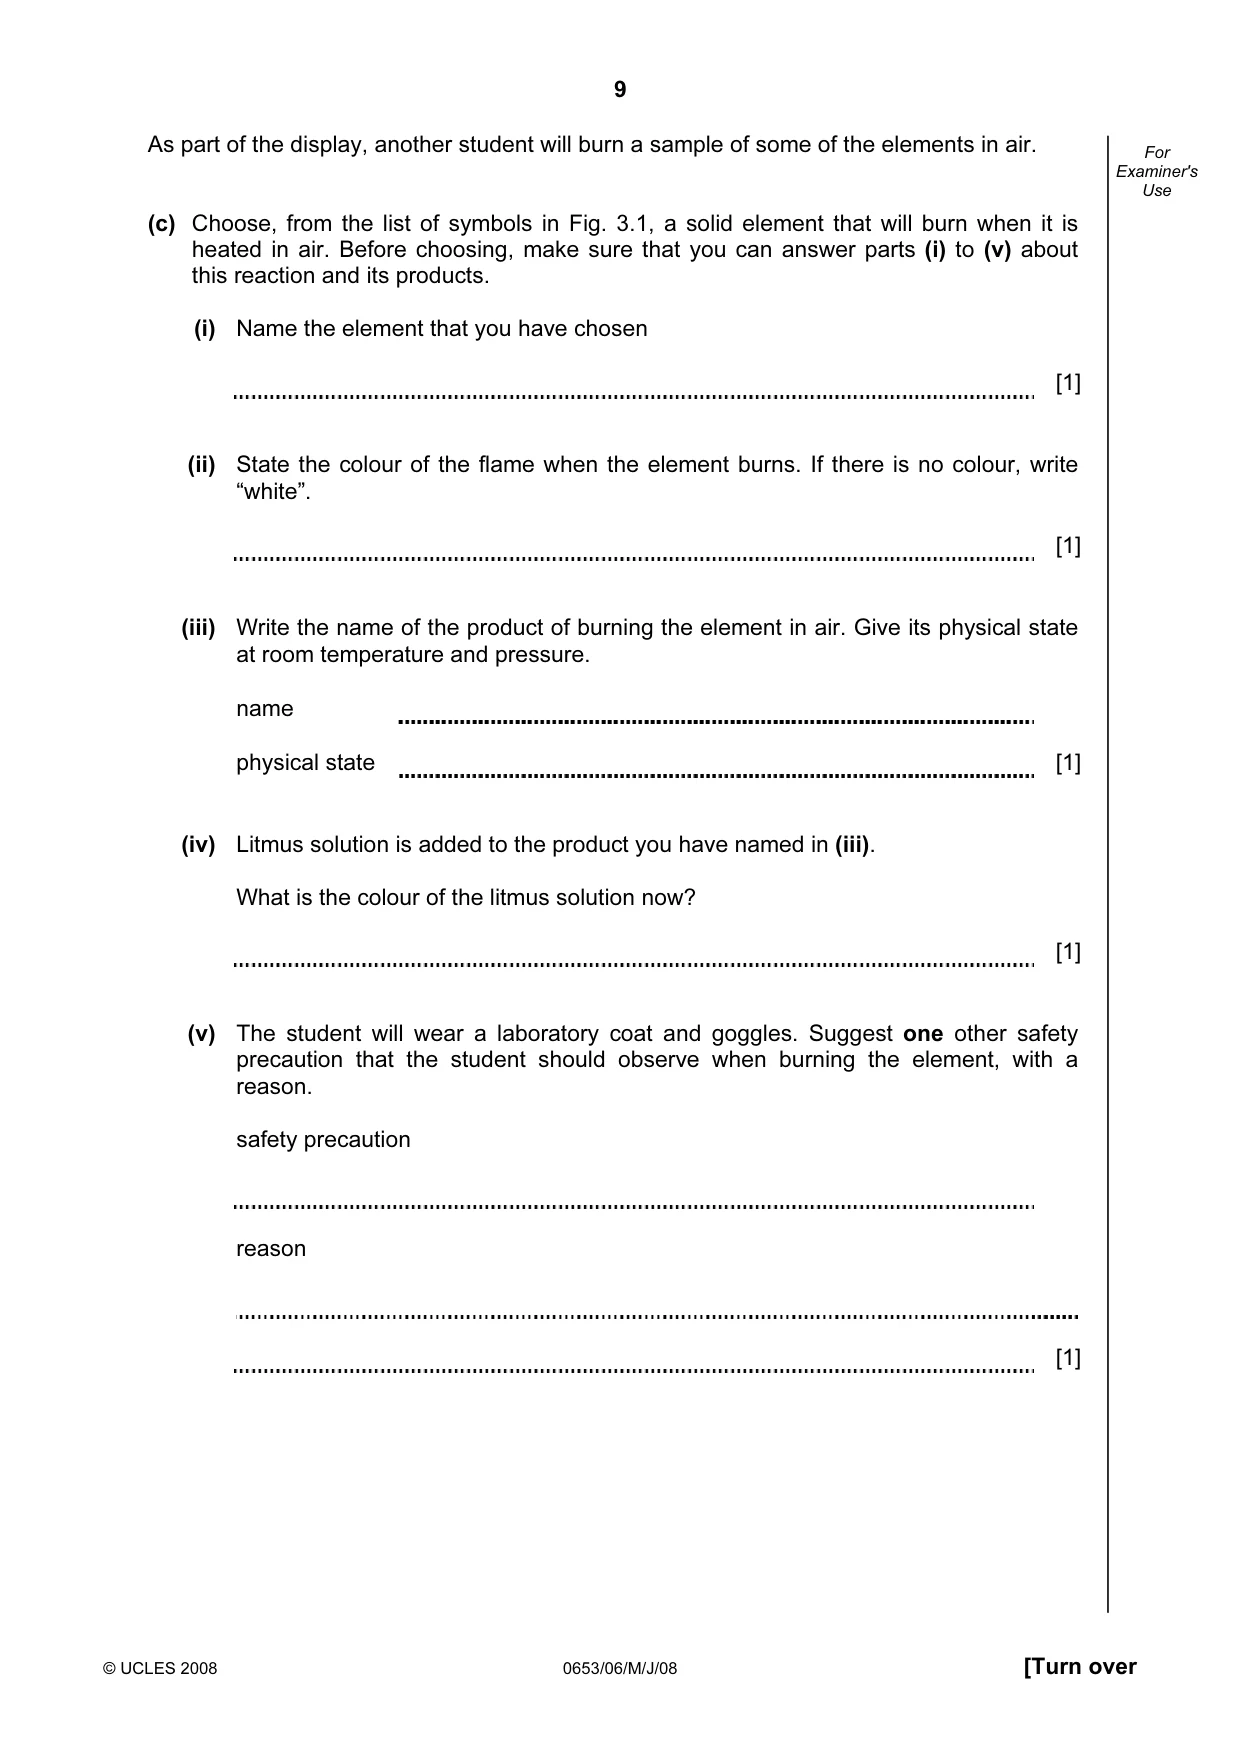
9 © UCLES 2008 0653/06/M/J/08 [Turn over For Examiner's Use As part of the display, another student will burn a sample of some of the elements in air. (c) Choose, from the list of symbols in Fig. 3.1, a solid element that will burn when it is heated in air. Before choosing, make sure that you can answer parts (i) to (v) about this reaction and its products. (i) Name the element that you have chosen [1] (ii) State the colour of the flame when the element burns. If there is no colour, write “white”. [1] (iii) Write the name of the product of burning the element in air. Give its physical state at room temperature and pressure. name physical state [1] (iv) Litmus solution is added to the product you have named in (iii). What is the colour of the litmus solution now? [1] (v) The student will wear a laboratory coat and goggles. Suggest one other safety precaution that the student should observe when burning the element, with a reason. safety precaution reason [1]
Question paper, page 10
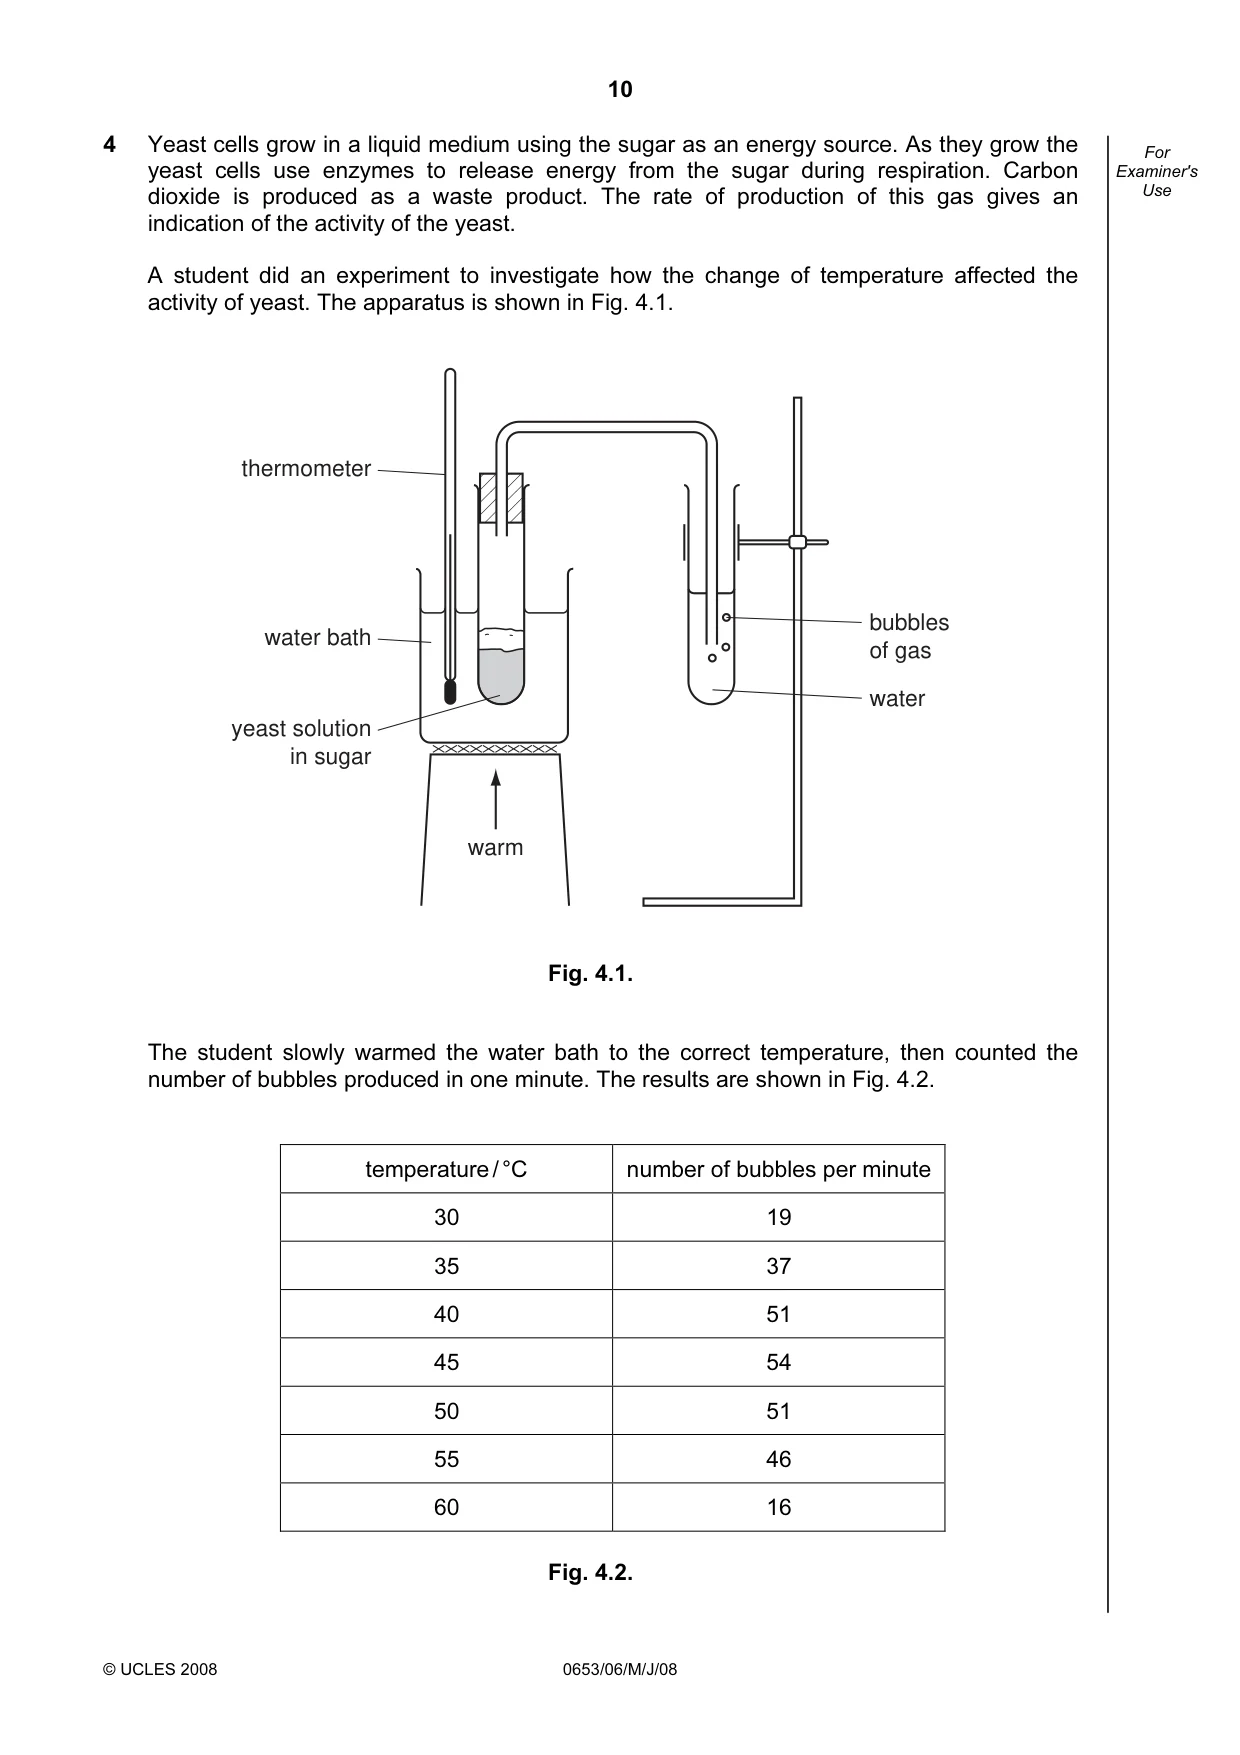
10 © UCLES 2008 0653/06/M/J/08 For Examiner's Use 4 Yeast cells grow in a liquid medium using the sugar as an energy source. As they grow the yeast cells use enzymes to release energy from the sugar during respiration. Carbon dioxide is produced as a waste product. The rate of production of this gas gives an indication of the activity of the yeast. A student did an experiment to investigate how the change of temperature affected the activity of yeast. The apparatus is shown in Fig. 4.1. warm thermometer water bath yeast solution in sugar bubbles of gas water Fig. 4.1. The student slowly warmed the water bath to the correct temperature, then counted the number of bubbles produced in one minute. The results are shown in Fig. 4.2. temperature / °C number of bubbles per minute 30 19 35 37 40 51 45 54 50 51 55 46 60 16 Fig. 4.2.
Question paper, page 11
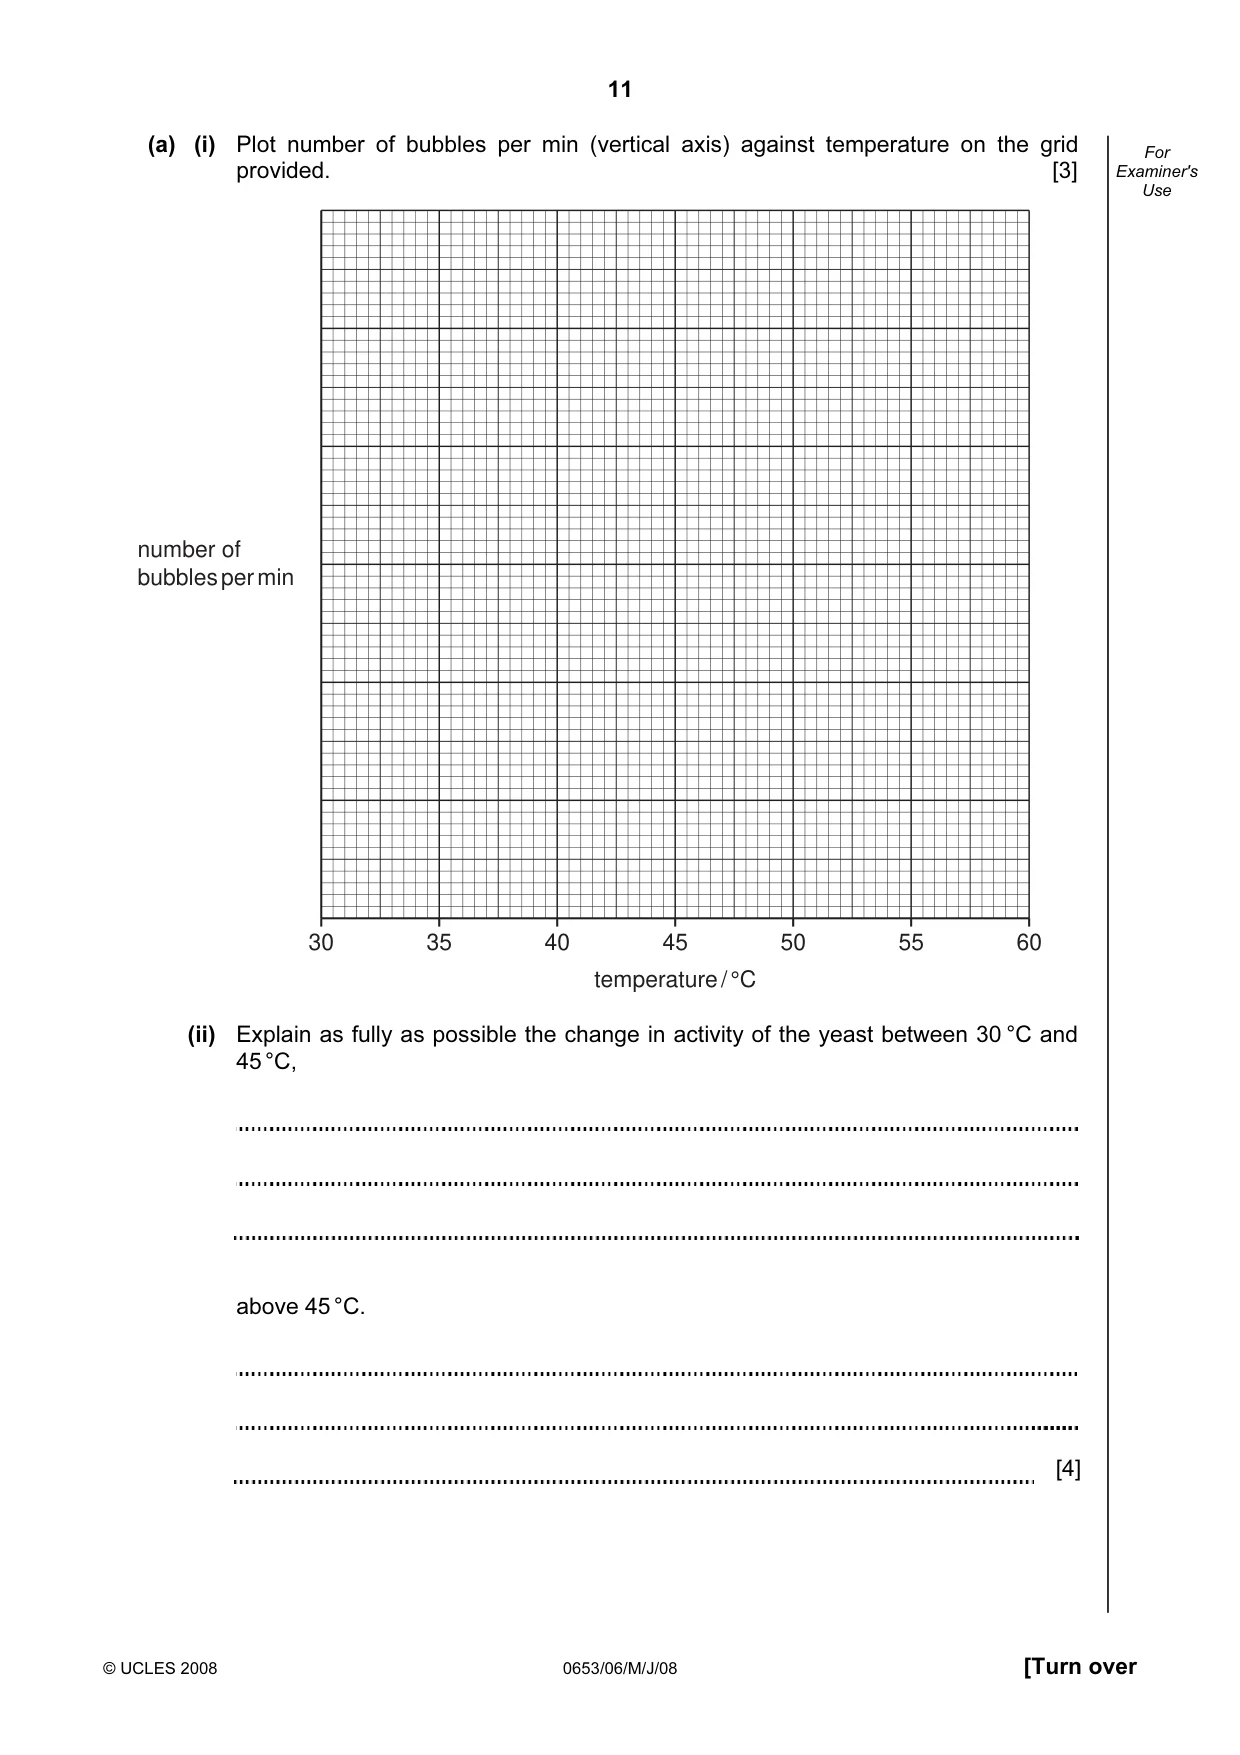
11 © UCLES 2008 0653/06/M/J/08 [Turn over For Examiner's Use (a) (i) Plot number of bubbles per min (vertical axis) against temperature on the grid provided. [3] 30 35 40 45 temperature / °C 50 55 60 number of bubbles per min (ii) Explain as fully as possible the change in activity of the yeast between 30 °C and 45 °C, above 45 °C. [4]
Question paper, page 12
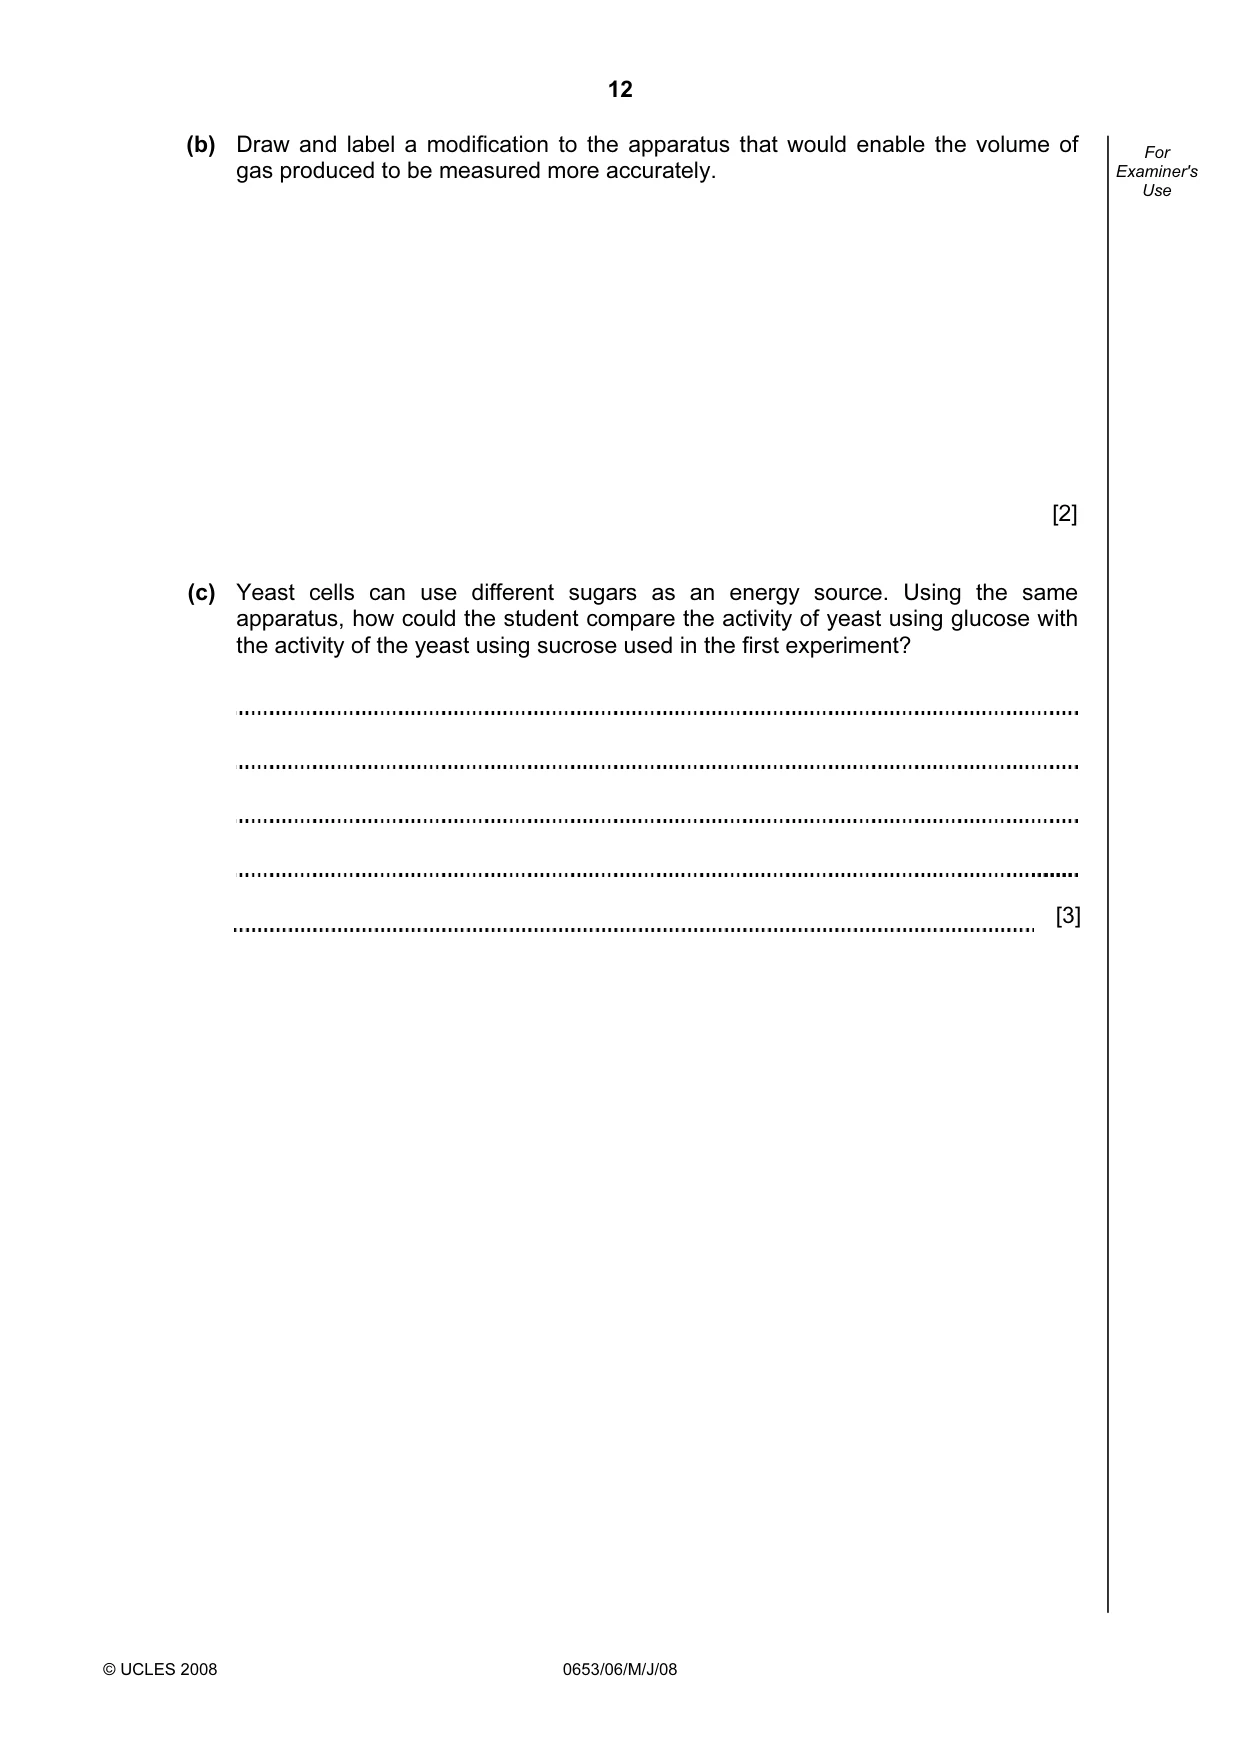
12 © UCLES 2008 0653/06/M/J/08 For Examiner's Use (b) Draw and label a modification to the apparatus that would enable the volume of gas produced to be measured more accurately. [2] (c) Yeast cells can use different sugars as an energy source. Using the same apparatus, how could the student compare the activity of yeast using glucose with the activity of the yeast using sucrose used in the first experiment? [3]
Question paper, page 14
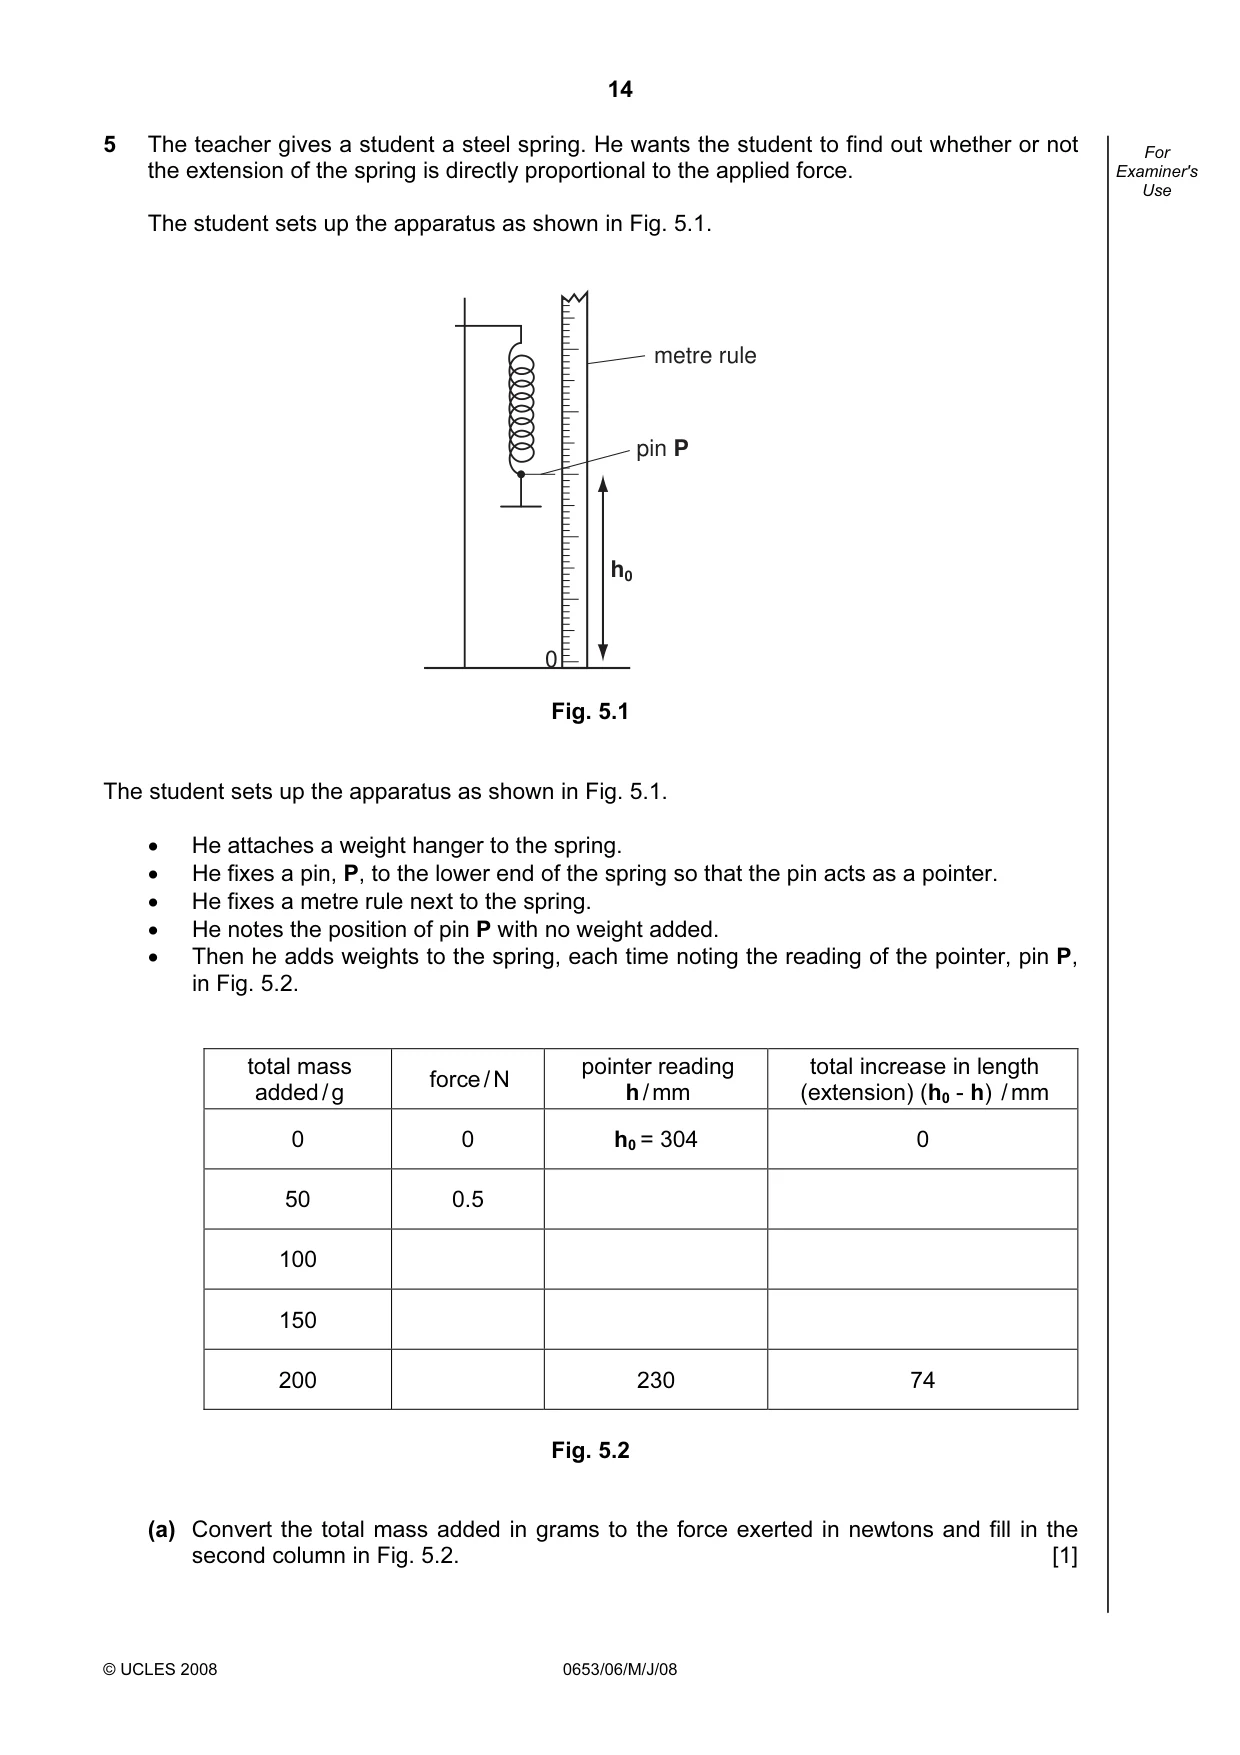
14 © UCLES 2008 0653/06/M/J/08 For Examiner's Use 5 The teacher gives a student a steel spring. He wants the student to find out whether or not the extension of the spring is directly proportional to the applied force. The student sets up the apparatus as shown in Fig. 5.1. 0 metre rule pin P h0 Fig. 5.1 The student sets up the apparatus as shown in Fig. 5.1. • He attaches a weight hanger to the spring. • He fixes a pin, P, to the lower end of the spring so that the pin acts as a pointer. • He fixes a metre rule next to the spring. • He notes the position of pin P with no weight added. • Then he adds weights to the spring, each time noting the reading of the pointer, pin P, in Fig. 5.2. total mass added / g force / N pointer reading h / mm total increase in length (extension) (h0 - h) / mm 0 0 h0 = 304 0 50 0.5 100 150 200 230 74 Fig. 5.2 (a) Convert the total mass added in grams to the force exerted in newtons and fill in the second column in Fig. 5.2. [1]
Question paper, page 15
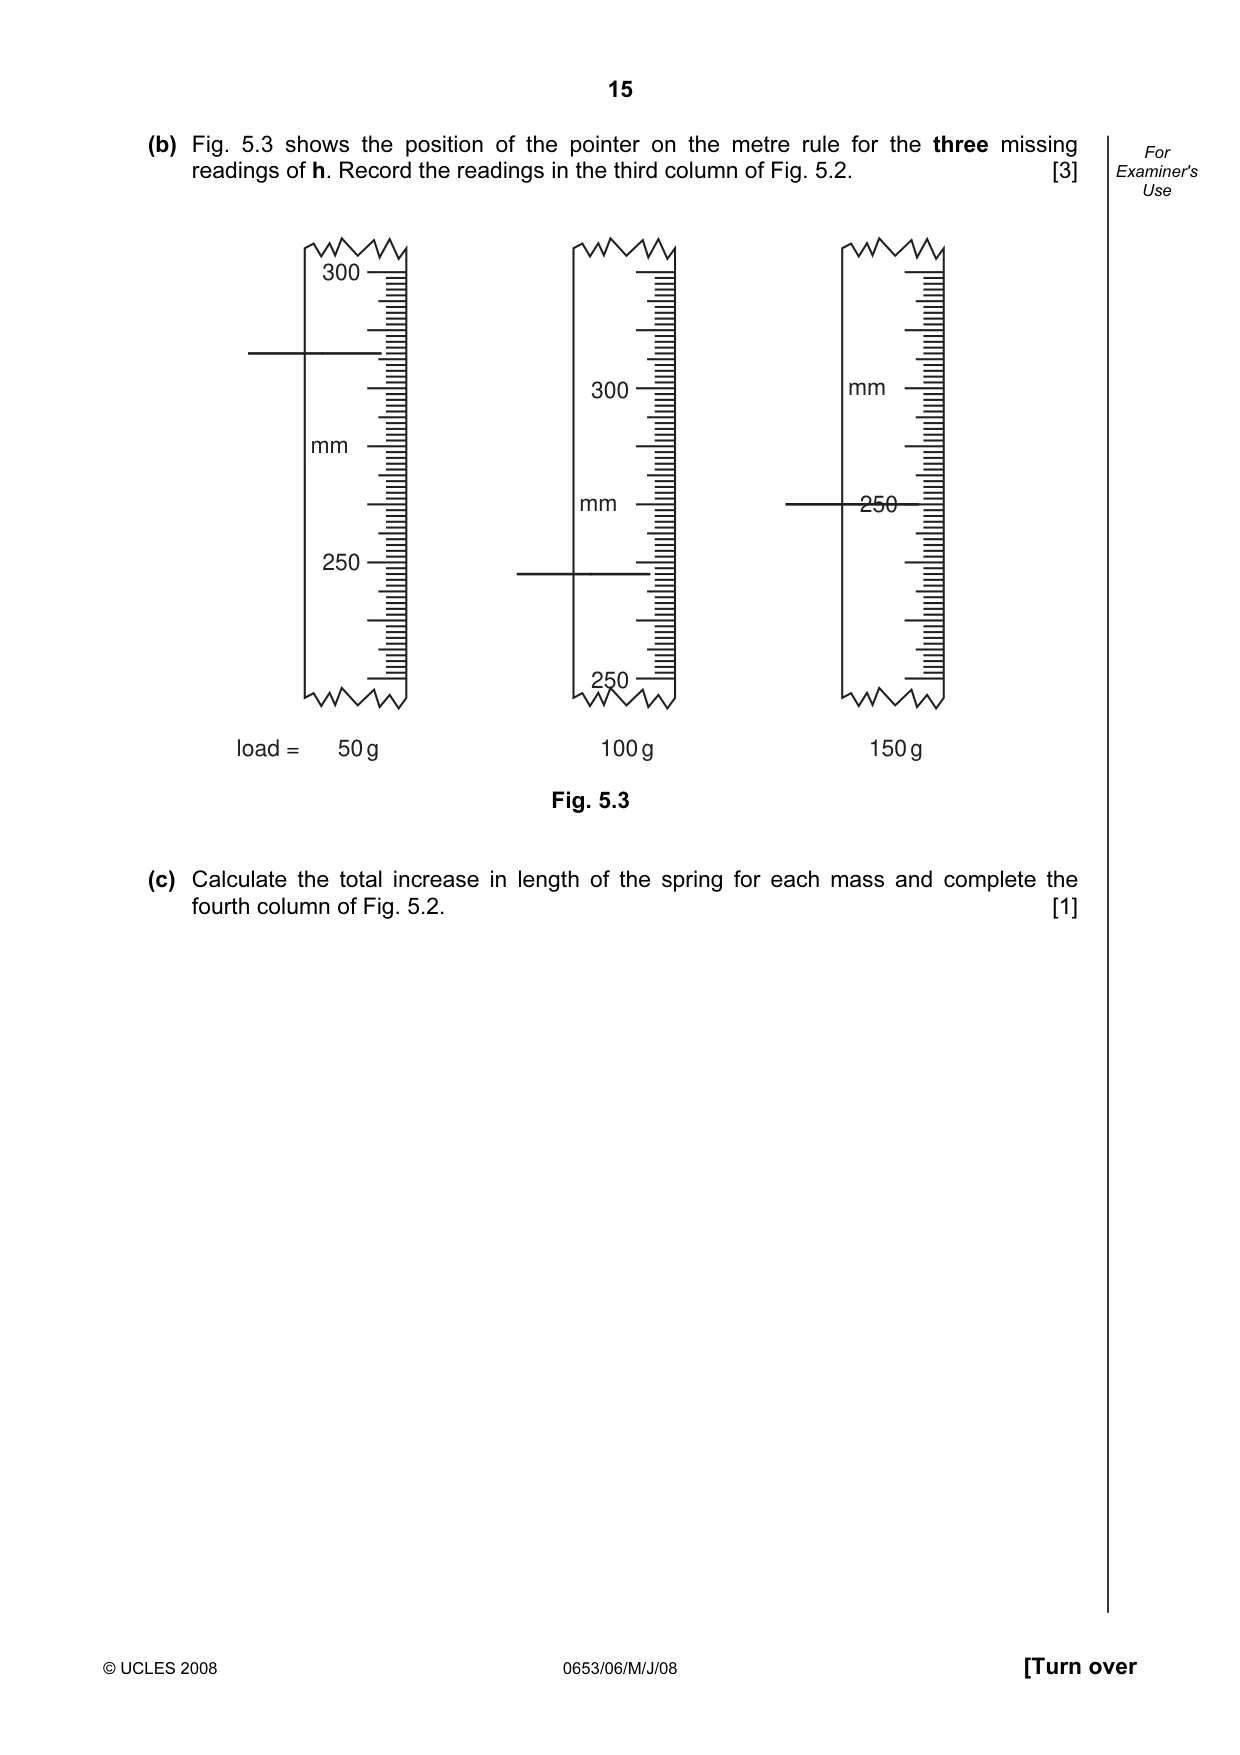
15 © UCLES 2008 0653/06/M/J/08 [Turn over For Examiner's Use (b) Fig. 5.3 shows the position of the pointer on the metre rule for the three missing readings of h. Record the readings in the third column of Fig. 5.2. [3] 300 250 mm 50 g load = 300 250 mm 100 g 250 mm 150 g Fig. 5.3 (c) Calculate the total increase in length of the spring for each mass and complete the fourth column of Fig. 5.2. [1]
Question paper, page 16
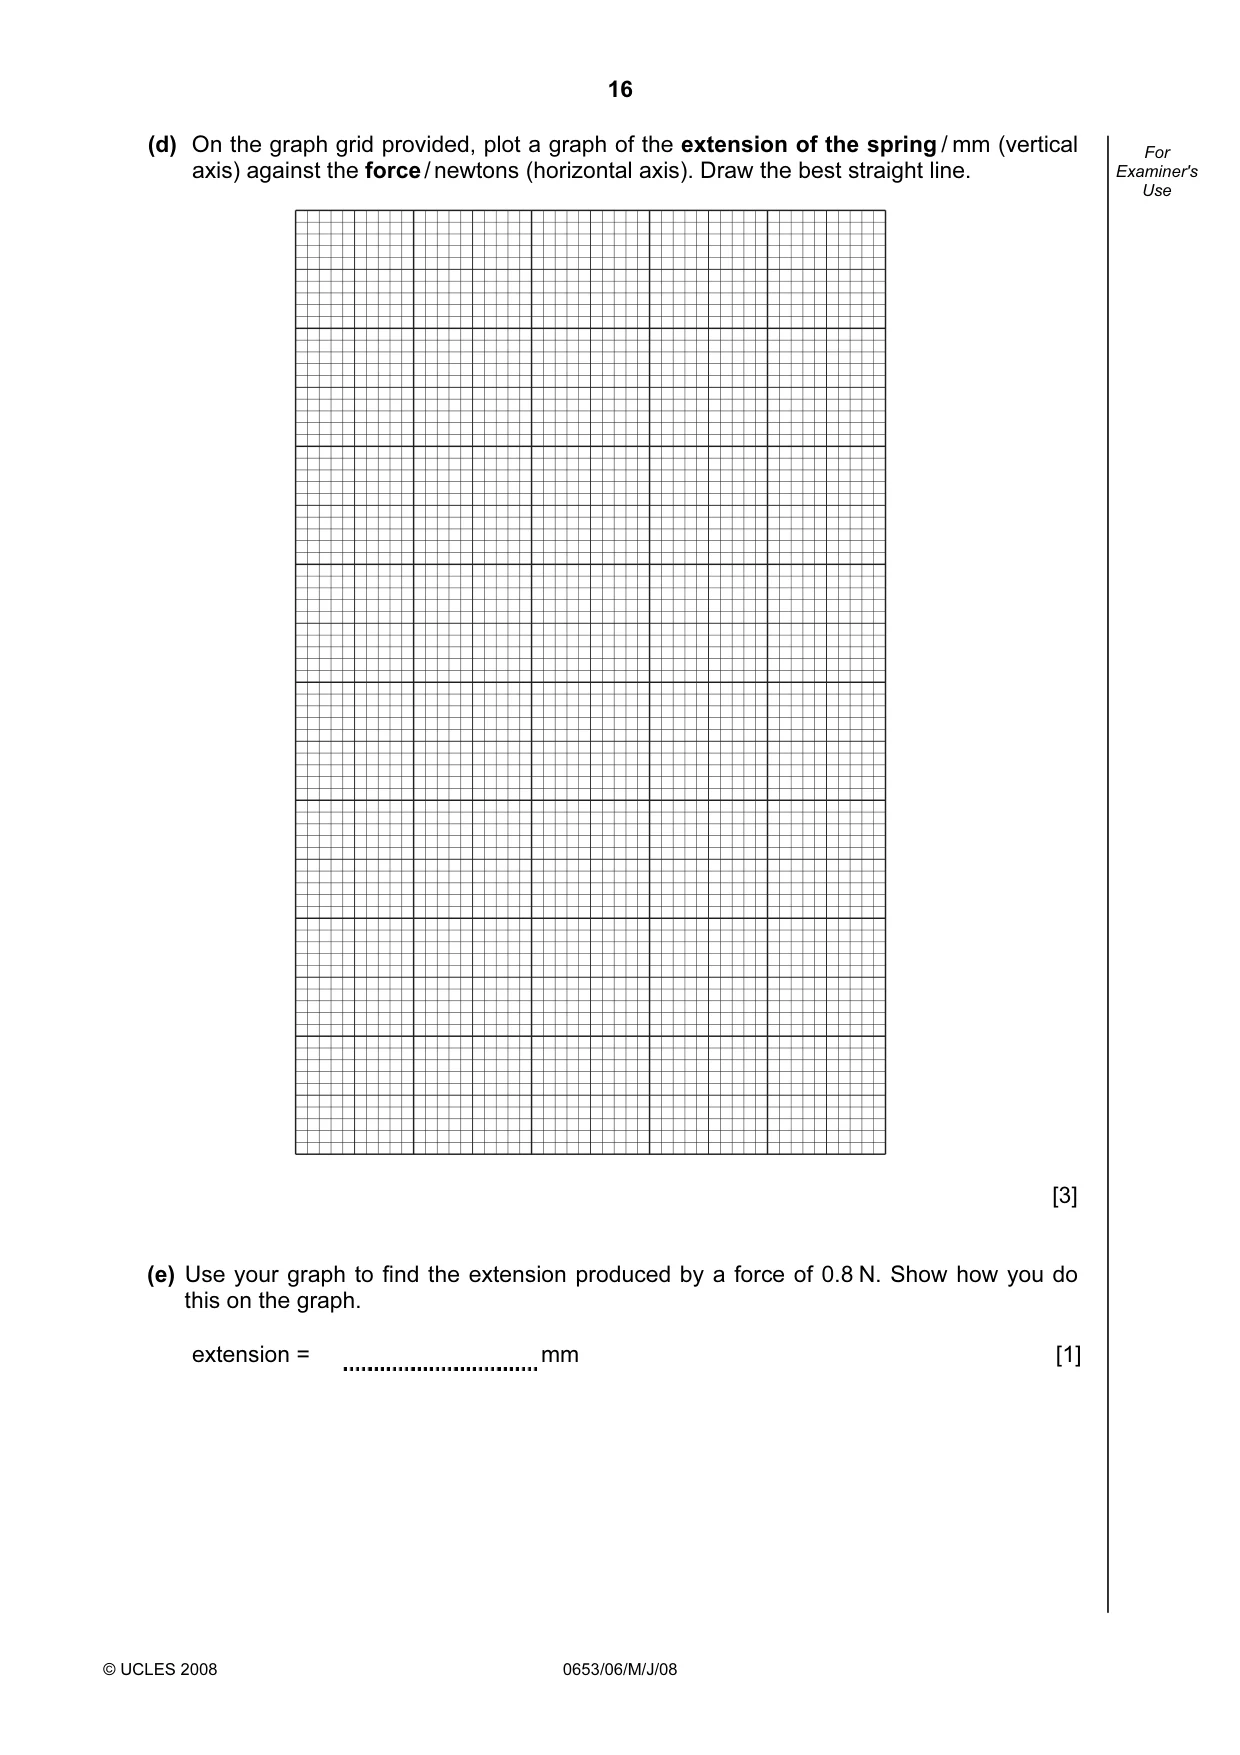
16 © UCLES 2008 0653/06/M/J/08 For Examiner's Use (d) On the graph grid provided, plot a graph of the extension of the spring / mm (vertical axis) against the force / newtons (horizontal axis). Draw the best straight line. [3] (e) Use your graph to find the extension produced by a force of 0.8 N. Show how you do this on the graph. extension = mm [1]
Question paper, page 17
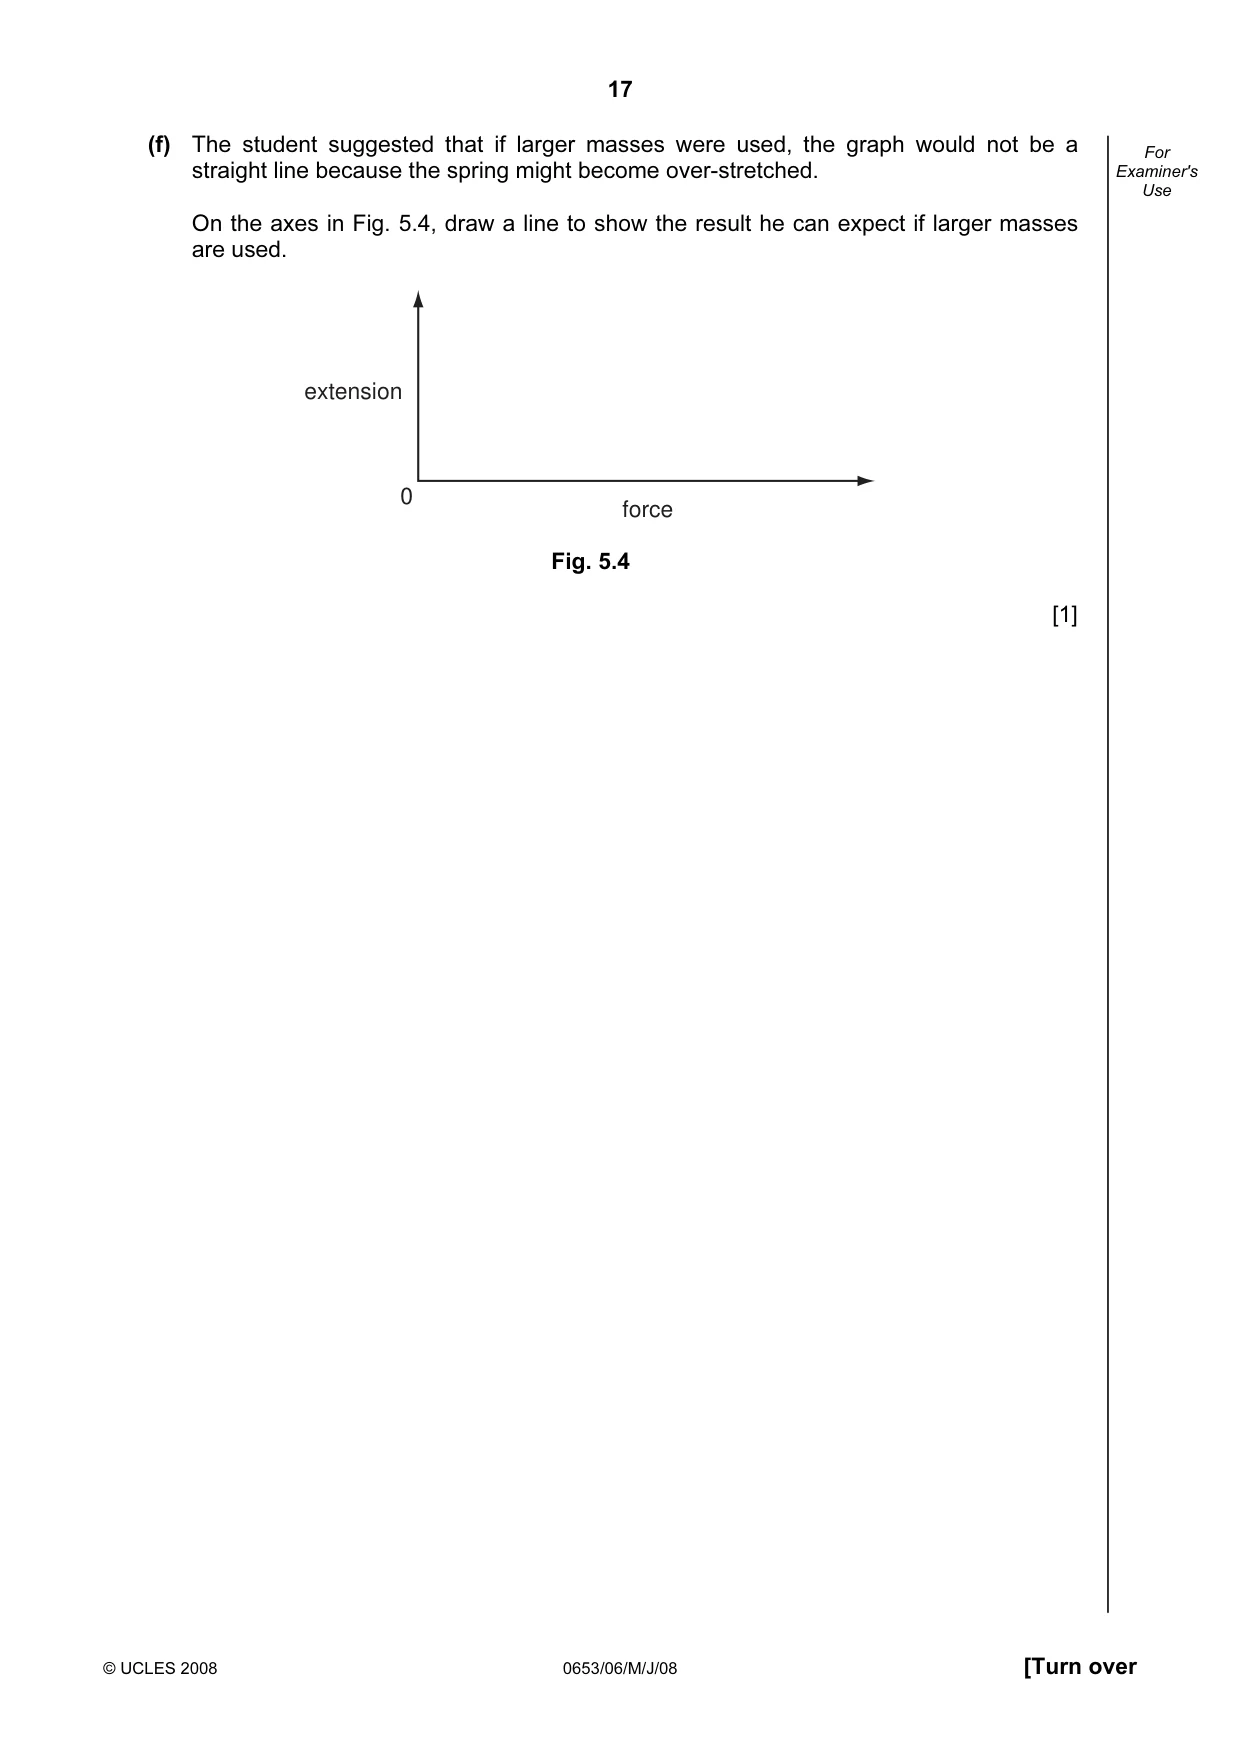
17 © UCLES 2008 0653/06/M/J/08 [Turn over For Examiner's Use (f) The student suggested that if larger masses were used, the graph would not be a straight line because the spring might become over-stretched. On the axes in Fig. 5.4, draw a line to show the result he can expect if larger masses are used. 0 force extension Fig. 5.4 [1]
Question paper, page 18
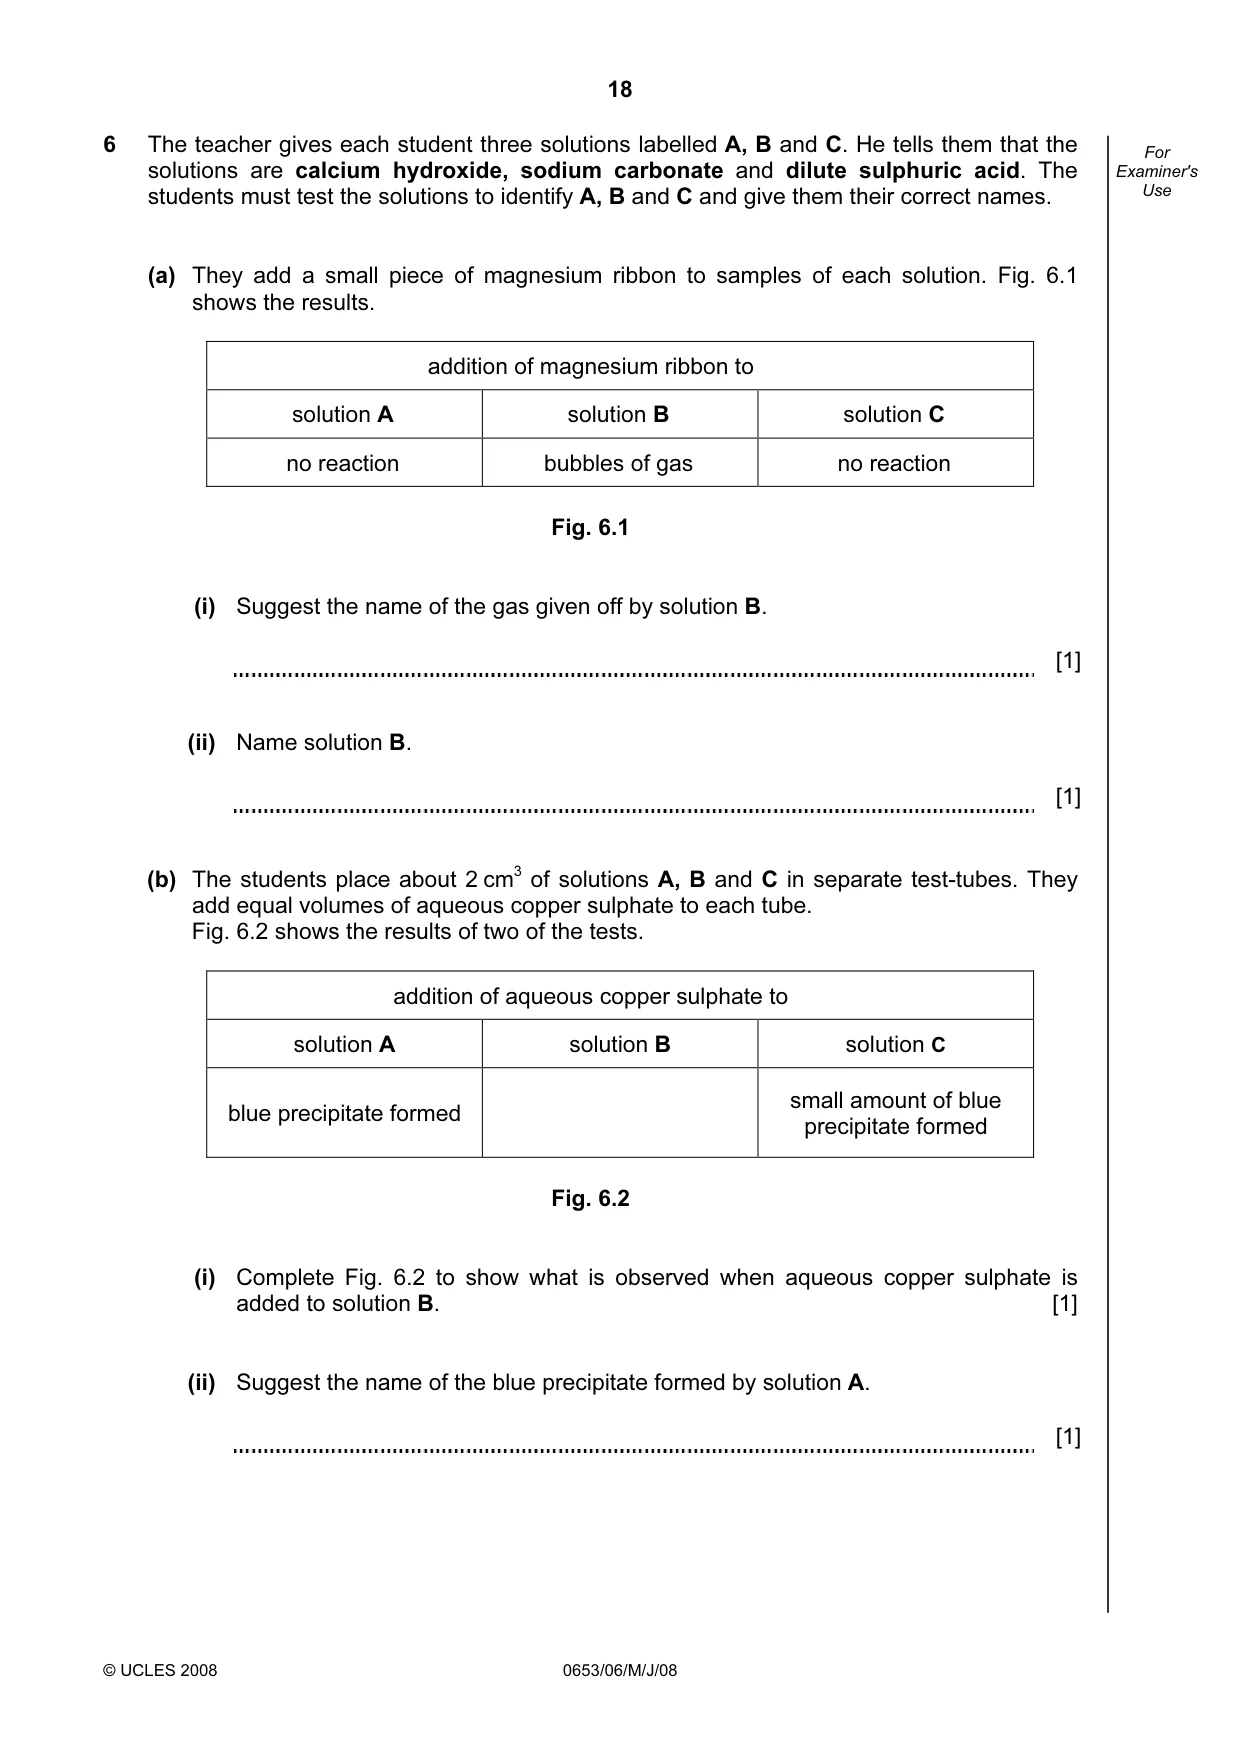
18 © UCLES 2008 0653/06/M/J/08 For Examiner's Use 6 The teacher gives each student three solutions labelled A, B and C. He tells them that the solutions are calcium hydroxide, sodium carbonate and dilute sulphuric acid. The students must test the solutions to identify A, B and C and give them their correct names. (a) They add a small piece of magnesium ribbon to samples of each solution. Fig. 6.1 shows the results. addition of magnesium ribbon to solution A solution B solution C no reaction bubbles of gas no reaction Fig. 6.1 (i) Suggest the name of the gas given off by solution B. [1] (ii) Name solution B. [1] (b) The students place about 2 cm3 of solutions A, B and C in separate test-tubes. They add equal volumes of aqueous copper sulphate to each tube. Fig. 6.2 shows the results of two of the tests. addition of aqueous copper sulphate to solution A solution B solution C blue precipitate formed small amount of blue precipitate formed Fig. 6.2 (i) Complete Fig. 6.2 to show what is observed when aqueous copper sulphate is added to solution B. [1] (ii) Suggest the name of the blue precipitate formed by solution A. [1]
Question paper, page 19
19 © UCLES 2008 0653/06/M/J/08 [Turn over For Examiner's Use (c) The students bubble carbon dioxide into each solution, A, B and C, in turn. This is shown in Fig. 6.3. solution A … and … Fig. 6.3 (i) Label on Fig. 6.3, two substances that can be used to react together to give the carbon dioxide. [1] The results of the experiment are shown in Fig. 6.4. effect of passing carbon dioxide into solution A solution B solution C no change no change Fig. 6.4 (ii) Complete Fig. 6.4 to show what happens when carbon dioxide is passed into solution C. [1] (d) The students place 2 cm3 of solution A in a test-tube. They add two drops of litmus. (i) The litmus shows that solution A is alkaline. What colour is the litmus in solution A? [1] The students add solution B drop by drop to the test-tube until the litmus changes colour. (ii) Complete the word equation to show the names of the products of the reaction between solution A and solution B. A + B … + … + water [2] The litmus does not change colour until 3 cm3 of solution B has been added. (iii) Which is more concentrated, solution A or solution B? Explain your answer. [1]
Question paper, page 20
20 Permission to reproduce items where third-party owned material protected by copyright is included has been sought and cleared where possible. Every reasonable effort has been made by the publisher (UCLES) to trace copyright holders, but if any items requiring clearance have unwittingly been included, the publisher will be pleased to make amends at the earliest possible opportunity. University of Cambridge International Examinations is part of the Cambridge Assessment Group. Cambridge Assessment is the brand name of University of Cambridge Local Examinations Syndicate (UCLES), which is itself a department of the University of Cambridge. 0653/06/M/J/08 BLANK PAGE
Mark scheme, page 1
UNIVERSITY OF CAMBRIDGE INTERNATIONAL EXAMINATIONS International General Certificate of Secondary Education MARK SCHEME for the May/June 2008 question paper 0653, 0654 COMBINED SCIENCE 0653, 0654/06 Paper 6 (Alternative to Practical), maximum raw mark 60 This mark scheme is published as an aid to teachers and candidates, to indicate the requirements of the examination. It shows the basis on which Examiners were instructed to award marks. It does not indicate the details of the discussions that took place at an Examiners’ meeting before marking began. All Examiners are instructed that alternative correct answers and unexpected approaches in candidates’ scripts must be given marks that fairly reflect the relevant knowledge and skills demonstrated. Mark schemes must be read in conjunction with the question papers and the report on the examination. • CIE will not enter into discussions or correspondence in connection with these mark schemes. CIE is publishing the mark schemes for the May/June 2008 question papers for most IGCSE, GCE Advanced Level and Advanced Subsidiary Level syllabuses and some Ordinary Level syllabuses. www.XtremePapers.com
Mark scheme, page 2
Page 2 Mark Scheme Syllabus Paper IGCSE – May/June 2008 0653, 0654 06 © UCLES 2008 1 (a) (i) xylem/vascular bundle [1] (ii) Diagram: showing wilting of leaves, (but not of main stalk) (1) Explanation: water lost from leaves/leaves dry out (1) by evaporation/transpiration (through guard cells)(1) turgor (pressure) lost/leaves become flaccid (1) Any 2 of the last 3 points (2) [3] (b) (i) wind speed/air movement OR humidity/amount of moisture in the air OWTTE [1] (ii) stand celery stems in dye (1) at different temperatures OWTTE (1) for same length of time (1) cut stems (1) to compare how far the dye has travelled (1) Any 3 points [3] (allow only 2 marks for potometer method adequately described) [Total: 8] 2 (a) (i) 48, 51, 49, 52 : 4 correct (2), 2 or 3 correct (1) 1 or 0 correct (0) (no tolerance) [2] (ii) 50s (ecf) [1] (iii) 60/50 = 1.2 m/s (ecf) (working need not be shown) [1] (iv) 60 3 27 × (1) = 0.15 (Hz) (1) [2] (allow 1 mark for 27/3) (v) point S [1] (b) (i) vertical arrow to show movement of ribbon [1] (ii) hand movement increased, (1) more movements per minute (1) OWTTE [2] [Total: 10]
Mark scheme, page 3
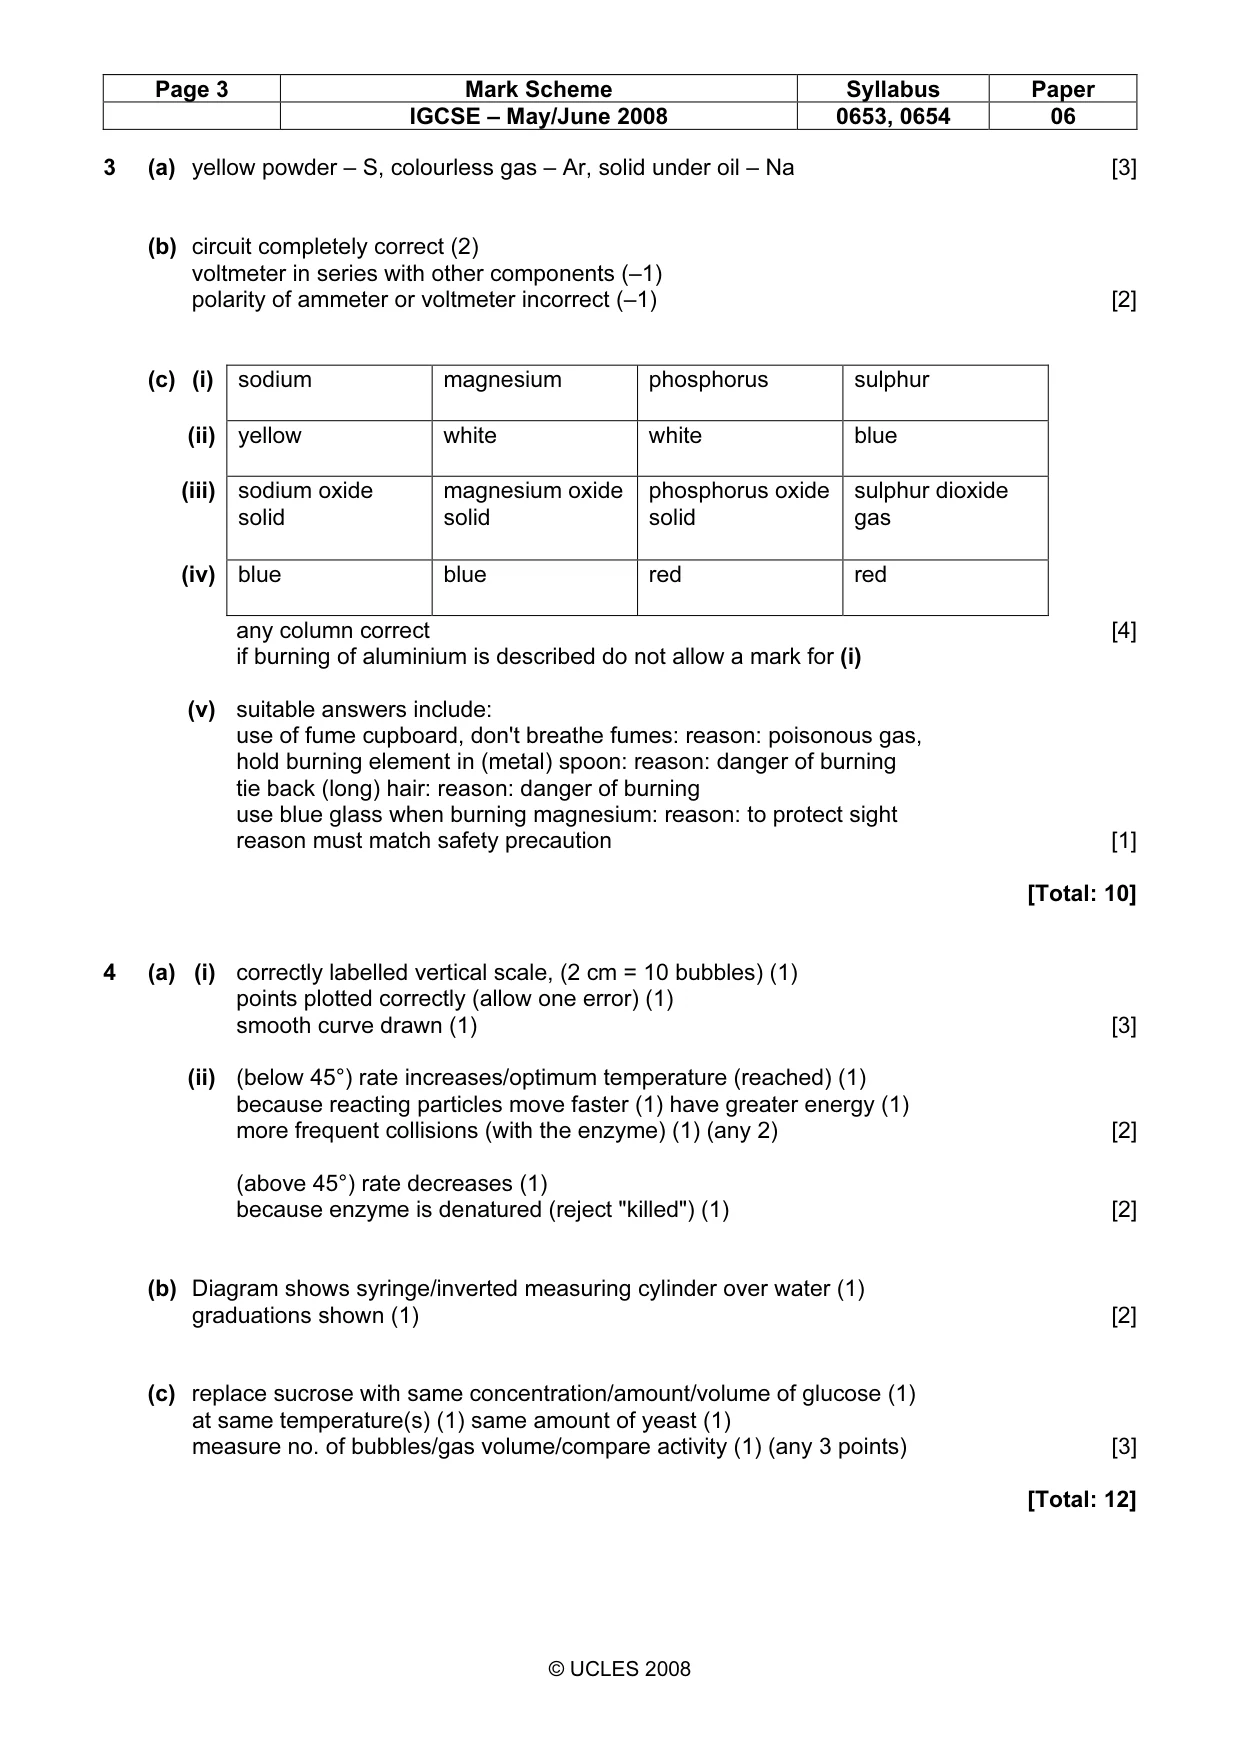
Page 3 Mark Scheme Syllabus Paper IGCSE – May/June 2008 0653, 0654 06 © UCLES 2008 3 (a) yellow powder – S, colourless gas – Ar, solid under oil – Na [3] (b) circuit completely correct (2) voltmeter in series with other components (–1) polarity of ammeter or voltmeter incorrect (–1) [2] (c) (i) sodium magnesium phosphorus sulphur (ii) yellow white white blue (iii) sodium oxide solid magnesium oxide solid phosphorus oxide solid sulphur dioxide gas (iv) blue blue red red any column correct [4] if burning of aluminium is described do not allow a mark for (i) (v) suitable answers include: use of fume cupboard, don't breathe fumes: reason: poisonous gas, hold burning element in (metal) spoon: reason: danger of burning tie back (long) hair: reason: danger of burning use blue glass when burning magnesium: reason: to protect sight reason must match safety precaution [1] [Total: 10] 4 (a) (i) correctly labelled vertical scale, (2 cm = 10 bubbles) (1) points plotted correctly (allow one error) (1) smooth curve drawn (1) [3] (ii) (below 45°) rate increases/optimum temperature (reached) (1) because reacting particles move faster (1) have greater energy (1) more frequent collisions (with the enzyme) (1) (any 2) [2] (above 45°) rate decreases (1) because enzyme is denatured (reject "killed") (1) [2] (b) Diagram shows syringe/inverted measuring cylinder over water (1) graduations shown (1) [2] (c) replace sucrose with same concentration/amount/volume of glucose (1) at same temperature(s) (1) same amount of yeast (1) measure no. of bubbles/gas volume/compare activity (1) (any 3 points) [3] [Total: 12]
Mark scheme, page 4
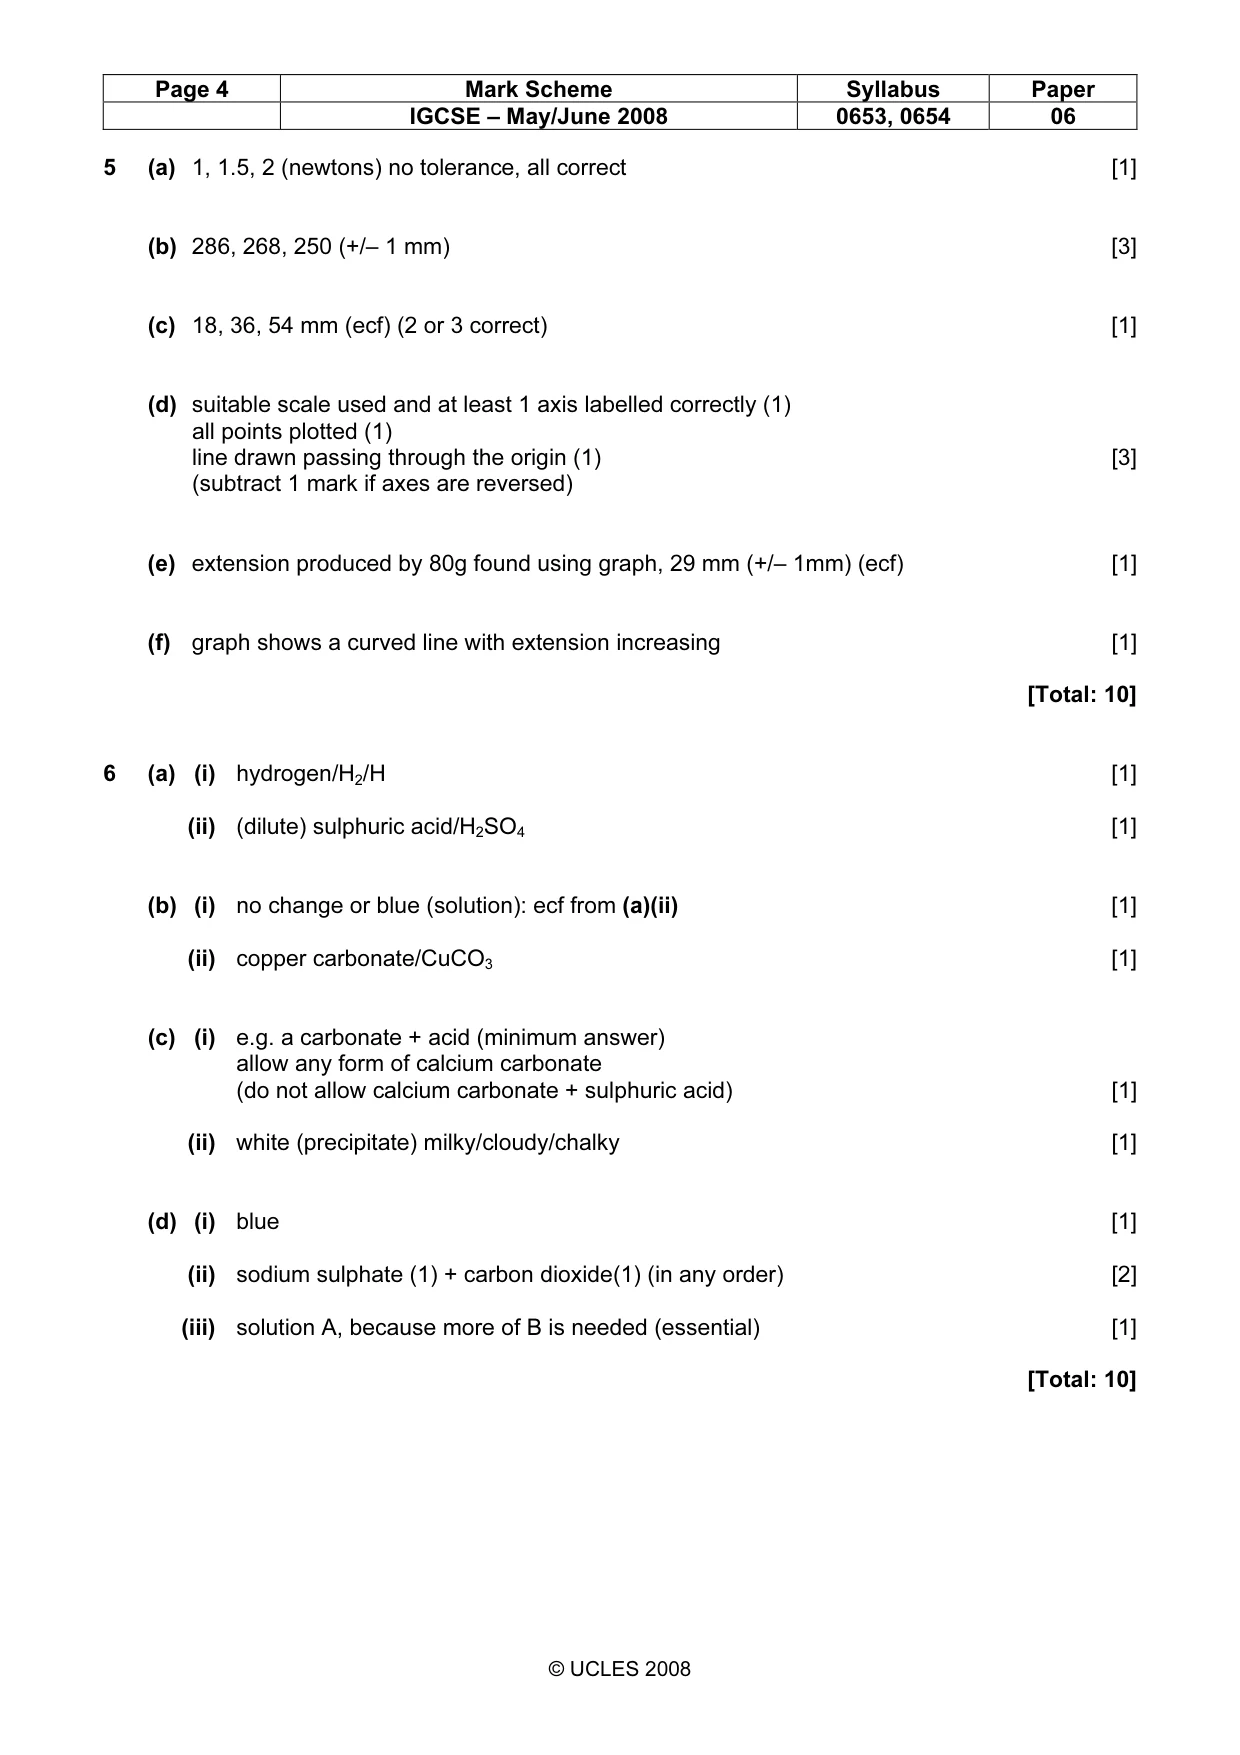
Page 4 Mark Scheme Syllabus Paper IGCSE – May/June 2008 0653, 0654 06 © UCLES 2008 5 (a) 1, 1.5, 2 (newtons) no tolerance, all correct [1] (b) 286, 268, 250 (+/– 1 mm) [3] (c) 18, 36, 54 mm (ecf) (2 or 3 correct) [1] (d) suitable scale used and at least 1 axis labelled correctly (1) all points plotted (1) line drawn passing through the origin (1) [3] (subtract 1 mark if axes are reversed) (e) extension produced by 80g found using graph, 29 mm (+/– 1mm) (ecf) [1] (f) graph shows a curved line with extension increasing [1] [Total: 10] 6 (a) (i) hydrogen/H2/H [1] (ii) (dilute) sulphuric acid/H2SO4 [1] (b) (i) no change or blue (solution): ecf from (a)(ii) [1] (ii) copper carbonate/CuCO3 [1] (c) (i) e.g. a carbonate + acid (minimum answer) allow any form of calcium carbonate (do not allow calcium carbonate + sulphuric acid) [1] (ii) white (precipitate) milky/cloudy/chalky [1] (d) (i) blue [1] (ii) sodium sulphate (1) + carbon dioxide(1) (in any order) [2] (iii) solution A, because more of B is needed (essential) [1] [Total: 10]
What you needed in this session
Cambridge’s own grade thresholds for 2008 May/June, Paper 6 · Variant 1. A higher threshold means an easier paper — the bar moves with how the cohort did.