Cambridge IGCSE Sciences - Co-ordinated (Double) 0654 — 2007 Oct/Nov Paper 6 · Variant 1
0654/61/O/N/07 · 60 marks · ≈68 min
The question paper and its mark scheme, free to read here and free to download. This is Cambridge’s own paper, exactly as it was sat.
Question paper16 pages

Mark scheme4 pages
Answers below. Sit the paper first if you are practising.
Paper as text
Question paper, page 1
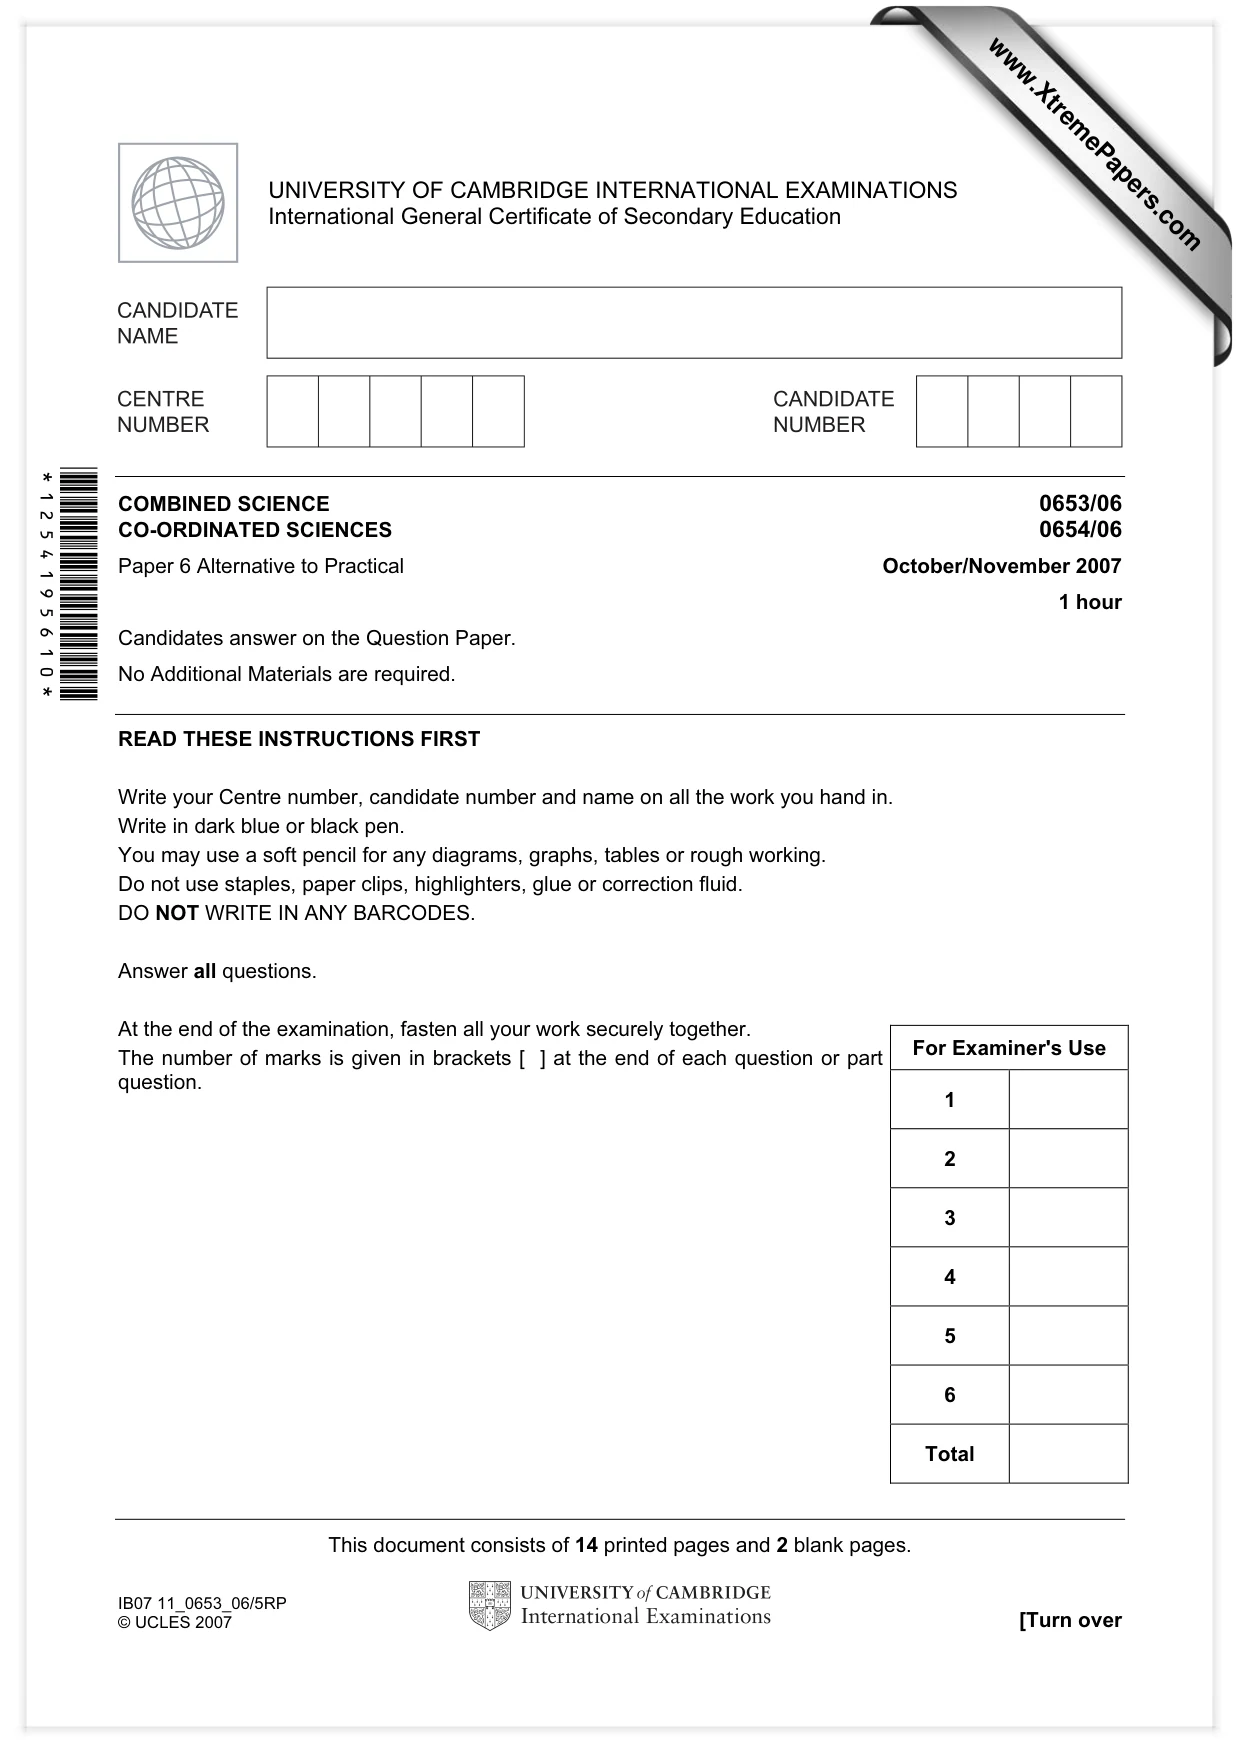
This document consists of 14 printed pages and 2 blank pages. IB07 11_0653_06/5RP © UCLES 2007 [Turn over *1254195610* For Examiner's Use 1 2 3 4 5 6 Total UNIVERSITY OF CAMBRIDGE INTERNATIONAL EXAMINATIONS International General Certificate of Secondary Education COMBINED SCIENCE 0653/06 CO-ORDINATED SCIENCES 0654/06 Paper 6 Alternative to Practical October/November 2007 1 hour Candidates answer on the Question Paper. No Additional Materials are required. READ THESE INSTRUCTIONS FIRST Write your Centre number, candidate number and name on all the work you hand in. Write in dark blue or black pen. You may use a soft pencil for any diagrams, graphs, tables or rough working. Do not use staples, paper clips, highlighters, glue or correction fluid. DO NOT WRITE IN ANY BARCODES. Answer all questions. At the end of the examination, fasten all your work securely together. The number of marks is given in brackets [ ] at the end of each question or part question. www.XtremePapers.com
Question paper, page 2
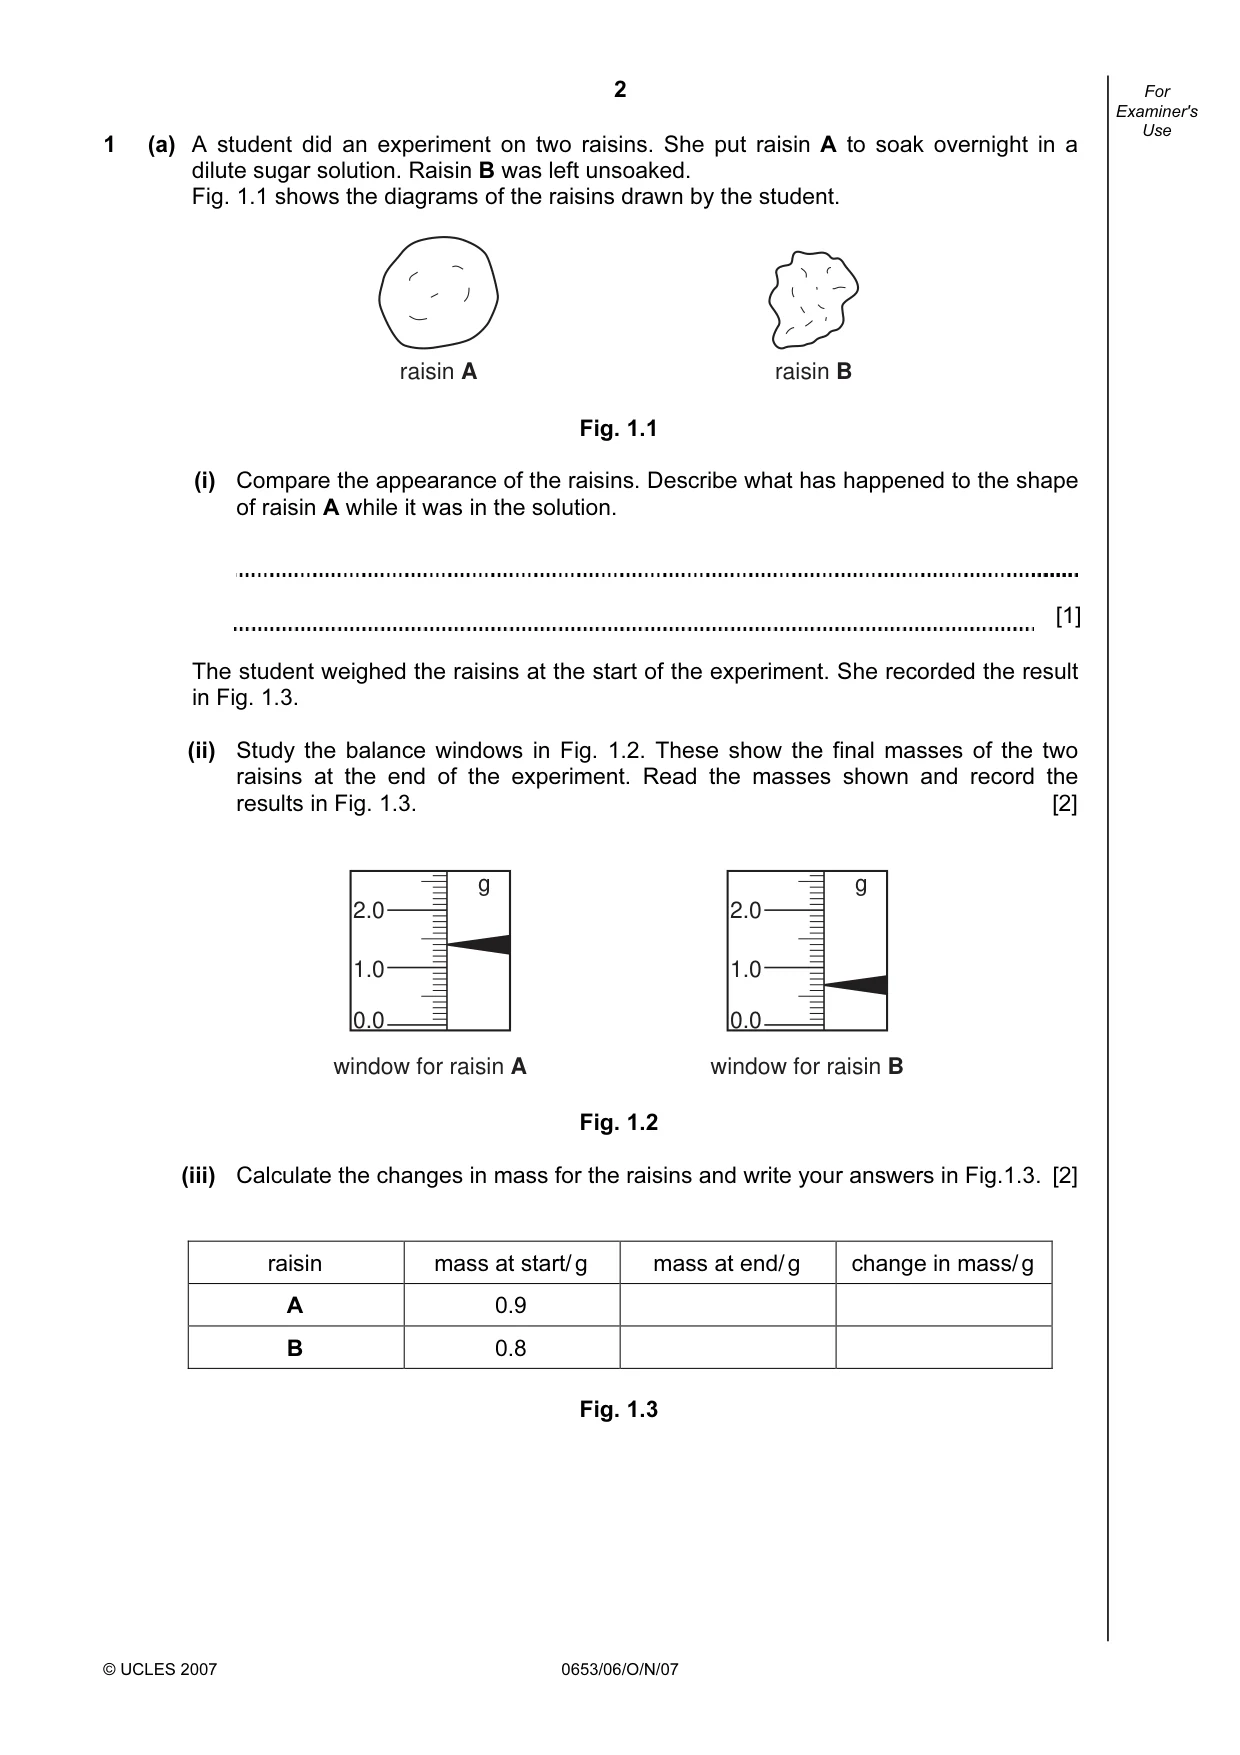
2 © UCLES 2007 0653/06/O/N/07 For Examiner's Use 1 (a) A student did an experiment on two raisins. She put raisin A to soak overnight in a dilute sugar solution. Raisin B was left unsoaked. Fig. 1.1 shows the diagrams of the raisins drawn by the student. raisin A raisin B Fig. 1.1 (i) Compare the appearance of the raisins. Describe what has happened to the shape of raisin A while it was in the solution. [1] The student weighed the raisins at the start of the experiment. She recorded the result in Fig. 1.3. (ii) Study the balance windows in Fig. 1.2. These show the final masses of the two raisins at the end of the experiment. Read the masses shown and record the results in Fig. 1.3. [2] window for raisin A 0.0 1.0 2.0 g window for raisin B 0.0 1.0 2.0 g Fig. 1.2 (iii) Calculate the changes in mass for the raisins and write your answers in Fig.1.3. [2] raisin mass at start/ g mass at end/ g change in mass/ g A 0.9 B 0.8 Fig. 1.3
Question paper, page 3
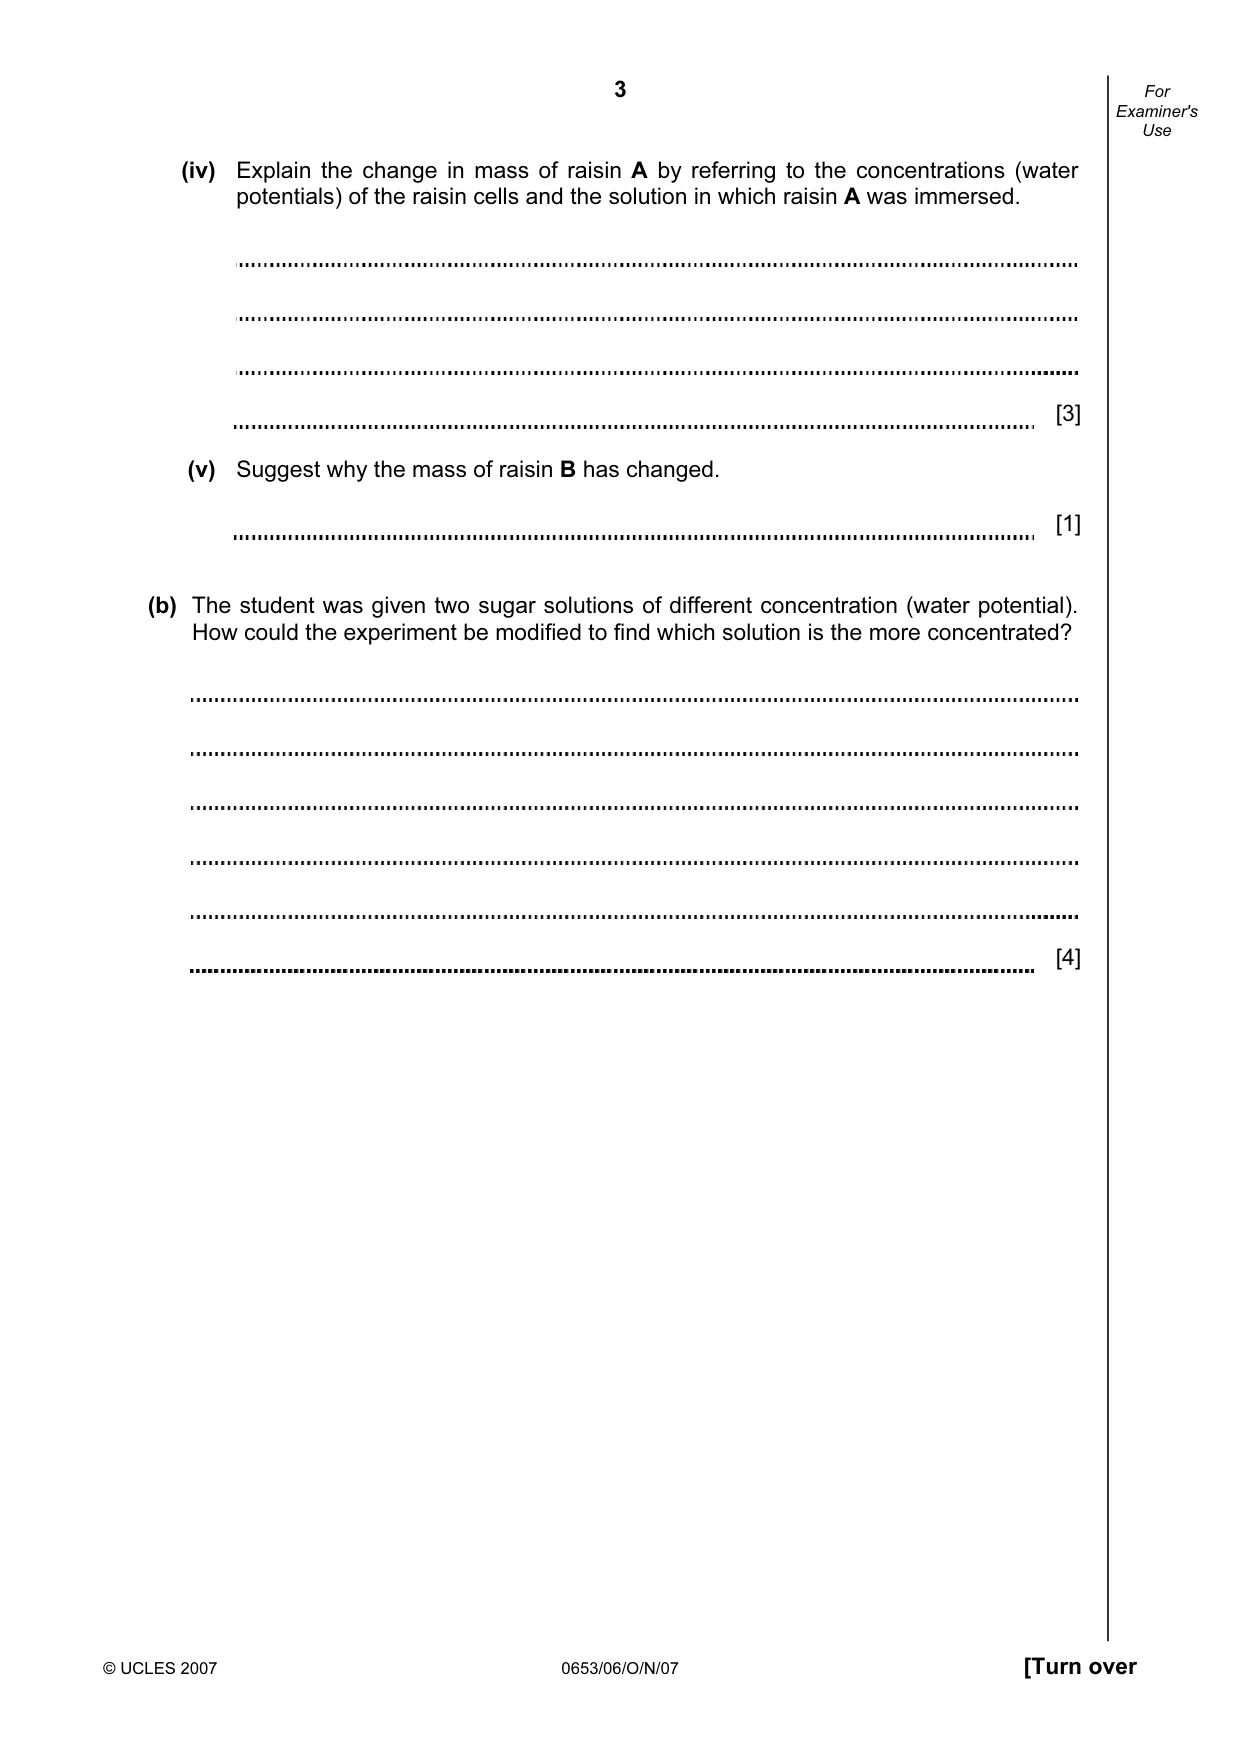
3 © UCLES 2007 0653/06/O/N/07 [Turn over For Examiner's Use (iv) Explain the change in mass of raisin A by referring to the concentrations (water potentials) of the raisin cells and the solution in which raisin A was immersed. [3] (v) Suggest why the mass of raisin B has changed. [1] (b) The student was given two sugar solutions of different concentration (water potential). How could the experiment be modified to find which solution is the more concentrated? [4]
Question paper, page 4
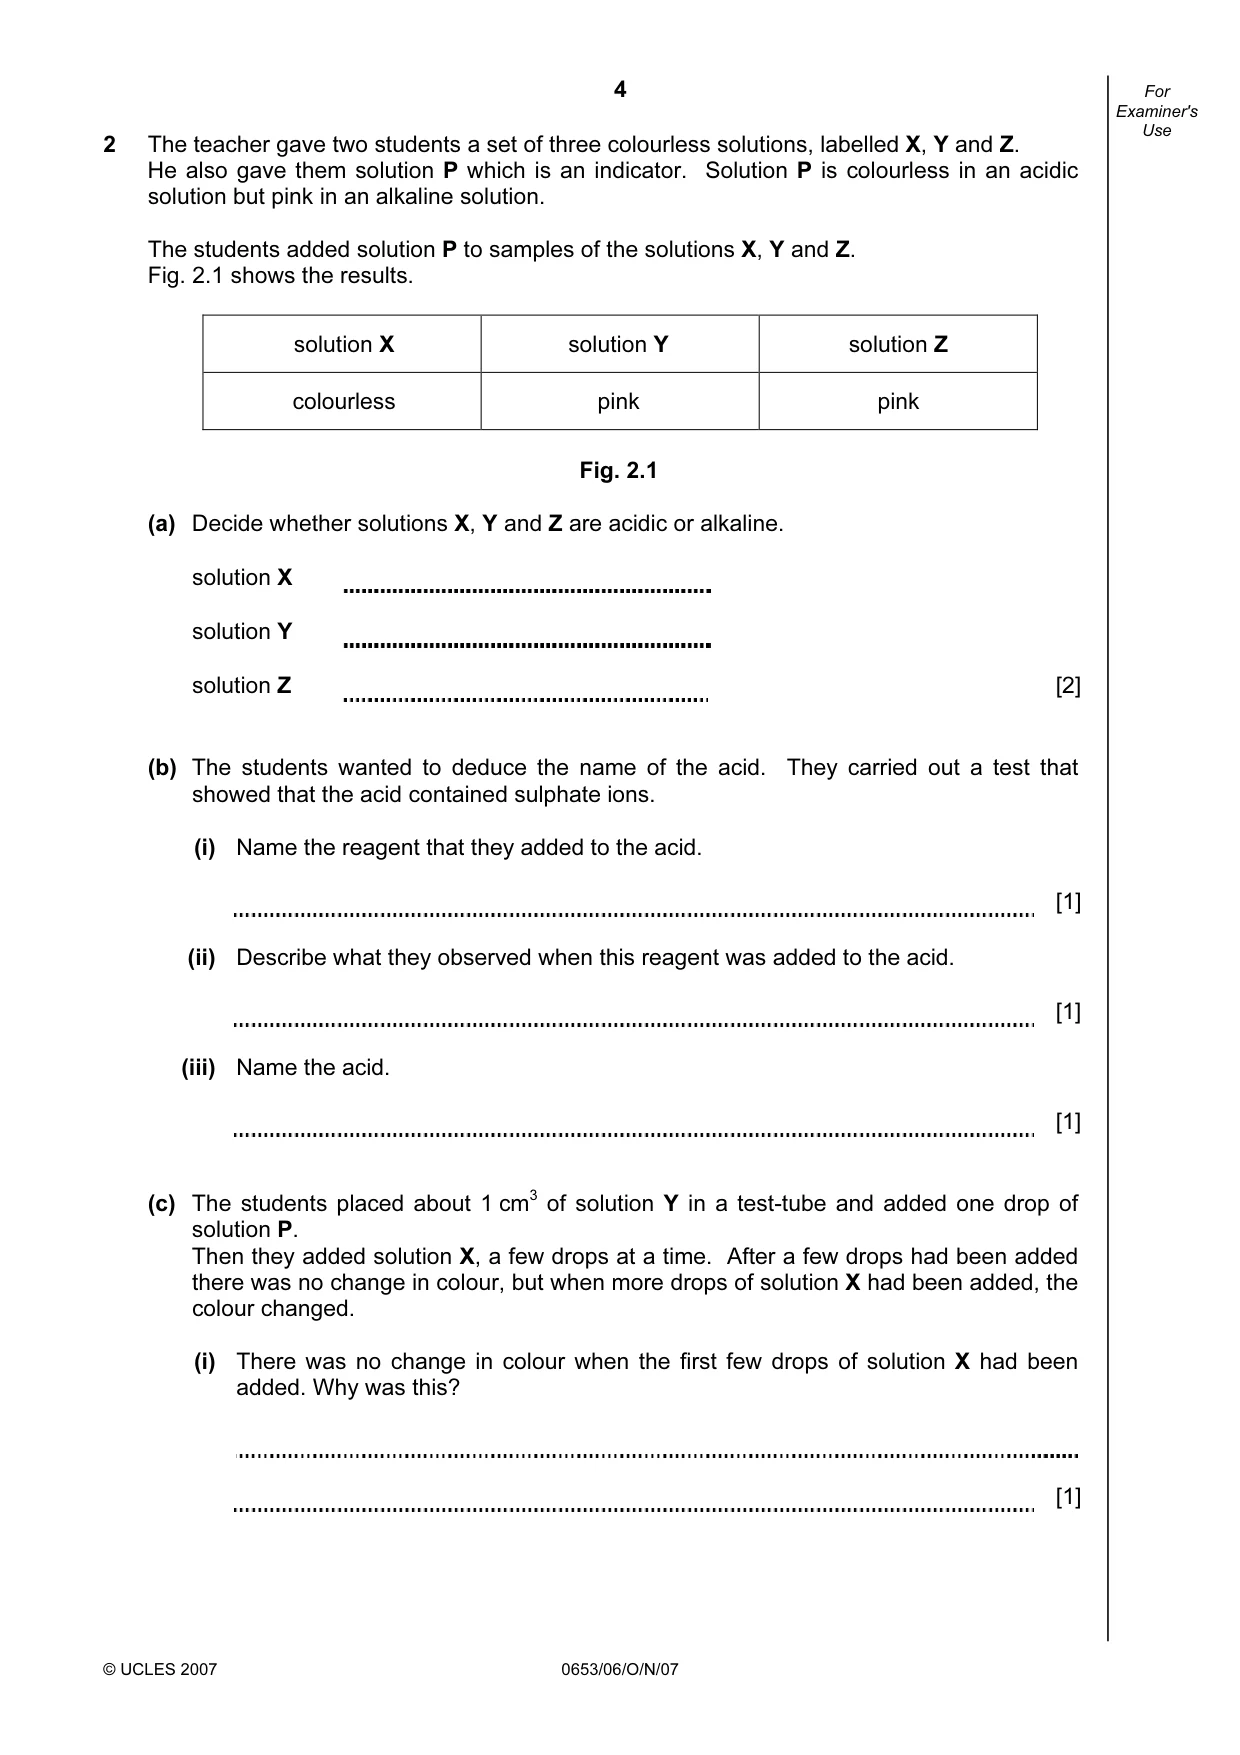
4 © UCLES 2007 0653/06/O/N/07 For Examiner's Use 2 The teacher gave two students a set of three colourless solutions, labelled X, Y and Z. He also gave them solution P which is an indicator. Solution P is colourless in an acidic solution but pink in an alkaline solution. The students added solution P to samples of the solutions X, Y and Z. Fig. 2.1 shows the results. solution X solution Y solution Z colourless pink pink Fig. 2.1 (a) Decide whether solutions X, Y and Z are acidic or alkaline. solution X solution Y solution Z [2] (b) The students wanted to deduce the name of the acid. They carried out a test that showed that the acid contained sulphate ions. (i) Name the reagent that they added to the acid. [1] (ii) Describe what they observed when this reagent was added to the acid. [1] (iii) Name the acid. [1] (c) The students placed about 1 cm3 of solution Y in a test-tube and added one drop of solution P. Then they added solution X, a few drops at a time. After a few drops had been added there was no change in colour, but when more drops of solution X had been added, the colour changed. (i) There was no change in colour when the first few drops of solution X had been added. Why was this? [1]
Question paper, page 5
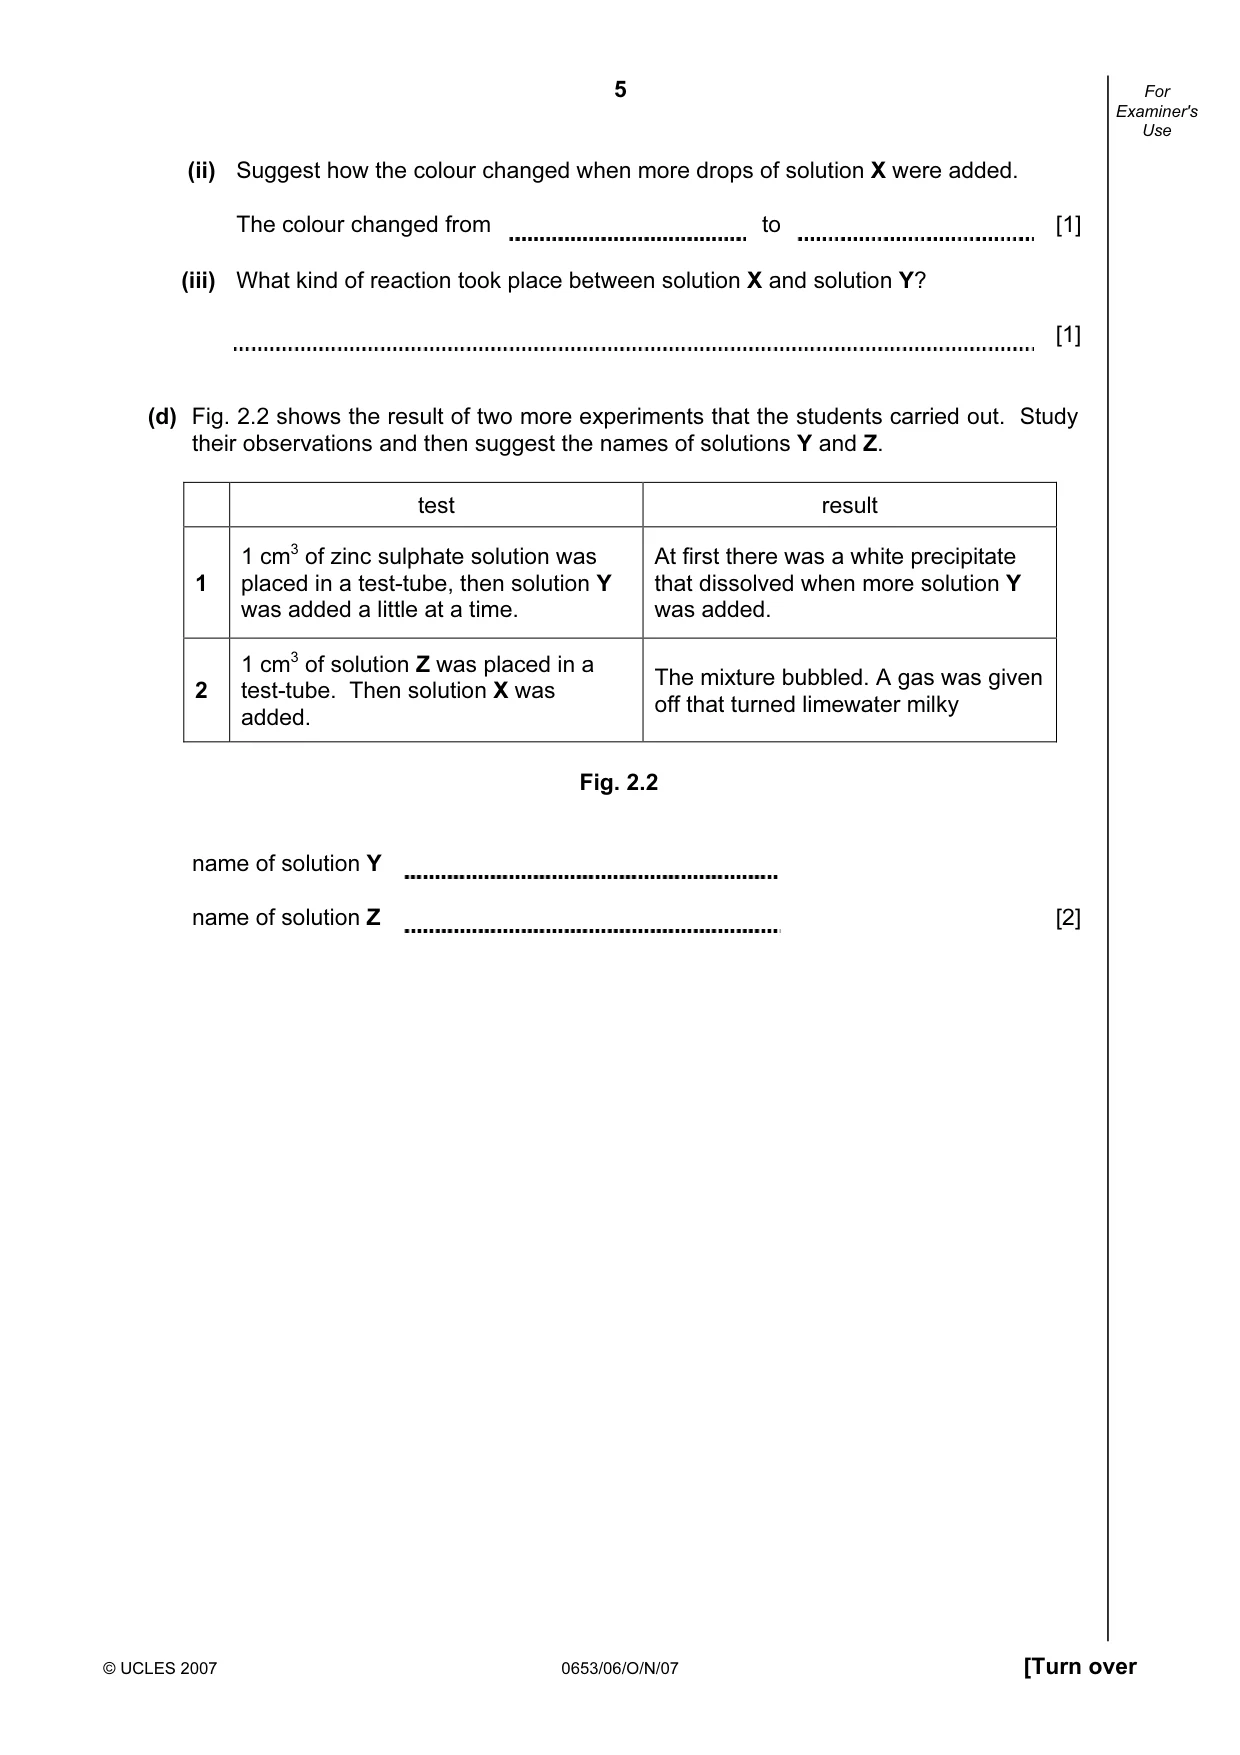
5 © UCLES 2007 0653/06/O/N/07 [Turn over For Examiner's Use (ii) Suggest how the colour changed when more drops of solution X were added. The colour changed from to [1] (iii) What kind of reaction took place between solution X and solution Y? [1] (d) Fig. 2.2 shows the result of two more experiments that the students carried out. Study their observations and then suggest the names of solutions Y and Z. test result 1 1 cm3 of zinc sulphate solution was placed in a test-tube, then solution Y was added a little at a time. At first there was a white precipitate that dissolved when more solution Y was added. 2 1 cm3 of solution Z was placed in a test-tube. Then solution X was added. The mixture bubbled. A gas was given off that turned limewater milky Fig. 2.2 name of solution Y name of solution Z [2]
Question paper, page 6
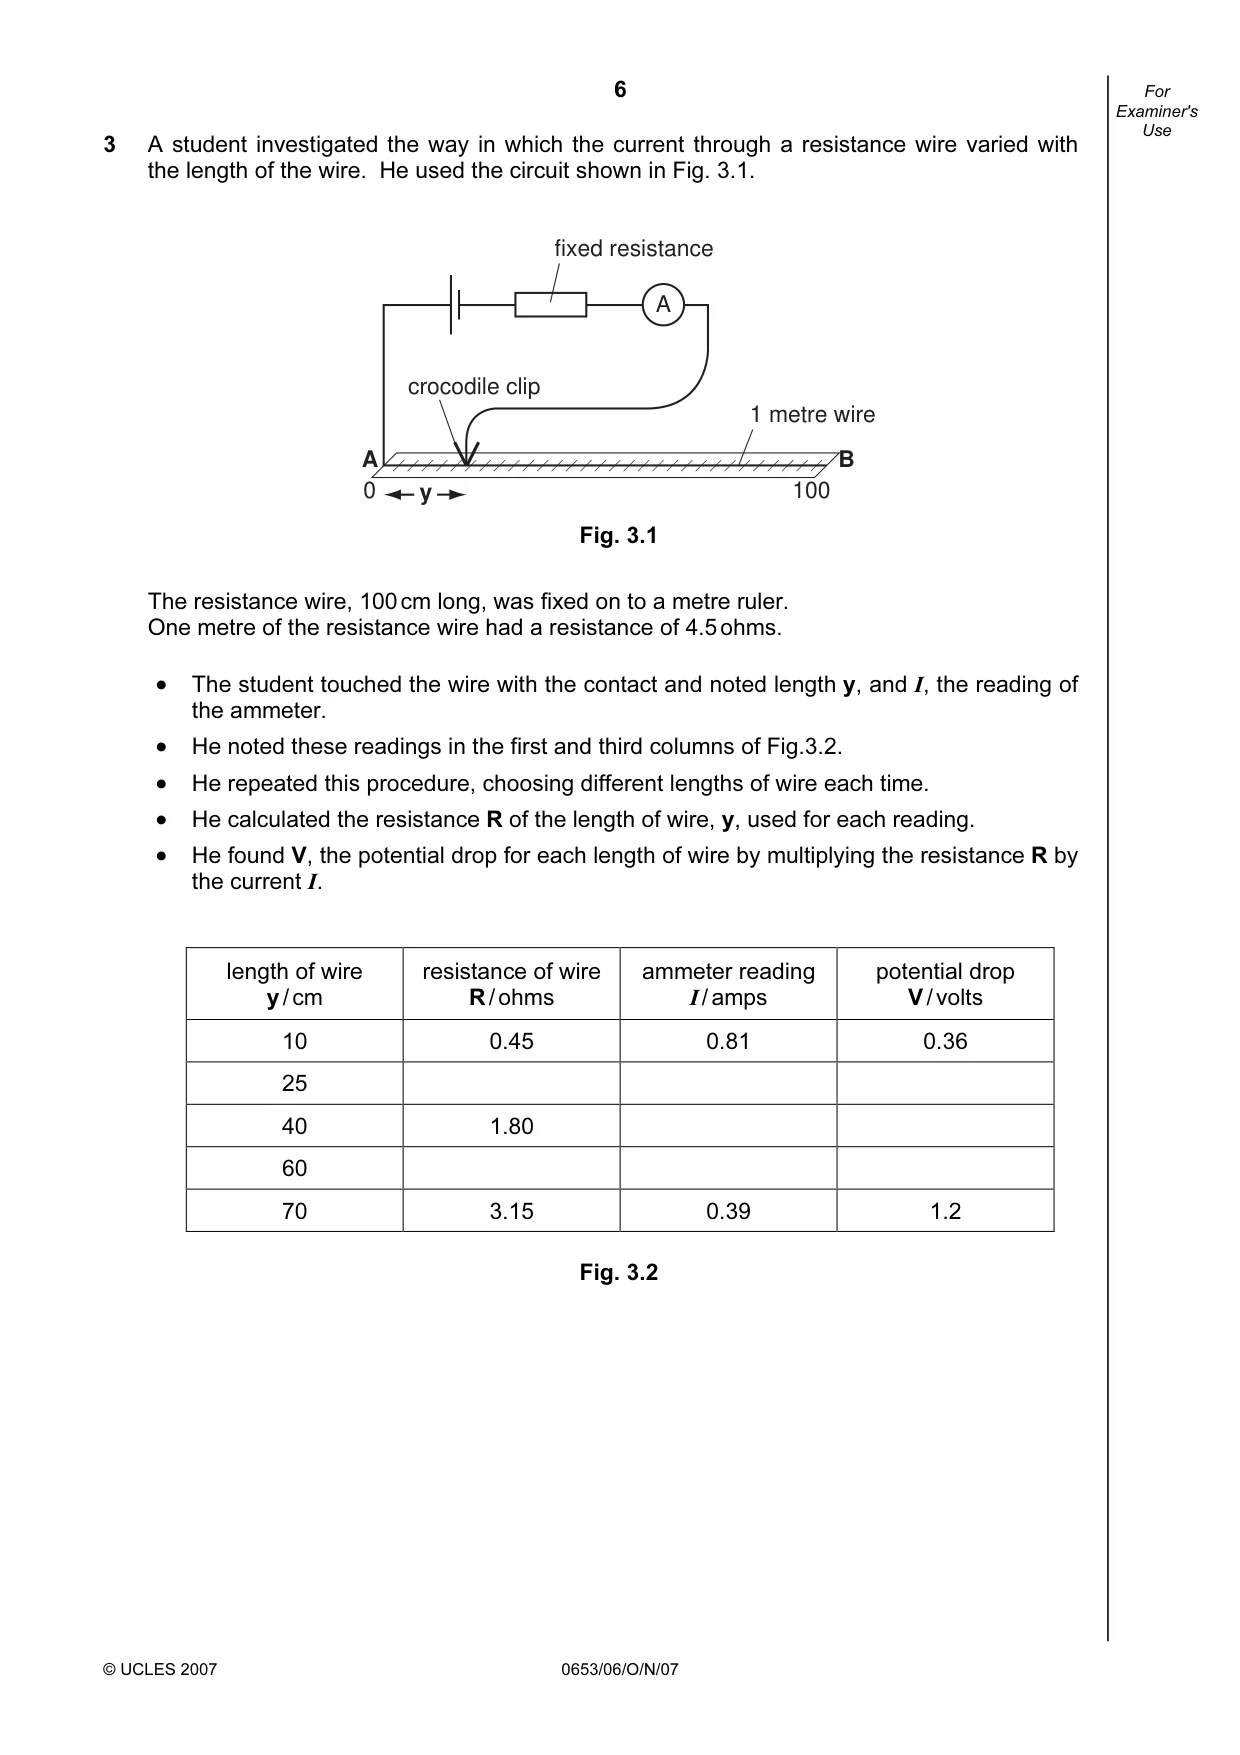
6 © UCLES 2007 0653/06/O/N/07 For Examiner's Use 3 A student investigated the way in which the current through a resistance wire varied with the length of the wire. He used the circuit shown in Fig. 3.1. A fixed resistance A B 0 100 1 metre wire crocodile clip y Fig. 3.1 The resistance wire, 100 cm long, was fixed on to a metre ruler. One metre of the resistance wire had a resistance of 4.5 ohms. • The student touched the wire with the contact and noted length y, and I, the reading of the ammeter. • He noted these readings in the first and third columns of Fig.3.2. • He repeated this procedure, choosing different lengths of wire each time. • He calculated the resistance R of the length of wire, y, used for each reading. • He found V, the potential drop for each length of wire by multiplying the resistance R by the current I. length of wire y / cm resistance of wire R / ohms ammeter reading I / amps potential drop V / volts 10 0.45 0.81 0.36 25 40 1.80 60 70 3.15 0.39 1.2 Fig. 3.2
Question paper, page 7
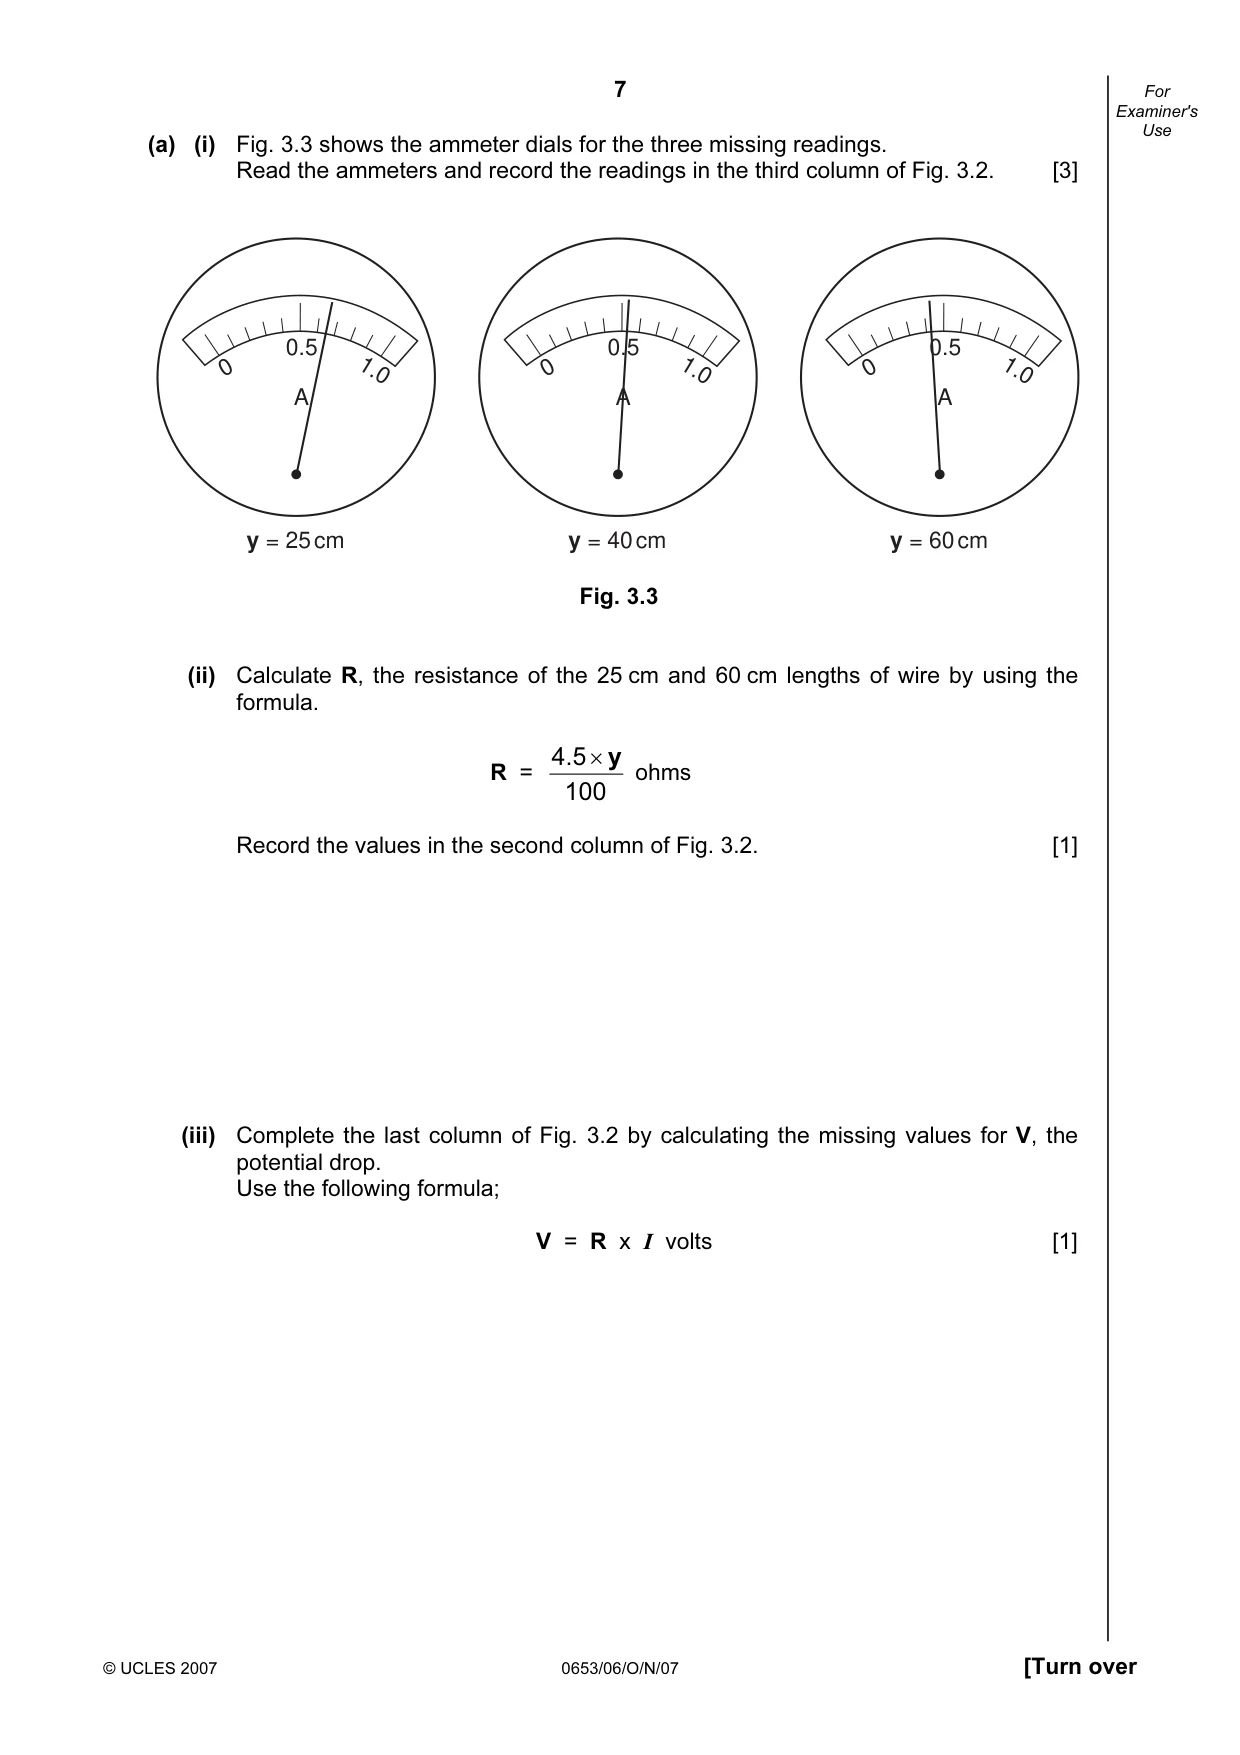
7 © UCLES 2007 0653/06/O/N/07 [Turn over For Examiner's Use (a) (i) Fig. 3.3 shows the ammeter dials for the three missing readings. Read the ammeters and record the readings in the third column of Fig. 3.2. [3] A 0.5 0 1.0 y = 25 cm A 0.5 0 1.0 y = 40 cm A 0.5 0 1.0 y = 60 cm Fig. 3.3 (ii) Calculate R, the resistance of the 25 cm and 60 cm lengths of wire by using the formula. R = 100 4.5 y × ohms Record the values in the second column of Fig. 3.2. [1] (iii) Complete the last column of Fig. 3.2 by calculating the missing values for V, the potential drop. Use the following formula; V = R x I volts [1]
Question paper, page 8
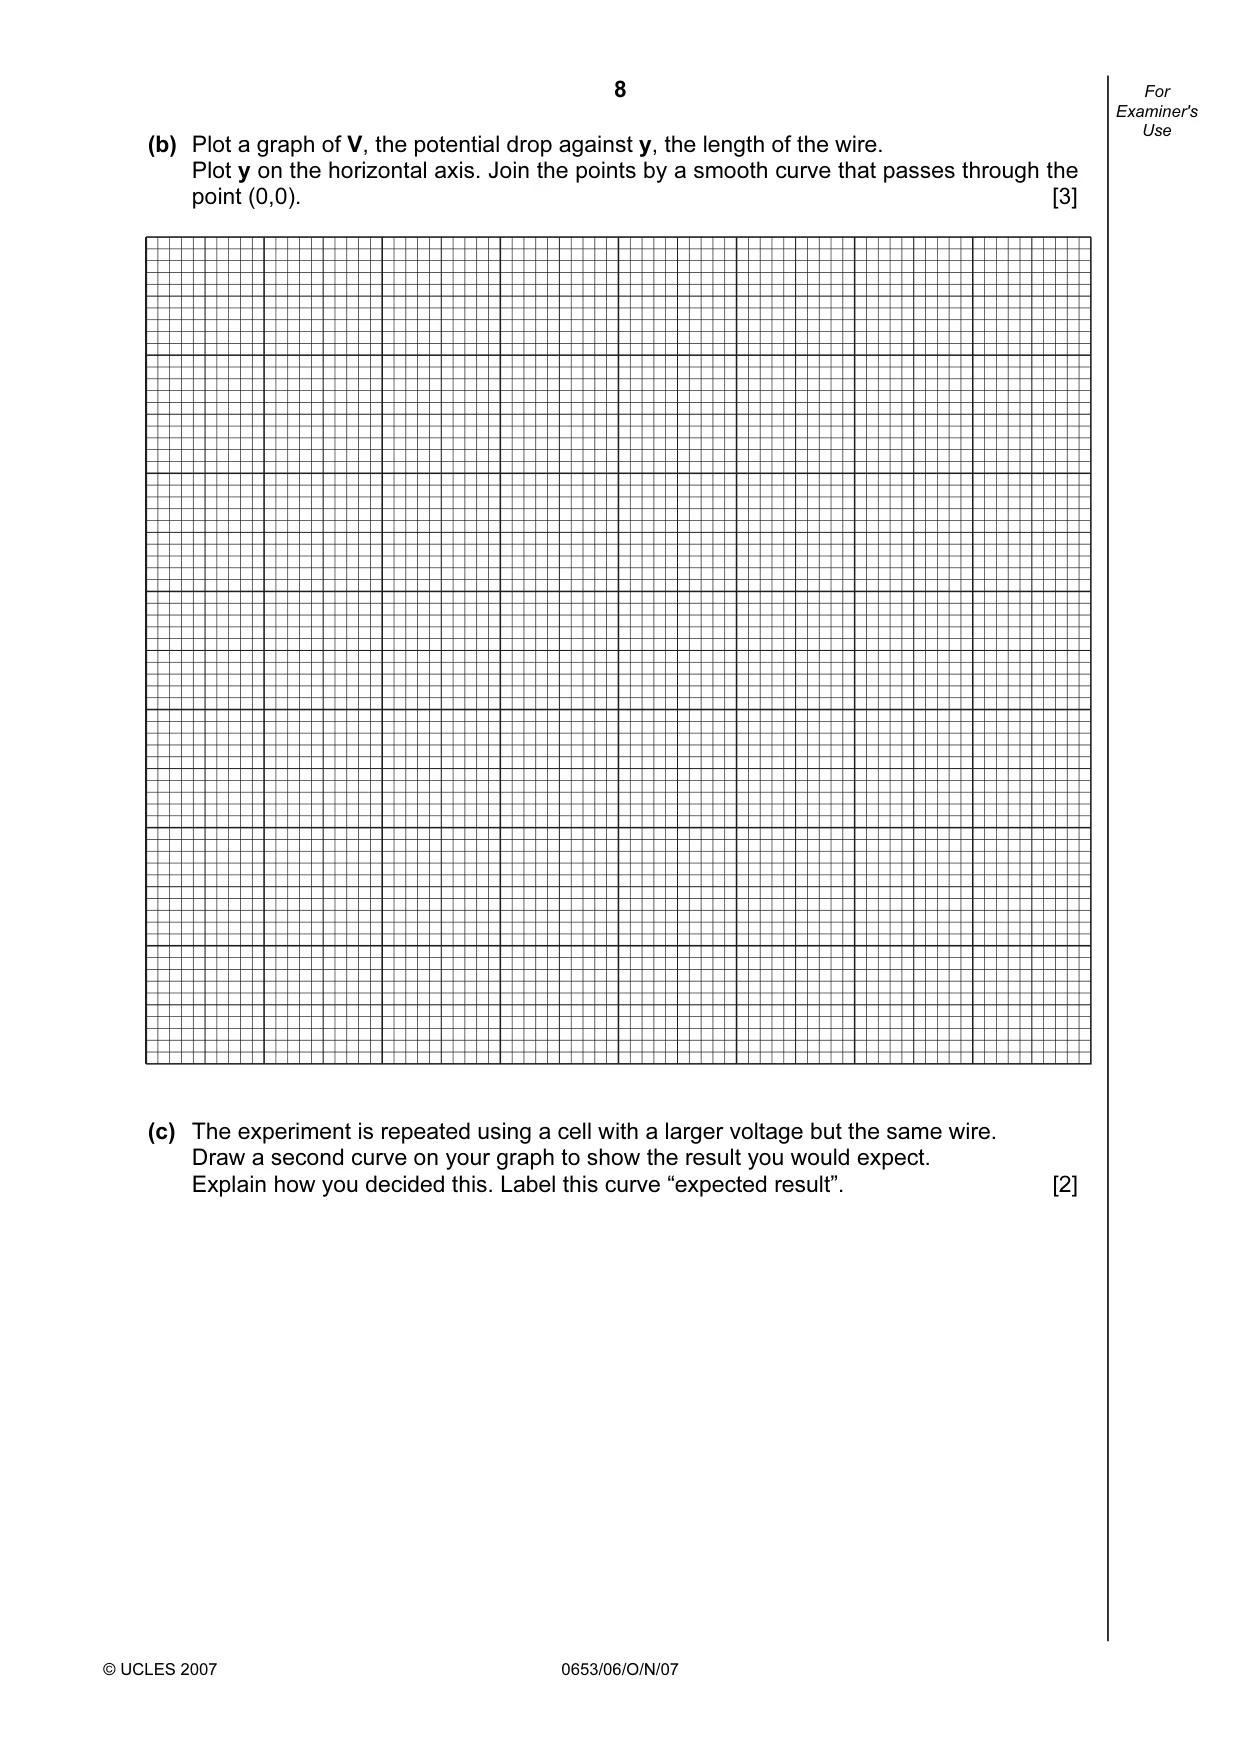
8 © UCLES 2007 0653/06/O/N/07 For Examiner's Use (b) Plot a graph of V, the potential drop against y, the length of the wire. Plot y on the horizontal axis. Join the points by a smooth curve that passes through the point (0,0). [3] (c) The experiment is repeated using a cell with a larger voltage but the same wire. Draw a second curve on your graph to show the result you would expect. Explain how you decided this. Label this curve “expected result”. [2]
Question paper, page 9
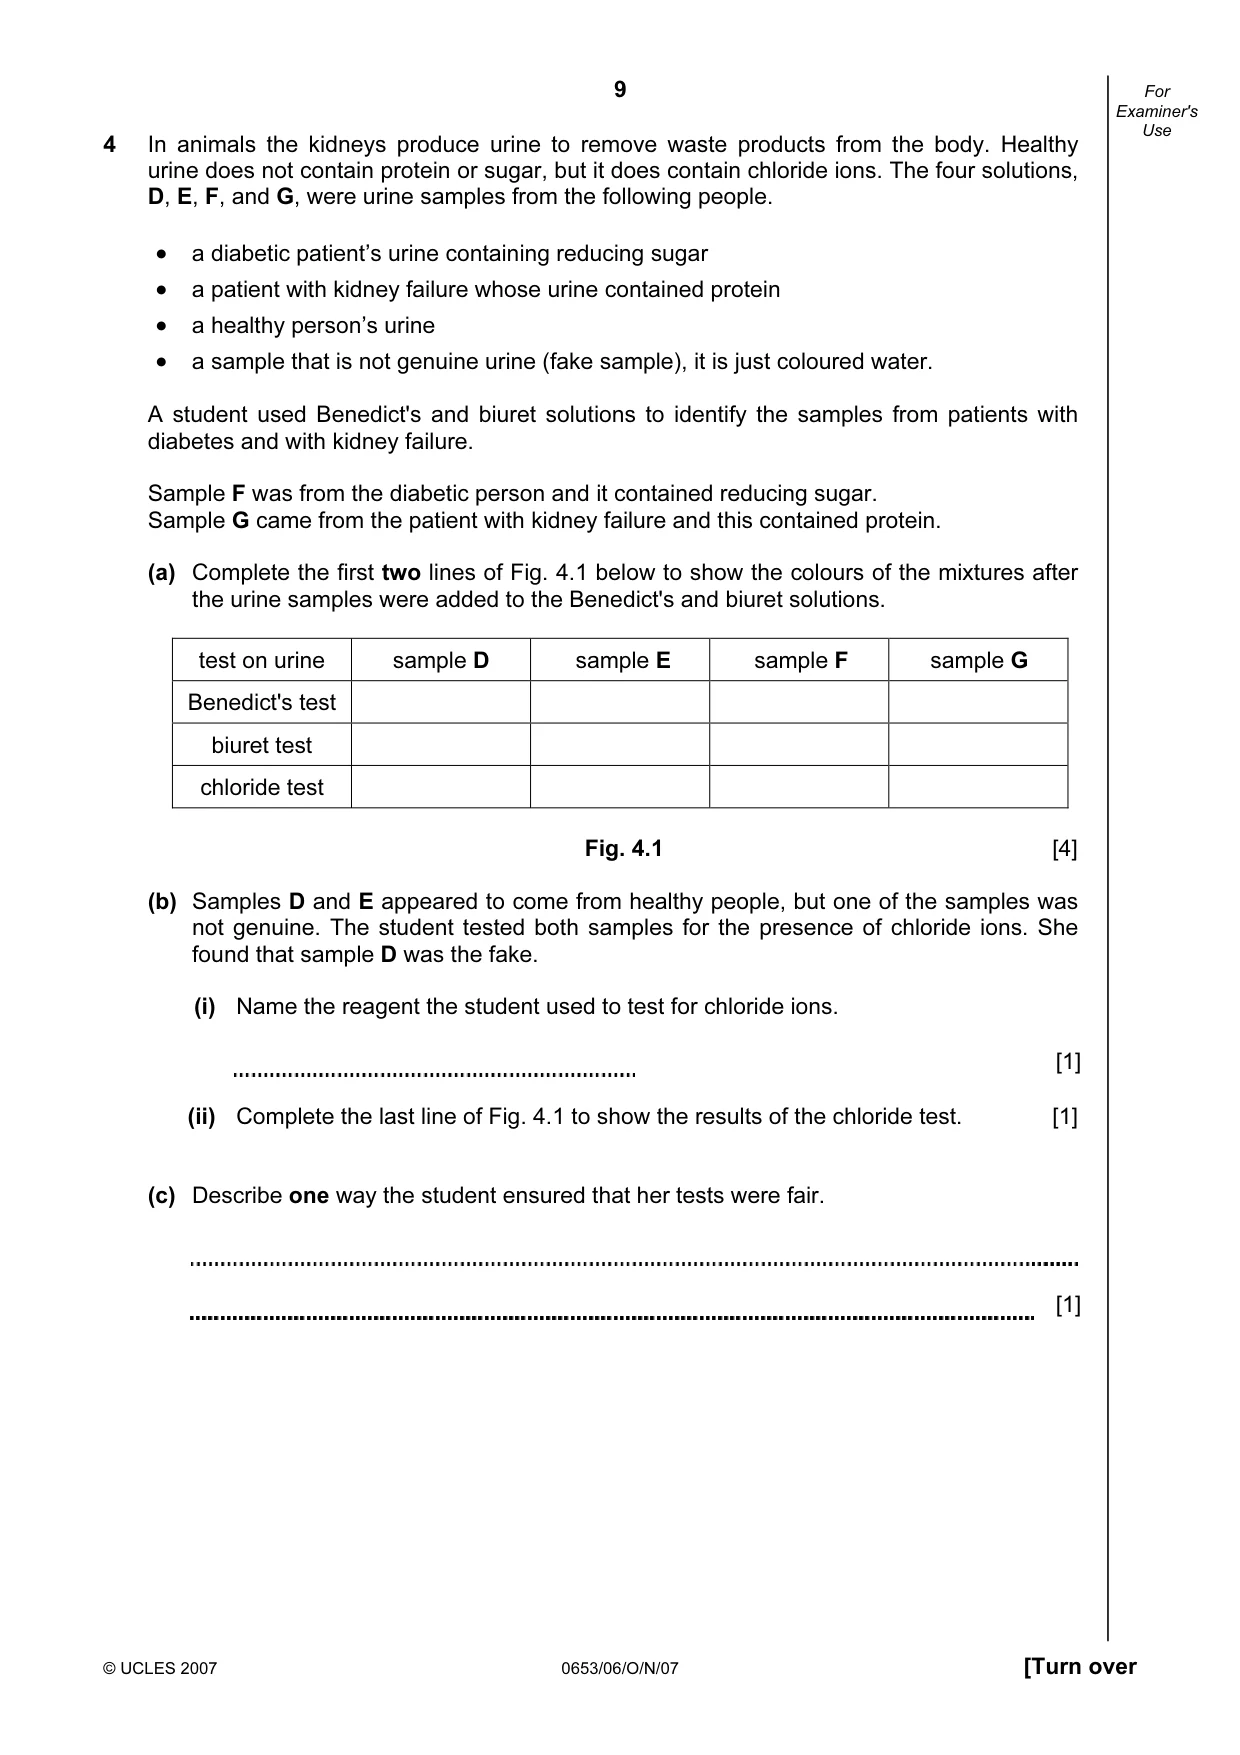
9 © UCLES 2007 0653/06/O/N/07 [Turn over For Examiner's Use 4 In animals the kidneys produce urine to remove waste products from the body. Healthy urine does not contain protein or sugar, but it does contain chloride ions. The four solutions, D, E, F, and G, were urine samples from the following people. • a diabetic patient’s urine containing reducing sugar • a patient with kidney failure whose urine contained protein • a healthy person’s urine • a sample that is not genuine urine (fake sample), it is just coloured water. A student used Benedict's and biuret solutions to identify the samples from patients with diabetes and with kidney failure. Sample F was from the diabetic person and it contained reducing sugar. Sample G came from the patient with kidney failure and this contained protein. (a) Complete the first two lines of Fig. 4.1 below to show the colours of the mixtures after the urine samples were added to the Benedict's and biuret solutions. test on urine sample D sample E sample F sample G Benedict's test biuret test chloride test Fig. 4.1 [4] (b) Samples D and E appeared to come from healthy people, but one of the samples was not genuine. The student tested both samples for the presence of chloride ions. She found that sample D was the fake. (i) Name the reagent the student used to test for chloride ions. [1] (ii) Complete the last line of Fig. 4.1 to show the results of the chloride test. [1] (c) Describe one way the student ensured that her tests were fair. [1]
Question paper, page 10
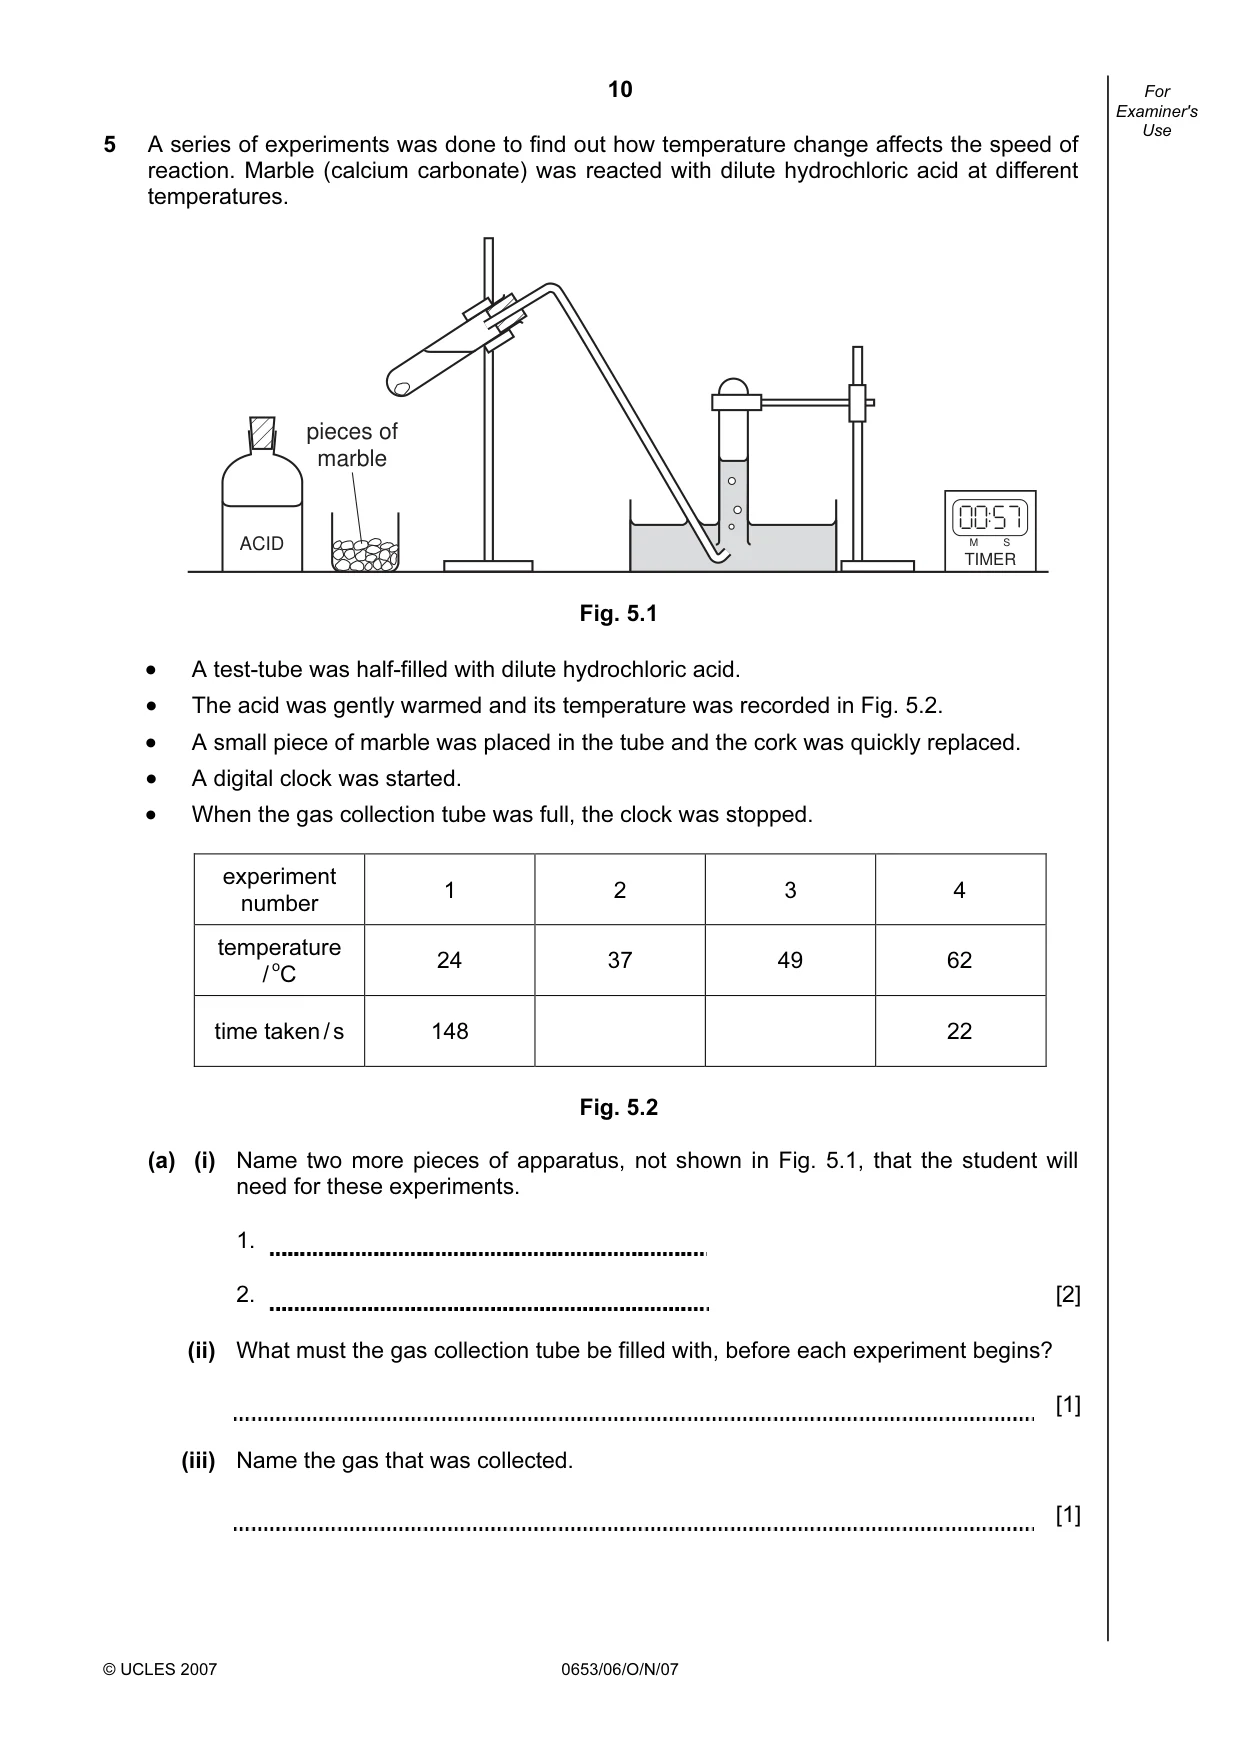
10 © UCLES 2007 0653/06/O/N/07 For Examiner's Use 5 A series of experiments was done to find out how temperature change affects the speed of reaction. Marble (calcium carbonate) was reacted with dilute hydrochloric acid at different temperatures. M S TIMER pieces of marble ACID Fig. 5.1 • A test-tube was half-filled with dilute hydrochloric acid. • The acid was gently warmed and its temperature was recorded in Fig. 5.2. • A small piece of marble was placed in the tube and the cork was quickly replaced. • A digital clock was started. • When the gas collection tube was full, the clock was stopped. experiment number 1 2 3 4 temperature / oC 24 37 49 62 time taken / s 148 22 Fig. 5.2 (a) (i) Name two more pieces of apparatus, not shown in Fig. 5.1, that the student will need for these experiments. 1. 2. [2] (ii) What must the gas collection tube be filled with, before each experiment begins? [1] (iii) Name the gas that was collected. [1]
Question paper, page 11
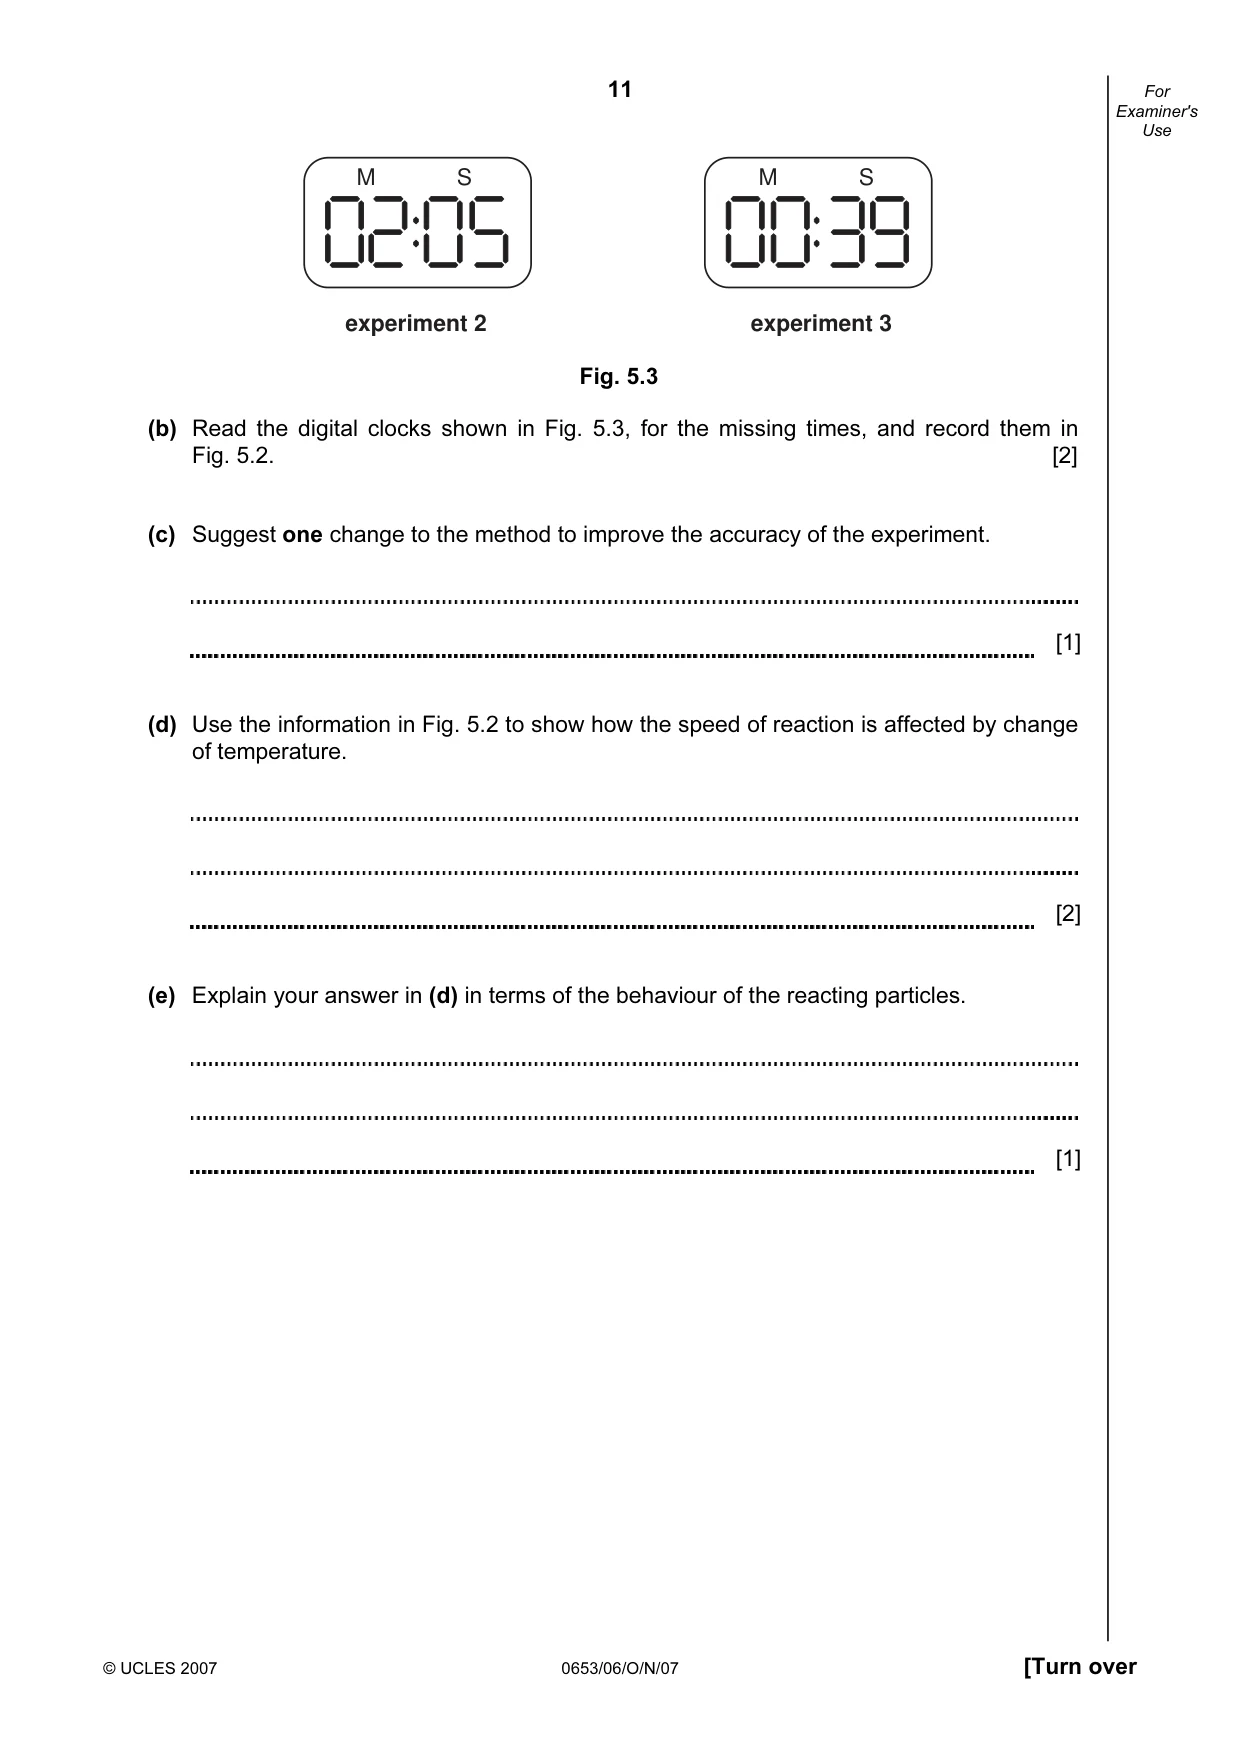
11 © UCLES 2007 0653/06/O/N/07 [Turn over For Examiner's Use M S M S experiment 2 experiment 3 Fig. 5.3 (b) Read the digital clocks shown in Fig. 5.3, for the missing times, and record them in Fig. 5.2. [2] (c) Suggest one change to the method to improve the accuracy of the experiment. [1] (d) Use the information in Fig. 5.2 to show how the speed of reaction is affected by change of temperature. [2] (e) Explain your answer in (d) in terms of the behaviour of the reacting particles. [1]
Question paper, page 12
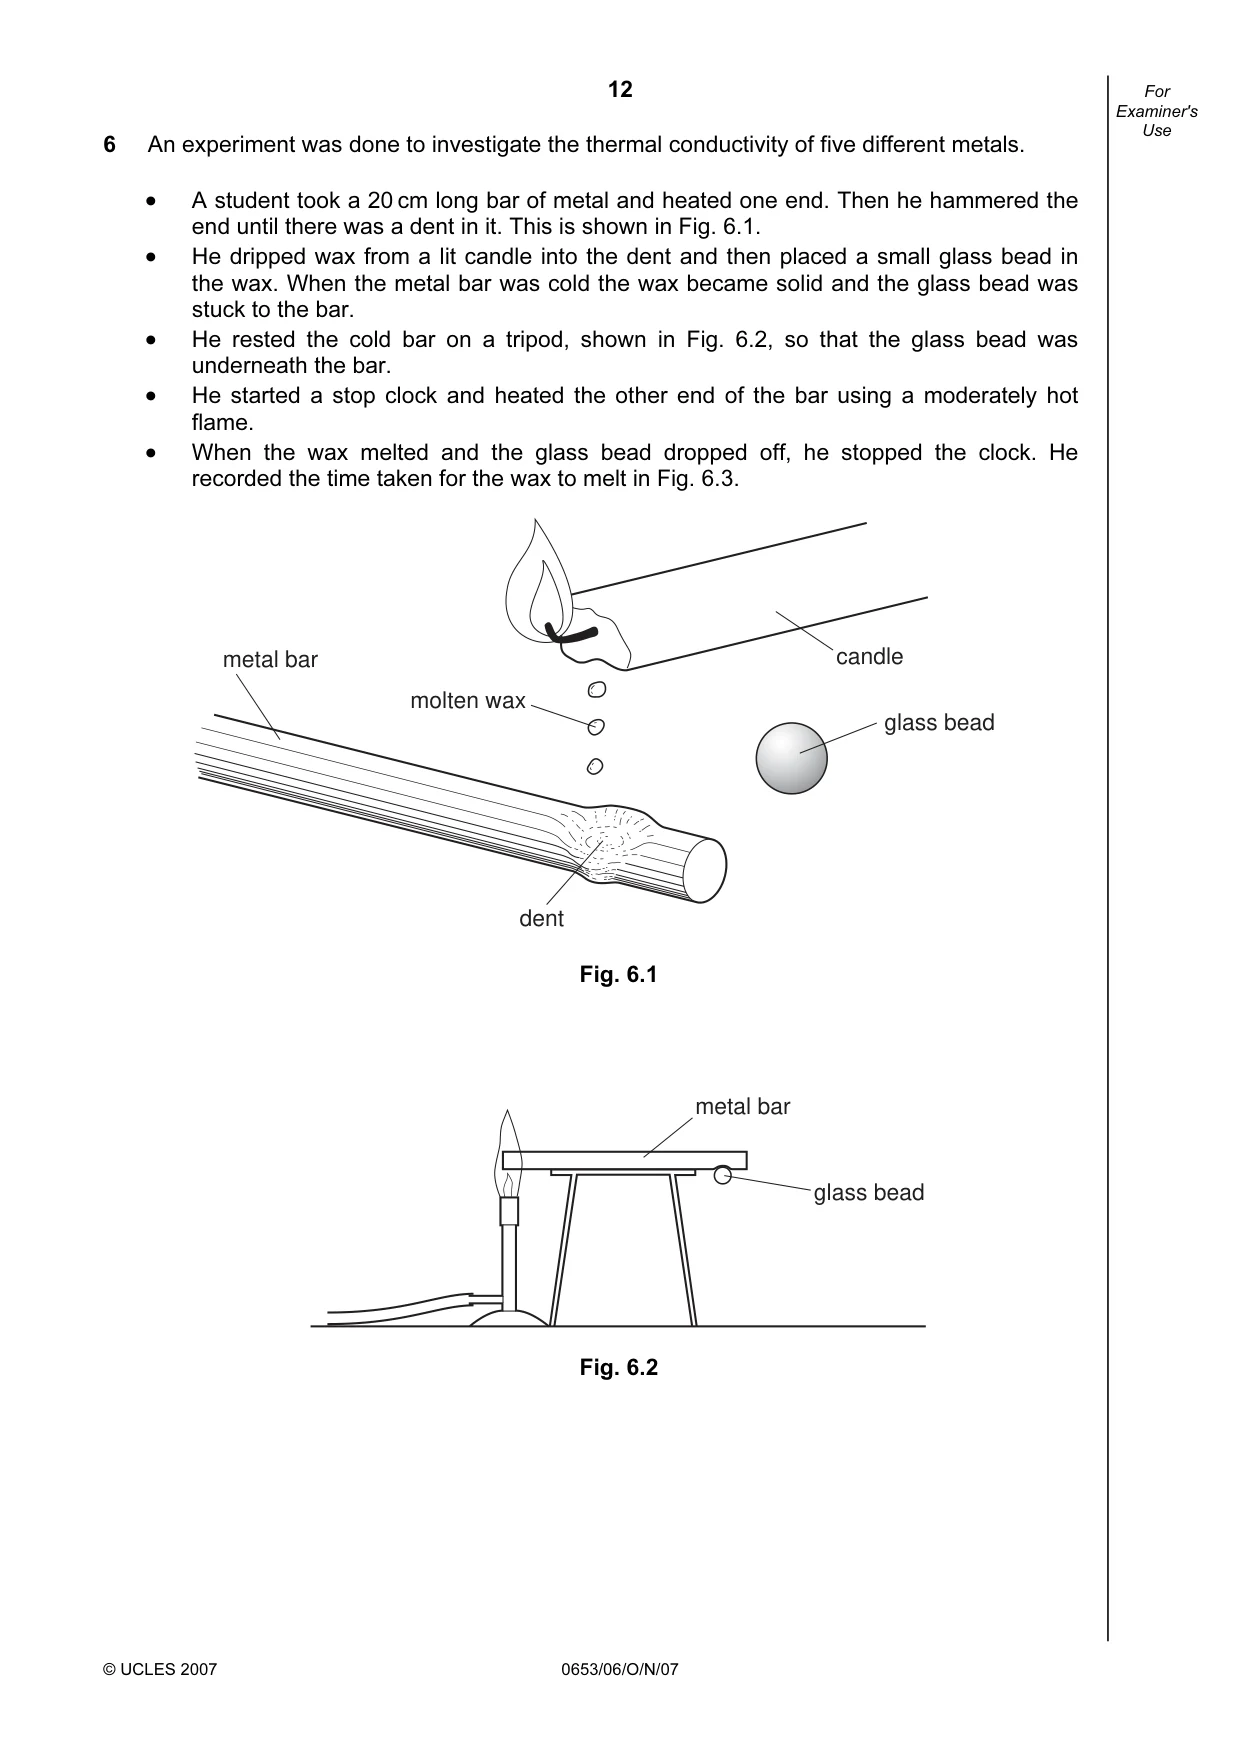
12 © UCLES 2007 0653/06/O/N/07 For Examiner's Use 6 An experiment was done to investigate the thermal conductivity of five different metals. • A student took a 20 cm long bar of metal and heated one end. Then he hammered the end until there was a dent in it. This is shown in Fig. 6.1. • He dripped wax from a lit candle into the dent and then placed a small glass bead in the wax. When the metal bar was cold the wax became solid and the glass bead was stuck to the bar. • He rested the cold bar on a tripod, shown in Fig. 6.2, so that the glass bead was underneath the bar. • He started a stop clock and heated the other end of the bar using a moderately hot flame. • When the wax melted and the glass bead dropped off, he stopped the clock. He recorded the time taken for the wax to melt in Fig. 6.3. metal bar molten wax dent glass bead candle Fig. 6.1 metal bar glass bead Fig. 6.2
Question paper, page 13
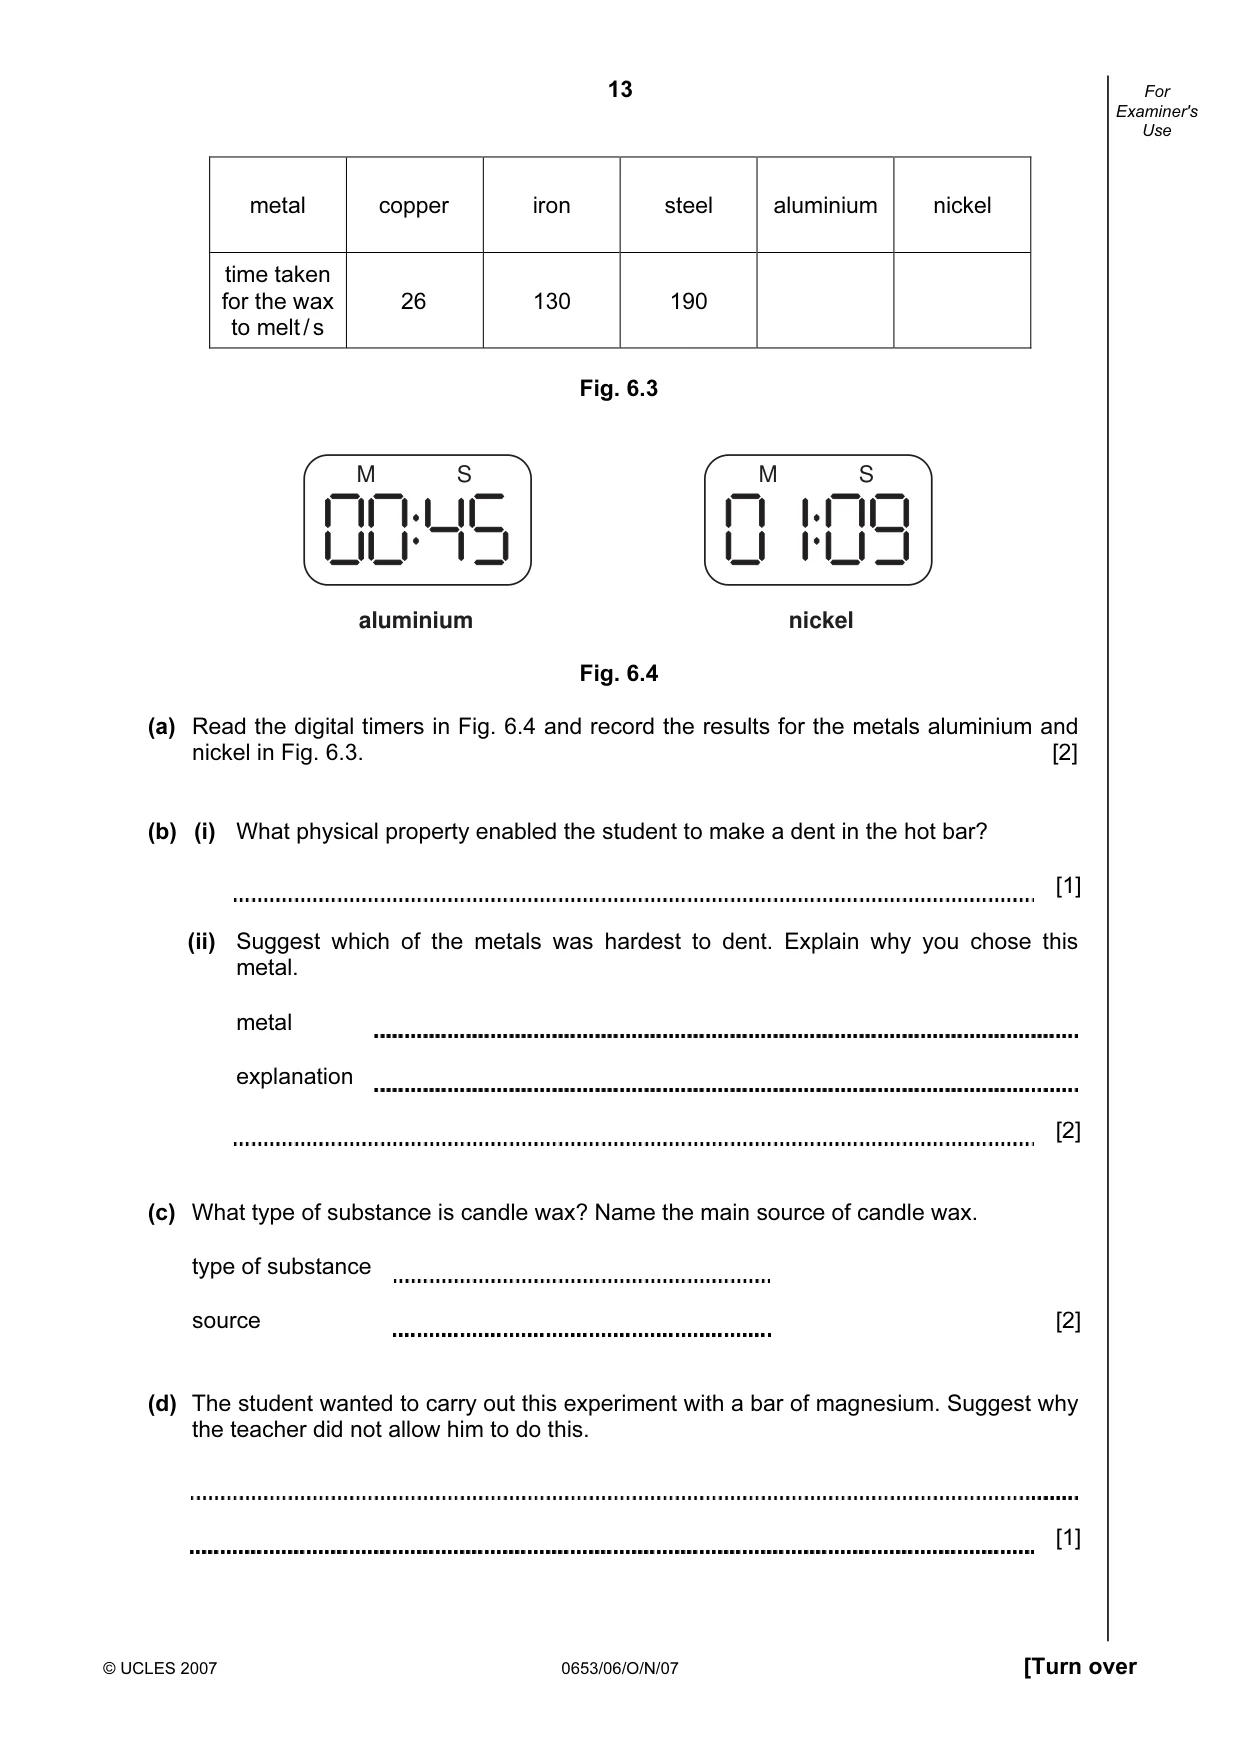
13 © UCLES 2007 0653/06/O/N/07 [Turn over For Examiner's Use metal copper iron steel aluminium nickel time taken for the wax to melt / s 26 130 190 Fig. 6.3 M S M S aluminium nickel Fig. 6.4 (a) Read the digital timers in Fig. 6.4 and record the results for the metals aluminium and nickel in Fig. 6.3. [2] (b) (i) What physical property enabled the student to make a dent in the hot bar? [1] (ii) Suggest which of the metals was hardest to dent. Explain why you chose this metal. metal explanation [2] (c) What type of substance is candle wax? Name the main source of candle wax. type of substance source [2] (d) The student wanted to carry out this experiment with a bar of magnesium. Suggest why the teacher did not allow him to do this. [1]
Question paper, page 14
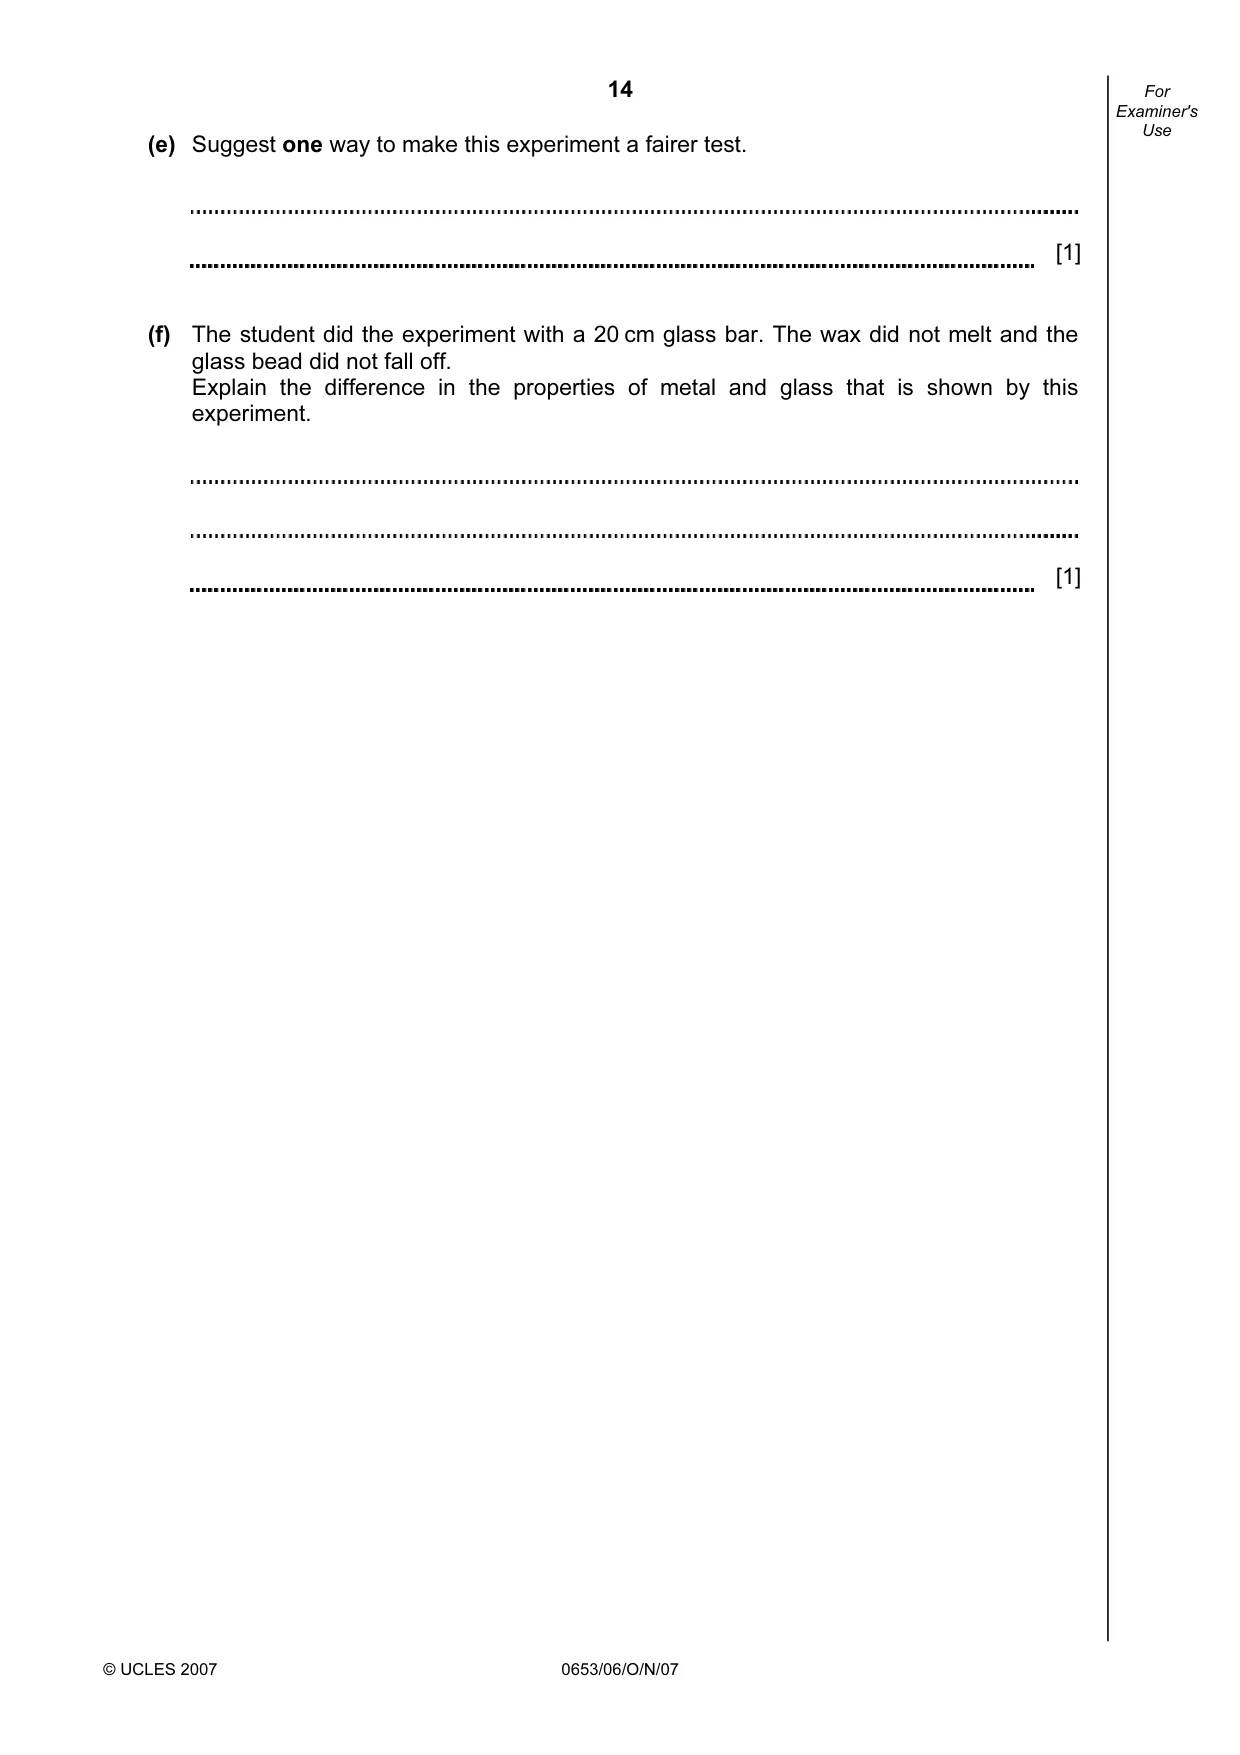
14 © UCLES 2007 0653/06/O/N/07 For Examiner's Use (e) Suggest one way to make this experiment a fairer test. [1] (f) The student did the experiment with a 20 cm glass bar. The wax did not melt and the glass bead did not fall off. Explain the difference in the properties of metal and glass that is shown by this experiment. [1]
Question paper, page 16
16 Permission to reproduce items where third-party owned material protected by copyright is included has been sought and cleared where possible. Every reasonable effort has been made by the publisher (UCLES) to trace copyright holders, but if any items requiring clearance have unwittingly been included, the publisher will be pleased to make amends at the earliest possible opportunity. University of Cambridge International Examinations is part of the Cambridge Assessment Group. Cambridge Assessment is the brand name of University of Cambridge Local Examinations Syndicate (UCLES), which is itself a department of the University of Cambridge. 0653/06/O/N/07 BLANK PAGE
Mark scheme, page 1
UNIVERSITY OF CAMBRIDGE INTERNATIONAL EXAMINATIONS International General Certificate of Secondary Education MARK SCHEME for the October/November 2007 question paper 0653 COMBINED SCIENCE 0654 CO-ORDINATED SCIENCES 0653/06 and 0654/06 Paper 6 (Alternative to Practical), maximum raw mark 60 This mark scheme is published as an aid to teachers and candidates, to indicate the requirements of the examination. It shows the basis on which Examiners were instructed to award marks. It does not indicate the details of the discussions that took place at an Examiners’ meeting before marking began. All Examiners are instructed that alternative correct answers and unexpected approaches in candidates’ scripts must be given marks that fairly reflect the relevant knowledge and skills demonstrated. Mark schemes must be read in conjunction with the question papers and the report on the examination. • CIE will not enter into discussions or correspondence in connection with these mark schemes. CIE is publishing the mark schemes for the October/November 2007 question papers for most IGCSE, GCE Advanced Level and Advanced Subsidiary Level syllabuses and some Ordinary Level syllabuses. www.XtremePapers.com
Mark scheme, page 2
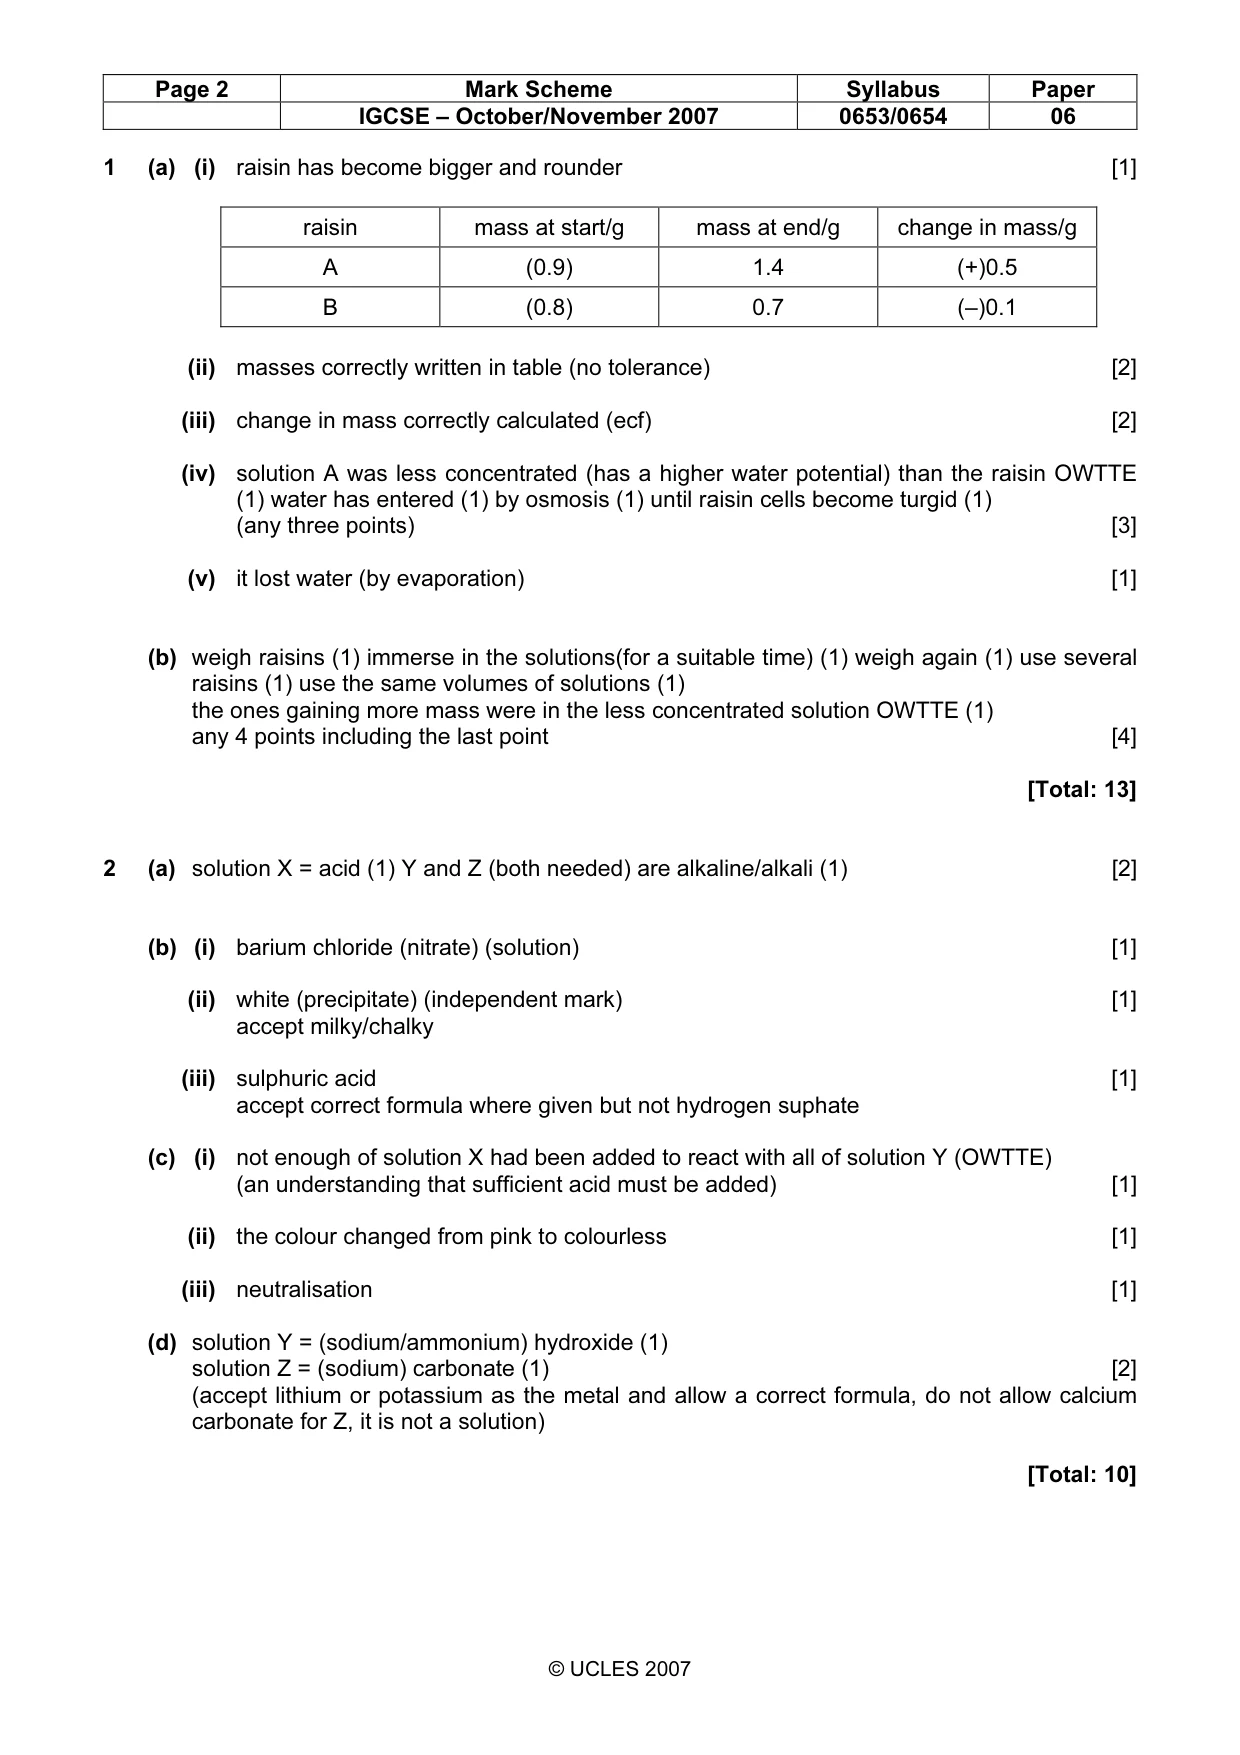
Page 2 Mark Scheme Syllabus Paper IGCSE – October/November 2007 0653/0654 06 © UCLES 2007 1 (a) (i) raisin has become bigger and rounder [1] raisin mass at start/g mass at end/g change in mass/g A (0.9) 1.4 (+)0.5 B (0.8) 0.7 (–)0.1 (ii) masses correctly written in table (no tolerance) [2] (iii) change in mass correctly calculated (ecf) [2] (iv) solution A was less concentrated (has a higher water potential) than the raisin OWTTE (1) water has entered (1) by osmosis (1) until raisin cells become turgid (1) (any three points) [3] (v) it lost water (by evaporation) [1] (b) weigh raisins (1) immerse in the solutions(for a suitable time) (1) weigh again (1) use several raisins (1) use the same volumes of solutions (1) the ones gaining more mass were in the less concentrated solution OWTTE (1) any 4 points including the last point [4] [Total: 13] 2 (a) solution X = acid (1) Y and Z (both needed) are alkaline/alkali (1) [2] (b) (i) barium chloride (nitrate) (solution) [1] (ii) white (precipitate) (independent mark) [1] accept milky/chalky (iii) sulphuric acid [1] accept correct formula where given but not hydrogen suphate (c) (i) not enough of solution X had been added to react with all of solution Y (OWTTE) (an understanding that sufficient acid must be added) [1] (ii) the colour changed from pink to colourless [1] (iii) neutralisation [1] (d) solution Y = (sodium/ammonium) hydroxide (1) solution Z = (sodium) carbonate (1) [2] (accept lithium or potassium as the metal and allow a correct formula, do not allow calcium carbonate for Z, it is not a solution) [Total: 10]
Mark scheme, page 3
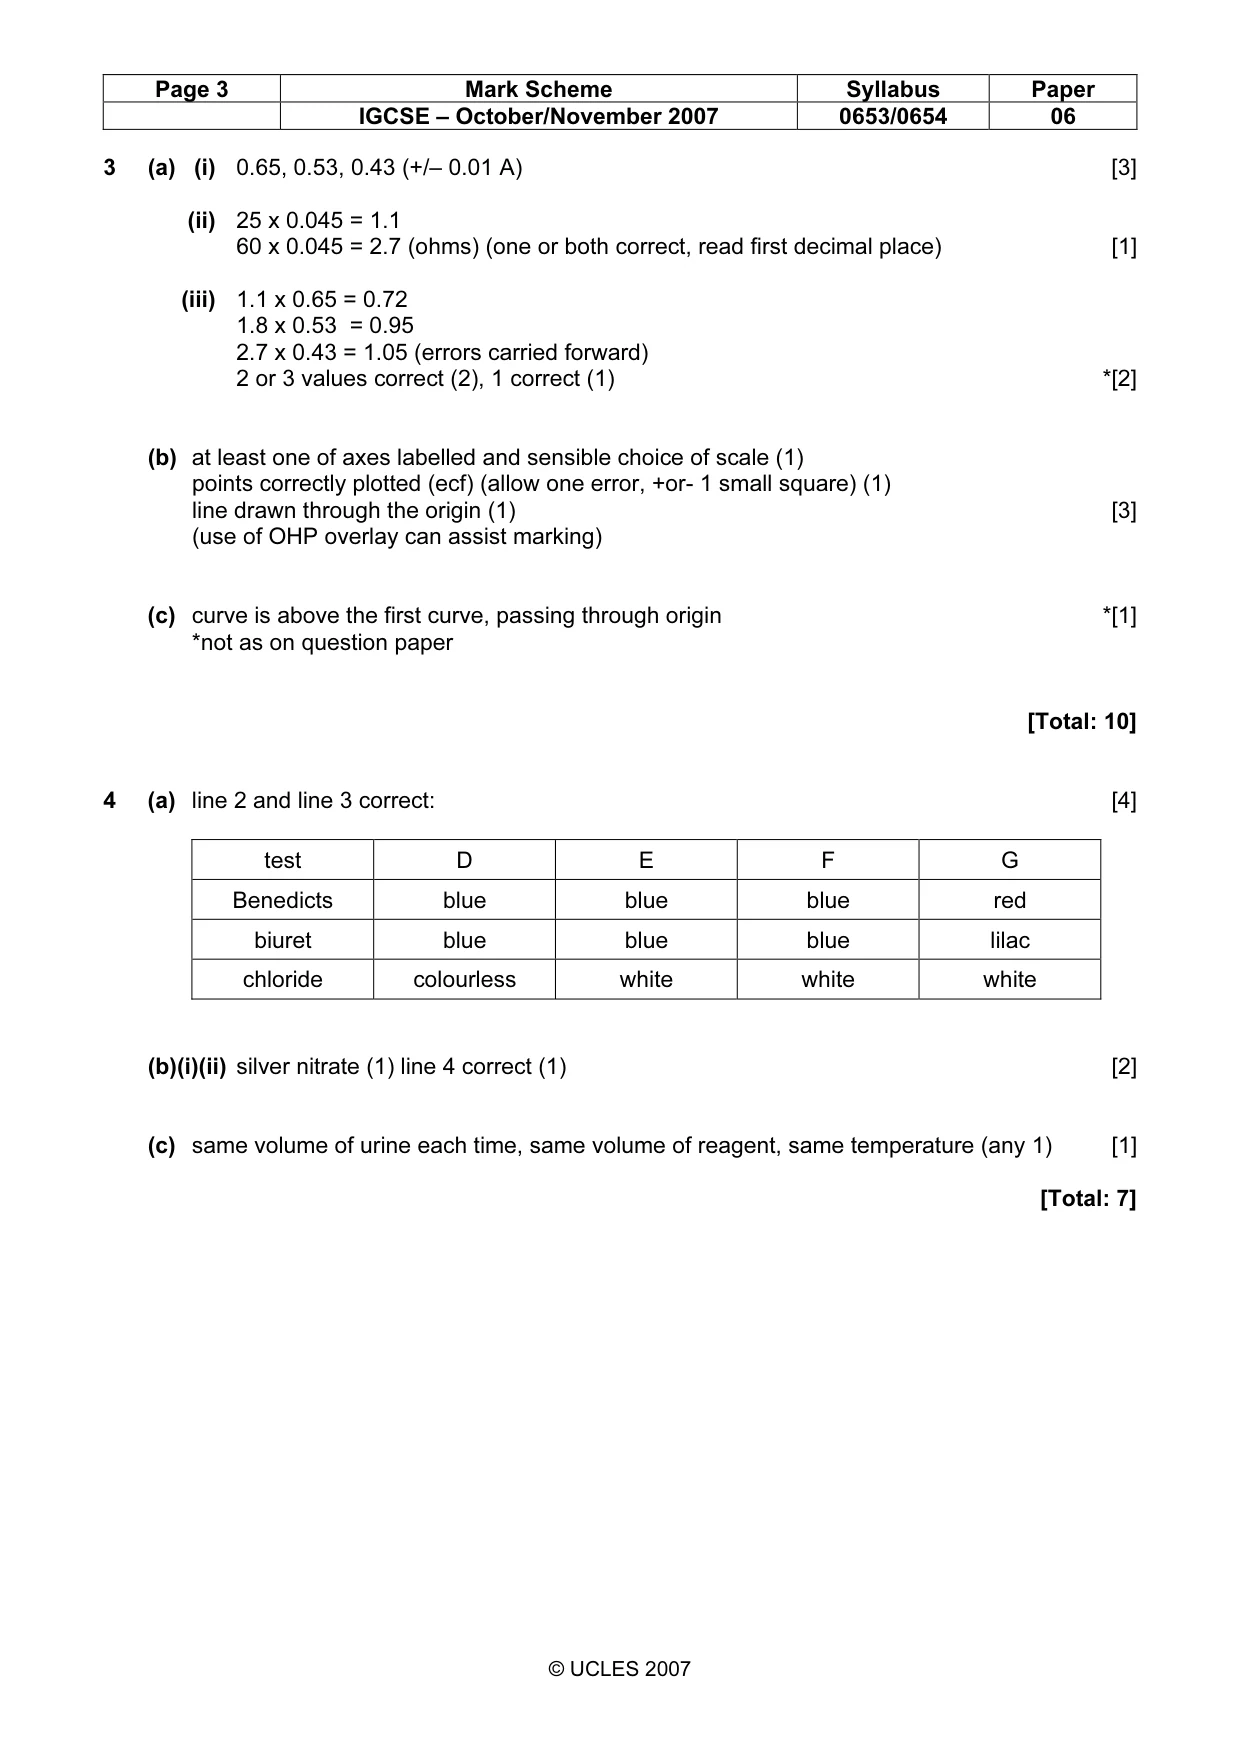
Page 3 Mark Scheme Syllabus Paper IGCSE – October/November 2007 0653/0654 06 © UCLES 2007 3 (a) (i) 0.65, 0.53, 0.43 (+/– 0.01 A) [3] (ii) 25 x 0.045 = 1.1 60 x 0.045 = 2.7 (ohms) (one or both correct, read first decimal place) [1] (iii) 1.1 x 0.65 = 0.72 1.8 x 0.53 = 0.95 2.7 x 0.43 = 1.05 (errors carried forward) 2 or 3 values correct (2), 1 correct (1) *[2] (b) at least one of axes labelled and sensible choice of scale (1) points correctly plotted (ecf) (allow one error, +or- 1 small square) (1) line drawn through the origin (1) [3] (use of OHP overlay can assist marking) (c) curve is above the first curve, passing through origin *[1] *not as on question paper [Total: 10] 4 (a) line 2 and line 3 correct: [4] test D E F G Benedicts blue blue blue red biuret blue blue blue lilac chloride colourless white white white (b)(i)(ii) silver nitrate (1) line 4 correct (1) [2] (c) same volume of urine each time, same volume of reagent, same temperature (any 1) [1] [Total: 7]
Mark scheme, page 4
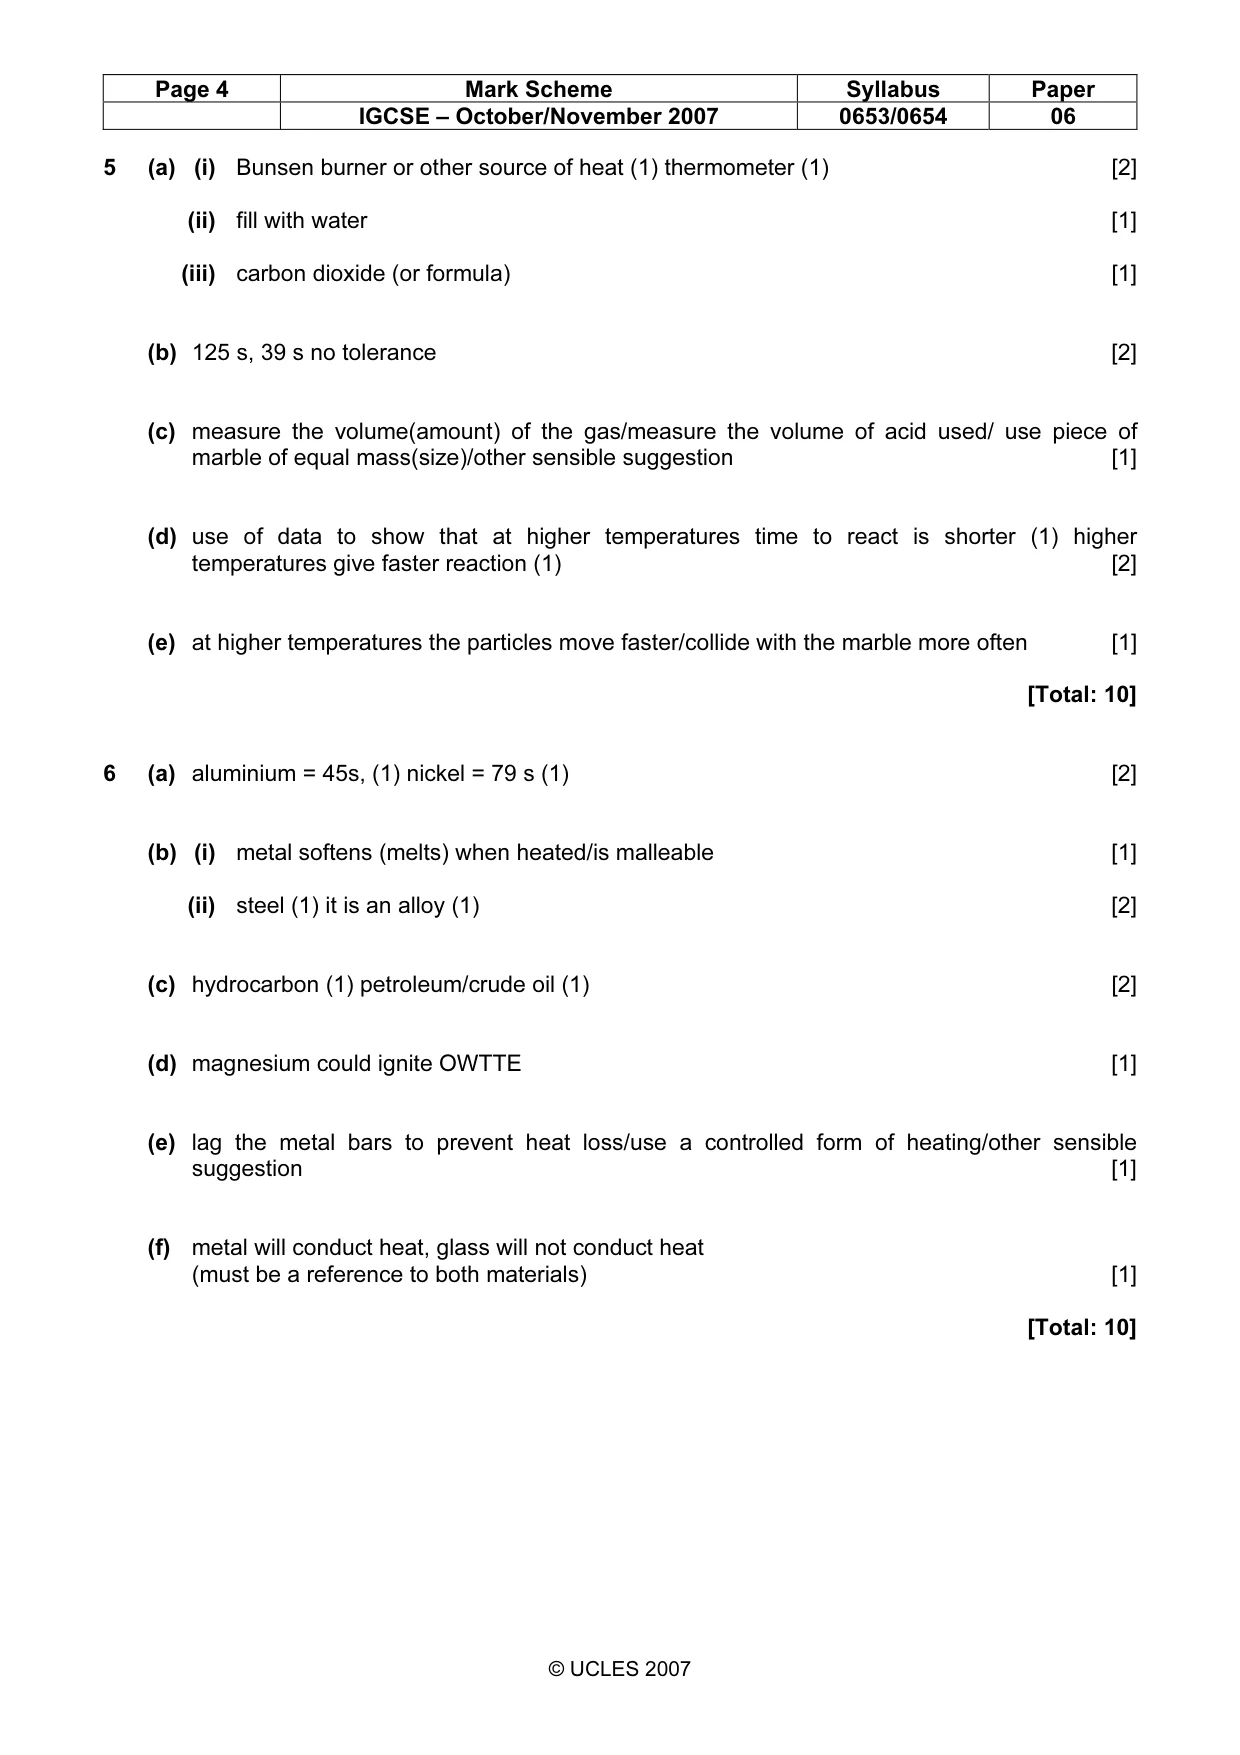
Page 4 Mark Scheme Syllabus Paper IGCSE – October/November 2007 0653/0654 06 © UCLES 2007 5 (a) (i) Bunsen burner or other source of heat (1) thermometer (1) [2] (ii) fill with water [1] (iii) carbon dioxide (or formula) [1] (b) 125 s, 39 s no tolerance [2] (c) measure the volume(amount) of the gas/measure the volume of acid used/ use piece of marble of equal mass(size)/other sensible suggestion [1] (d) use of data to show that at higher temperatures time to react is shorter (1) higher temperatures give faster reaction (1) [2] (e) at higher temperatures the particles move faster/collide with the marble more often [1] [Total: 10] 6 (a) aluminium = 45s, (1) nickel = 79 s (1) [2] (b) (i) metal softens (melts) when heated/is malleable [1] (ii) steel (1) it is an alloy (1) [2] (c) hydrocarbon (1) petroleum/crude oil (1) [2] (d) magnesium could ignite OWTTE [1] (e) lag the metal bars to prevent heat loss/use a controlled form of heating/other sensible suggestion [1] (f) metal will conduct heat, glass will not conduct heat (must be a reference to both materials) [1] [Total: 10]
What you needed in this session
Cambridge’s own grade thresholds for 2007 Oct/Nov, Paper 6 · Variant 1. A higher threshold means an easier paper — the bar moves with how the cohort did.