Cambridge IGCSE Sciences - Co-ordinated (Double) 0654 — 2003 May/June Paper 6 · Variant 1
0654/61/M/J/03
The question paper and its mark scheme, free to read here and free to download. This is Cambridge’s own paper, exactly as it was sat.
Question paper16 pages

Mark scheme
No mark scheme is in the library for this paper.
Paper as text
Question paper, page 1
This document consists of 15 printed pages and 1 blank page. SP (SM/KN) S41614/2 © CIE 2003 [Turn over CAMBRIDGE INTERNATIONAL EXAMINATIONS International General Certificate of Secondary Education COMBINED SCIENCE 0653/06 CO-ORDINATED SCIENCES 0654/06 Paper 6 Alternative to Practical May/June 2003 1 hour Candidates answer on the Question Paper. No Additional Materials are required. READ THESE INSTRUCTIONS FIRST Write your Centre number, candidate number and name on all the work you hand in. Write in dark blue or black pen in the spaces provided on the Question Paper. You may use a soft pencil for any diagrams, graphs or rough working. Do not use staples, paper clips, highlighters, glue or correction fluid. Answer all questions. At the end of the examination, fasten all your work securely together. The number of marks is given in brackets [ ] at the end of each question or part question. Centre Number Candidate Number Name If you have been given a label, look at the details. If any details are incorrect or missing, please fill in your correct details in the space given at the top of this page. Stick your personal label here, if provided. For Examiner’s Use 1 2 3 4 5 6 Total www.XtremePapers.com
Question paper, page 2
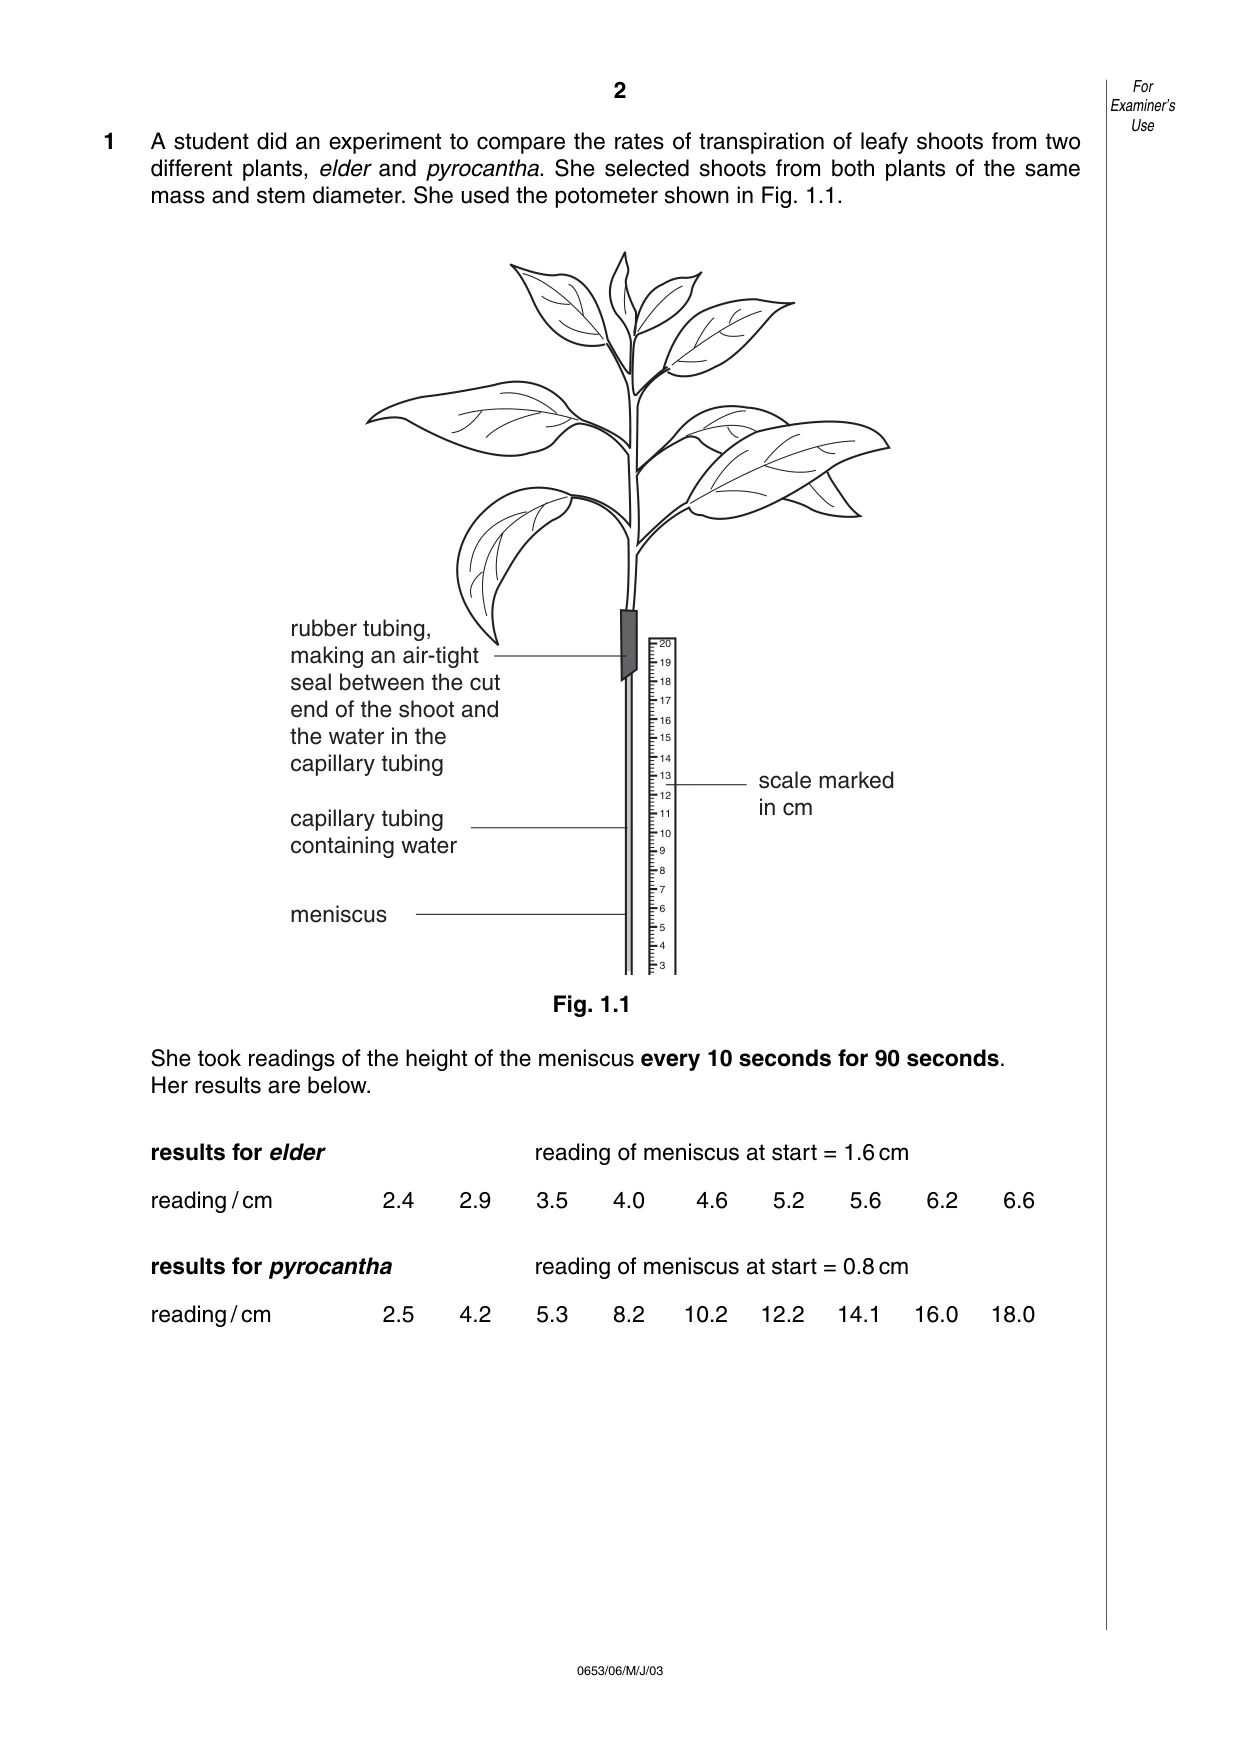
2 0653/06/M/J/03 1 A student did an experiment to compare the rates of transpiration of leafy shoots from two different plants, elder and pyrocantha. She selected shoots from both plants of the same mass and stem diameter. She used the potometer shown in Fig. 1.1. Fig. 1.1 She took readings of the height of the meniscus every 10 seconds for 90 seconds. Her results are below. results for elder reading of meniscus at start = 1.6 cm reading / cm 2.4 2.9 3.5 4.0 4.6 5.2 5.6 6.2 6.6 results for pyrocantha reading of meniscus at start = 0.8 cm reading / cm 2.5 4.2 5.3 8.2 10.2 12.2 14.1 16.0 18.0 rubber tubing, making an air-tight seal between the cut end of the shoot and the water in the capillary tubing capillary tubing containing water meniscus scale marked in cm 4 6 5 3 8 7 10 12 11 9 14 13 15 16 18 17 19 20 For Examiner’s Use
Question paper, page 3
3 0653/06/M/J/03 [Turn over (a) Construct a table showing times and readings in the space below. [3] (b) Work out the average water loss for each plant in centimetres of water per second. Show your working. elder average water loss = … cm / s pyrocantha average water loss = … cm / s [4] (c) Suggest one difference between the shoots that could account for the different rates of water loss. Explain your answer. difference … explanation … …[2] (d) Name one environmental factor that could account for the different rates of water loss of the two shoots. …[1] For Examiner’s Use
Question paper, page 4
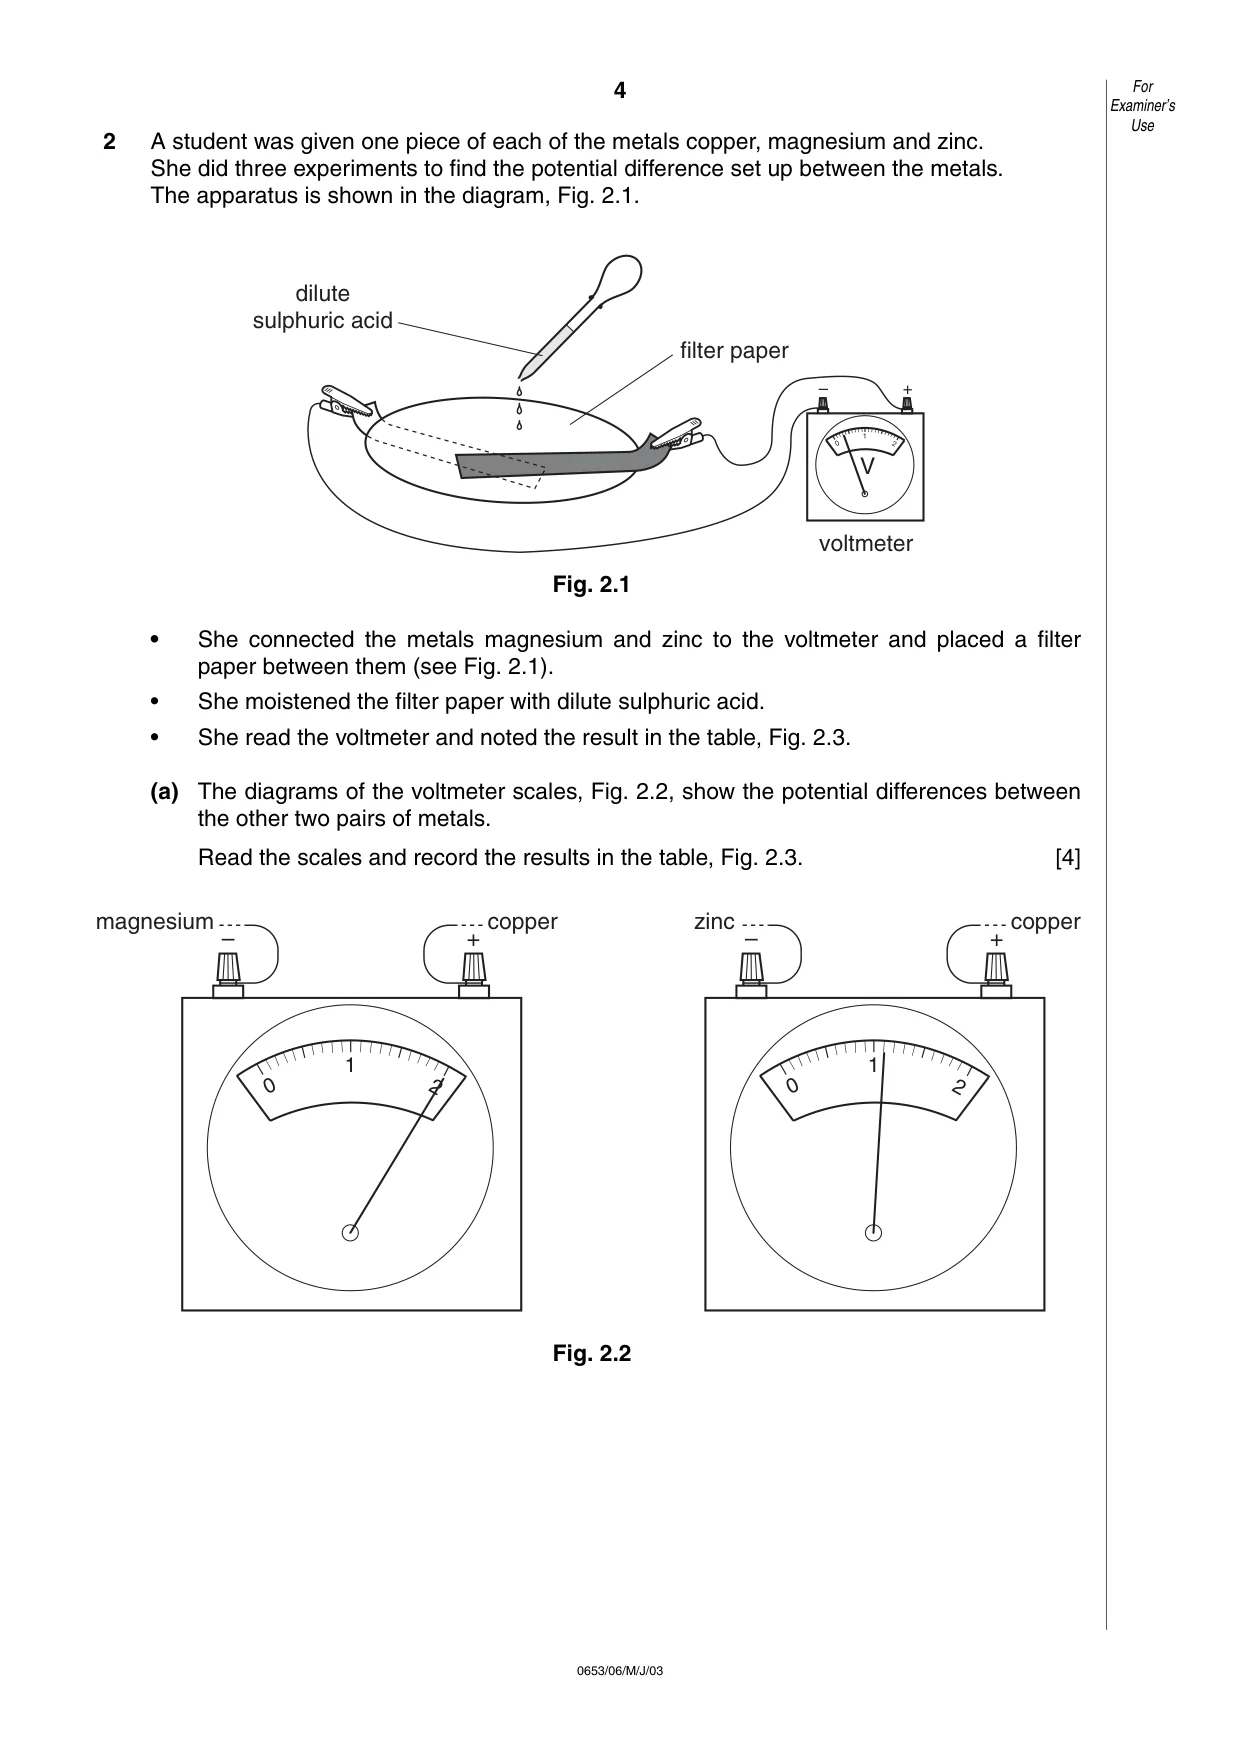
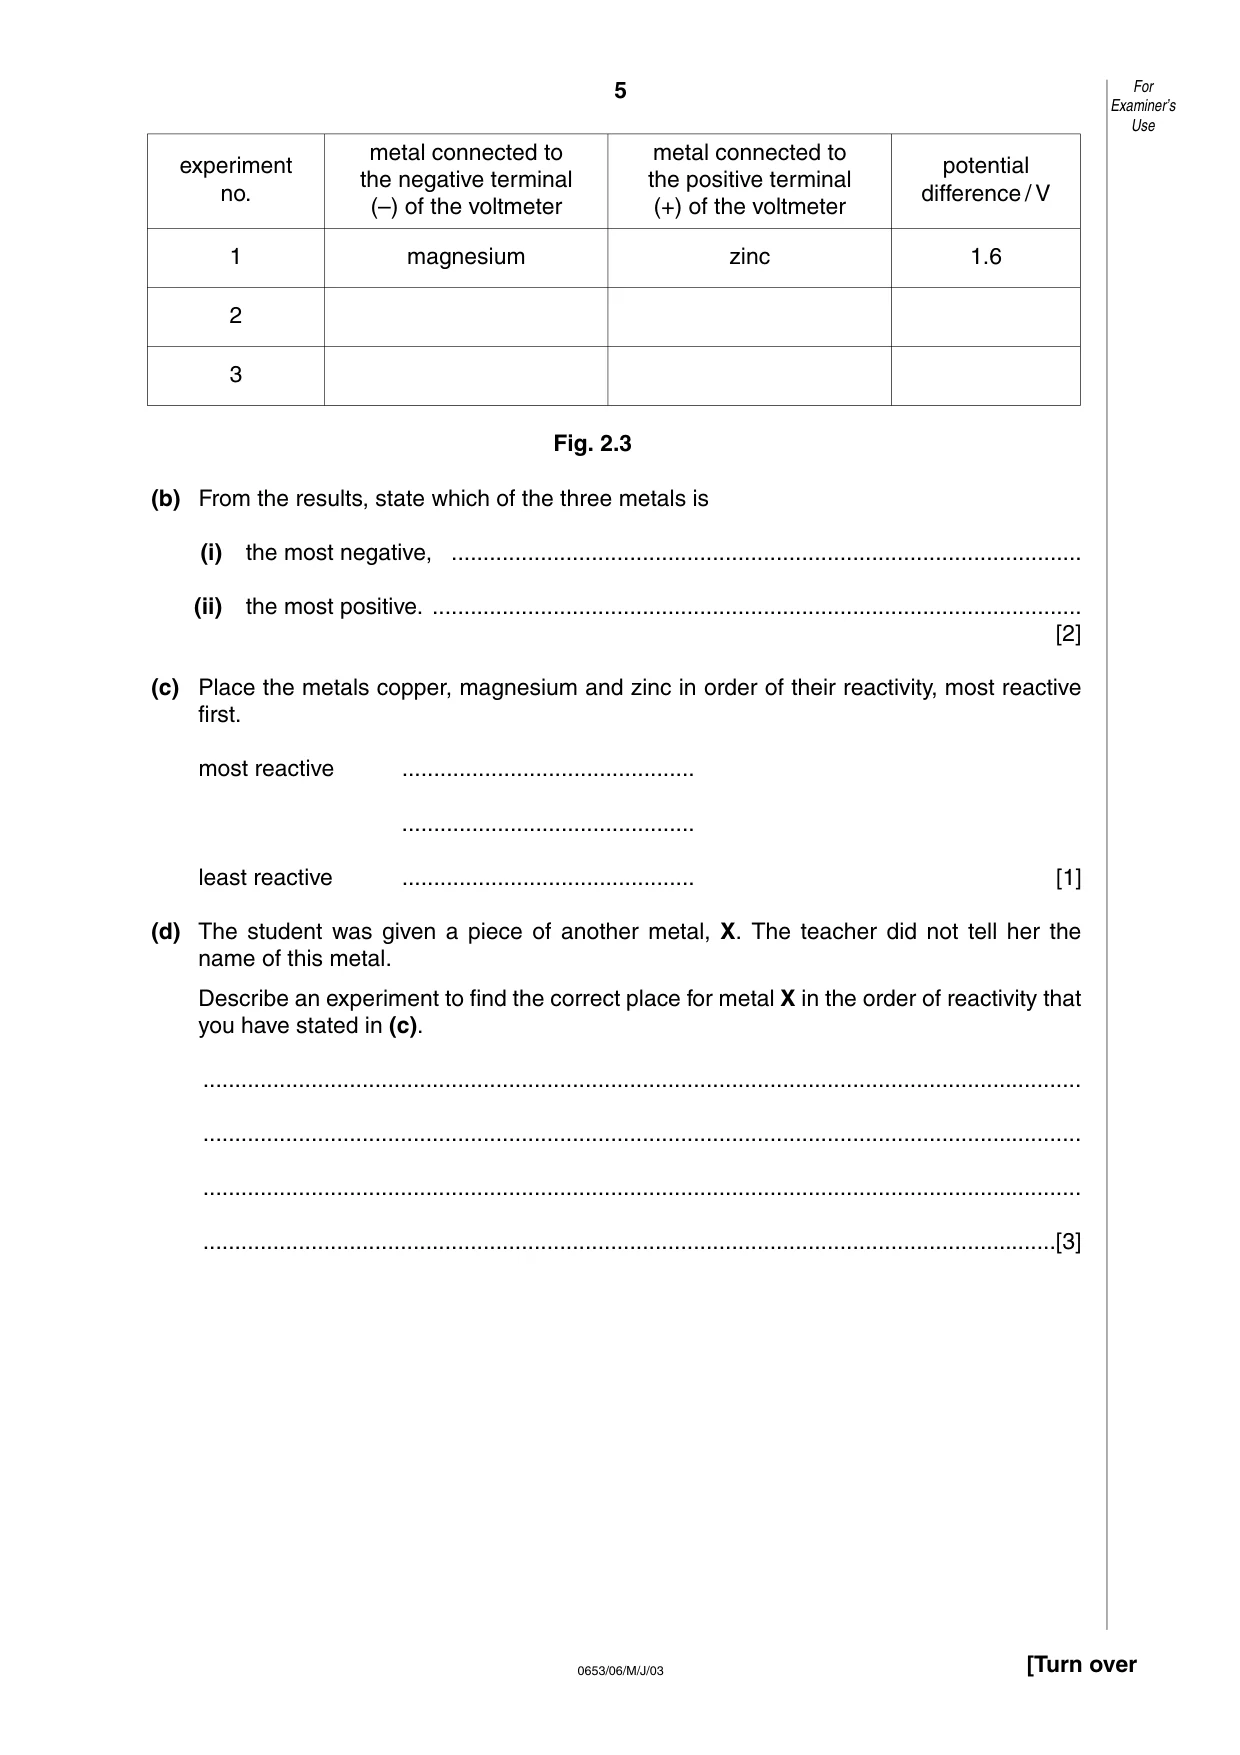
4 0653/06/M/J/03 2 A student was given one piece of each of the metals copper, magnesium and zinc. She did three experiments to find the potential difference set up between the metals. The apparatus is shown in the diagram, Fig. 2.1. Fig. 2.1 • She connected the metals magnesium and zinc to the voltmeter and placed a filter paper between them (see Fig. 2.1). • She moistened the filter paper with dilute sulphuric acid. • She read the voltmeter and noted the result in the table, Fig. 2.3. (a) The diagrams of the voltmeter scales, Fig. 2.2, show the potential differences between the other two pairs of metals. Read the scales and record the results in the table, Fig. 2.3. [4] Fig. 2.2 2 1 0 – + V filter paper dilute sulphuric acid voltmeter For Examiner’s Use 2 1 0 – + magnesium copper 2 1 0 – + zinc copper
Question paper, page 5
5 0653/06/M/J/03 [Turn over Fig. 2.3 (b) From the results, state which of the three metals is (i) the most negative, … (ii) the most positive. … [2] (c) Place the metals copper, magnesium and zinc in order of their reactivity, most reactive first. most reactive … … least reactive … [1] (d) The student was given a piece of another metal, X. The teacher did not tell her the name of this metal. Describe an experiment to find the correct place for metal X in the order of reactivity that you have stated in (c). … … … …[3] For Examiner’s Use experiment no. 1 magnesium zinc 1.6 2 3 metal connected to the negative terminal (–) of the voltmeter metal connected to the positive terminal (+) of the voltmeter potential difference / V
Question paper, page 7
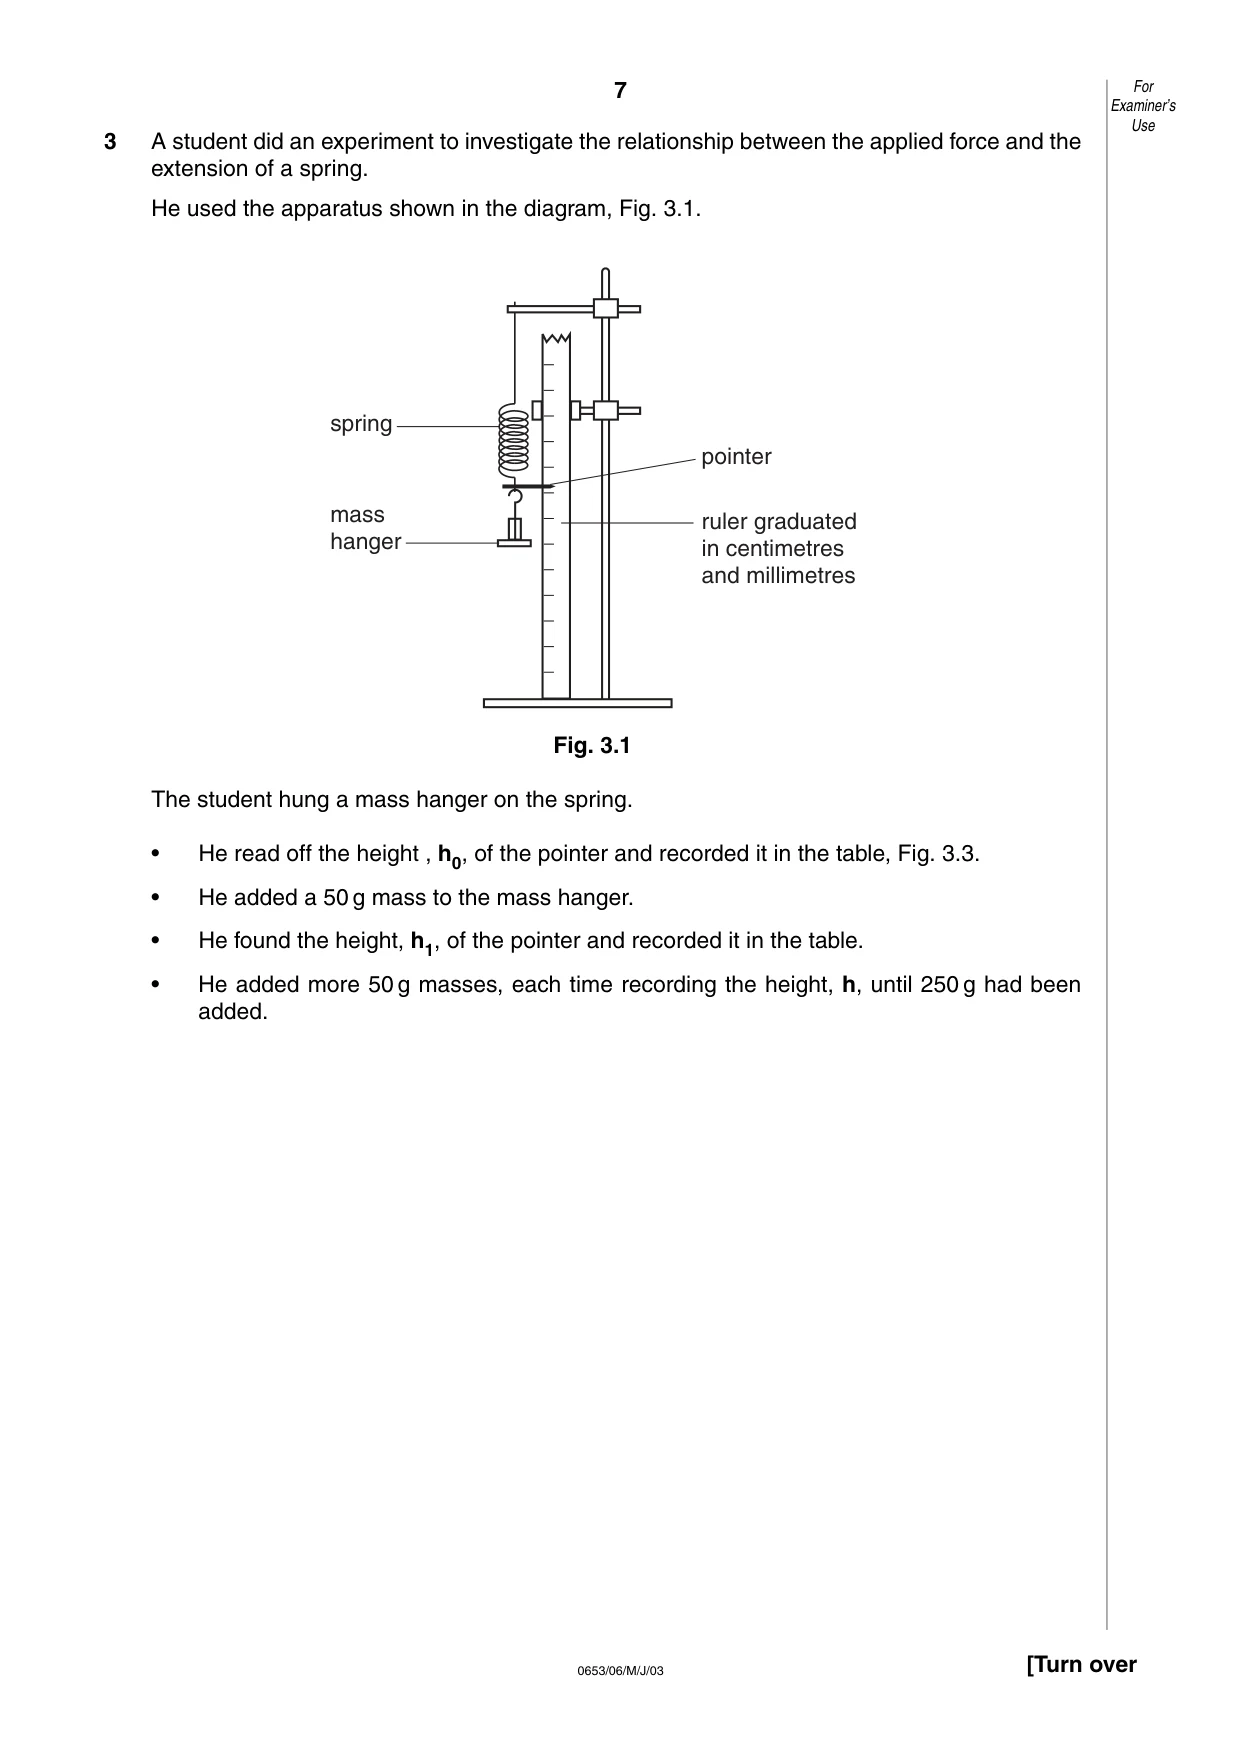
7 0653/06/M/J/03 [Turn over 3 A student did an experiment to investigate the relationship between the applied force and the extension of a spring. He used the apparatus shown in the diagram, Fig. 3.1. Fig. 3.1 The student hung a mass hanger on the spring. • He read off the height , h0, of the pointer and recorded it in the table, Fig. 3.3. • He added a 50 g mass to the mass hanger. • He found the height, h1, of the pointer and recorded it in the table. • He added more 50 g masses, each time recording the height, h, until 250 g had been added. spring mass hanger pointer ruler graduated in centimetres and millimetres For Examiner’s Use
Question paper, page 8
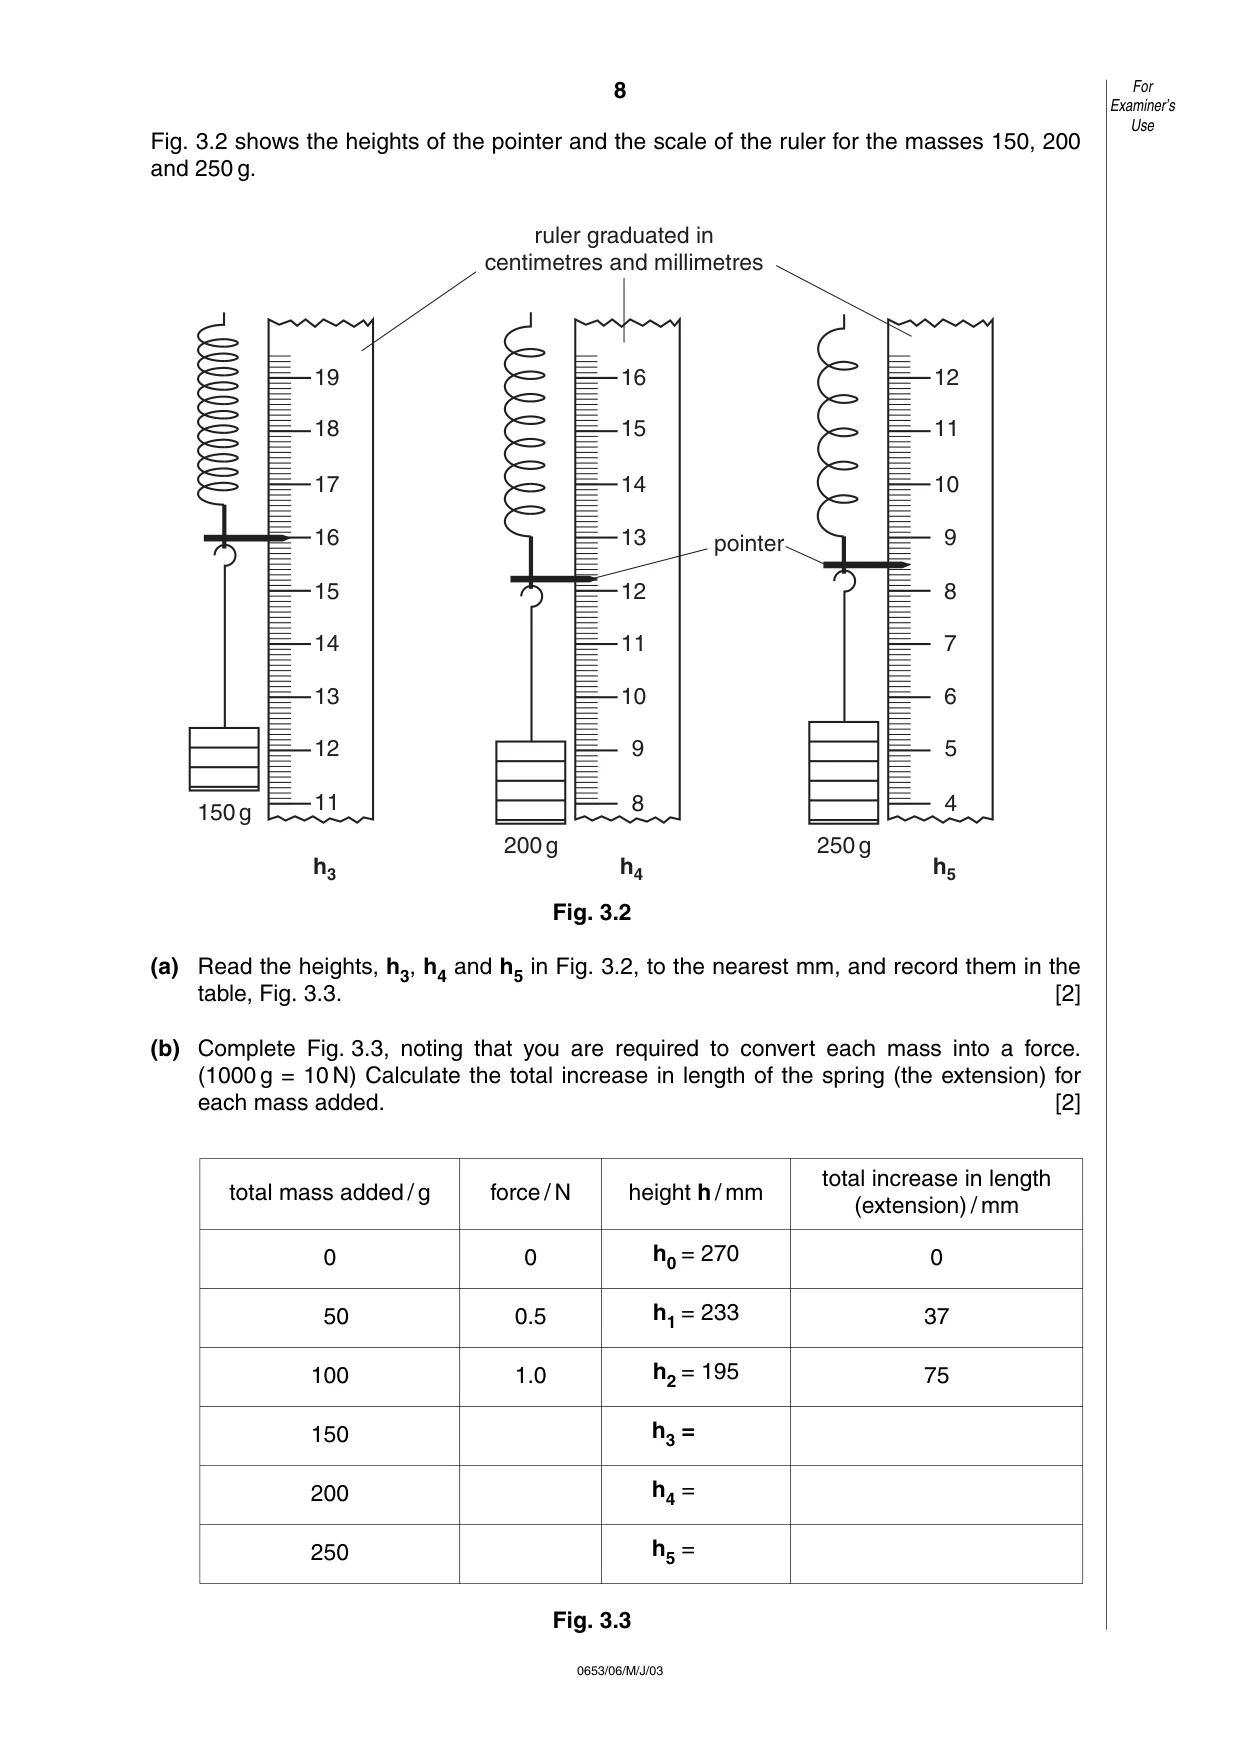
8 0653/06/M/J/03 Fig. 3.2 shows the heights of the pointer and the scale of the ruler for the masses 150, 200 and 250 g. Fig. 3.2 (a) Read the heights, h3, h4 and h5 in Fig. 3.2, to the nearest mm, and record them in the table, Fig. 3.3. [2] (b) Complete Fig. 3.3, noting that you are required to convert each mass into a force. (1000 g = 10 N) Calculate the total increase in length of the spring (the extension) for each mass added. [2] Fig. 3.3 19 18 17 16 15 14 13 12 11 150g h3 16 15 14 13 12 11 10 9 8 200g h4 12 11 10 9 8 7 6 5 4 250g h5 ruler graduated in centimetres and millimetres pointer For Examiner’s Use total mass added / g 0 0 h0 = 270 0 37 75 h1 = 233 h2 = 195 h3 = h4 = h5 = 0.5 1.0 50 100 150 200 250 force / N height h / mm total increase in length (extension) / mm
Question paper, page 9
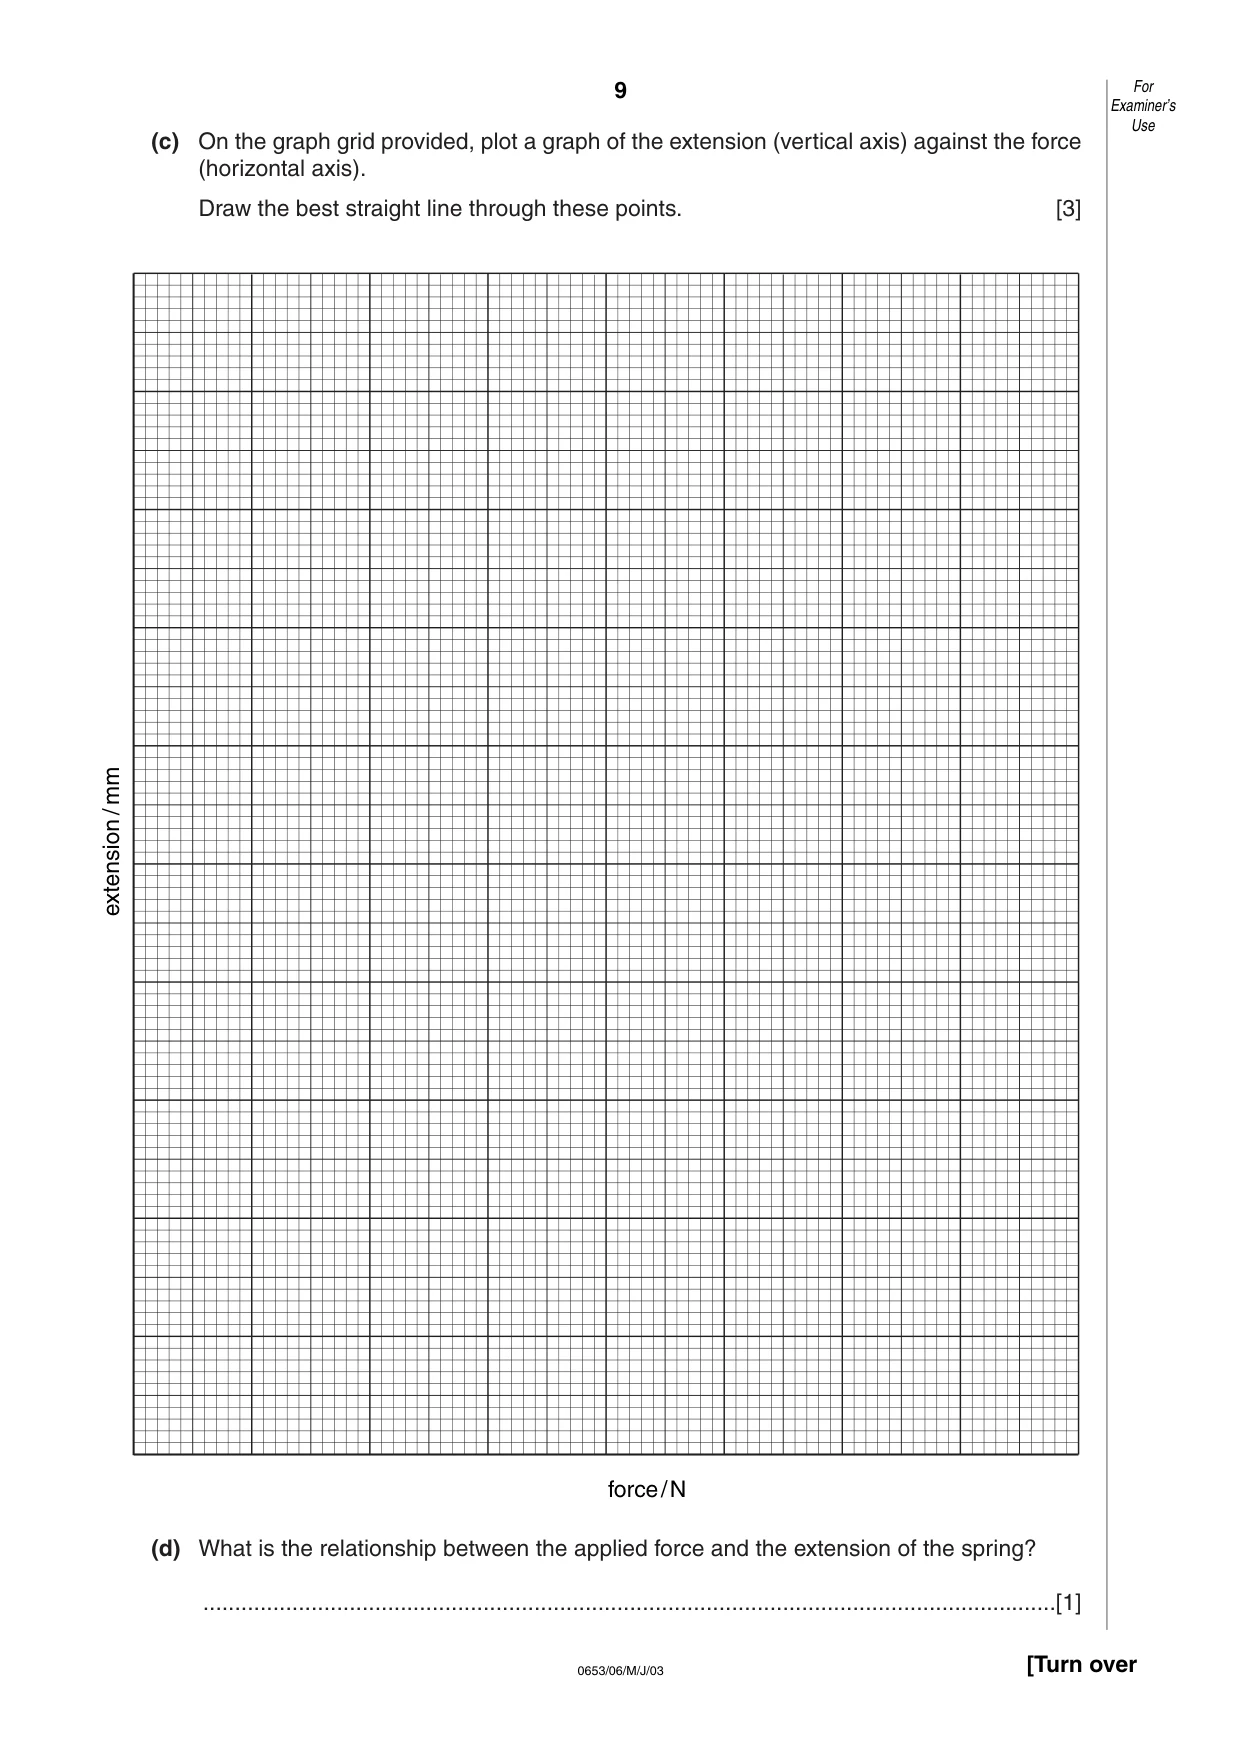
(c) On the graph grid provided, plot a graph of the extension (vertical axis) against the force (horizontal axis). Draw the best straight line through these points. [3] (d) What is the relationship between the applied force and the extension of the spring? …[1] 9 0653/06/M/J/03 [Turn over For Examiner’s Use force/N extension / mm
Question paper, page 10
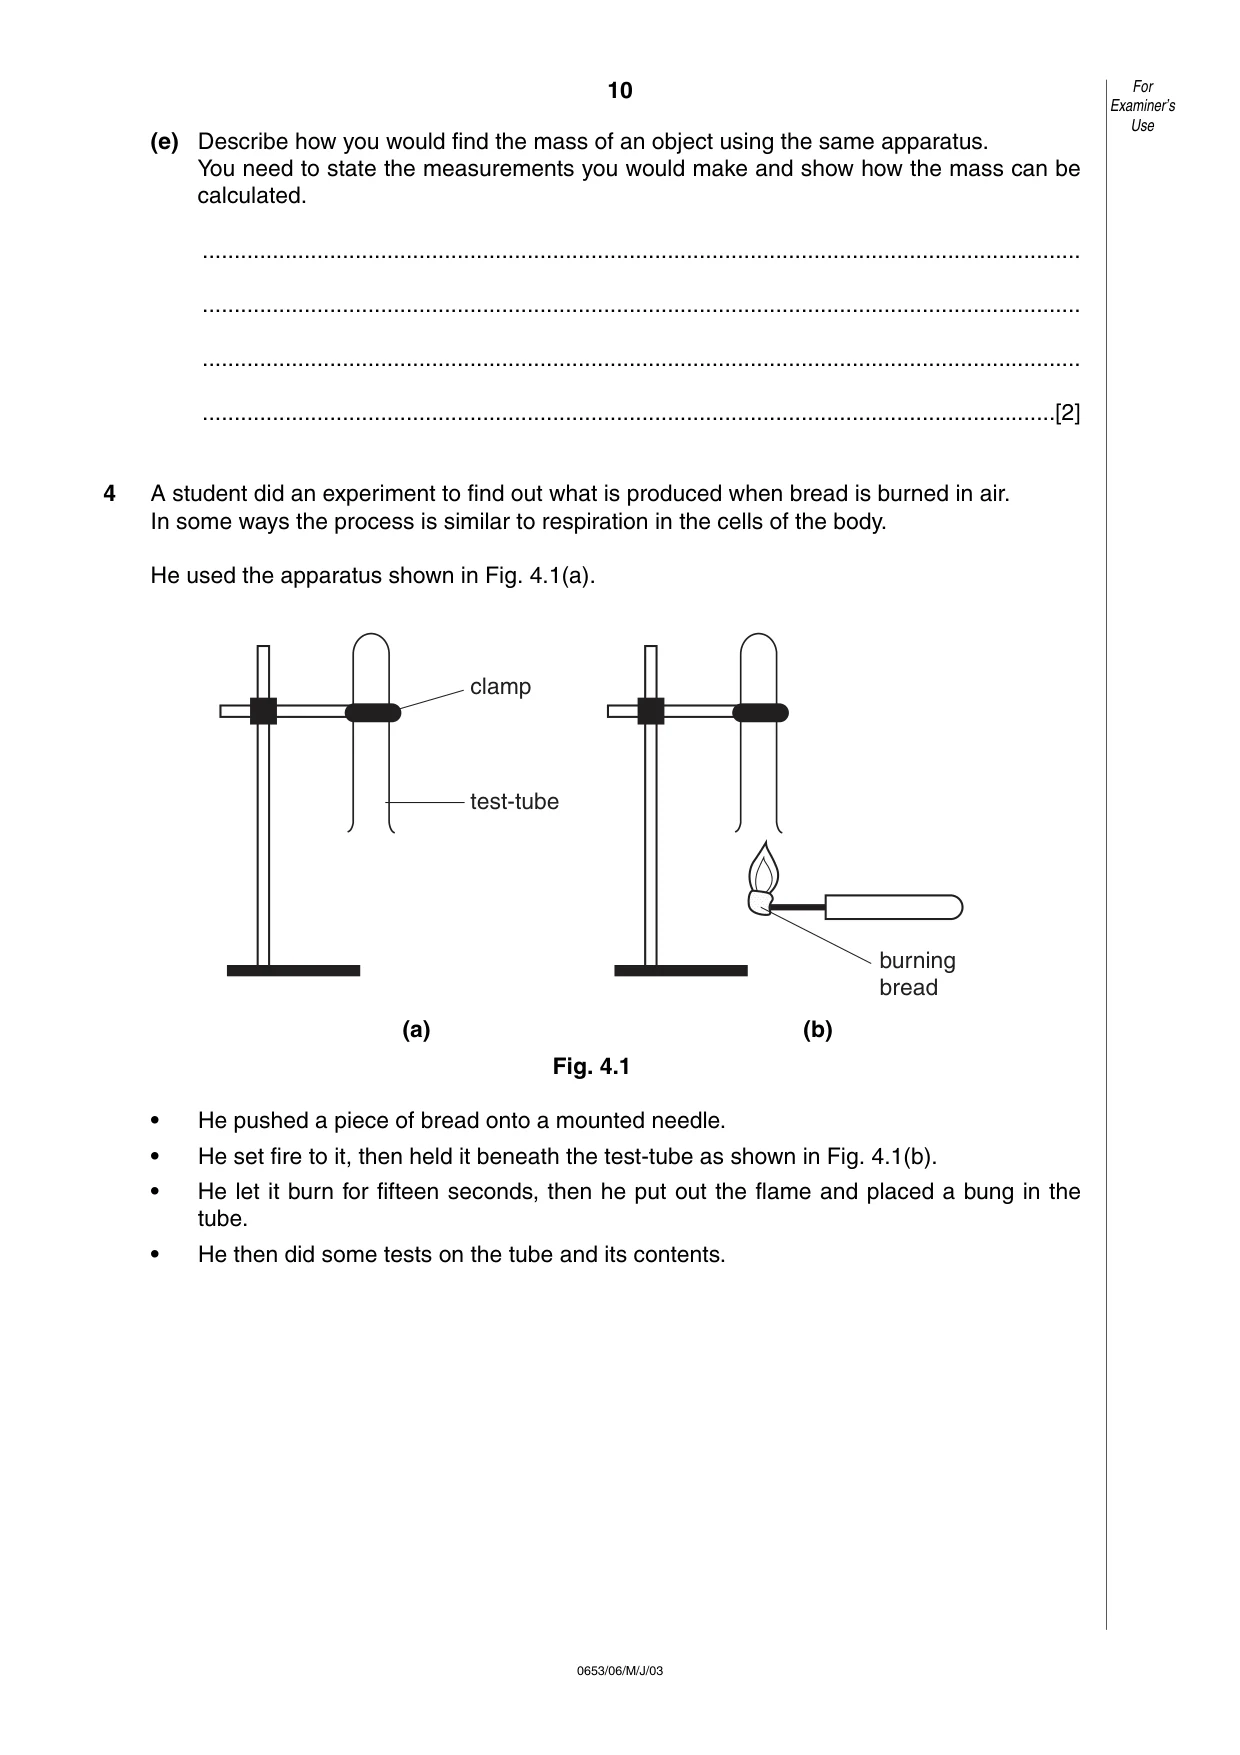
10 0653/06/M/J/03 (e) Describe how you would find the mass of an object using the same apparatus. You need to state the measurements you would make and show how the mass can be calculated. … … … …[2] 4 A student did an experiment to find out what is produced when bread is burned in air. In some ways the process is similar to respiration in the cells of the body. He used the apparatus shown in Fig. 4.1(a). (a) (b) Fig. 4.1 • He pushed a piece of bread onto a mounted needle. • He set fire to it, then held it beneath the test-tube as shown in Fig. 4.1(b). • He let it burn for fifteen seconds, then he put out the flame and placed a bung in the tube. • He then did some tests on the tube and its contents. clamp test-tube burning bread For Examiner’s Use
Question paper, page 11
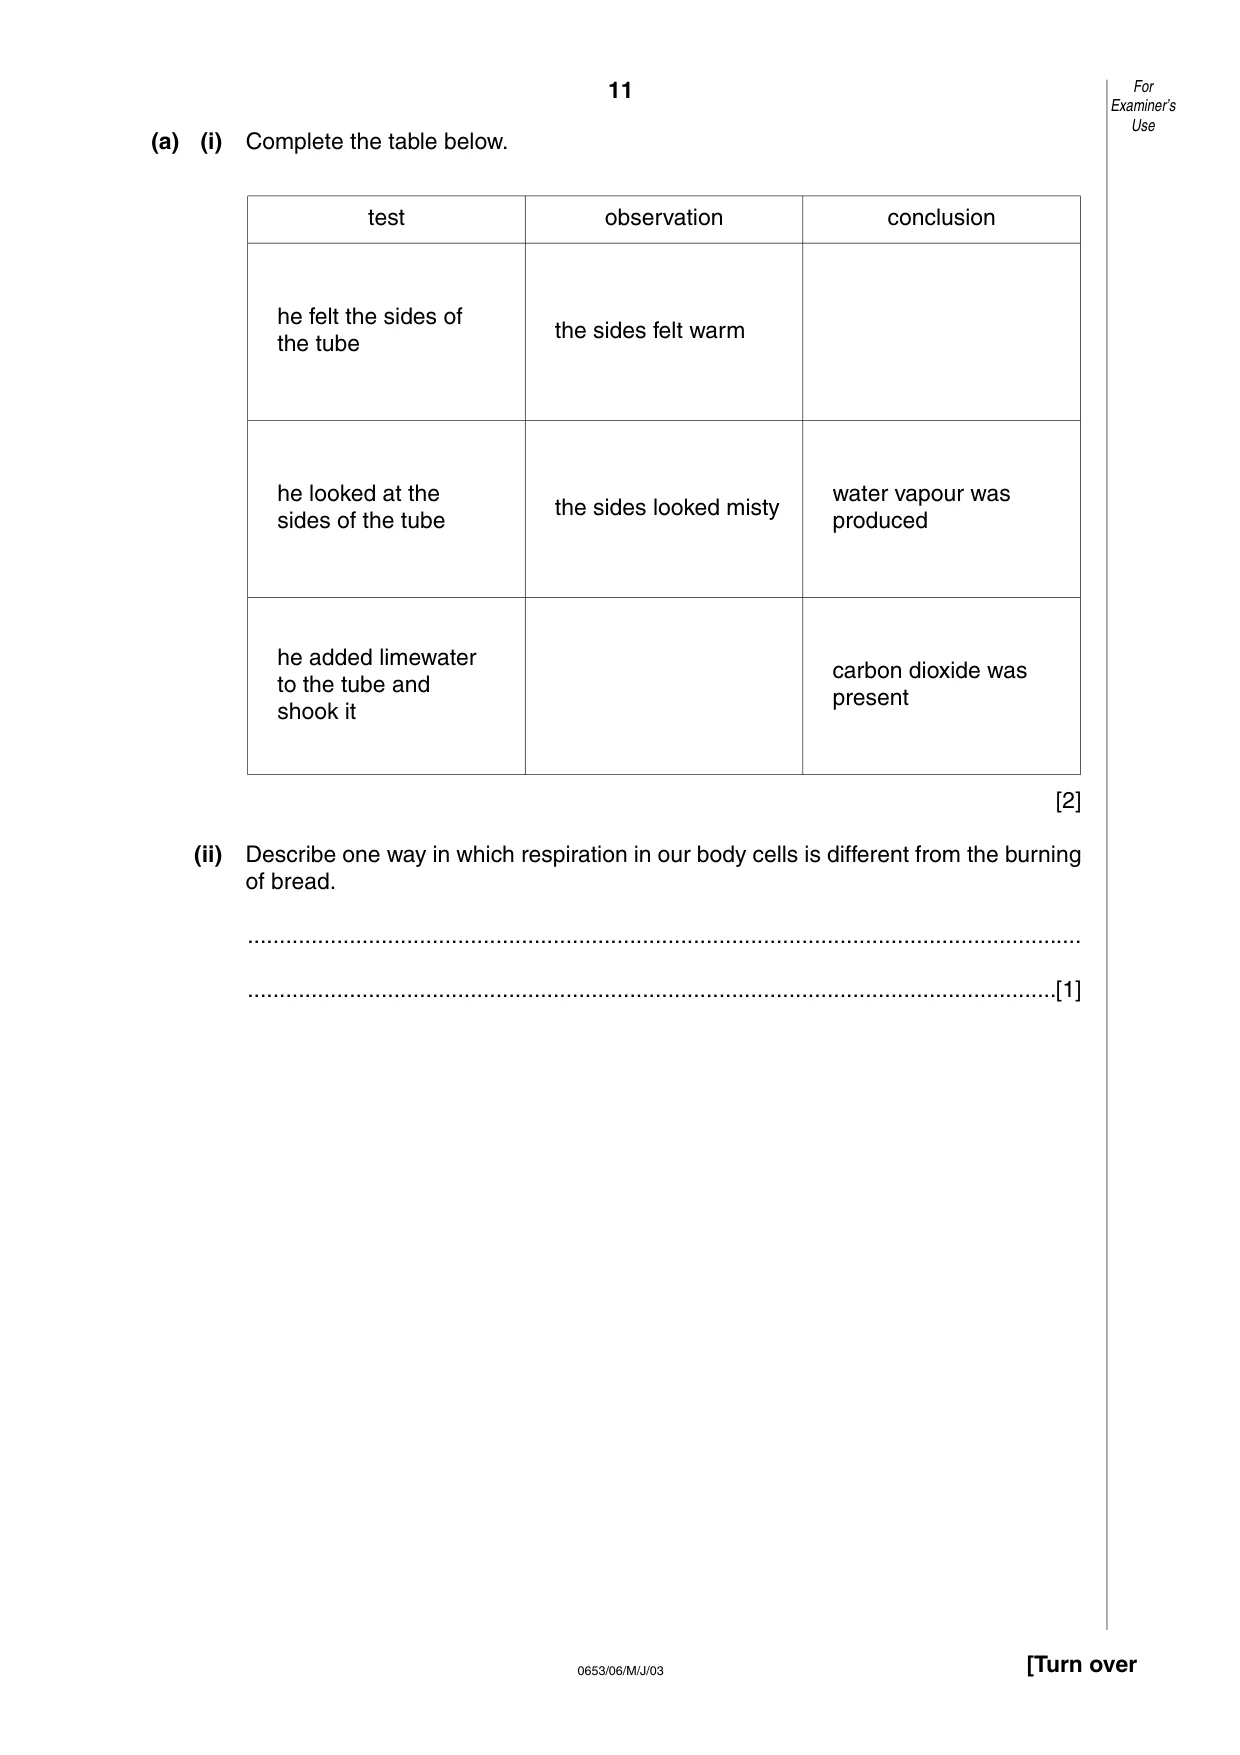
11 0653/06/M/J/03 [Turn over (a) (i) Complete the table below. [2] (ii) Describe one way in which respiration in our body cells is different from the burning of bread. … …[1] For Examiner’s Use test he felt the sides of the tube the sides felt warm the sides looked misty water vapour was produced carbon dioxide was present he looked at the sides of the tube he added limewater to the tube and shook it observation conclusion
Question paper, page 12
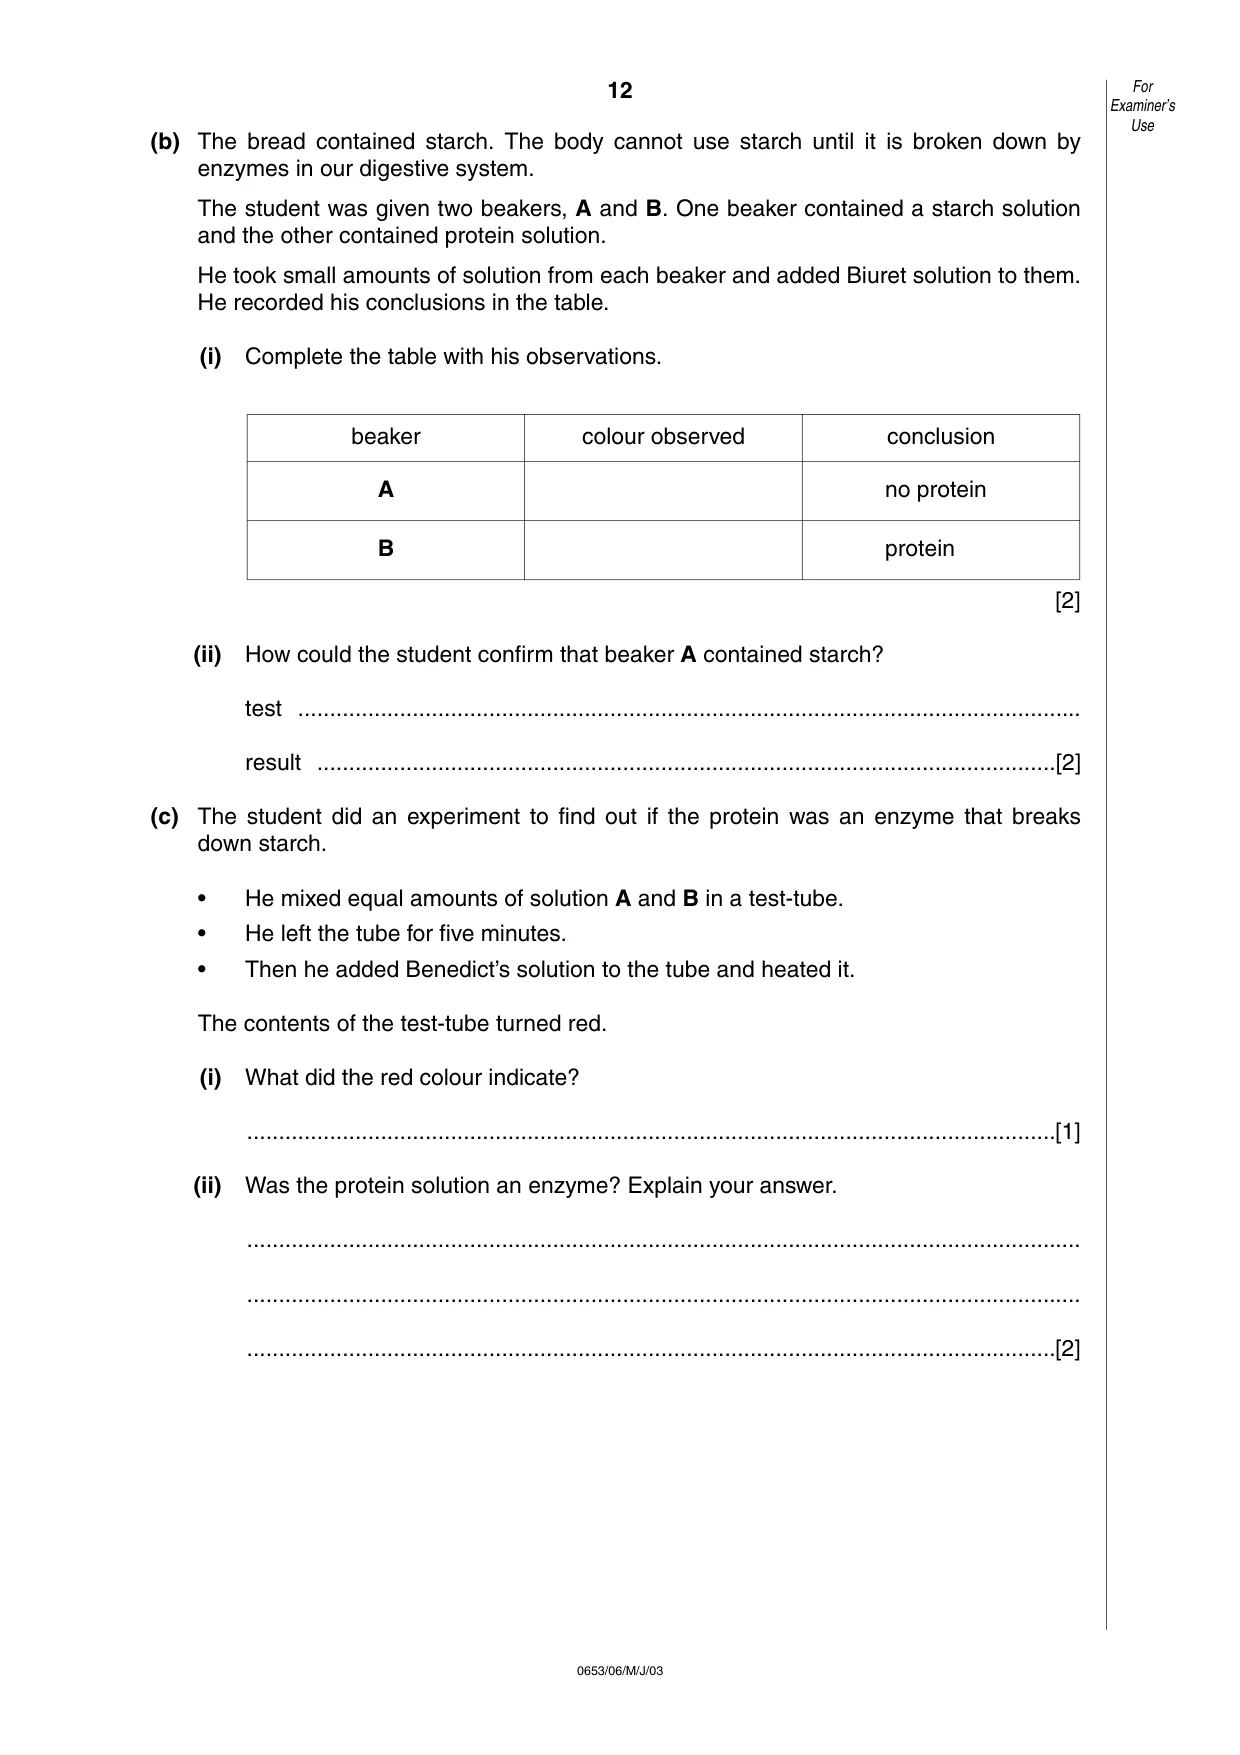
12 0653/06/M/J/03 (b) The bread contained starch. The body cannot use starch until it is broken down by enzymes in our digestive system. The student was given two beakers, A and B. One beaker contained a starch solution and the other contained protein solution. He took small amounts of solution from each beaker and added Biuret solution to them. He recorded his conclusions in the table. (i) Complete the table with his observations. [2] (ii) How could the student confirm that beaker A contained starch? test … result …[2] (c) The student did an experiment to find out if the protein was an enzyme that breaks down starch. • He mixed equal amounts of solution A and B in a test-tube. • He left the tube for five minutes. • Then he added Benedict’s solution to the tube and heated it. The contents of the test-tube turned red. (i) What did the red colour indicate? …[1] (ii) Was the protein solution an enzyme? Explain your answer. … … …[2] For Examiner’s Use beaker A B colour observed conclusion no protein protein
Question paper, page 13
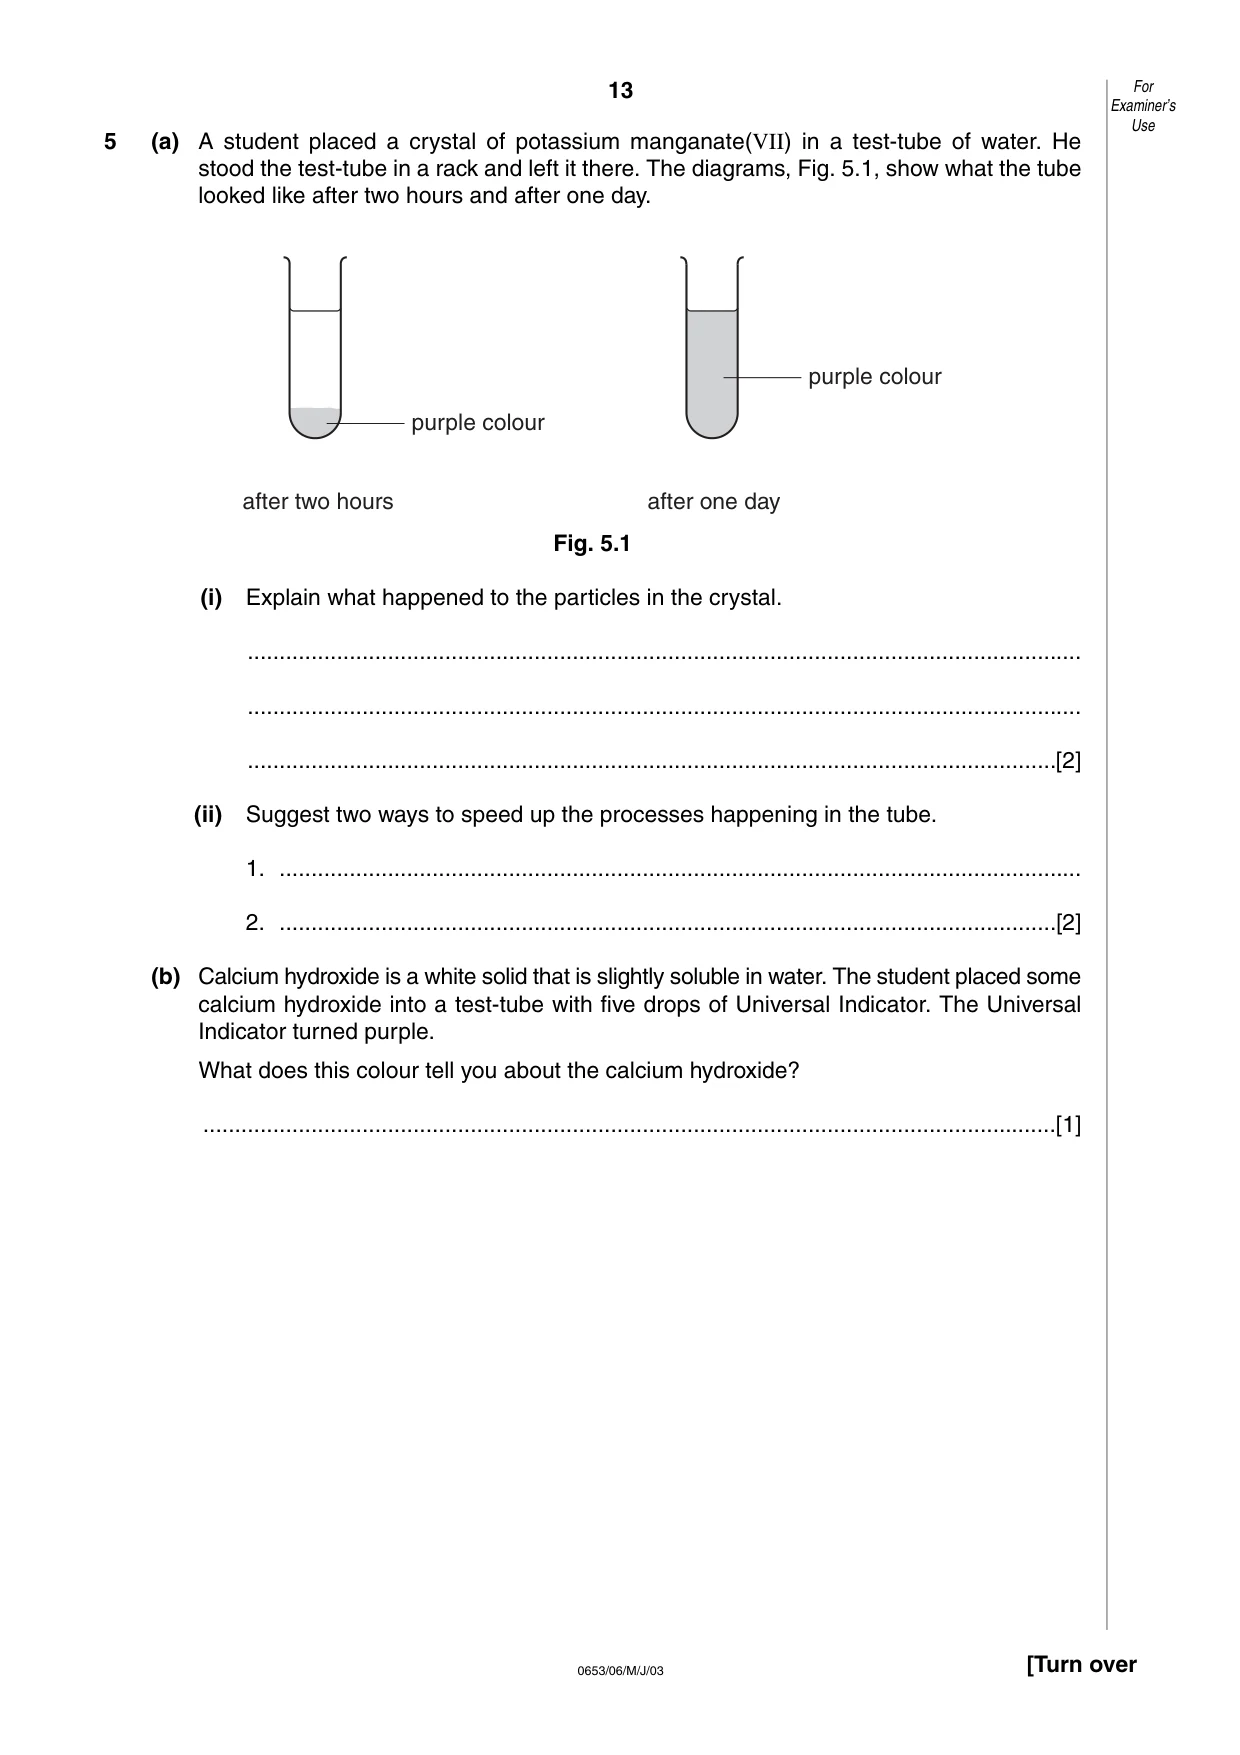
13 0653/06/M/J/03 [Turn over 5 (a) A student placed a crystal of potassium manganate(VII) in a test-tube of water. He stood the test-tube in a rack and left it there. The diagrams, Fig. 5.1, show what the tube looked like after two hours and after one day. Fig. 5.1 (i) Explain what happened to the particles in the crystal. … … …[2] (ii) Suggest two ways to speed up the processes happening in the tube. 1. … 2. …[2] (b) Calcium hydroxide is a white solid that is slightly soluble in water. The student placed some calcium hydroxide into a test-tube with five drops of Universal Indicator. The Universal Indicator turned purple. What does this colour tell you about the calcium hydroxide? …[1] purple colour purple colour after two hours after one day For Examiner’s Use
Question paper, page 14
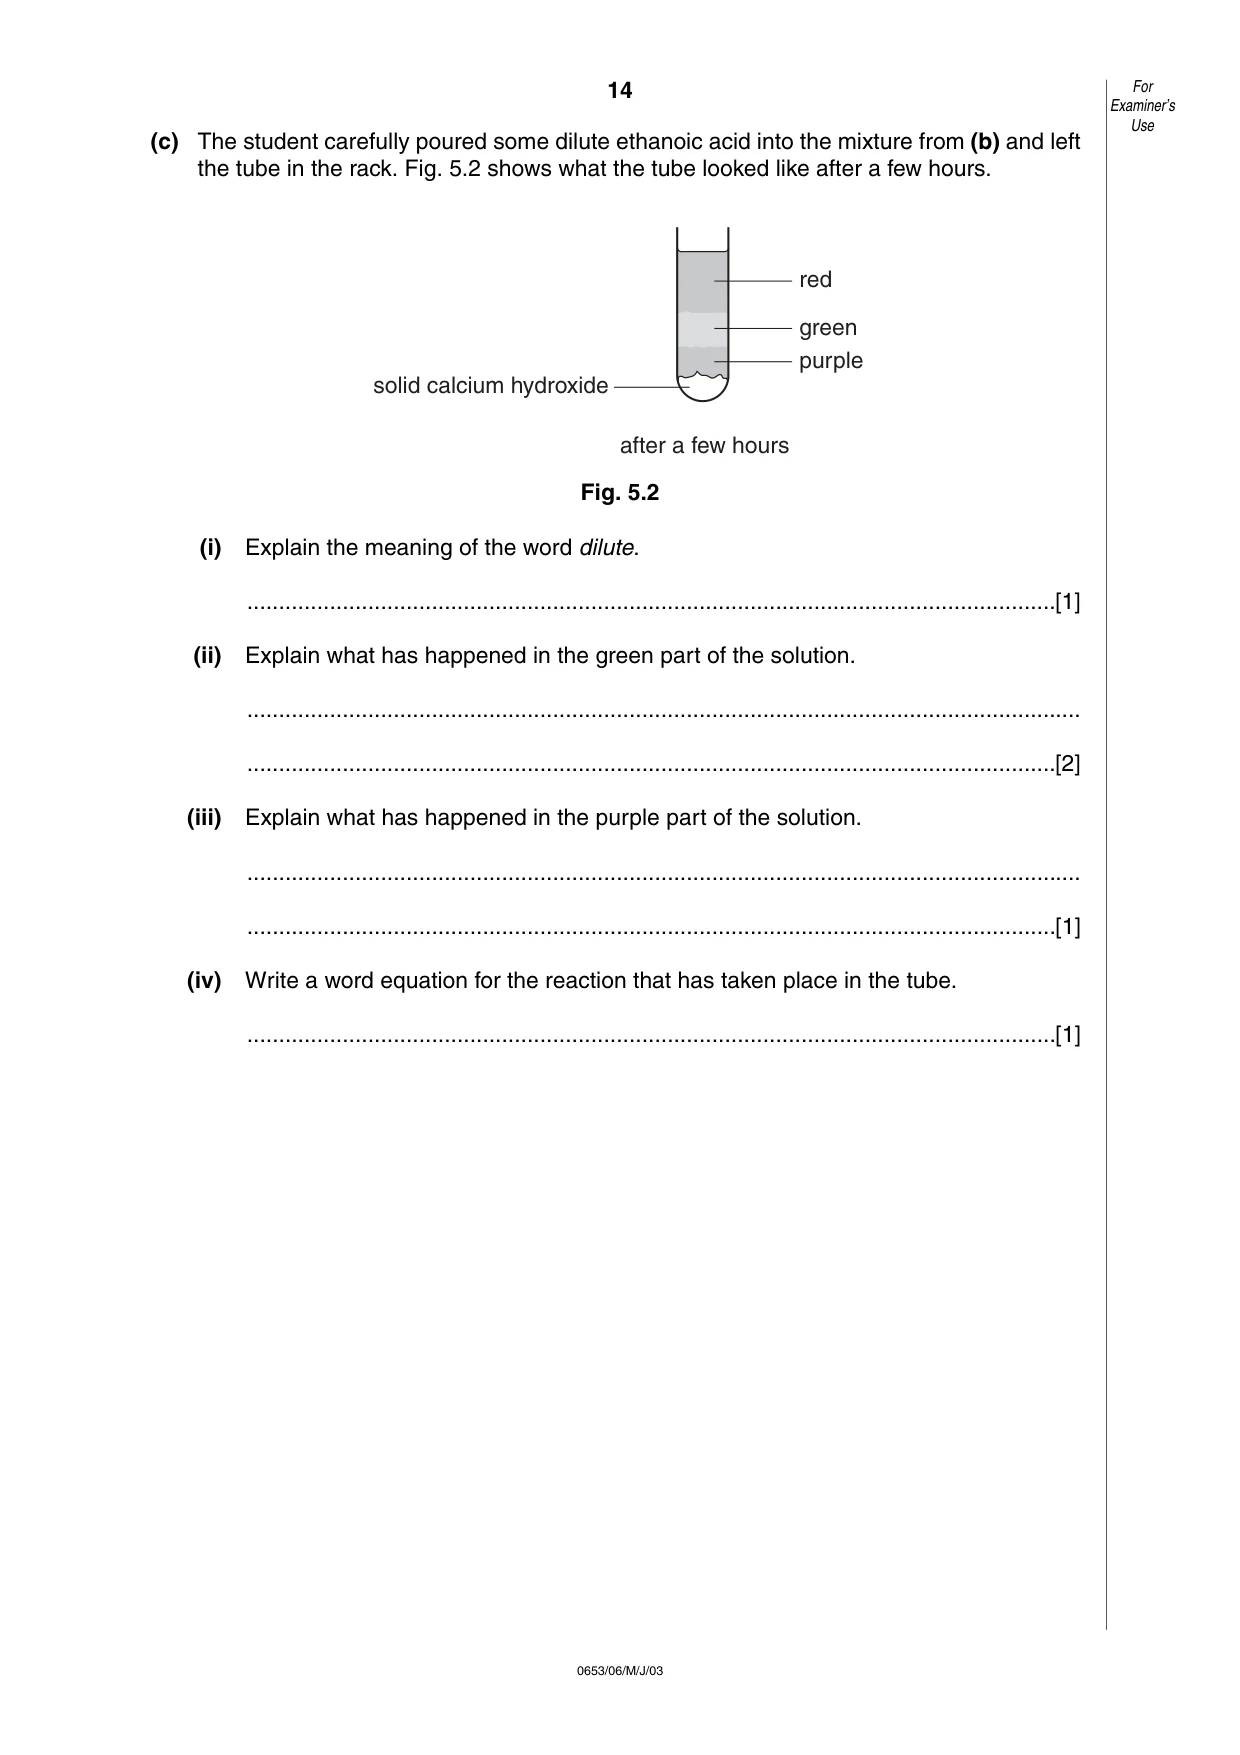
14 0653/06/M/J/03 (c) The student carefully poured some dilute ethanoic acid into the mixture from (b) and left the tube in the rack. Fig. 5.2 shows what the tube looked like after a few hours. Fig. 5.2 (i) Explain the meaning of the word dilute. …[1] (ii) Explain what has happened in the green part of the solution. … …[2] (iii) Explain what has happened in the purple part of the solution. … …[1] (iv) Write a word equation for the reaction that has taken place in the tube. …[1] purple green red after a few hours solid calcium hydroxide For Examiner’s Use
Question paper, page 15
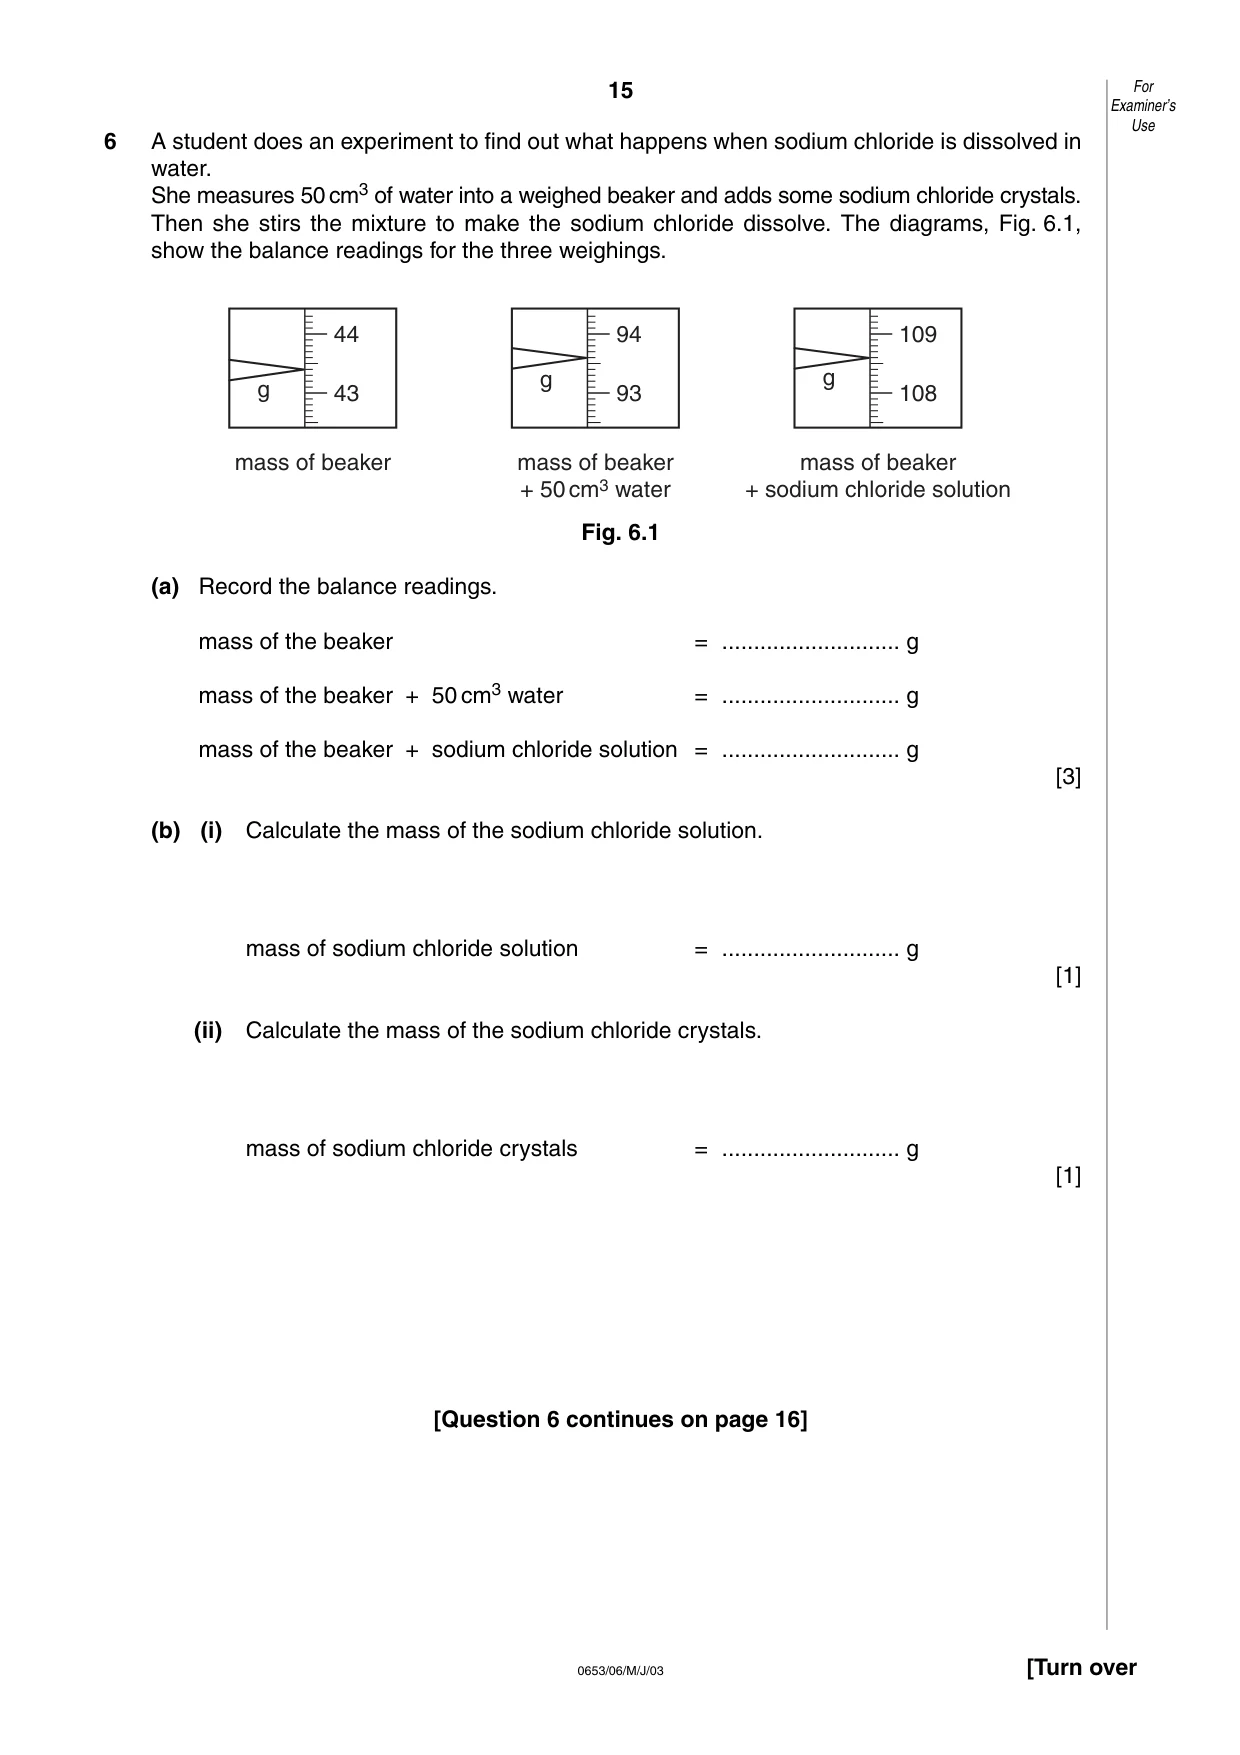
15 0653/06/M/J/03 6 A student does an experiment to find out what happens when sodium chloride is dissolved in water. She measures 50 cm3 of water into a weighed beaker and adds some sodium chloride crystals. Then she stirs the mixture to make the sodium chloride dissolve. The diagrams, Fig. 6.1, show the balance readings for the three weighings. Fig. 6.1 (a) Record the balance readings. mass of the beaker = … g mass of the beaker + 50 cm3 water = … g mass of the beaker + sodium chloride solution = … g [3] (b) (i) Calculate the mass of the sodium chloride solution. mass of sodium chloride solution = … g [1] (ii) Calculate the mass of the sodium chloride crystals. mass of sodium chloride crystals = … g [1] [Question 6 continues on page 16] g 44 43 mass of beaker g 94 93 mass of beaker + 50cm3 water g 109 108 mass of beaker + sodium chloride solution For Examiner’s Use [Turn over
Question paper, page 16
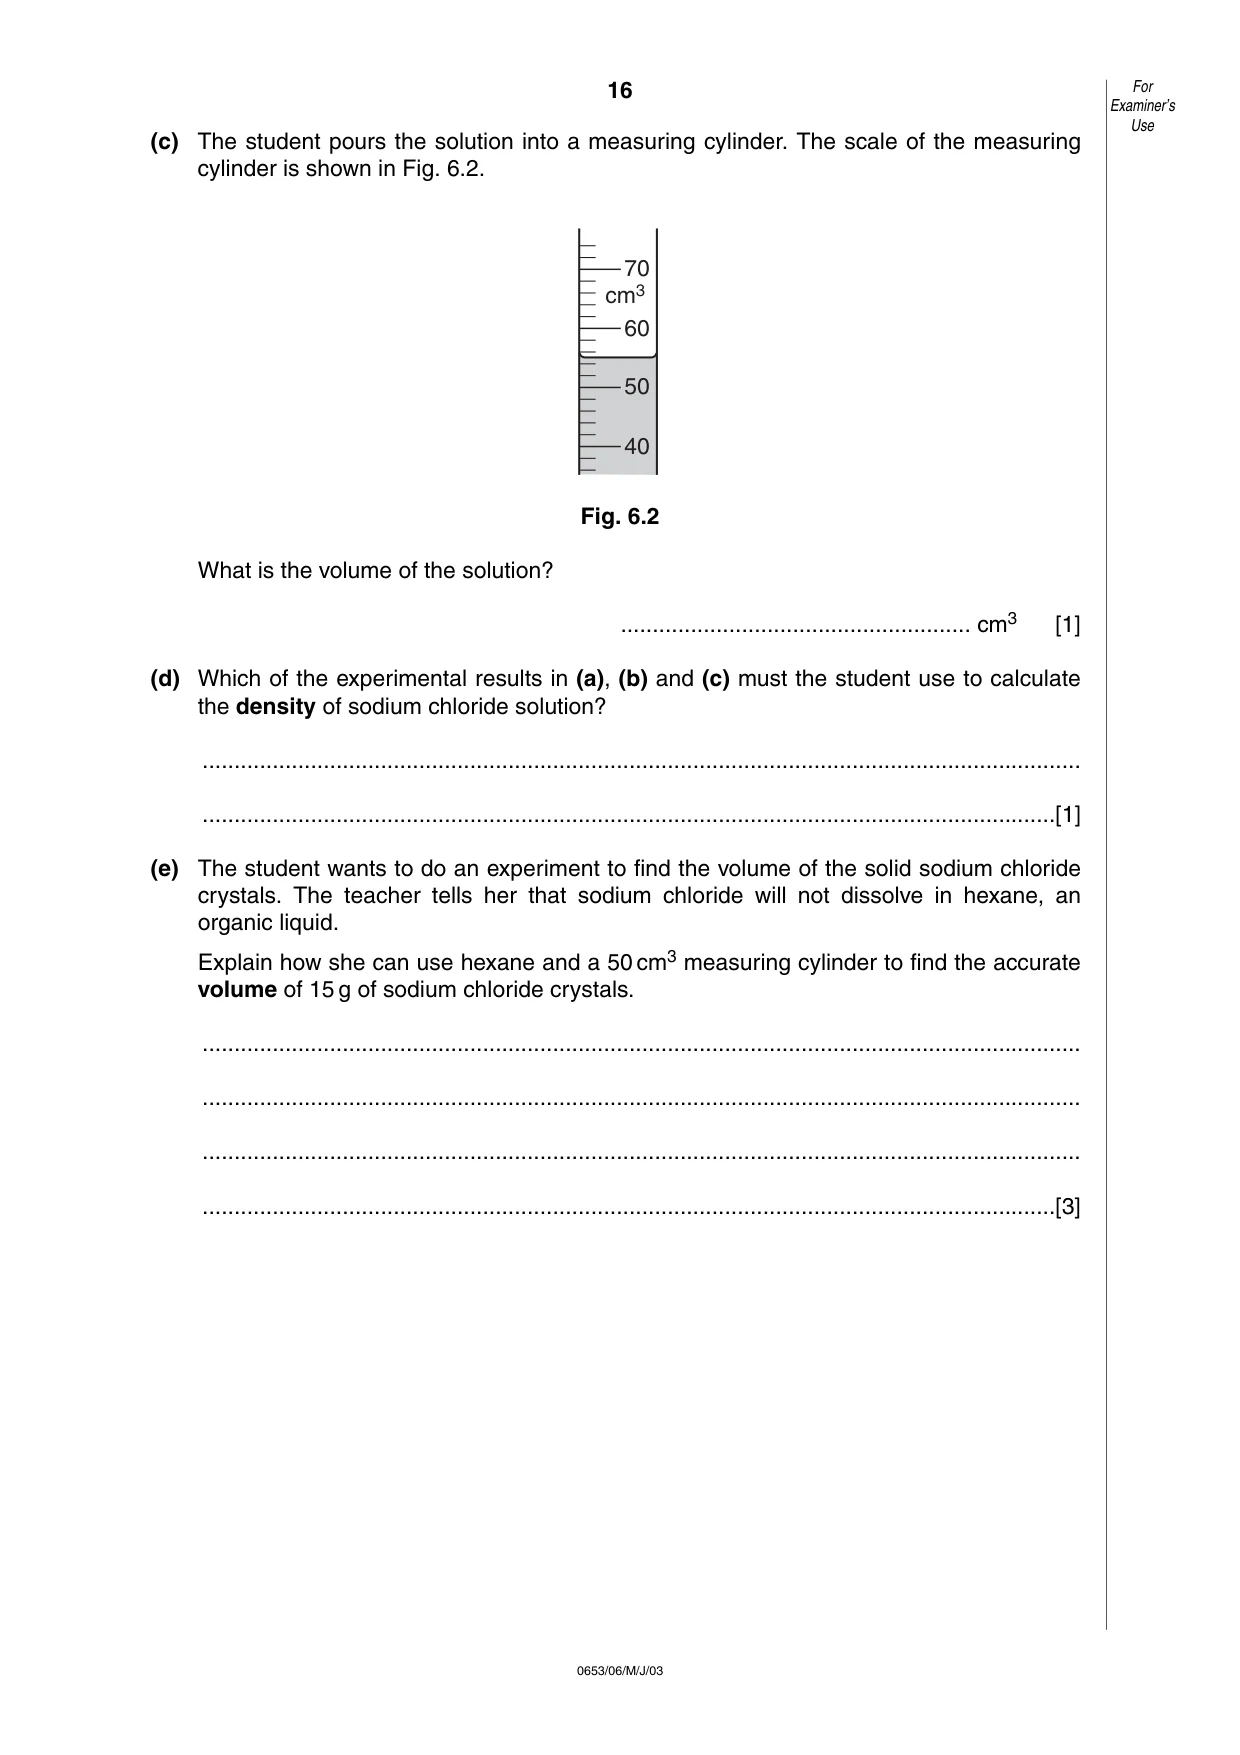
16 0653/06/M/J/03 (c) The student pours the solution into a measuring cylinder. The scale of the measuring cylinder is shown in Fig. 6.2. Fig. 6.2 What is the volume of the solution? … cm3 [1] (d) Which of the experimental results in (a), (b) and (c) must the student use to calculate the density of sodium chloride solution? … …[1] (e) The student wants to do an experiment to find the volume of the solid sodium chloride crystals. The teacher tells her that sodium chloride will not dissolve in hexane, an organic liquid. Explain how she can use hexane and a 50 cm3 measuring cylinder to find the accurate volume of 15 g of sodium chloride crystals. … … … …[3] 70 60 50 40 cm3 For Examiner’s Use