Cambridge IGCSE Science - Combined 0653 — 2023 May/June Paper 5 · Variant 2
0653/52/M/J/23 · 4 questions · 40 marks · ≈45 min
The question paper and its mark scheme, free to read here and free to download. This is Cambridge’s own paper, exactly as it was sat.
Question paper12 pages

Mark scheme9 pages
Answers below. Sit the paper first if you are practising.
Questions as text
Q1 · You are going to investigate okra, a fruit which contains many seeds
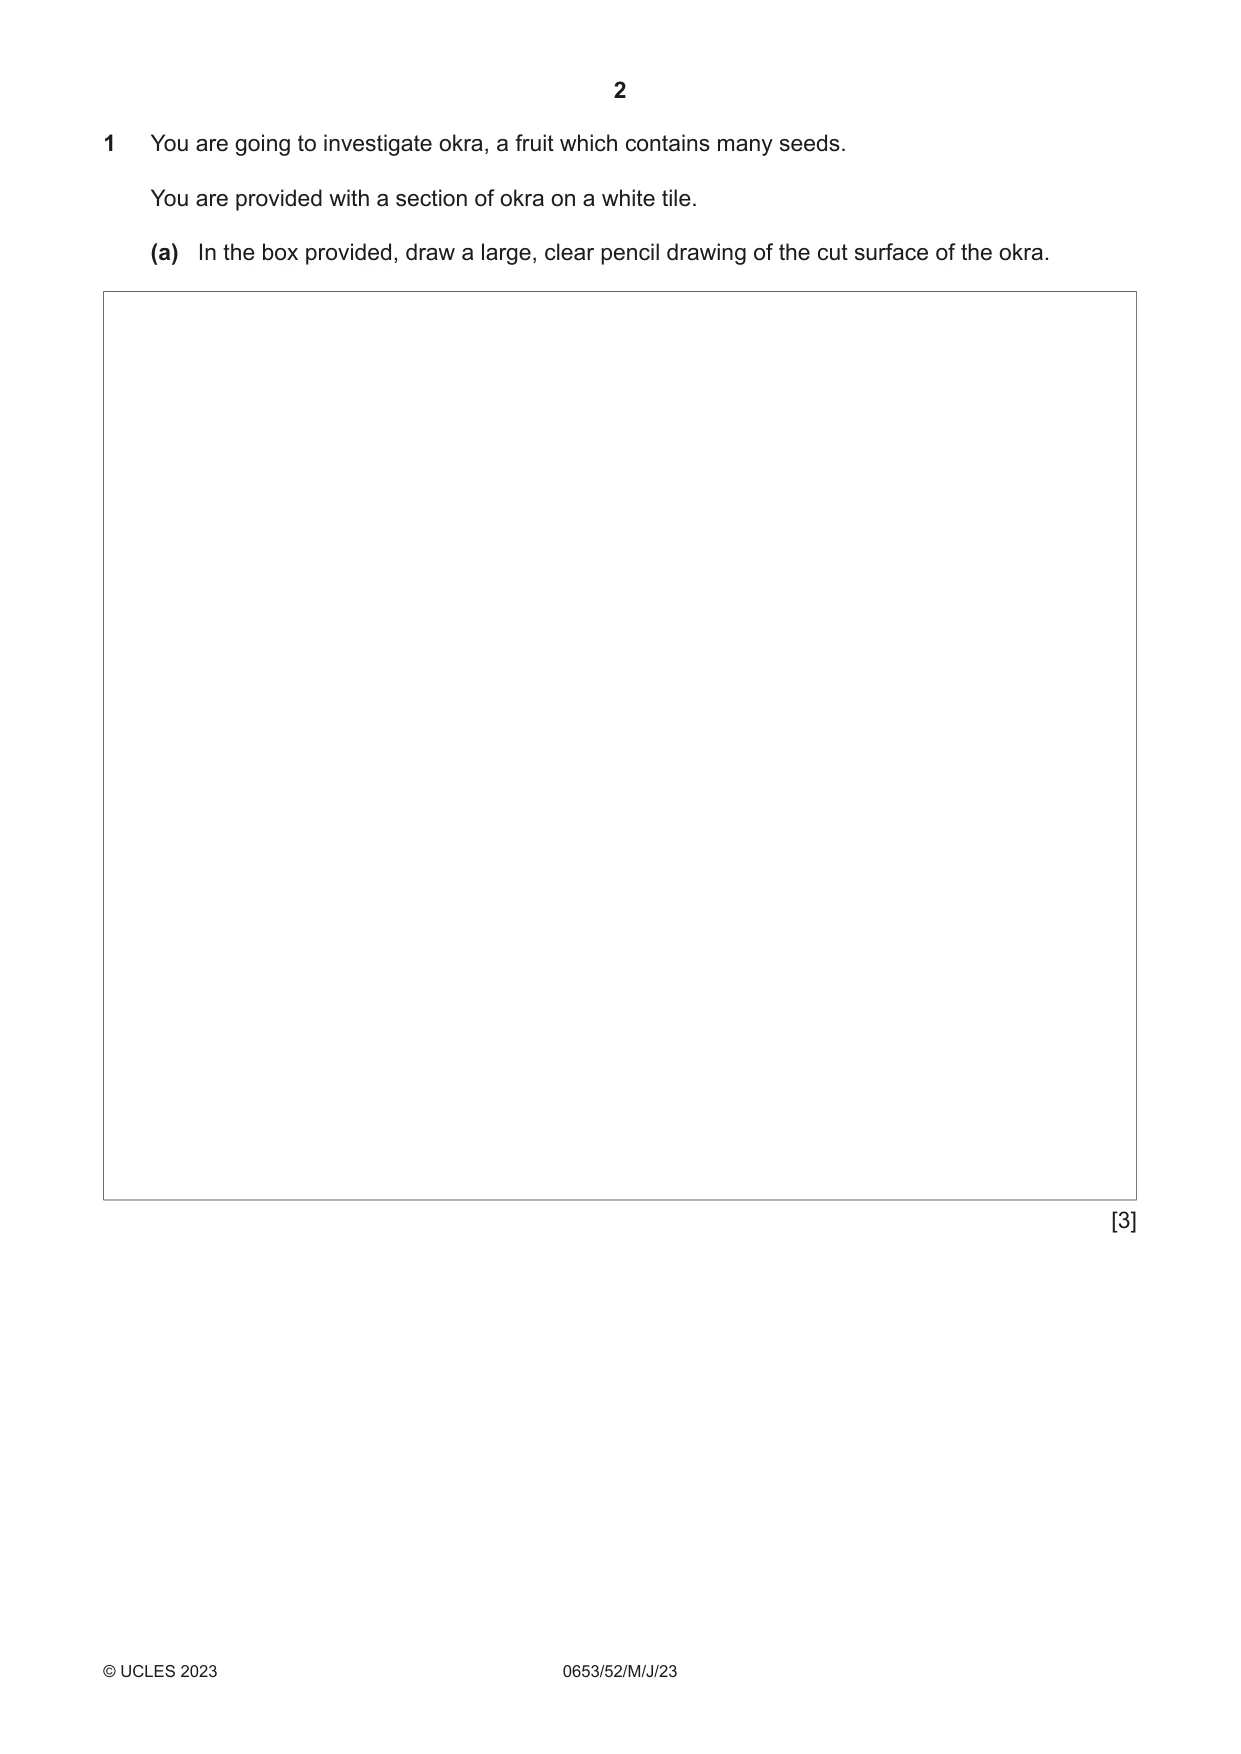
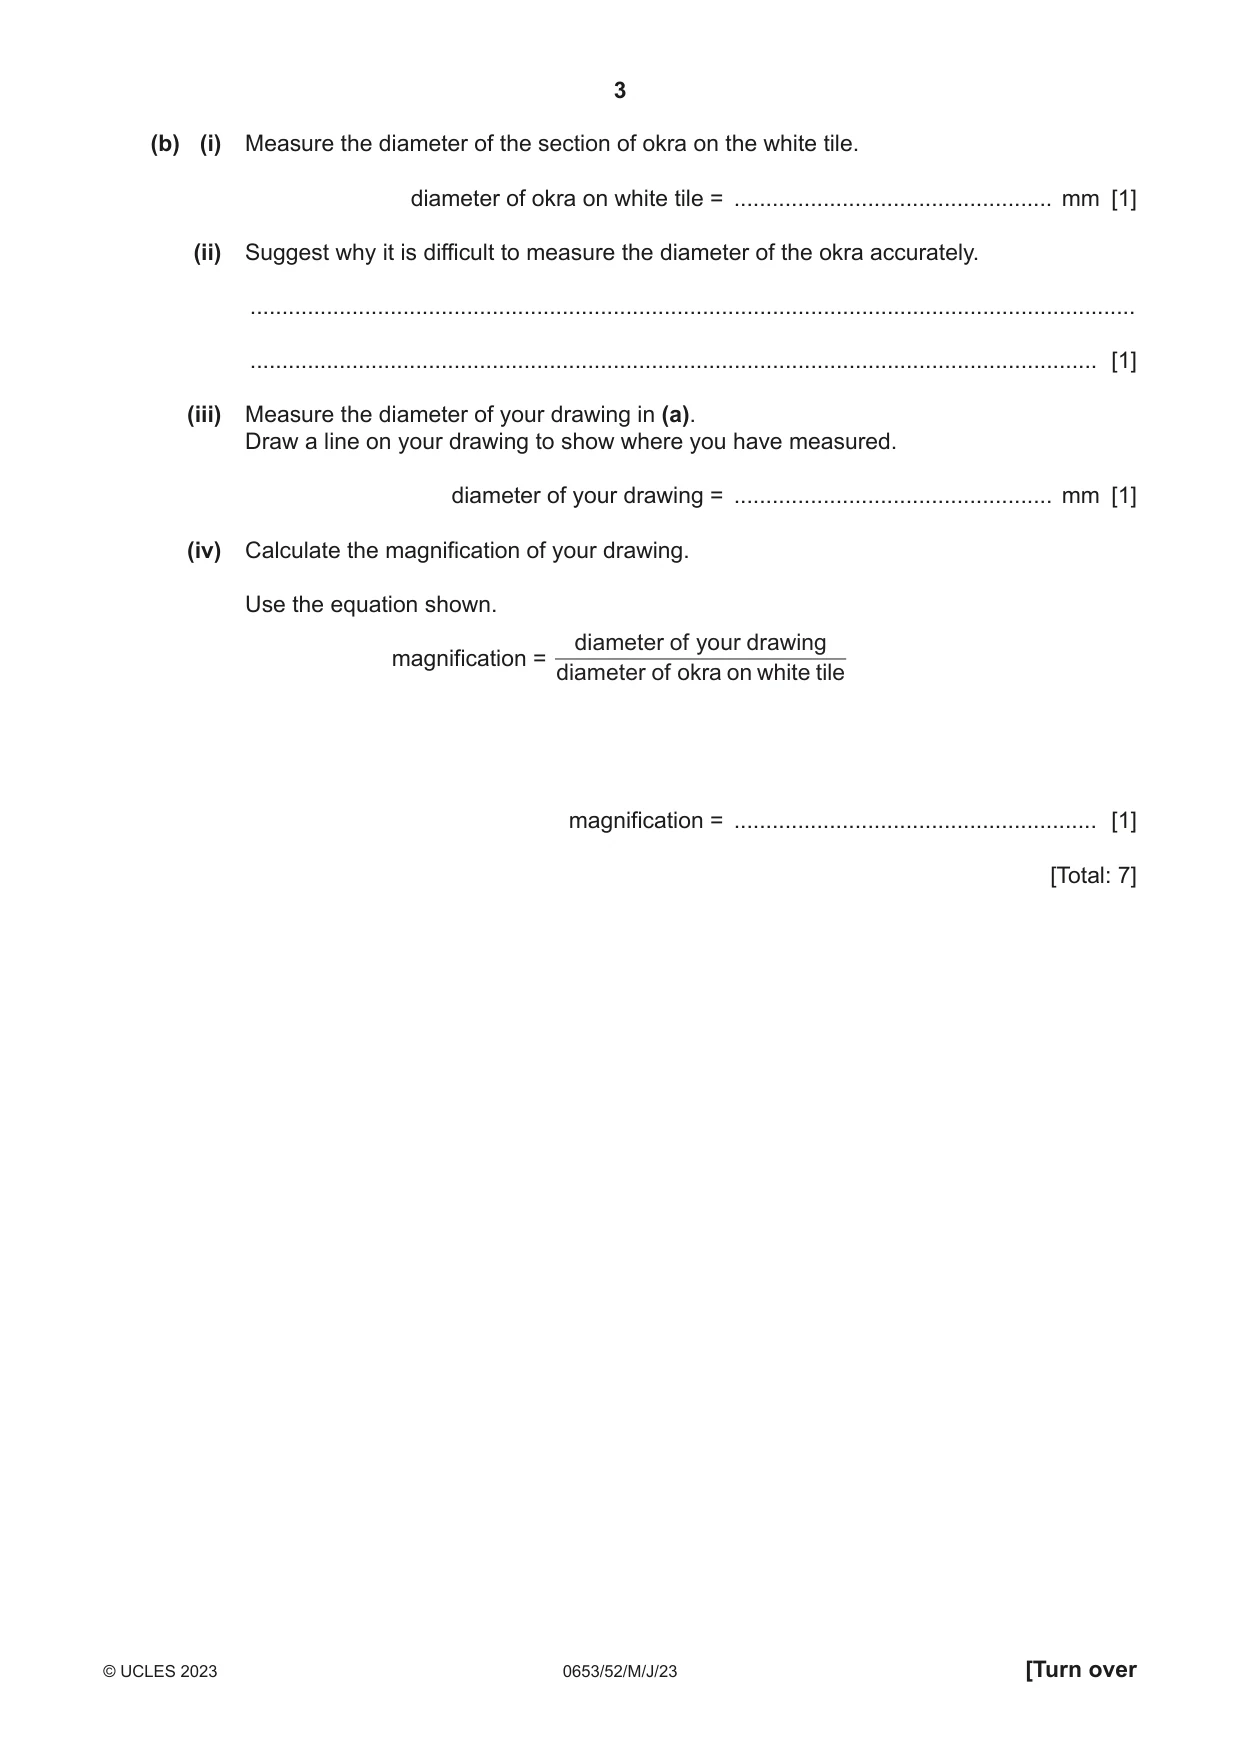
1 You are going to investigate okra, a fruit which contains many seeds. You are provided with a section of okra on a white tile. (a) In the box provided, draw a large, clear pencil drawing of the cut surface of the okra. [3] (b) (i) Measure the diameter of the section of okra on the white tile. diameter of okra on white tile = .................................................. mm [1] (ii) Suggest why it is difficult to measure the diameter of the okra accurately. ........................................................................................................................................... ..................................................................................................................................... [1] (iii) Measure the diameter of your drawing in (a). Draw a line on your drawing to show where you have measured. diameter of your drawing = .................................................. mm [1] (iv) Calculate the magnification of your drawing. Use the equation shown. diameter o f yo ur drawin g magnification = diameter of okra on white tile magnification = ......................................................... [1] [Total: 7]
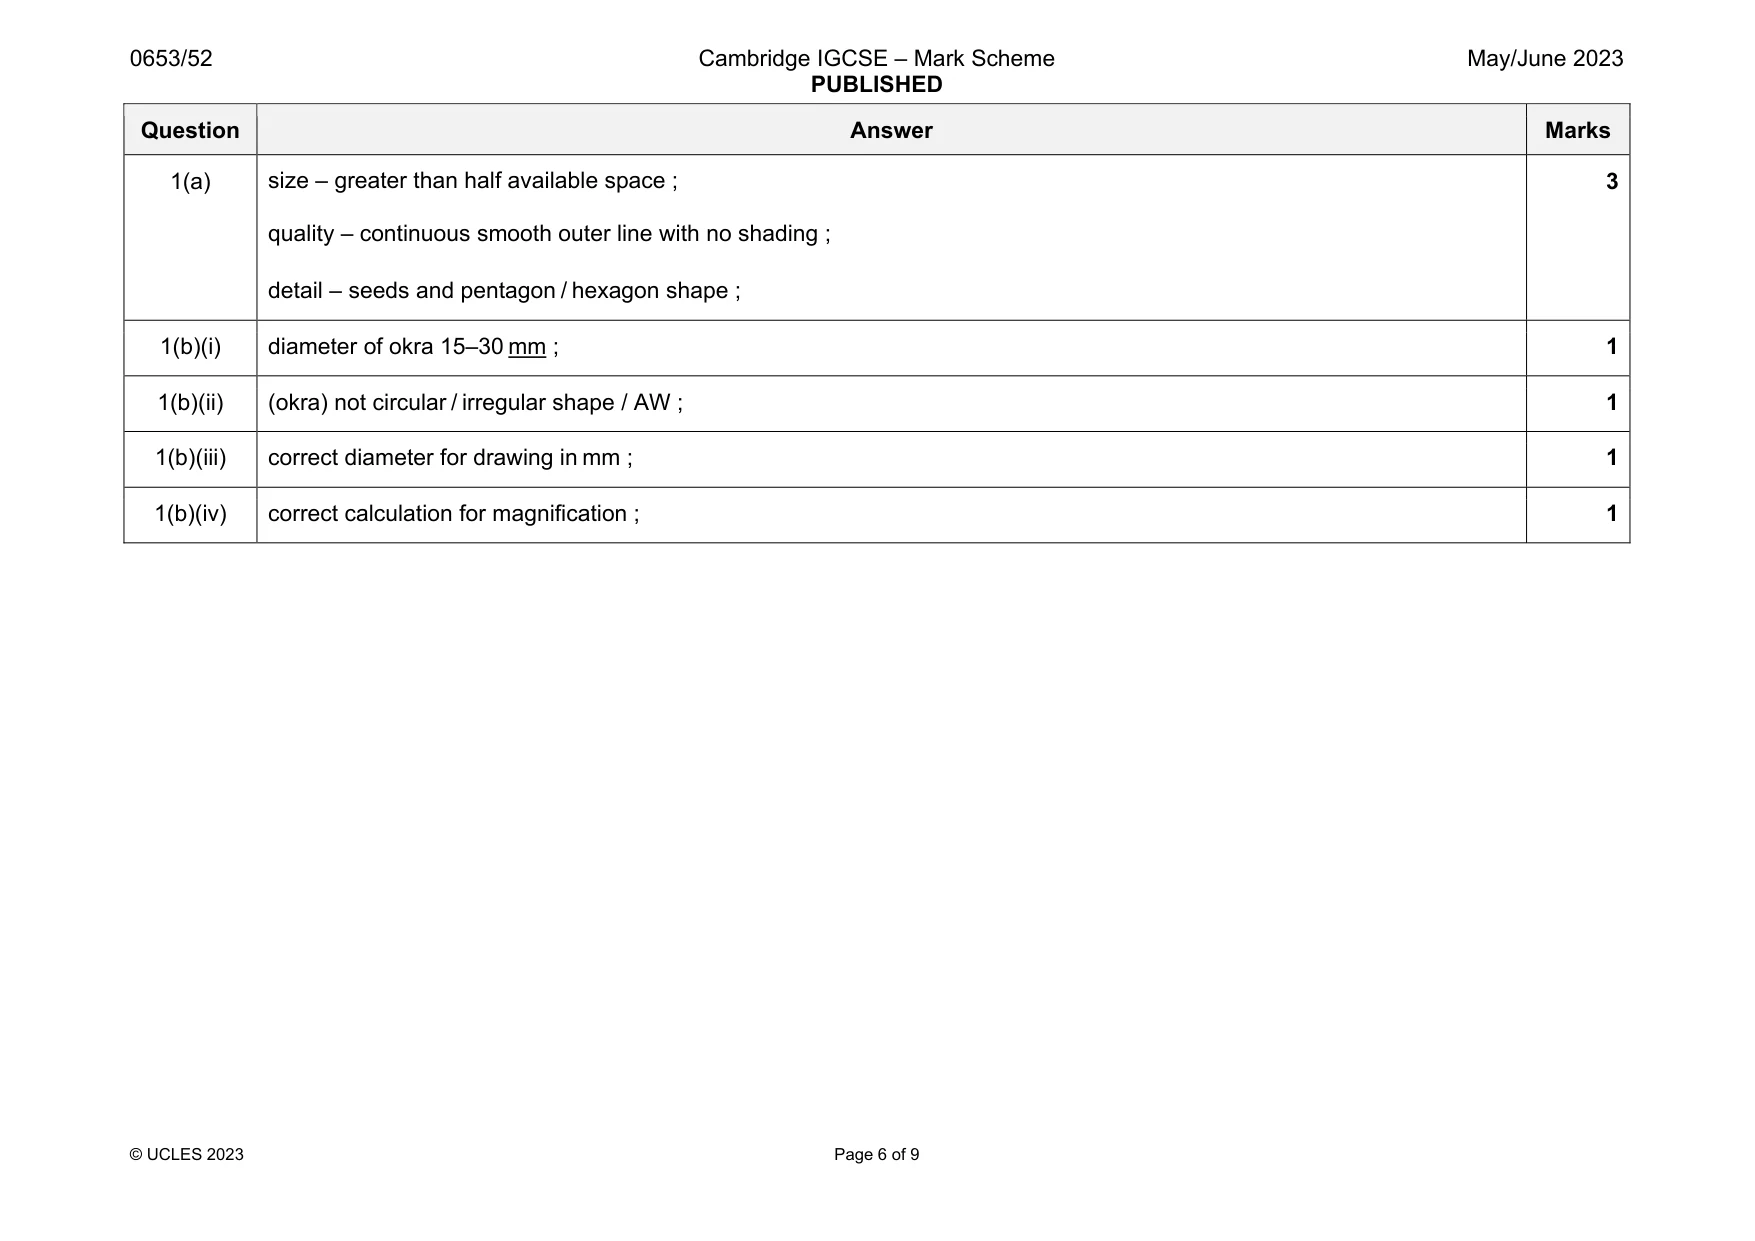
Mark scheme: 1(a) quality – continuous smooth outer line with no shading ; detail – seeds and pentagon / hexagon shape ; 3 1(b)(i) diameter of okra 15–30 mm ; 1 1(b)(ii) (okra) not circular / irregular shape / AW ; 1 1(b)(iii) correct diameter for drawing in mm ; 1 1(b)(iv) correct calculation for magnification ; 1
Q2 · The enzyme amylase breaks down starch to form a reducing sugar
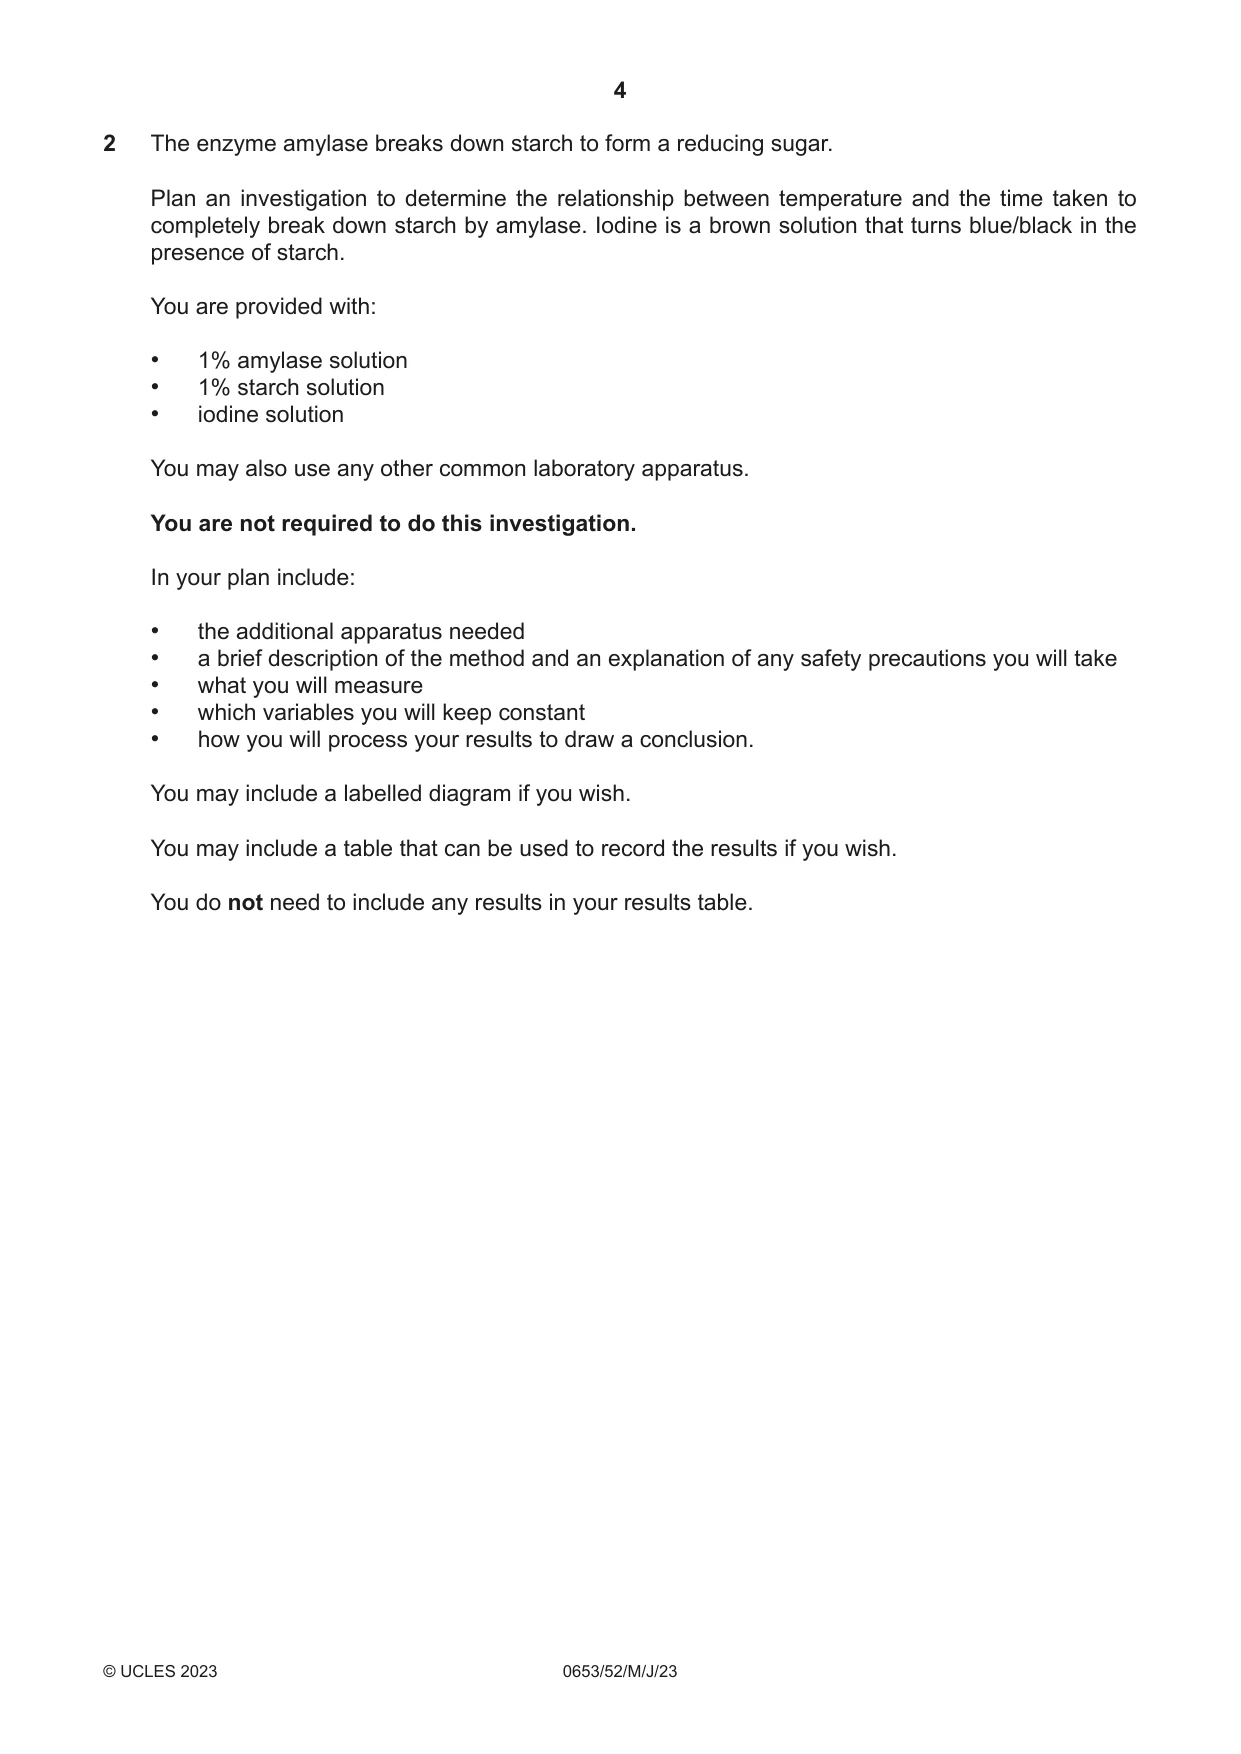
2 The enzyme amylase breaks down starch to form a reducing sugar. Plan an investigation to determine the relationship between temperature and the time taken to completely break down starch by amylase. Iodine is a brown solution that turns blue/black in the presence of starch. You are provided with: • 1% amylase solution • 1% starch solution • iodine solution You may also use any other common laboratory apparatus. You are not required to do this investigation. In your plan include: • the additional apparatus needed • a brief description of the method and an explanation of any safety precautions you will take • what you will measure • which variables you will keep constant • how you will process your results to draw a conclusion. You may include a labelled diagram if you wish. You may include a table that can be used to record the results if you wish. You do not need to include any results in your results table. .......................................................................................................................................................... .......................................................................................................................................................... .......................................................................................................................................................... .......................................................................................................................................................... .......................................................................................................................................................... .......................................................................................................................................................... .......................................................................................................................................................... .......................................................................................................................................................... .......................................................................................................................................................... .......................................................................................................................................................... .......................................................................................................................................................... .......................................................................................................................................................... .......................................................................................................................................................... .................................................................................................................................................... [7]
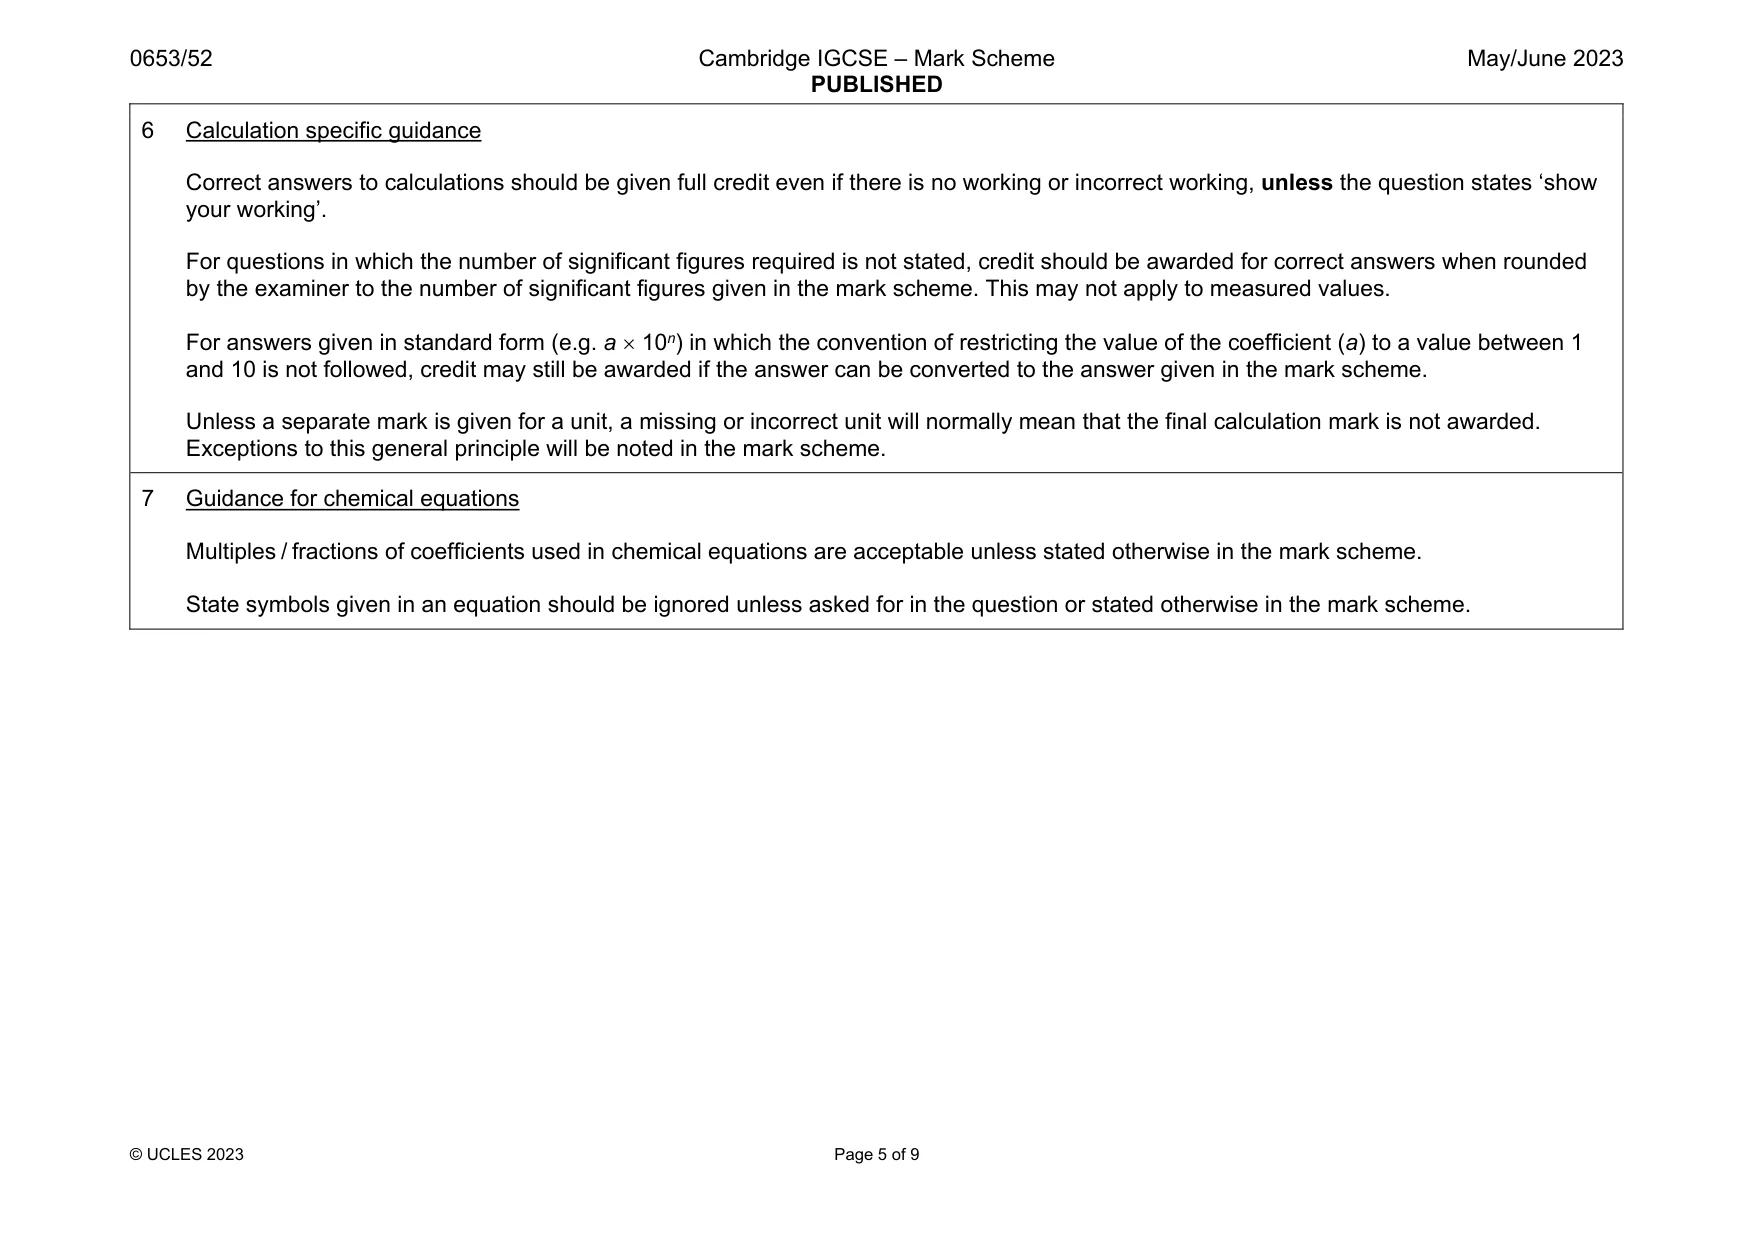
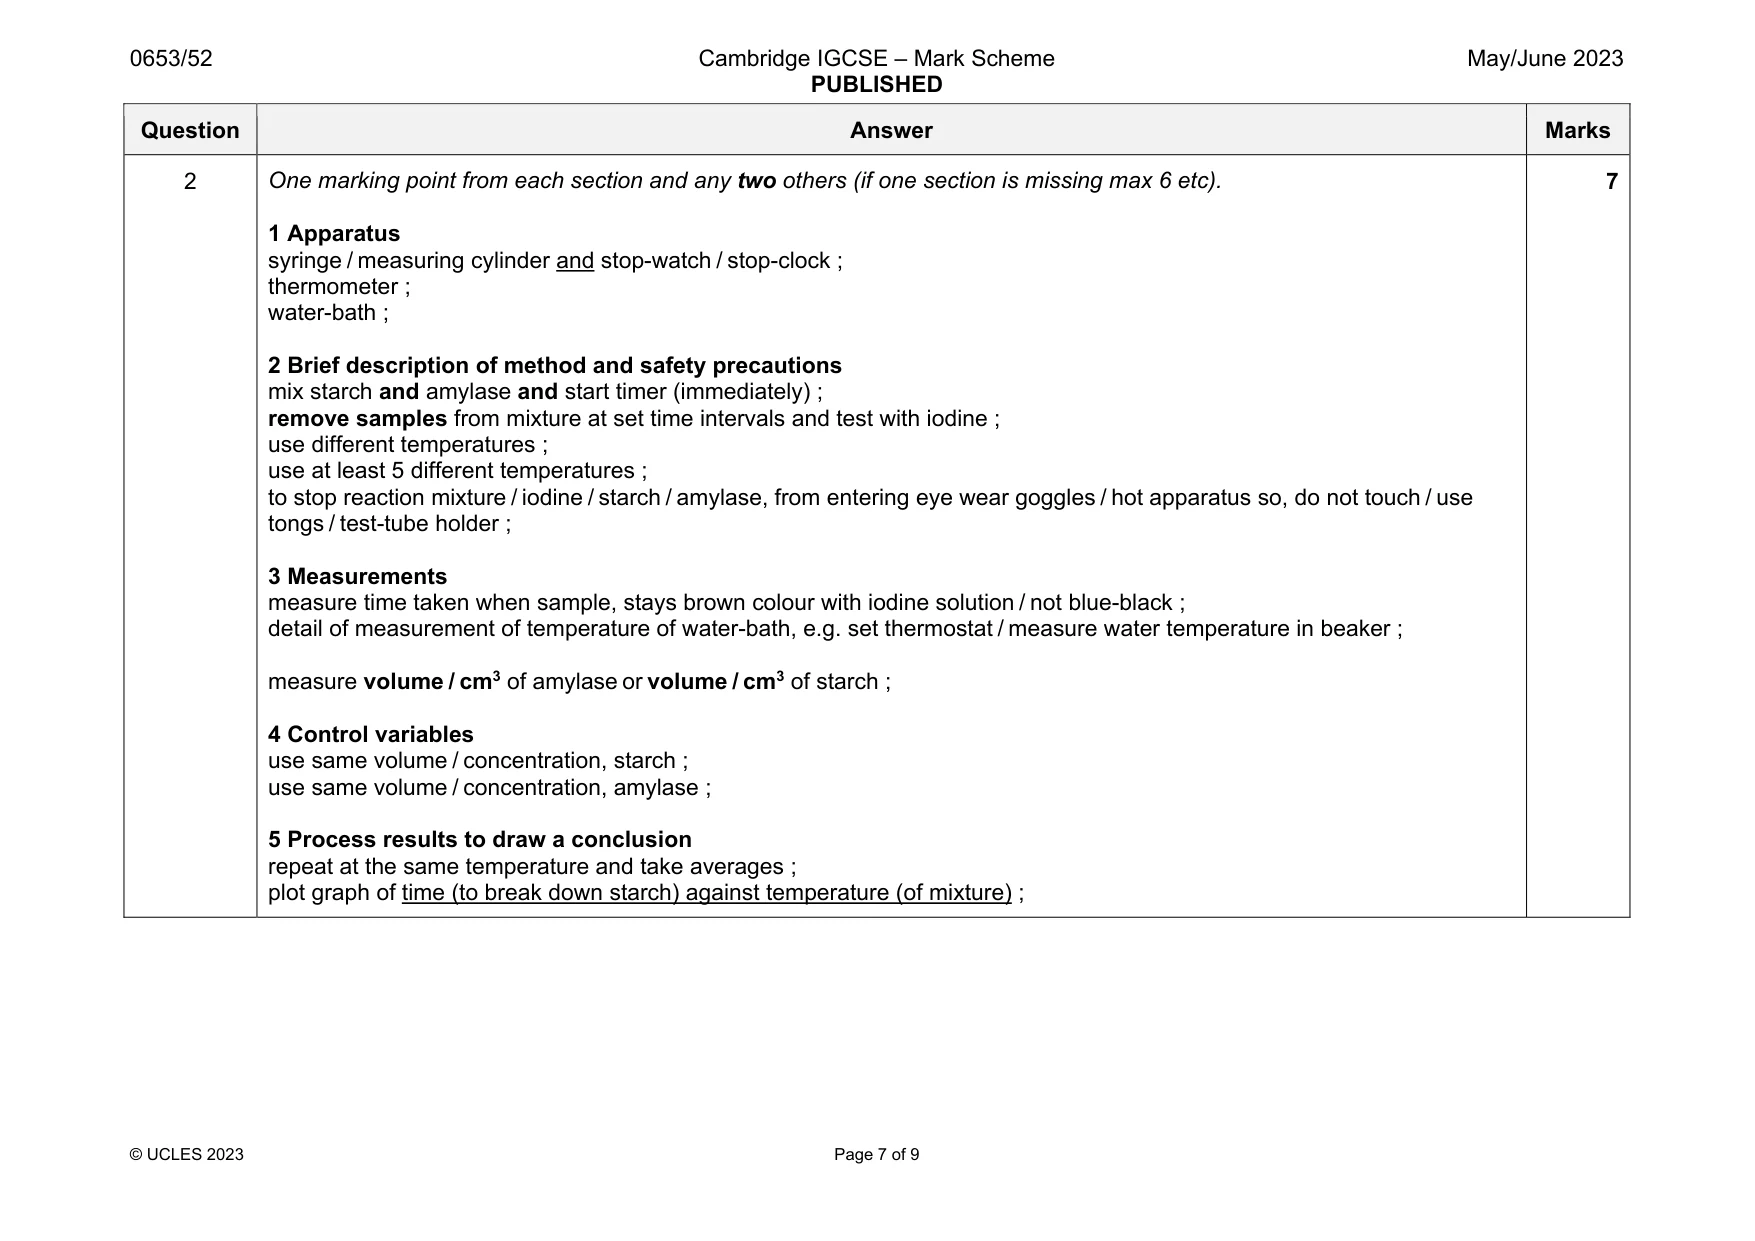
Mark scheme: 2 1 Apparatus syringe / measuring cylinder and stop-watch / stop-clock ; thermometer ; water-bath ; 2 Brief description of method and safety precautions mix starch and amylase and start timer (immediately) ; remove samples from mixture at set time intervals and test with iodine ; use different temperatures ; use at least 5 different temperatures ; to stop reaction mixture / iodine / starch / amylase, from entering eye wear goggles / hot apparatus so, do not touch / use tongs / test-tube holder ; 3 Measurements measure time taken when sample, stays brown colour with iodine solution / not blue-black ; detail of measurement of temperature of water-bath, e.g. set thermostat / measure water temperature in beaker ; measure volume / cm3 of amylase or volume / cm3 of starch ; 4 Control variables use same volume / concentration, starch ; use same volume / concentration, amylase ; 5 Process results to draw a conclusion repeat at the same temperature and take averages ; plot graph of time (to break down starch) against temperature (of mixture) ; 7
Q3 · You are going to investigate a white solid H
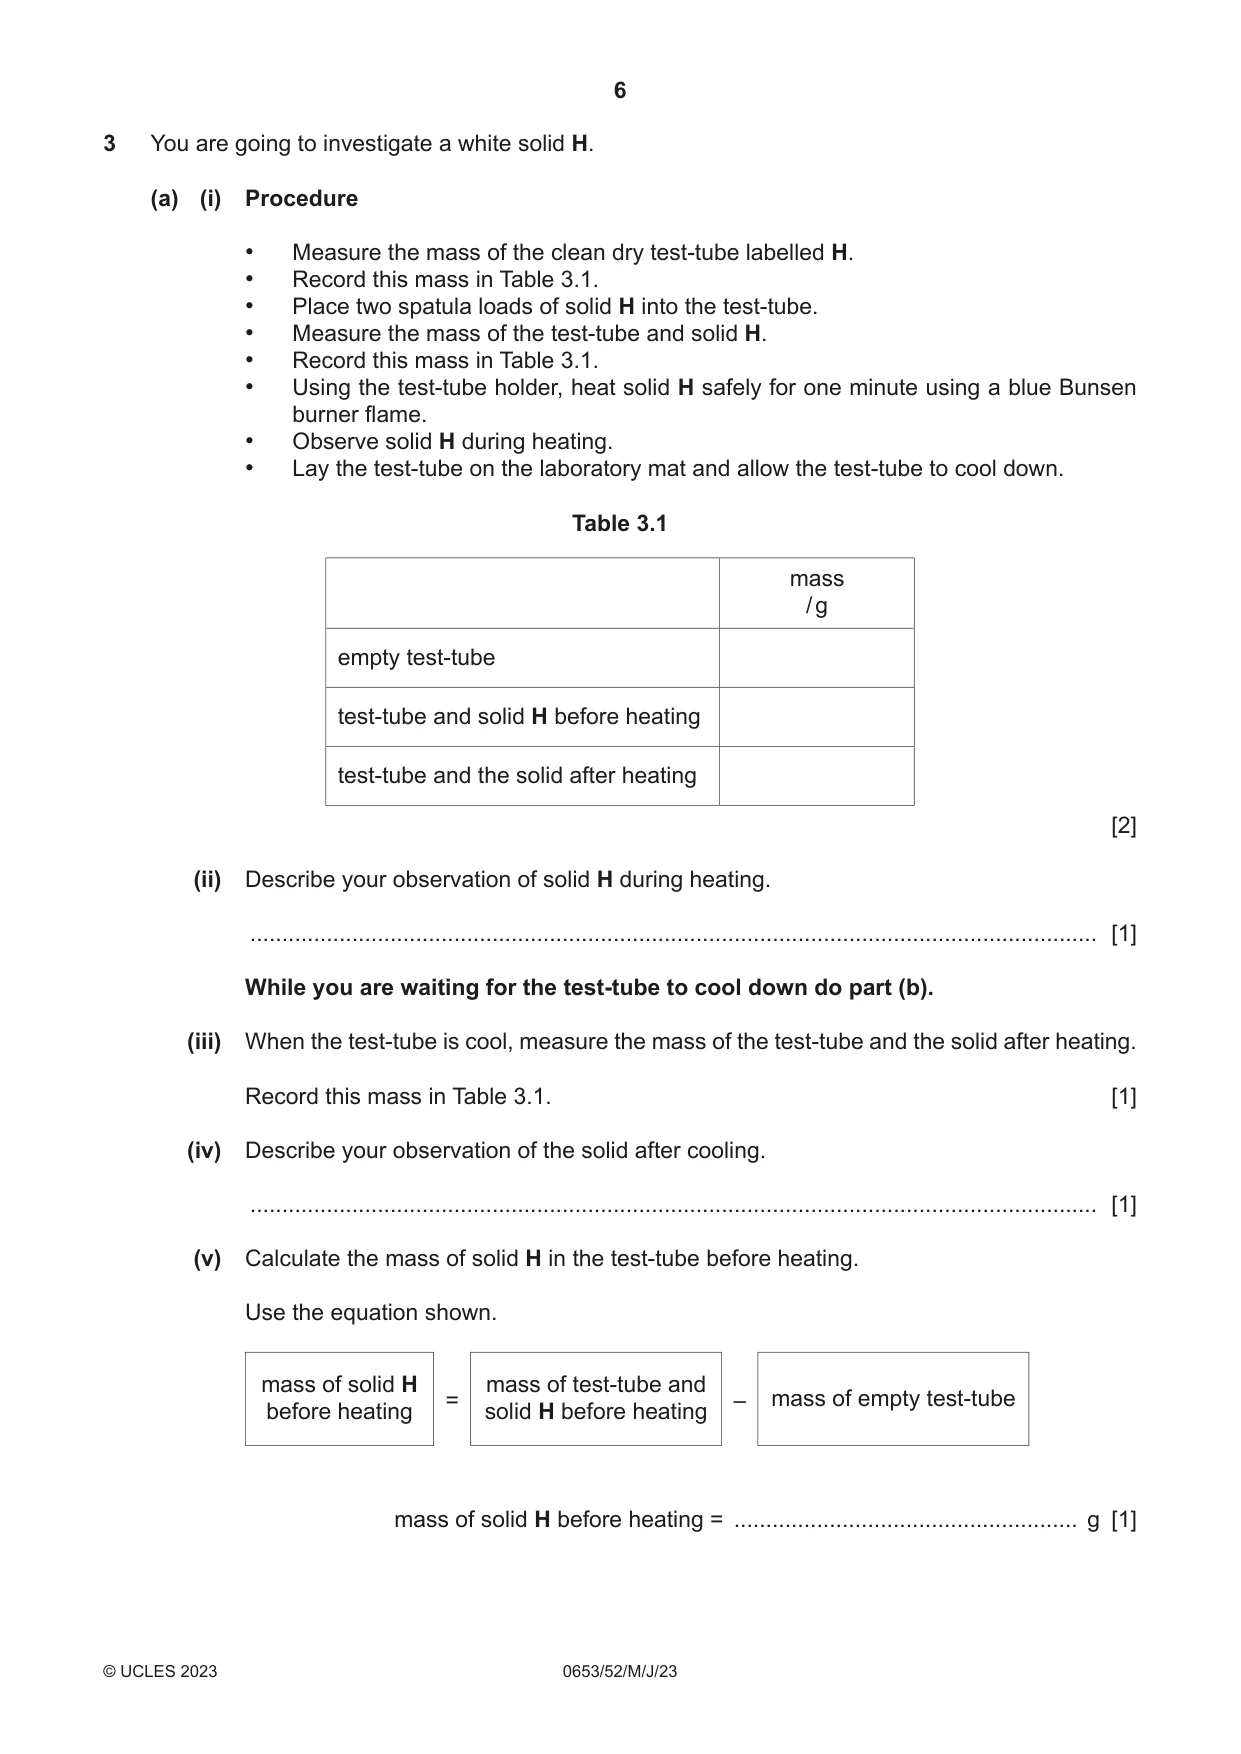
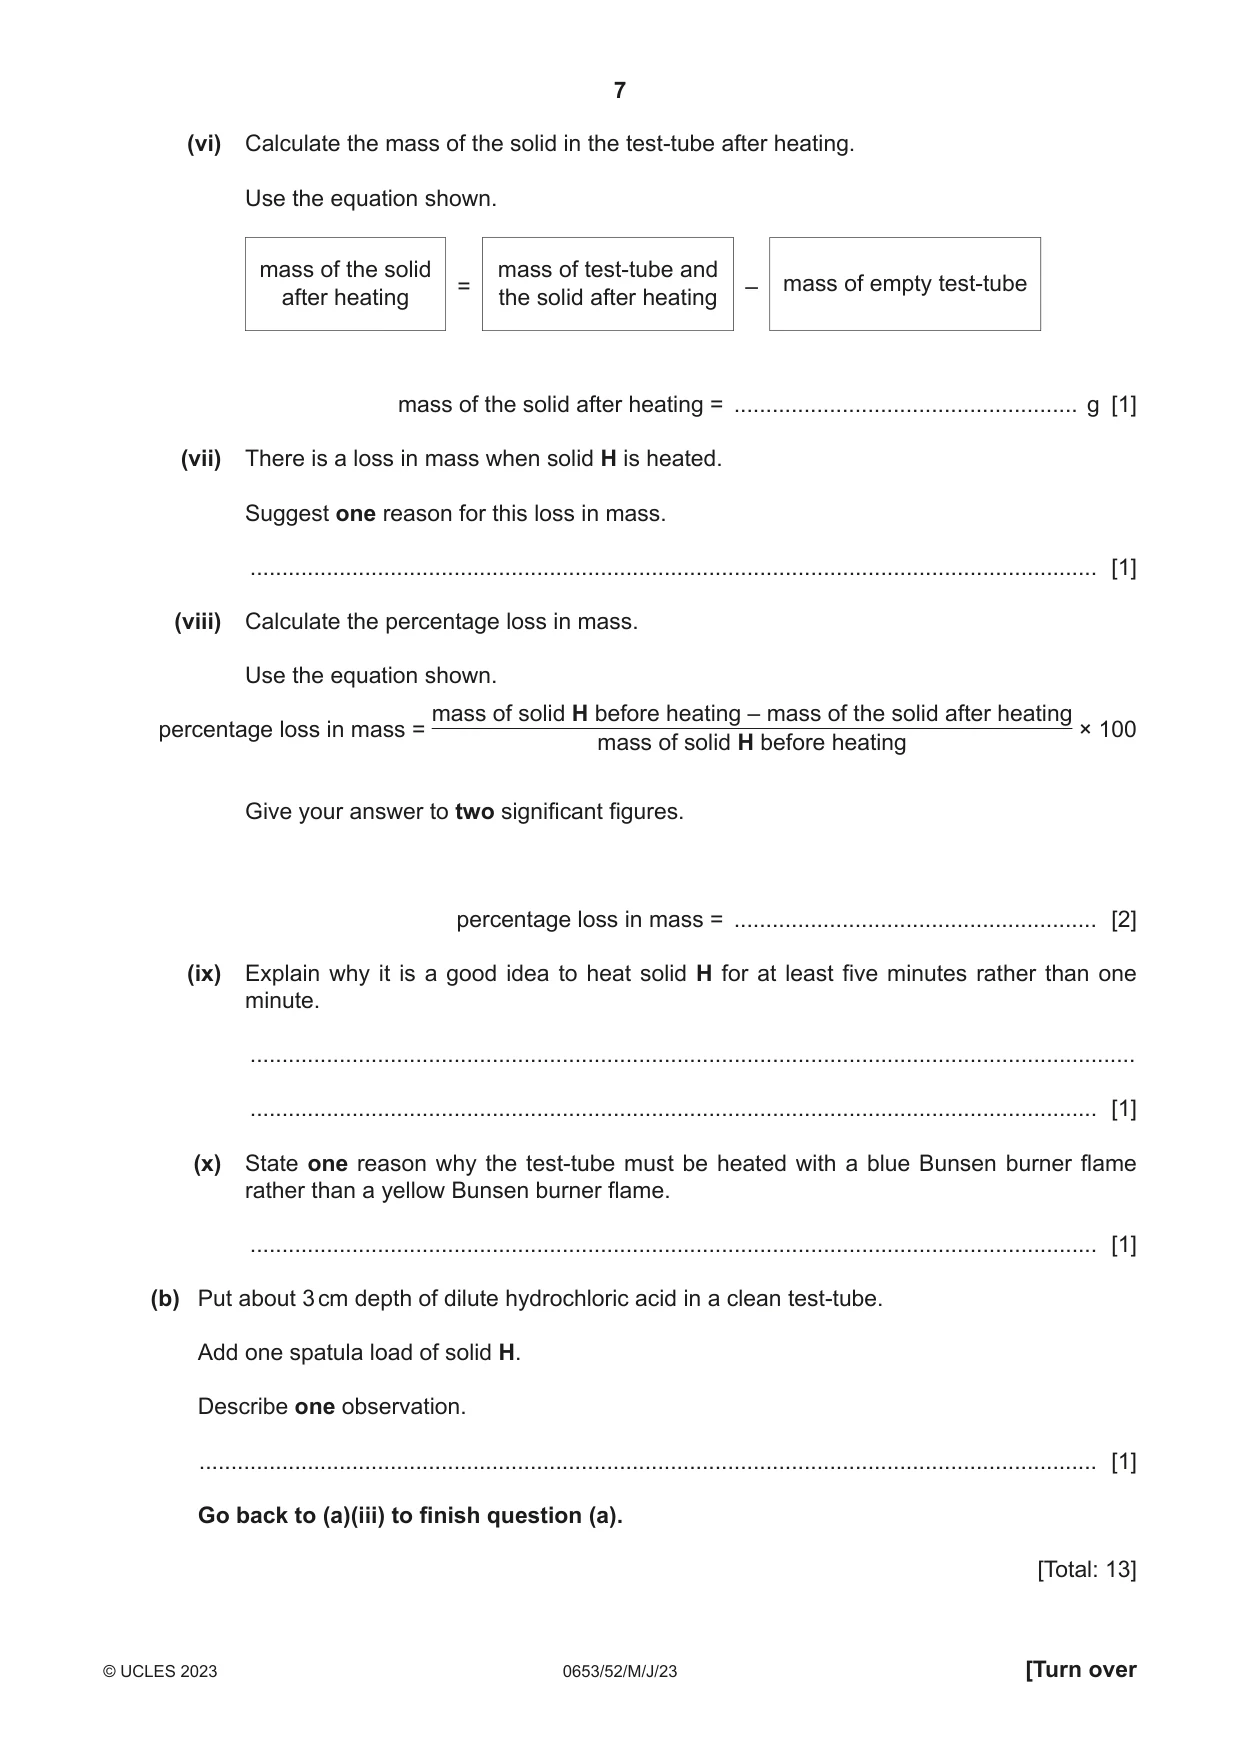
3 You are going to investigate a white solid H. (a) (i) Procedure • Measure the mass of the clean dry test-tube labelled H. • Record this mass in Table 3.1. • Place two spatula loads of solid H into the test-tube. • Measure the mass of the test-tube and solid H. • Record this mass in Table 3.1. • Using the test-tube holder, heat solid H safely for one minute using a blue Bunsen burner flame. • Observe solid H during heating. • Lay the test-tube on the laboratory mat and allow the test-tube to cool down. Table 3.1 mass / g empty test-tube test-tube and solid H before heating test-tube and the solid after heating [2] (ii) Describe your observation of solid H during heating. ..................................................................................................................................... [1] While you are waiting for the test-tube to cool down do part (b). (iii) When the test-tube is cool, measure the mass of the test-tube and the solid after heating. Record this mass in Table 3.1. [1] (iv) Describe your observation of the solid after cooling. ..................................................................................................................................... [1] (v) Calculate the mass of solid H in the test-tube before heating. Use the equation shown. mass of solid H mass of test-tube and = – mass of empty test-tube before heating solid H before heating mass of solid H before heating = ...................................................... g [1] (vi) Calculate the mass of the solid in the test-tube after heating. Use the equation shown. mass of the solid mass of test-tube and = – mass of empty test-tube after heating the solid after heating mass of the solid after heating = ...................................................... g [1] (vii) There is a loss in mass when solid H is heated. Suggest one reason for this loss in mass. ..................................................................................................................................... [1] (viii) Calculate the percentage loss in mass. Use the equation shown. mass of solid H before heating – mass of the solid after heating percentage loss in mass = × 100 mass of solid H before heating Give your answer to two significant figures. percentage loss in mass = ......................................................... [2] (ix) Explain why it is a good idea to heat solid H for at least five minutes rather than one minute. ........................................................................................................................................... ..................................................................................................................................... [1] (x) State one reason why the test-tube must be heated with a blue Bunsen burner flame rather than a yellow Bunsen burner flame. ..................................................................................................................................... [1] (b) Put about 3 cm depth of dilute hydrochloric acid in a clean test-tube. Add one spatula load of solid H. Describe one observation. ............................................................................................................................................. [1] Go back to (a)(iii) to finish question (a). [Total: 13]
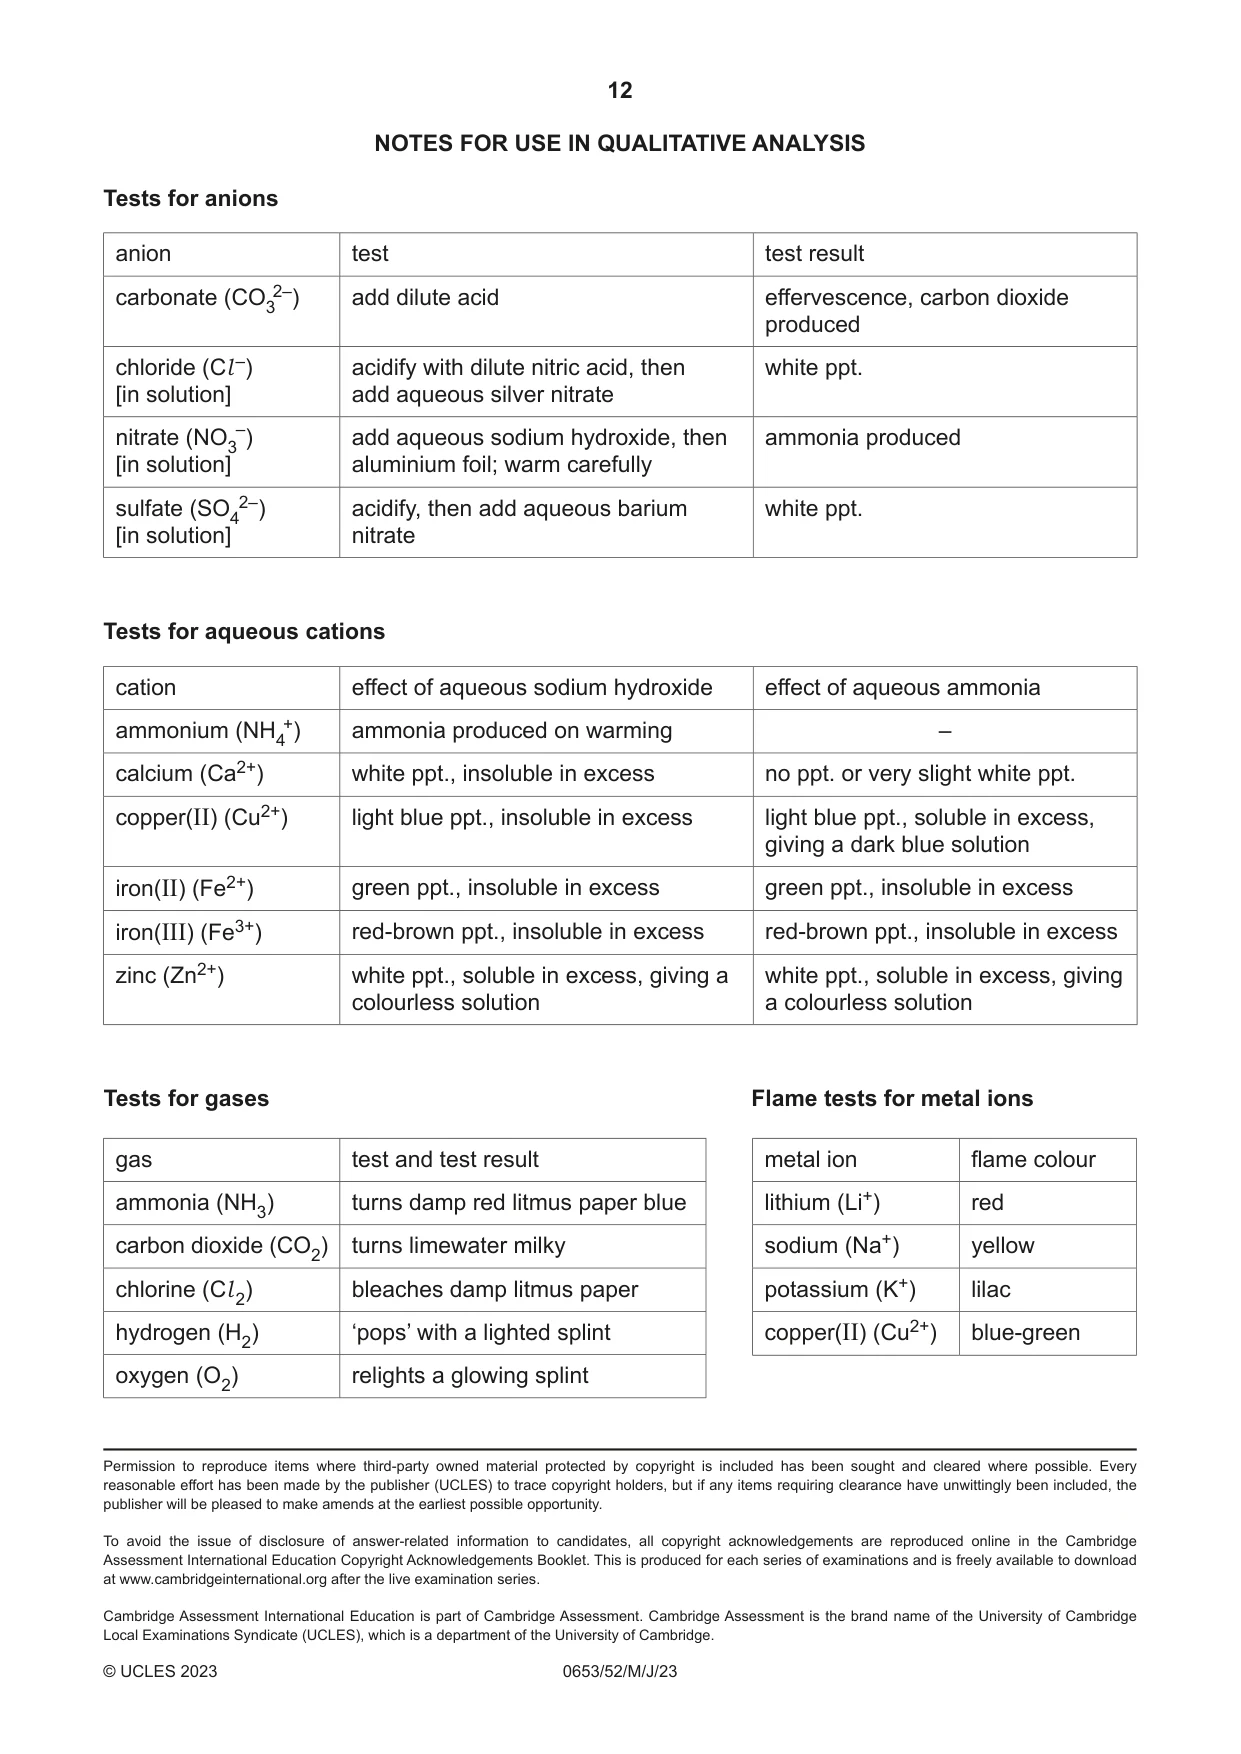
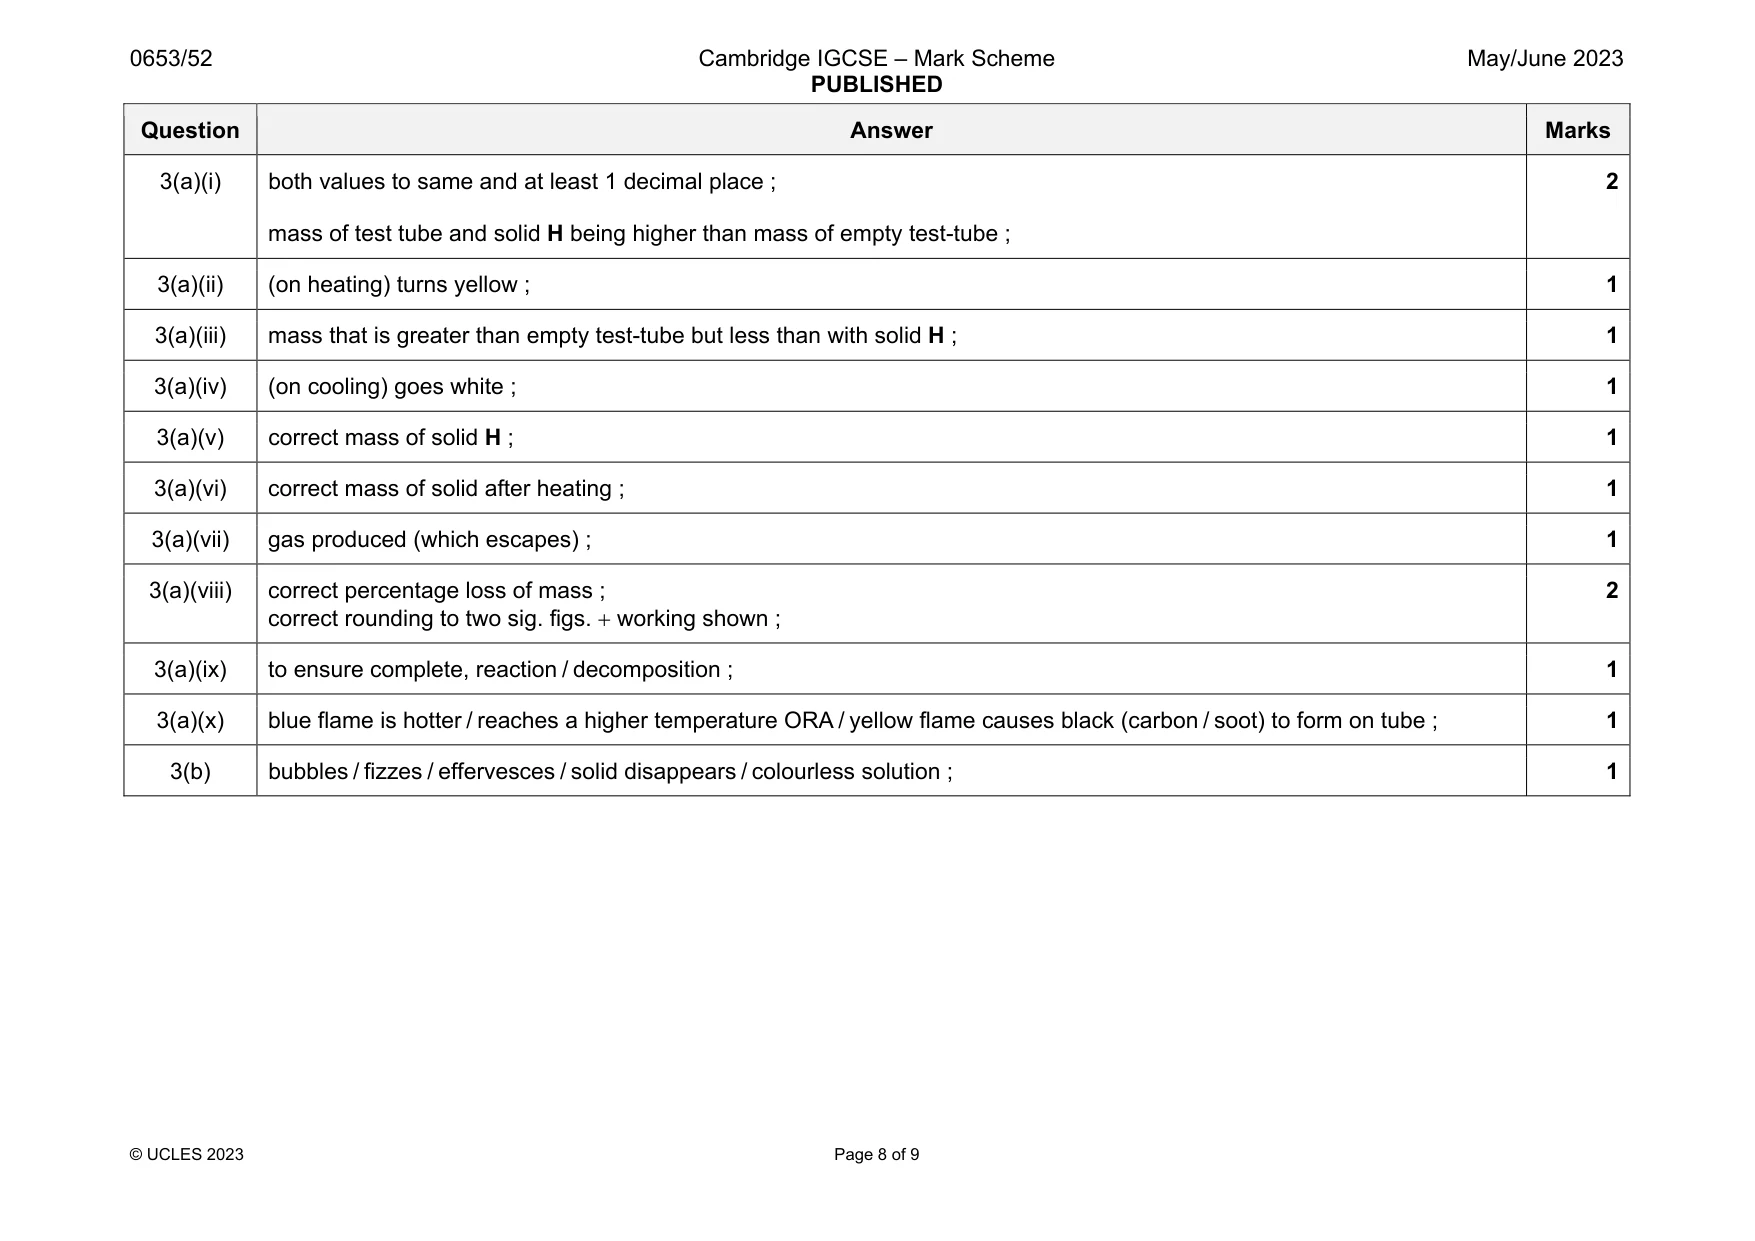
Mark scheme: 3(a)(i) both values to same and at least 1 decimal place ; mass of test tube and solid H being higher than mass of empty test-tube ; 2 3(a)(ii) (on heating) turns yellow ; 1 3(a)(iii) mass that is greater than empty test-tube but less than with solid H ; 1 3(a)(iv) (on cooling) goes white ; 1 3(a)(v) correct mass of solid H ; 1 3(a)(vi) correct mass of solid after heating ; 1 3(a)(vii) gas produced (which escapes) ; 1 3(a)(viii) correct percentage loss of mass ; correct rounding to two sig. figs. working shown ; 2 3(a)(ix) to ensure complete, reaction / decomposition ; 1 3(a)(x) blue flame is hotter / reaches a higher temperature ORA / yellow flame causes black (carbon / soot) to form on tube ; 1 3(b) bubbles / fizzes / effervesces / solid disappears / colourless solution ; 1
Q4 · You are going to measure the focal length F of a convex lens
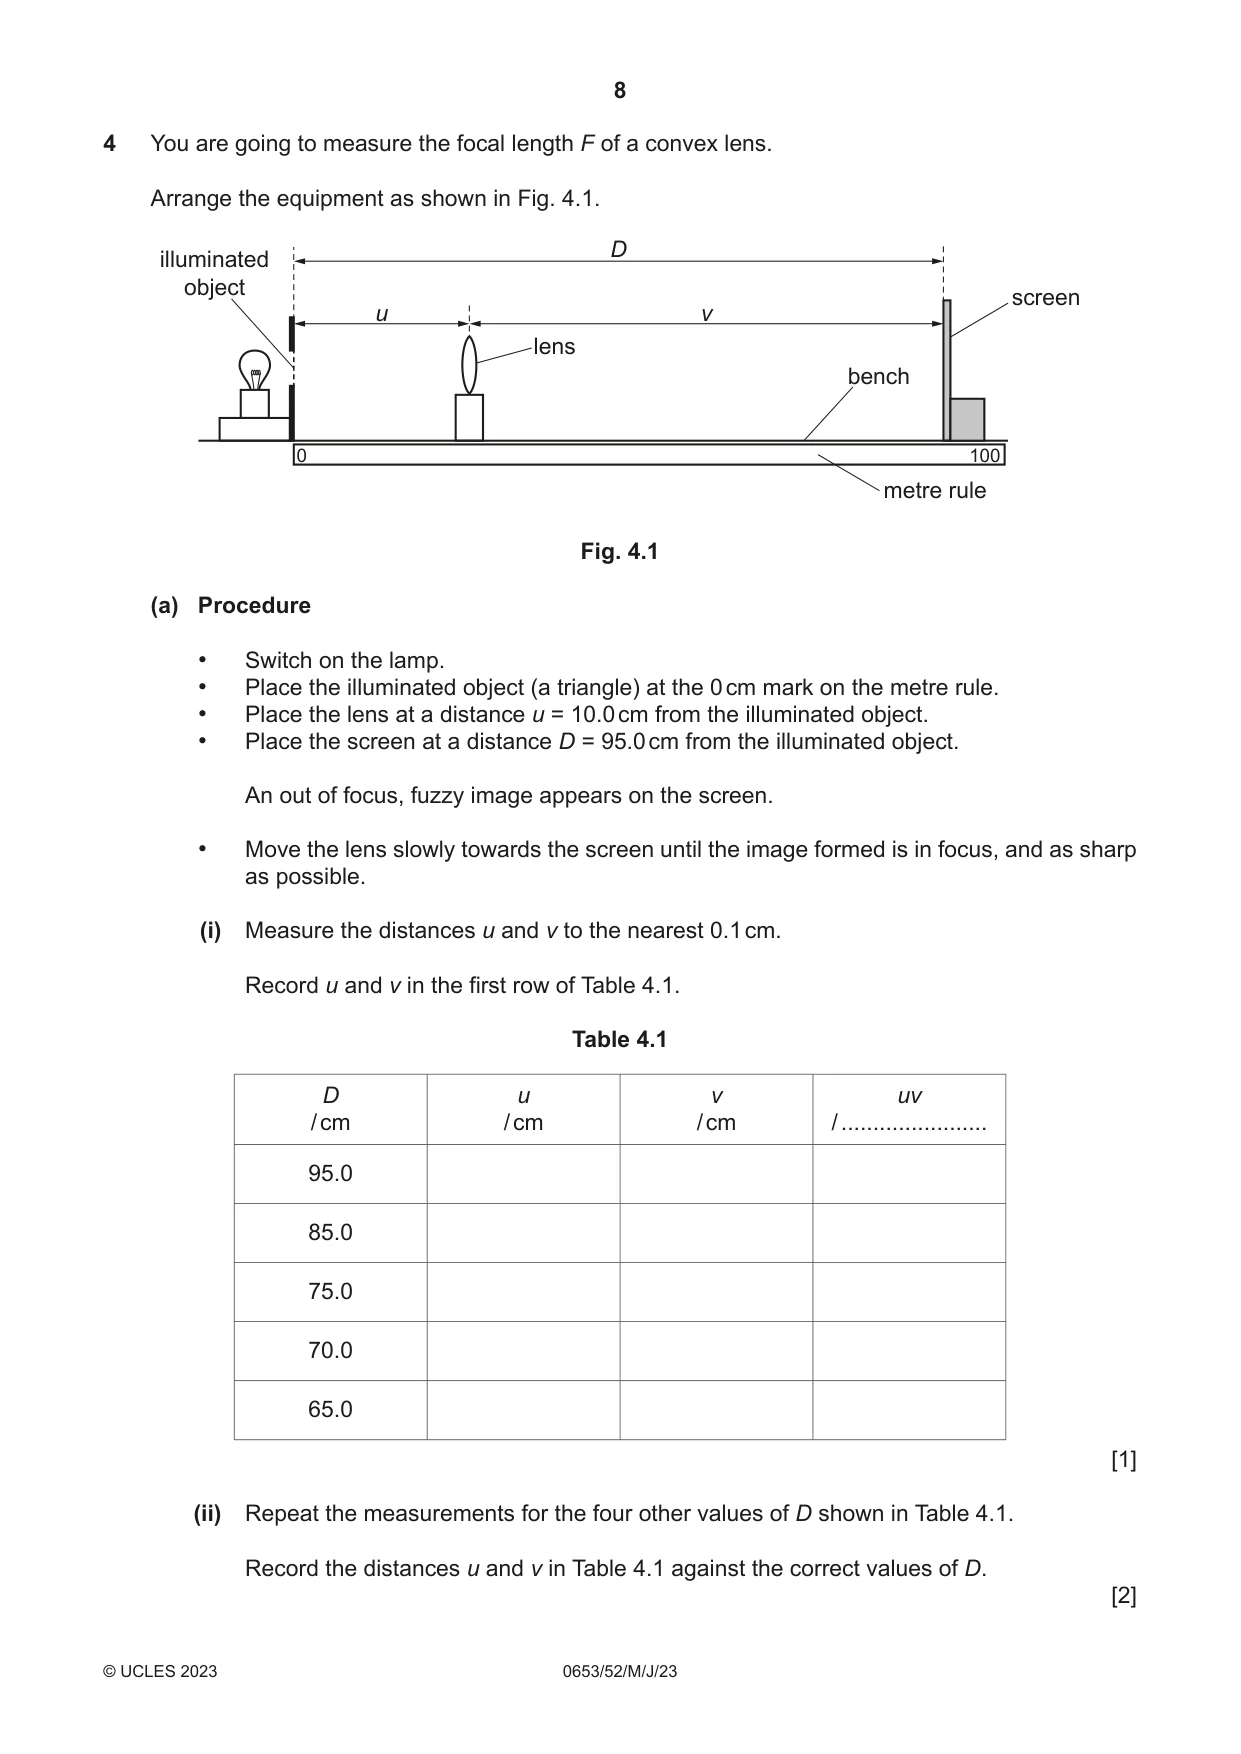
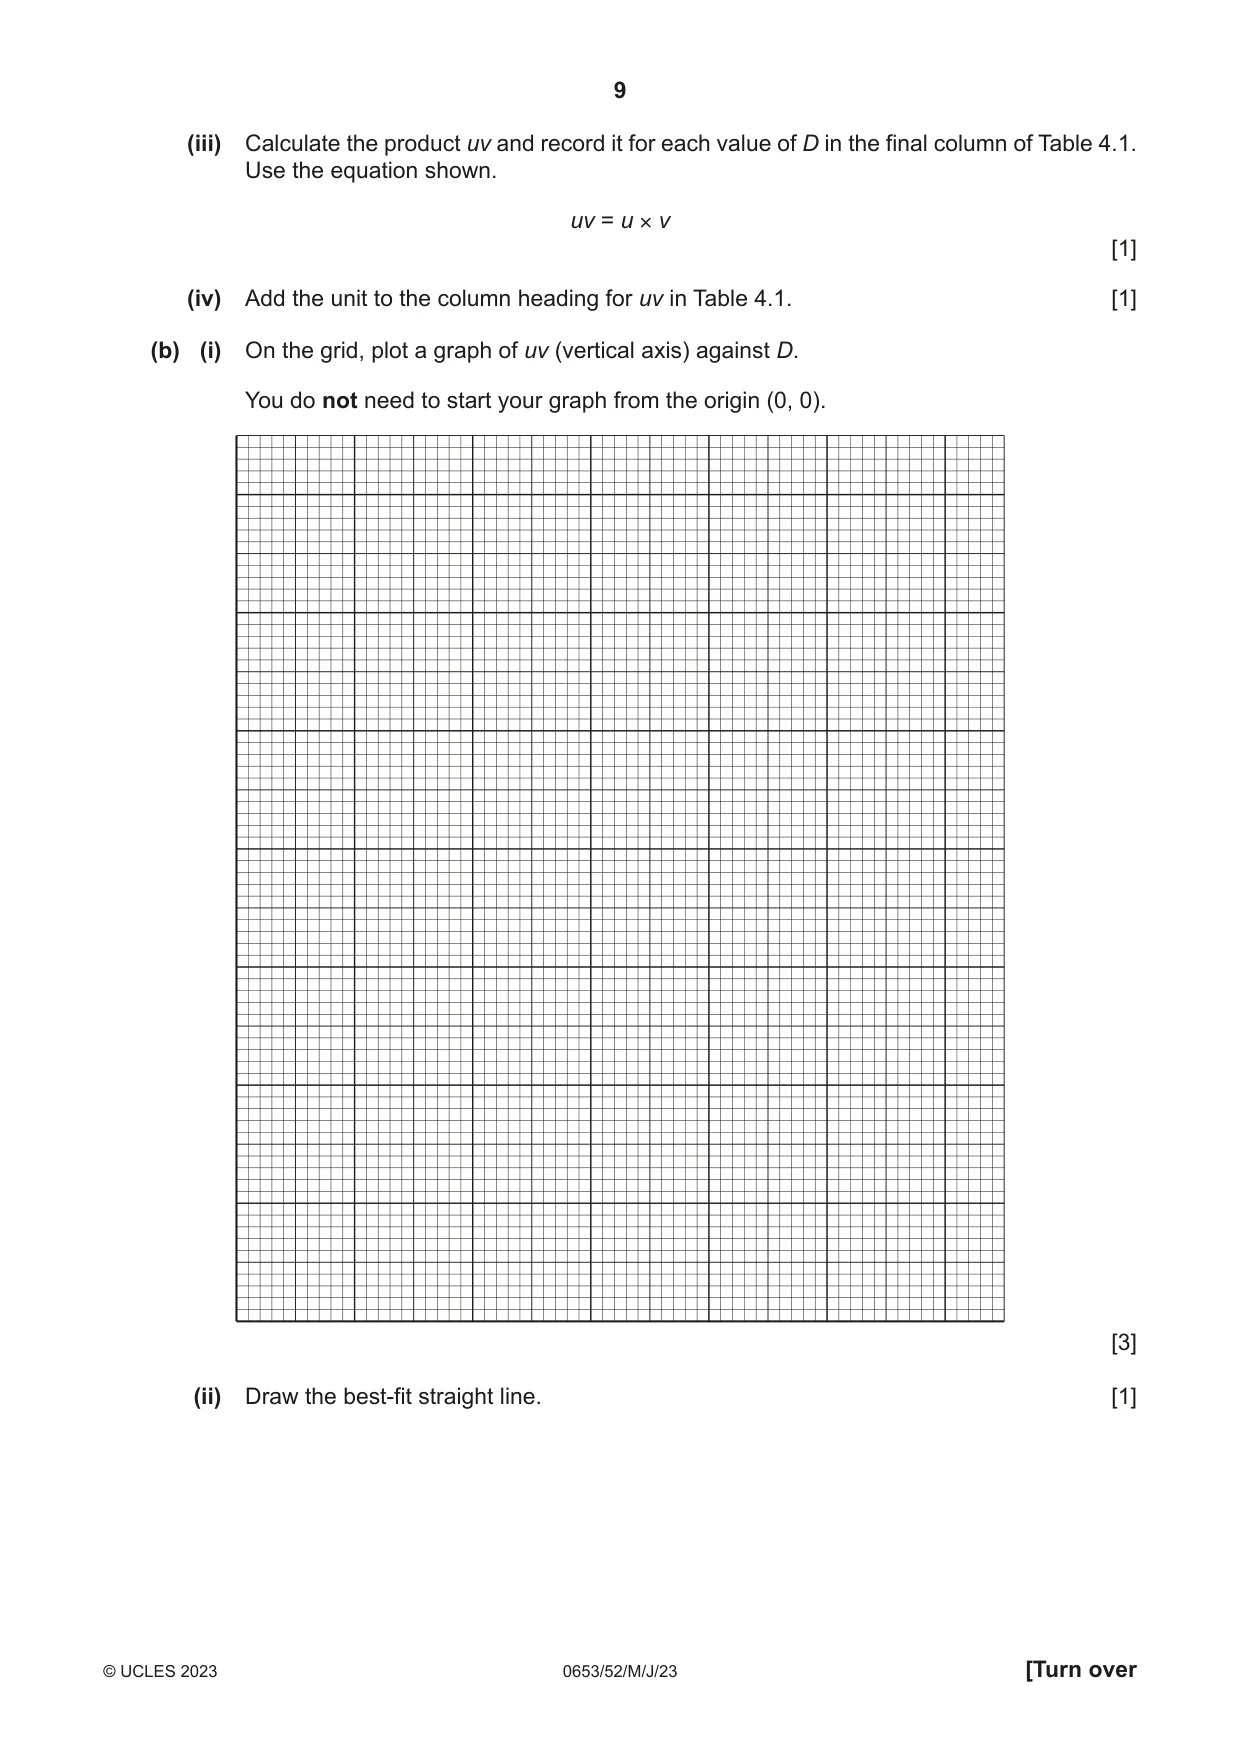
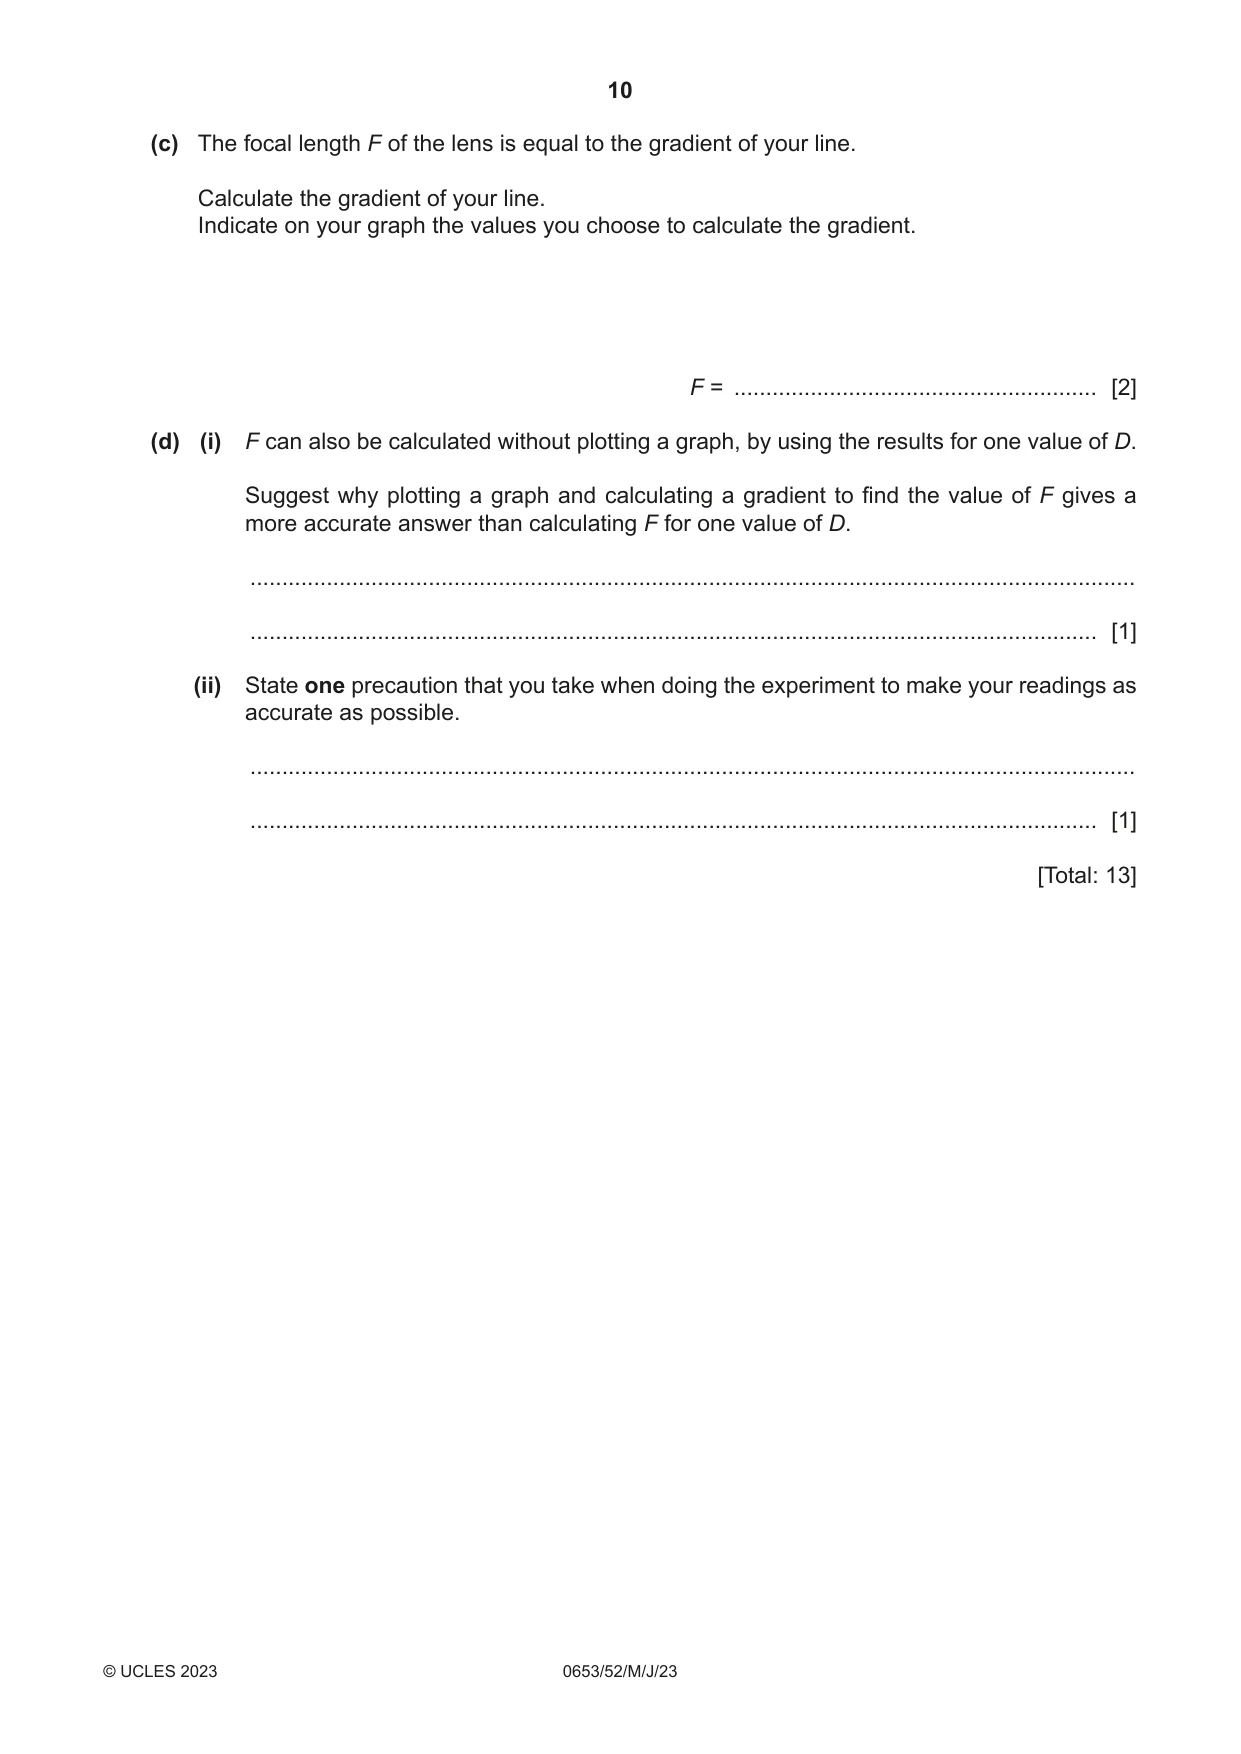
4 You are going to measure the focal length F of a convex lens. Arrange the equipment as shown in Fig. 4.1. D illuminated object screen u v lens bench 0 100 metre rule Fig. 4.1 (a) Procedure • Switch on the lamp. • Place the illuminated object (a triangle) at the 0 cm mark on the metre rule. • Place the lens at a distance u = 10.0 cm from the illuminated object. • Place the screen at a distance D = 95.0 cm from the illuminated object. An out of focus, fuzzy image appears on the screen. • Move the lens slowly towards the screen until the image formed is in focus, and as sharp as possible. (i) Measure the distances u and v to the nearest 0.1 cm. Record u and v in the first row of Table 4.1. Table 4.1 D u v uv / cm / cm / cm / ....................... 95.0 85.0 75.0 70.0 65.0 [1] (ii) Repeat the measurements for the four other values of D shown in Table 4.1. Record the distances u and v in Table 4.1 against the correct values of D. [2] (iii) Calculate the product uv and record it for each value of D in the final column of Table 4.1. Use the equation shown. uv = u × v [1] (iv) Add the unit to the column heading for uv in Table 4.1. [1] (b) (i) On the grid, plot a graph of uv (vertical axis) against D. You do not need to start your graph from the origin (0, 0). [3] (ii) Draw the best-fit straight line. [1] (c) The focal length F of the lens is equal to the gradient of your line. Calculate the gradient of your line. Indicate on your graph the values you choose to calculate the gradient. F = ......................................................... [2] (d) (i) F can also be calculated without plotting a graph, by using the results for one value of D. Suggest why plotting a graph and calculating a gradient to find the value of F gives a more accurate answer than calculating F for one value of D. ........................................................................................................................................... ..................................................................................................................................... [1] (ii) State one precaution that you take when doing the experiment to make your readings as accurate as possible. ........................................................................................................................................... ..................................................................................................................................... [1] [Total: 13]
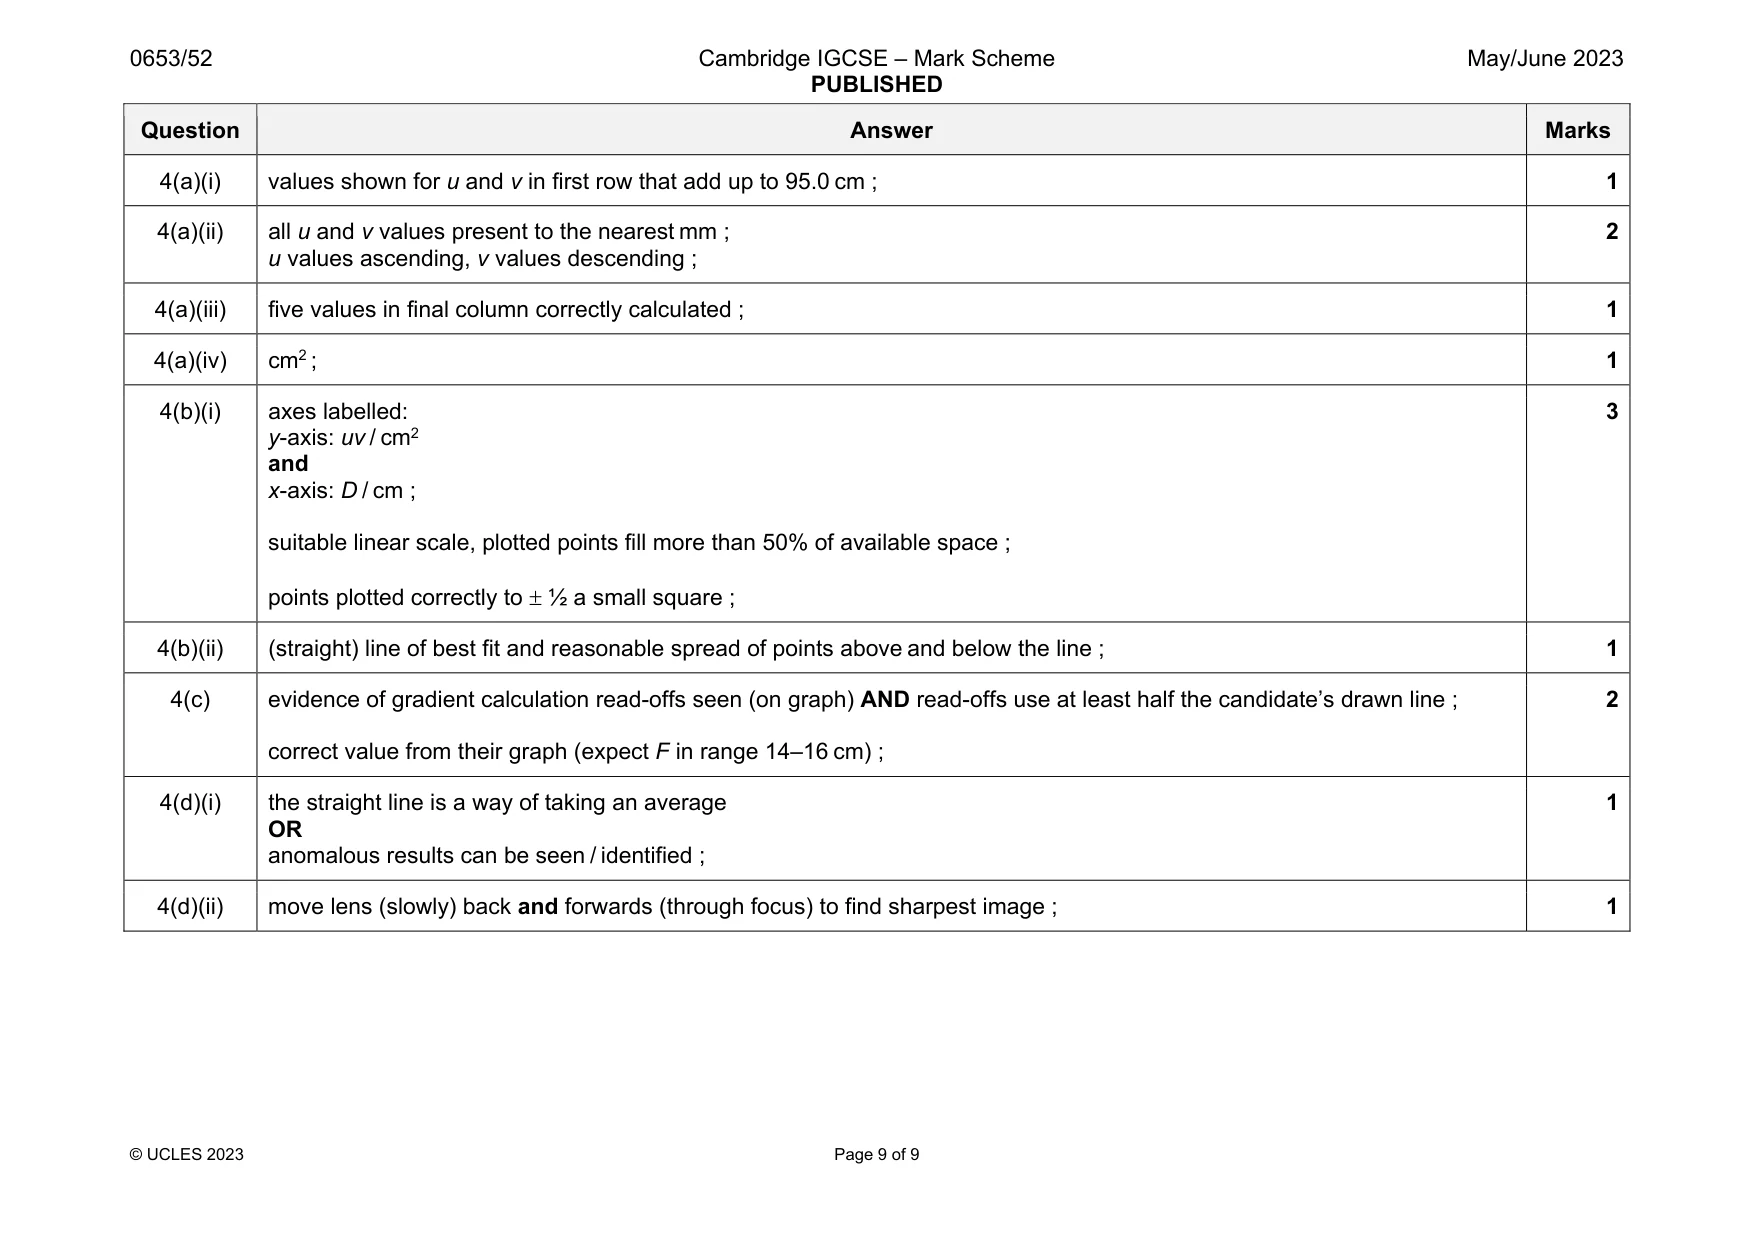
Mark scheme: 4(a)(i) values shown for u and v in first row that add up to 95.0 cm ; 1 4(a)(ii) all u and v values present to the nearest mm ; u values ascending, v values descending ; 2 4(a)(iii) five values in final column correctly calculated ; 1 4(a)(iv) cm2 ; 1 4(b)(i) axes labelled: y-axis: uv / cm2 and x-axis: D / cm ; suitable linear scale, plotted points fill more than 50% of available space ; points plotted correctly to ½ a small square ; 3 4(b)(ii) (straight) line of best fit and reasonable spread of points above and below the line ; 1 4(c) evidence of gradient calculation read-offs seen (on graph) AND read-offs use at least half the candidate’s drawn line ; correct value from their graph (expect F in range 14–16 cm) ; 2 4(d)(i) the straight line is a way of taking an average OR anomalous results can be seen / identified ; 1 4(d)(ii) move lens (slowly) back and forwards (through focus) to find sharpest image ; 1
What was in this paper
The subtopics covered by these 4 questions, and how many questions each got. Open one in a new tab to see every Cambridge question on it.
What you needed in this session
Cambridge’s own grade thresholds for 2023 May/June, Paper 5 · Variant 2. A higher threshold means an easier paper — the bar moves with how the cohort did.