Cambridge IGCSE Science - Combined 0653 — 2021 May/June Paper 5 · Variant 2
0653/52/M/J/21 · 4 questions · 40 marks · ≈45 min
The question paper and its mark scheme, free to read here and free to download. This is Cambridge’s own paper, exactly as it was sat.
Question paper16 pages
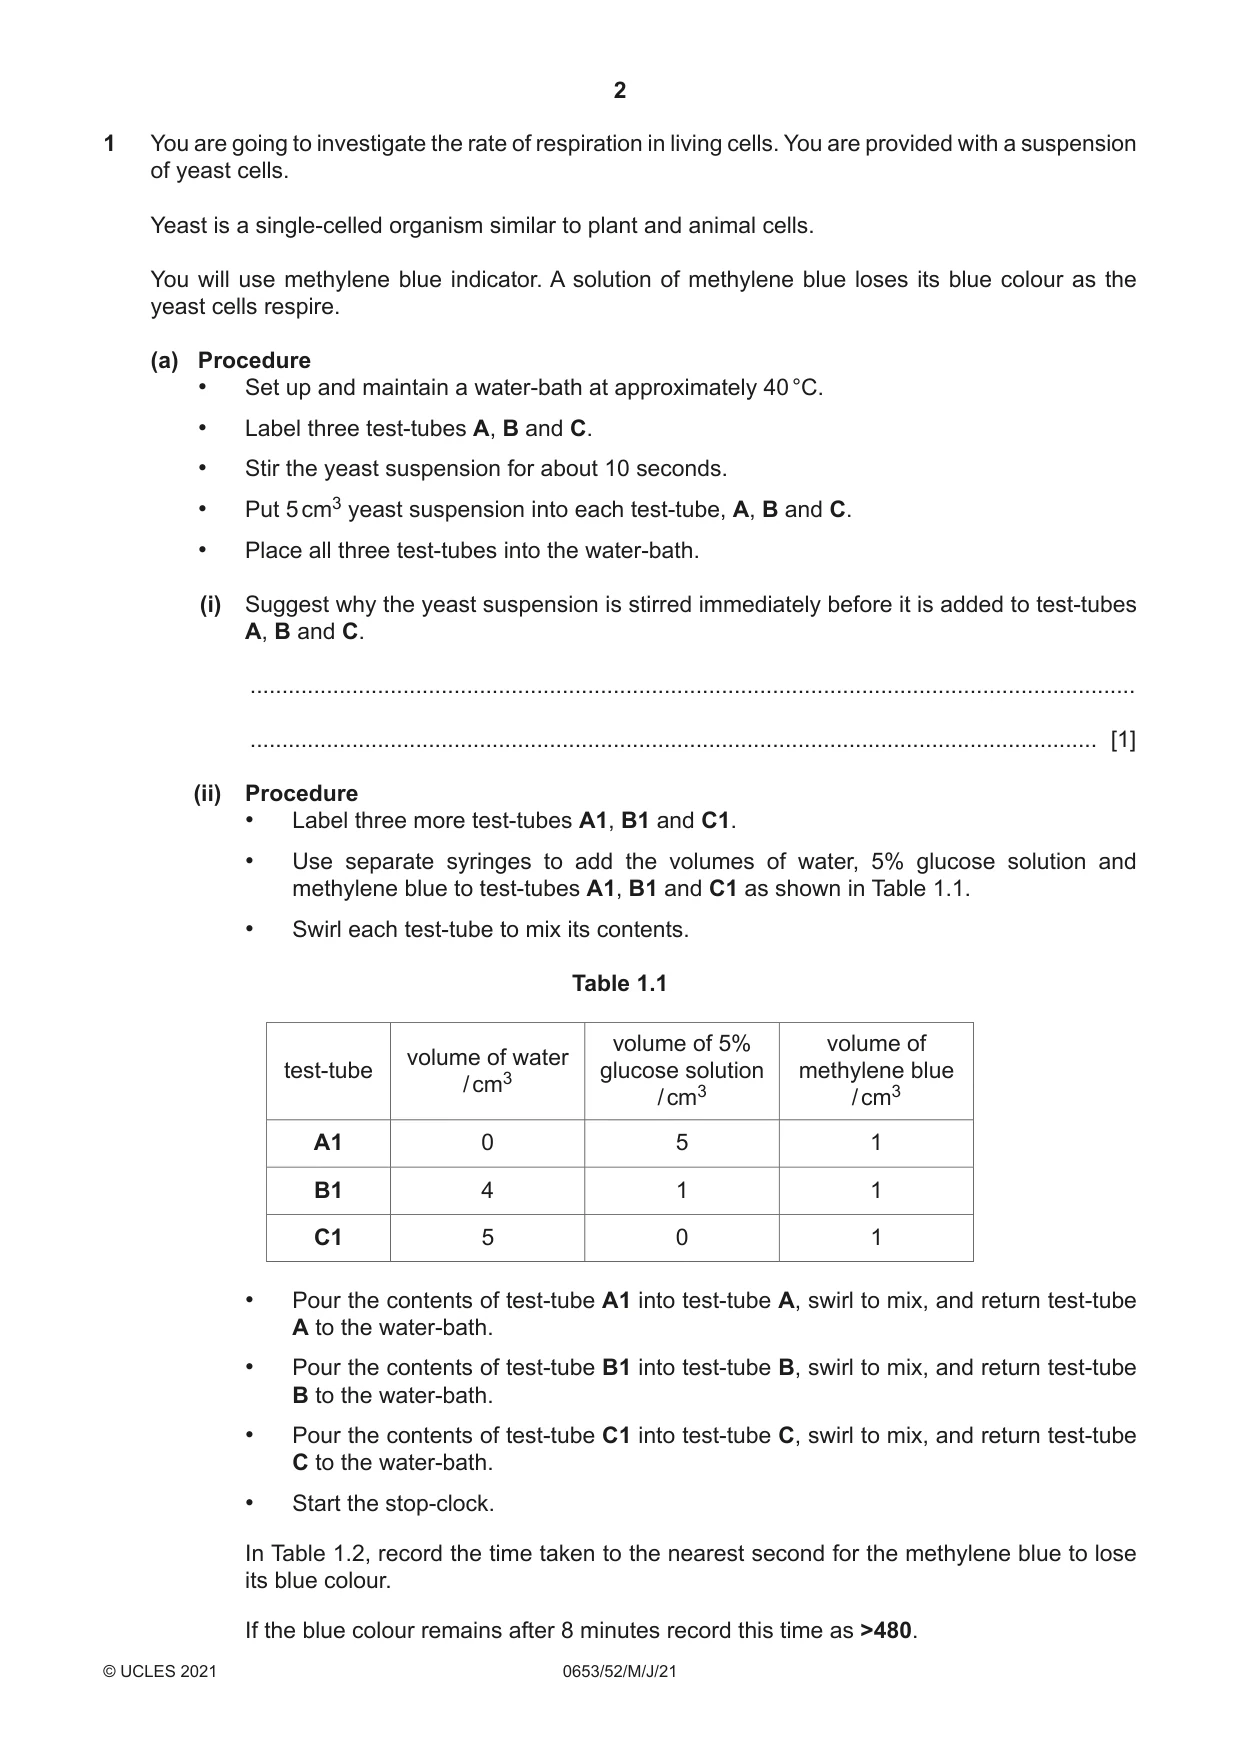
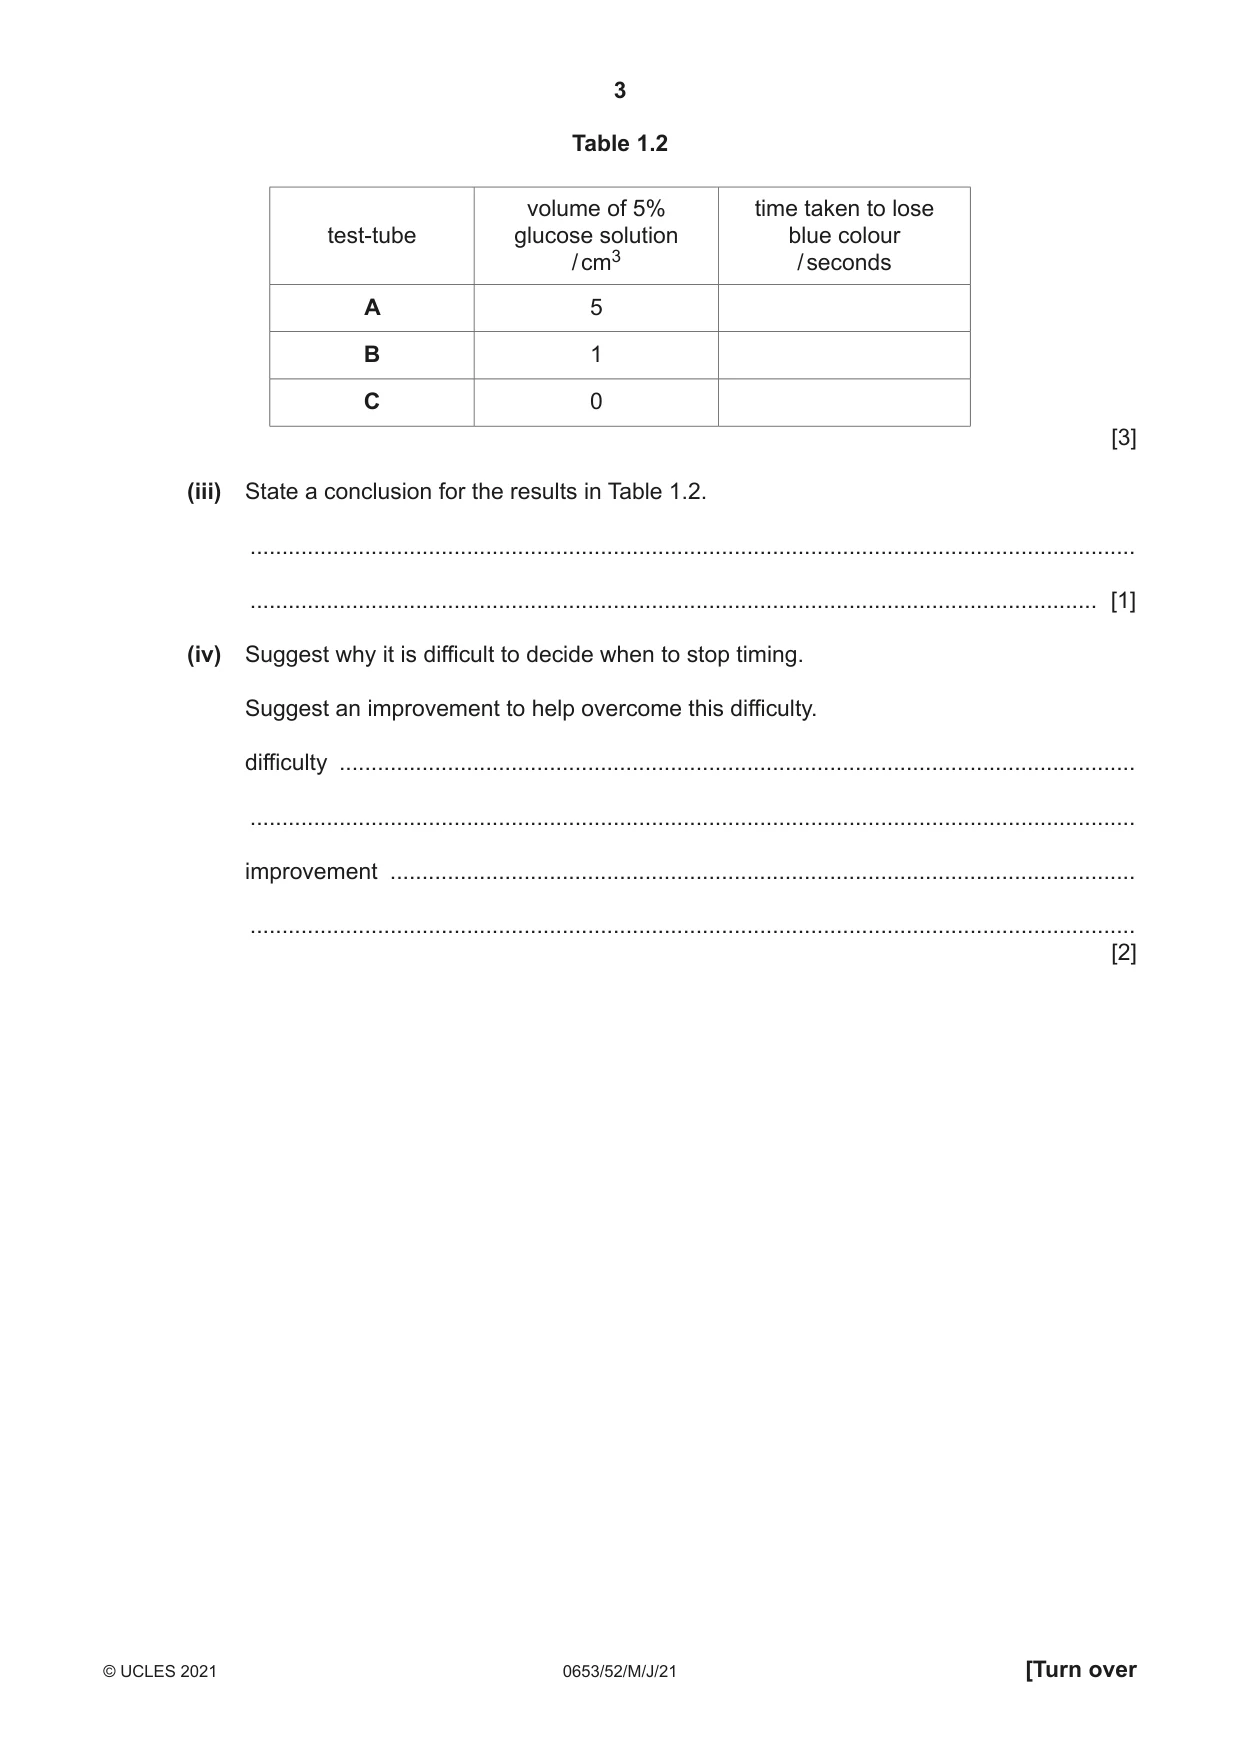




Mark scheme7 pages
Answers below. Sit the paper first if you are practising.
Questions as text
Q1 · You are going to investigate the rate of respiration in living cells
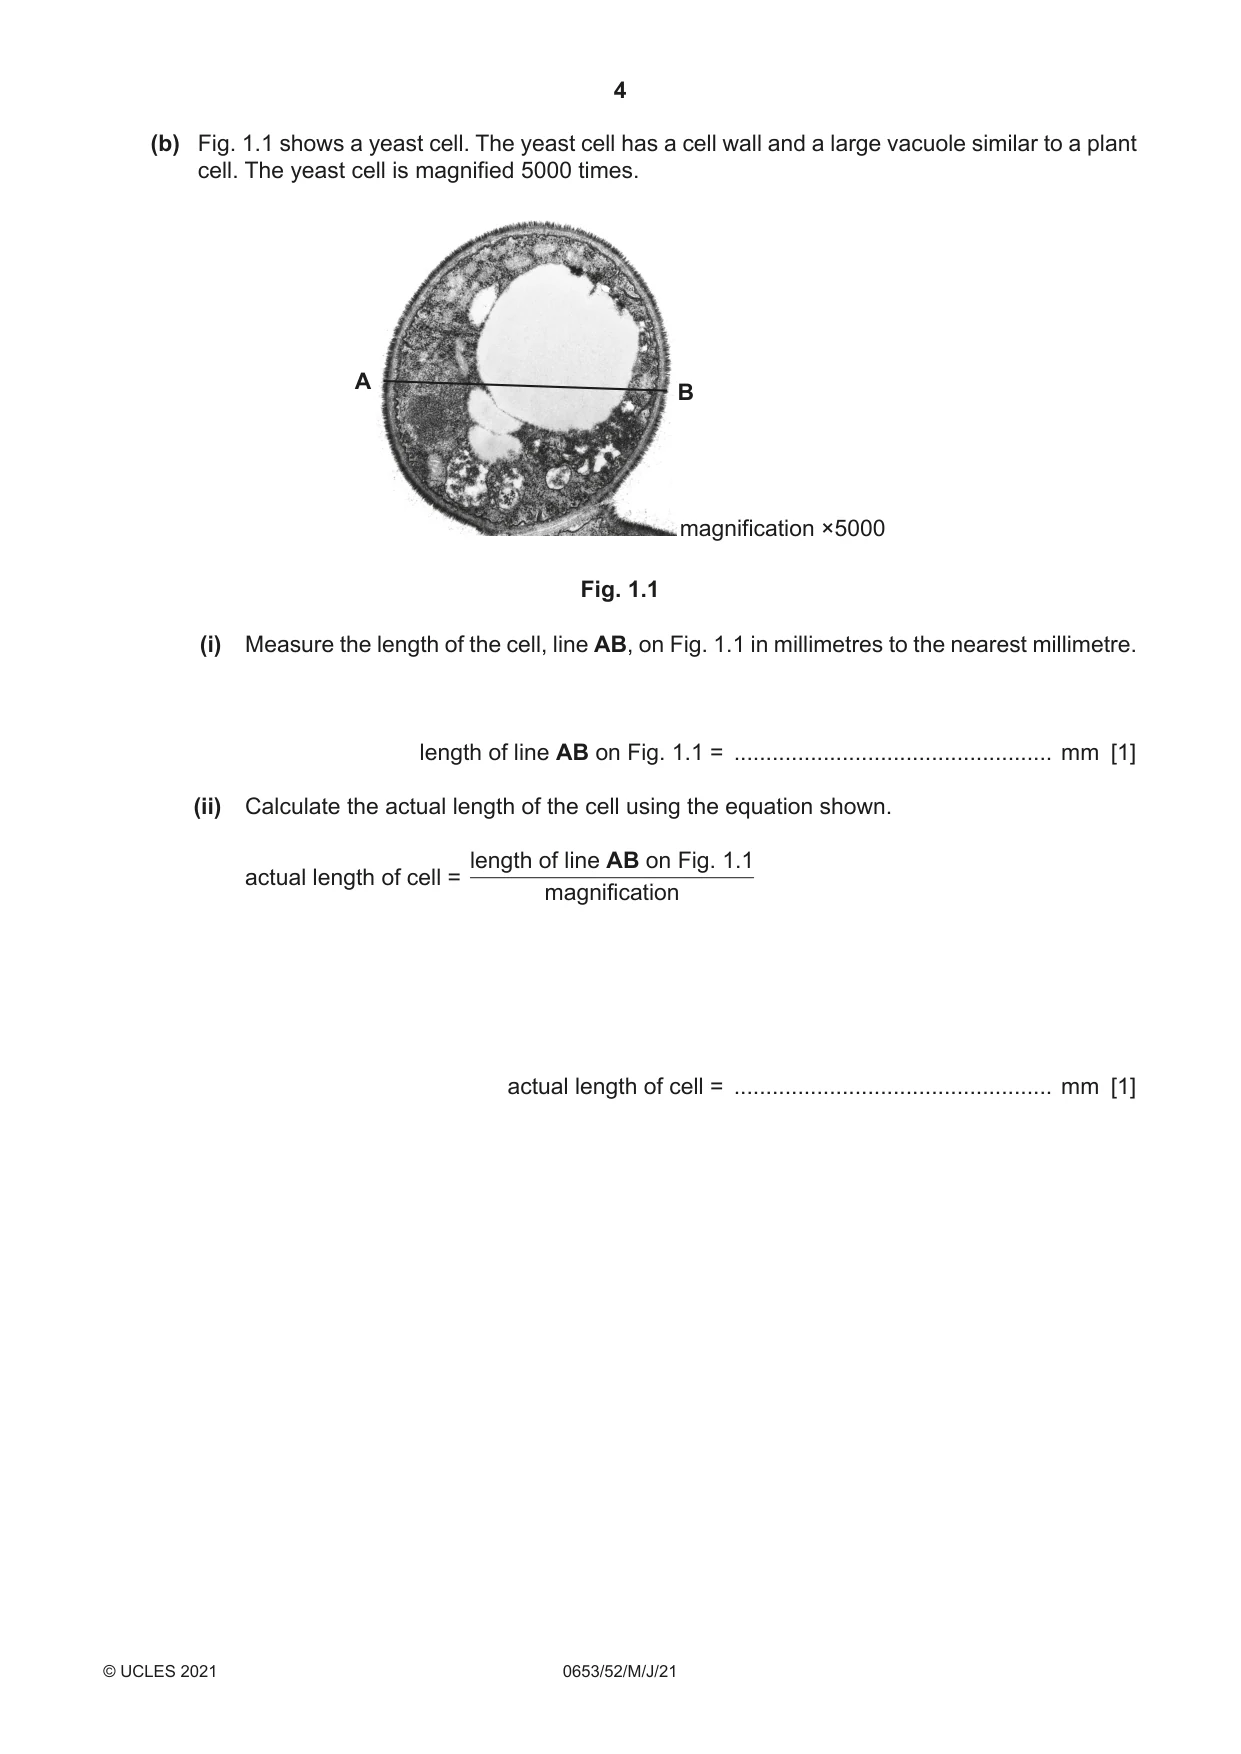
1 You are going to investigate the rate of respiration in living cells. You are provided with a suspension of yeast cells. Yeast is a single-celled organism similar to plant and animal cells. You will use methylene blue indicator. A solution of methylene blue loses its blue colour as the yeast cells respire. (a) Procedure • Set up and maintain a water-bath at approximately 40 °C. • Label three test-tubes A, B and C. • Stir the yeast suspension for about 10 seconds. • Put 5 cm3 yeast suspension into each test-tube, A, B and C. • Place all three test-tubes into the water-bath. (i) Suggest why the yeast suspension is stirred immediately before it is added to test-tubes A, B and C. ........................................................................................................................................... ..................................................................................................................................... [1] (ii) Procedure • Label three more test-tubes A1, B1 and C1. • Use separate syringes to add the volumes of water, 5% glucose solution and methylene blue to test-tubes A1, B1 and C1 as shown in Table 1.1. • Swirl each test-tube to mix its contents. Table 1.1 volume of 5% volume of volume of water test-tube glucose solution methylene blue / cm3 / cm3 / cm3 A1 0 5 1 B1 4 1 1 C1 5 0 1 • Pour the contents of test-tube A1 into test-tube A, swirl to mix, and return test-tube A to the water-bath. • Pour the contents of test-tube B1 into test-tube B, swirl to mix, and return test-tube B to the water-bath. • Pour the contents of test-tube C1 into test-tube C, swirl to mix, and return test-tube C to the water-bath. • Start the stop-clock. In Table 1.2, record the time taken to the nearest second for the methylene blue to lose its blue colour. If the blue colour remains after 8 minutes record this time as >480. Table 1.2 volume of 5% time taken to lose test-tube glucose solution blue colour / cm3 / seconds A 5 B 1 C 0 [3] (iii) State a conclusion for the results in Table 1.2. ........................................................................................................................................... ..................................................................................................................................... [1] (iv) Suggest why it is difficult to decide when to stop timing. Suggest an improvement to help overcome this difficulty. difficulty ............................................................................................................................. ........................................................................................................................................... improvement ..................................................................................................................... ........................................................................................................................................... [2] (b) Fig. 1.1 shows a yeast cell. The yeast cell has a cell wall and a large vacuole similar to a plant cell. The yeast cell is magnified 5000 times. A B magnification ×5000 Fig. 1.1 (i) Measure the length of the cell, line AB, on Fig. 1.1 in millimetres to the nearest millimetre. length of line AB on Fig. 1.1 = .................................................. mm [1] (ii) Calculate the actual length of the cell using the equation shown. length of line AB on Fig. 1.1 actual length of cell = magnification actual length of cell = .................................................. mm [1] (iii) In the box provided, make a large, clear line drawing of the yeast cell in Fig. 1.1 showing the cell wall and vacuole. [4] [Total: 13]
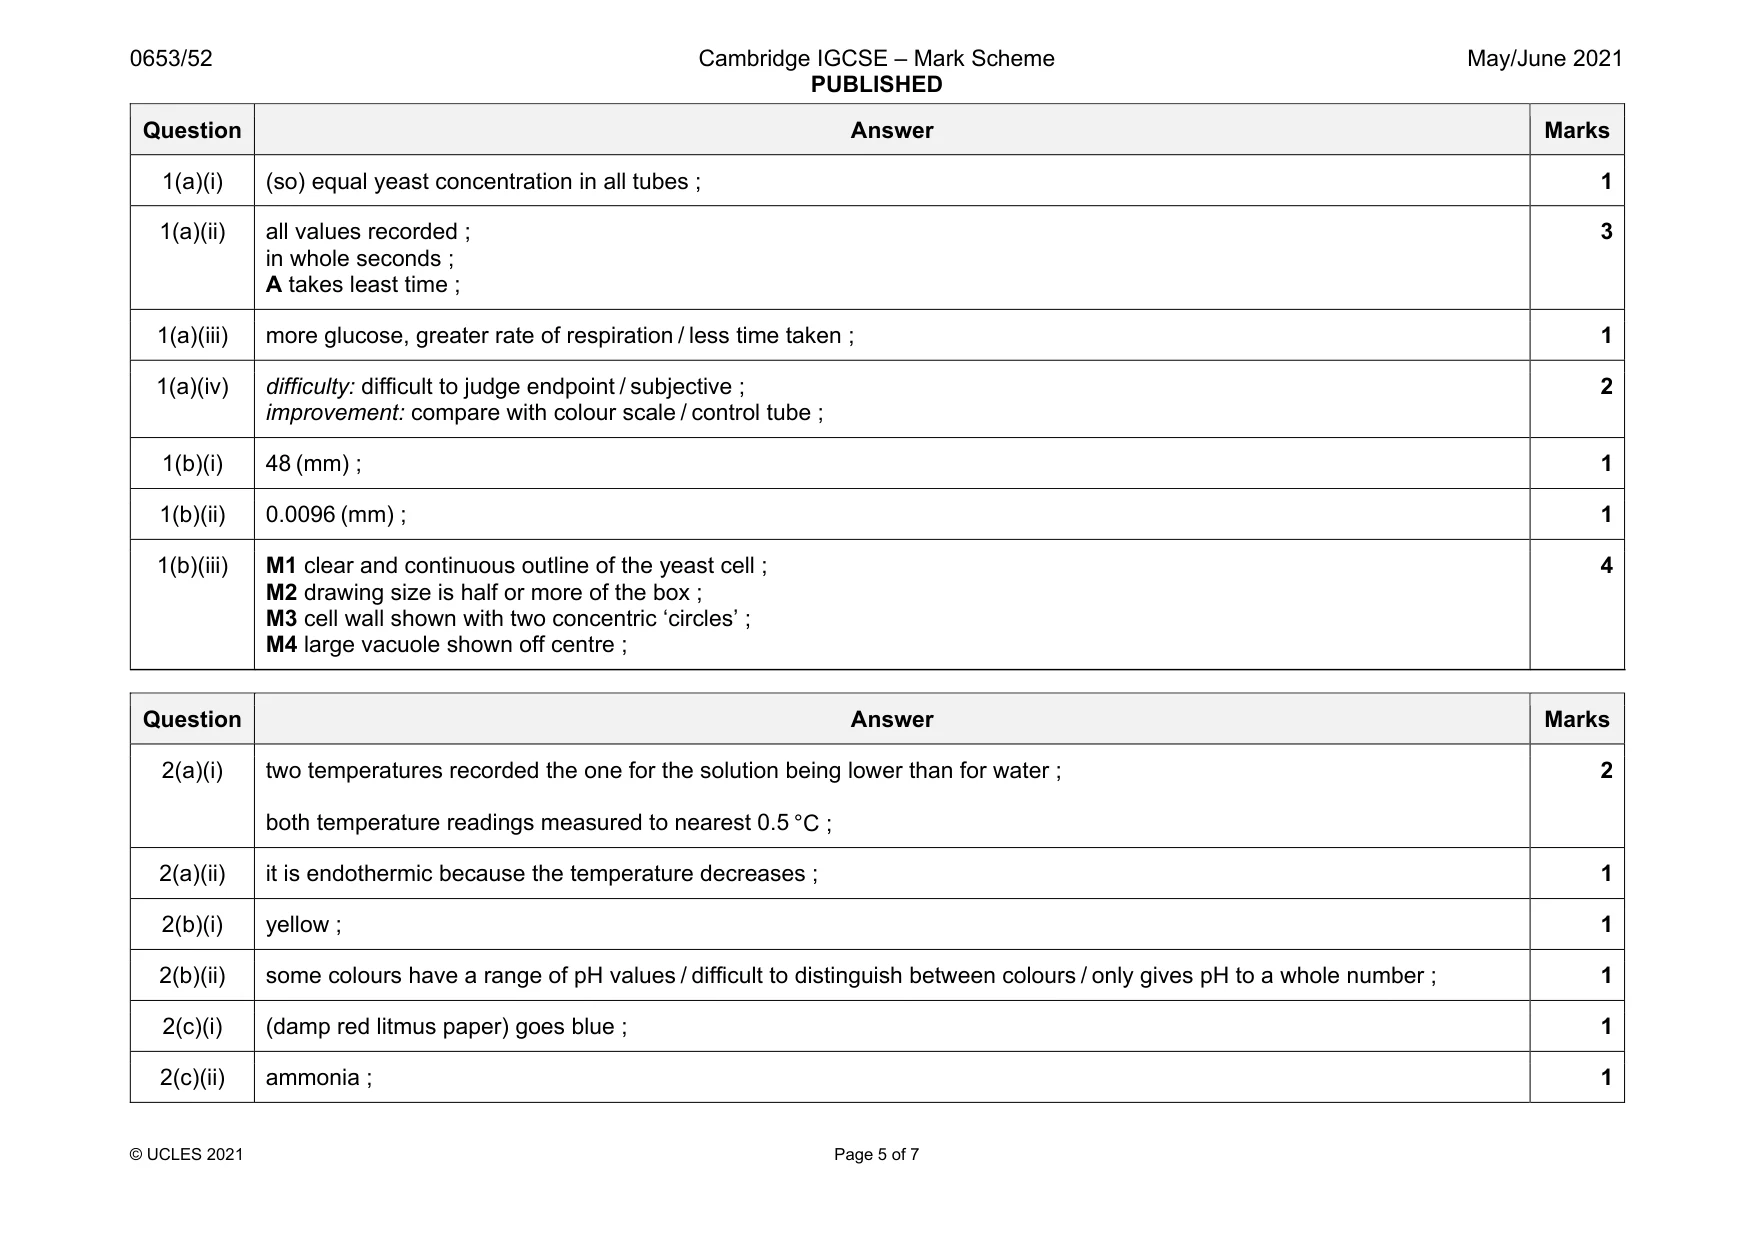
Mark scheme: 1(a)(i) (so) equal yeast concentration in all tubes ; 1 1(a)(ii) all values recorded ; in whole seconds ; A takes least time ; 3 1(a)(iii) more glucose, greater rate of respiration / less time taken ; 1 1(a)(iv) difficulty: difficult to judge endpoint / subjective ; improvement: compare with colour scale / control tube ; 2 1(b)(i) 48 (mm) ; 1 1(b)(ii) 0.0096 (mm) ; 1 1(b)(iii) M1 clear and continuous outline of the yeast cell ; M2 drawing size is half or more of the box ; M3 cell wall shown with two concentric ‘circles’ ; M4 large vacuole shown off centre ; 4
Q2 · You are going to investigate solid F
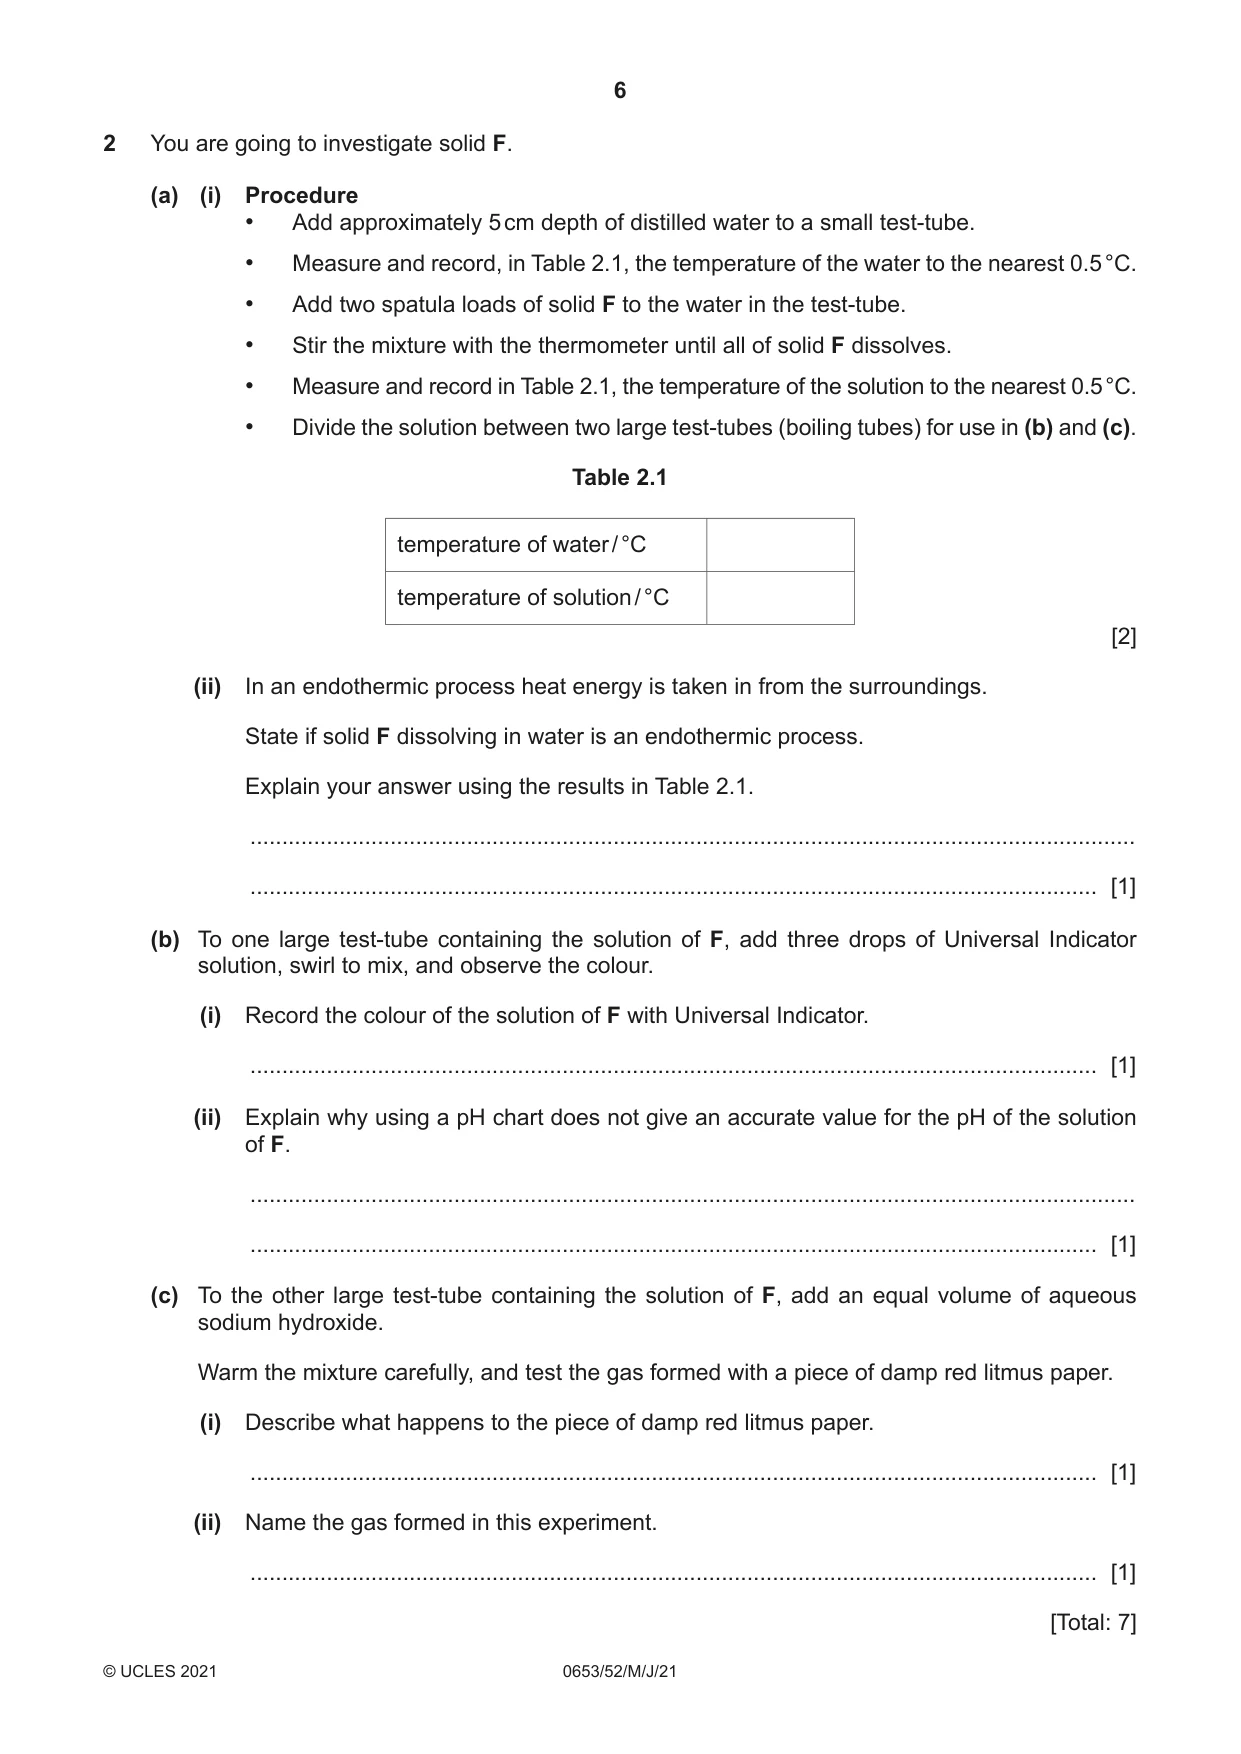
2 You are going to investigate solid F. (a) (i) Procedure • Add approximately 5 cm depth of distilled water to a small test-tube. • Measure and record, in Table 2.1, the temperature of the water to the nearest 0.5 °C. • Add two spatula loads of solid F to the water in the test-tube. • Stir the mixture with the thermometer until all of solid F dissolves. • Measure and record in Table 2.1, the temperature of the solution to the nearest 0.5 °C. • Divide the solution between two large test-tubes (boiling tubes) for use in (b) and (c). Table 2.1 temperature of water / °C temperature of solution / °C [2] (ii) In an endothermic process heat energy is taken in from the surroundings. State if solid F dissolving in water is an endothermic process. Explain your answer using the results in Table 2.1. ........................................................................................................................................... ..................................................................................................................................... [1] (b) To one large test-tube containing the solution of F, add three drops of Universal Indicator solution, swirl to mix, and observe the colour. (i) Record the colour of the solution of F with Universal Indicator. ..................................................................................................................................... [1] (ii) Explain why using a pH chart does not give an accurate value for the pH of the solution of F. ........................................................................................................................................... ..................................................................................................................................... [1] (c) To the other large test-tube containing the solution of F, add an equal volume of aqueous sodium hydroxide. Warm the mixture carefully, and test the gas formed with a piece of damp red litmus paper. (i) Describe what happens to the piece of damp red litmus paper. ..................................................................................................................................... [1] (ii) Name the gas formed in this experiment. ..................................................................................................................................... [1] [Total: 7]
Mark scheme: 2(a)(i) two temperatures recorded the one for the solution being lower than for water ; both temperature readings measured to nearest 0.5 °C ; 2 2(a)(ii) it is endothermic because the temperature decreases ; 1 2(b)(i) yellow ; 1 2(b)(ii) some colours have a range of pH values / difficult to distinguish between colours / only gives pH to a whole number ; 1 2(c)(i) (damp red litmus paper) goes blue ; 1 2(c)(ii) ammonia ; 1
Q3 · Sodium hydrogencarbonate is a white solid that reacts with dilute nitric acid as shown in…
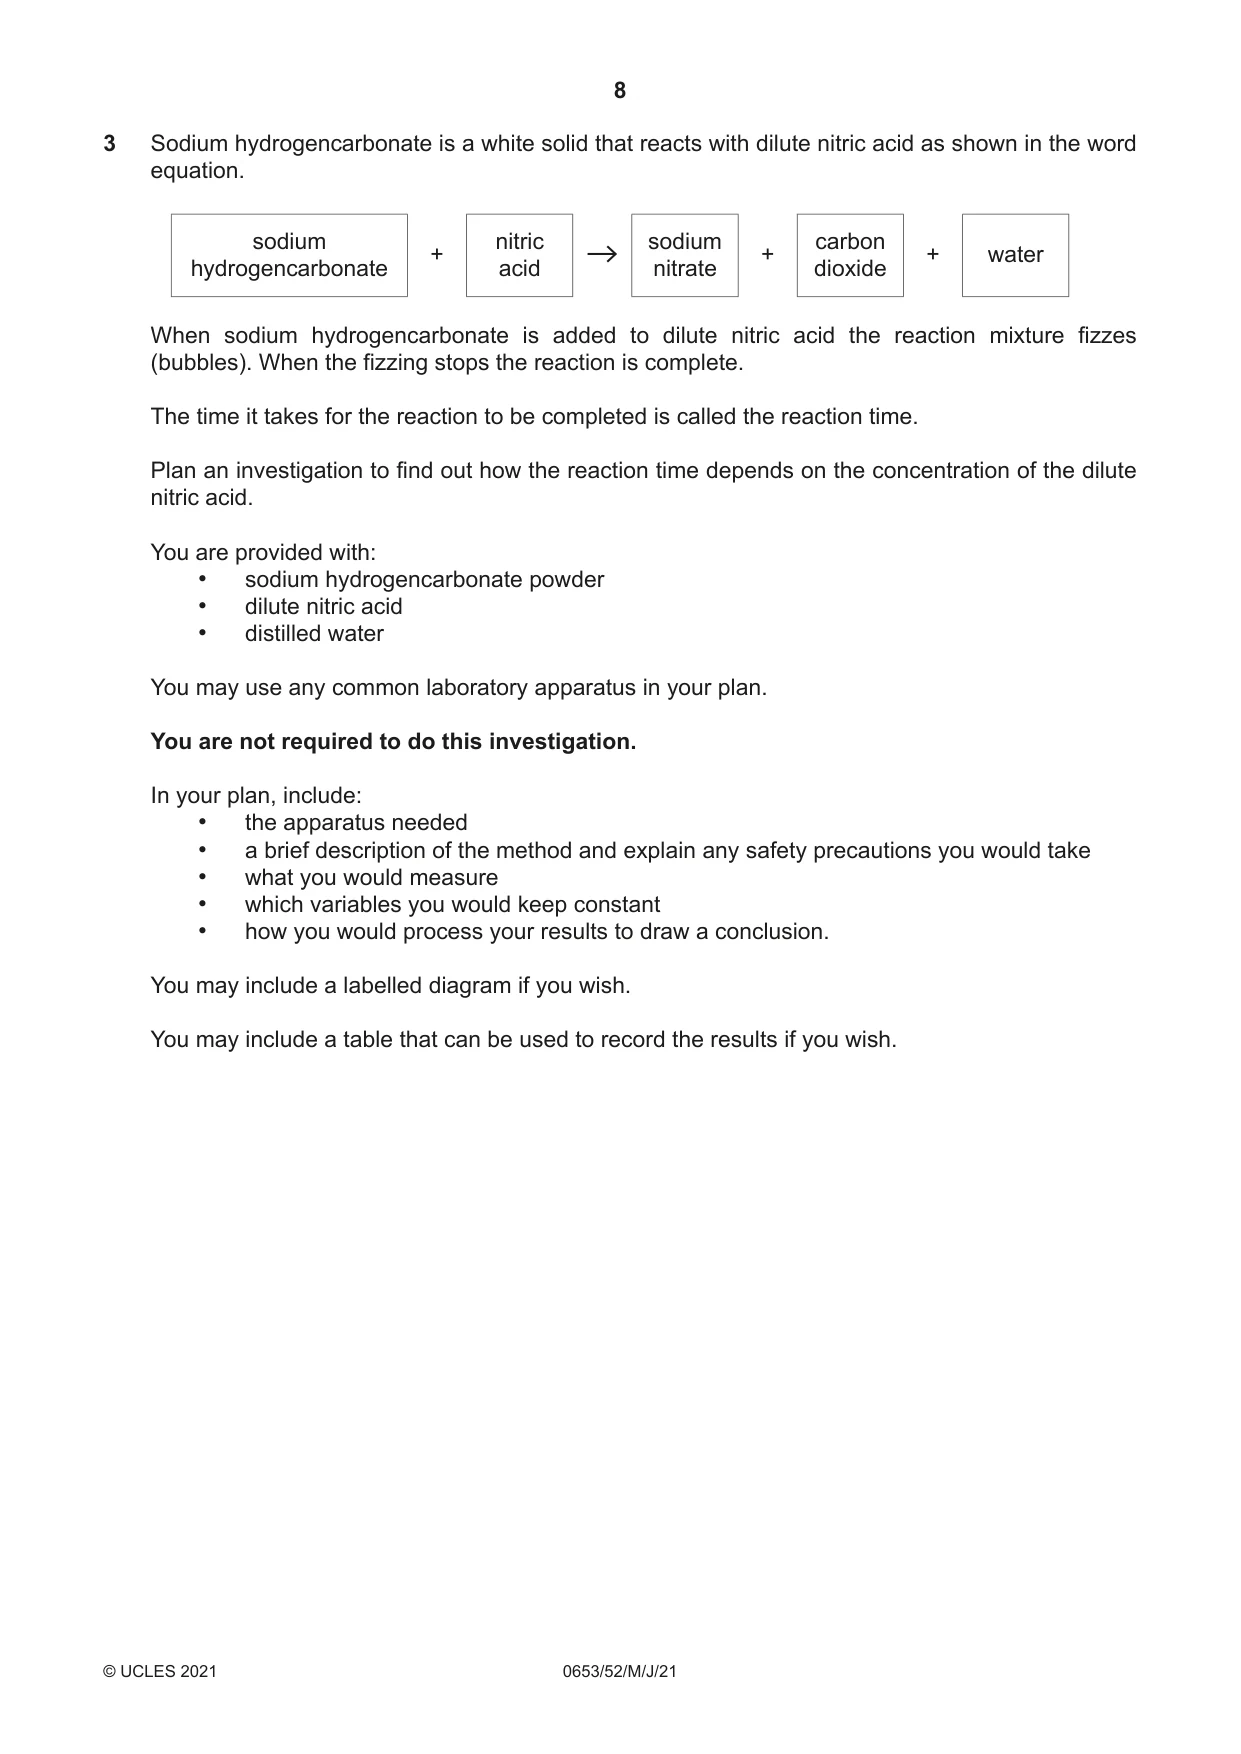
3 Sodium hydrogencarbonate is a white solid that reacts with dilute nitric acid as shown in the word equation. sodium nitric sodium carbon + + + water hydrogencarbonate acid nitrate dioxide When sodium hydrogencarbonate is added to dilute nitric acid the reaction mixture fizzes (bubbles). When the fizzing stops the reaction is complete. The time it takes for the reaction to be completed is called the reaction time. Plan an investigation to find out how the reaction time depends on the concentration of the dilute nitric acid. You are provided with: • sodium hydrogencarbonate powder • dilute nitric acid • distilled water You may use any common laboratory apparatus in your plan. You are not required to do this investigation. In your plan, include: • the apparatus needed • a brief description of the method and explain any safety precautions you would take • what you would measure • which variables you would keep constant • how you would process your results to draw a conclusion. You may include a labelled diagram if you wish. You may include a table that can be used to record the results if you wish. .......................................................................................................................................................... .......................................................................................................................................................... .......................................................................................................................................................... .......................................................................................................................................................... .......................................................................................................................................................... .......................................................................................................................................................... .......................................................................................................................................................... .......................................................................................................................................................... .......................................................................................................................................................... .......................................................................................................................................................... .......................................................................................................................................................... .......................................................................................................................................................... .......................................................................................................................................................... .................................................................................................................................................... [7]
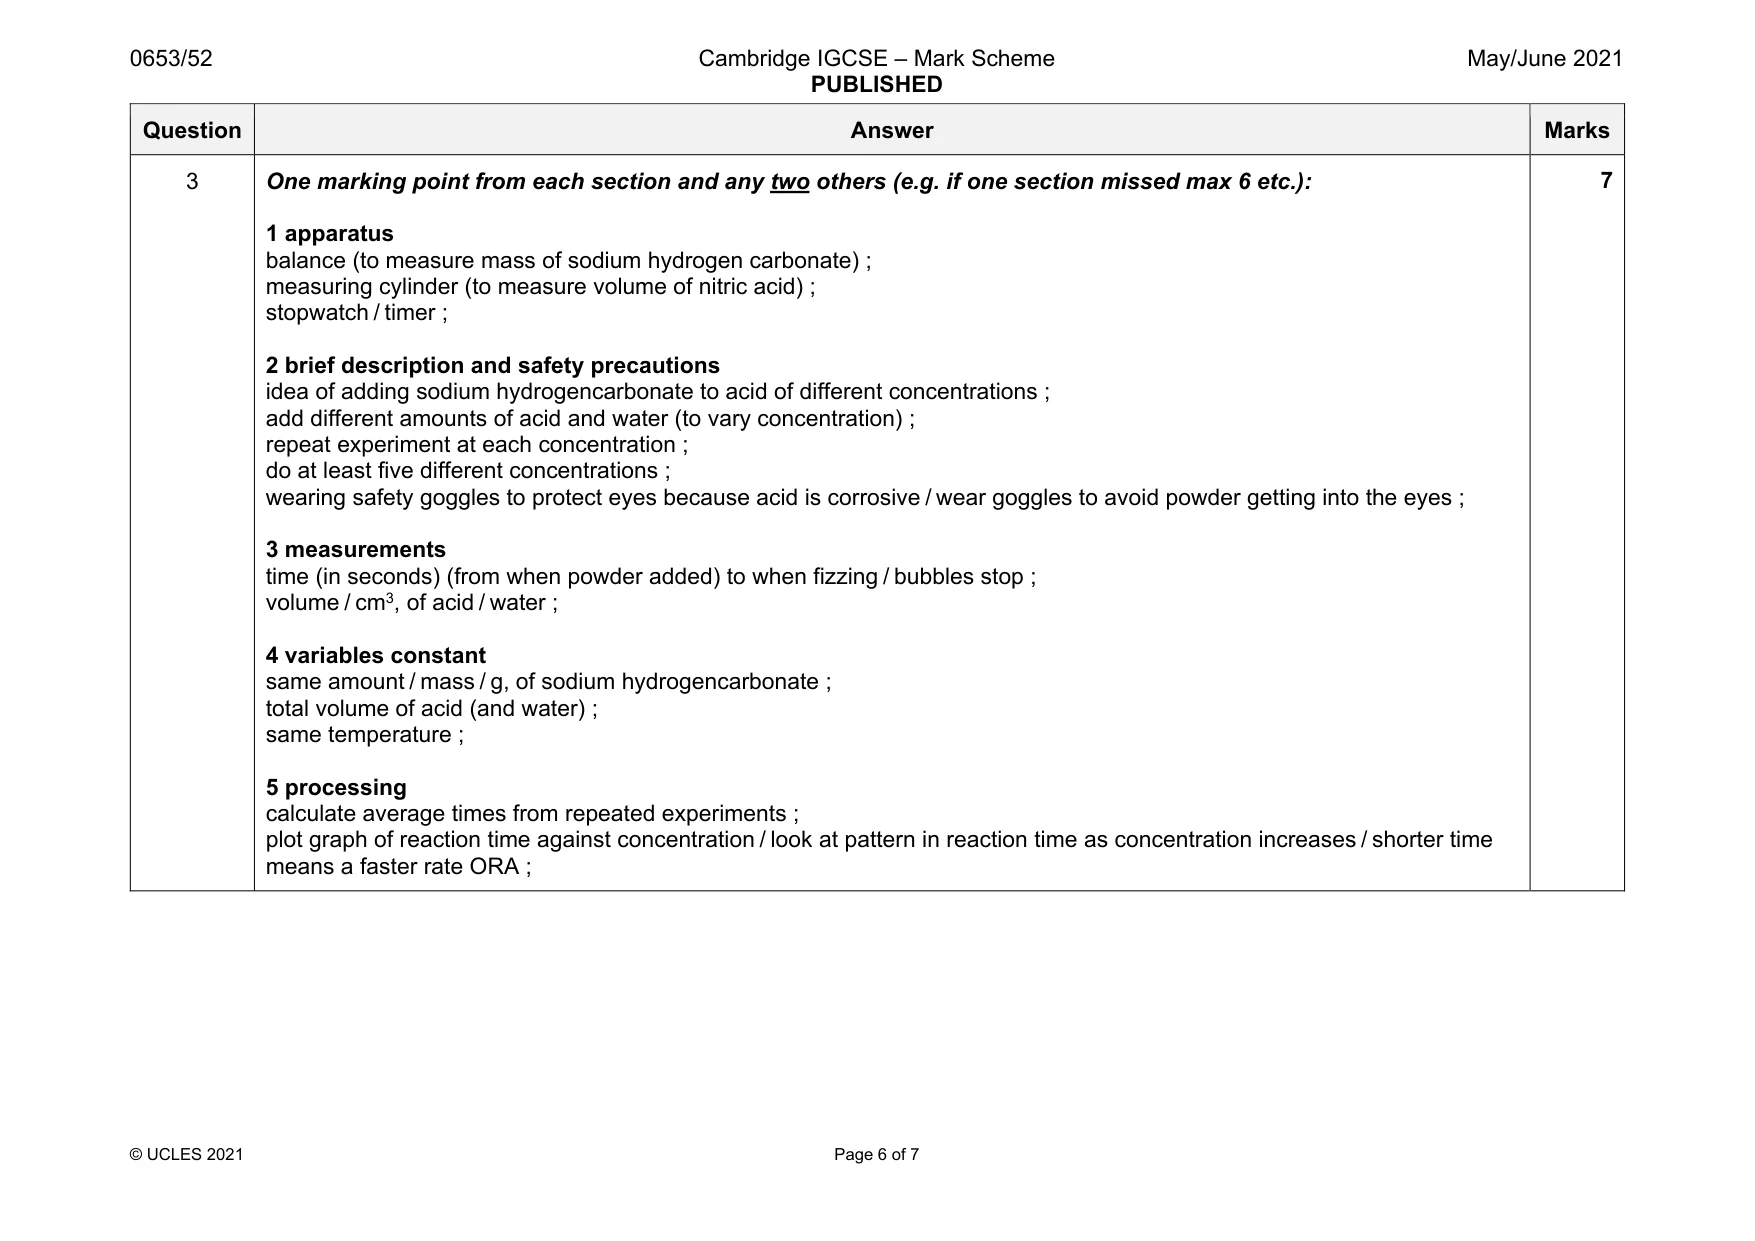
Mark scheme: 3 One marking point from each section and any two others (e.g. if one section missed max 6 etc.): 1 apparatus balance (to measure mass of sodium hydrogen carbonate) ; measuring cylinder (to measure volume of nitric acid) ; stopwatch / timer ; 2 brief description and safety precautions idea of adding sodium hydrogencarbonate to acid of different concentrations ; add different amounts of acid and water (to vary concentration) ; repeat experiment at each concentration ; do at least five different concentrations ; wearing safety goggles to protect eyes because acid is corrosive / wear goggles to avoid powder getting into the eyes ; 3 measurements time (in seconds) (from when powder added) to when fizzing / bubbles stop ; volume / cm3, of acid / water ; 4 variables constant same amount / mass / g, of sodium hydrogencarbonate ; total volume of acid (and water) ; same temperature ; 5 processing calculate average times from repeated experiments ; plot graph of reaction time against concentration / look at pattern in reaction time as concentration increases / shorter time means a faster rate ORA ;
Q4 · You are going to determine the cross-sectional area of a piece of resistance wire
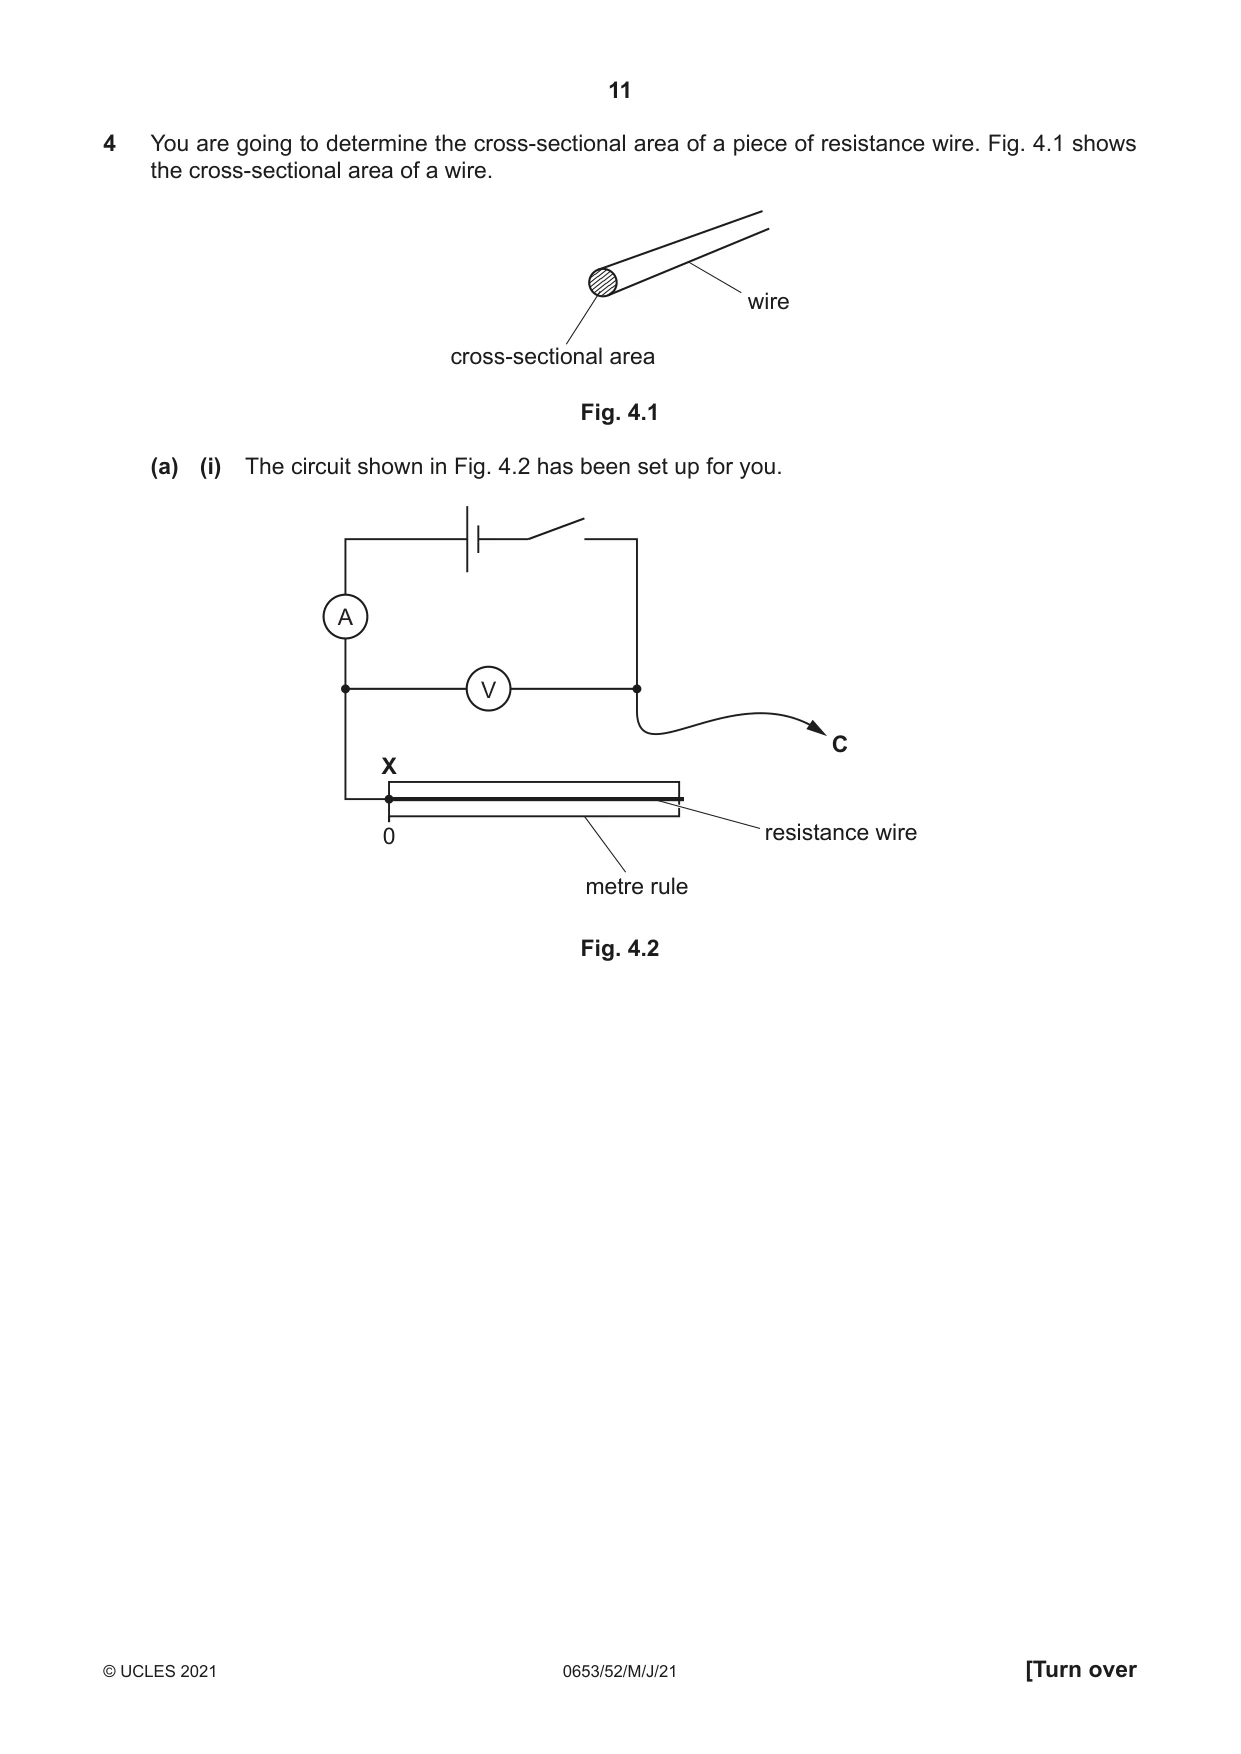
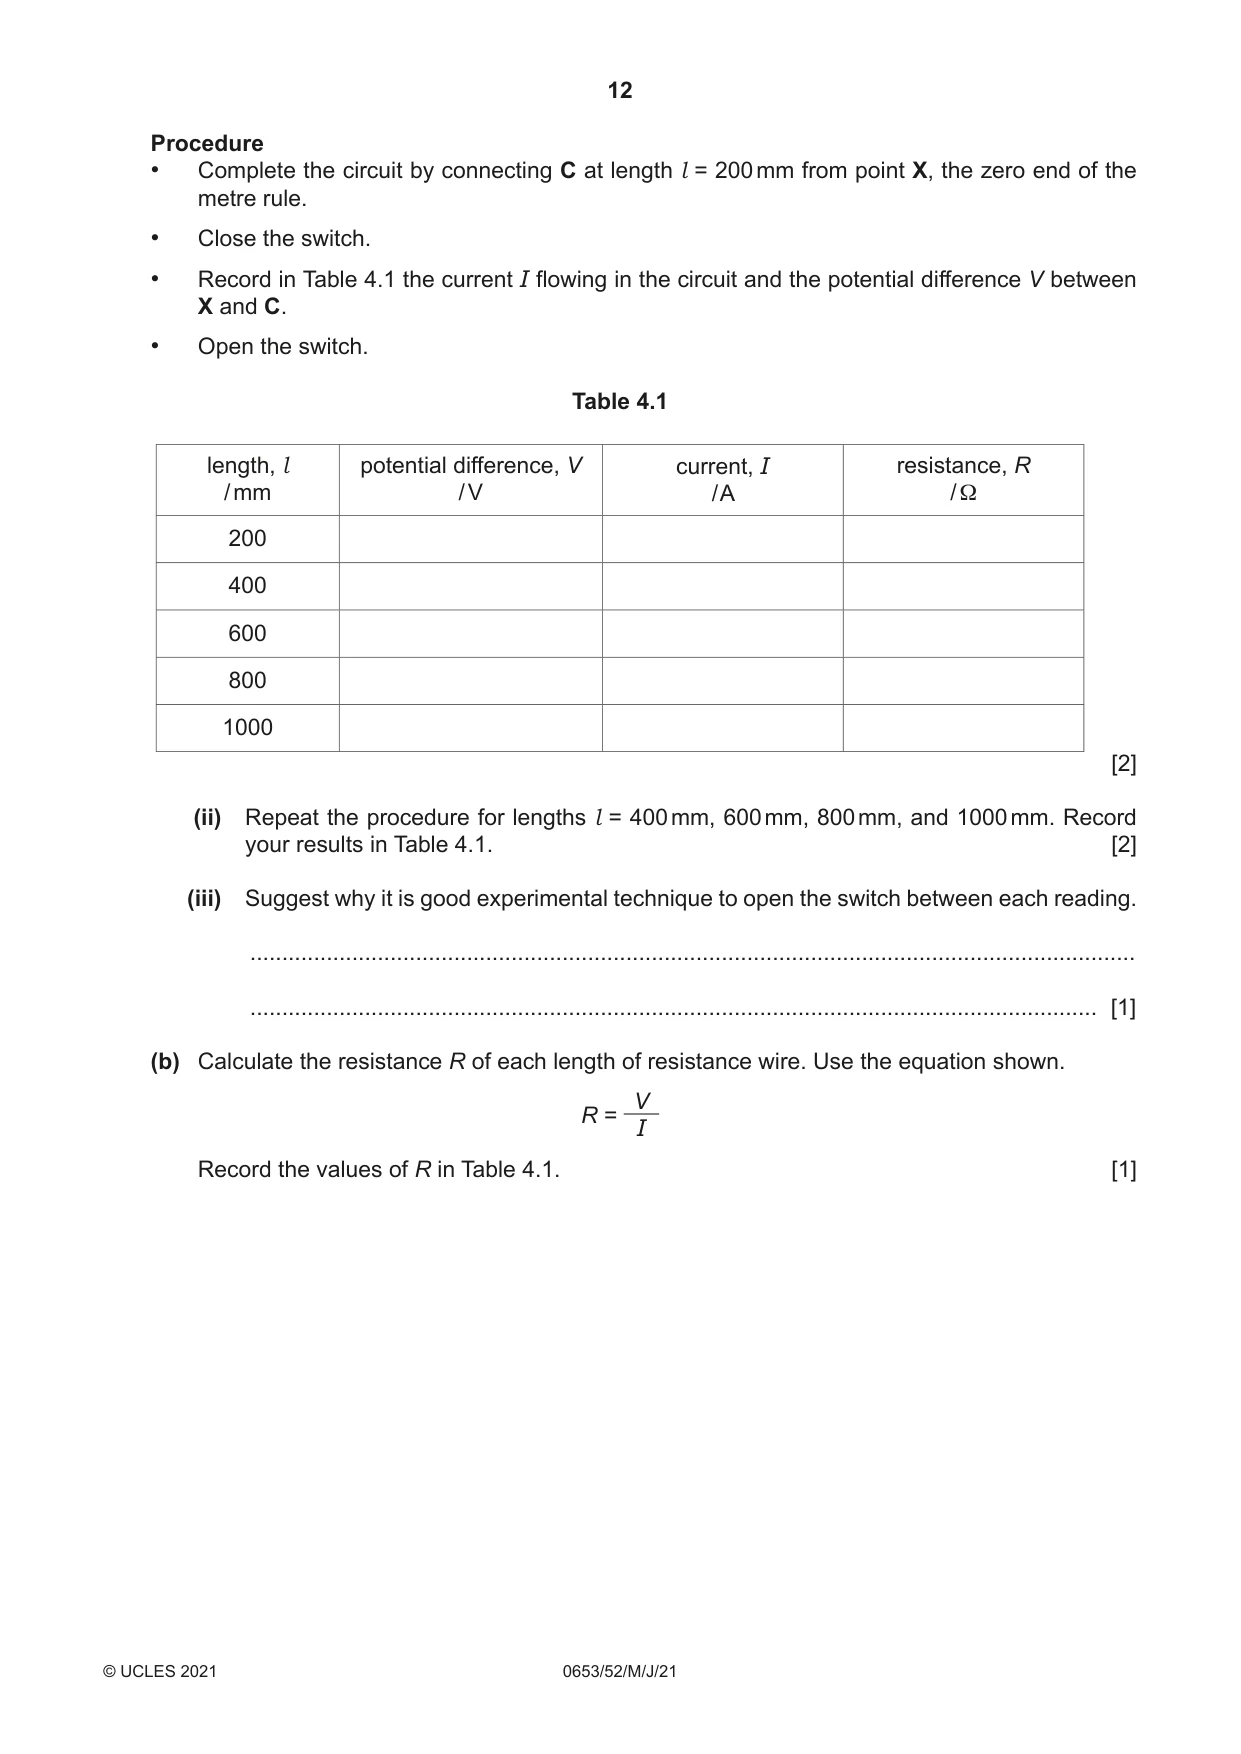
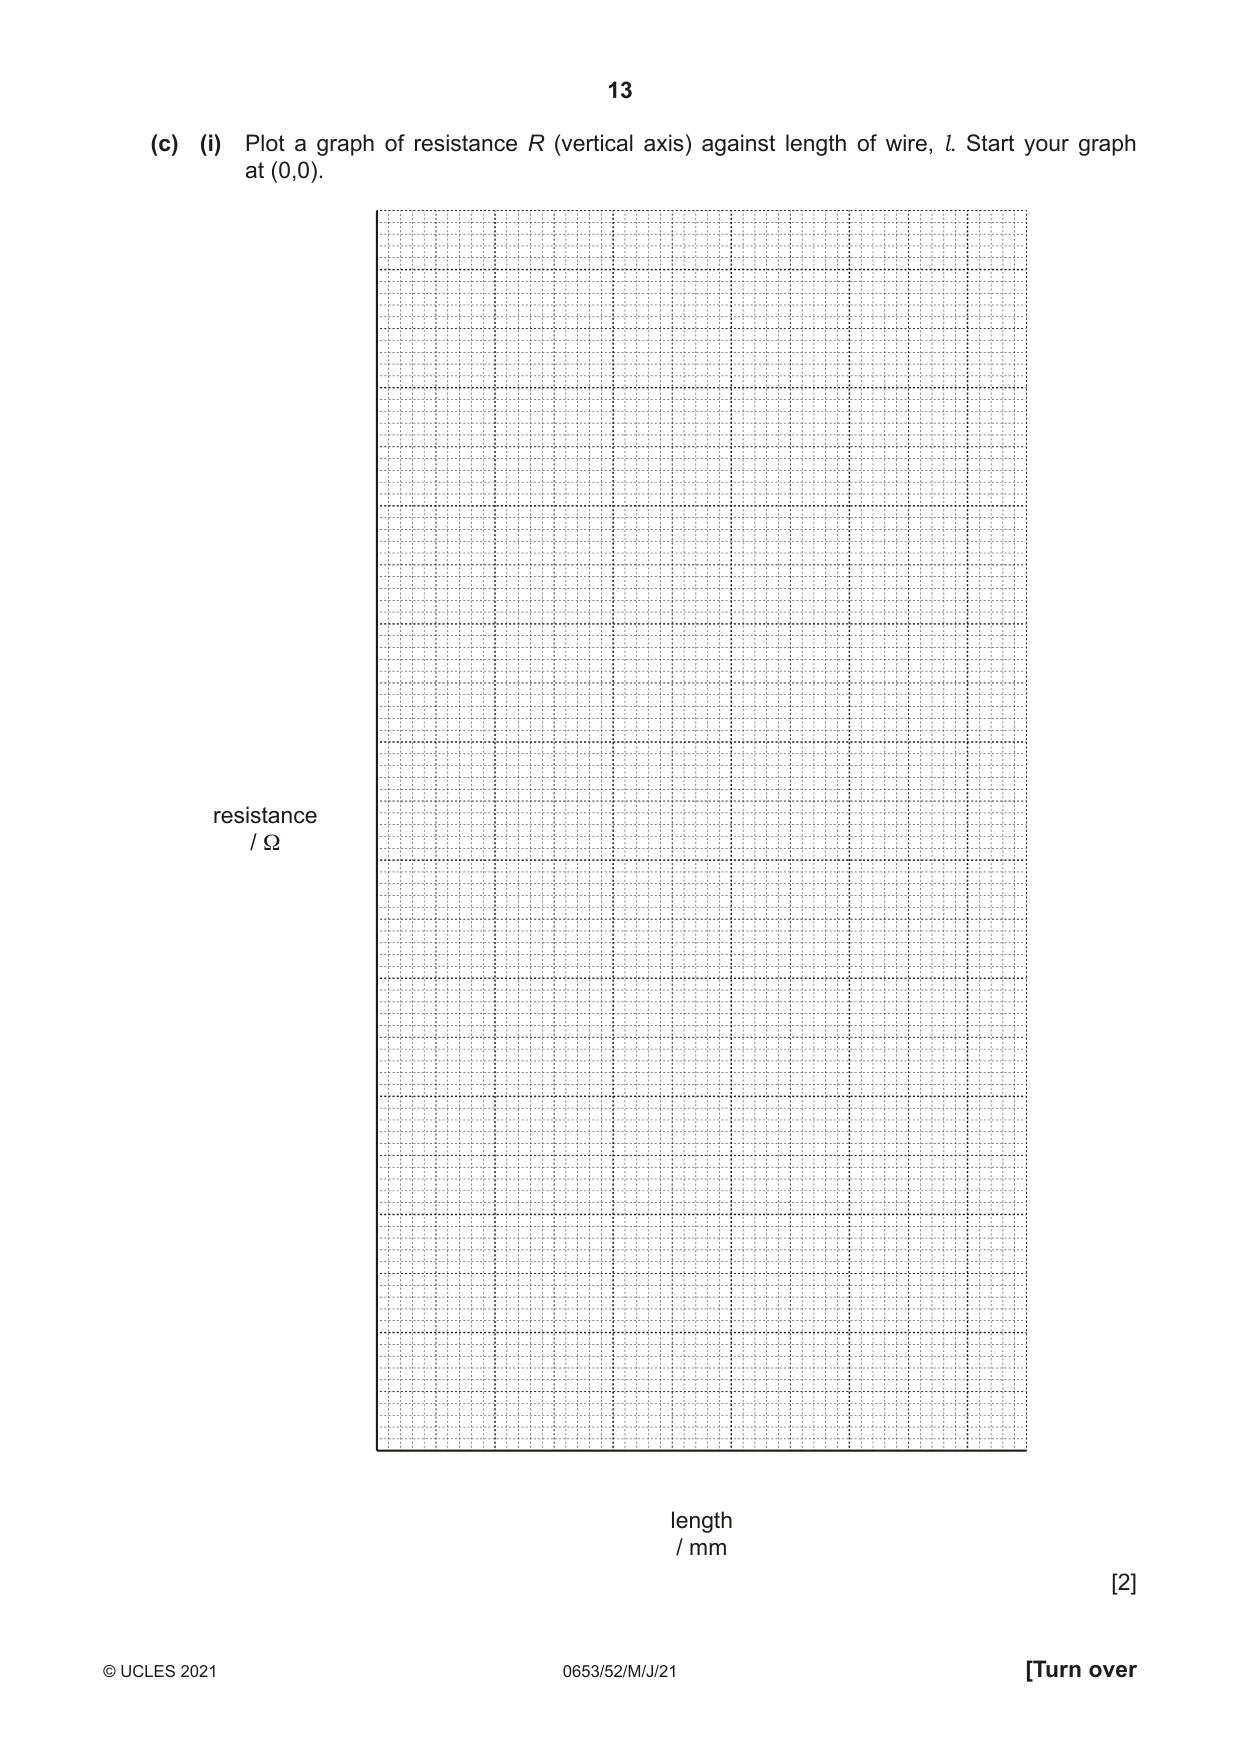
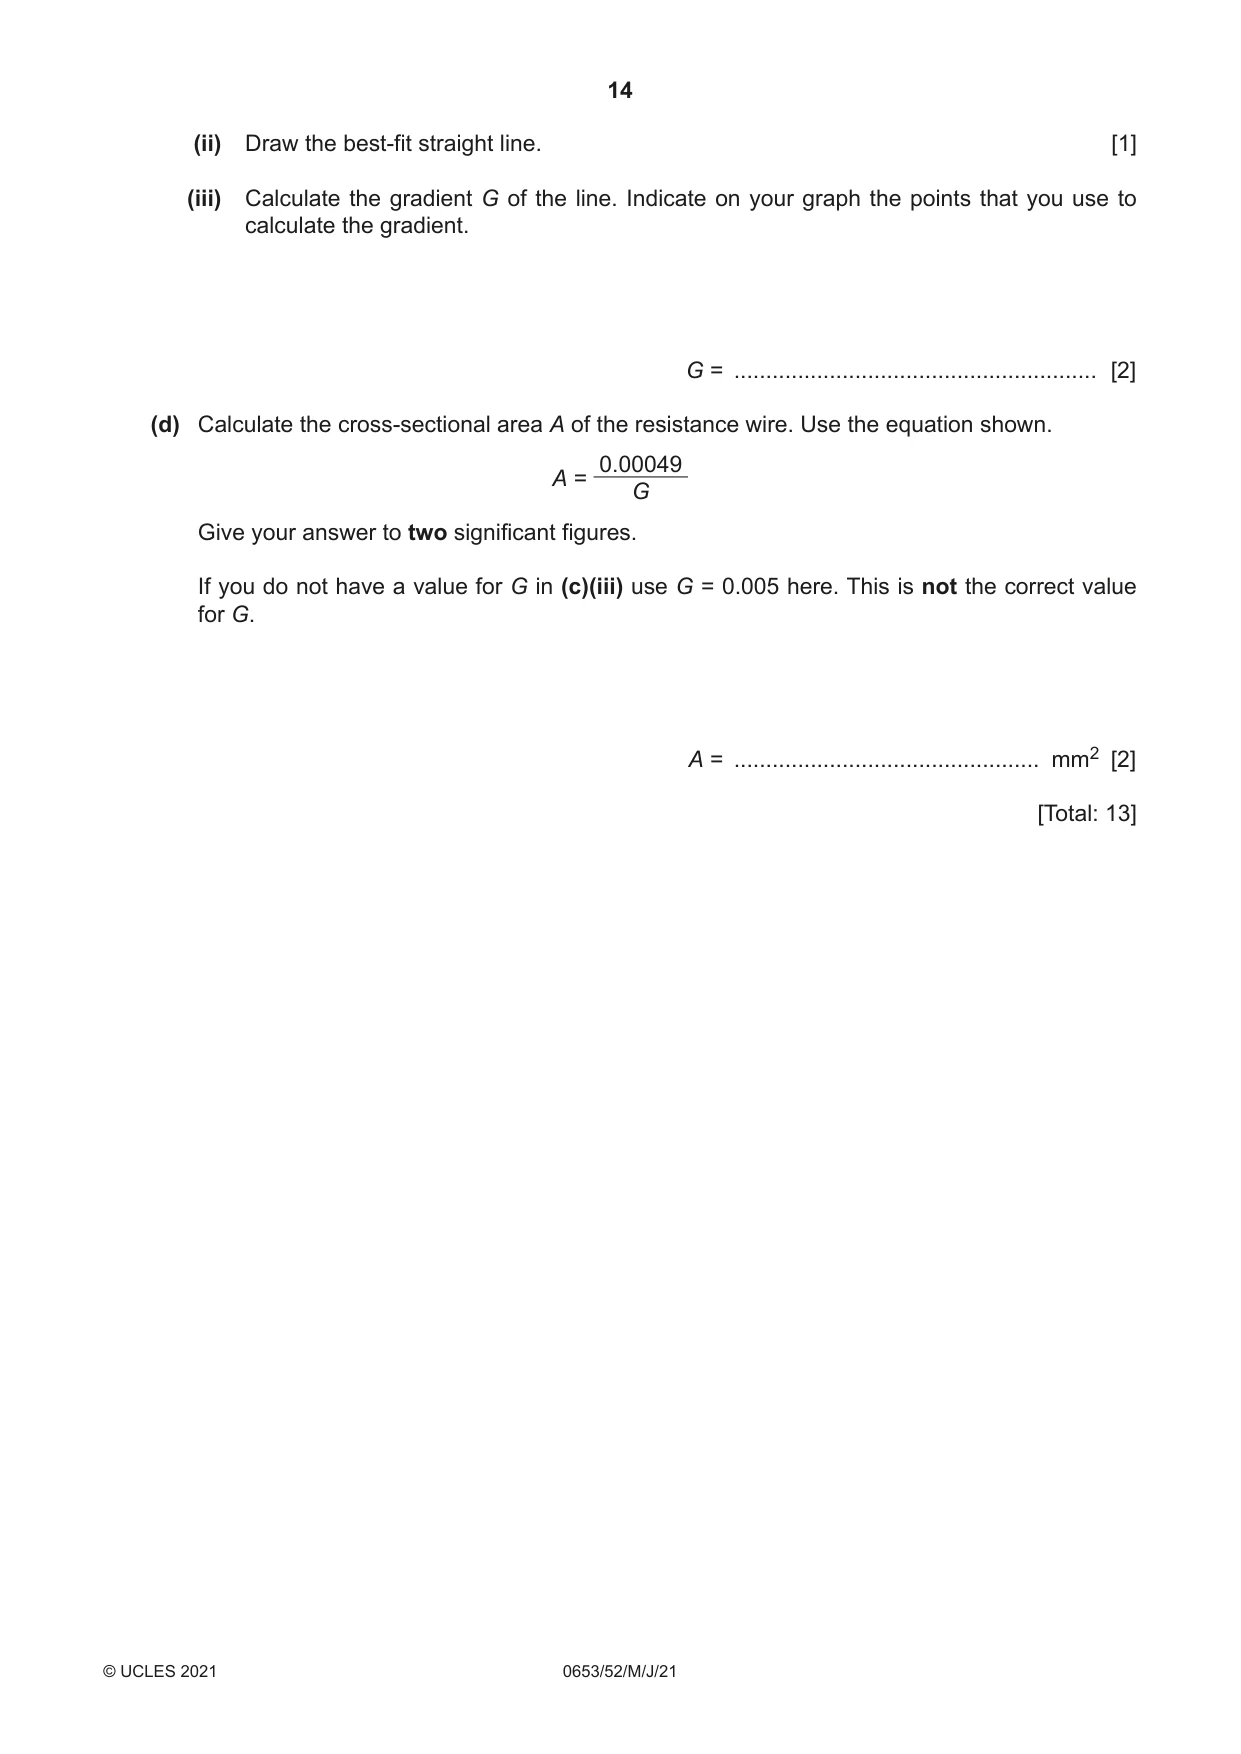
4 You are going to determine the cross-sectional area of a piece of resistance wire. Fig. 4.1 shows the cross-sectional area of a wire. wire cross-sectional area Fig. 4.1 (a) (i) The circuit shown in Fig. 4.2 has been set up for you. A V C X 0 resistance wire metre rule Fig. 4.2 Procedure • Complete the circuit by connecting C at length l = 200 mm from point X, the zero end of the metre rule. • Close the switch. • Record in Table 4.1 the current I flowing in the circuit and the potential difference V between X and C. • Open the switch. Table 4.1 length, l potential difference, V current, I resistance, R / mm / V / A / Ω 200 400 600 800 1000 [2] (ii) Repeat the procedure for lengths l = 400 mm, 600 mm, 800 mm, and 1000 mm. Record your results in Table 4.1. [2] (iii) Suggest why it is good experimental technique to open the switch between each reading. ........................................................................................................................................... ..................................................................................................................................... [1] (b) Calculate the resistance R of each length of resistance wire. Use the equation shown. V R = I Record the values of R in Table 4.1. [1]
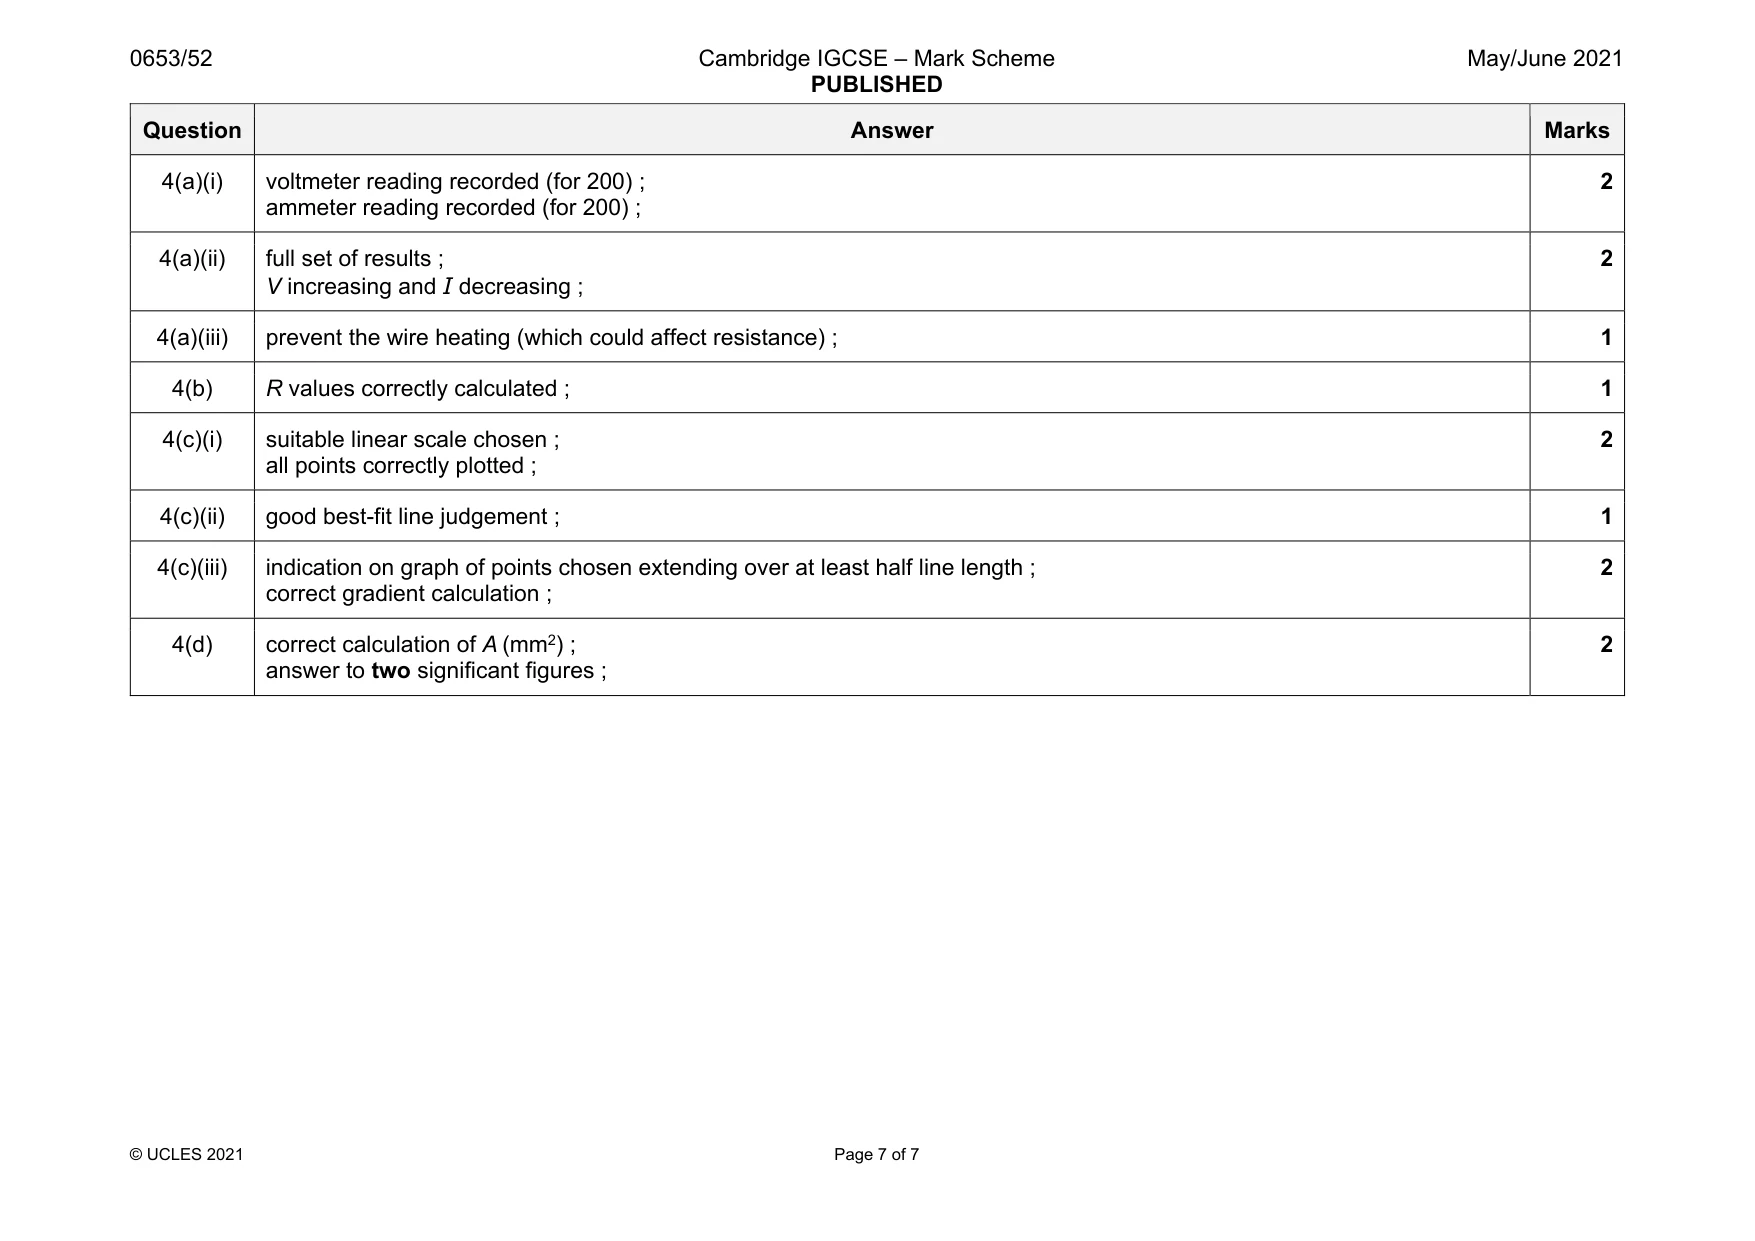
Mark scheme: 4(a)(i) voltmeter reading recorded (for 200) ; ammeter reading recorded (for 200) ; 2 4(a)(ii) full set of results ; V increasing and I decreasing ; 2 4(a)(iii) prevent the wire heating (which could affect resistance) ; 1 4(b) R values correctly calculated ; 1 4(c)(i) suitable linear scale chosen ; all points correctly plotted ; 2 4(c)(ii) good best-fit line judgement ; 1 4(c)(iii) indication on graph of points chosen extending over at least half line length ; correct gradient calculation ; 2 4(d) correct calculation of A (mm2) ; answer to two significant figures ; 2
What was in this paper
The subtopics covered by these 4 questions, and how many questions each got. Open one in a new tab to see every Cambridge question on it.
What you needed in this session
Cambridge’s own grade thresholds for 2021 May/June, Paper 5 · Variant 2. A higher threshold means an easier paper — the bar moves with how the cohort did.