Cambridge IGCSE Science - Combined 0653 — 2019 May/June Paper 5 · Variant 3
0653/53/M/J/19 · 4 questions · 40 marks · ≈45 min
The question paper and its mark scheme, free to read here and free to download. This is Cambridge’s own paper, exactly as it was sat.
Question paper12 pages

Mark scheme7 pages
Answers below. Sit the paper first if you are practising.
Questions as text
Q1 · You are going to investigate the nutrient content of an apple
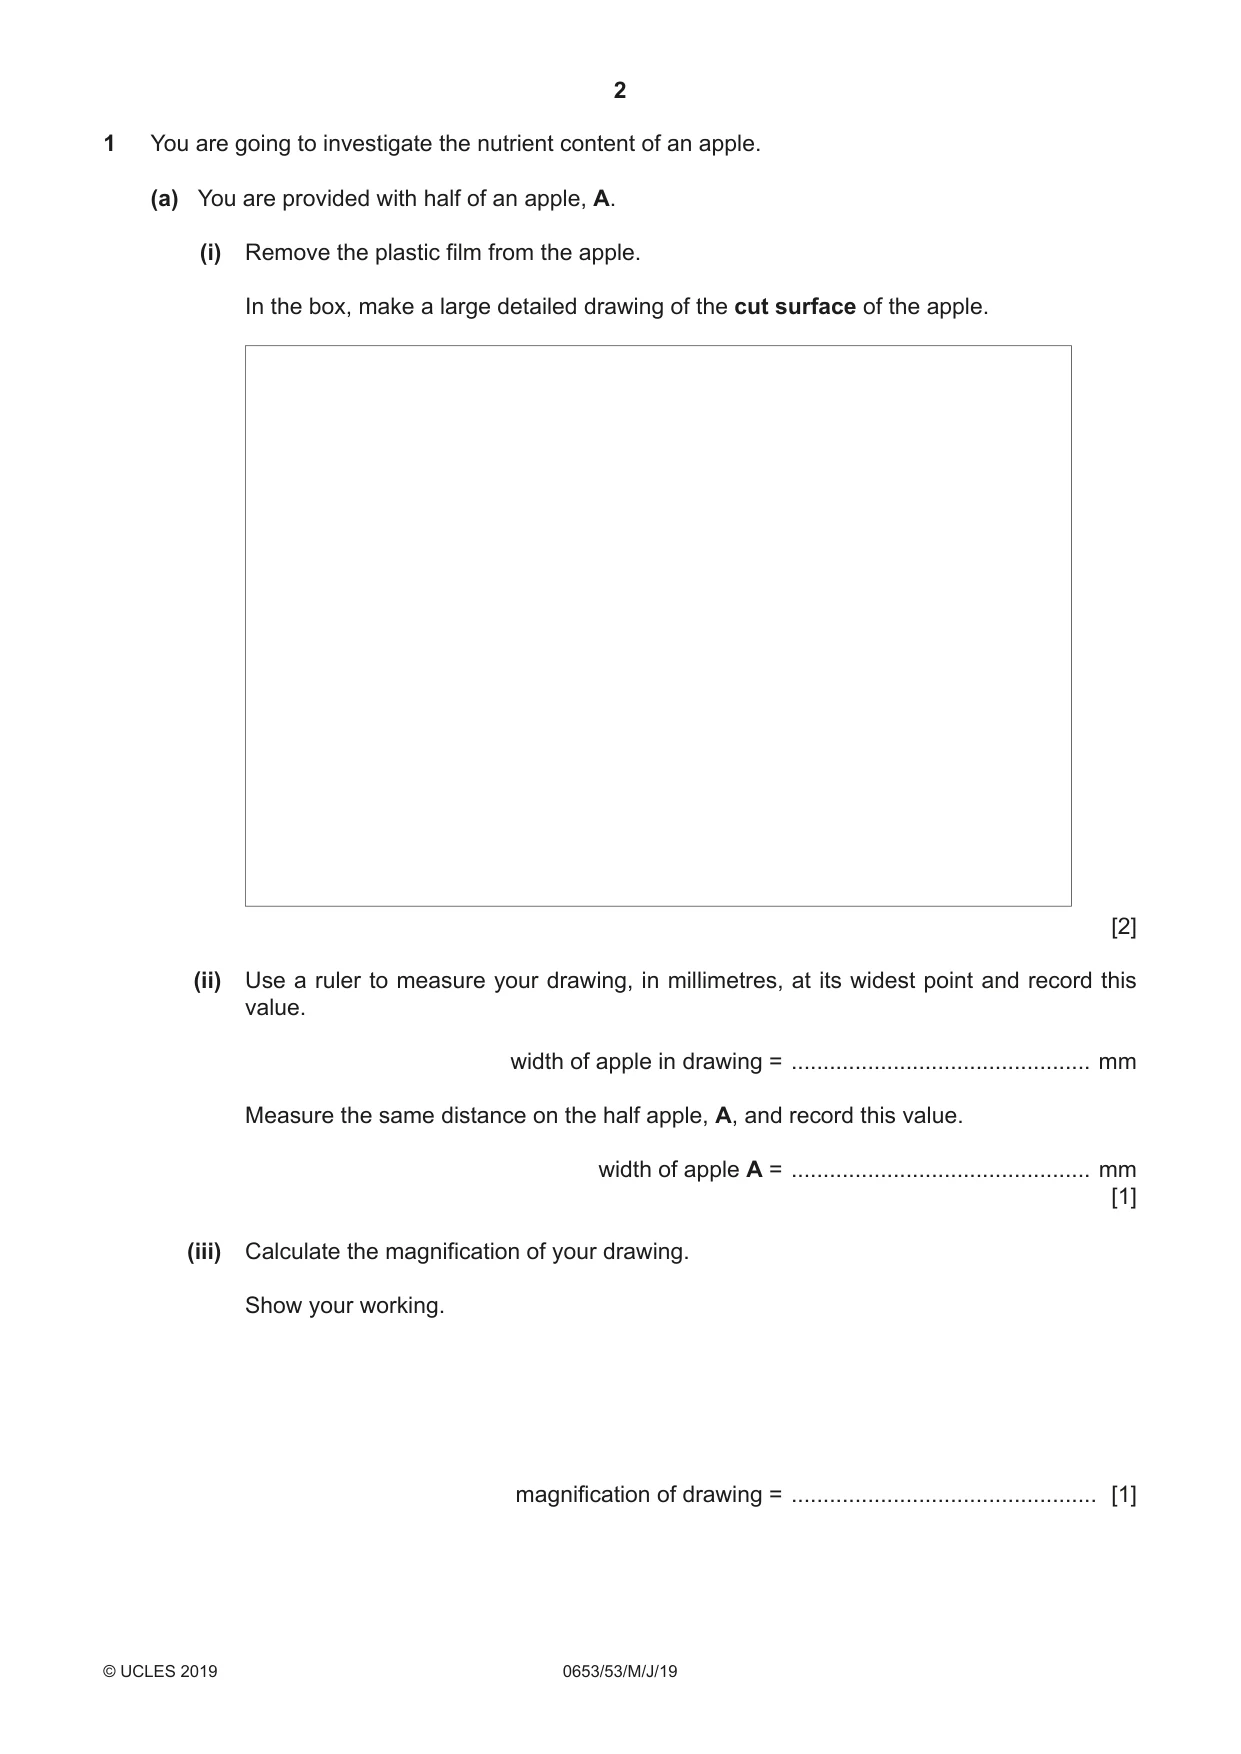
1 You are going to investigate the nutrient content of an apple. (a) You are provided with half of an apple, A. (i) Remove the plastic film from the apple. In the box, make a large detailed drawing of the cut surface of the apple. [2] (ii) Use a ruler to measure your drawing, in millimetres, at its widest point and record this value. width of apple in drawing = ............................................... mm Measure the same distance on the half apple, A, and record this value. width of apple A = ............................................... mm [1] (iii) Calculate the magnification of your drawing. Show your working. magnification of drawing = ................................................ [1] (b) • Place the half apple, A, on the white tile. Use the knife, with care, to cut two small cubes of apple. The cubes must be small enough to fit into the test‑tubes provided. • Place one cube into a test‑tube and add two drops of iodine solution. • Place the second cube into another test‑tube and add about 1 cm3 of Benedict’s solution. Heat in a water bath for five minutes. (i) Record your observations. colour observed after adding iodine solution ..................................................................... colour observed after heating with Benedict’s solution ..................................................... [2] (ii) State the conclusions about the nutrient content of an apple that can be made from your observations. ........................................................................................................................................... ..................................................................................................................................... [1] [Total: 7]
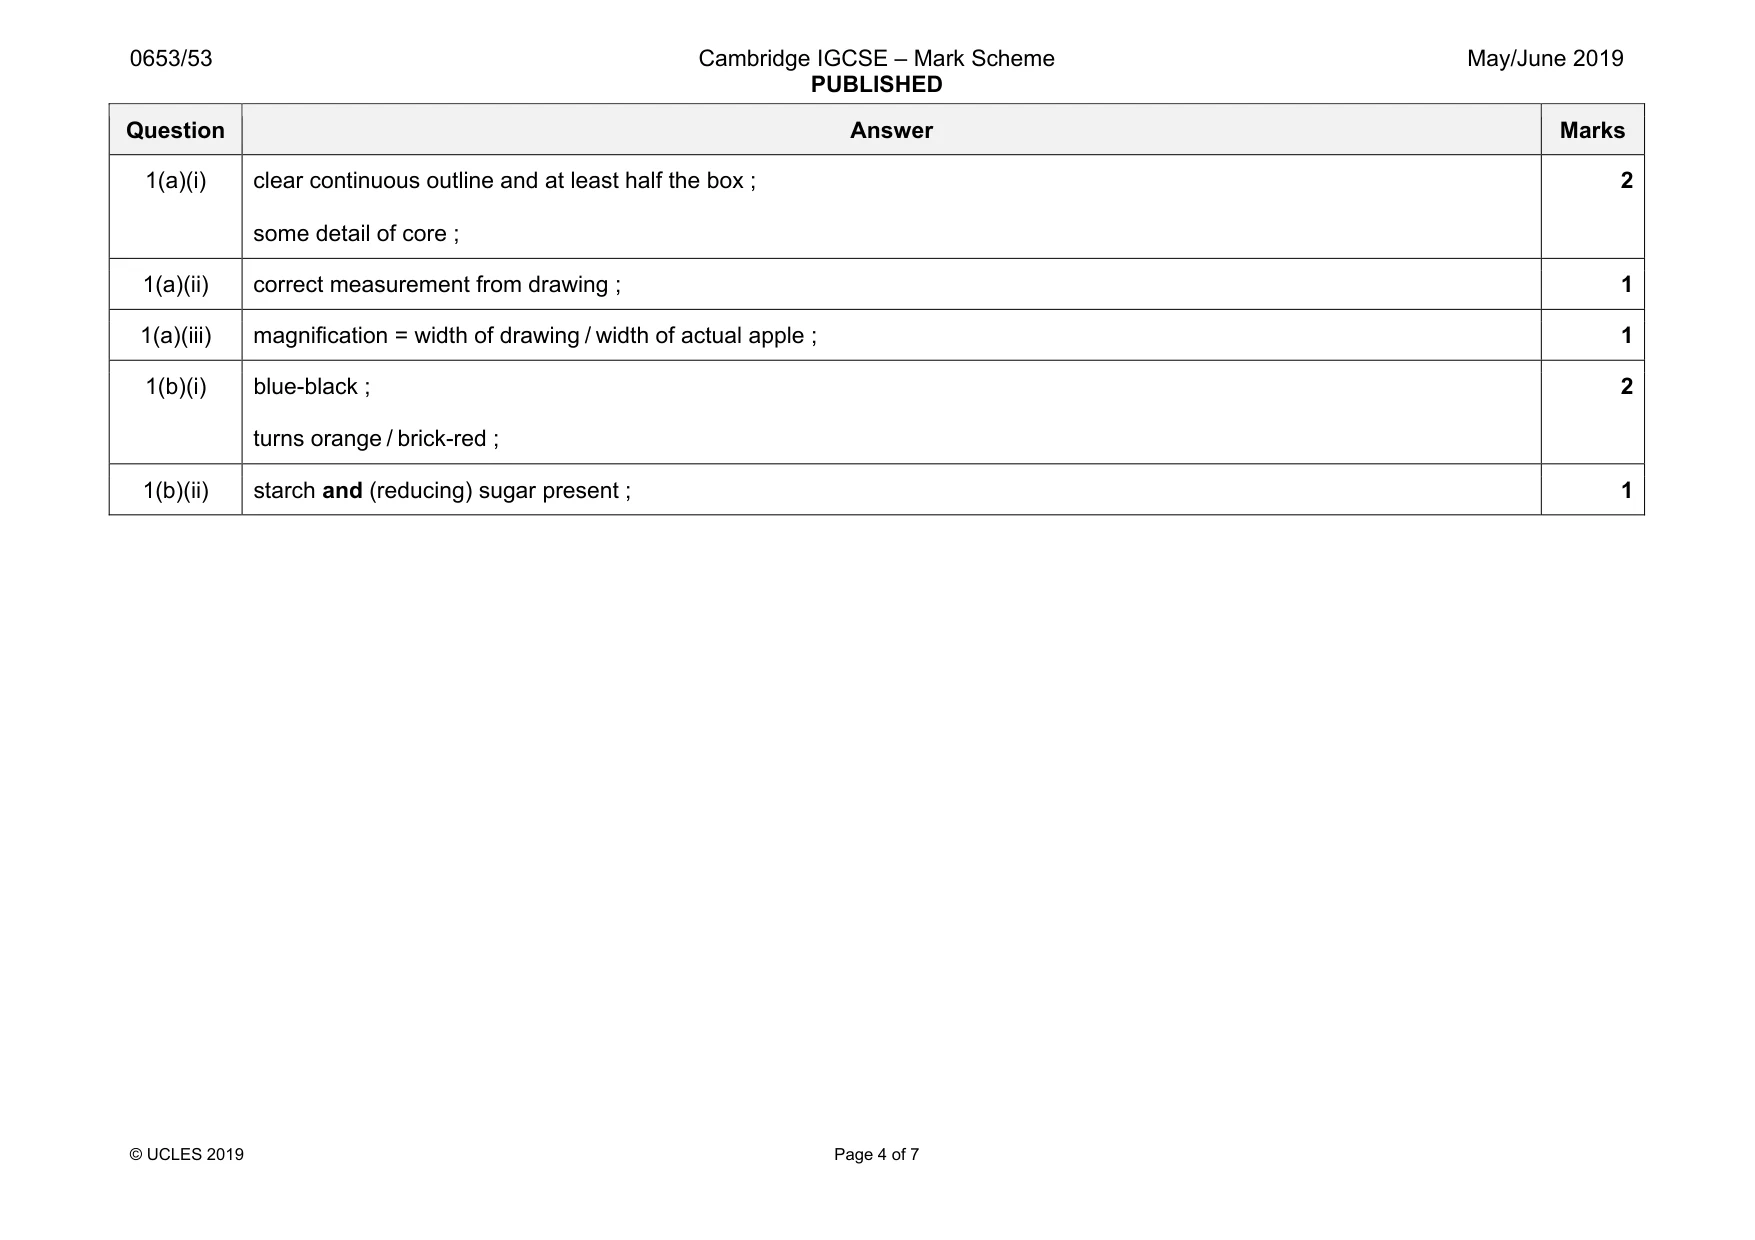
Mark scheme: 1(a)(i) clear continuous outline and at least half the box ; some detail of core ; 2 1(a)(ii) correct measurement from drawing ; 1 1(a)(iii) magnification = width of drawing / width of actual apple ; 1 1(b)(i) blue-black ; turns orange / brick-red ; 2 1(b)(ii) starch and (reducing) sugar present ; 1
Q2 · A cut stem of the water plant Elodea placed in a beaker of water
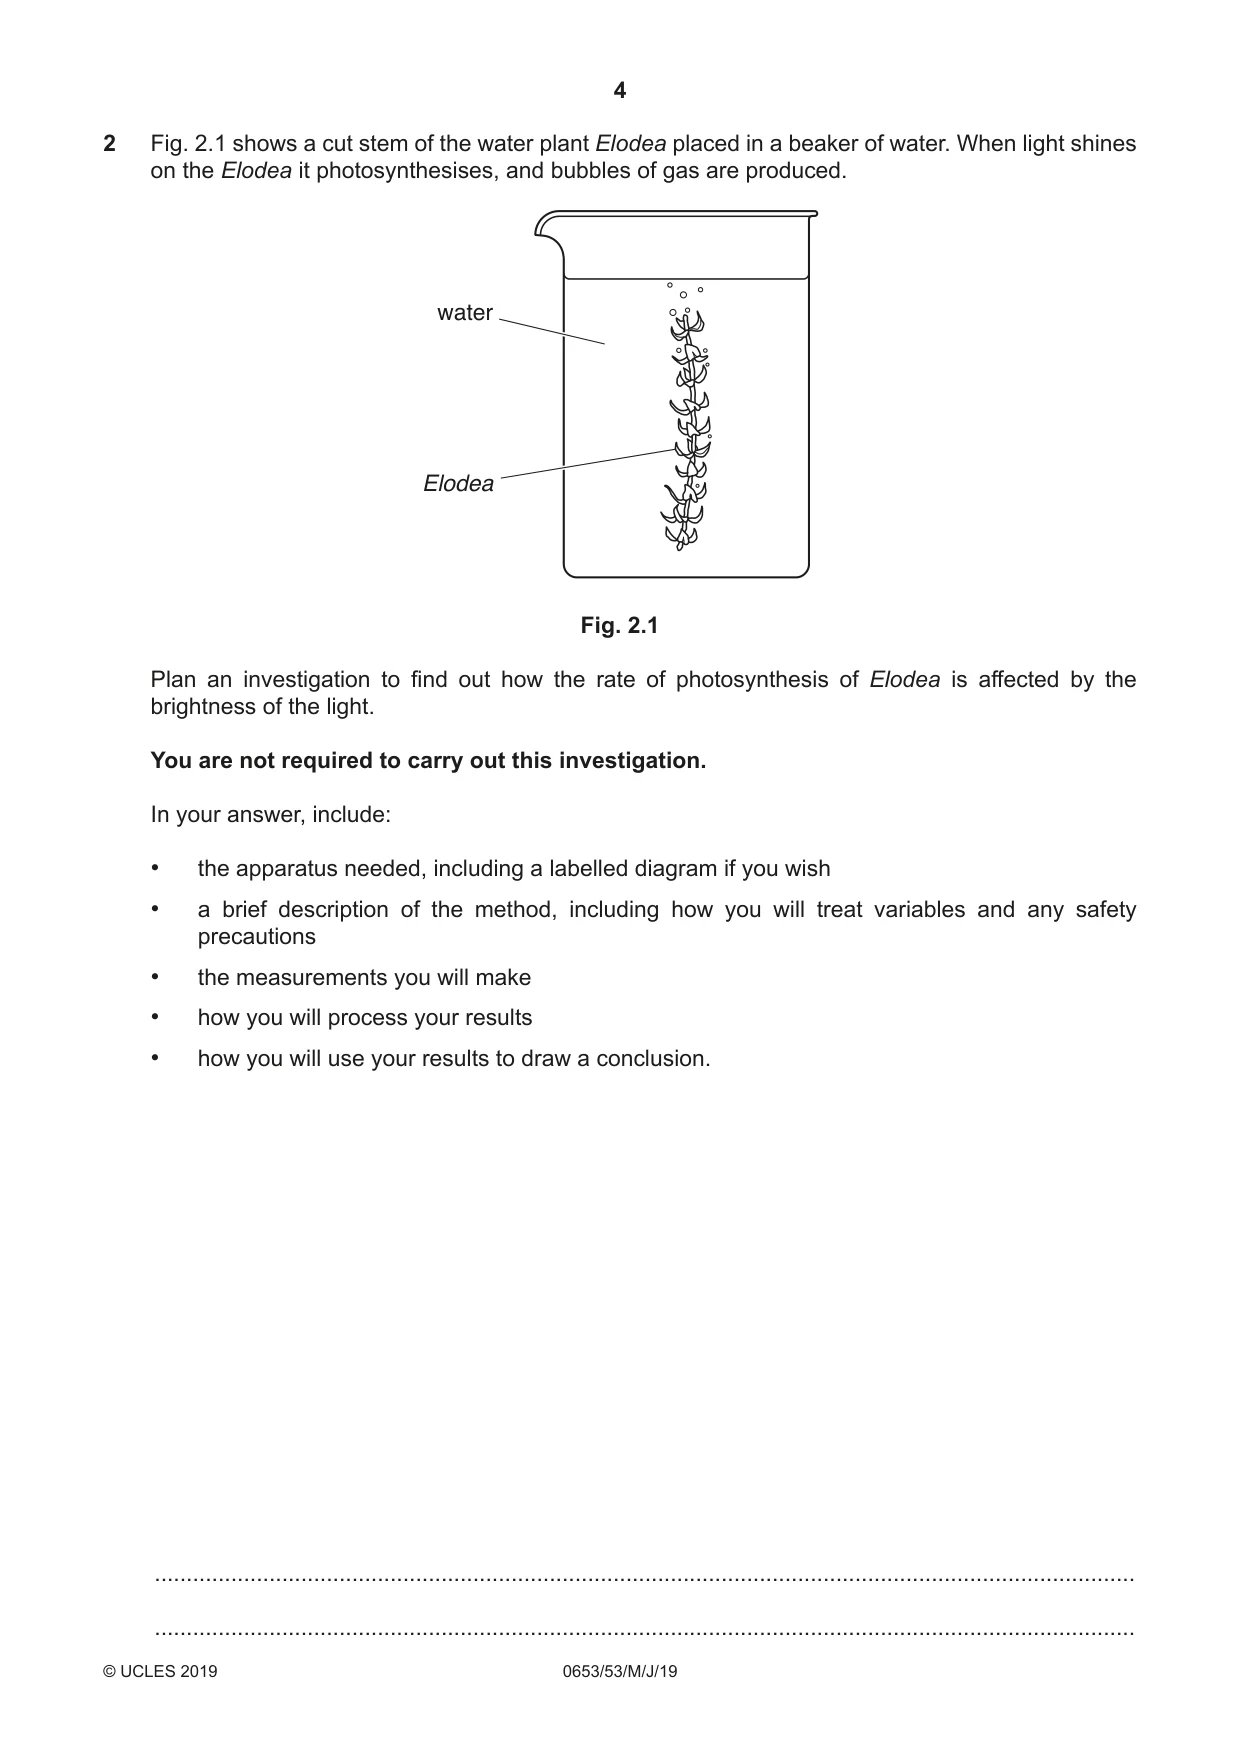
2 Fig. 2.1 shows a cut stem of the water plant Elodea placed in a beaker of water. When light shines on the Elodea it photosynthesises, and bubbles of gas are produced. water Elodea Fig. 2.1 Plan an investigation to find out how the rate of photosynthesis of Elodea is affected by the brightness of the light. You are not required to carry out this investigation. In your answer, include: • the apparatus needed, including a labelled diagram if you wish • a brief description of the method, including how you will treat variables and any safety precautions • the measurements you will make • how you will process your results • how you will use your results to draw a conclusion. .......................................................................................................................................................... .......................................................................................................................................................... .......................................................................................................................................................... .......................................................................................................................................................... .......................................................................................................................................................... .......................................................................................................................................................... .......................................................................................................................................................... .......................................................................................................................................................... .......................................................................................................................................................... .......................................................................................................................................................... .......................................................................................................................................................... .......................................................................................................................................................... .......................................................................................................................................................... .......................................................................................................................................................... .......................................................................................................................................................... .......................................................................................................................................................... .................................................................................................................................................... [7]
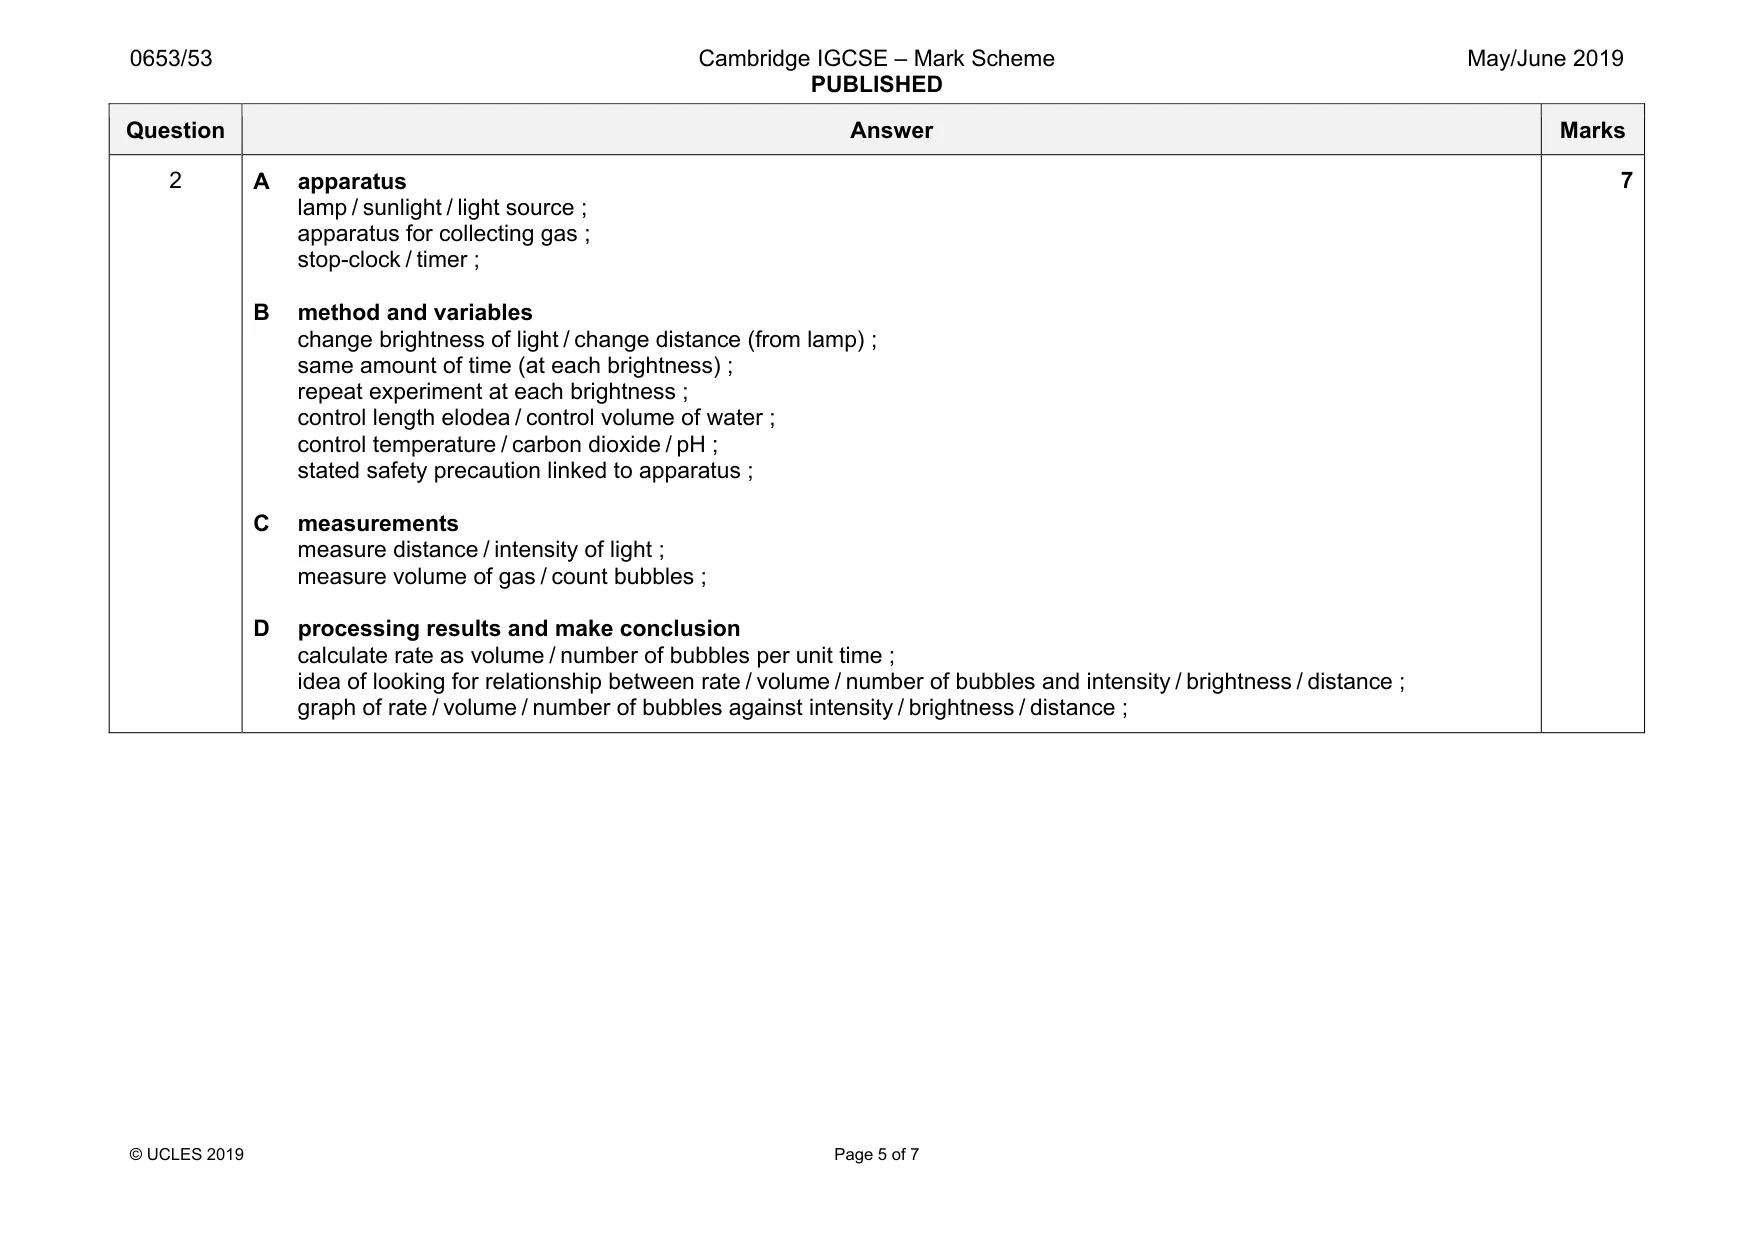
Mark scheme: 2 A apparatus lamp / sunlight / light source ; apparatus for collecting gas ; stop-clock / timer ; B method and variables change brightness of light / change distance (from lamp) ; same amount of time (at each brightness) ; repeat experiment at each brightness ; control length elodea / control volume of water ; control temperature / carbon dioxide / pH ; stated safety precaution linked to apparatus ; C measurements measure distance / intensity of light ; measure volume of gas / count bubbles ; D processing results and make conclusion calculate rate as volume / number of bubbles per unit time ; idea of looking for relationship between rate / volume / number of bubbles and intensity / brightness / distance ; graph of rate / volume / number of bubbles against intensity / brightness / distance ; 7
Q3 · You are going to investigate the temperature changes which occur when aqueous copper(II)…
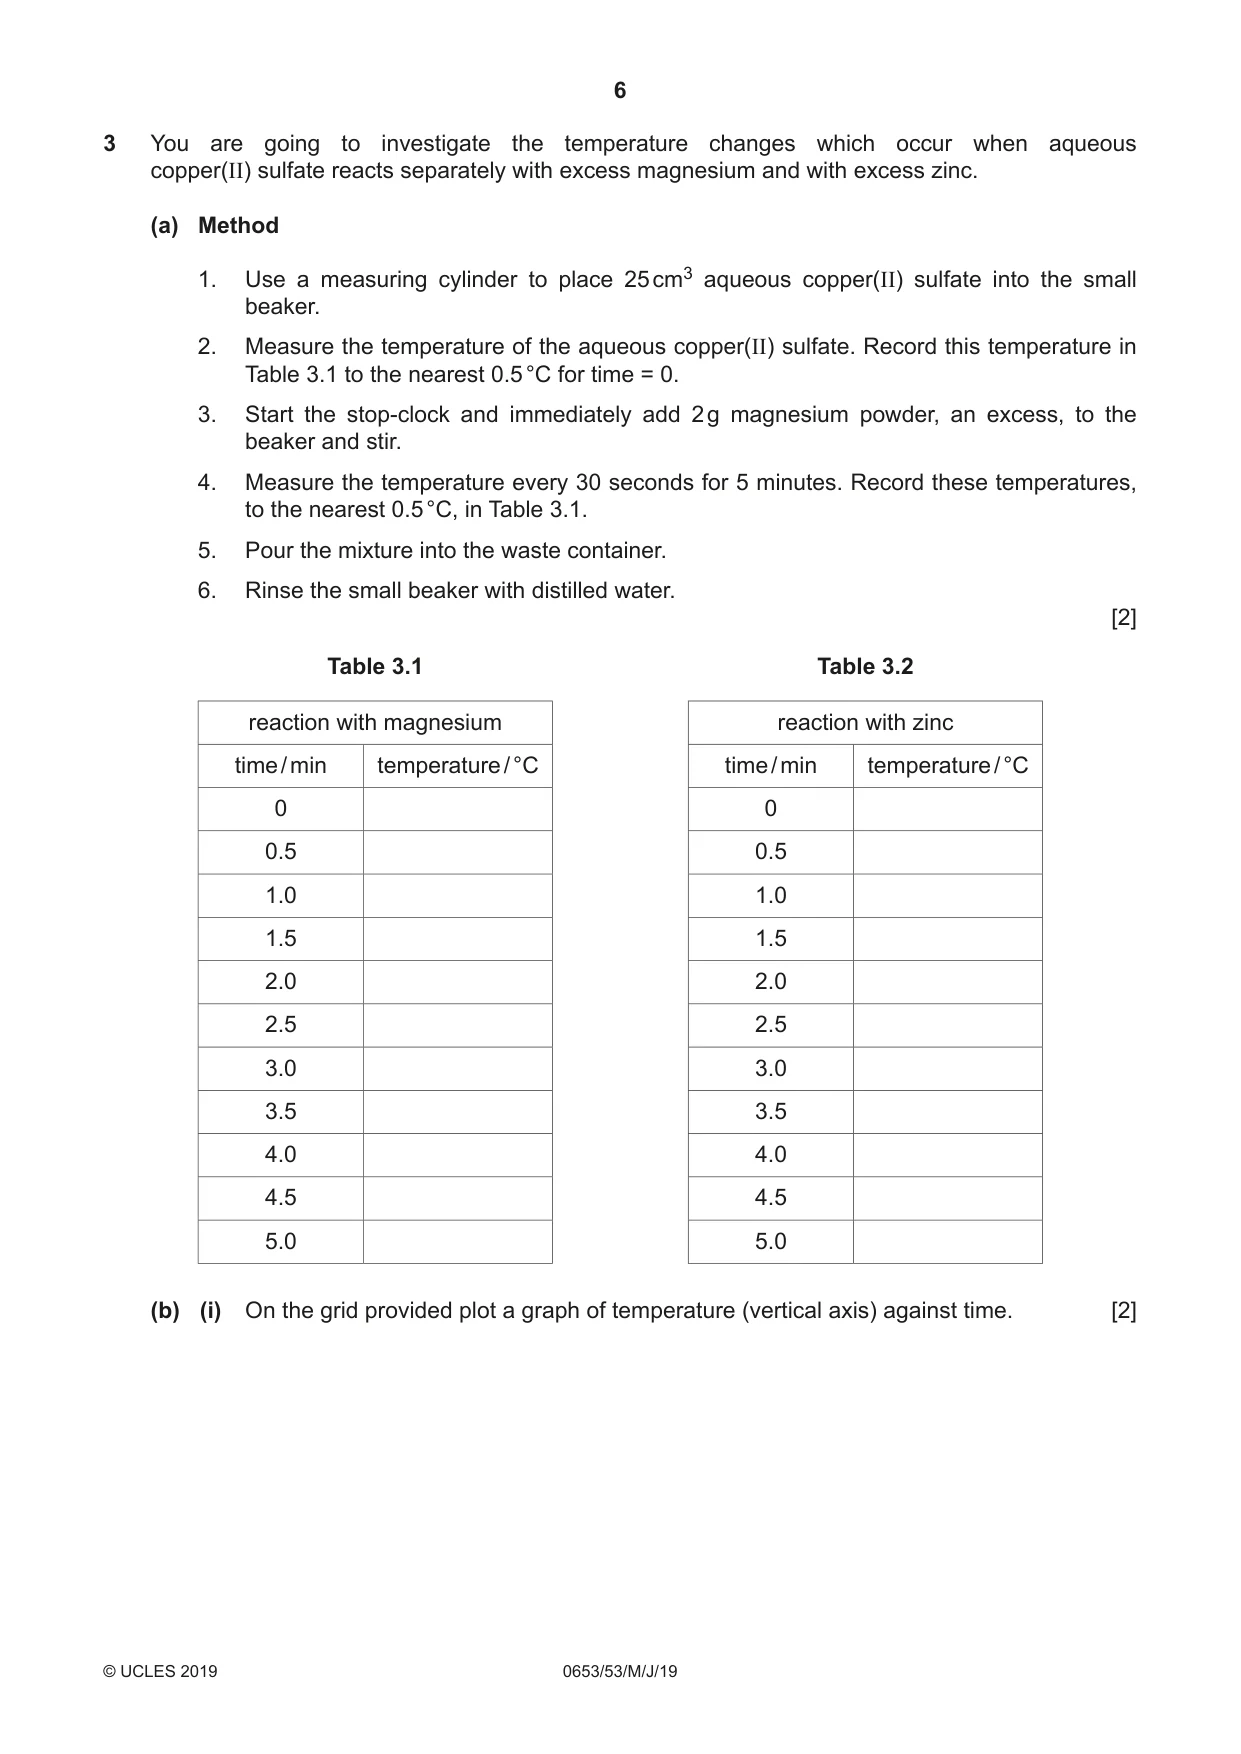
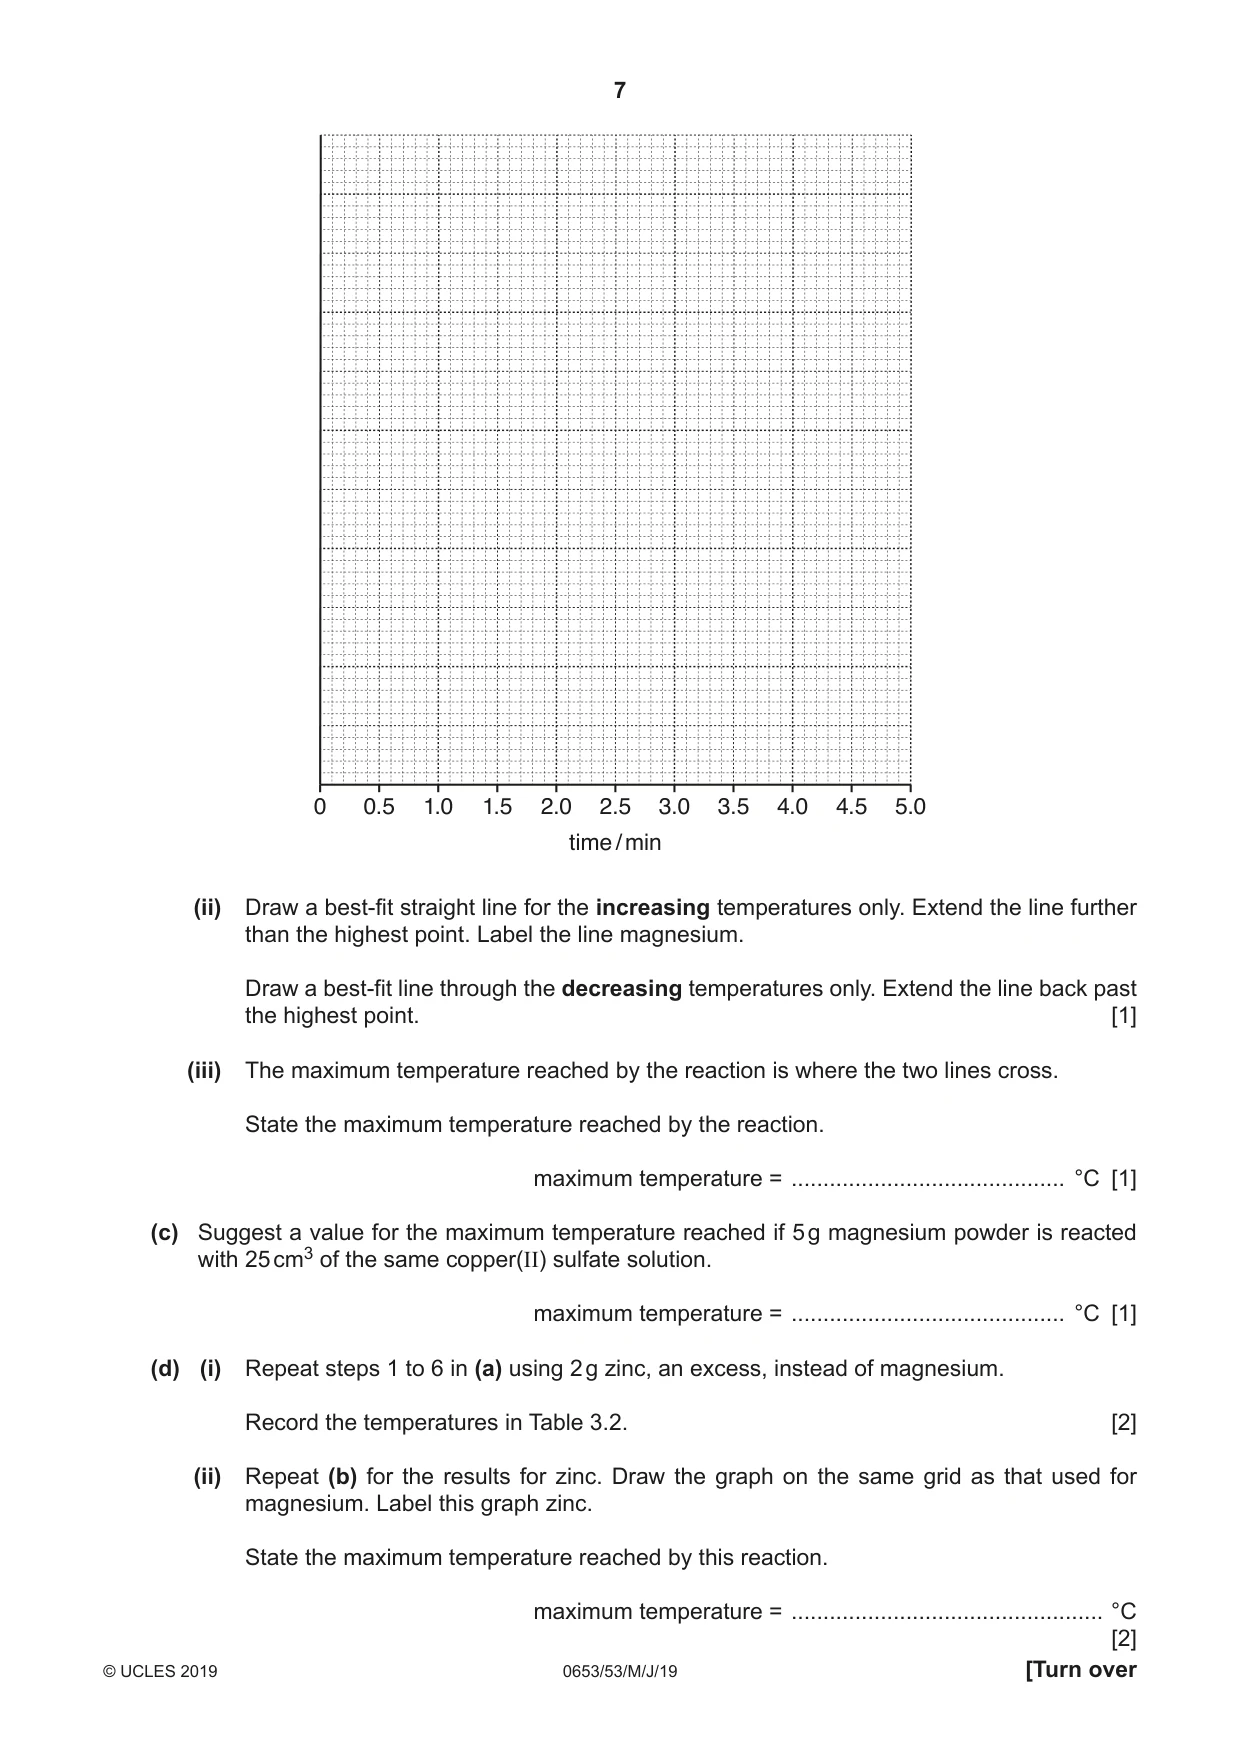
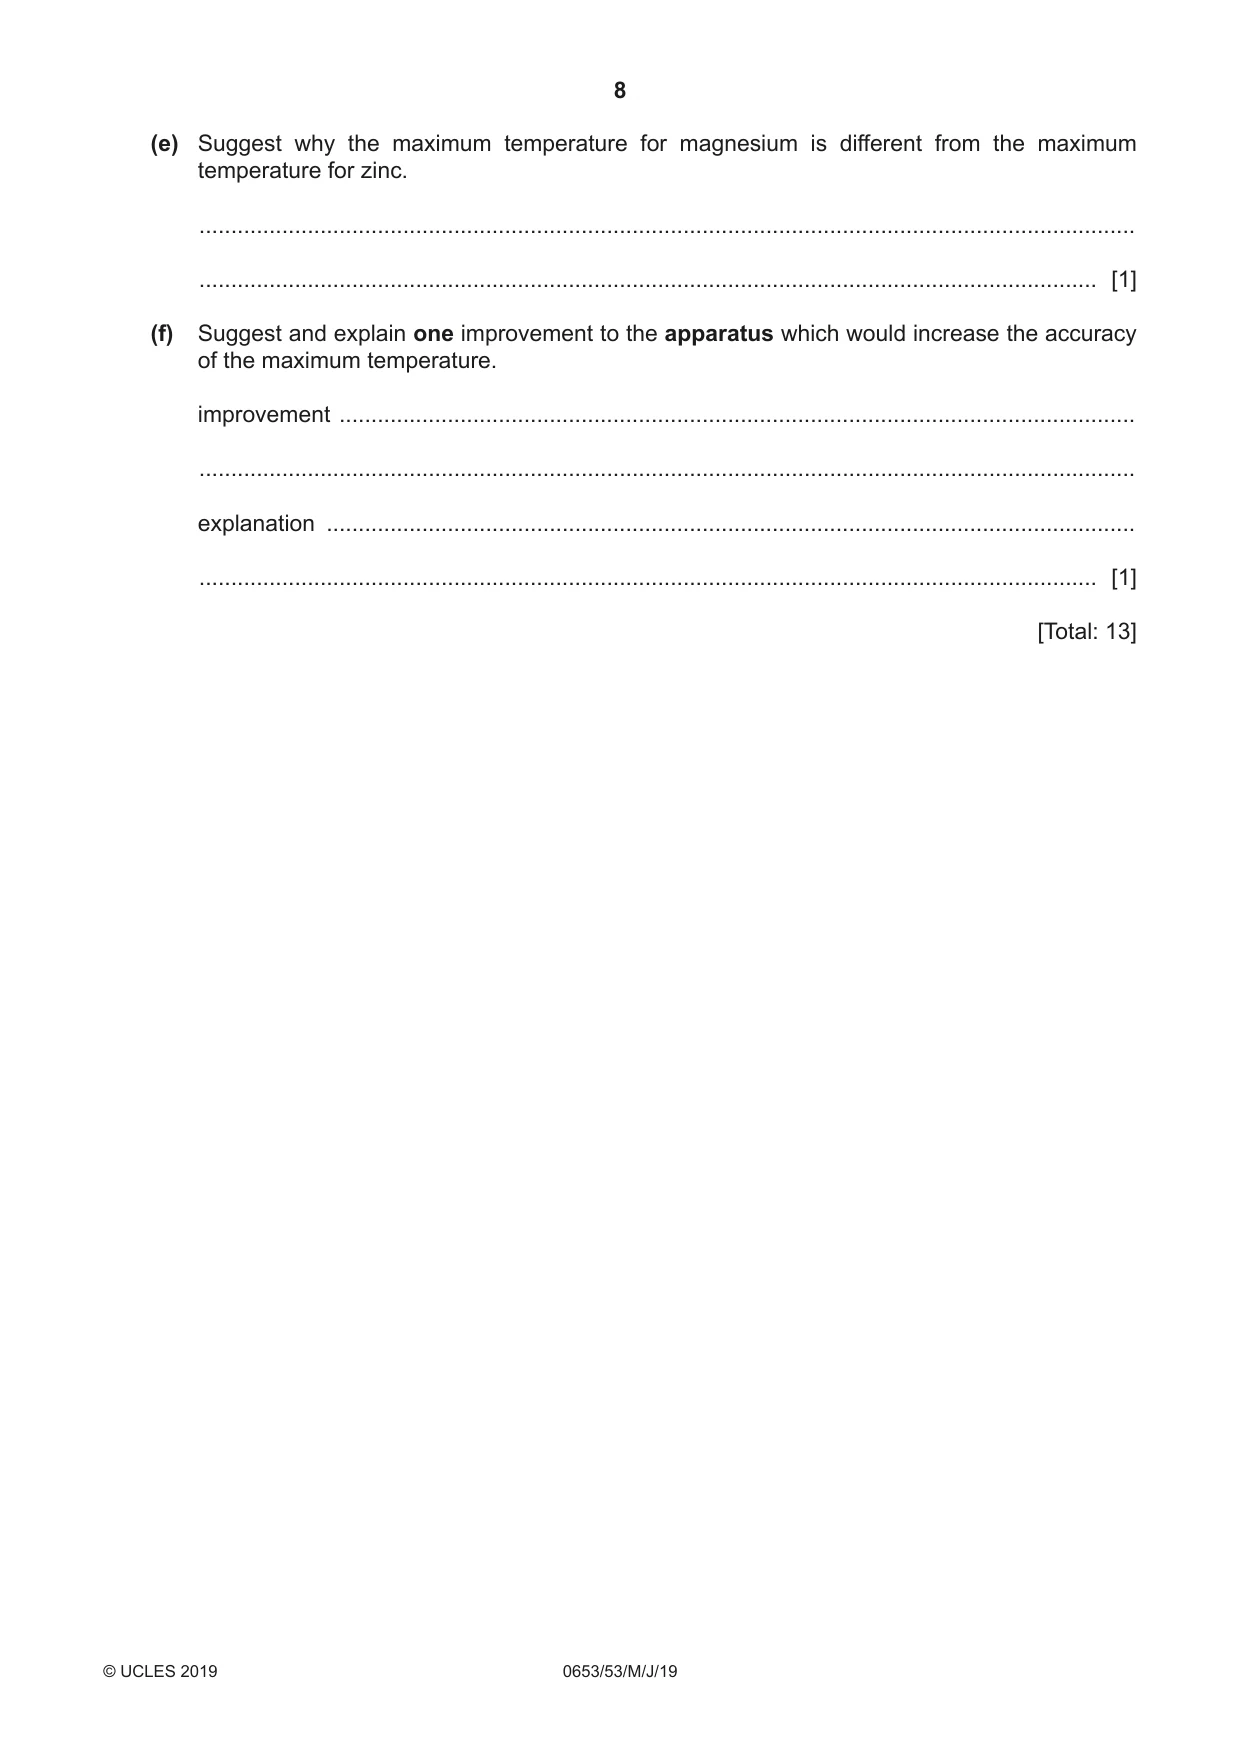
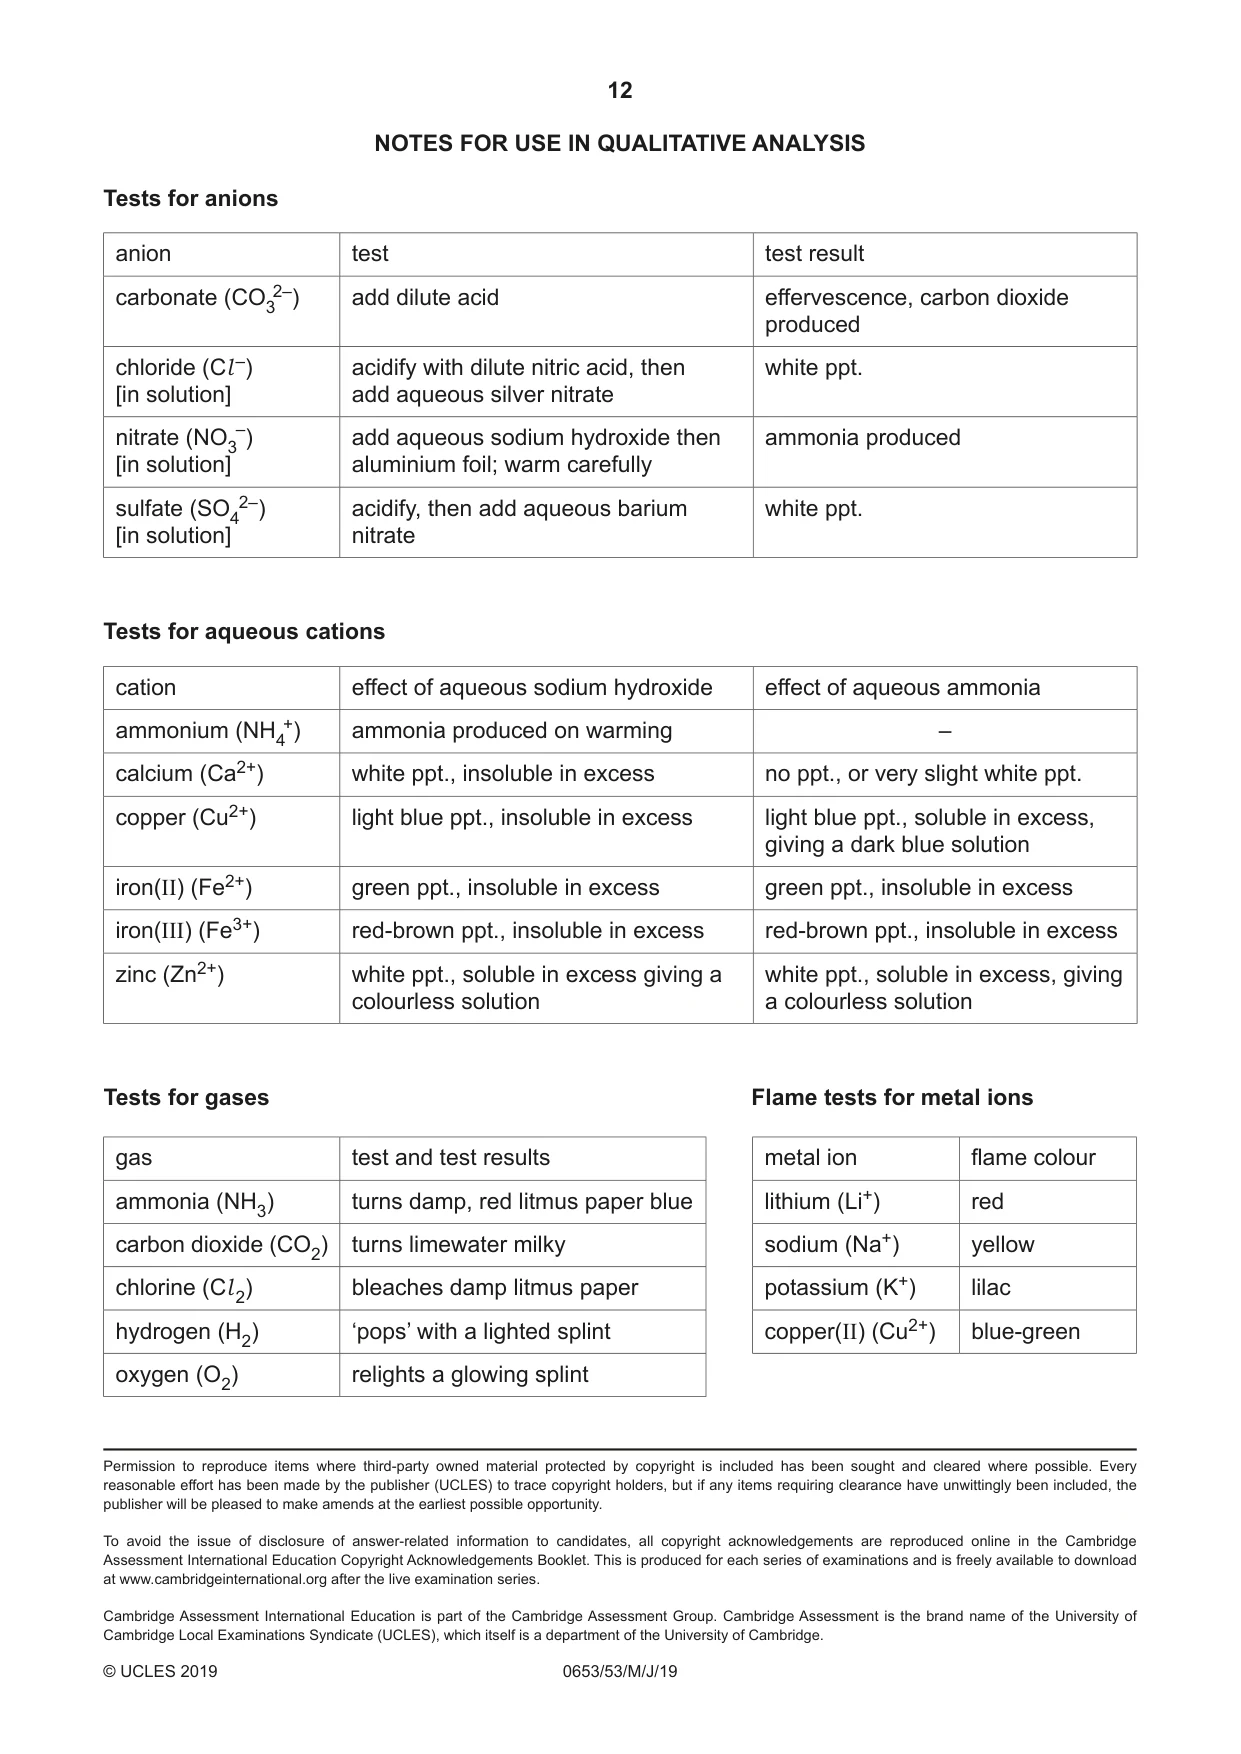
3 You are going to investigate the temperature changes which occur when aqueous copper(II) sulfate reacts separately with excess magnesium and with excess zinc. (a) Method 1. Use a measuring cylinder to place 25 cm3 aqueous copper(II) sulfate into the small beaker. 2. Measure the temperature of the aqueous copper(II) sulfate. Record this temperature in Table 3.1 to the nearest 0.5 °C for time = 0. 3. Start the stop‑clock and immediately add 2 g magnesium powder, an excess, to the beaker and stir. 4. Measure the temperature every 30 seconds for 5 minutes. Record these temperatures, to the nearest 0.5 °C, in Table 3.1. 5. Pour the mixture into the waste container. 6. Rinse the small beaker with distilled water. [2] Table 3.1 Table 3.2 reaction with magnesium reaction with zinc time / min temperature / °C time / min temperature / °C 0 0 0.5 0.5 1.0 1.0 1.5 1.5 2.0 2.0 2.5 2.5 3.0 3.0 3.5 3.5 4.0 4.0 4.5 4.5 5.0 5.0 (b) (i) On the grid provided plot a graph of temperature (vertical axis) against time. [2] 0 0.5 1.0 1.5 2.0 2.5 3.0 3.5 4.0 4.5 5.0 time / min (ii) Draw a best‑fit straight line for the increasing temperatures only. Extend the line further than the highest point. Label the line magnesium. Draw a best‑fit line through the decreasing temperatures only. Extend the line back past the highest point. [1] (iii) The maximum temperature reached by the reaction is where the two lines cross. State the maximum temperature reached by the reaction. maximum temperature = ........................................... °C [1] (c) Suggest a value for the maximum temperature reached if 5 g magnesium powder is reacted with 25 cm3 of the same copper(II) sulfate solution. maximum temperature = ........................................... °C [1] (d) (i) Repeat steps 1 to 6 in (a) using 2 g zinc, an excess, instead of magnesium. Record the temperatures in Table 3.2. [2] (ii) Repeat (b) for the results for zinc. Draw the graph on the same grid as that used for magnesium. Label this graph zinc. State the maximum temperature reached by this reaction. maximum temperature = ................................................. °C [2] (e) Suggest why the maximum temperature for magnesium is different from the maximum temperature for zinc. ................................................................................................................................................... ............................................................................................................................................. [1] (f) Suggest and explain one improvement to the apparatus which would increase the accuracy of the maximum temperature. improvement ............................................................................................................................. ................................................................................................................................................... explanation ............................................................................................................................... ............................................................................................................................................. [1] [Total: 13]
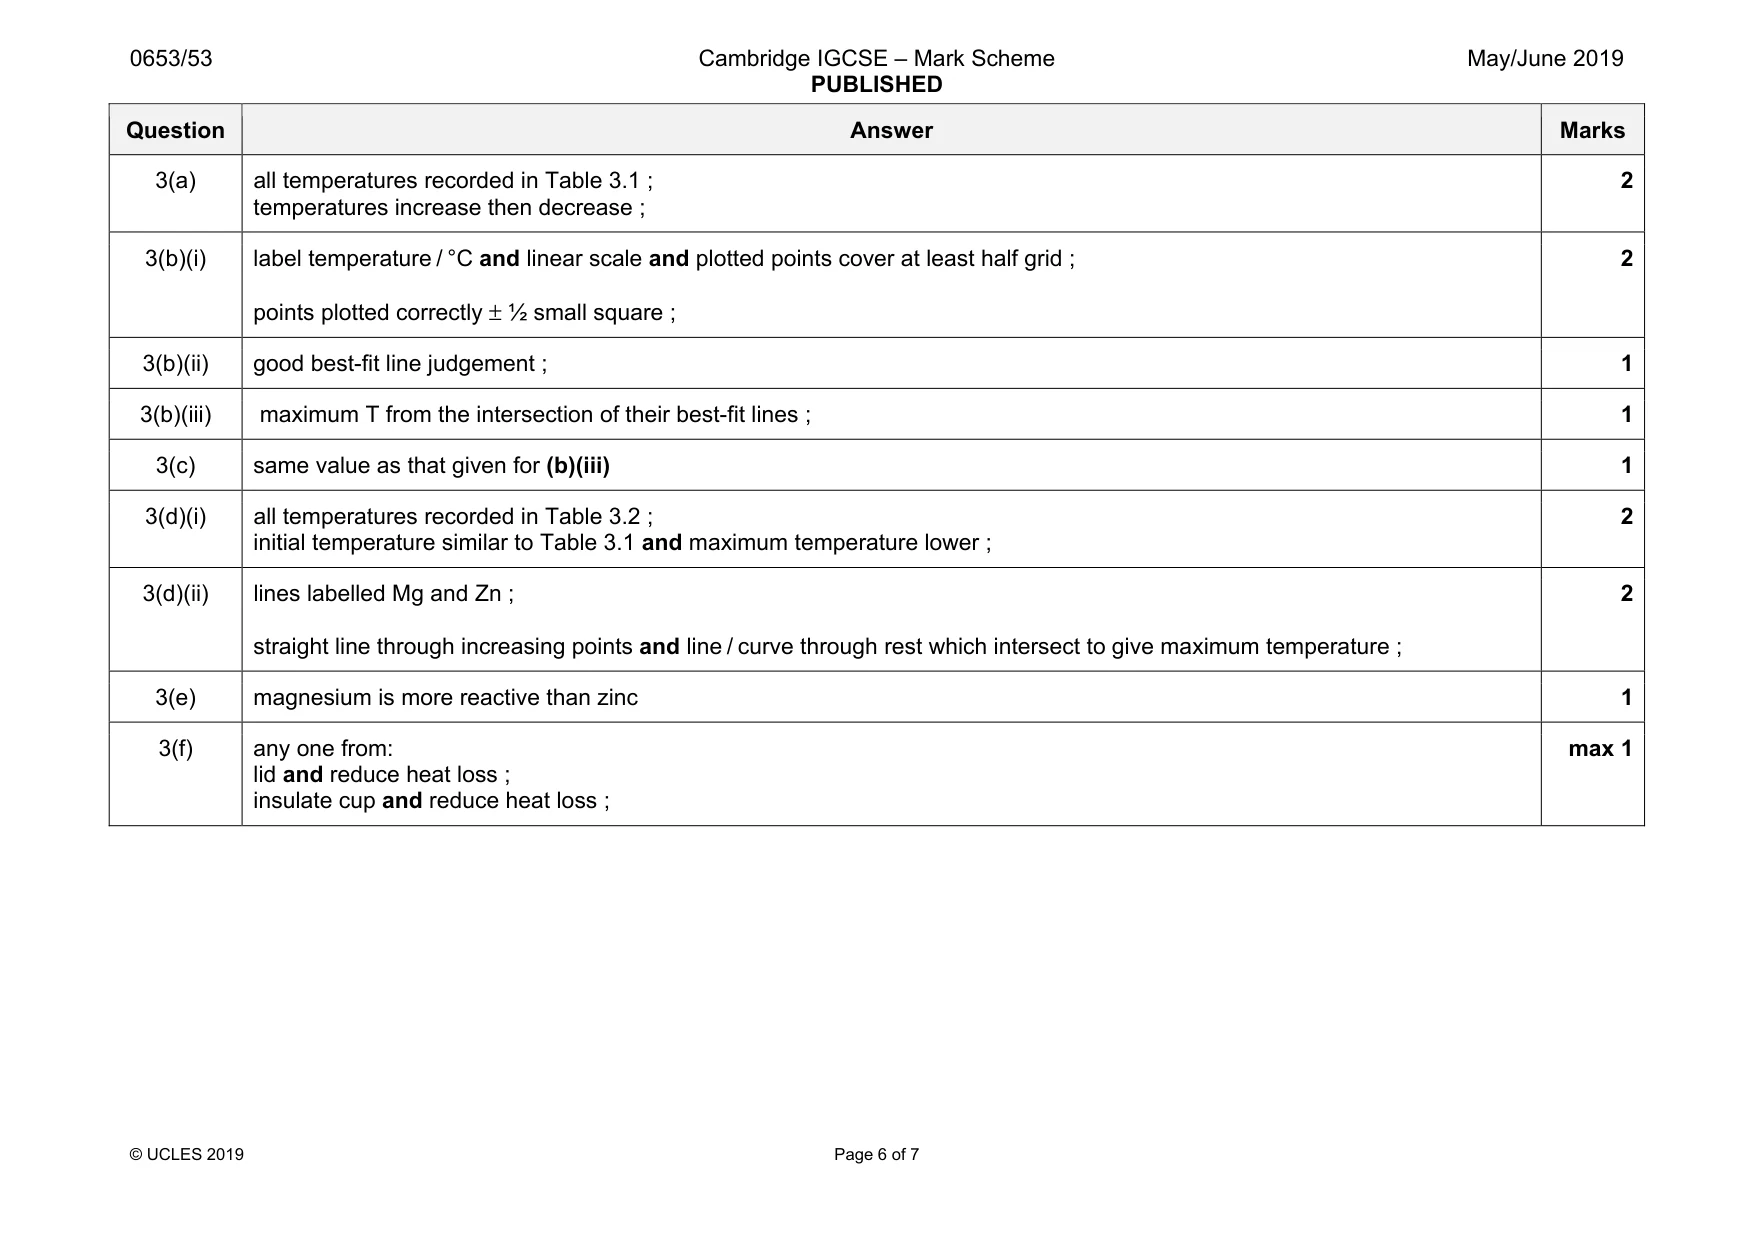
Mark scheme: 3(a) all temperatures recorded in Table 3.1 ; temperatures increase then decrease ; 2 3(b)(i) label temperature / °C and linear scale and plotted points cover at least half grid ; points plotted correctly ± ½ small square ; 2 3(b)(ii) good best-fit line judgement ; 1 3(b)(iii) maximum T from the intersection of their best-fit lines ; 1 3(c) same value as that given for (b)(iii) 1 3(d)(i) all temperatures recorded in Table 3.2 ; initial temperature similar to Table 3.1 and maximum temperature lower ; 2 3(d)(ii) lines labelled Mg and Zn ; straight line through increasing points and line / curve through rest which intersect to give maximum temperature ; 2 3(e) magnesium is more reactive than zinc 1 3(f) any one from: lid and reduce heat loss ; insulate cup and reduce heat loss ; max 1
Q4 · You are going to calculate the density of a liquid using two different methods
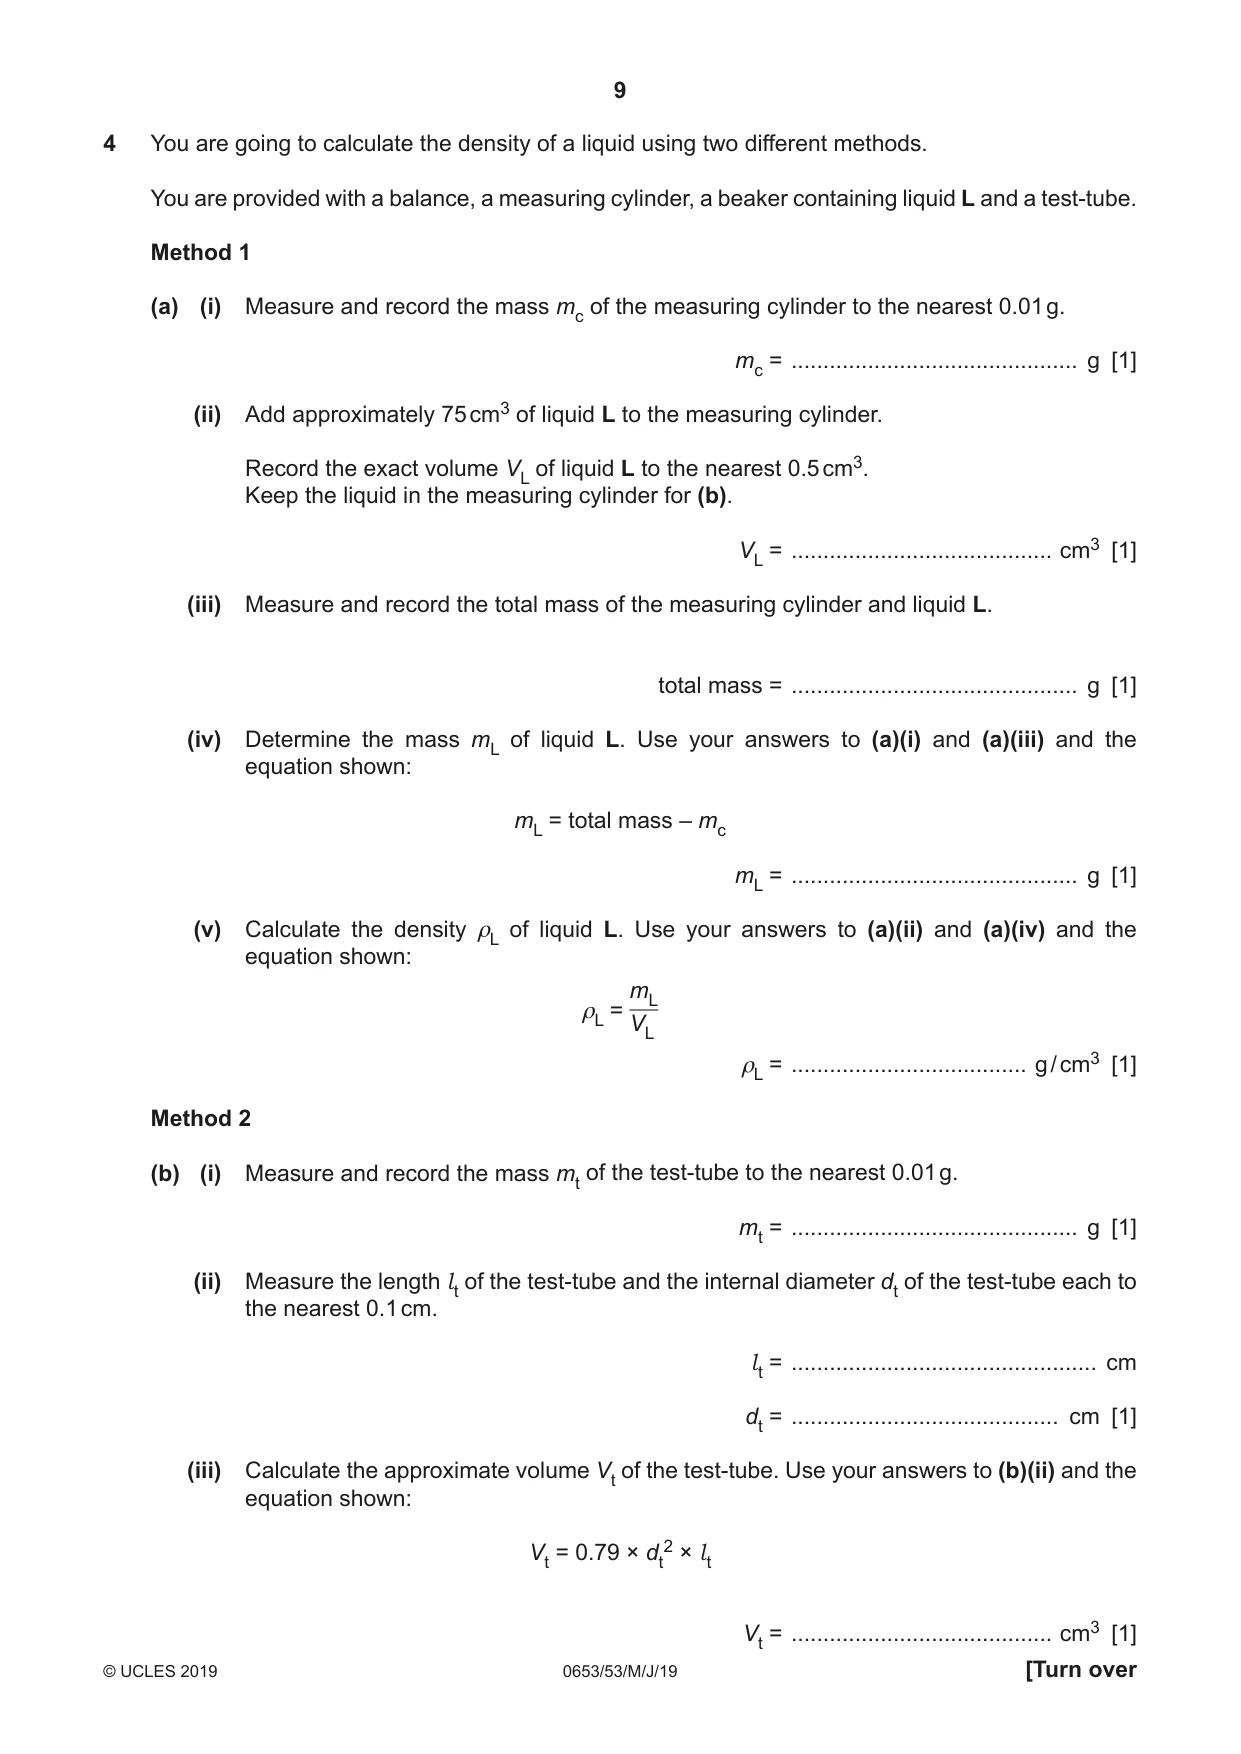
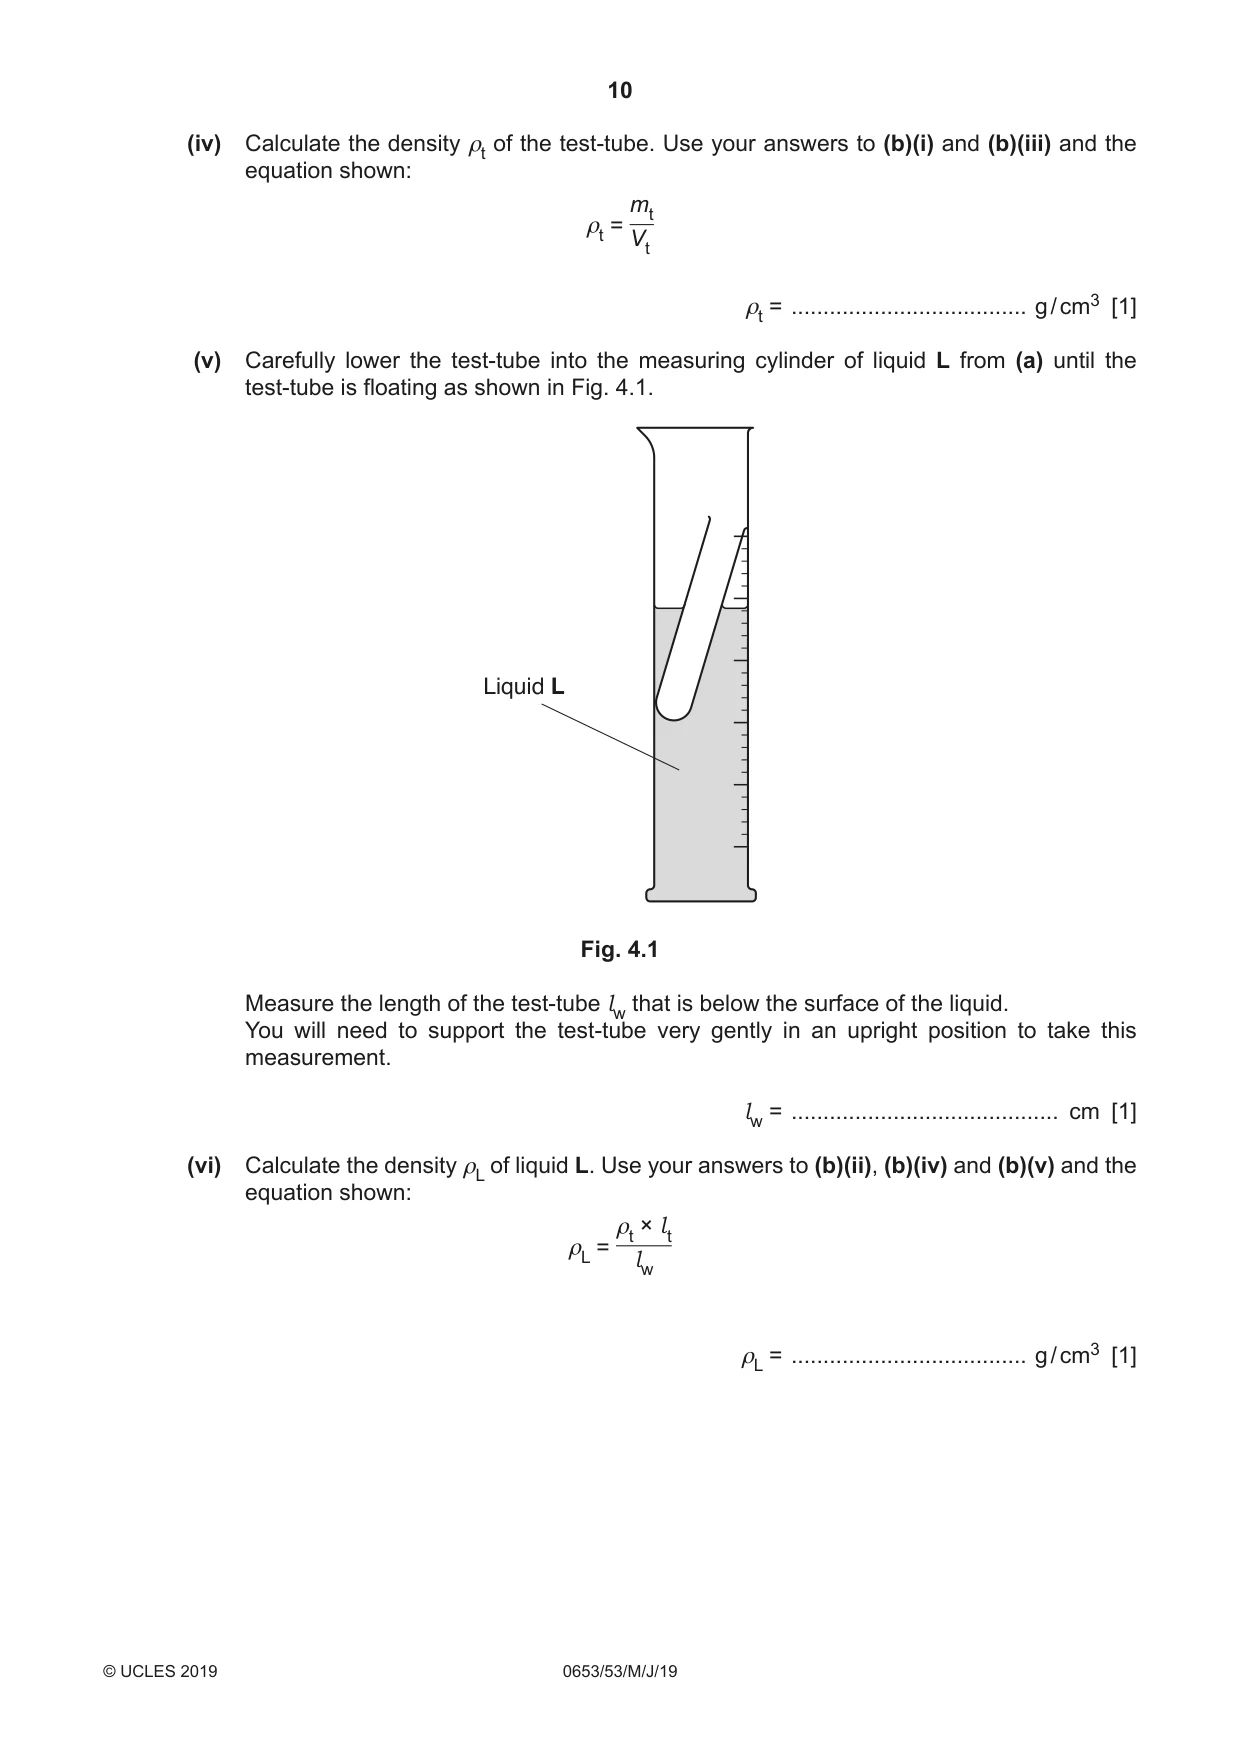
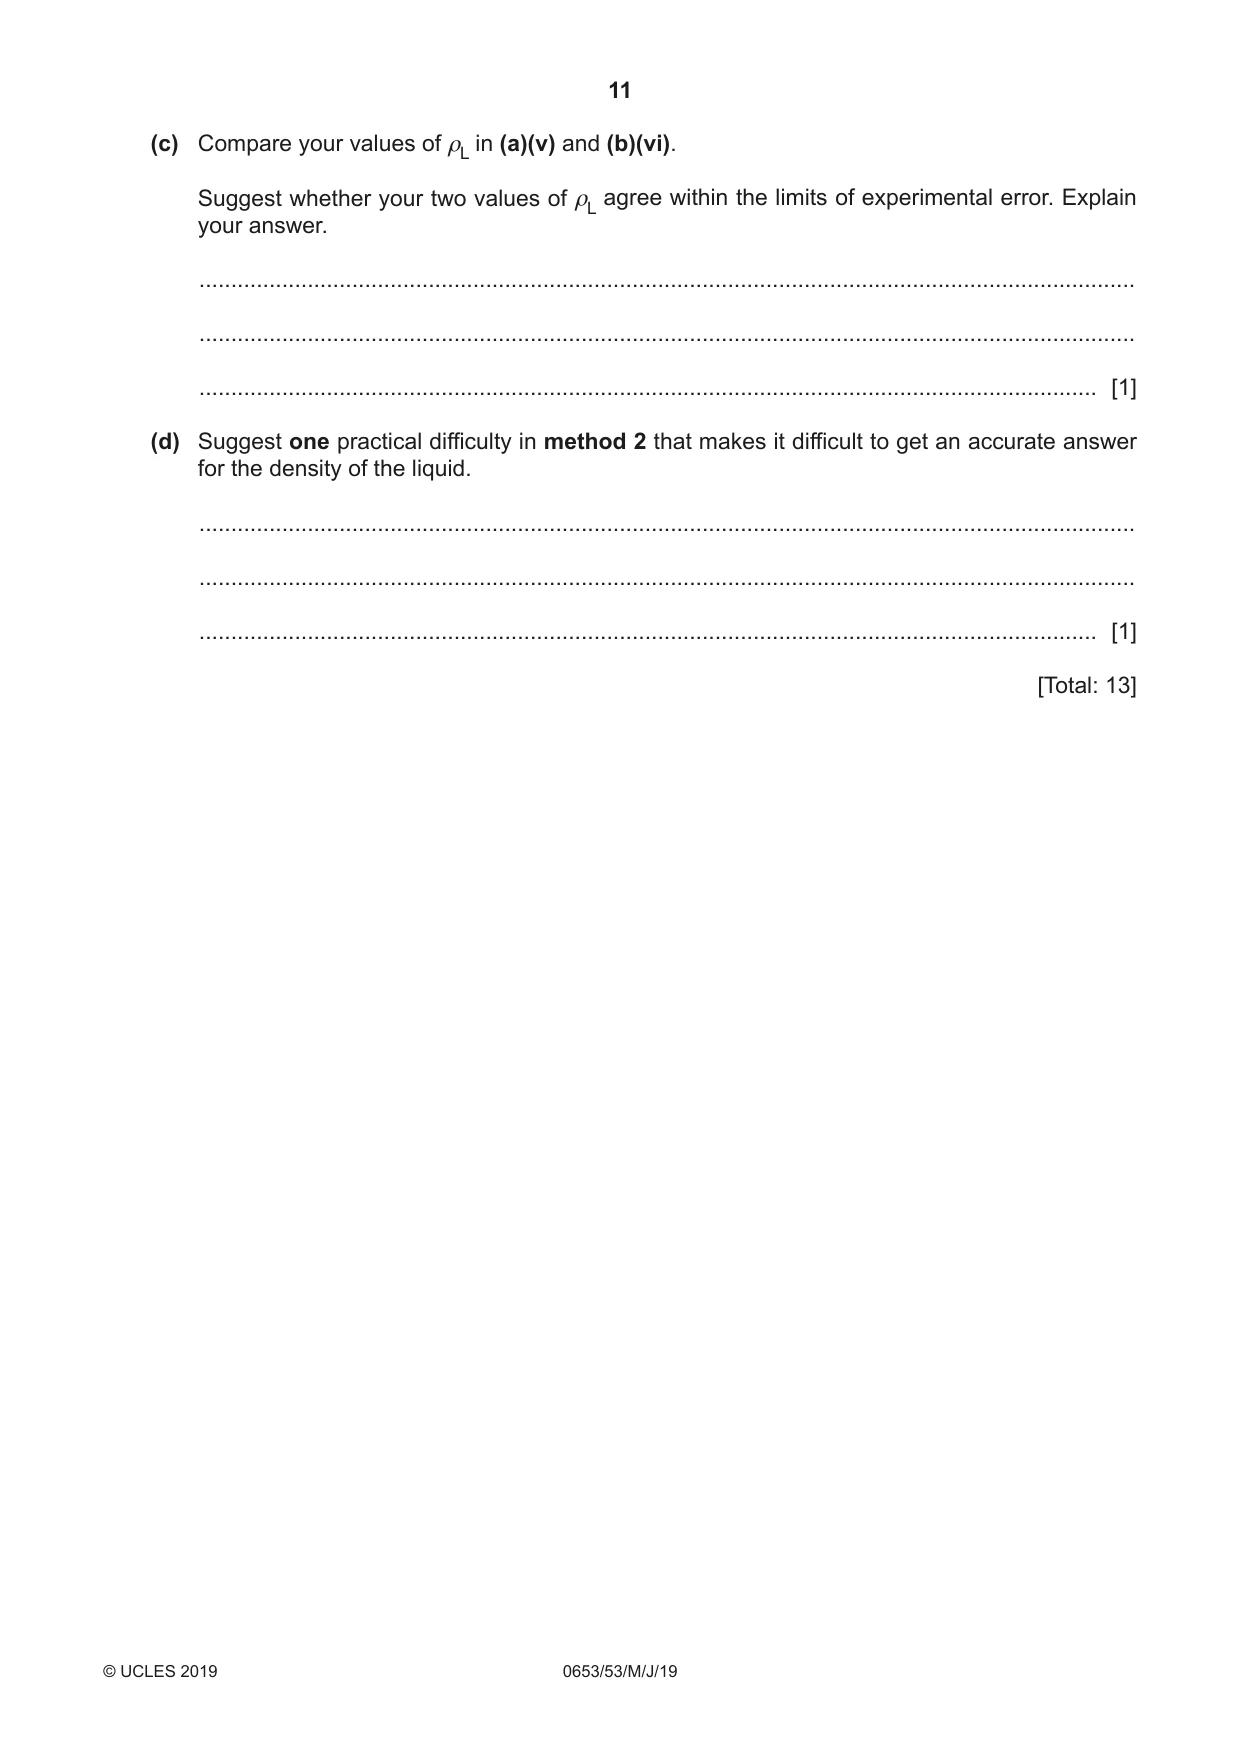
4 You are going to calculate the density of a liquid using two different methods. You are provided with a balance, a measuring cylinder, a beaker containing liquid L and a test‑tube. Method 1 (a) (i) Measure and record the mass mc of the measuring cylinder to the nearest 0.01 g. mc = ............................................. g [1] (ii) Add approximately 75 cm3 of liquid L to the measuring cylinder. Record the exact volume VL of liquid L to the nearest 0.5 cm3. Keep the liquid in the measuring cylinder for (b). VL = ......................................... cm3 [1] (iii) Measure and record the total mass of the measuring cylinder and liquid L. total mass = ............................................. g [1] (iv) Determine the mass mL of liquid L. Use your answers to (a)(i) and (a)(iii) and the equation shown: mL = total mass – mc mL = ............................................. g [1] (v) Calculate the density ρL of liquid L. Use your answers to (a)(ii) and (a)(iv) and the equation shown: mL ρL = VL ρL = ..................................... g / cm3 [1] Method 2 (b) (i) Measure and record the mass mt of the test‑tube to the nearest 0.01 g. mt = ............................................. g [1] (ii) Measure the length l t of the test‑tube and the internal diameter dt of the test‑tube each to the nearest 0.1 cm. l t = ................................................ cm dt = .......................................... cm [1] (iii) Calculate the approximate volume Vt of the test‑tube. Use your answers to (b)(ii) and the equation shown: Vt = 0.79 × dt 2 × l t Vt = ......................................... cm3 [1] (iv) Calculate the density ρt of the test‑tube. Use your answers to (b)(i) and (b)(iii) and the equation shown: mt ρt = Vt ρt = ..................................... g / cm3 [1] (v) Carefully lower the test‑tube into the measuring cylinder of liquid L from (a) until the test‑tube is floating as shown in Fig. 4.1. Liquid L Fig. 4.1 Measure the length of the test‑tube lw that is below the surface of the liquid. You will need to support the test‑tube very gently in an upright position to take this measurement. lw = .......................................... cm [1] (vi) Calculate the density ρL of liquid L. Use your answers to (b)(ii), (b)(iv) and (b)(v) and the equation shown: ρt × l t ρL = lw ρL = ..................................... g / cm3 [1] (c) Compare your values of ρL in (a)(v) and (b)(vi). Suggest whether your two values of ρL agree within the limits of experimental error. Explain your answer. ................................................................................................................................................... ................................................................................................................................................... ............................................................................................................................................. [1] (d) Suggest one practical difficulty in method 2 that makes it difficult to get an accurate answer for the density of the liquid. ................................................................................................................................................... ................................................................................................................................................... ............................................................................................................................................. [1] [Total: 13]
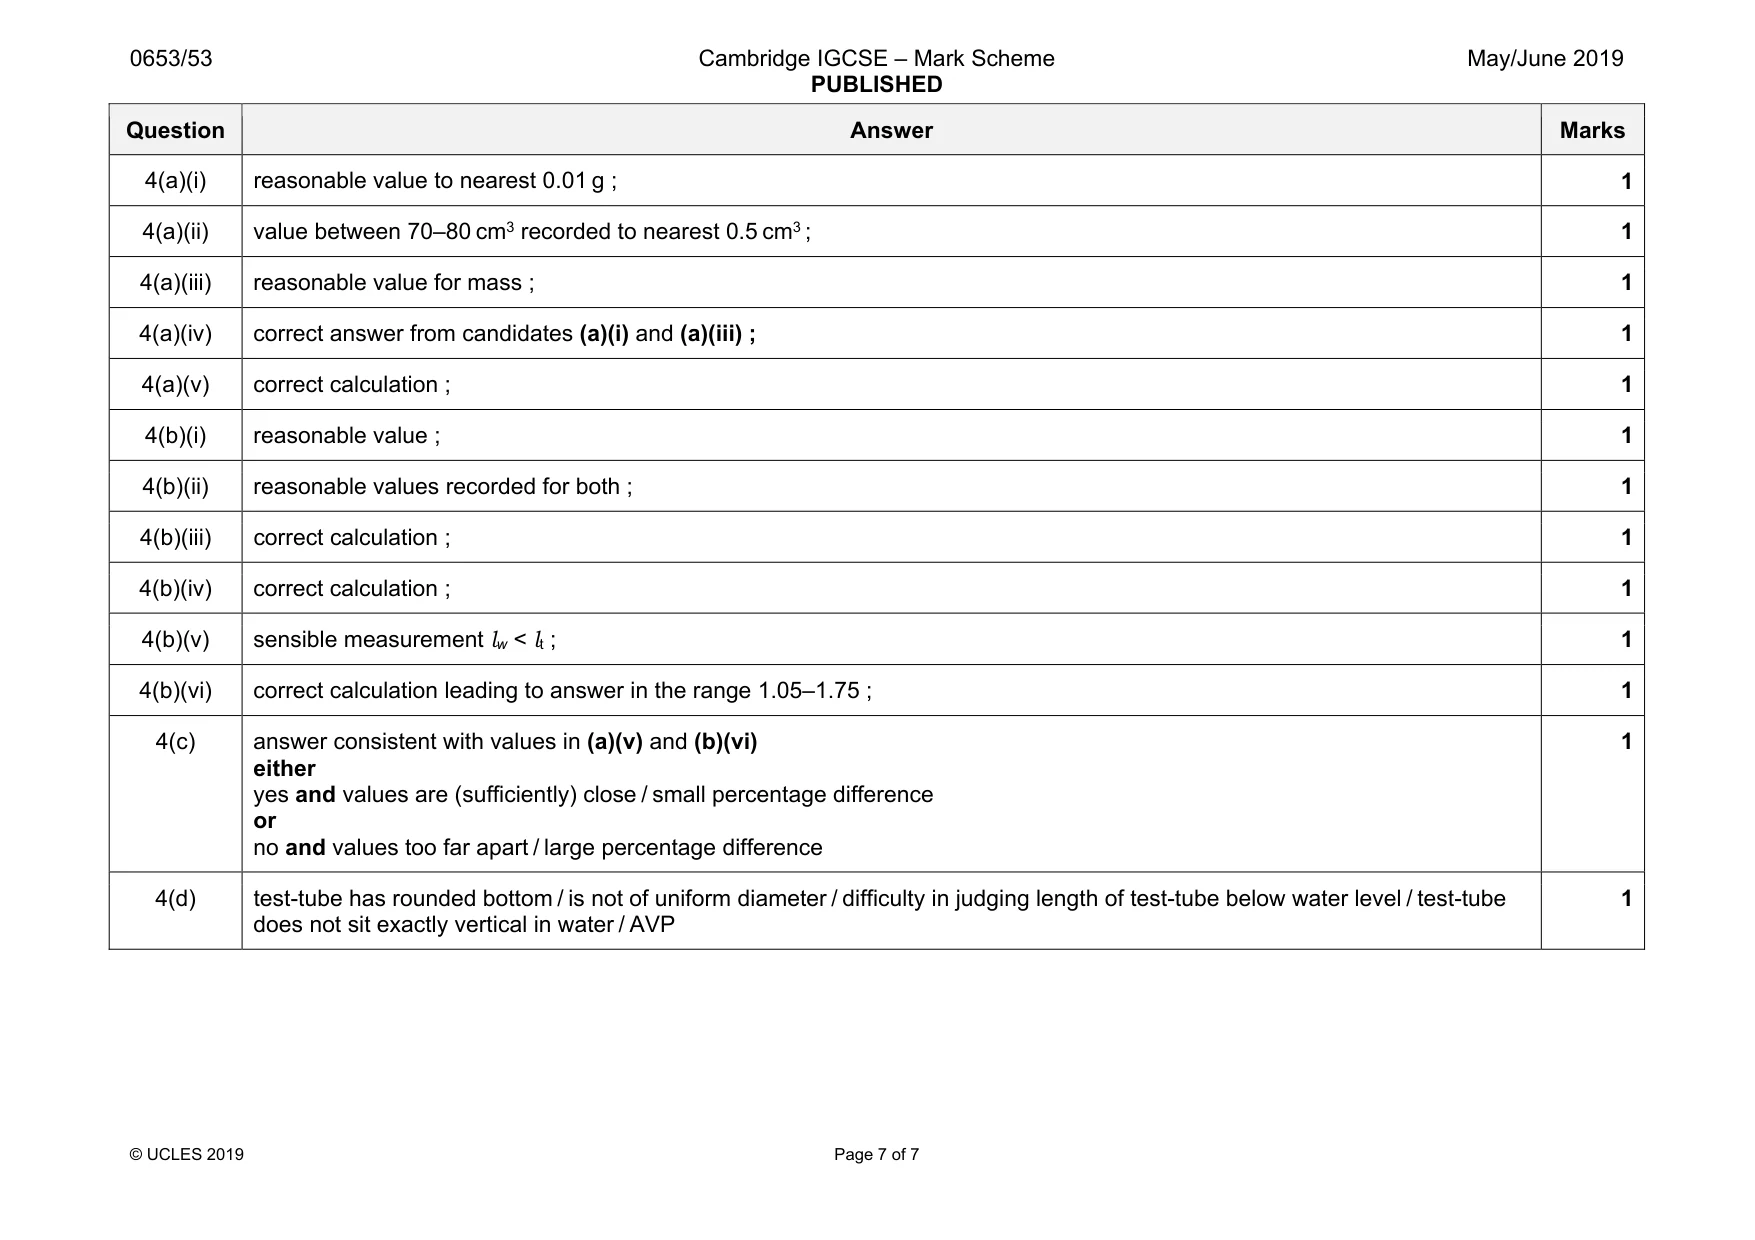
Mark scheme: 4(a)(i) reasonable value to nearest 0.01 g ; 1 4(a)(ii) value between 70–80 cm3 recorded to nearest 0.5 cm3 ; 1 4(a)(iii) reasonable value for mass ; 1 4(a)(iv) correct answer from candidates (a)(i) and (a)(iii) ; 1 4(a)(v) correct calculation ; 1 4(b)(i) reasonable value ; 1 4(b)(ii) reasonable values recorded for both ; 1 4(b)(iii) correct calculation ; 1 4(b)(iv) correct calculation ; 1 4(b)(v) sensible measurement lw < lt ; 1 4(b)(vi) correct calculation leading to answer in the range 1.05–1.75 ; 1 4(c) answer consistent with values in (a)(v) and (b)(vi) either yes and values are (sufficiently) close / small percentage difference or no and values too far apart / large percentage difference 1 4(d) test-tube has rounded bottom / is not of uniform diameter / difficulty in judging length of test-tube below water level / test-tube does not sit exactly vertical in water / AVP 1
What was in this paper
The subtopics covered by these 4 questions, and how many questions each got. Open one in a new tab to see every Cambridge question on it.
What you needed in this session
Cambridge’s own grade thresholds for 2019 May/June, Paper 5 · Variant 3. A higher threshold means an easier paper — the bar moves with how the cohort did.