Cambridge IGCSE Science - Combined 0653 — 2013 May/June Paper 5 · Variant 3
0653/53/M/J/13 · 30 marks · ≈34 min
The question paper and its mark scheme, free to read here and free to download. This is Cambridge’s own paper, exactly as it was sat.
Question paper16 pages



Mark scheme3 pages
Answers below. Sit the paper first if you are practising.
Paper as text
Question paper, page 1
This document consists of 13 printed pages and 3 blank pages. IB13 06_0653_53/FP © UCLES 2013 [Turn over *0828286396* For Examiner's Use 1 2 3 Total UNIVERSITY OF CAMBRIDGE INTERNATIONAL EXAMINATIONS International General Certificate of Secondary Education COMBINED SCIENCE 0653/53 Paper 5 Practical Test May/June 2013 1 hour 30 minutes Candidates answer on the Question Paper. Additional Materials: As listed in the Confidential Instructions READ THESE INSTRUCTIONS FIRST Write your Centre number, candidate number and name on all the work you hand in. Write in dark blue or black pen. You may use a pencil for any diagrams or graphs. Do not use staples, paper clips, glue or correction fluid. DO NOT WRITE IN ANY BARCODES. Answer all questions. Electronic calculators may be used. You may lose marks if you do not show your working or if you do not use appropriate units. Chemistry practical notes for this paper are printed on page 16. At the end of the examination, fasten all your work securely together. The number of marks is given in brackets [ ] at the end of each question or part question. www.XtremePapers.com
Question paper, page 2
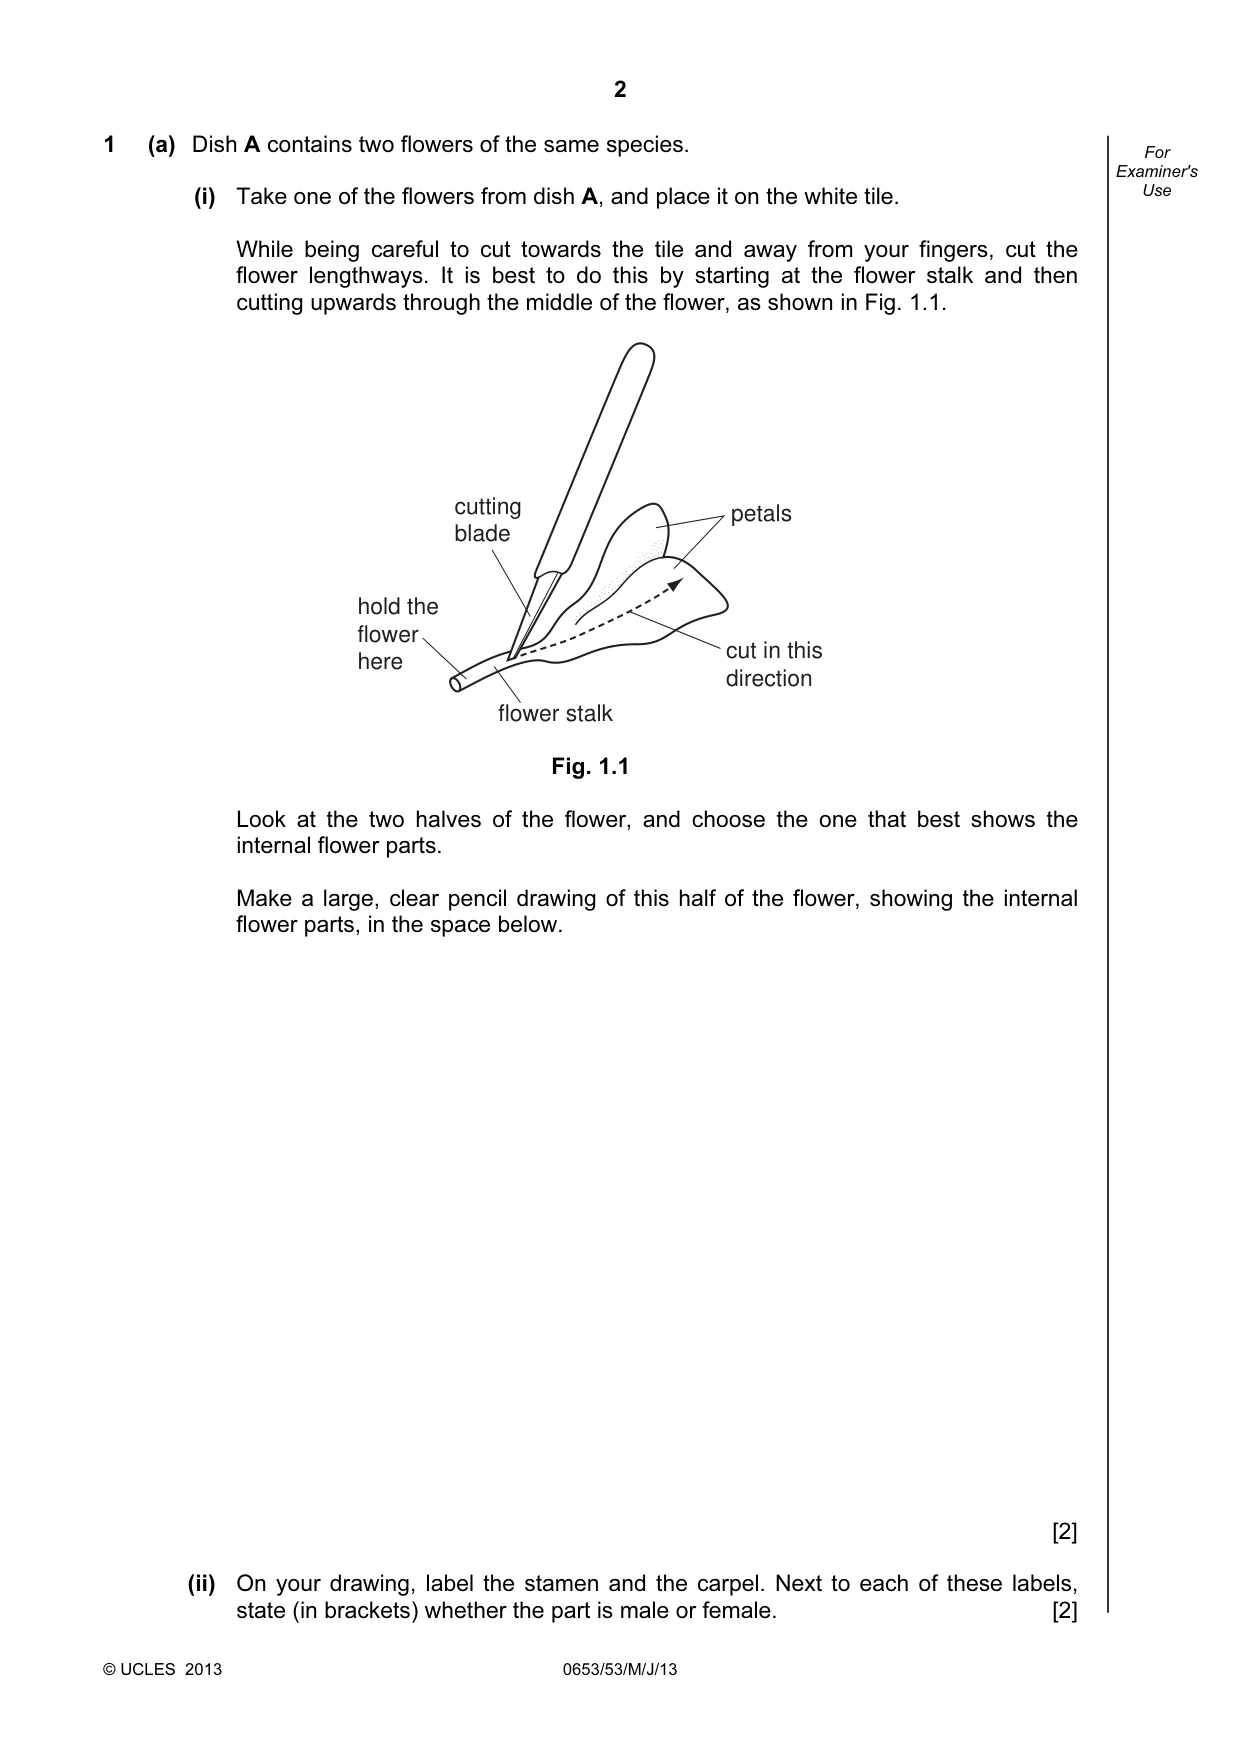
2 © UCLES 2013 0653/53/M/J/13 For Examiner's Use 1 (a) Dish A contains two flowers of the same species. (i) Take one of the flowers from dish A, and place it on the white tile. While being careful to cut towards the tile and away from your fingers, cut the flower lengthways. It is best to do this by starting at the flower stalk and then cutting upwards through the middle of the flower, as shown in Fig. 1.1. cutting blade hold the flower here flower stalk cut in this direction petals Fig. 1.1 Look at the two halves of the flower, and choose the one that best shows the internal flower parts. Make a large, clear pencil drawing of this half of the flower, showing the internal flower parts, in the space below. [2] (ii) On your drawing, label the stamen and the carpel. Next to each of these labels, state (in brackets) whether the part is male or female. [2]
Question paper, page 3
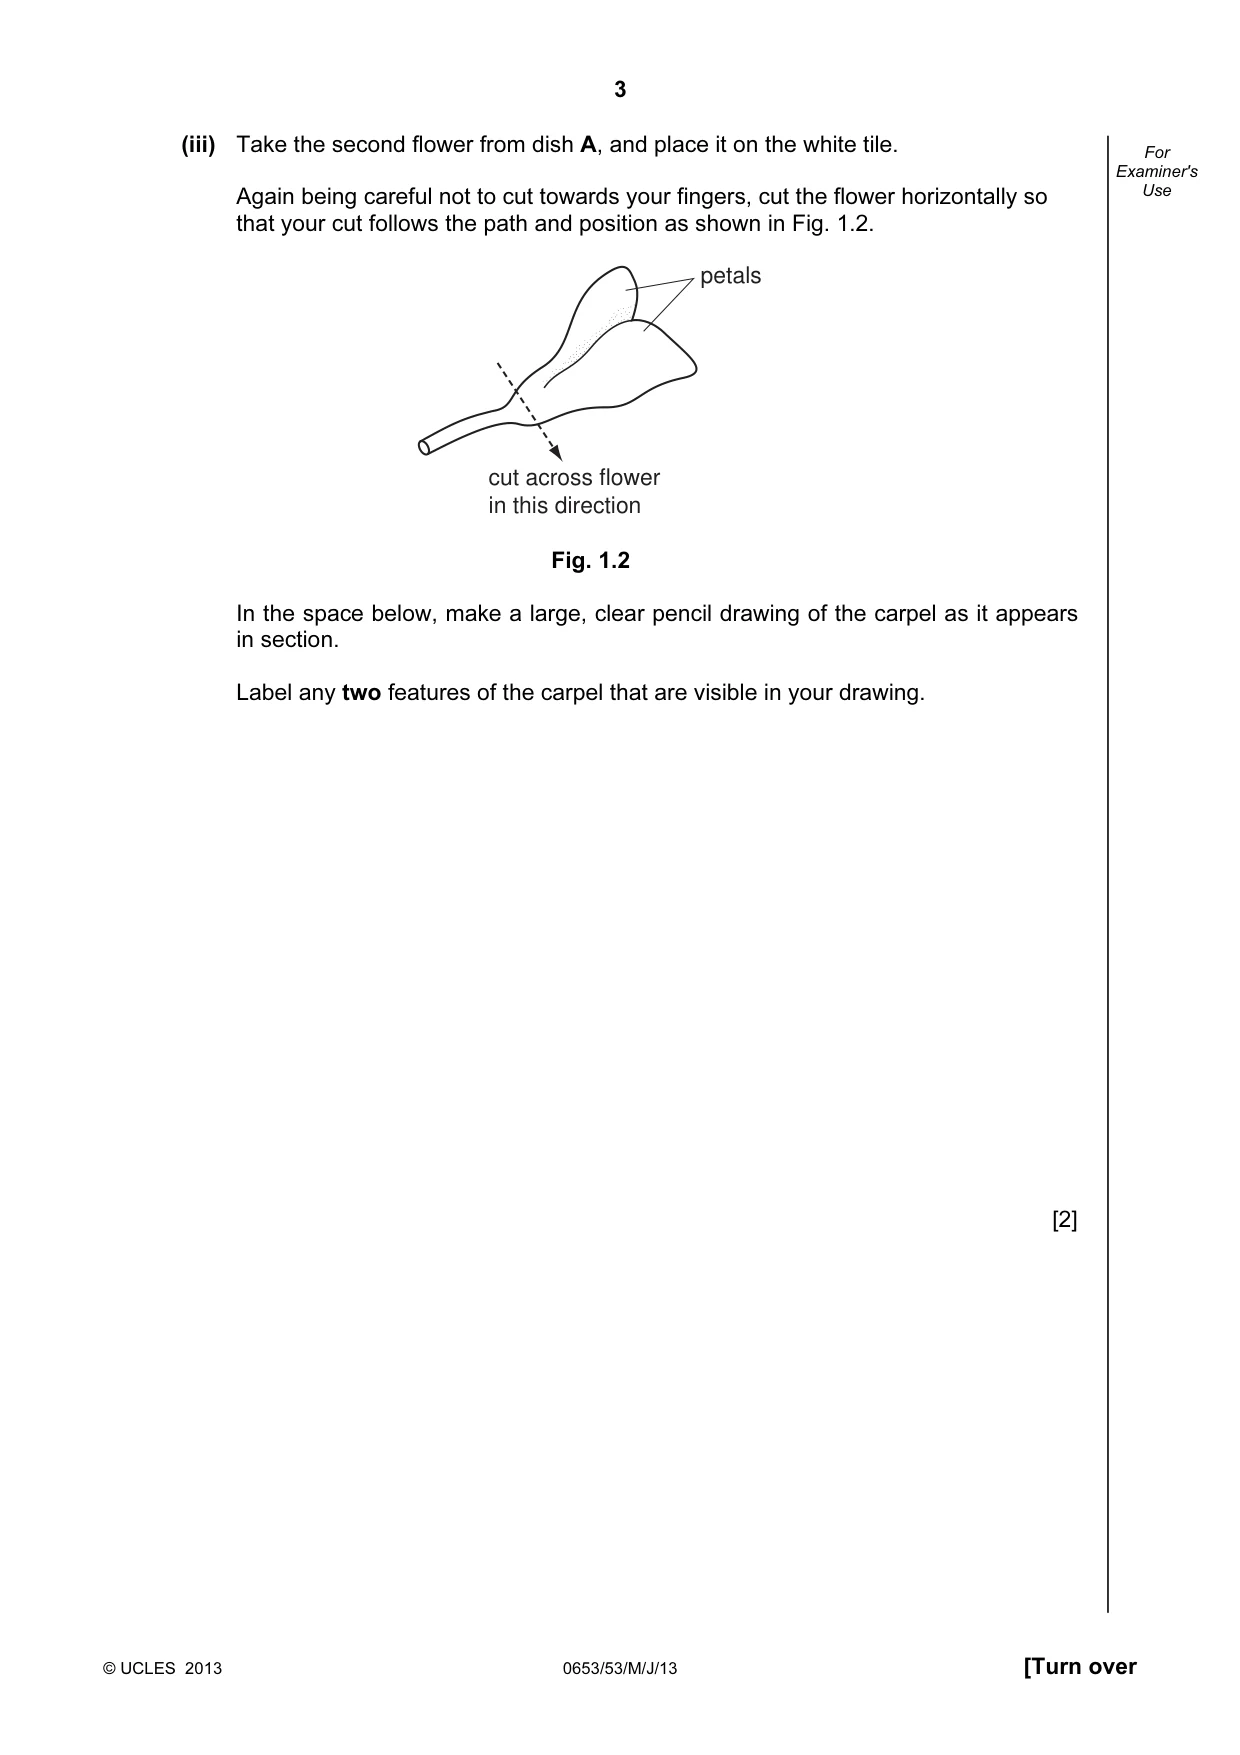
3 © UCLES 2013 0653/53/M/J/13 [Turn over For Examiner's Use (iii) Take the second flower from dish A, and place it on the white tile. Again being careful not to cut towards your fingers, cut the flower horizontally so that your cut follows the path and position as shown in Fig. 1.2. cut across flower in this direction petals Fig. 1.2 In the space below, make a large, clear pencil drawing of the carpel as it appears in section. Label any two features of the carpel that are visible in your drawing. [2]
Question paper, page 4
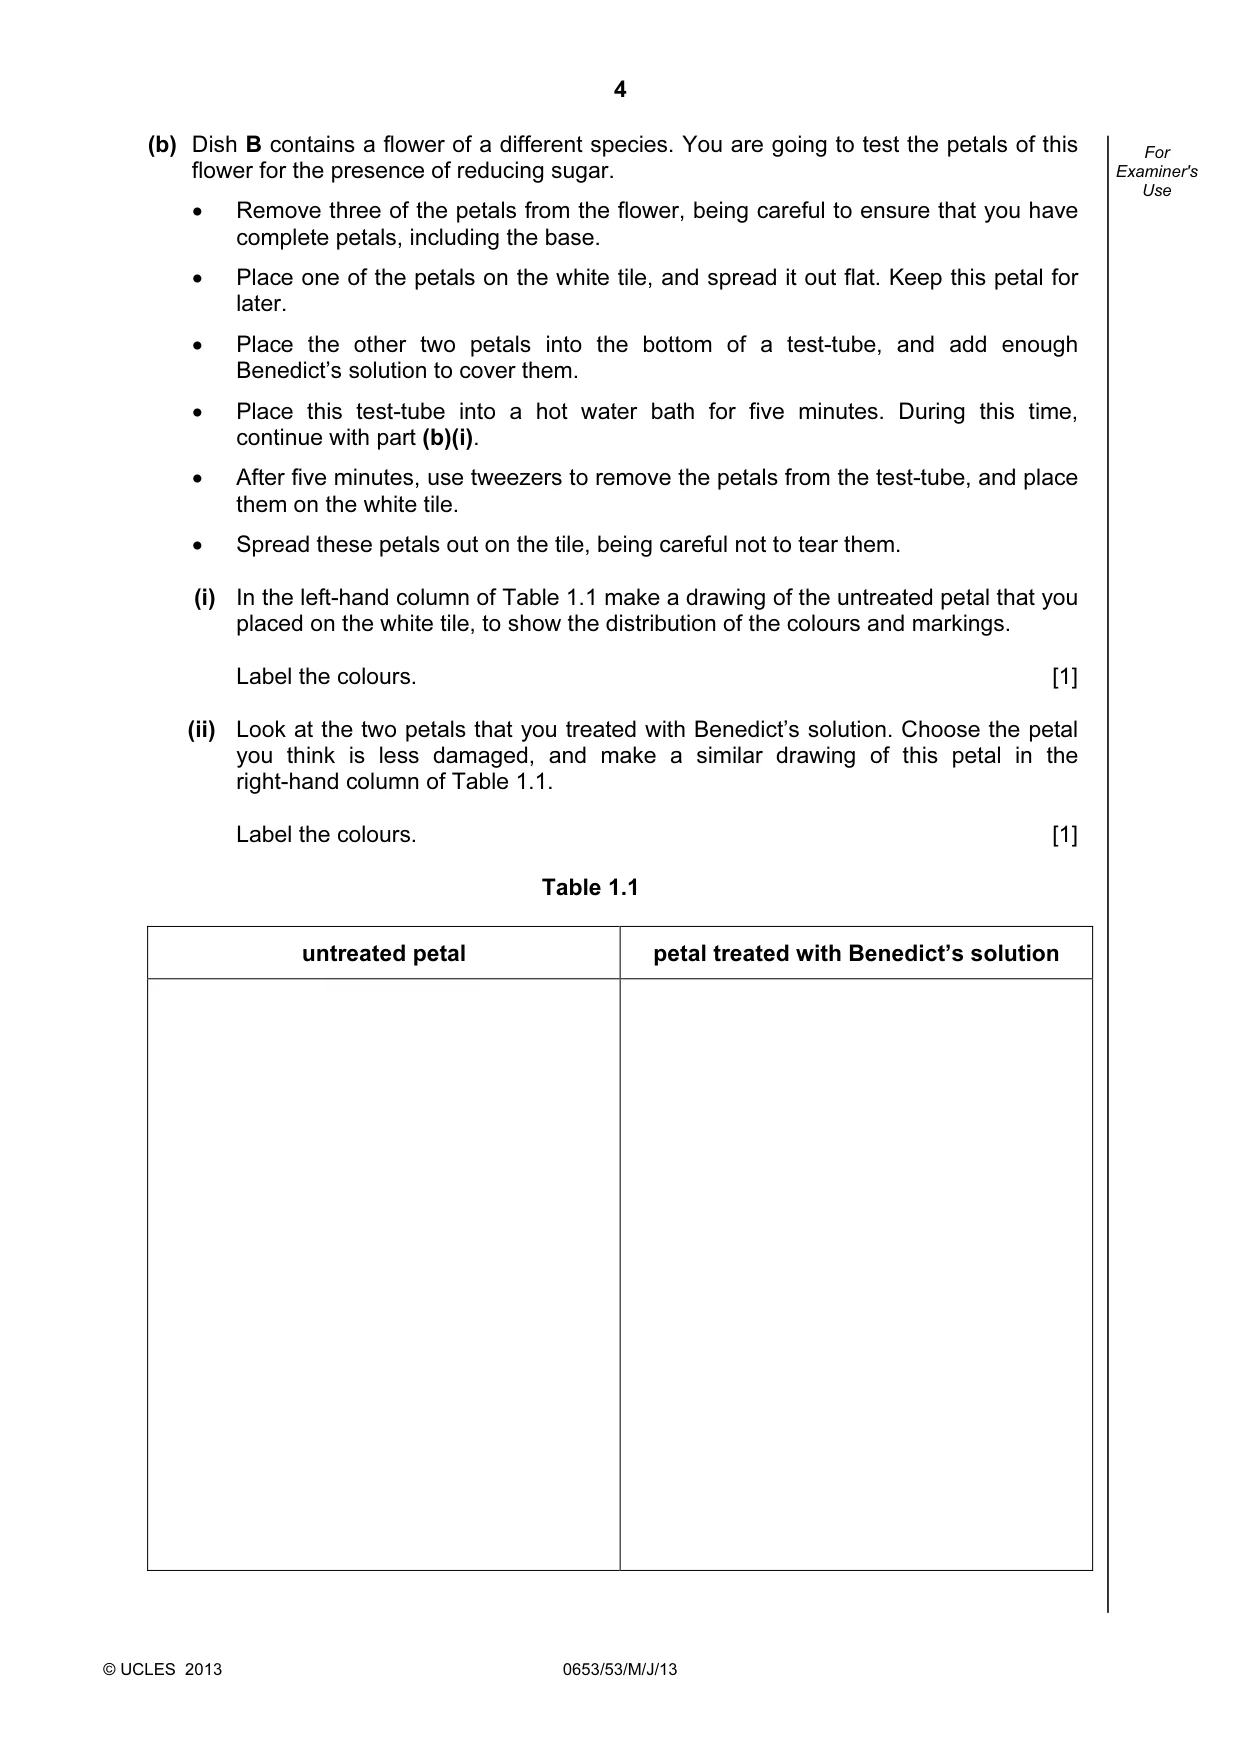
4 © UCLES 2013 0653/53/M/J/13 For Examiner's Use (b) Dish B contains a flower of a different species. You are going to test the petals of this flower for the presence of reducing sugar. • Remove three of the petals from the flower, being careful to ensure that you have complete petals, including the base. • Place one of the petals on the white tile, and spread it out flat. Keep this petal for later. • Place the other two petals into the bottom of a test-tube, and add enough Benedict’s solution to cover them. • Place this test-tube into a hot water bath for five minutes. During this time, continue with part (b)(i). • After five minutes, use tweezers to remove the petals from the test-tube, and place them on the white tile. • Spread these petals out on the tile, being careful not to tear them. (i) In the left-hand column of Table 1.1 make a drawing of the untreated petal that you placed on the white tile, to show the distribution of the colours and markings. Label the colours. [1] (ii) Look at the two petals that you treated with Benedict’s solution. Choose the petal you think is less damaged, and make a similar drawing of this petal in the right-hand column of Table 1.1. Label the colours. [1] Table 1.1 untreated petal petal treated with Benedict’s solution
Question paper, page 5
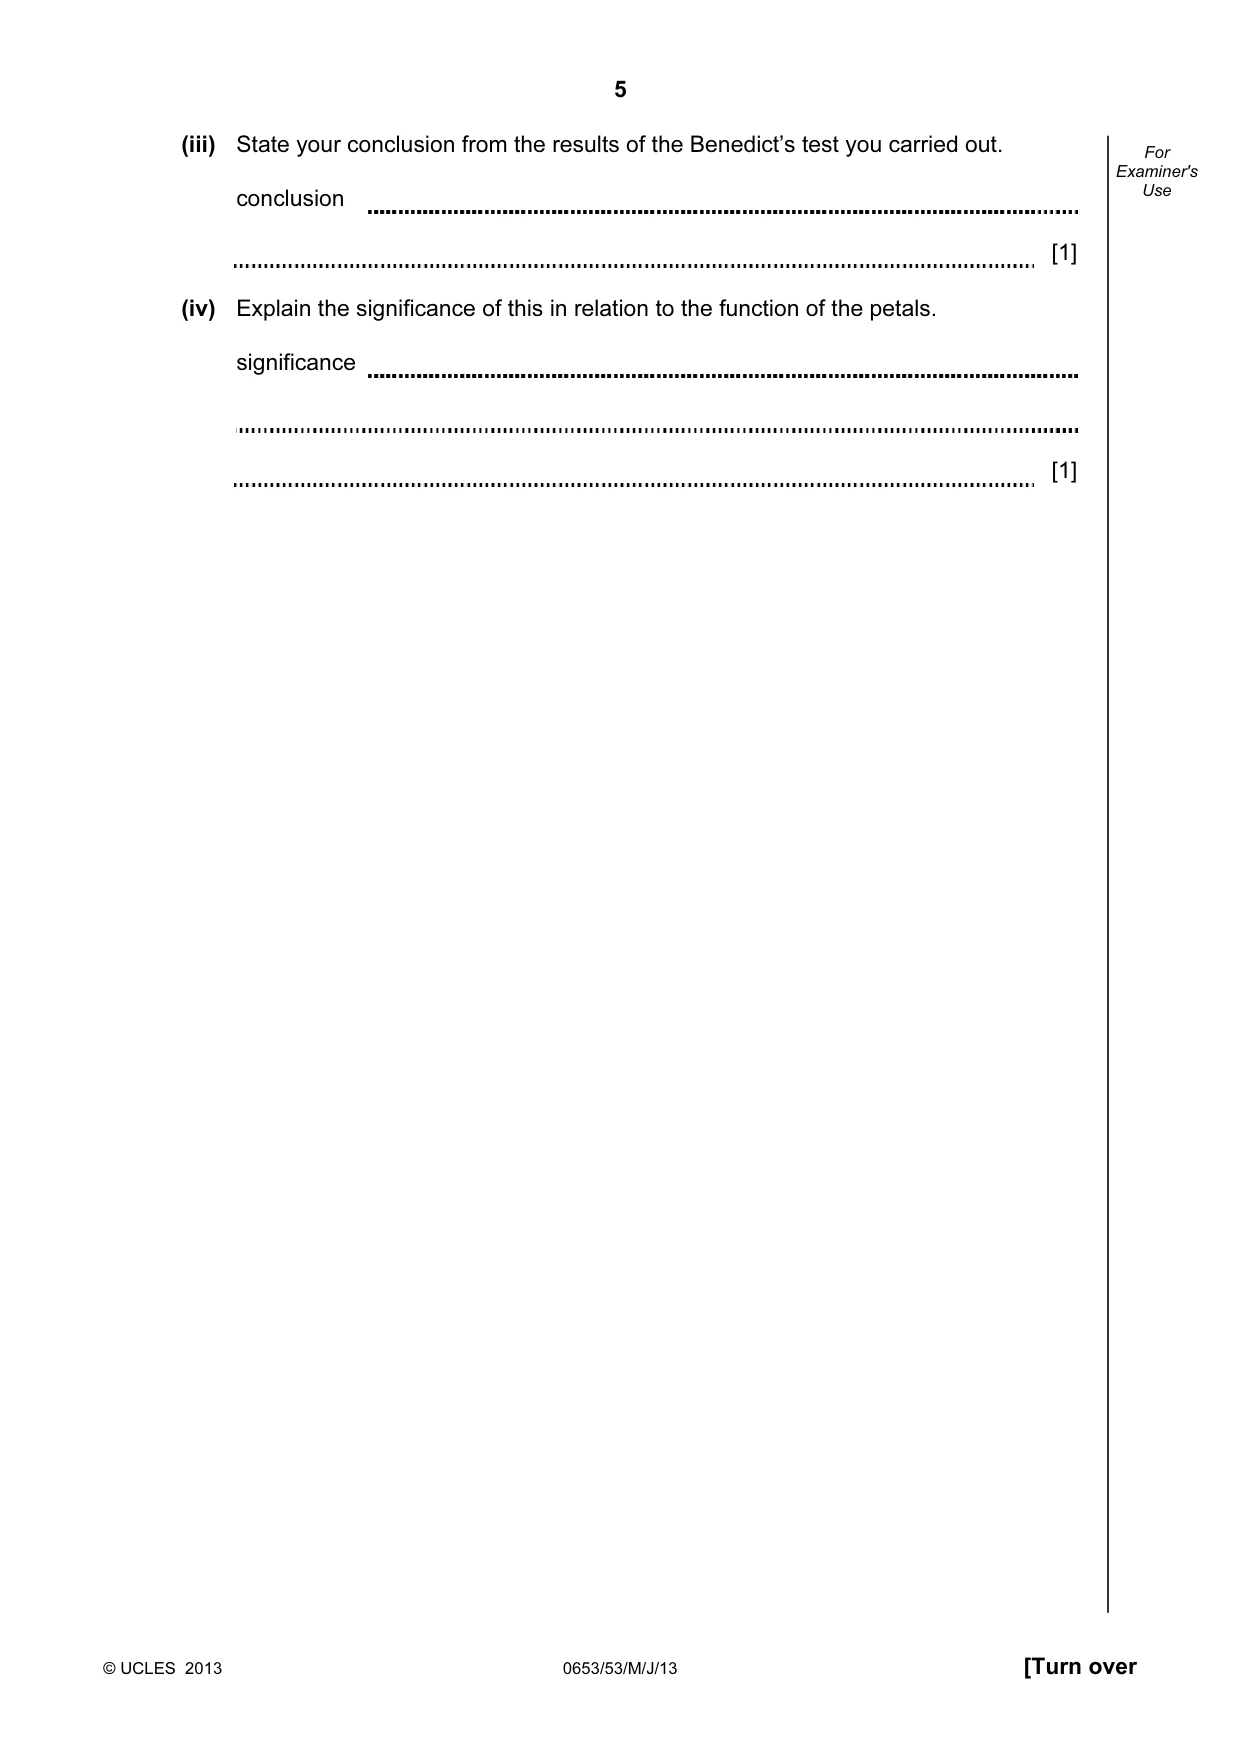
5 © UCLES 2013 0653/53/M/J/13 [Turn over For Examiner's Use (iii) State your conclusion from the results of the Benedict’s test you carried out. conclusion [1] (iv) Explain the significance of this in relation to the function of the petals. significance [1]
Question paper, page 6
6 © UCLES 2013 0653/53/M/J/13 BLANK PAGE
Question paper, page 7
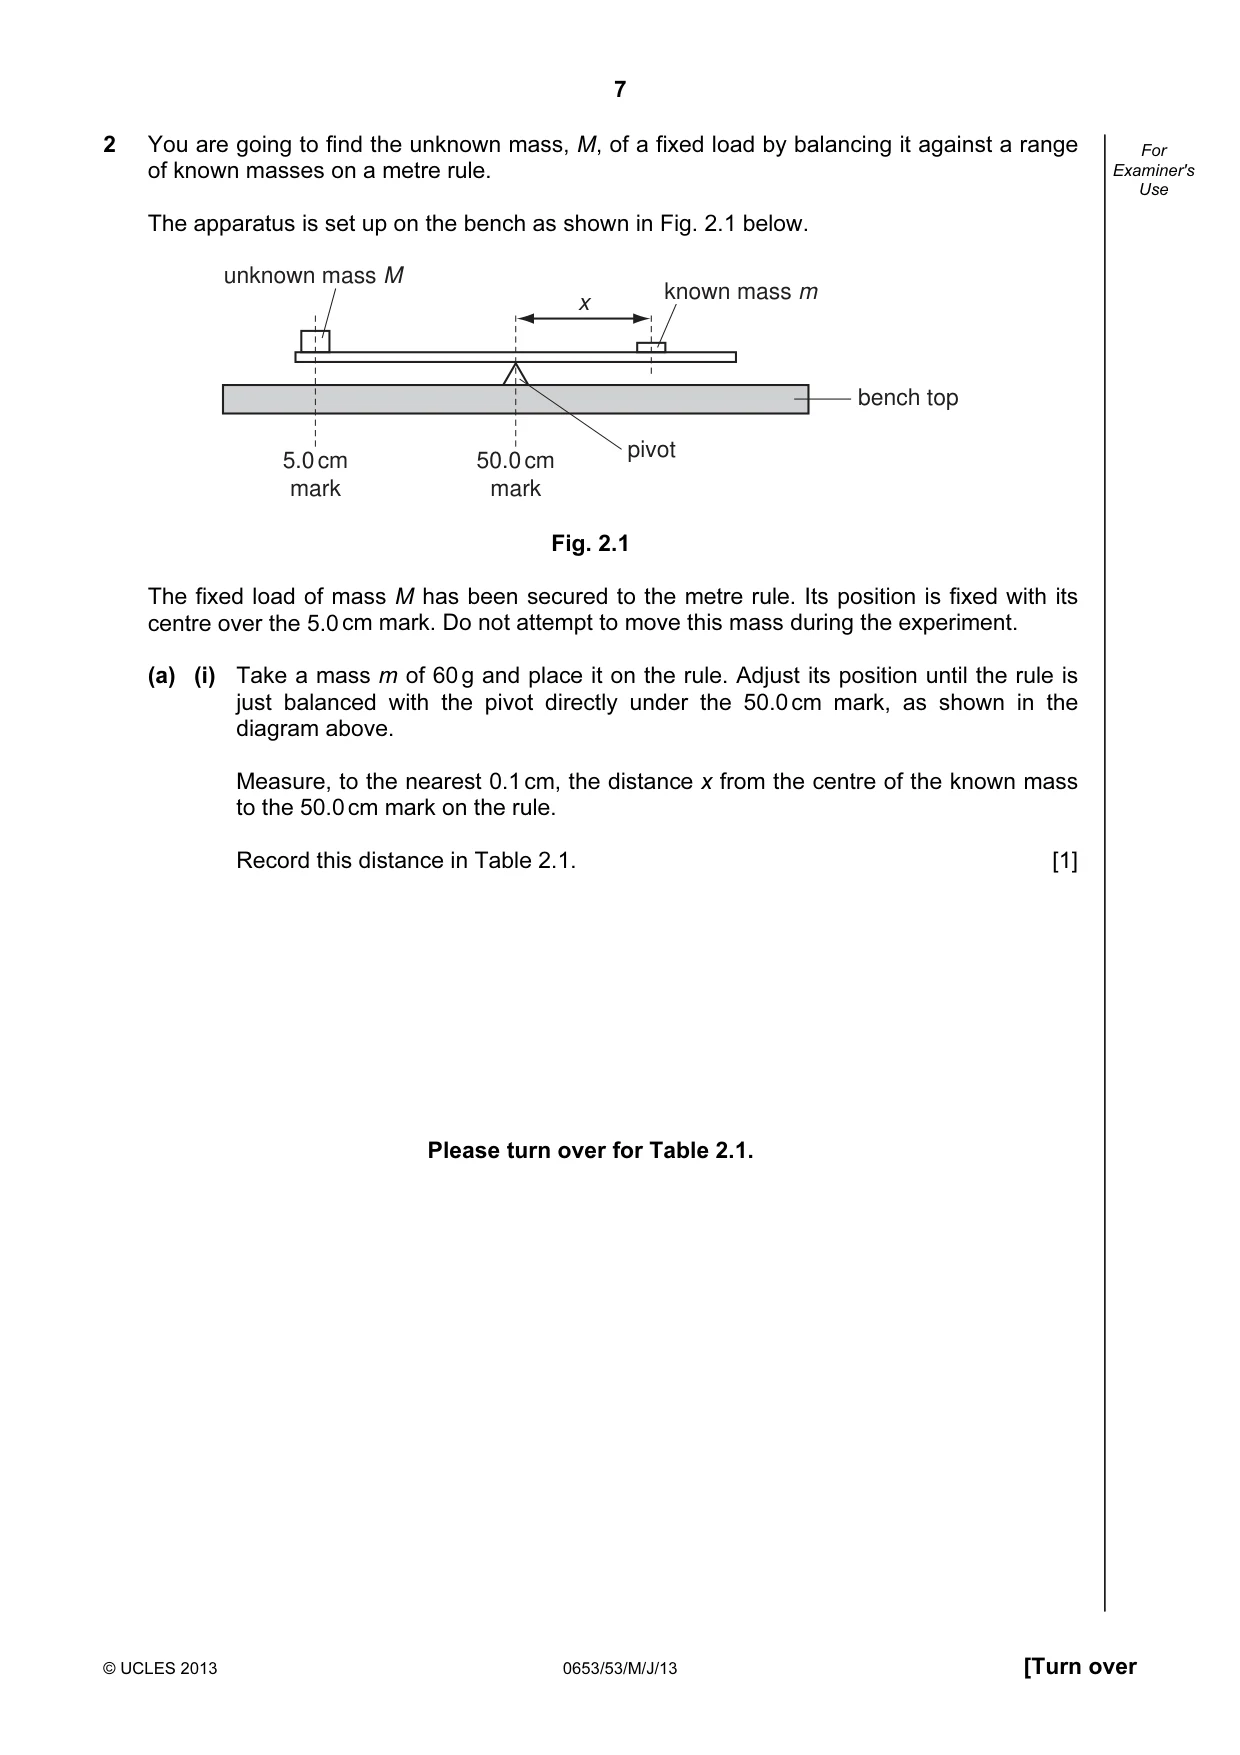
7 © UCLES 2013 0653/53/M/J/13 [Turn over For Examiner's Use 2 You are going to find the unknown mass, M, of a fixed load by balancing it against a range of known masses on a metre rule. The apparatus is set up on the bench as shown in Fig. 2.1 below. unknown mass M known mass m x pivot 5.0 cm mark 50.0 cm mark bench top Fig. 2.1 The fixed load of mass M has been secured to the metre rule. Its position is fixed with its centre over the 5.0 cm mark. Do not attempt to move this mass during the experiment. (a) (i) Take a mass m of 60 g and place it on the rule. Adjust its position until the rule is just balanced with the pivot directly under the 50.0 cm mark, as shown in the diagram above. Measure, to the nearest 0.1 cm, the distance x from the centre of the known mass to the 50.0 cm mark on the rule. Record this distance in Table 2.1. [1] Please turn over for Table 2.1.
Question paper, page 8
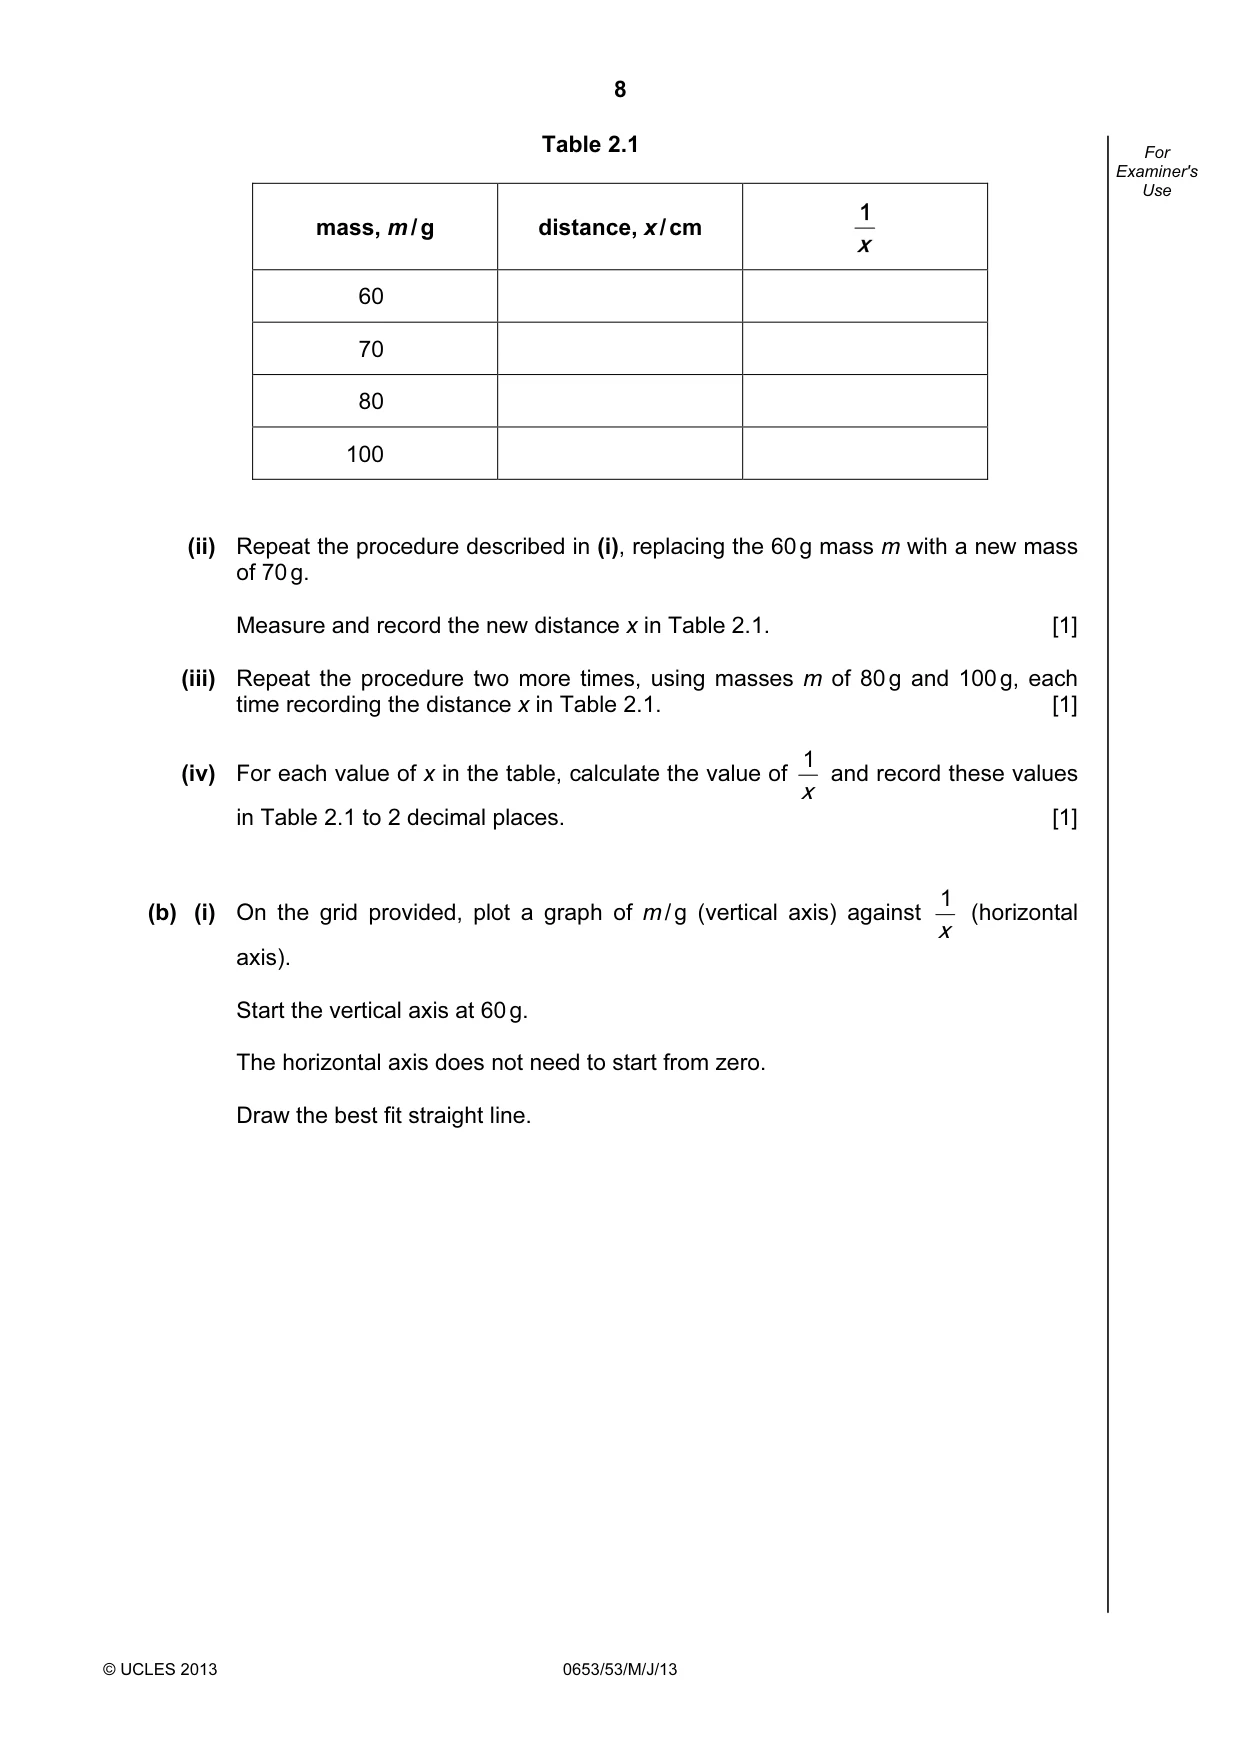
8 © UCLES 2013 0653/53/M/J/13 For Examiner's Use Table 2.1 mass, m / g distance, x / cm x 1 60 70 80 100 (ii) Repeat the procedure described in (i), replacing the 60 g mass m with a new mass of 70 g. Measure and record the new distance x in Table 2.1. [1] (iii) Repeat the procedure two more times, using masses m of 80 g and 100 g, each time recording the distance x in Table 2.1. [1] (iv) For each value of x in the table, calculate the value of x 1 and record these values in Table 2.1 to 2 decimal places. [1] (b) (i) On the grid provided, plot a graph of m / g (vertical axis) against x 1 (horizontal axis). Start the vertical axis at 60 g. The horizontal axis does not need to start from zero. Draw the best fit straight line.
Question paper, page 9
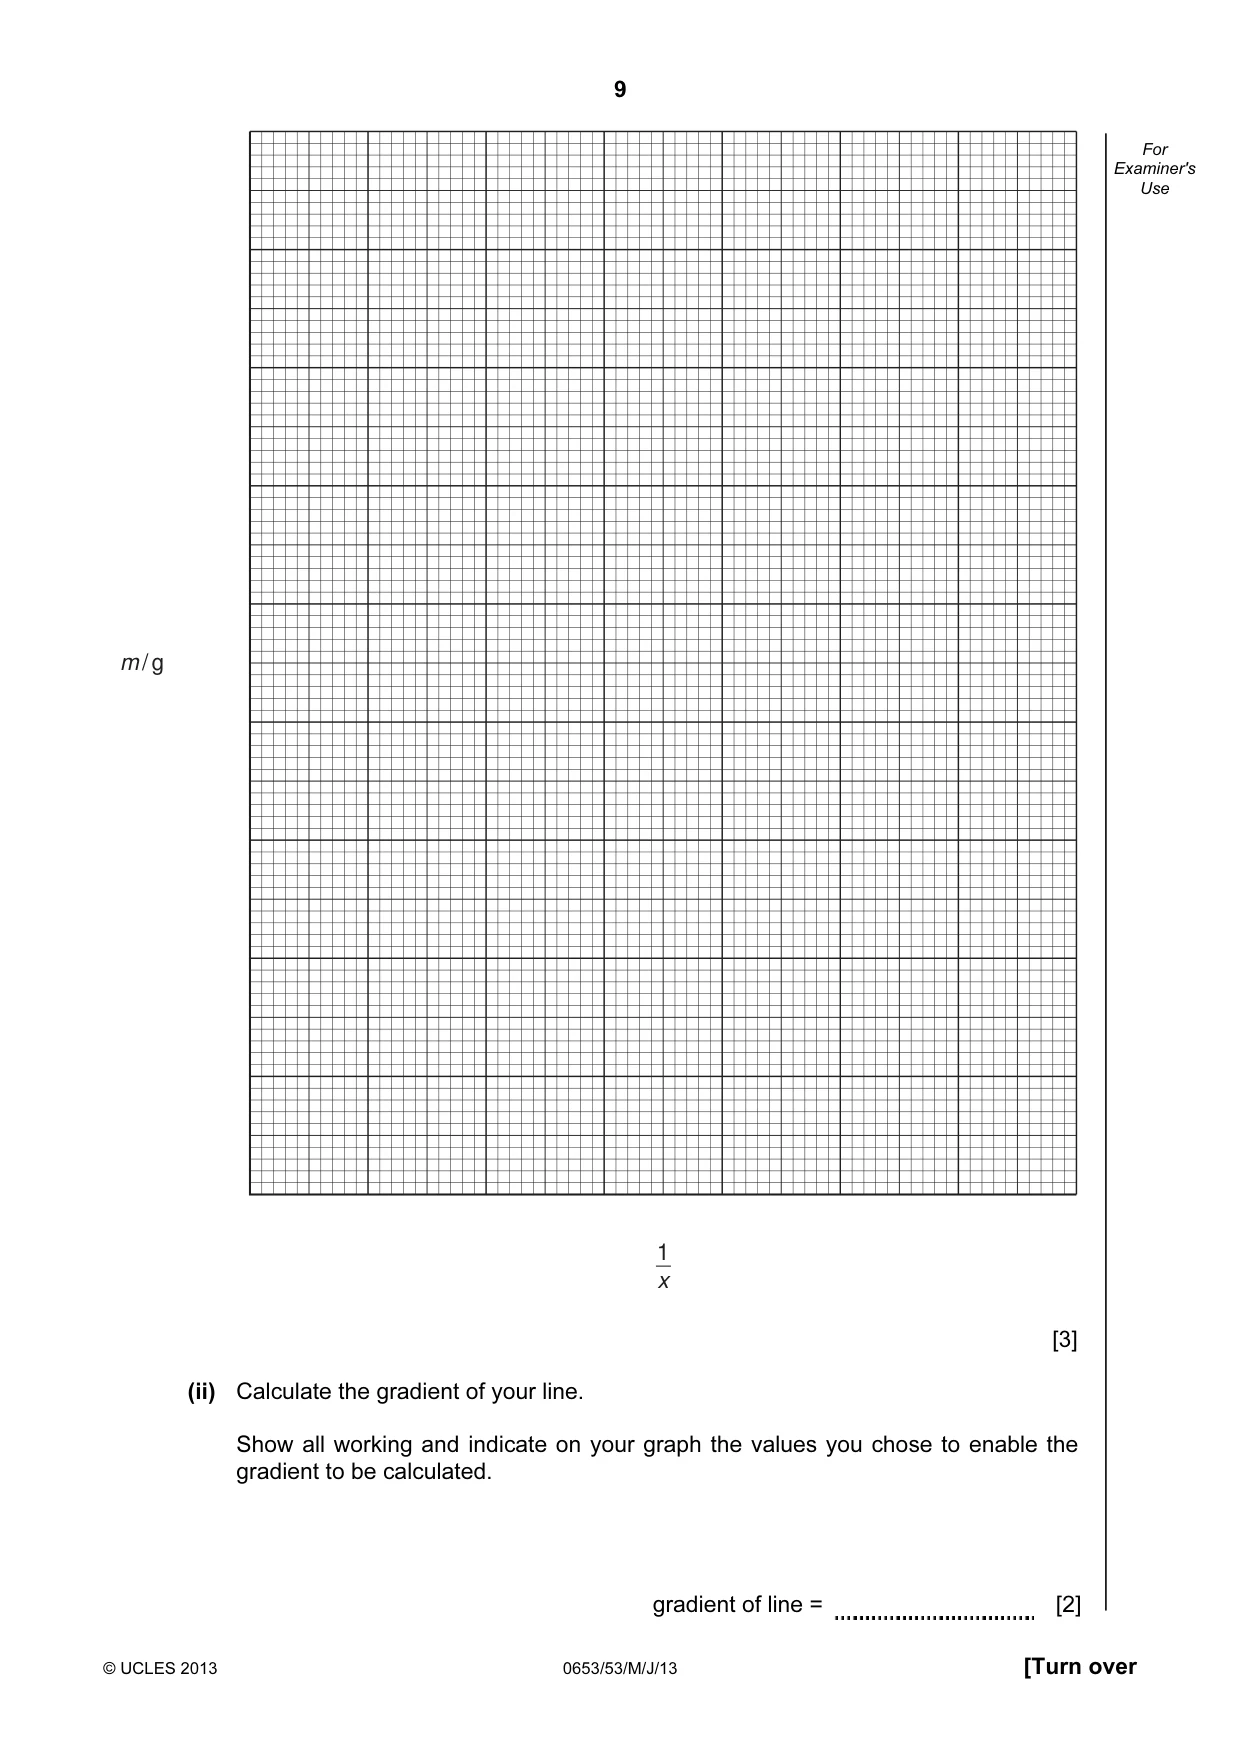
9 © UCLES 2013 0653/53/M/J/13 [Turn over For Examiner's Use m / g 1 x [3] (ii) Calculate the gradient of your line. Show all working and indicate on your graph the values you chose to enable the gradient to be calculated. gradient of line = [2]
Question paper, page 10
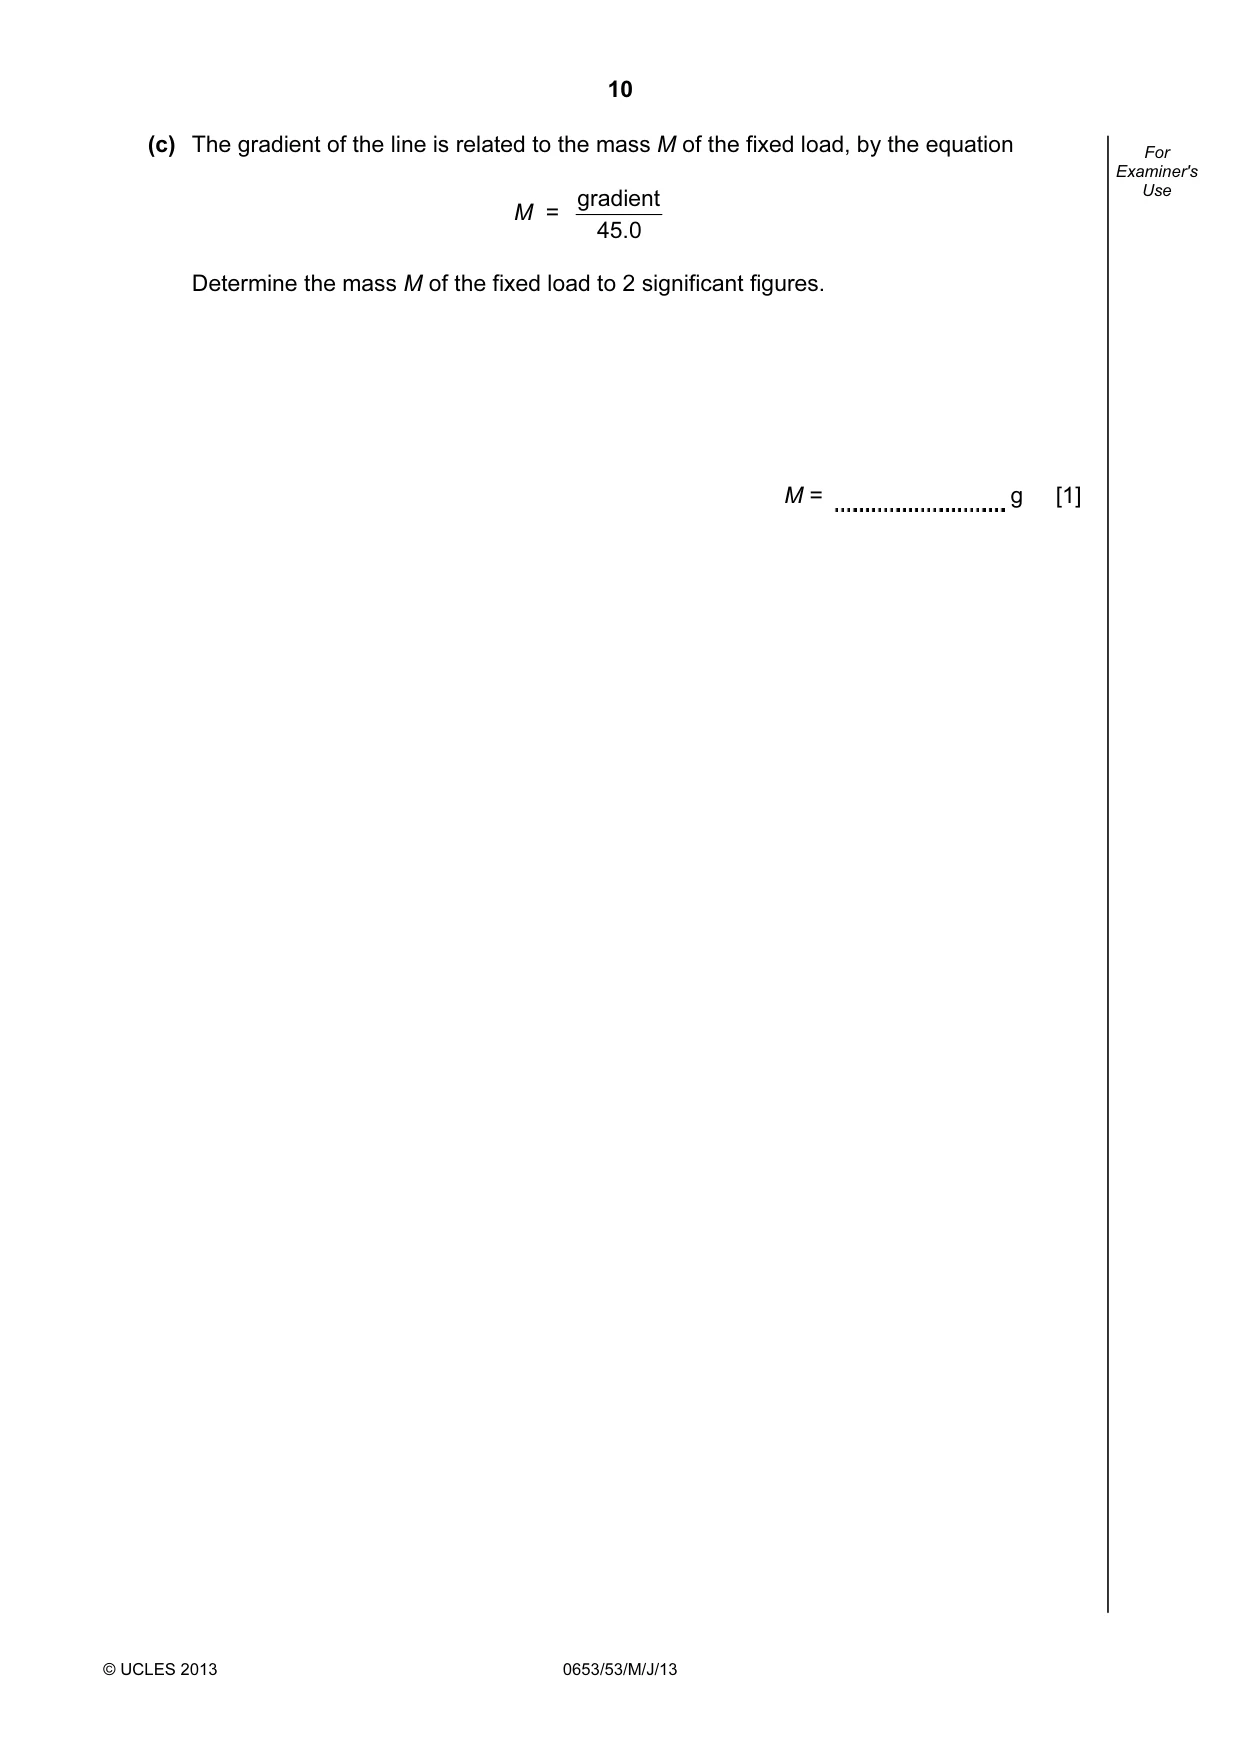
10 © UCLES 2013 0653/53/M/J/13 For Examiner's Use (c) The gradient of the line is related to the mass M of the fixed load, by the equation M = 0 . 45 gradient Determine the mass M of the fixed load to 2 significant figures. M = g [1]
Question paper, page 11
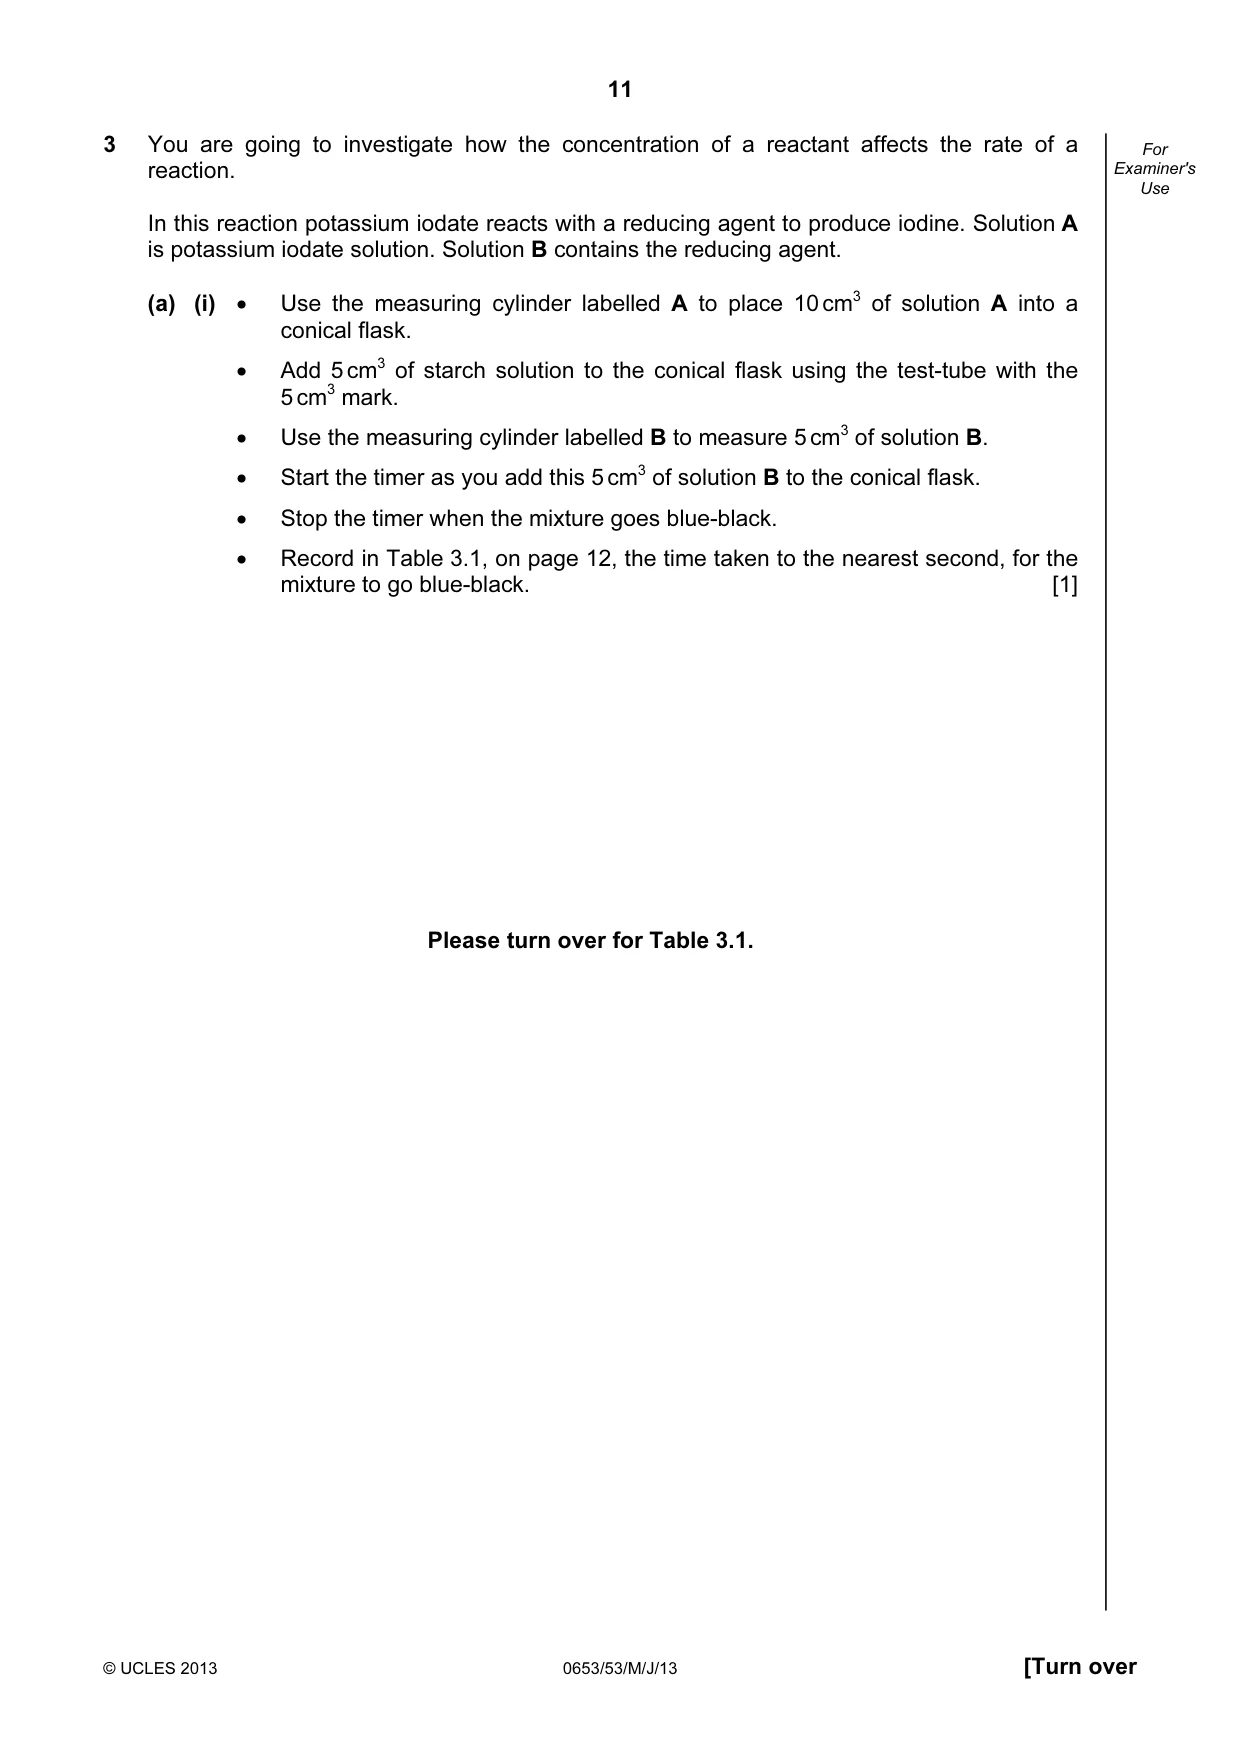
11 © UCLES 2013 0653/53/M/J/13 [Turn over For Examiner's Use 3 You are going to investigate how the concentration of a reactant affects the rate of a reaction. In this reaction potassium iodate reacts with a reducing agent to produce iodine. Solution A is potassium iodate solution. Solution B contains the reducing agent. (a) (i) • Use the measuring cylinder labelled A to place 10 cm3 of solution A into a conical flask. • Add 5 cm3 of starch solution to the conical flask using the test-tube with the 5 cm3 mark. • Use the measuring cylinder labelled B to measure 5 cm3 of solution B. • Start the timer as you add this 5 cm3 of solution B to the conical flask. • Stop the timer when the mixture goes blue-black. • Record in Table 3.1, on page 12, the time taken to the nearest second, for the mixture to go blue-black. [1] Please turn over for Table 3.1.
Question paper, page 12
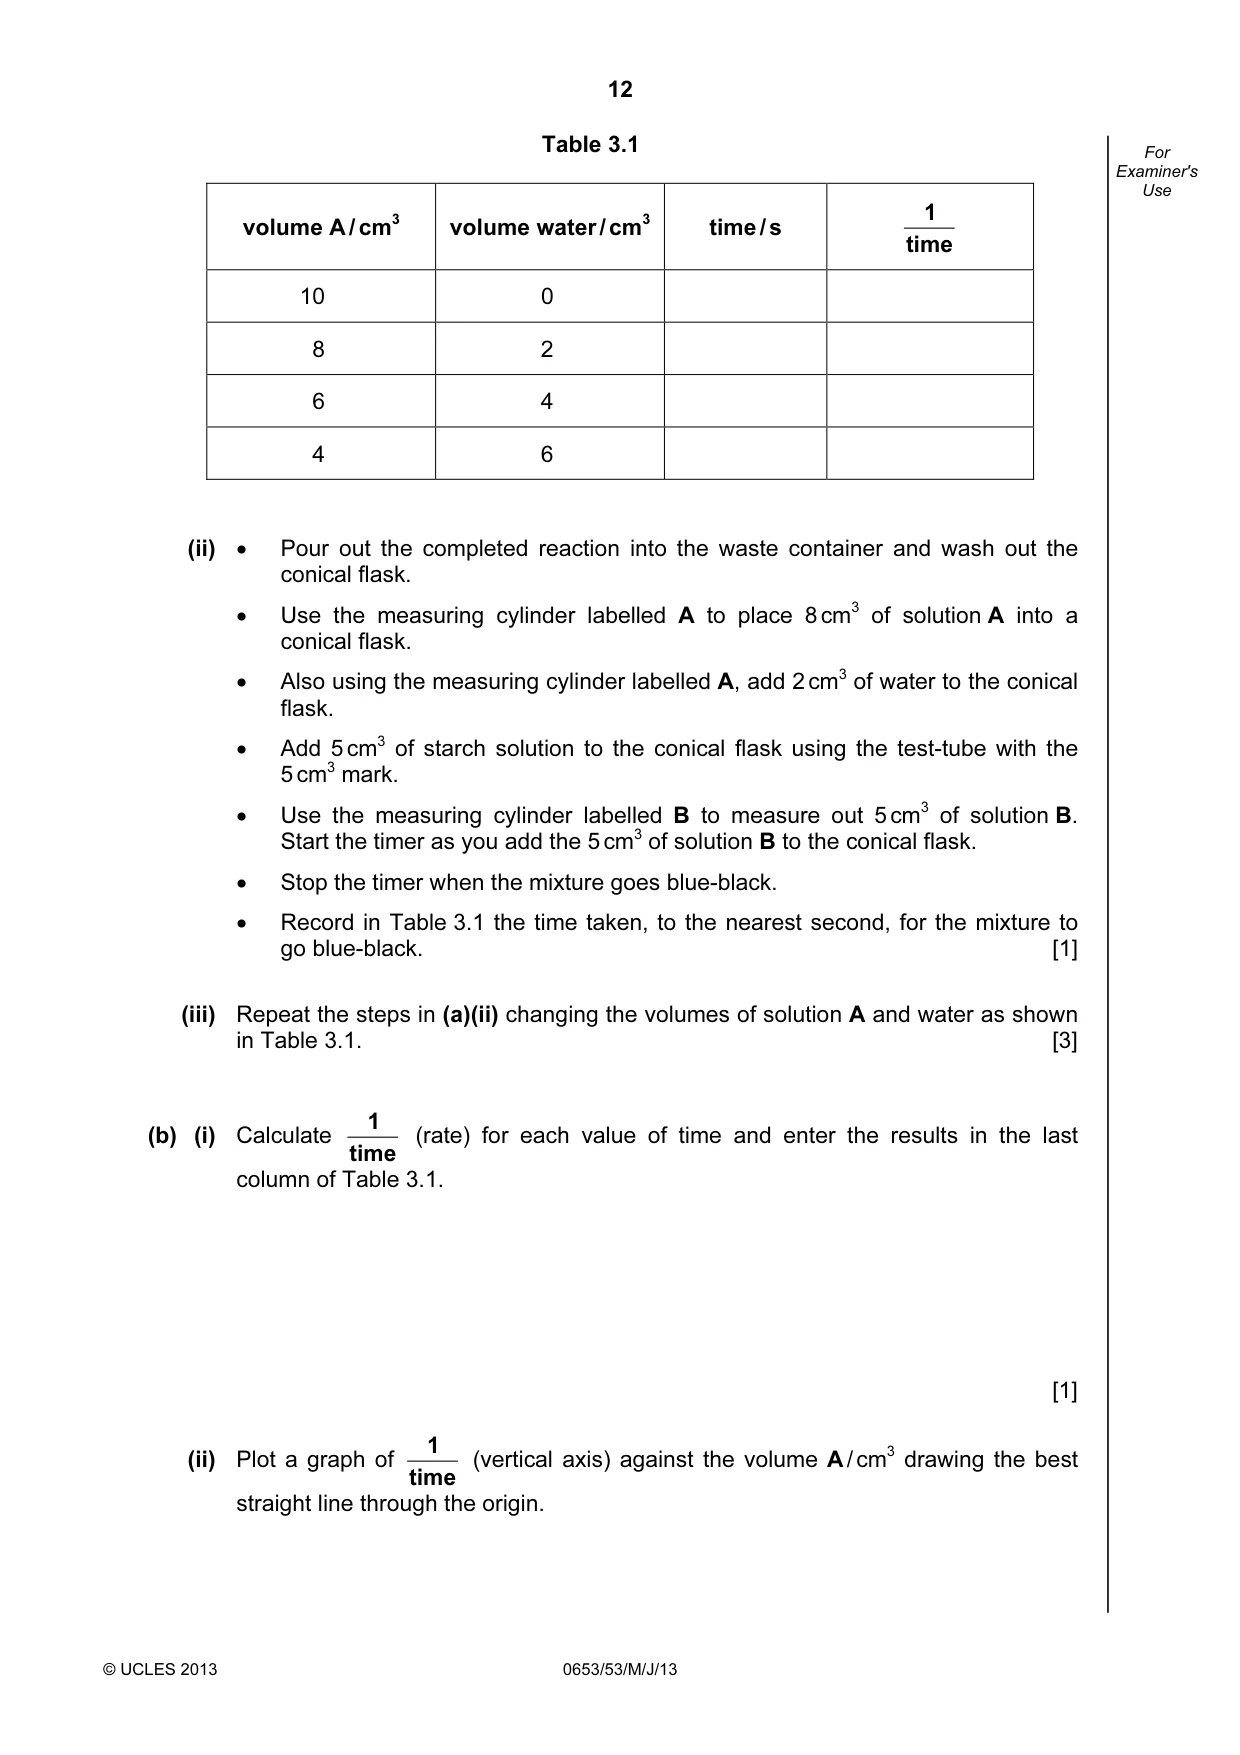
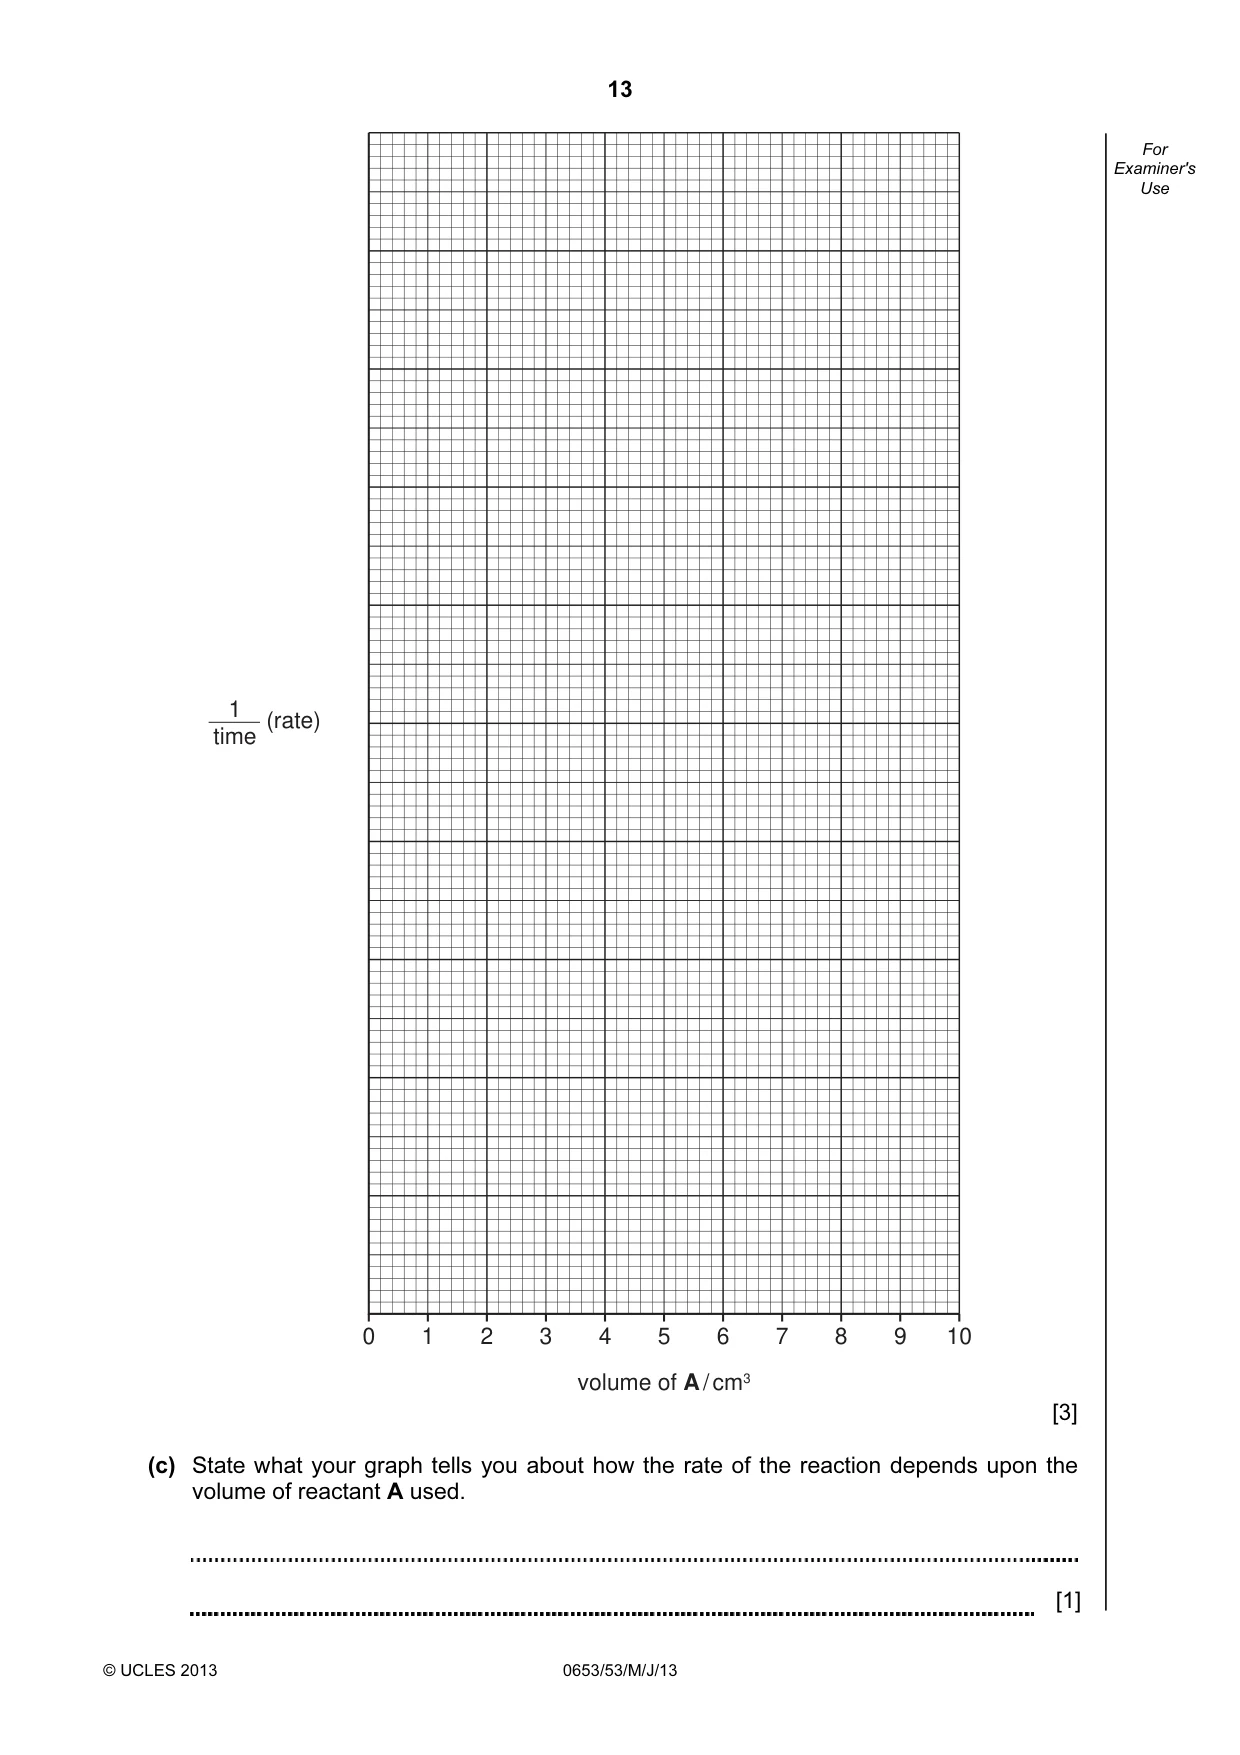
12 © UCLES 2013 0653/53/M/J/13 For Examiner's Use Table 3.1 volume A / cm3 volume water / cm3 time / s time 1 10 0 8 2 6 4 4 6 (ii) • Pour out the completed reaction into the waste container and wash out the conical flask. • Use the measuring cylinder labelled A to place 8 cm3 of solution A into a conical flask. • Also using the measuring cylinder labelled A, add 2 cm3 of water to the conical flask. • Add 5 cm3 of starch solution to the conical flask using the test-tube with the 5 cm3 mark. • Use the measuring cylinder labelled B to measure out 5 cm3 of solution B. Start the timer as you add the 5 cm3 of solution B to the conical flask. • Stop the timer when the mixture goes blue-black. • Record in Table 3.1 the time taken, to the nearest second, for the mixture to go blue-black. [1] (iii) Repeat the steps in (a)(ii) changing the volumes of solution A and water as shown in Table 3.1. [3] (b) (i) Calculate time 1 (rate) for each value of time and enter the results in the last column of Table 3.1. [1] (ii) Plot a graph of time 1 (vertical axis) against the volume A / cm3 drawing the best straight line through the origin.
Question paper, page 13
13 © UCLES 2013 0653/53/M/J/13 For Examiner's Use 0 1 2 3 4 5 volume of A / cm3 (rate) 6 7 8 9 10 1 time [3] (c) State what your graph tells you about how the rate of the reaction depends upon the volume of reactant A used. [1]
Question paper, page 14
14 © UCLES 2013 0653/53/M/J/13 BLANK PAGE
Question paper, page 15
15 © UCLES 2013 0653/53/M/J/13 BLANK PAGE
Question paper, page 16
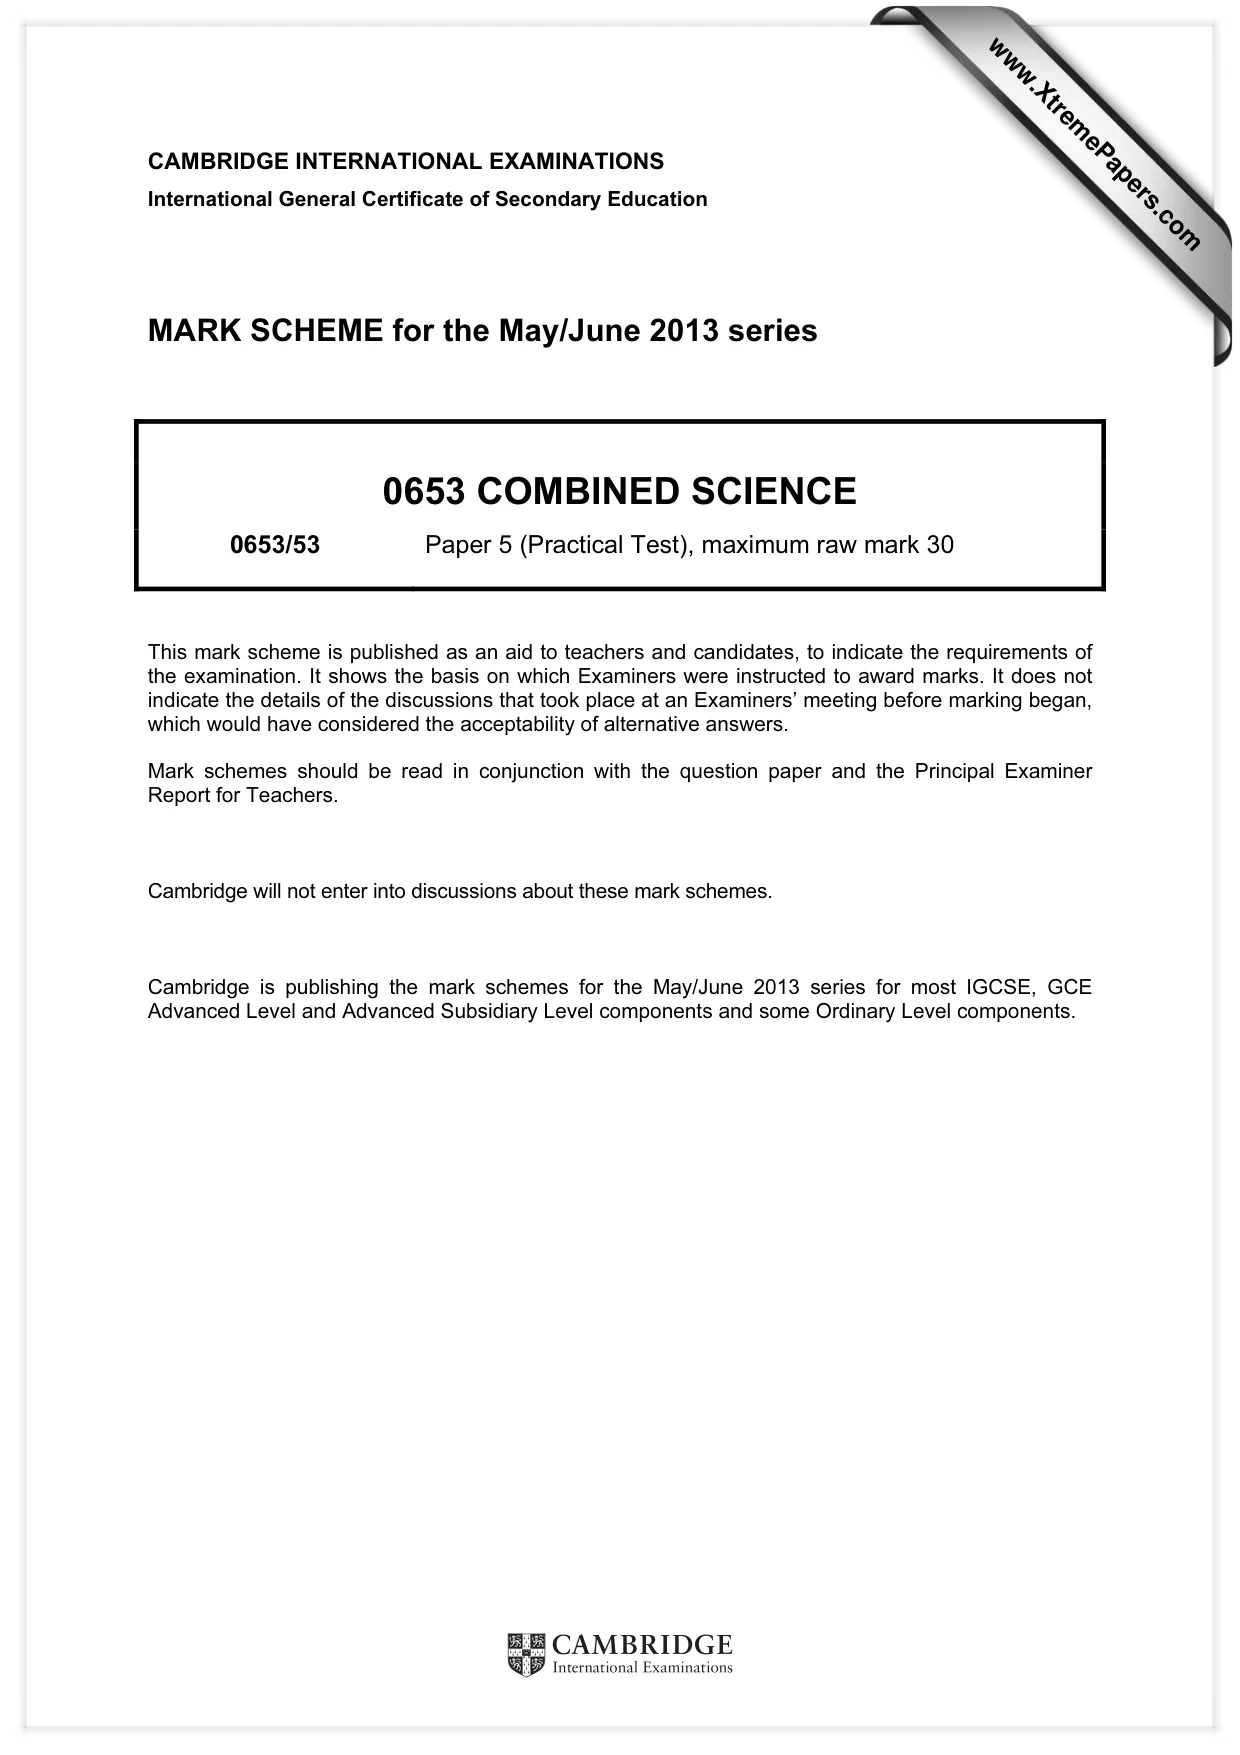
16 Permission to reproduce items where third-party owned material protected by copyright is included has been sought and cleared where possible. Every reasonable effort has been made by the publisher (UCLES) to trace copyright holders, but if any items requiring clearance have unwittingly been included, the publisher will be pleased to make amends at the earliest possible opportunity. University of Cambridge International Examinations is part of the Cambridge Assessment Group. Cambridge Assessment is the brand name of University of Cambridge Local Examinations Syndicate (UCLES), which is itself a department of the University of Cambridge. © UCLES 2013 0653/53/M/J/13 CHEMISTRY PRACTICAL NOTES Test for anions anion test test result carbonate (CO3 2-) add dilute acid effervescence, carbon dioxide produced chloride (Cl -) [in solution] acidify with dilute nitric acid, then add aqueous silver nitrate white ppt. nitrate (NO3 -) [in solution] add aqueous sodium hydroxide then aluminium foil; warm carefully ammonia produced sulfate (SO4 2-) [in solution] acidify then add aqueous barium chloride or aqueous barium nitrate white ppt. Test for aqueous cations cation effect of aqueous sodium hydroxide effect of aqueous ammonia ammonium (NH4 +) ammonia produced on warming - copper(II) (Cu2+) light blue ppt., insoluble in excess light blue ppt., soluble in excess giving a dark blue solution iron(II) (Fe2+) green ppt., insoluble in excess green ppt., insoluble in excess iron(III) (Fe3+) red-brown ppt., insoluble in excess red-brown ppt., insoluble in excess zinc (Zn2+) white ppt., soluble in excess giving a colourless solution white ppt., soluble in excess giving a colourless solution Test for gases gas test and test results ammonia (NH3) turns damp red litmus paper blue carbon dioxide (CO2) turns limewater milky chlorine (Cl2) bleaches damp litmus paper hydrogen (H2) “pops” with a lighted splint oxygen (O2) relights a glowing splint
Mark scheme, page 1
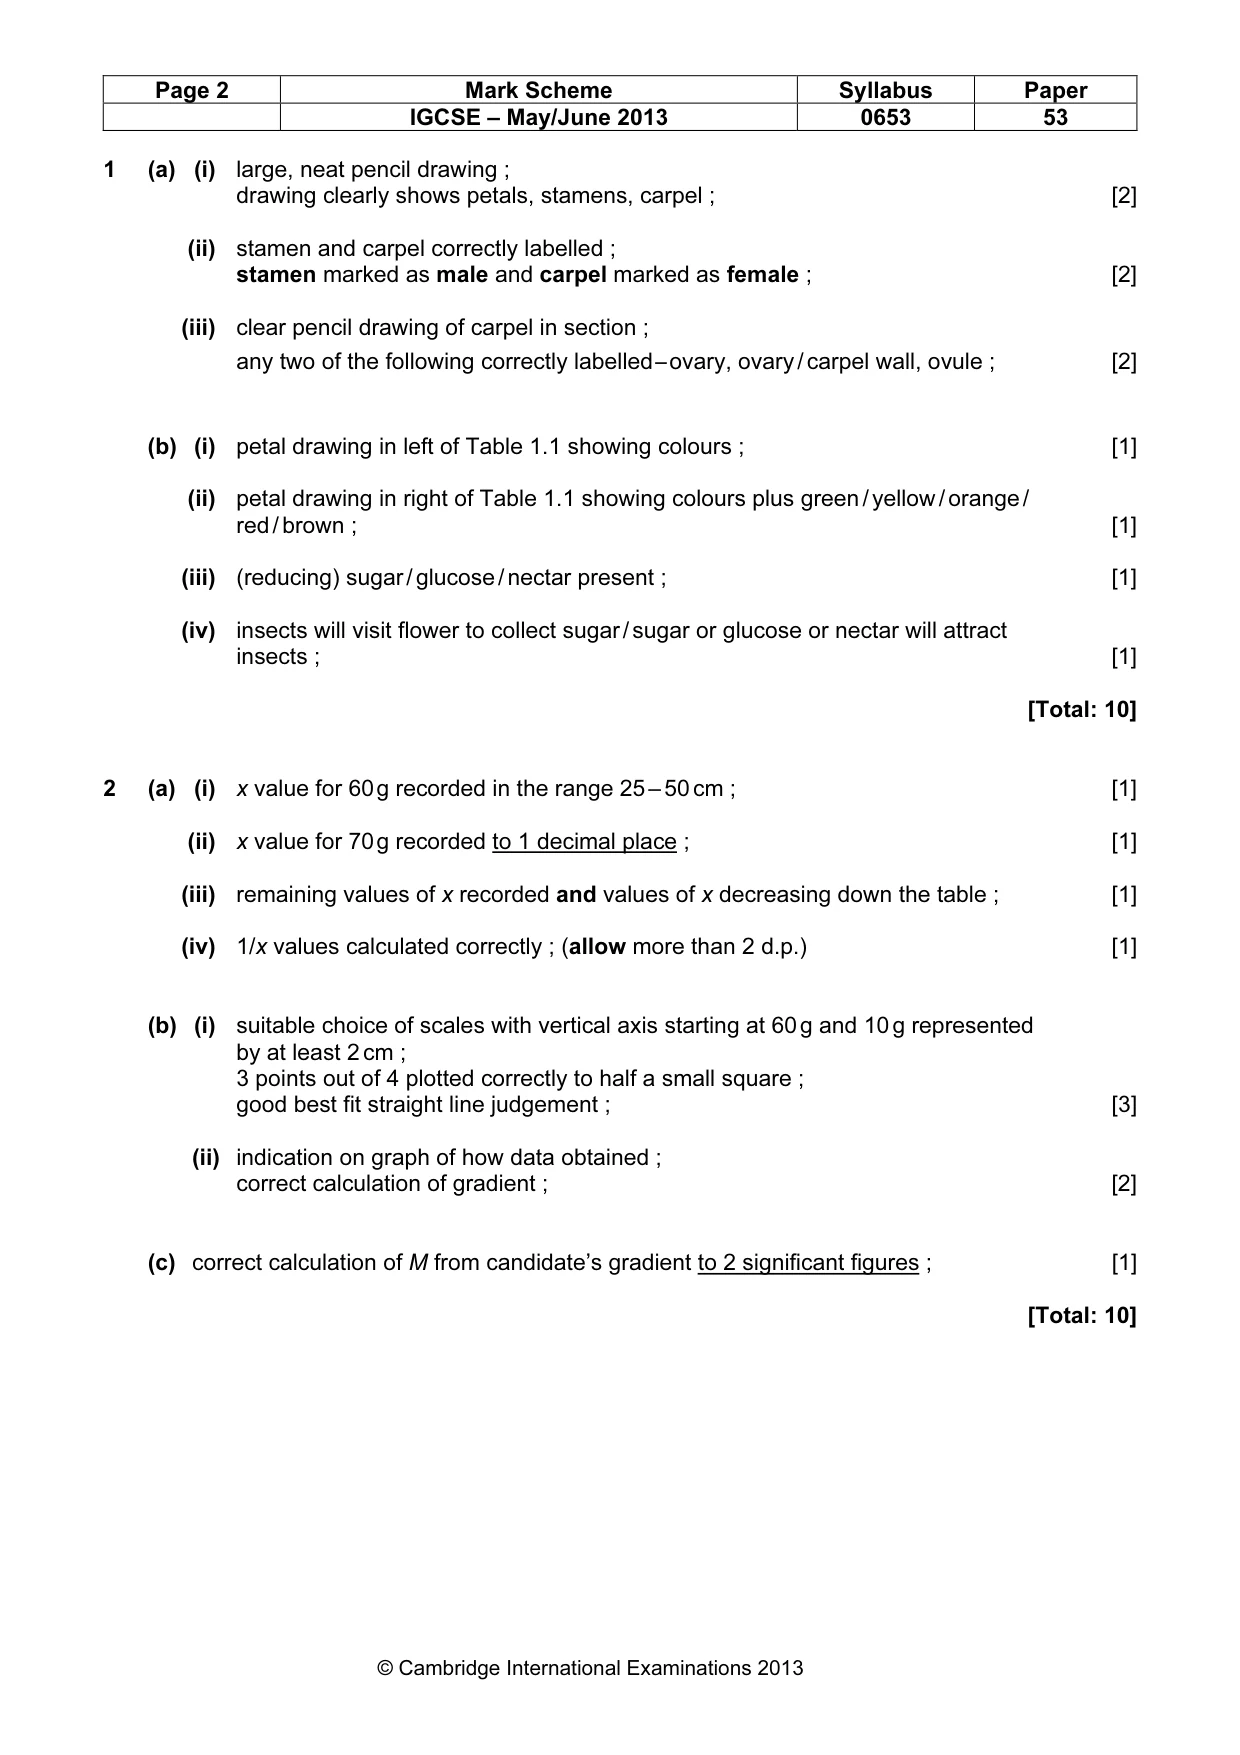
CAMBRIDGE INTERNATIONAL EXAMINATIONS International General Certificate of Secondary Education MARK SCHEME for the May/June 2013 series 0653 COMBINED SCIENCE 0653/53 Paper 5 (Practical Test), maximum raw mark 30 This mark scheme is published as an aid to teachers and candidates, to indicate the requirements of the examination. It shows the basis on which Examiners were instructed to award marks. It does not indicate the details of the discussions that took place at an Examiners’ meeting before marking began, which would have considered the acceptability of alternative answers. Mark schemes should be read in conjunction with the question paper and the Principal Examiner Report for Teachers. Cambridge will not enter into discussions about these mark schemes. Cambridge is publishing the mark schemes for the May/June 2013 series for most IGCSE, GCE Advanced Level and Advanced Subsidiary Level components and some Ordinary Level components. www.XtremePapers.com
Mark scheme, page 2
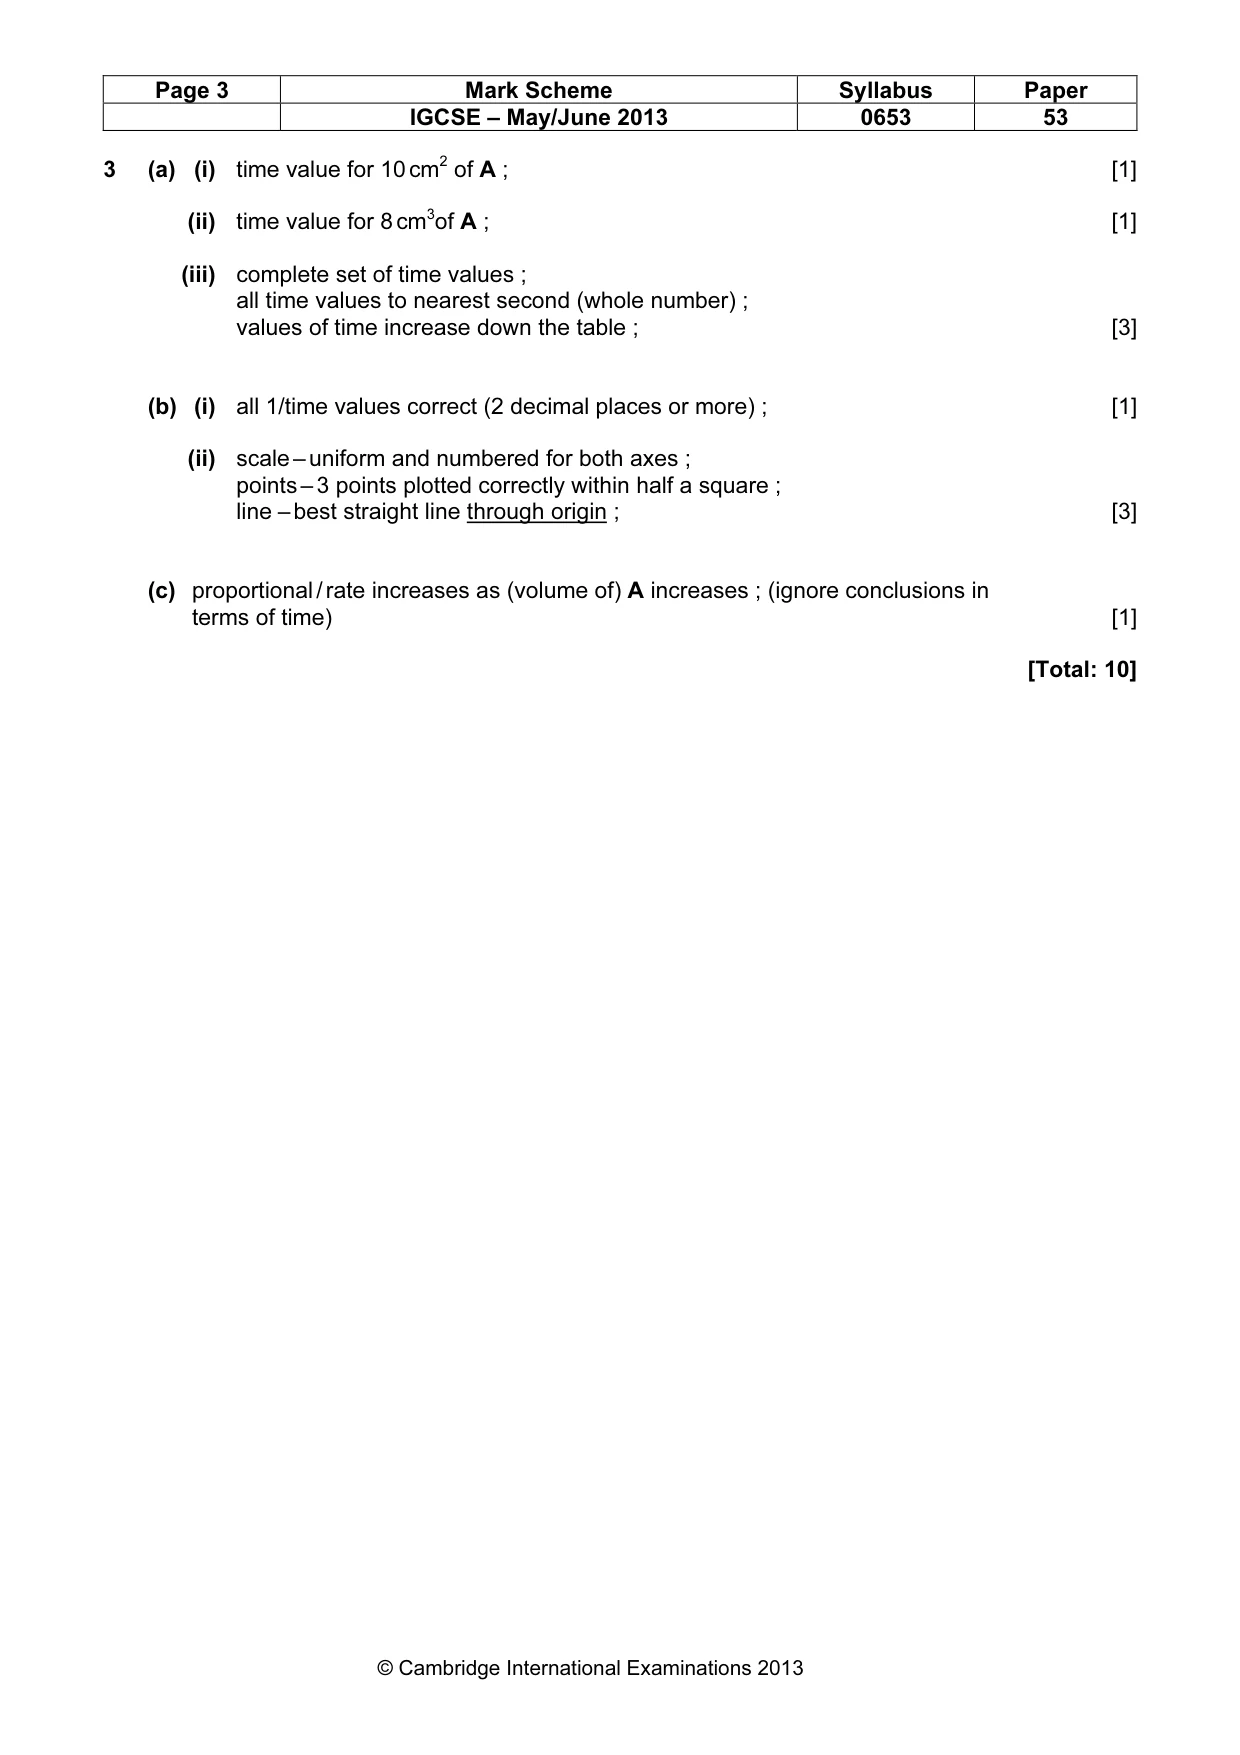
Page 2 Mark Scheme Syllabus Paper IGCSE – May/June 2013 0653 53 © Cambridge International Examinations 2013 1 (a) (i) large, neat pencil drawing ; drawing clearly shows petals, stamens, carpel ; [2] (ii) stamen and carpel correctly labelled ; stamen marked as male and carpel marked as female ; [2] (iii) clear pencil drawing of carpel in section ; any two of the following correctly labelled – ovary, ovary / carpel wall, ovule ; [2] (b) (i) petal drawing in left of Table 1.1 showing colours ; [1] (ii) petal drawing in right of Table 1.1 showing colours plus green / yellow / orange / red / brown ; [1] (iii) (reducing) sugar / glucose / nectar present ; [1] (iv) insects will visit flower to collect sugar / sugar or glucose or nectar will attract insects ; [1] [Total: 10] 2 (a) (i) x value for 60 g recorded in the range 25 – 50 cm ; [1] (ii) x value for 70 g recorded to 1 decimal place ; [1] (iii) remaining values of x recorded and values of x decreasing down the table ; [1] (iv) 1/x values calculated correctly ; (allow more than 2 d.p.) [1] (b) (i) suitable choice of scales with vertical axis starting at 60 g and 10 g represented by at least 2 cm ; 3 points out of 4 plotted correctly to half a small square ; good best fit straight line judgement ; [3] (ii) indication on graph of how data obtained ; correct calculation of gradient ; [2] (c) correct calculation of M from candidate’s gradient to 2 significant figures ; [1] [Total: 10]
Mark scheme, page 3
Page 3 Mark Scheme Syllabus Paper IGCSE – May/June 2013 0653 53 © Cambridge International Examinations 2013 3 (a) (i) time value for 10 cm2 of A ; [1] (ii) time value for 8 cm3of A ; [1] (iii) complete set of time values ; all time values to nearest second (whole number) ; values of time increase down the table ; [3] (b) (i) all 1/time values correct (2 decimal places or more) ; [1] (ii) scale – uniform and numbered for both axes ; points – 3 points plotted correctly within half a square ; line – best straight line through origin ; [3] (c) proportional / rate increases as (volume of) A increases ; (ignore conclusions in terms of time) [1] [Total: 10]
What you needed in this session
Cambridge’s own grade thresholds for 2013 May/June, Paper 5 · Variant 3. A higher threshold means an easier paper — the bar moves with how the cohort did.