Cambridge IGCSE Science - Combined 0653 — 2019 Feb/March Paper 5 · Variant 2
0653/52/F/M/19 · 4 questions · 40 marks · ≈45 min
The question paper and its mark scheme, free to read here and free to download. This is Cambridge’s own paper, exactly as it was sat.
Question paper16 pages




Mark scheme7 pages
Answers below. Sit the paper first if you are practising.
Questions as text
Q1 · You are going to investigate seeds which were germinated at different temperatures
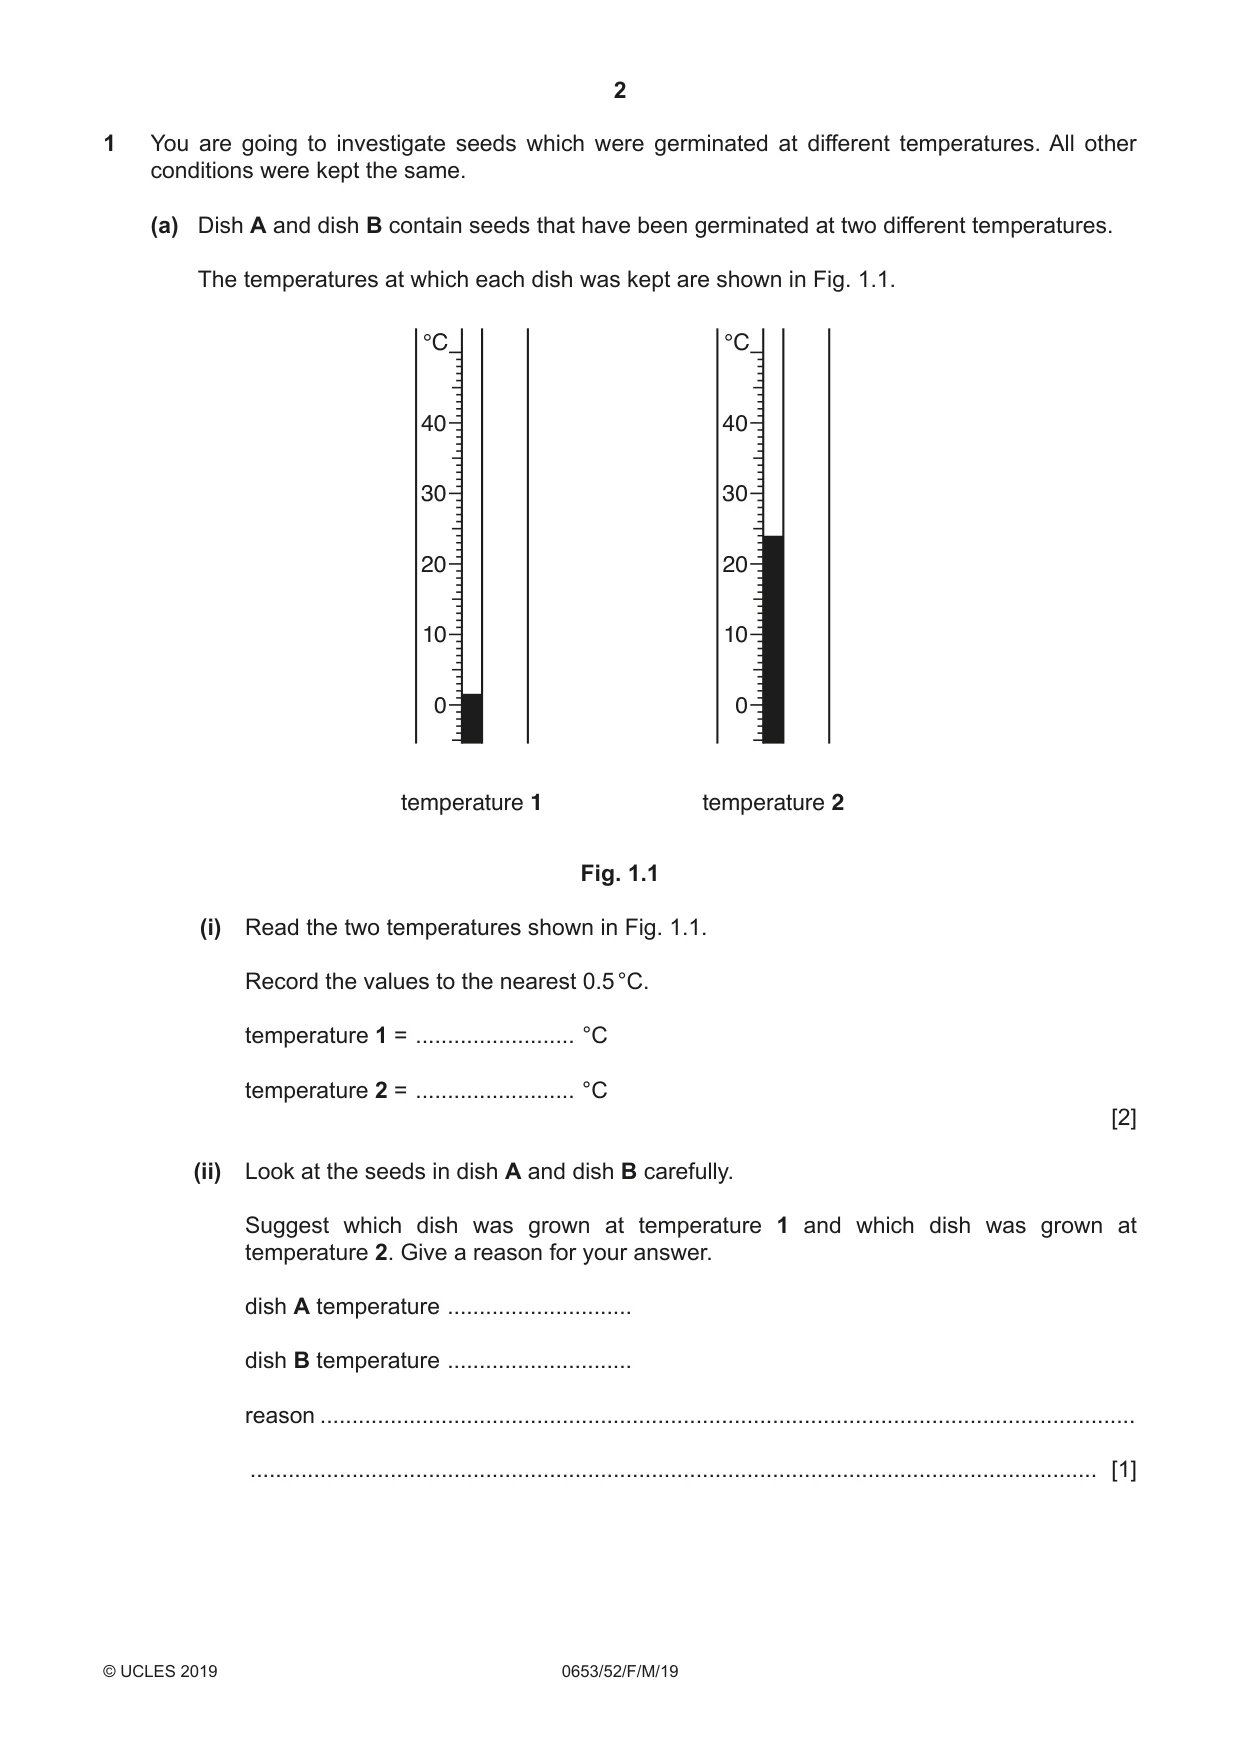
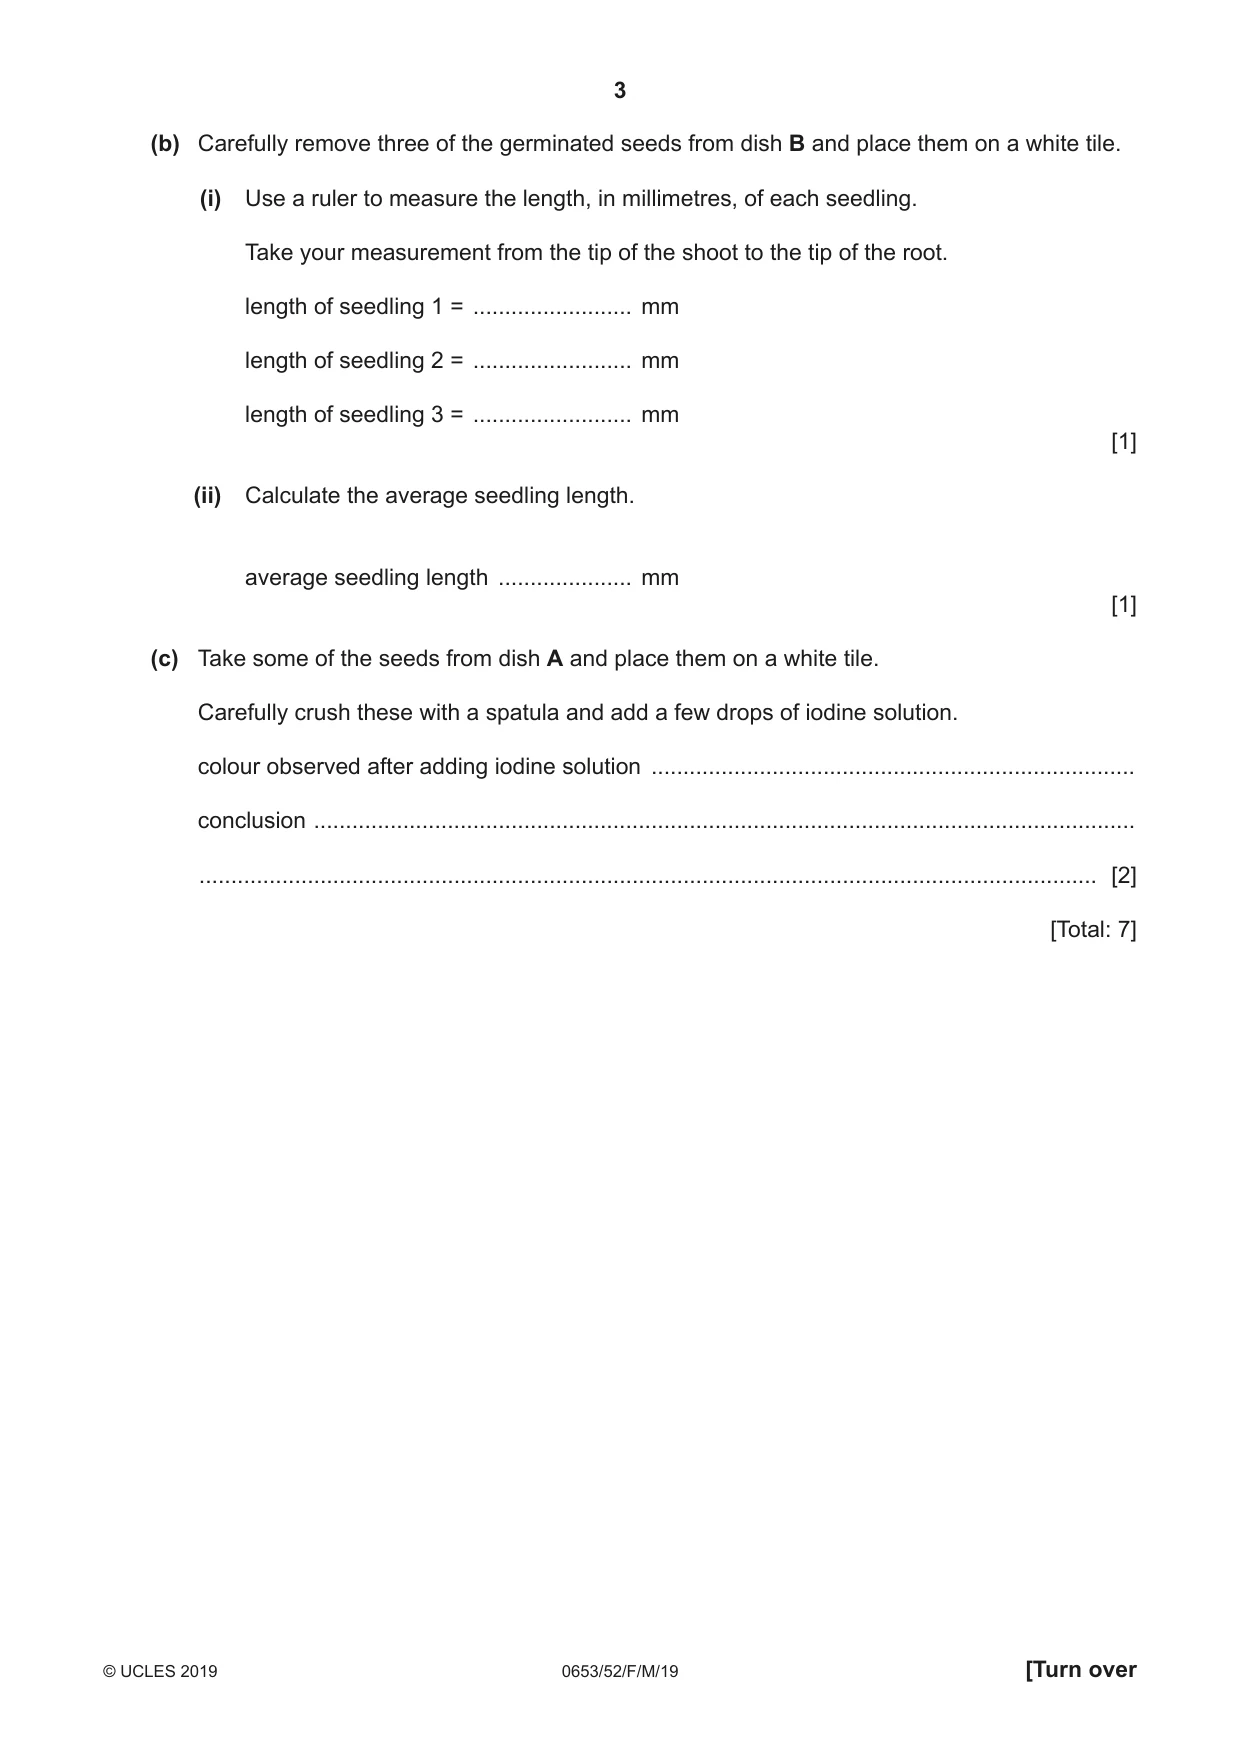
1 You are going to investigate seeds which were germinated at different temperatures. All other conditions were kept the same. (a) Dish A and dish B contain seeds that have been germinated at two different temperatures. The temperatures at which each dish was kept are shown in Fig. 1.1. °C °C 40 40 30 30 20 20 10 10 0 0 temperature 1 temperature 2 Fig. 1.1 (i) Read the two temperatures shown in Fig. 1.1. Record the values to the nearest 0.5 °C. temperature 1 = ......................... °C temperature 2 = ......................... °C [2] (ii) Look at the seeds in dish A and dish B carefully. Suggest which dish was grown at temperature 1 and which dish was grown at temperature 2. Give a reason for your answer. dish A temperature ............................. dish B temperature ............................. reason ................................................................................................................................ ..................................................................................................................................... [1] (b) Carefully remove three of the germinated seeds from dish B and place them on a white tile. (i) Use a ruler to measure the length, in millimetres, of each seedling. Take your measurement from the tip of the shoot to the tip of the root. length of seedling 1 = ......................... mm length of seedling 2 = ......................... mm length of seedling 3 = ......................... mm [1] (ii) Calculate the average seedling length. average seedling length ..................... mm [1] (c) Take some of the seeds from dish A and place them on a white tile. Carefully crush these with a spatula and add a few drops of iodine solution. colour observed after adding iodine solution ............................................................................ conclusion ................................................................................................................................. ............................................................................................................................................. [2] [Total: 7]
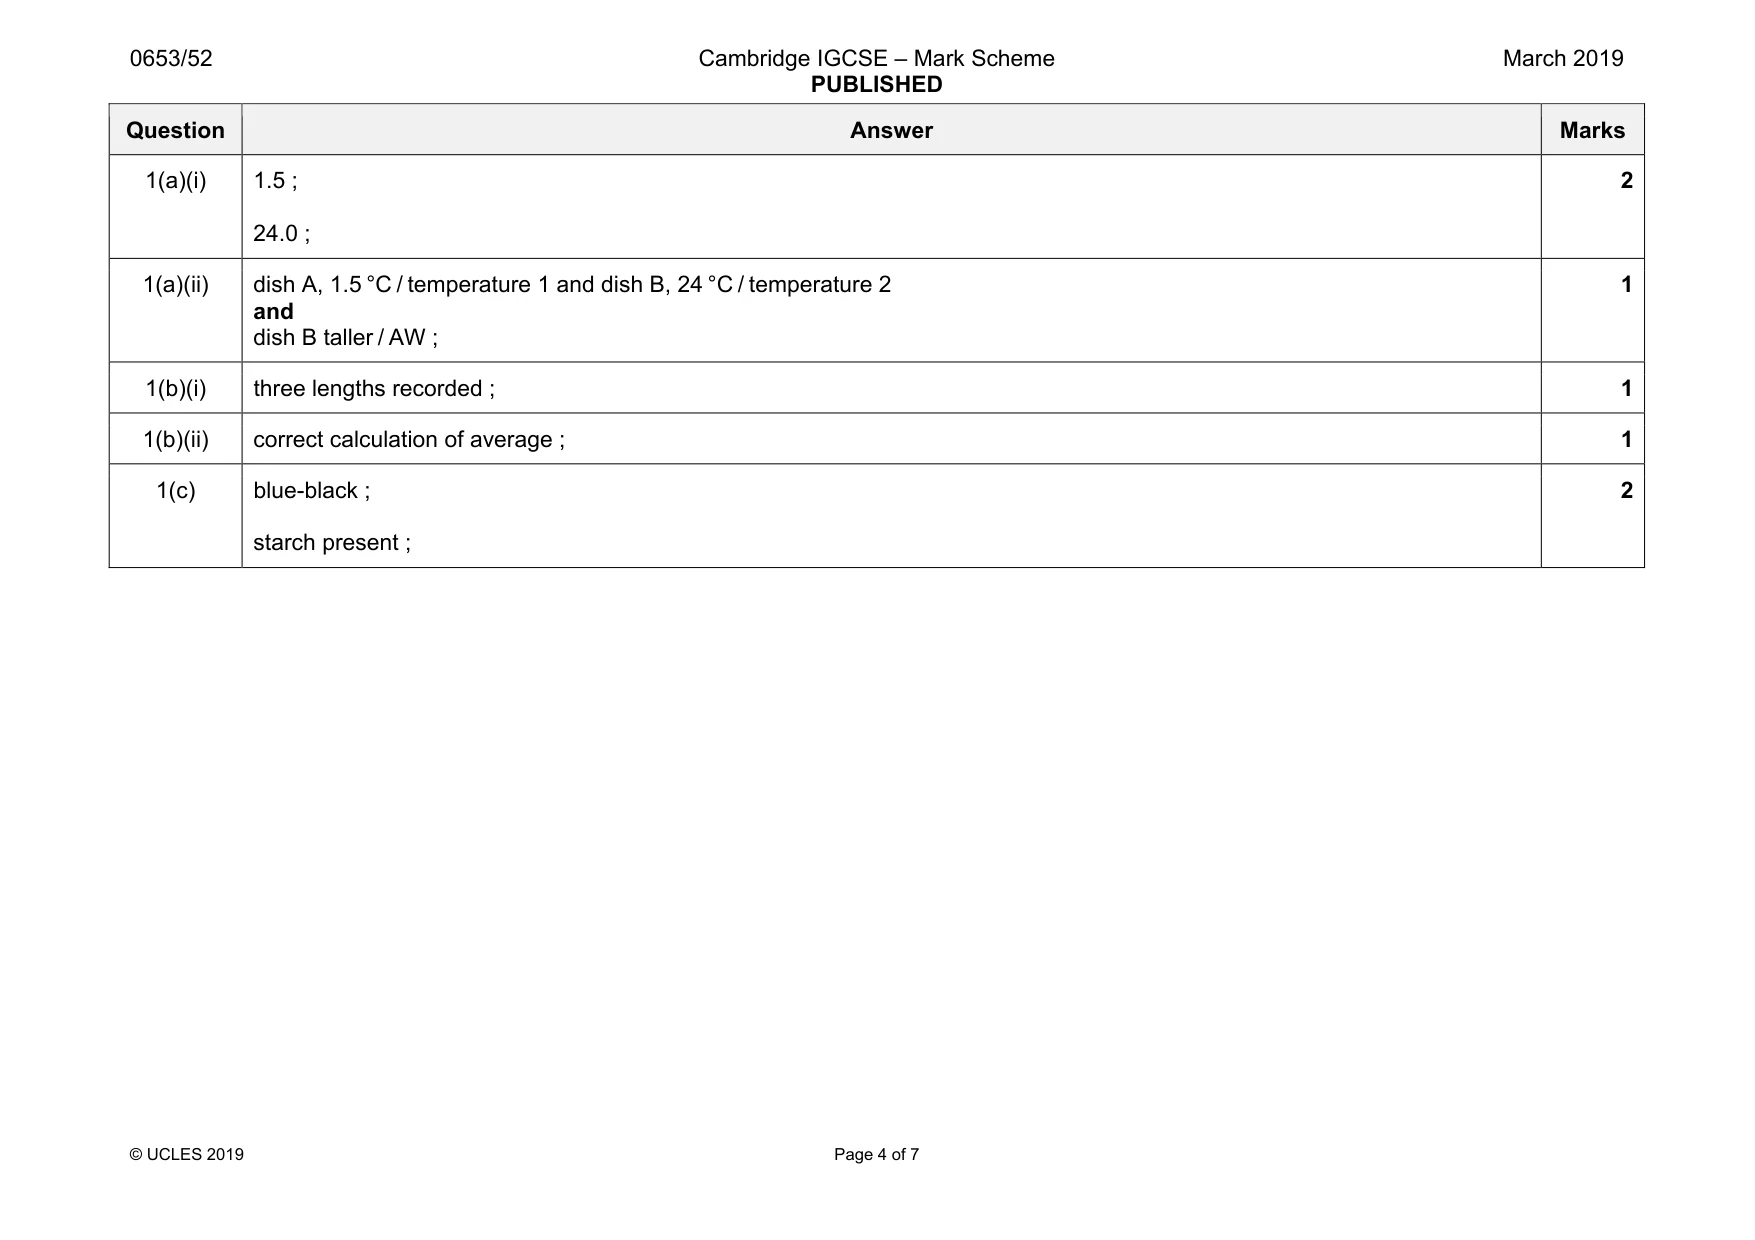
Mark scheme: 1(a)(i) 1.5 ; 24.0 ; 2 1(a)(ii) dish A, 1.5 °C / temperature 1 and dish B, 24 °C / temperature 2 and dish B taller / AW ; 1 1(b)(i) three lengths recorded ; 1 1(b)(ii) correct calculation of average ; 1 1(c) blue-black ; starch present ; 2
More questions on Physical quantities and measurement techniques
Q2 · A student cuts a potato into cylinders as shown in Fig
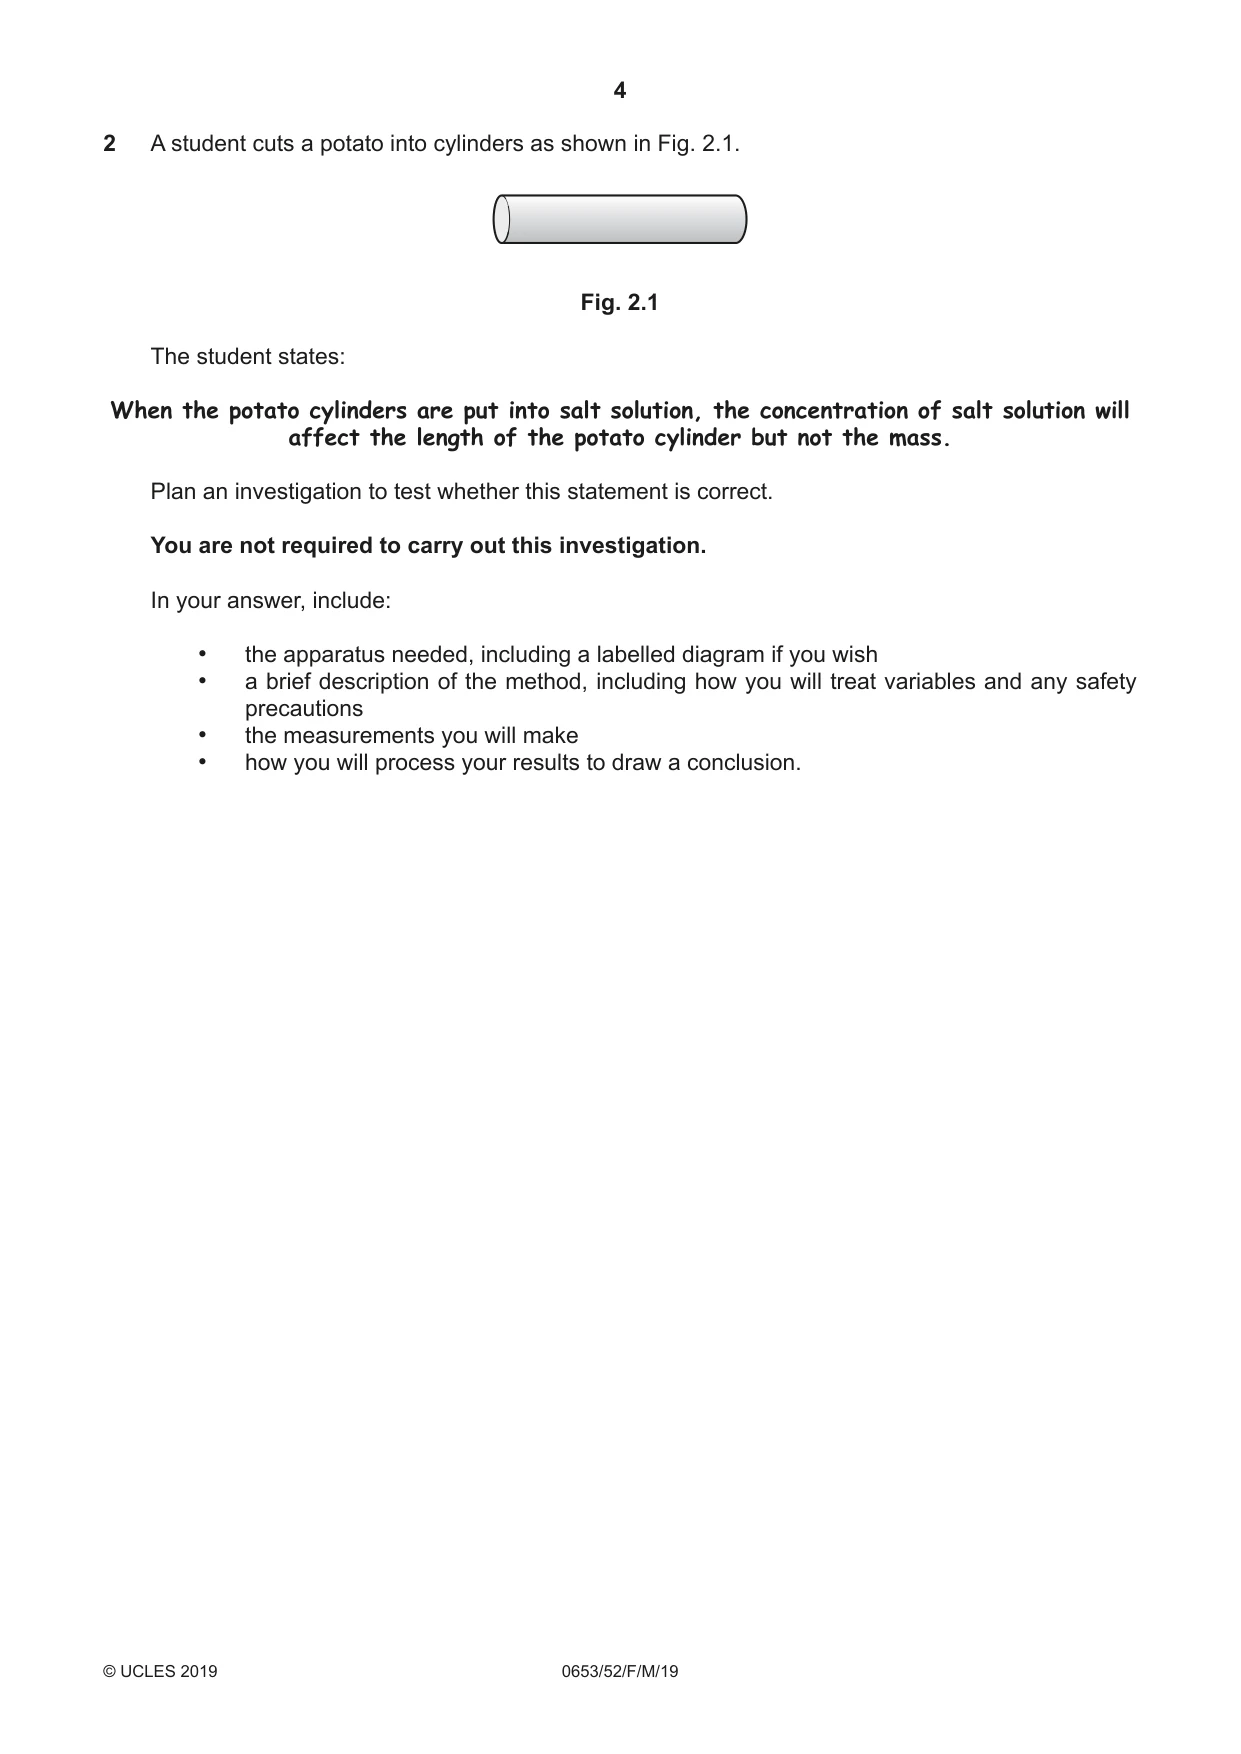
2 A student cuts a potato into cylinders as shown in Fig. 2.1. Fig. 2.1 The student states: When the potato cylinders are put into salt solution, the concentration of salt solution will affect the length of the potato cylinder but not the mass. Plan an investigation to test whether this statement is correct. You are not required to carry out this investigation. In your answer, include: • the apparatus needed, including a labelled diagram if you wish • a brief description of the method, including how you will treat variables and any safety precautions • the measurements you will make • how you will process your results to draw a conclusion. .......................................................................................................................................................... .......................................................................................................................................................... .......................................................................................................................................................... .......................................................................................................................................................... .......................................................................................................................................................... .......................................................................................................................................................... .......................................................................................................................................................... .......................................................................................................................................................... .......................................................................................................................................................... .......................................................................................................................................................... .......................................................................................................................................................... .................................................................................................................................................... [7]
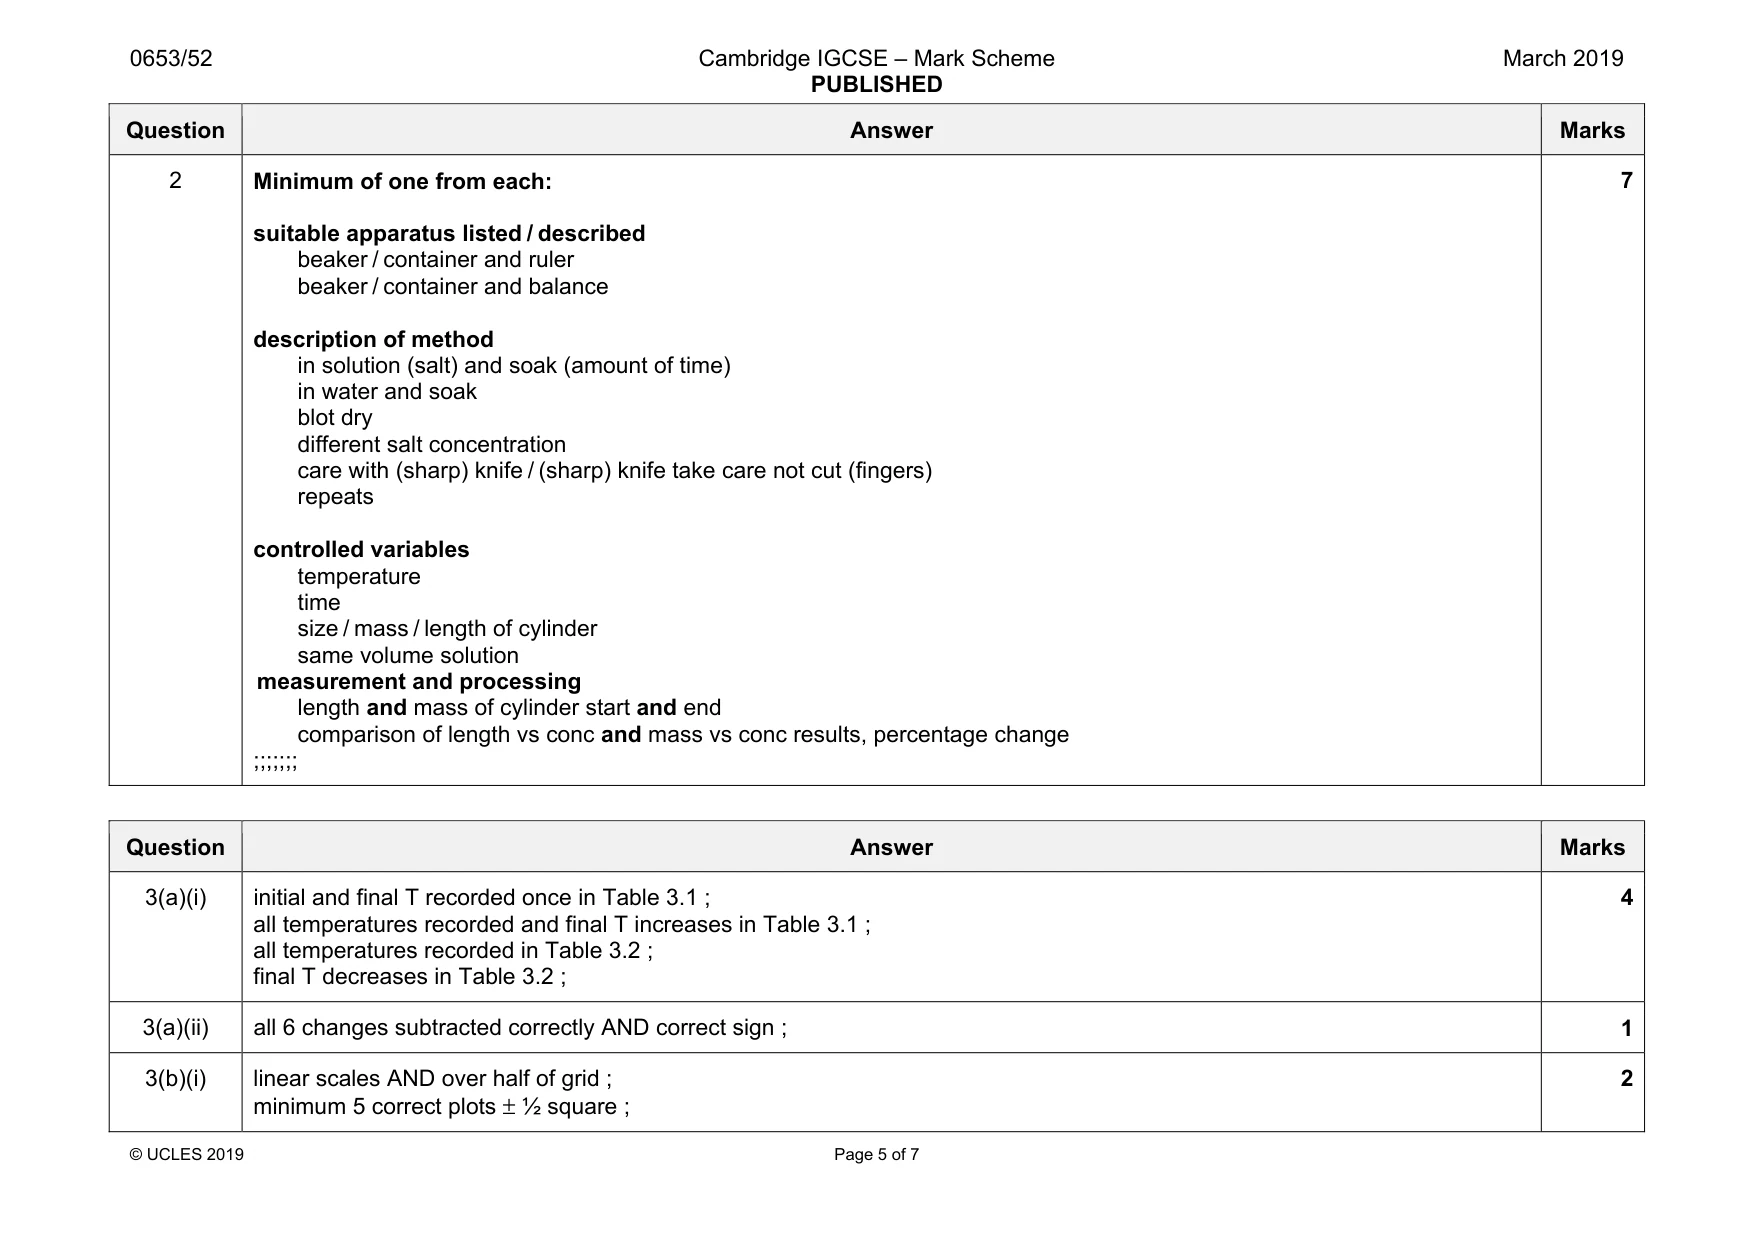
Mark scheme: 2 Minimum of one from each: suitable apparatus listed / described beaker / container and ruler beaker / container and balance description of method in solution (salt) and soak (amount of time) in water and soak blot dry different salt concentration care with (sharp) knife / (sharp) knife take care not cut (fingers) repeats controlled variables temperature time size / mass / length of cylinder same volume solution measurement and processing length and mass of cylinder start and end comparison of length vs conc and mass vs conc results, percentage change ;;;;;;; 7
Q3 · You are going to investigate the change in temperature which occurs when sodium carbonate…
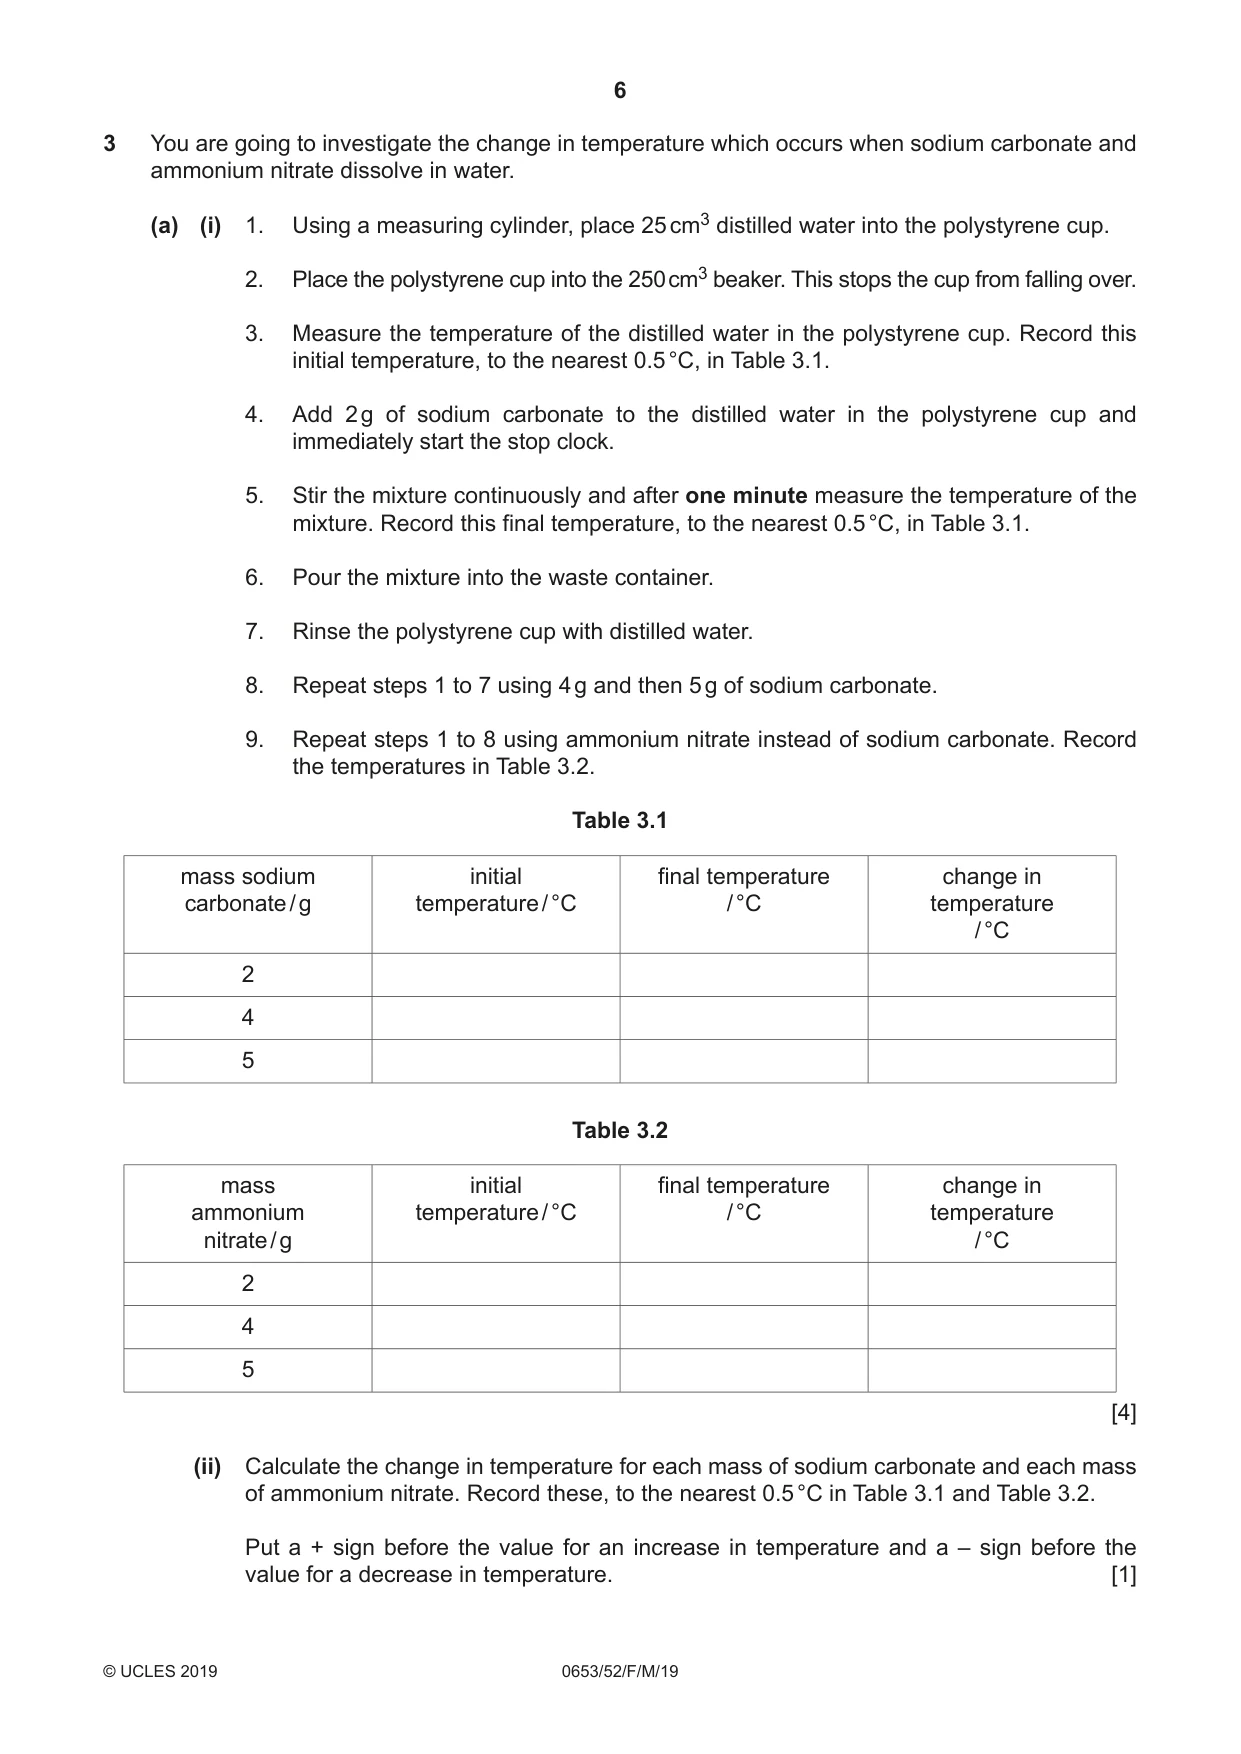
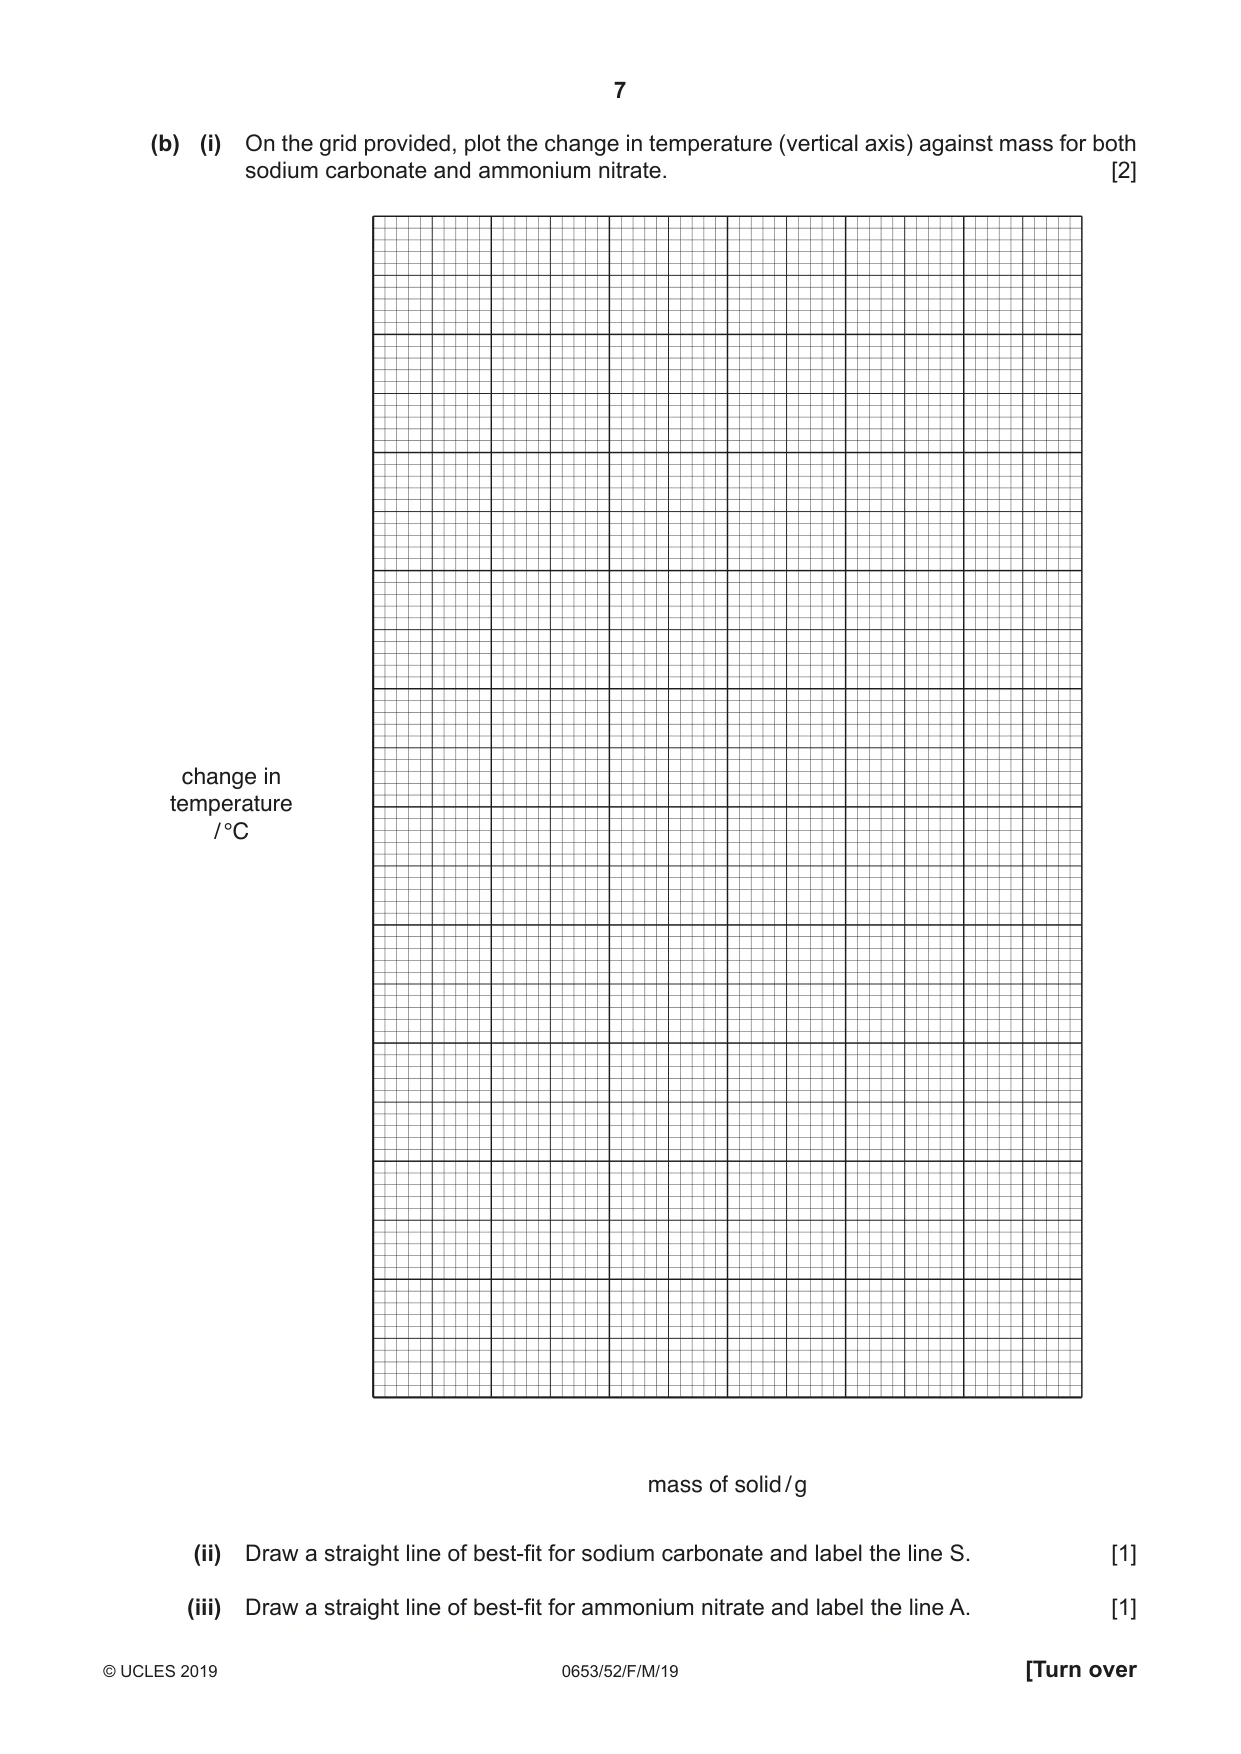
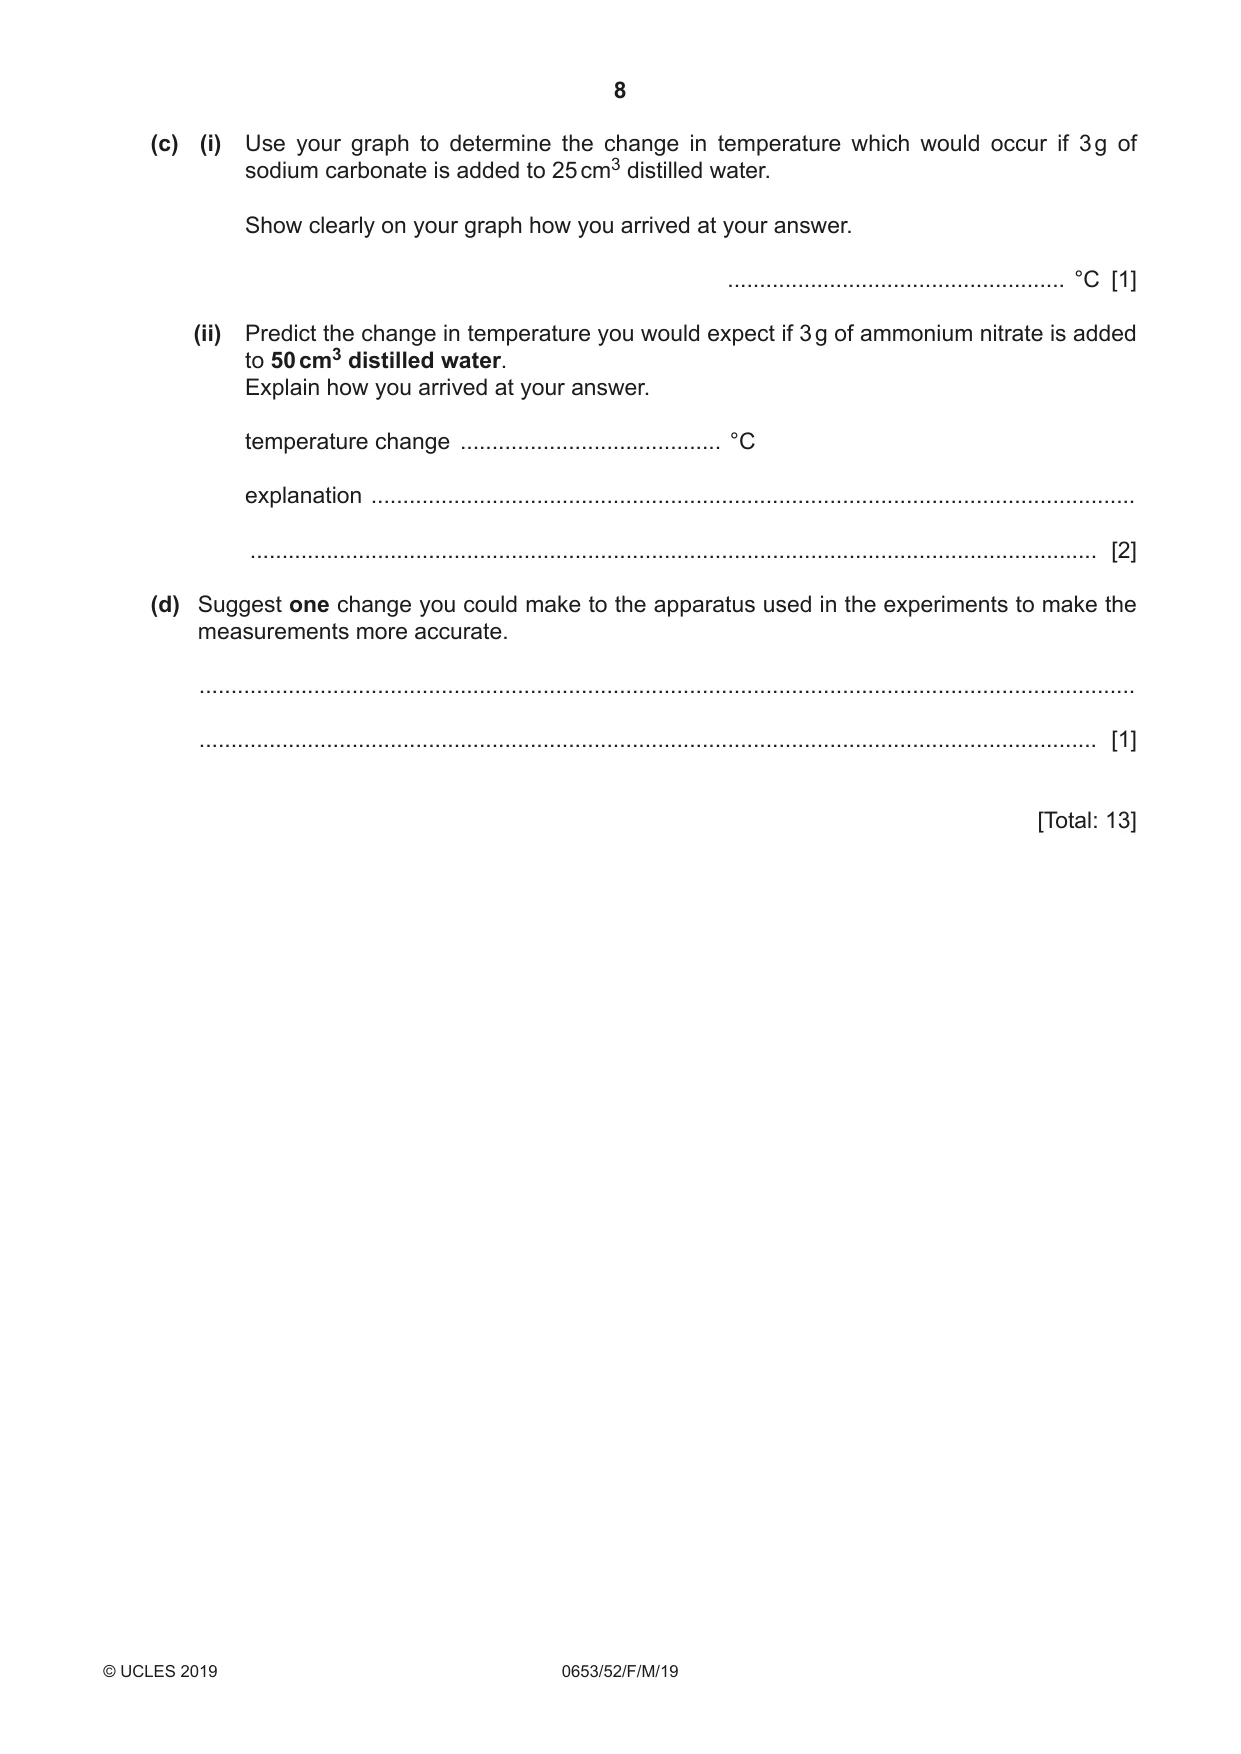
3 You are going to investigate the change in temperature which occurs when sodium carbonate and ammonium nitrate dissolve in water. (a) (i) 1. Using a measuring cylinder, place 25 cm3 distilled water into the polystyrene cup. 2. Place the polystyrene cup into the 250 cm3 beaker. This stops the cup from falling over. 3. Measure the temperature of the distilled water in the polystyrene cup. Record this initial temperature, to the nearest 0.5 °C, in Table 3.1. 4. Add 2 g of sodium carbonate to the distilled water in the polystyrene cup and immediately start the stop clock. 5. Stir the mixture continuously and after one minute measure the temperature of the mixture. Record this final temperature, to the nearest 0.5 °C, in Table 3.1. 6. Pour the mixture into the waste container. 7. Rinse the polystyrene cup with distilled water. 8. Repeat steps 1 to 7 using 4 g and then 5 g of sodium carbonate. 9. Repeat steps 1 to 8 using ammonium nitrate instead of sodium carbonate. Record the temperatures in Table 3.2. Table 3.1 mass sodium initial final temperature change in carbonate / g temperature / °C / °C temperature / °C 2 4 5 Table 3.2 mass initial final temperature change in ammonium temperature / °C / °C temperature nitrate / g / °C 2 4 5 [4] (ii) Calculate the change in temperature for each mass of sodium carbonate and each mass of ammonium nitrate. Record these, to the nearest 0.5 °C in Table 3.1 and Table 3.2. Put a + sign before the value for an increase in temperature and a – sign before the value for a decrease in temperature. [1] (c) (i) Use your graph to determine the change in temperature which would occur if 3 g of sodium carbonate is added to 25 cm3 distilled water. Show clearly on your graph how you arrived at your answer. ..................................................... °C [1] (ii) Predict the change in temperature you would expect if 3 g of ammonium nitrate is added to 50 cm3 distilled water. Explain how you arrived at your answer. temperature change ......................................... °C explanation ........................................................................................................................ ..................................................................................................................................... [2] (d) Suggest one change you could make to the apparatus used in the experiments to make the measurements more accurate. ................................................................................................................................................... ............................................................................................................................................. [1] [Total: 13]
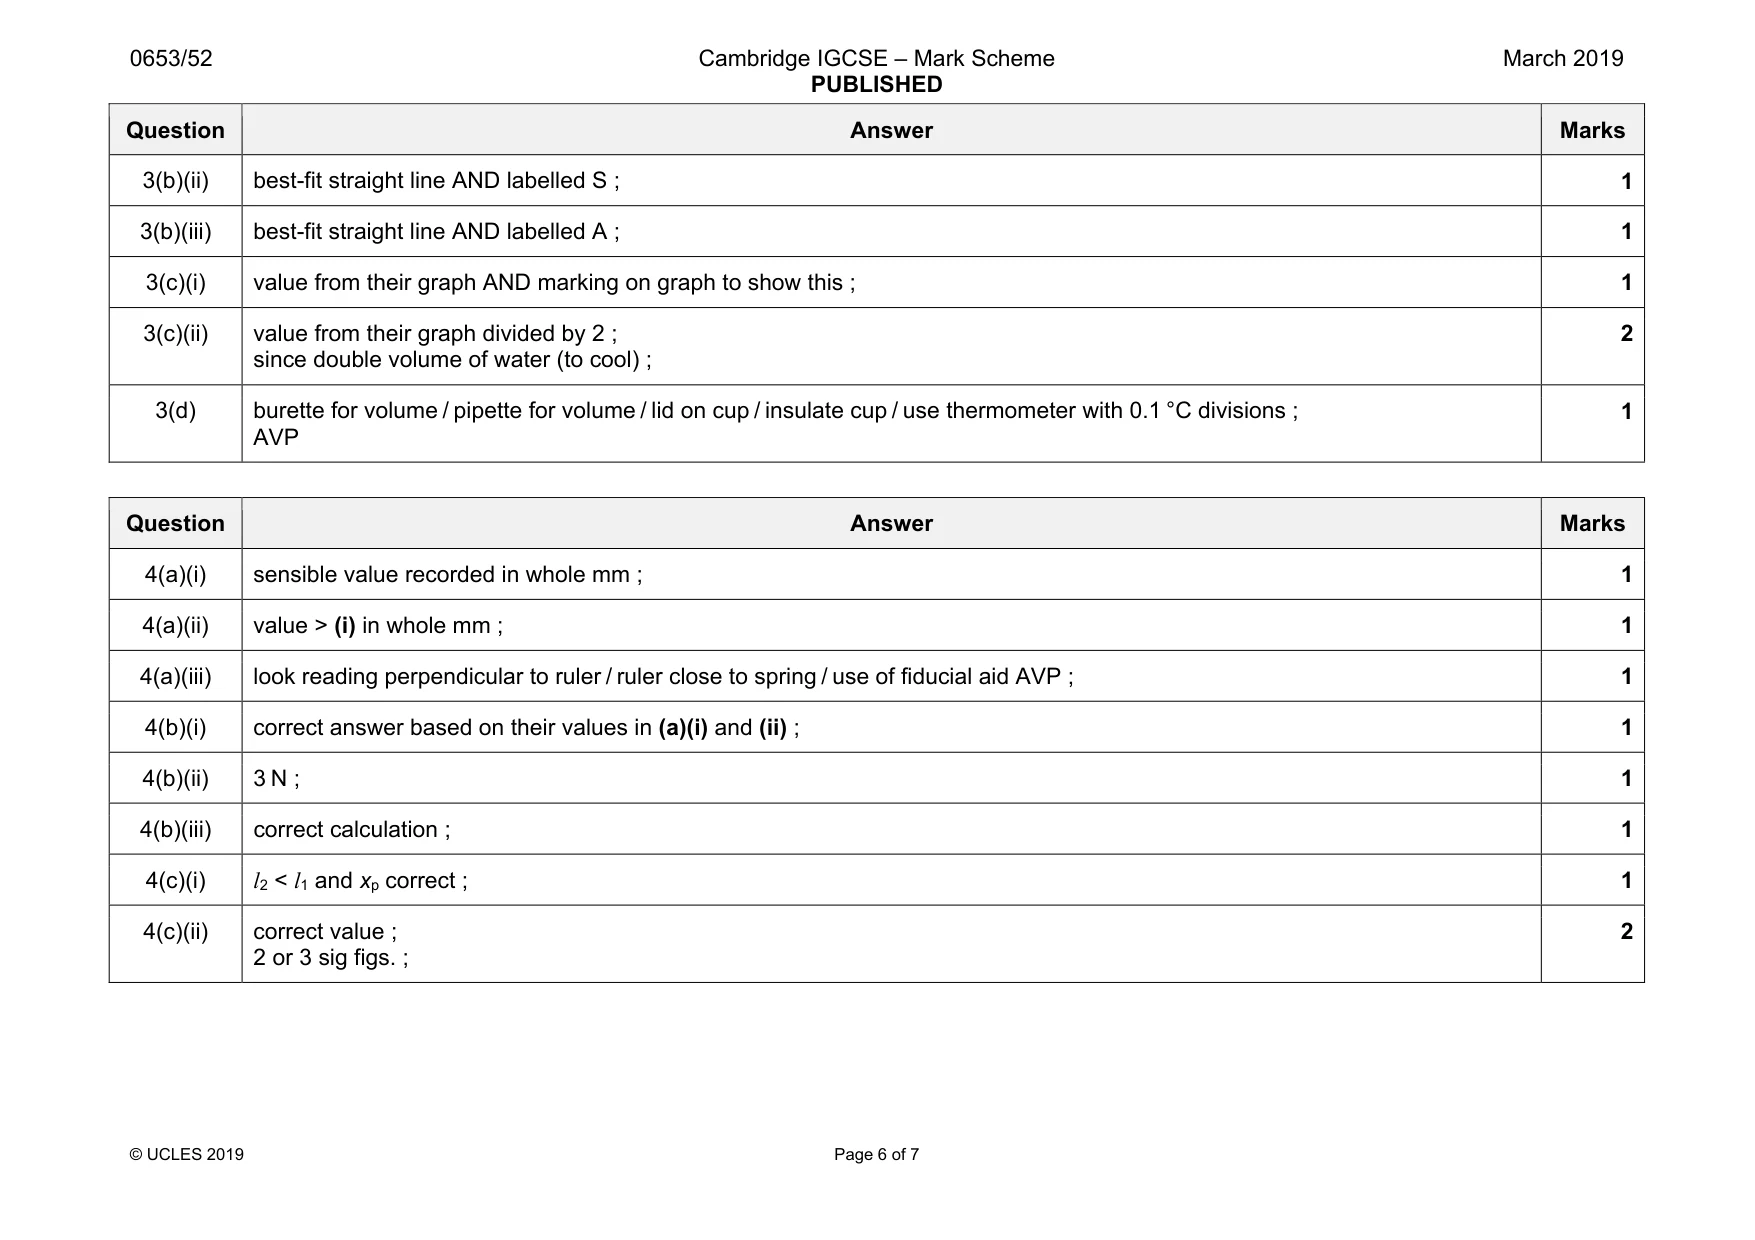
Mark scheme: 3(a)(i) initial and final T recorded once in Table 3.1 ; all temperatures recorded and final T increases in Table 3.1 ; all temperatures recorded in Table 3.2 ; final T decreases in Table 3.2 ; 4 3(a)(ii) all 6 changes subtracted correctly AND correct sign ; 1 3(b)(i) linear scales AND over half of grid ; minimum 5 correct plots ± ½ square ; 2 Question Answer Marks 3(b)(ii) best-fit straight line AND labelled S ; 1 3(b)(iii) best-fit straight line AND labelled A ; 1 3(c)(i) value from their graph AND marking on graph to show this ; 1 3(c)(ii) value from their graph divided by 2 ; since double volume of water (to cool) ; 2 3(d) burette for volume / pipette for volume / lid on cup / insulate cup / use thermometer with 0.1 °C divisions ; AVP 1
Q4 · You are going to find the spring constant of different combinations of identical springs
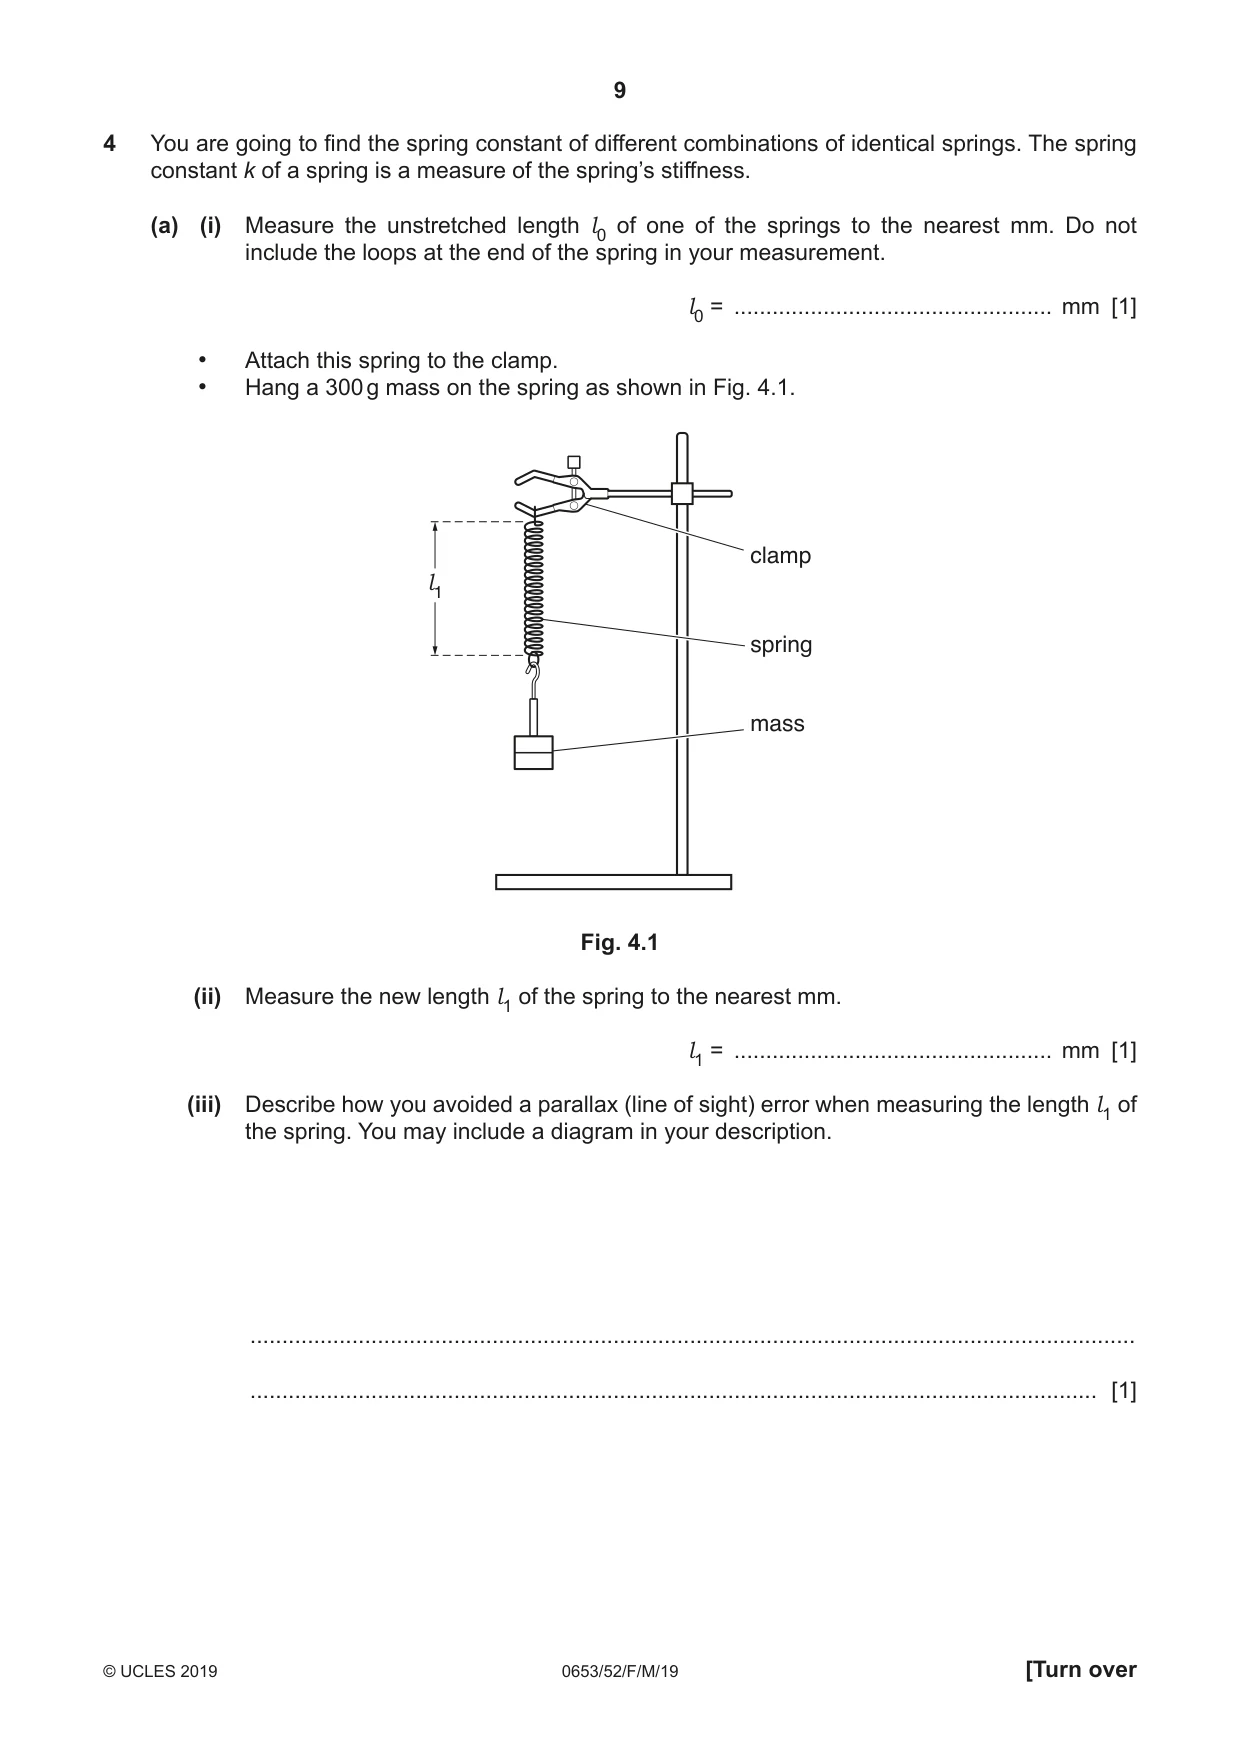
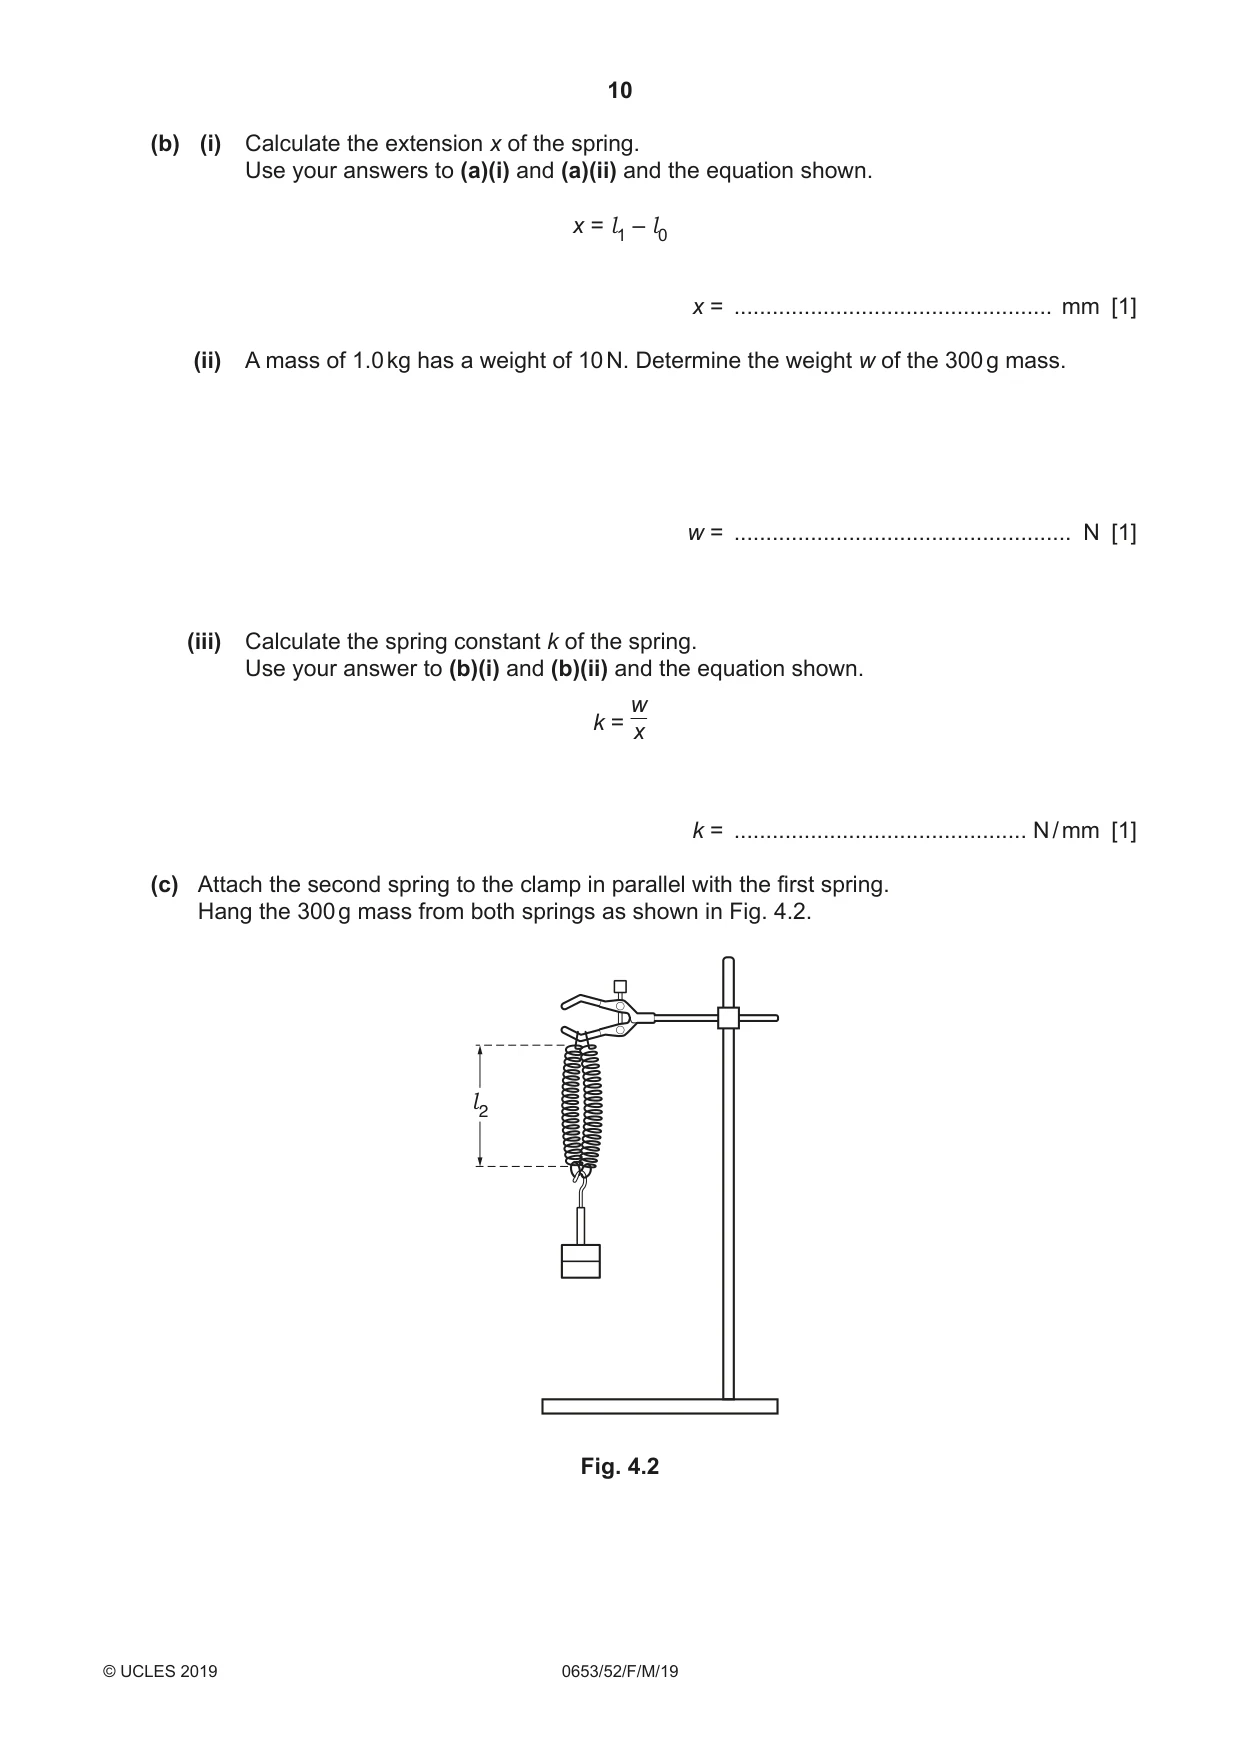
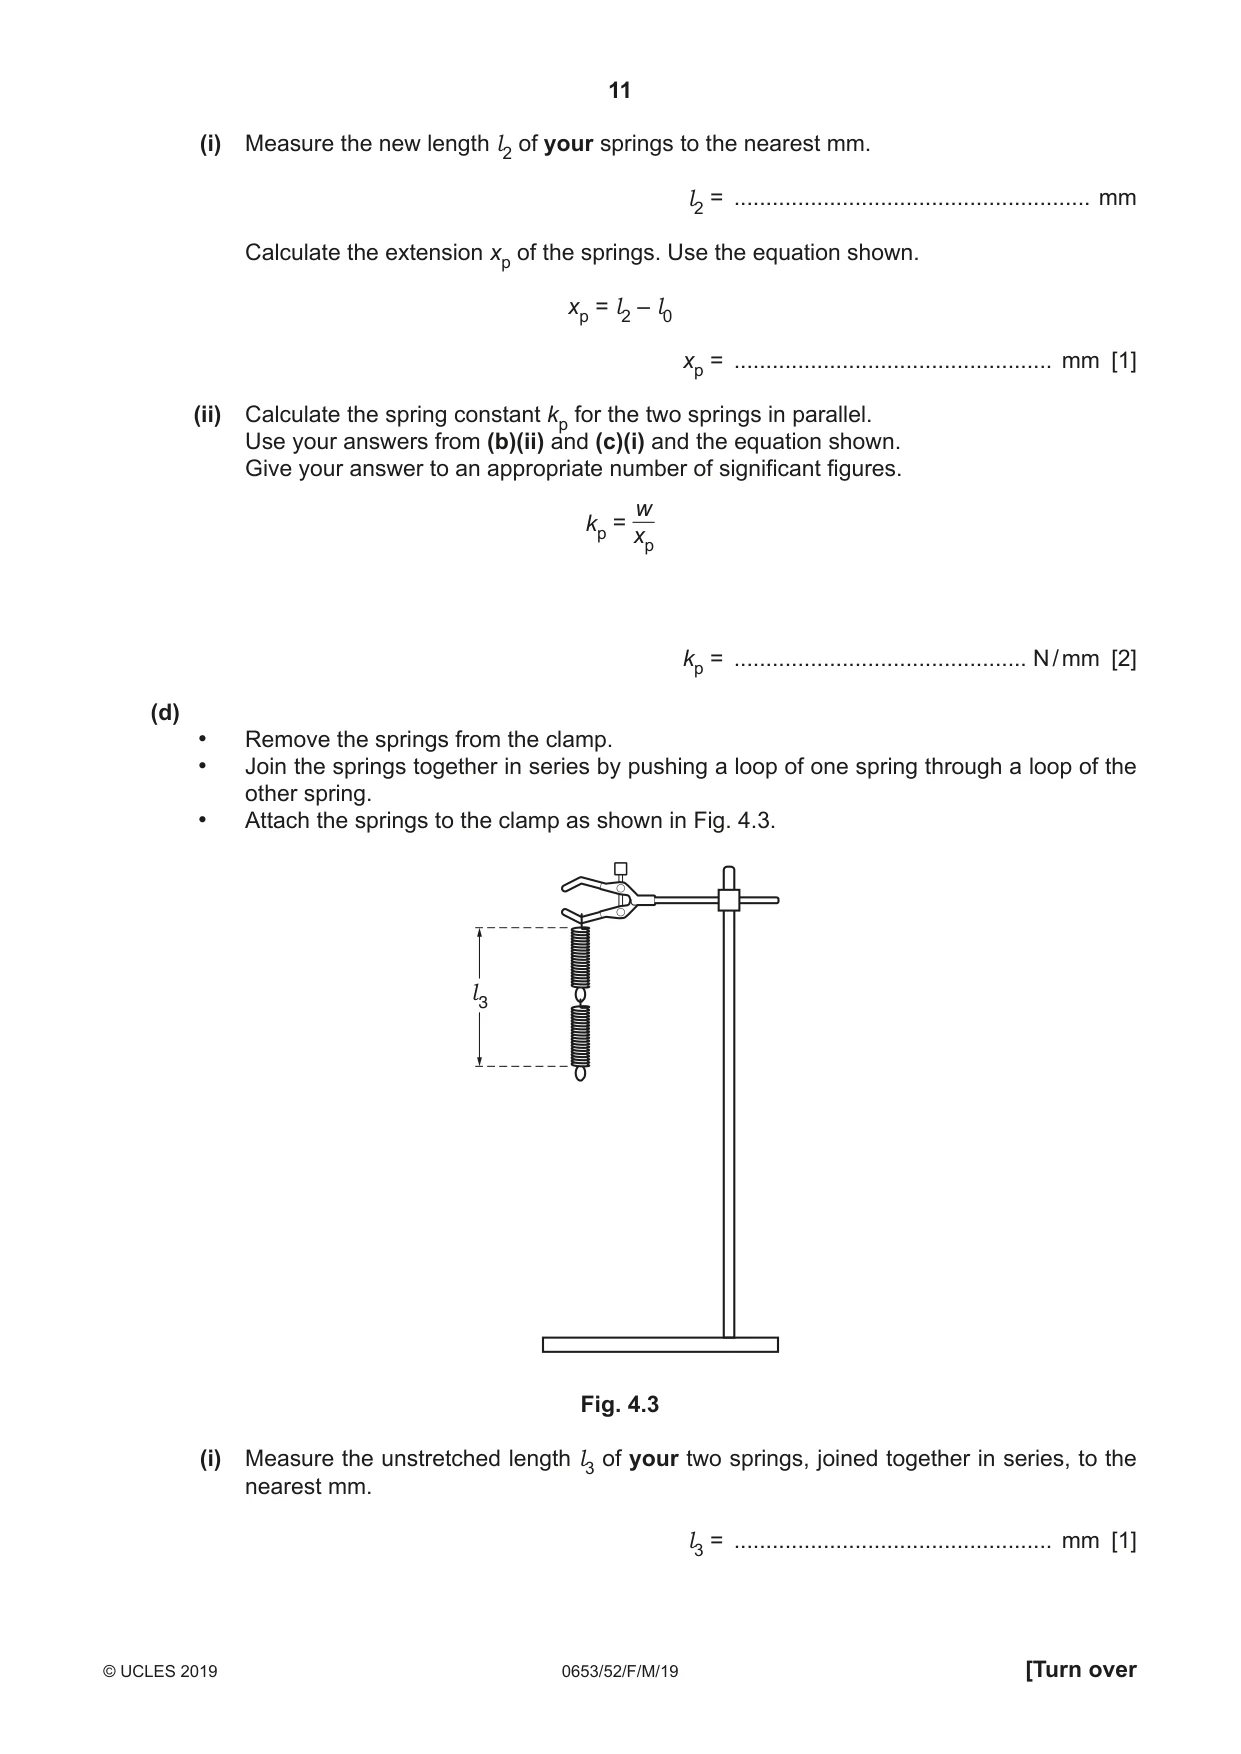
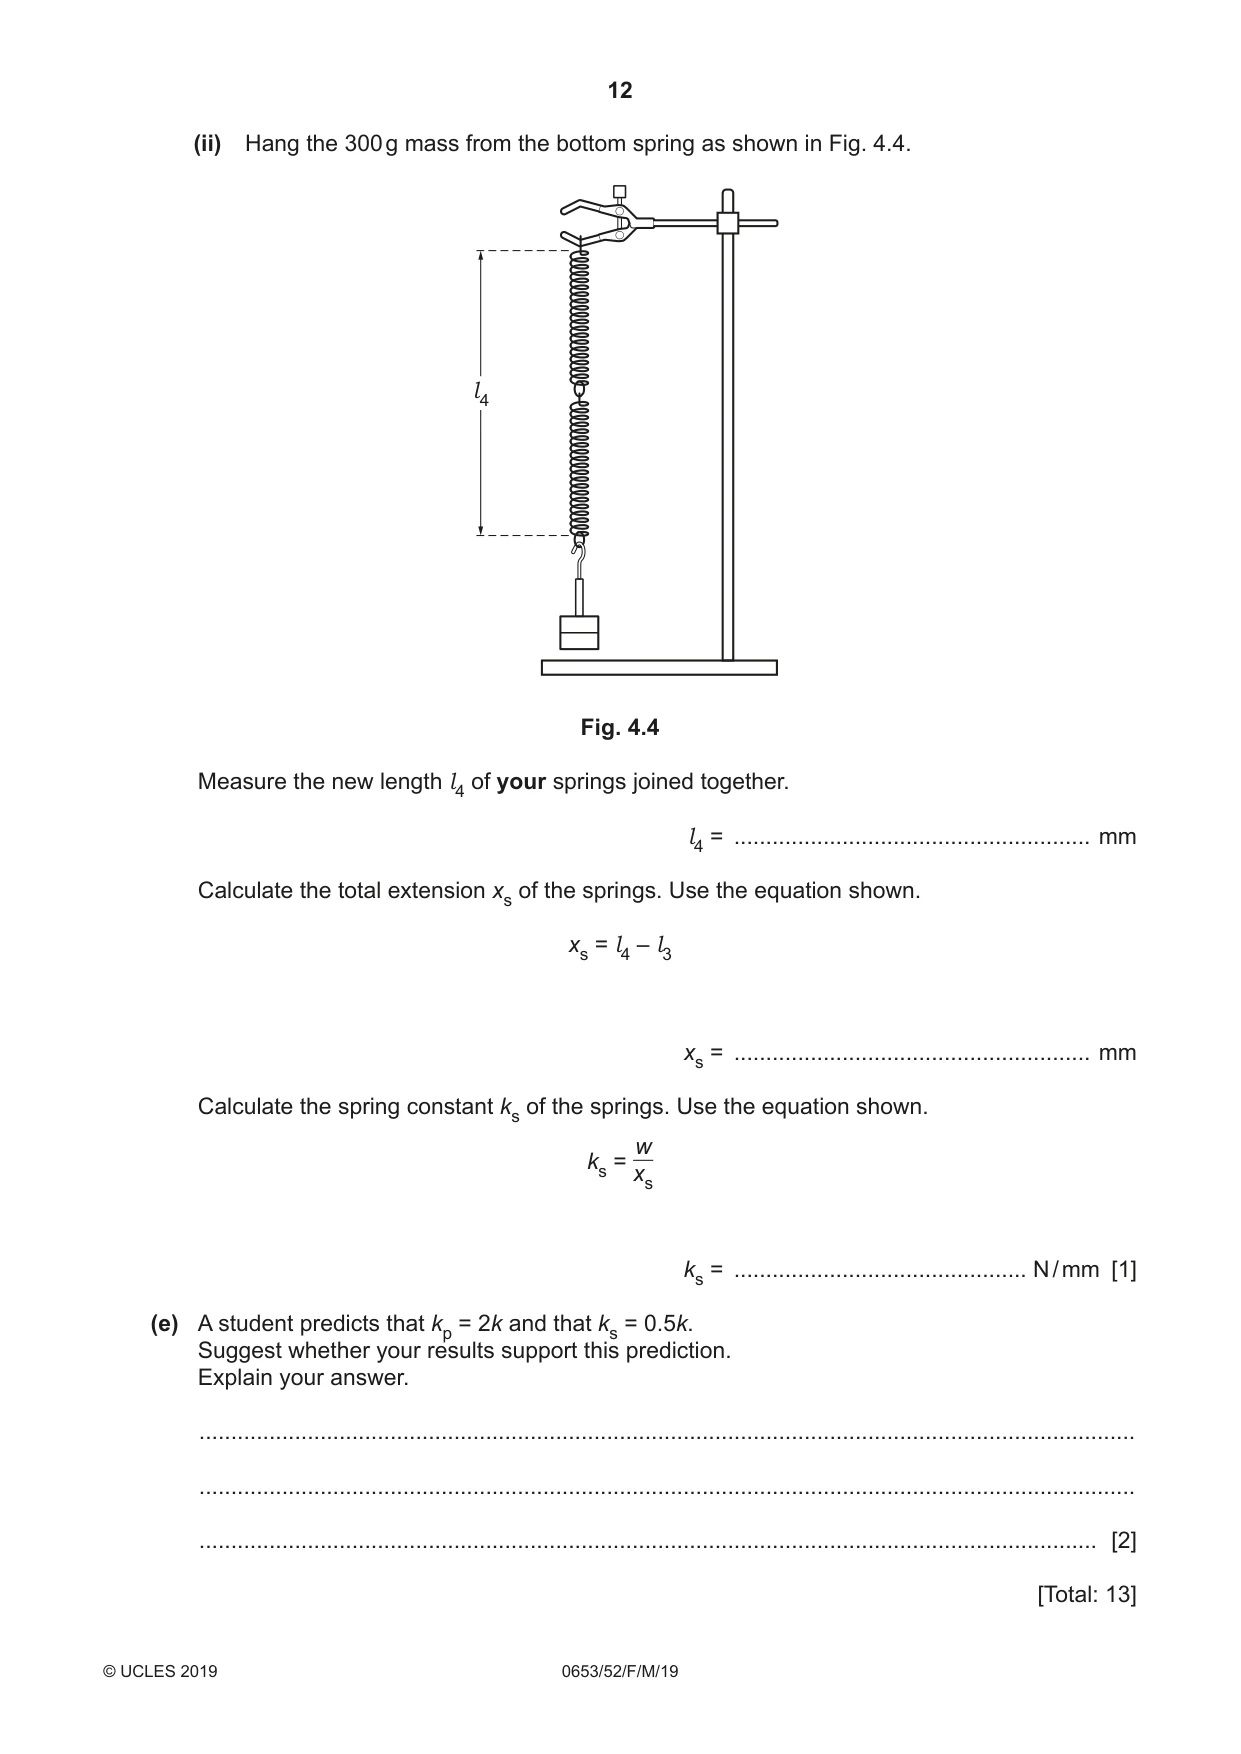
4 You are going to find the spring constant of different combinations of identical springs. The spring constant k of a spring is a measure of the spring’s stiffness. (a) (i) Measure the unstretched length l0 of one of the springs to the nearest mm. Do not include the loops at the end of the spring in your measurement. l0 = .................................................. mm [1] • Attach this spring to the clamp. • Hang a 300 g mass on the spring as shown in Fig. 4.1. clamp l1 spring mass Fig. 4.1 (ii) Measure the new length l1 of the spring to the nearest mm. l1 = .................................................. mm [1] (iii) Describe how you avoided a parallax (line of sight) error when measuring the length l1 of the spring. You may include a diagram in your description. ........................................................................................................................................... ..................................................................................................................................... [1] (b) (i) Calculate the extension x of the spring. Use your answers to (a)(i) and (a)(ii) and the equation shown. x = l1 – l0 x = .................................................. mm [1] (ii) A mass of 1.0 kg has a weight of 10 N. Determine the weight w of the 300 g mass. w = ..................................................... N [1] (iii) Calculate the spring constant k of the spring. Use your answer to (b)(i) and (b)(ii) and the equation shown. w k = x k = .............................................. N / mm [1] (c) Attach the second spring to the clamp in parallel with the first spring. Hang the 300 g mass from both springs as shown in Fig. 4.2. l2 Fig. 4.2 (i) Measure the new length l2 of your springs to the nearest mm. l2 = ........................................................ mm Calculate the extension xp of the springs. Use the equation shown. xp = l2 – l0 xp = .................................................. mm [1] (ii) Calculate the spring constant kp for the two springs in parallel. Use your answers from (b)(ii) and (c)(i) and the equation shown. Give your answer to an appropriate number of significant figures. w kp = xp kp = .............................................. N / mm [2] (d) • Remove the springs from the clamp. • Join the springs together in series by pushing a loop of one spring through a loop of the other spring. • Attach the springs to the clamp as shown in Fig. 4.3. l3 Fig. 4.3 (i) Measure the unstretched length l3 of your two springs, joined together in series, to the nearest mm. l3 = .................................................. mm [1]
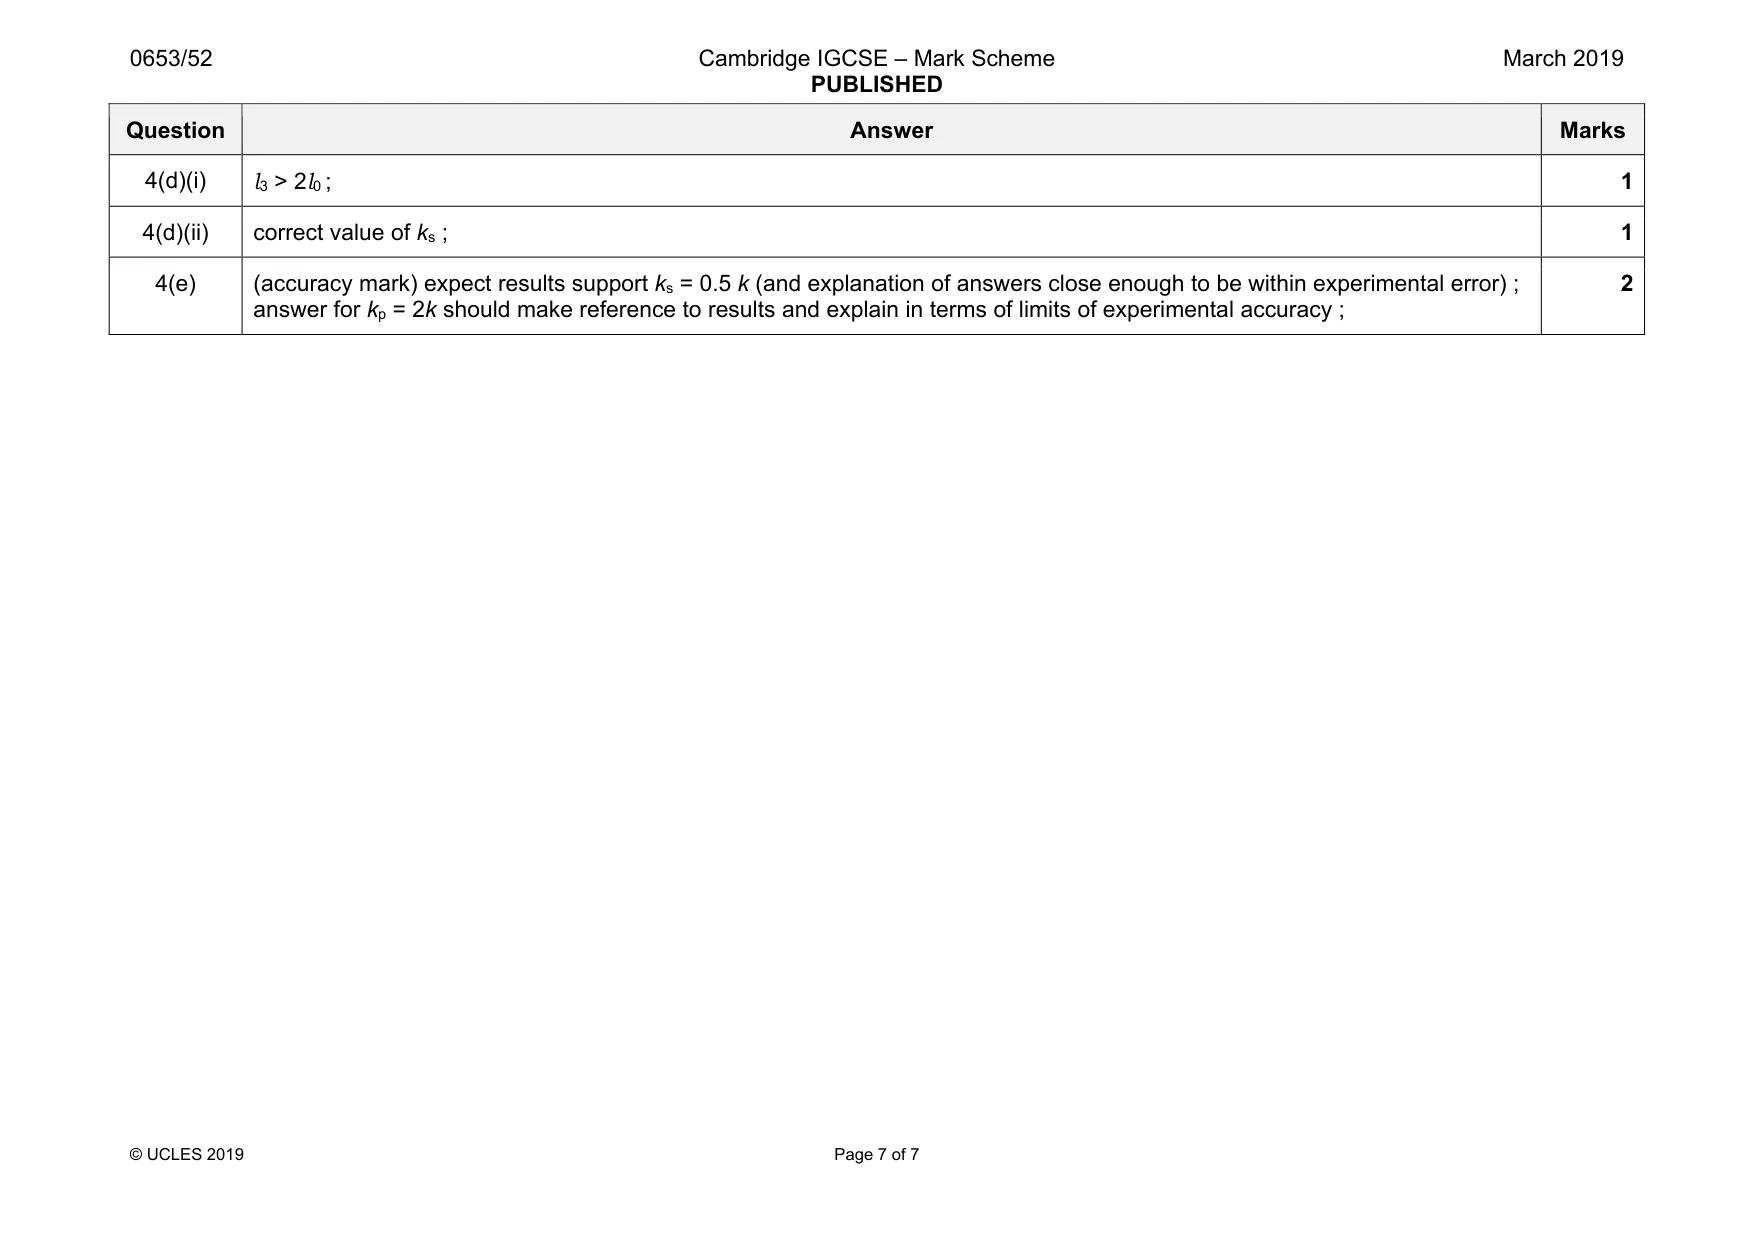
Mark scheme: 4(a)(i) sensible value recorded in whole mm ; 1 4(a)(ii) value > (i) in whole mm ; 1 4(a)(iii) look reading perpendicular to ruler / ruler close to spring / use of fiducial aid AVP ; 1 4(b)(i) correct answer based on their values in (a)(i) and (ii) ; 1 4(b)(ii) 3 N ; 1 4(b)(iii) correct calculation ; 1 4(c)(i) l2 < l1 and xp correct ; 1 4(c)(ii) correct value ; 2 or 3 sig figs. ; 2 Question Answer Marks 4(d)(i) l3 > 2l0 ; 1 4(d)(ii) correct value of ks ; 1 4(e) (accuracy mark) expect results support ks = 0.5 k (and explanation of answers close enough to be within experimental error) ; answer for kp = 2k should make reference to results and explain in terms of limits of experimental accuracy ; 2
What was in this paper
The subtopics covered by these 4 questions, and how many questions each got. Open one in a new tab to see every Cambridge question on it.
What you needed in this session
Cambridge’s own grade thresholds for 2019 Feb/March, Paper 5 · Variant 2. A higher threshold means an easier paper — the bar moves with how the cohort did.