Cambridge IGCSE Physics (9-1) 0972 — 2021 May/June Paper 6 · Variant 1
0972/61/M/J/21 · 4 questions · 40 marks · ≈45 min
The question paper and its mark scheme, free to read here and free to download. This is Cambridge’s own paper, exactly as it was sat.
Question paper12 pages

Mark scheme8 pages
Answers below. Sit the paper first if you are practising.
Questions as text
Q1 · A student investigates the period of a pendulum
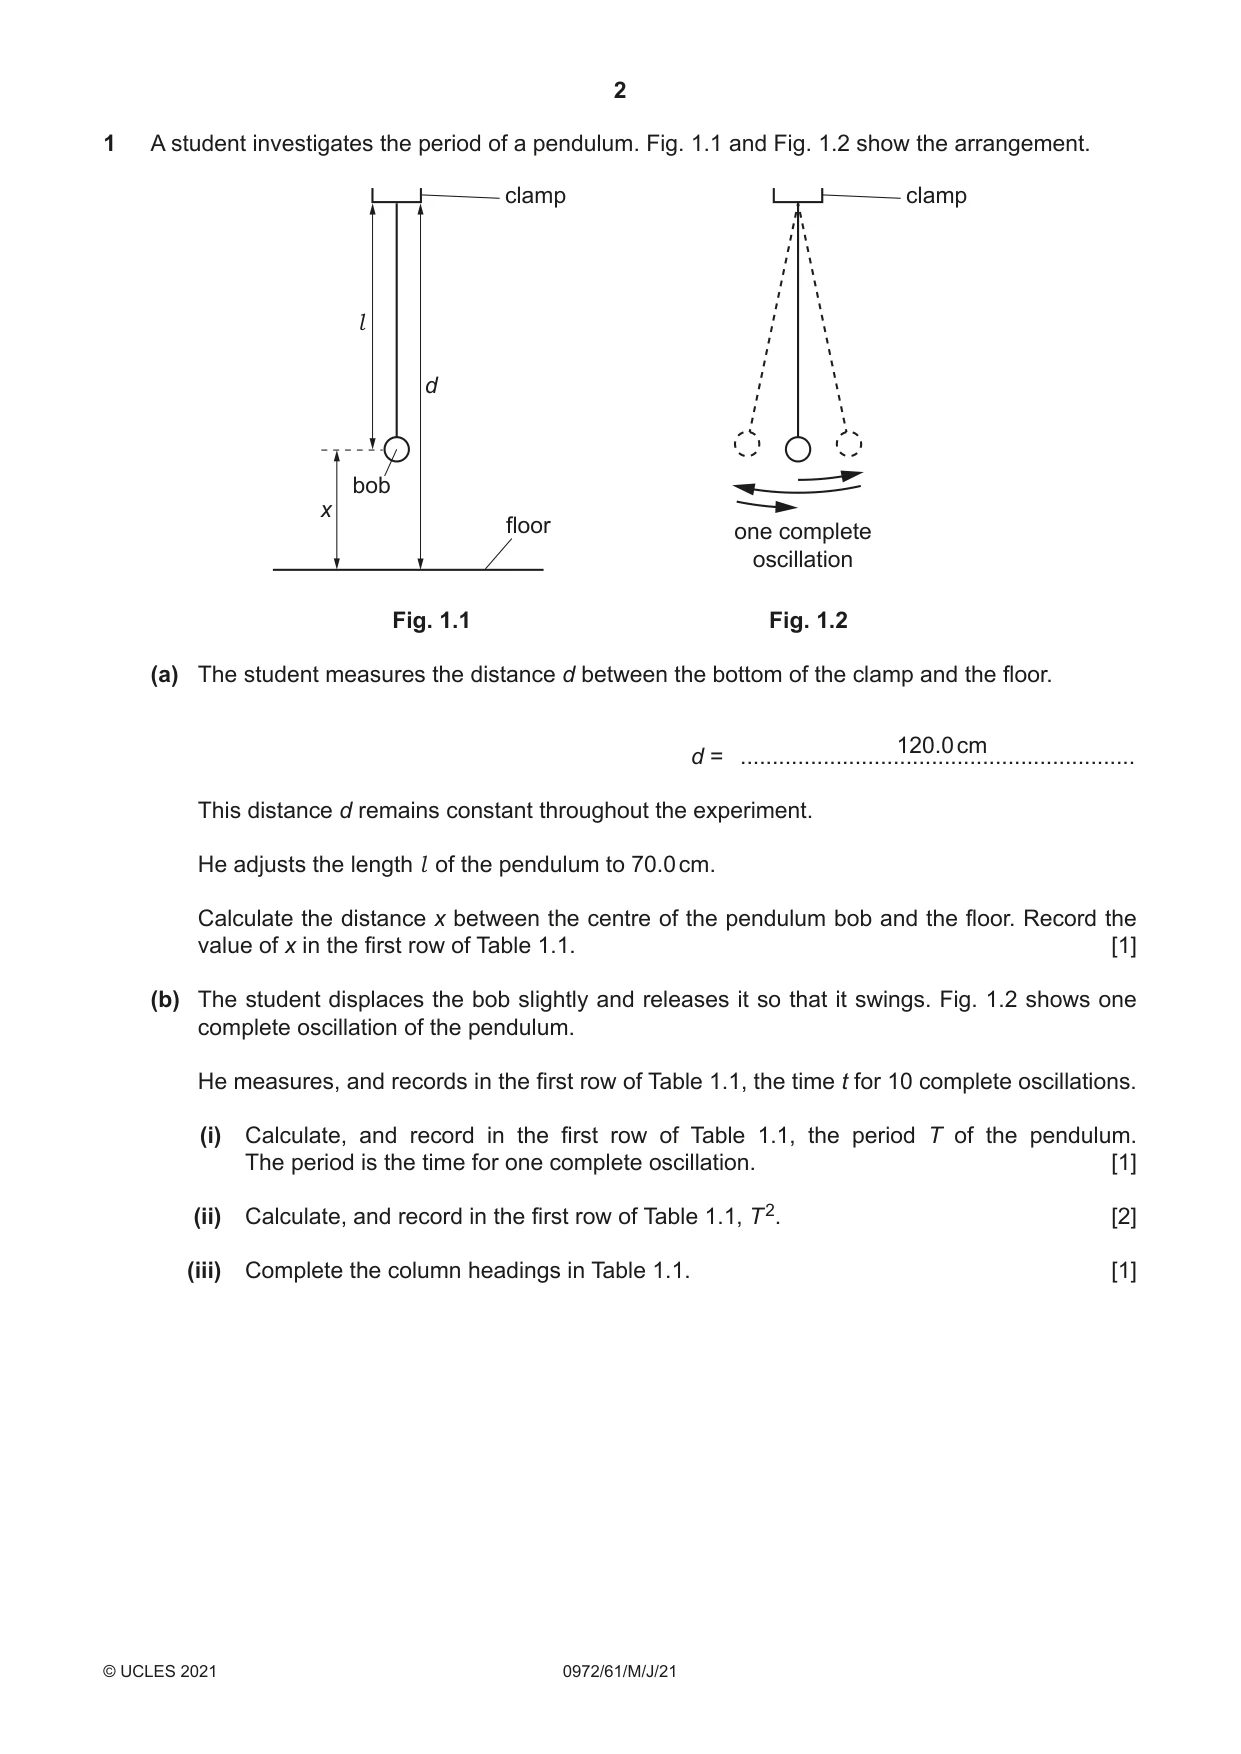
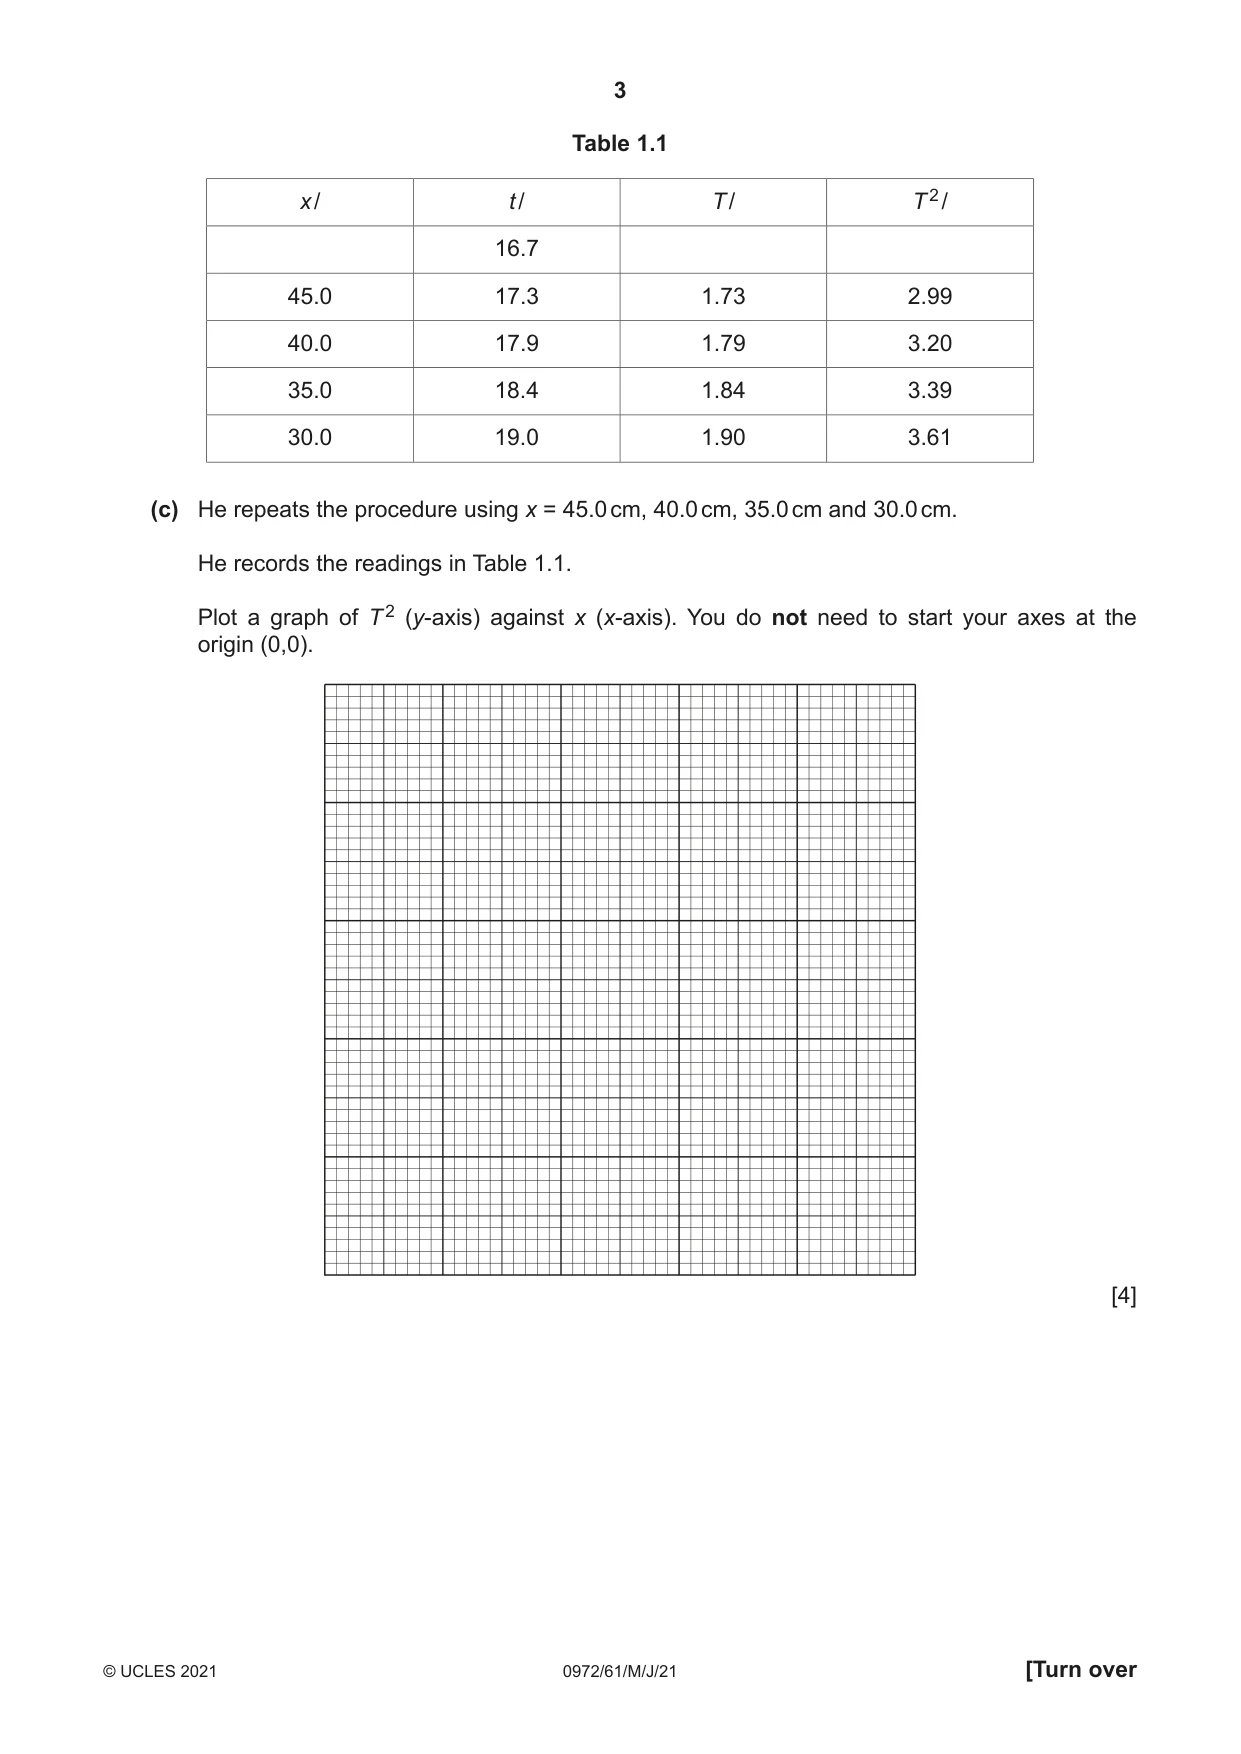
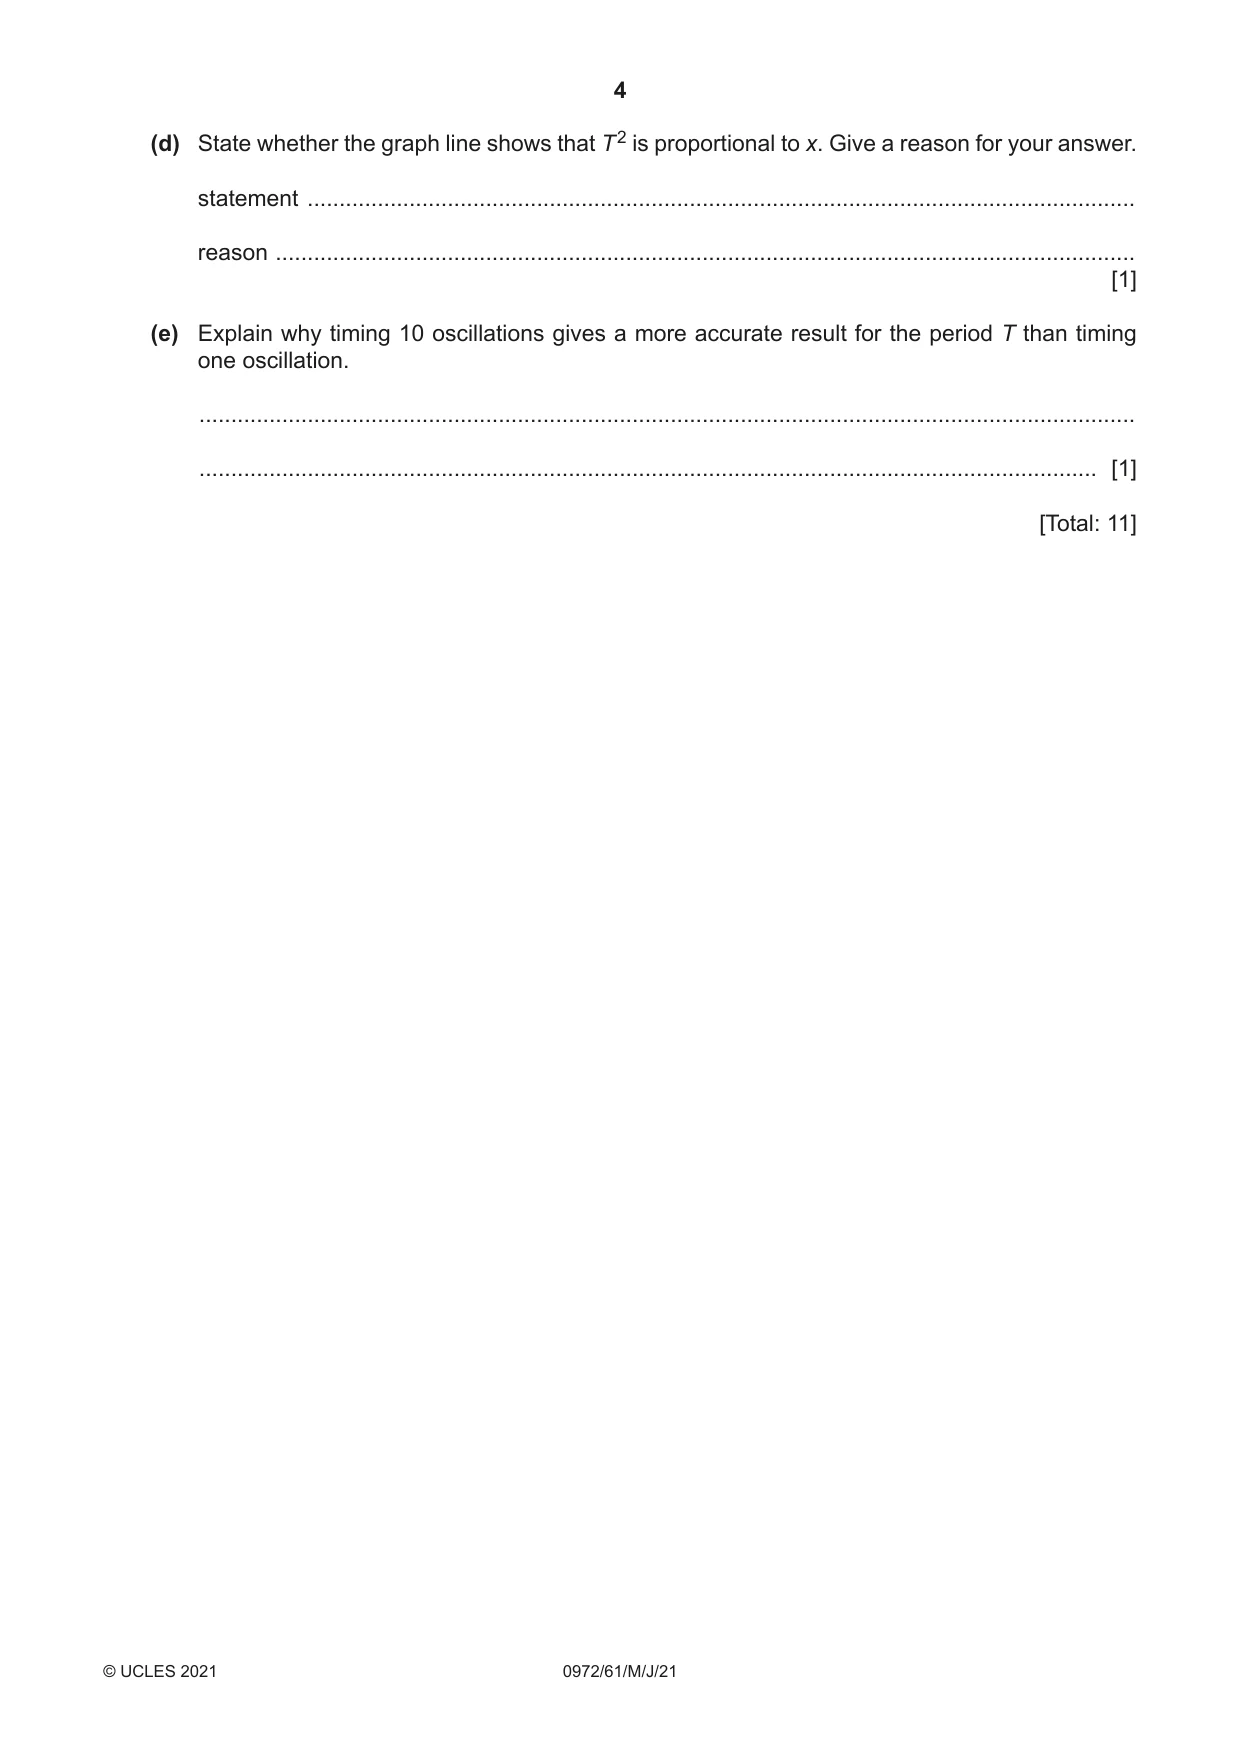
1 A student investigates the period of a pendulum. Fig. 1.1 and Fig. 1.2 show the arrangement. clamp clamp l d bob x floor one complete oscillation Fig. 1.1 Fig. 1.2 (a) The student measures the distance d between the bottom of the clamp and the floor. 120.0 cm d = .............................................................. This distance d remains constant throughout the experiment. He adjusts the length l of the pendulum to 70.0 cm. Calculate the distance x between the centre of the pendulum bob and the floor. Record the value of x in the first row of Table 1.1. [1] (b) The student displaces the bob slightly and releases it so that it swings. Fig. 1.2 shows one complete oscillation of the pendulum. He measures, and records in the first row of Table 1.1, the time t for 10 complete oscillations. (i) Calculate, and record in the first row of Table 1.1, the period T of the pendulum. The period is the time for one complete oscillation. [1] (ii) Calculate, and record in the first row of Table 1.1, T 2. [2] (iii) Complete the column headings in Table 1.1. [1] Table 1.1 x / t / T / T 2 / 16.7 45.0 17.3 1.73 2.99 40.0 17.9 1.79 3.20 35.0 18.4 1.84 3.39 30.0 19.0 1.90 3.61 (c) He repeats the procedure using x = 45.0 cm, 40.0 cm, 35.0 cm and 30.0 cm. He records the readings in Table 1.1. Plot a graph of T 2 (y-axis) against x (x-axis). You do not need to start your axes at the origin (0,0). [4] (d) State whether the graph line shows that T 2 is proportional to x. Give a reason for your answer. statement .................................................................................................................................. reason ....................................................................................................................................... [1] (e) Explain why timing 10 oscillations gives a more accurate result for the period T than timing one oscillation. ................................................................................................................................................... ............................................................................................................................................. [1] [Total: 11]
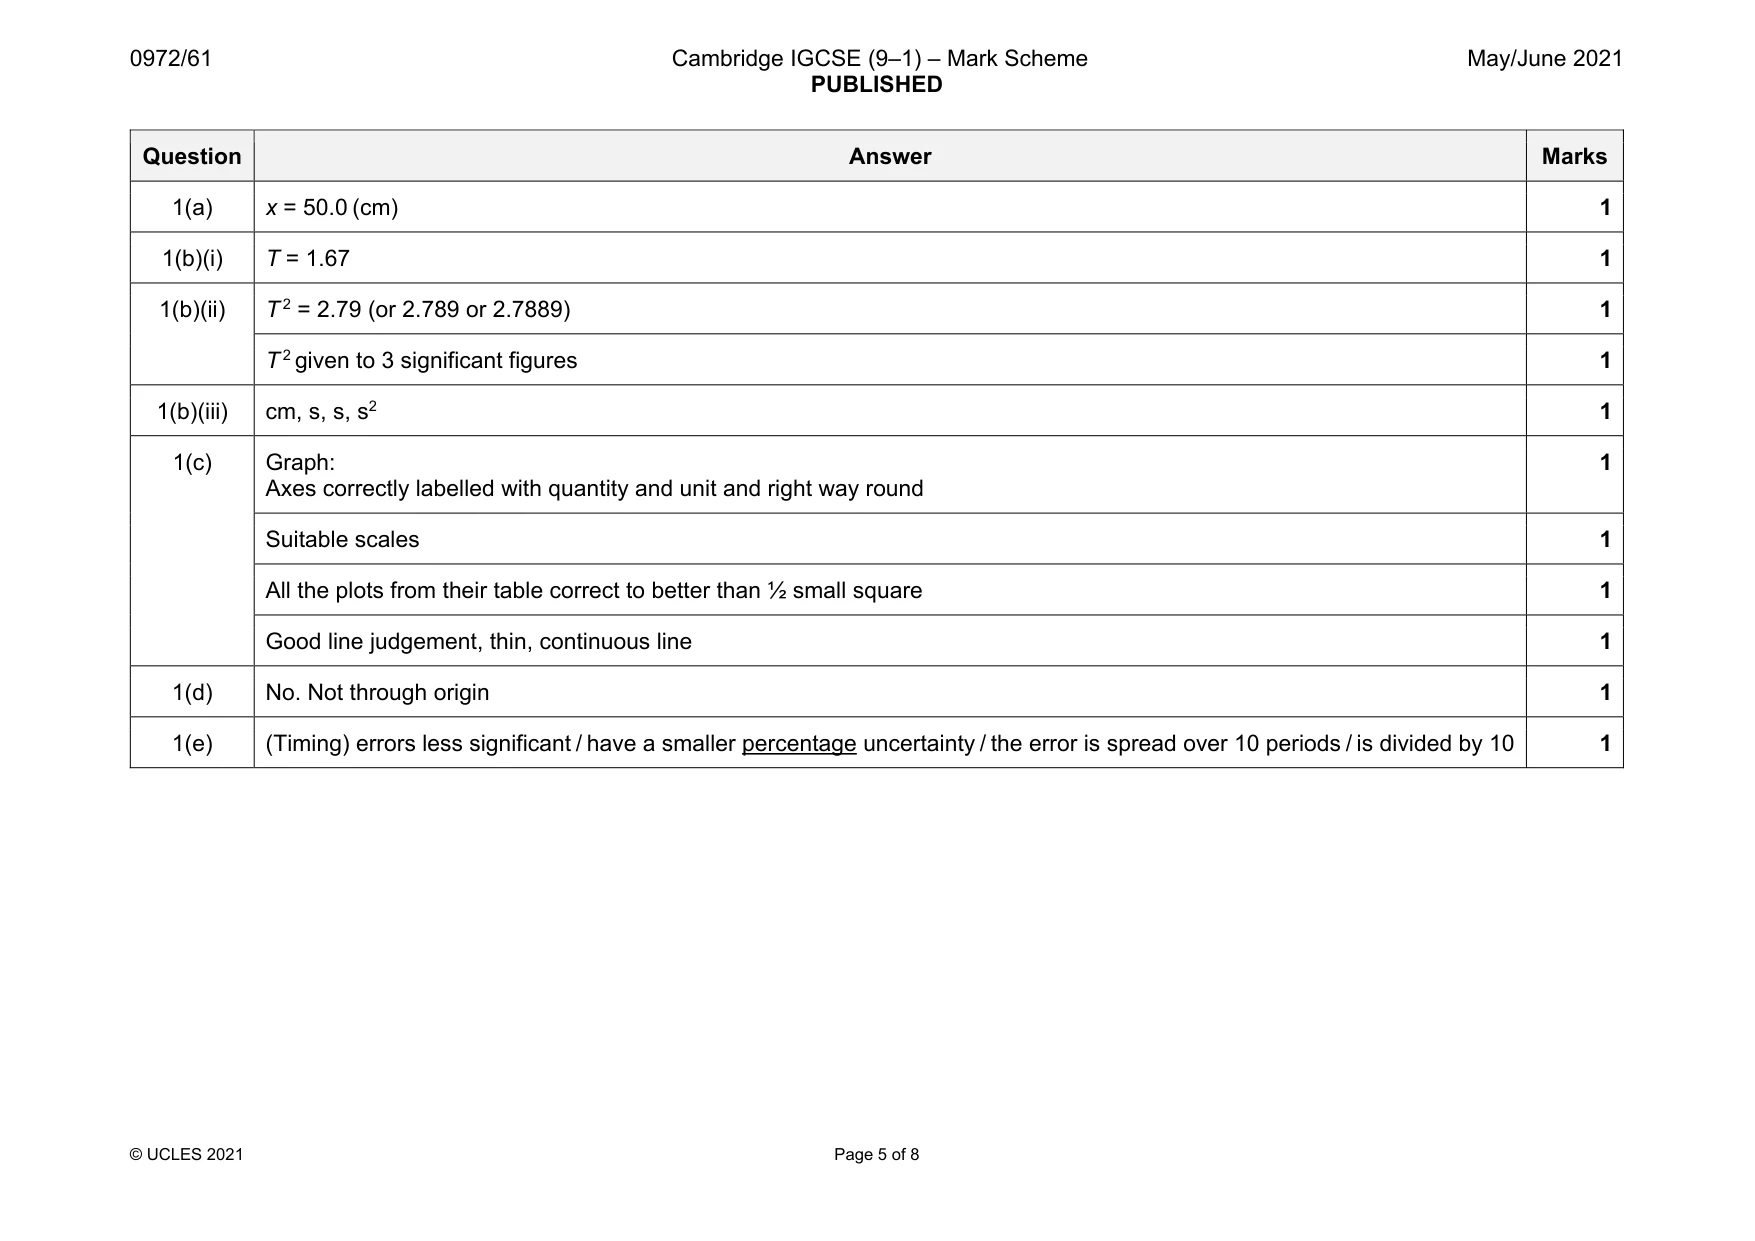
Mark scheme: 1(a) x = 50.0 (cm) 1 1(b)(i) T = 1.67 1 1(b)(ii) T 2 = 2.79 (or 2.789 or 2.7889) 1 T 2 given to 3 significant figures 1 1(b)(iii) cm, s, s, s2 1 1(c) Graph: Axes correctly labelled with quantity and unit and right way round 1 Suitable scales 1 All the plots from their table correct to better than ½ small square 1 Good line judgement, thin, continuous line 1 1(d) No. Not through origin 1 1(e) (Timing) errors less significant / have a smaller percentage uncertainty / the error is spread over 10 periods / is divided by 10 1
Q2 · A student investigates resistance
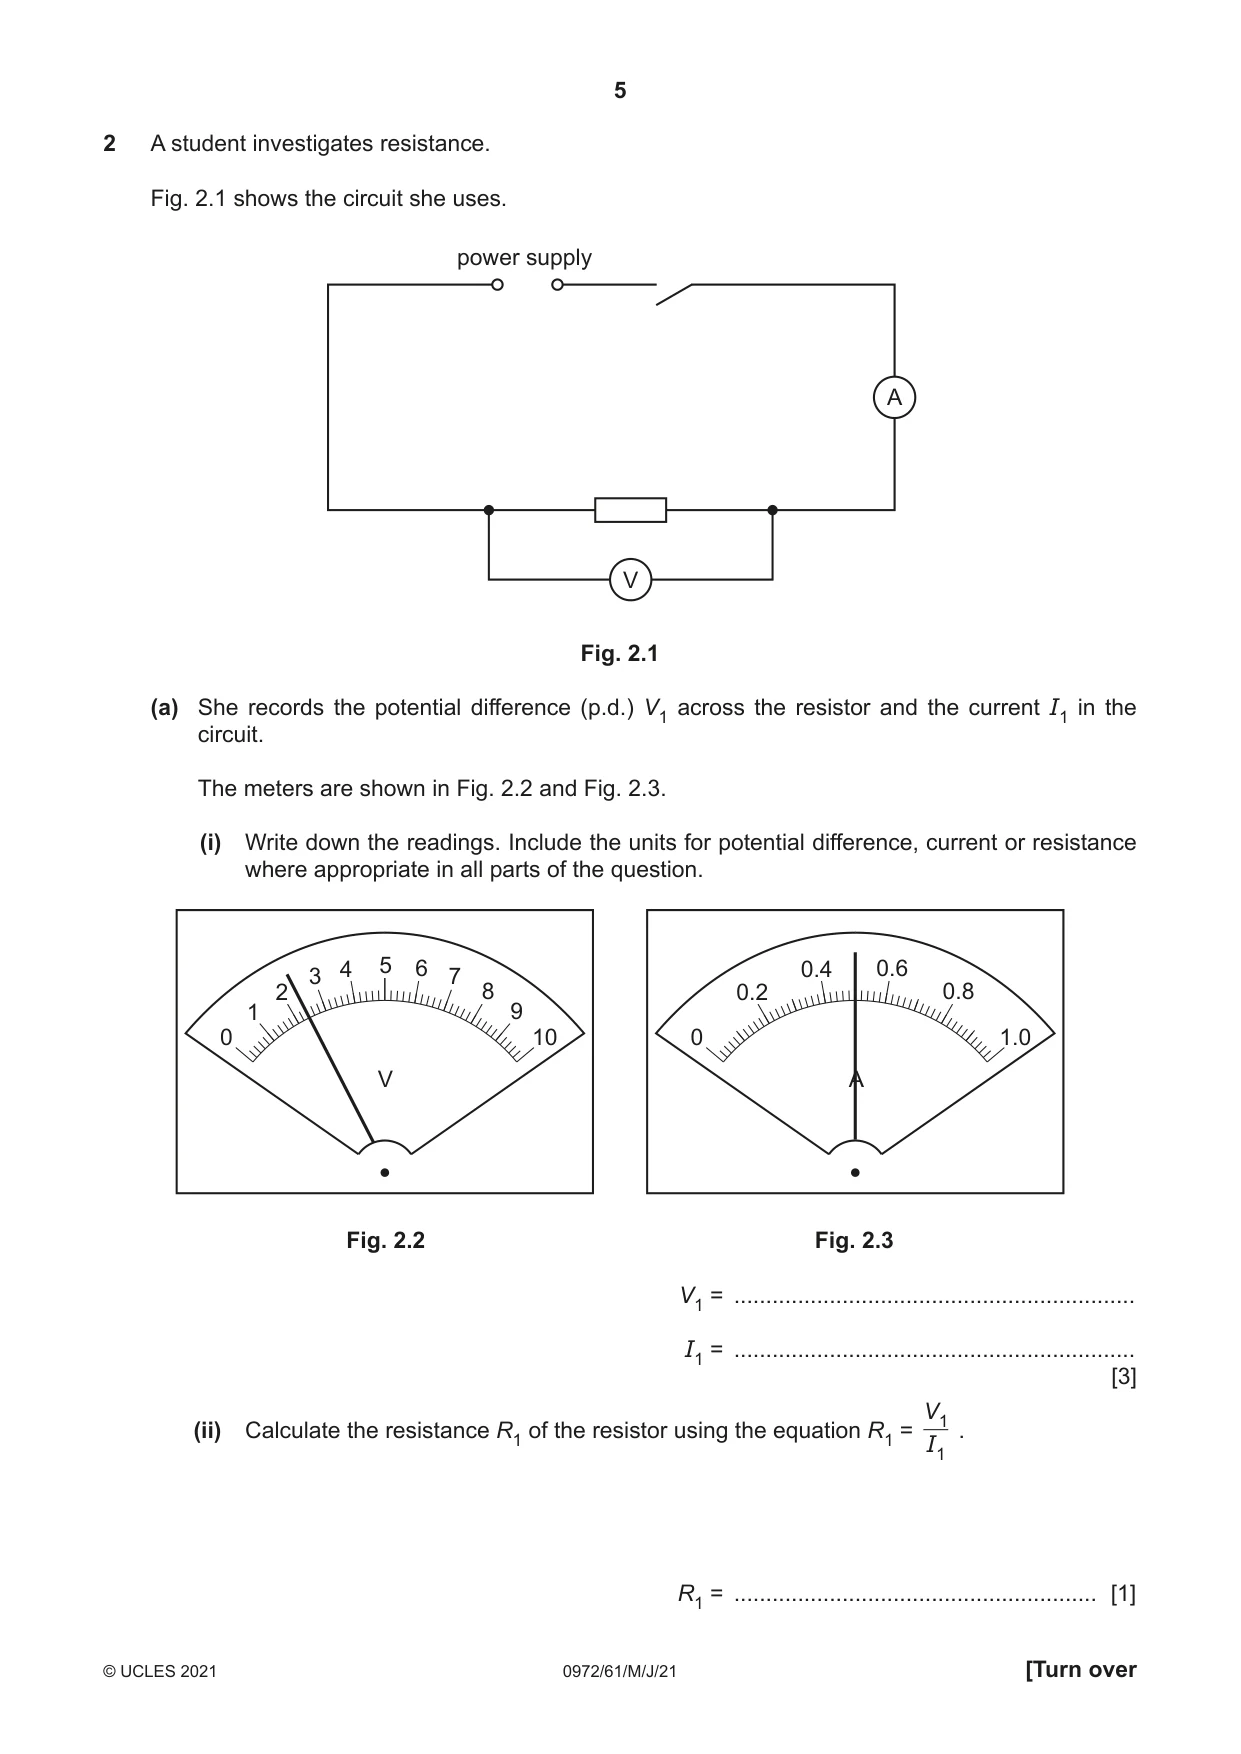
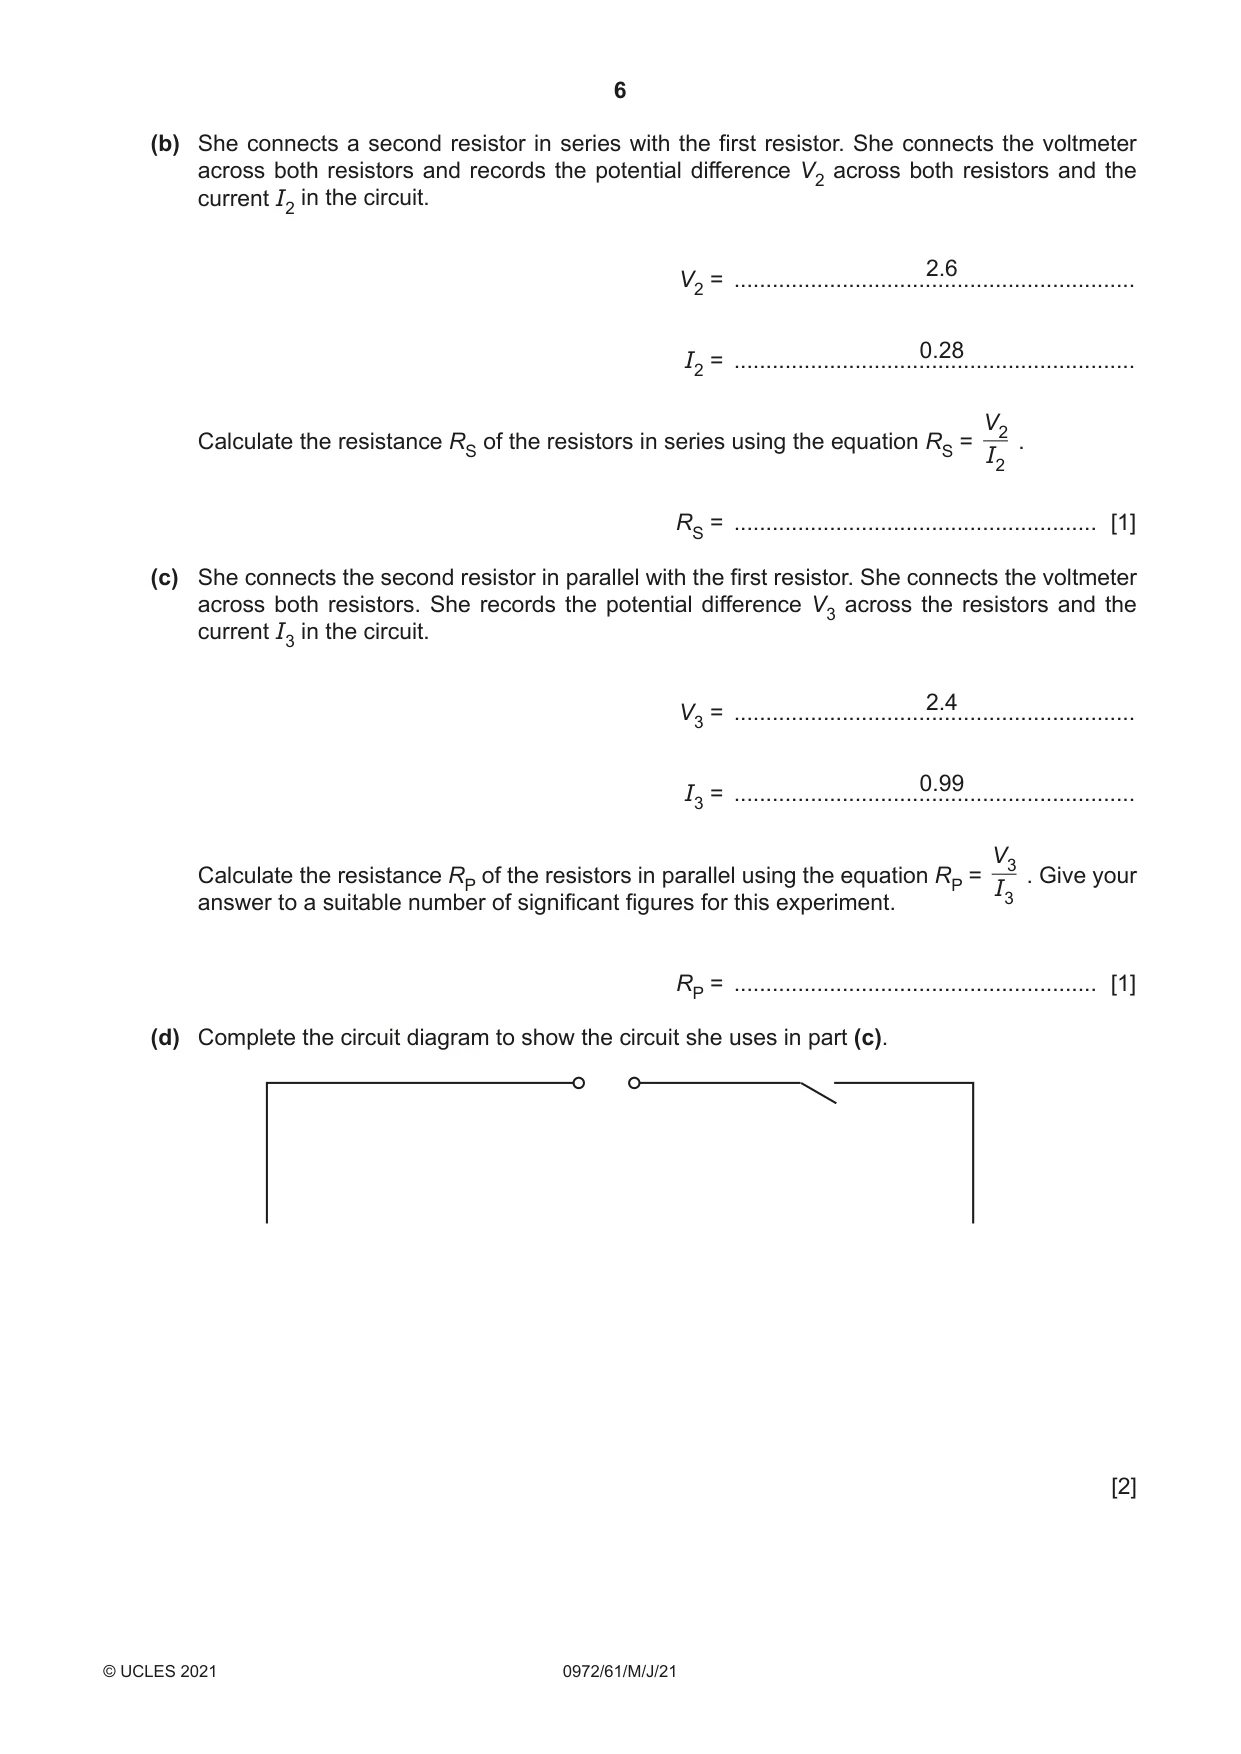
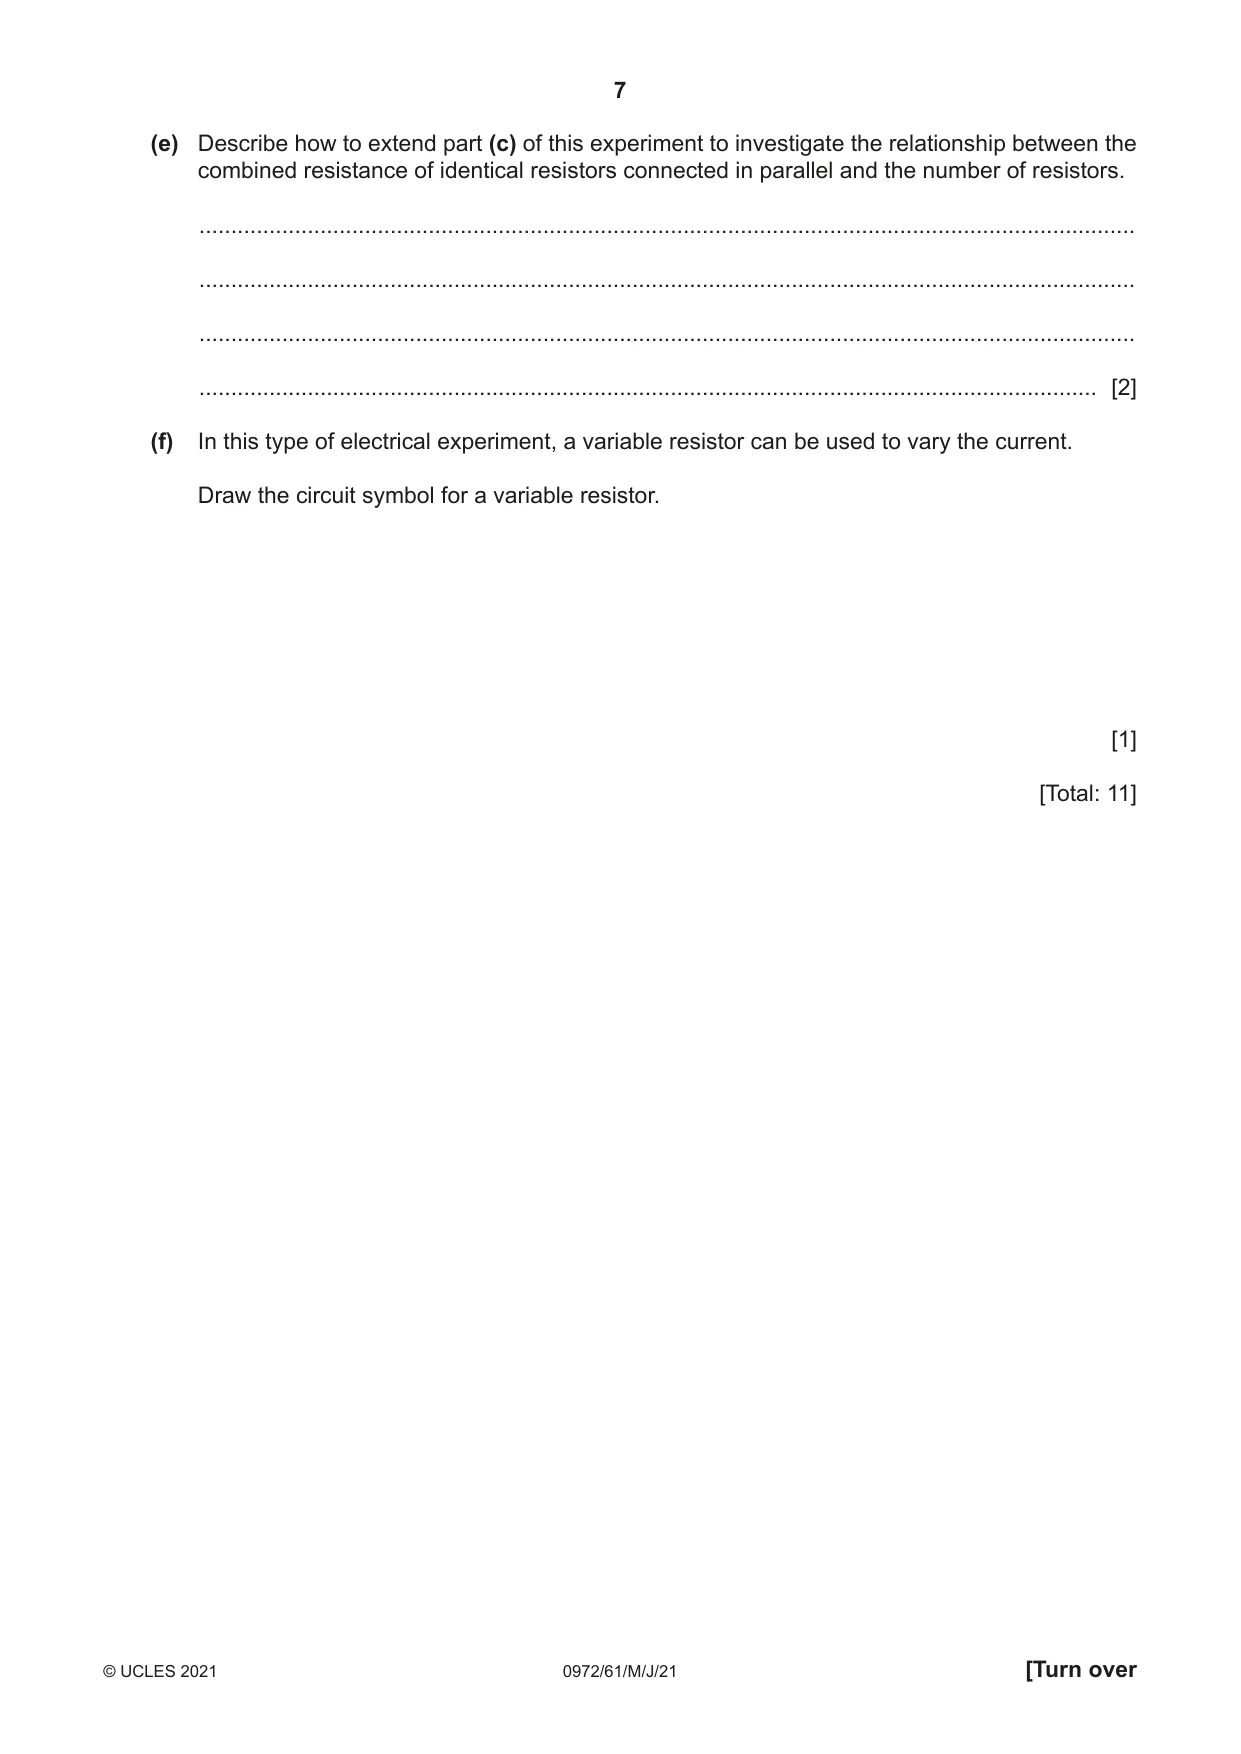
2 A student investigates resistance. Fig. 2.1 shows the circuit she uses. power supply A V Fig. 2.1 (a) She records the potential difference (p.d.) V1 across the resistor and the current I1 in the circuit. The meters are shown in Fig. 2.2 and Fig. 2.3. (i) Write down the readings. Include the units for potential difference, current or resistance where appropriate in all parts of the question. 4 5 6 0.4 0.6 3 7 2 8 0.2 0.8 1 9 0 10 0 1.0 V A Fig. 2.2 Fig. 2.3 V1 = ............................................................... I1 = ............................................................... [3] V1 (ii) Calculate the resistance R1 of the resistor using the equation R1 = . I1 R1 = ......................................................... [1] (b) She connects a second resistor in series with the first resistor. She connects the voltmeter across both resistors and records the potential difference V2 across both resistors and the current I2 in the circuit. 2.6 V2 = ............................................................... 0.28 I2 = ............................................................... V2 Calculate the resistance RS of the resistors in series using the equation RS = . I2 RS = ......................................................... [1] (c) She connects the second resistor in parallel with the first resistor. She connects the voltmeter across both resistors. She records the potential difference V3 across the resistors and the current I3 in the circuit. 2.4 V3 = ............................................................... 0.99 I3 = ............................................................... V3 Calculate the resistance RP of the resistors in parallel using the equation RP = . Give your I3 answer to a suitable number of significant figures for this experiment. RP = ......................................................... [1] (d) Complete the circuit diagram to show the circuit she uses in part (c). [2] (e) Describe how to extend part (c) of this experiment to investigate the relationship between the combined resistance of identical resistors connected in parallel and the number of resistors. ................................................................................................................................................... ................................................................................................................................................... ................................................................................................................................................... ............................................................................................................................................. [2] (f) In this type of electrical experiment, a variable resistor can be used to vary the current. Draw the circuit symbol for a variable resistor. [1] [Total: 11]
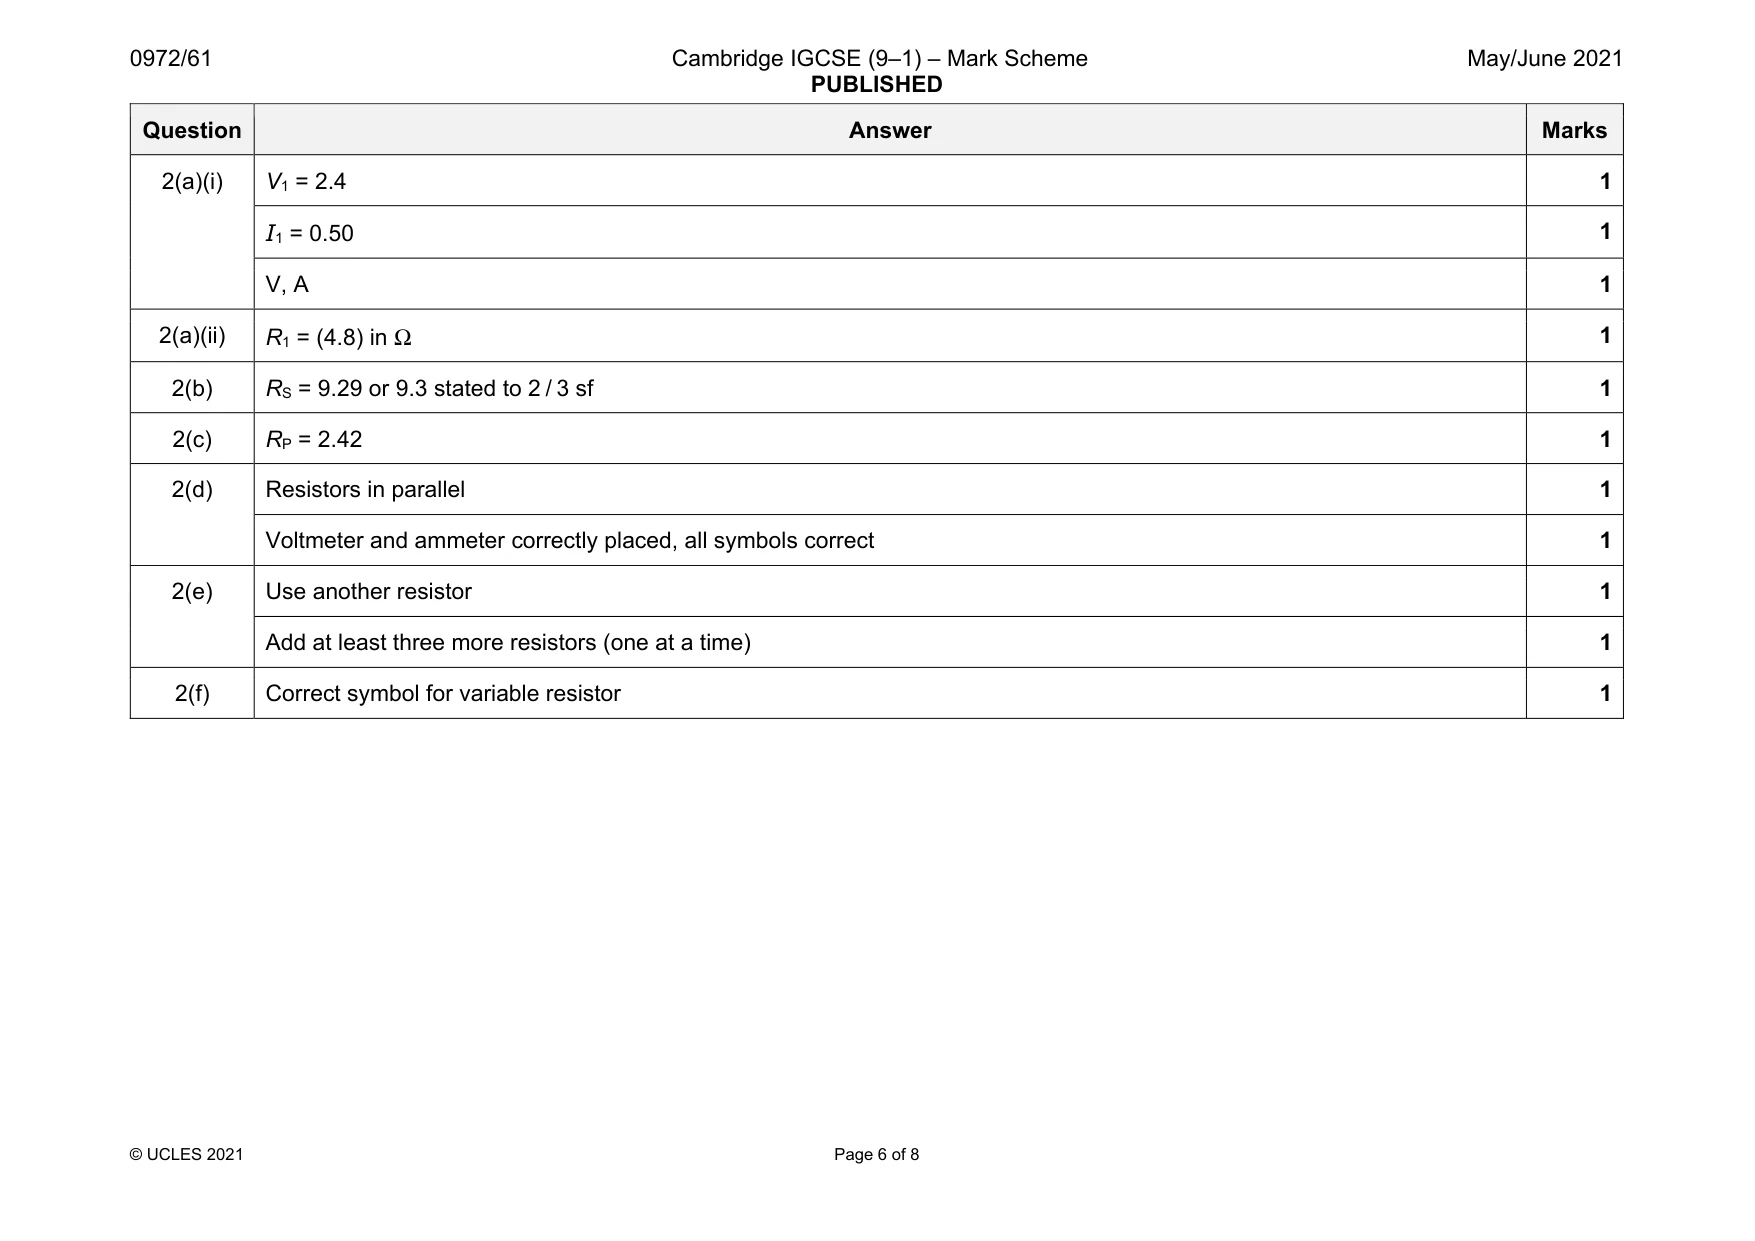
Mark scheme: 2(a)(i) V1 = 2.4 1 I1 = 0.50 1 V, A 1 2(a)(ii) R1 = (4.8) in Ω 1 2(b) RS = 9.29 or 9.3 stated to 2 / 3 sf 1 2(c) RP = 2.42 1 2(d) Resistors in parallel 1 Voltmeter and ammeter correctly placed, all symbols correct 1 2(e) Use another resistor 1 Add at least three more resistors (one at a time) 1 2(f) Correct symbol for variable resistor 1
Q3 · A student investigates the refraction of light through a transparent block
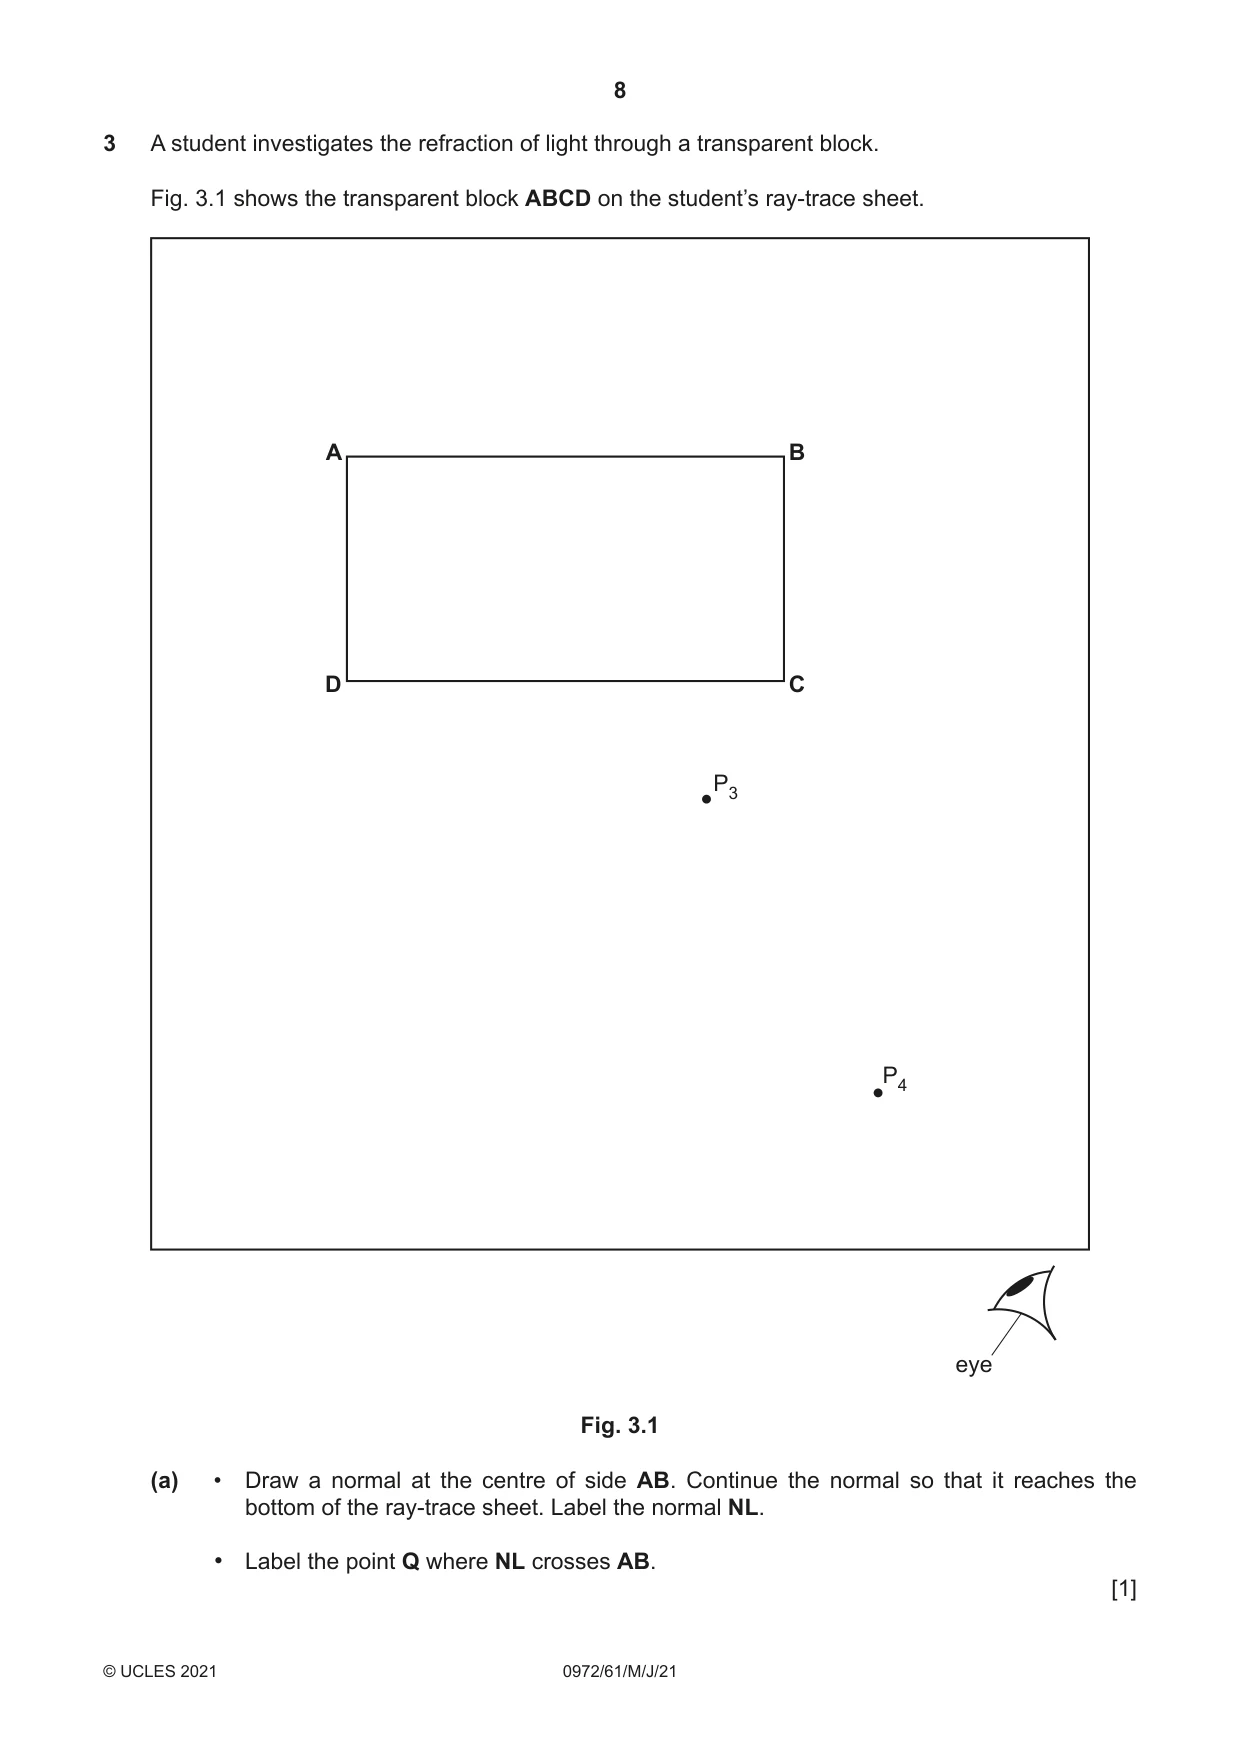
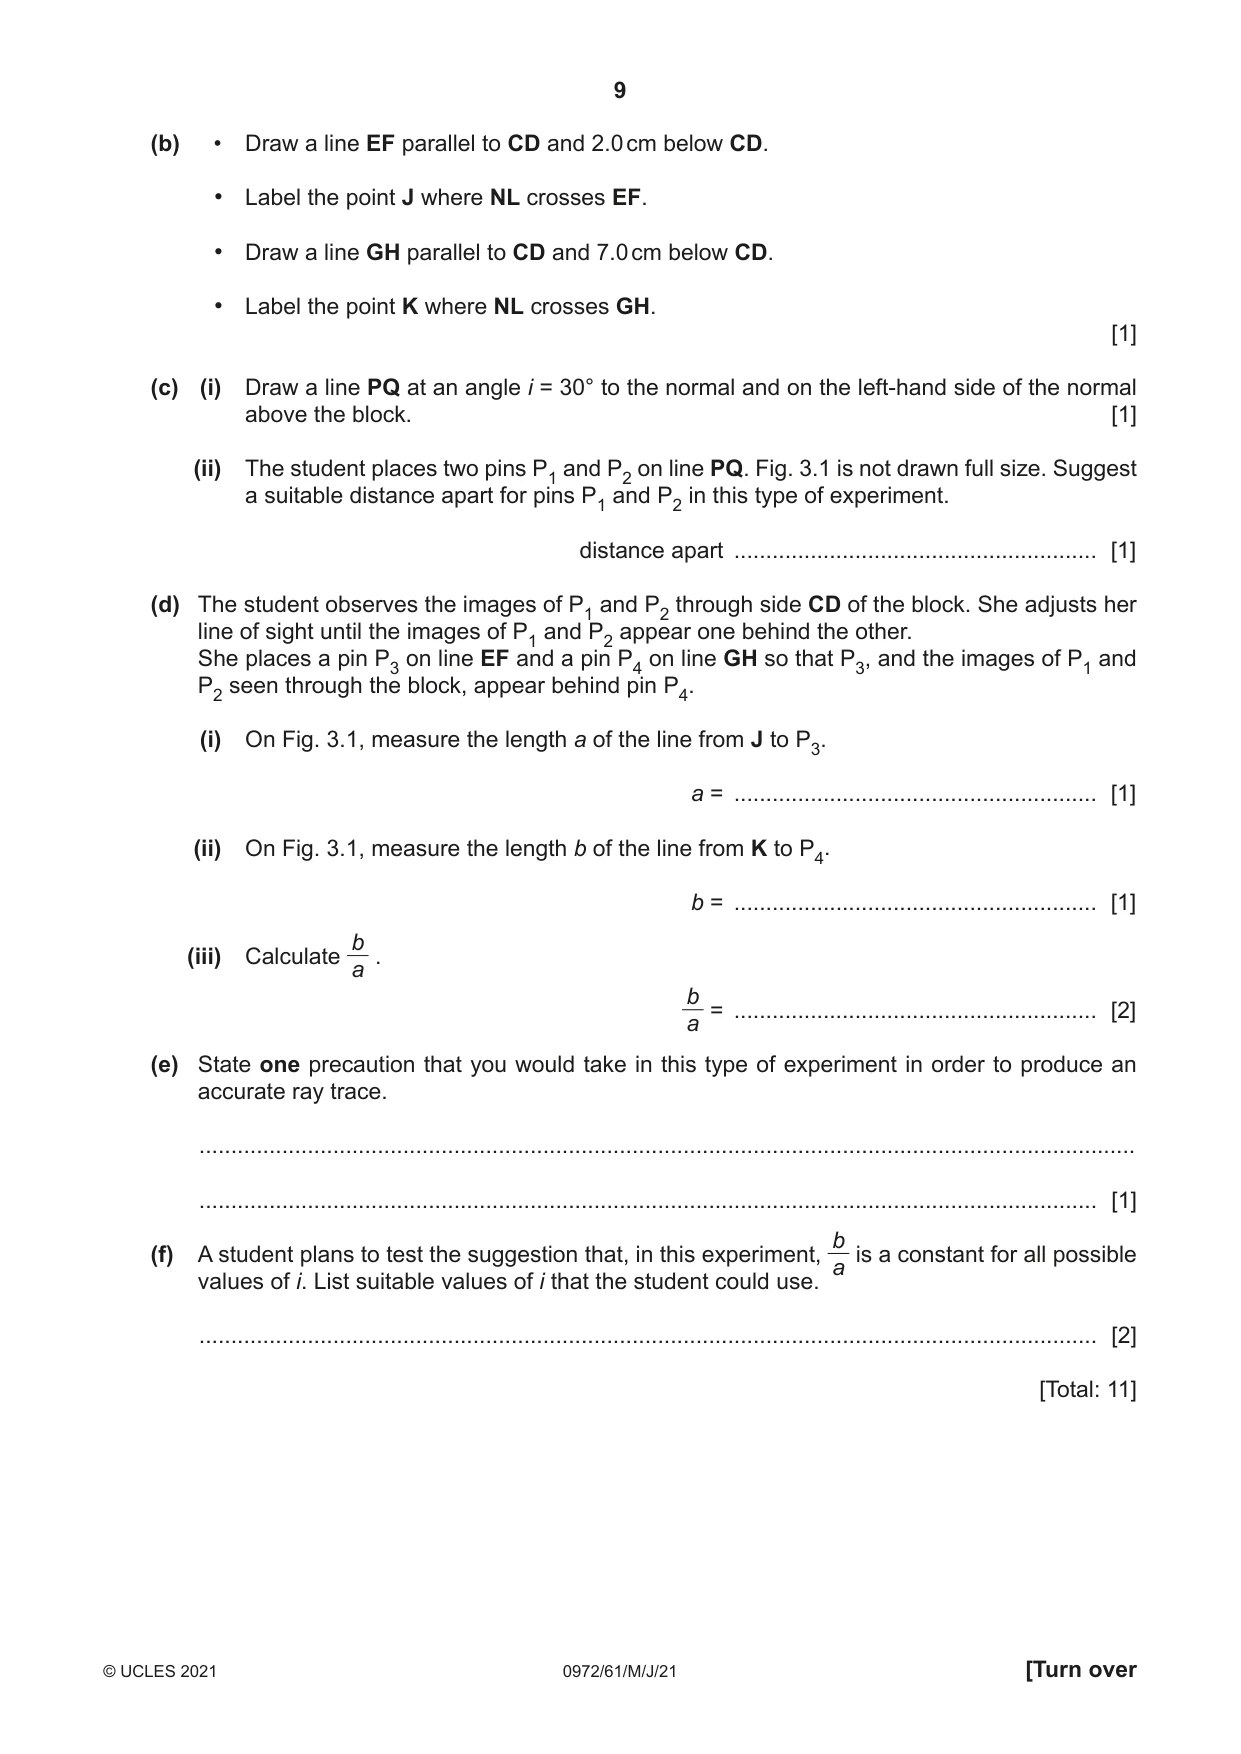
3 A student investigates the refraction of light through a transparent block. Fig. 3.1 shows the transparent block ABCD on the student’s ray-trace sheet. A B D C P3 P4 eye Fig. 3.1 (a) • Draw a normal at the centre of side AB. Continue the normal so that it reaches the bottom of the ray-trace sheet. Label the normal NL. • Label the point Q where NL crosses AB. [1] (b) • Draw a line EF parallel to CD and 2.0 cm below CD. • Label the point J where NL crosses EF. • Draw a line GH parallel to CD and 7.0 cm below CD. • Label the point K where NL crosses GH. [1] (c) (i) Draw a line PQ at an angle i = 30° to the normal and on the left-hand side of the normal above the block. [1] (ii) The student places two pins P1 and P2 on line PQ. Fig. 3.1 is not drawn full size. Suggest a suitable distance apart for pins P1 and P2 in this type of experiment. distance apart ......................................................... [1] (d) The student observes the images of P1 and P2 through side CD of the block. She adjusts her line of sight until the images of P1 and P2 appear one behind the other. She places a pin P3 on line EF and a pin P4 on line GH so that P3, and the images of P1 and P2 seen through the block, appear behind pin P4. (i) On Fig. 3.1, measure the length a of the line from J to P3. a = ......................................................... [1] (ii) On Fig. 3.1, measure the length b of the line from K to P4. b = ......................................................... [1] b (iii) Calculate . a b = ......................................................... [2] a (e) State one precaution that you would take in this type of experiment in order to produce an accurate ray trace. ................................................................................................................................................... ............................................................................................................................................. [1] b(f) A student plans to test the suggestion that, in this experiment, is a constant for all possible a values of i. List suitable values of i that the student could use. ............................................................................................................................................. [2] [Total: 11]
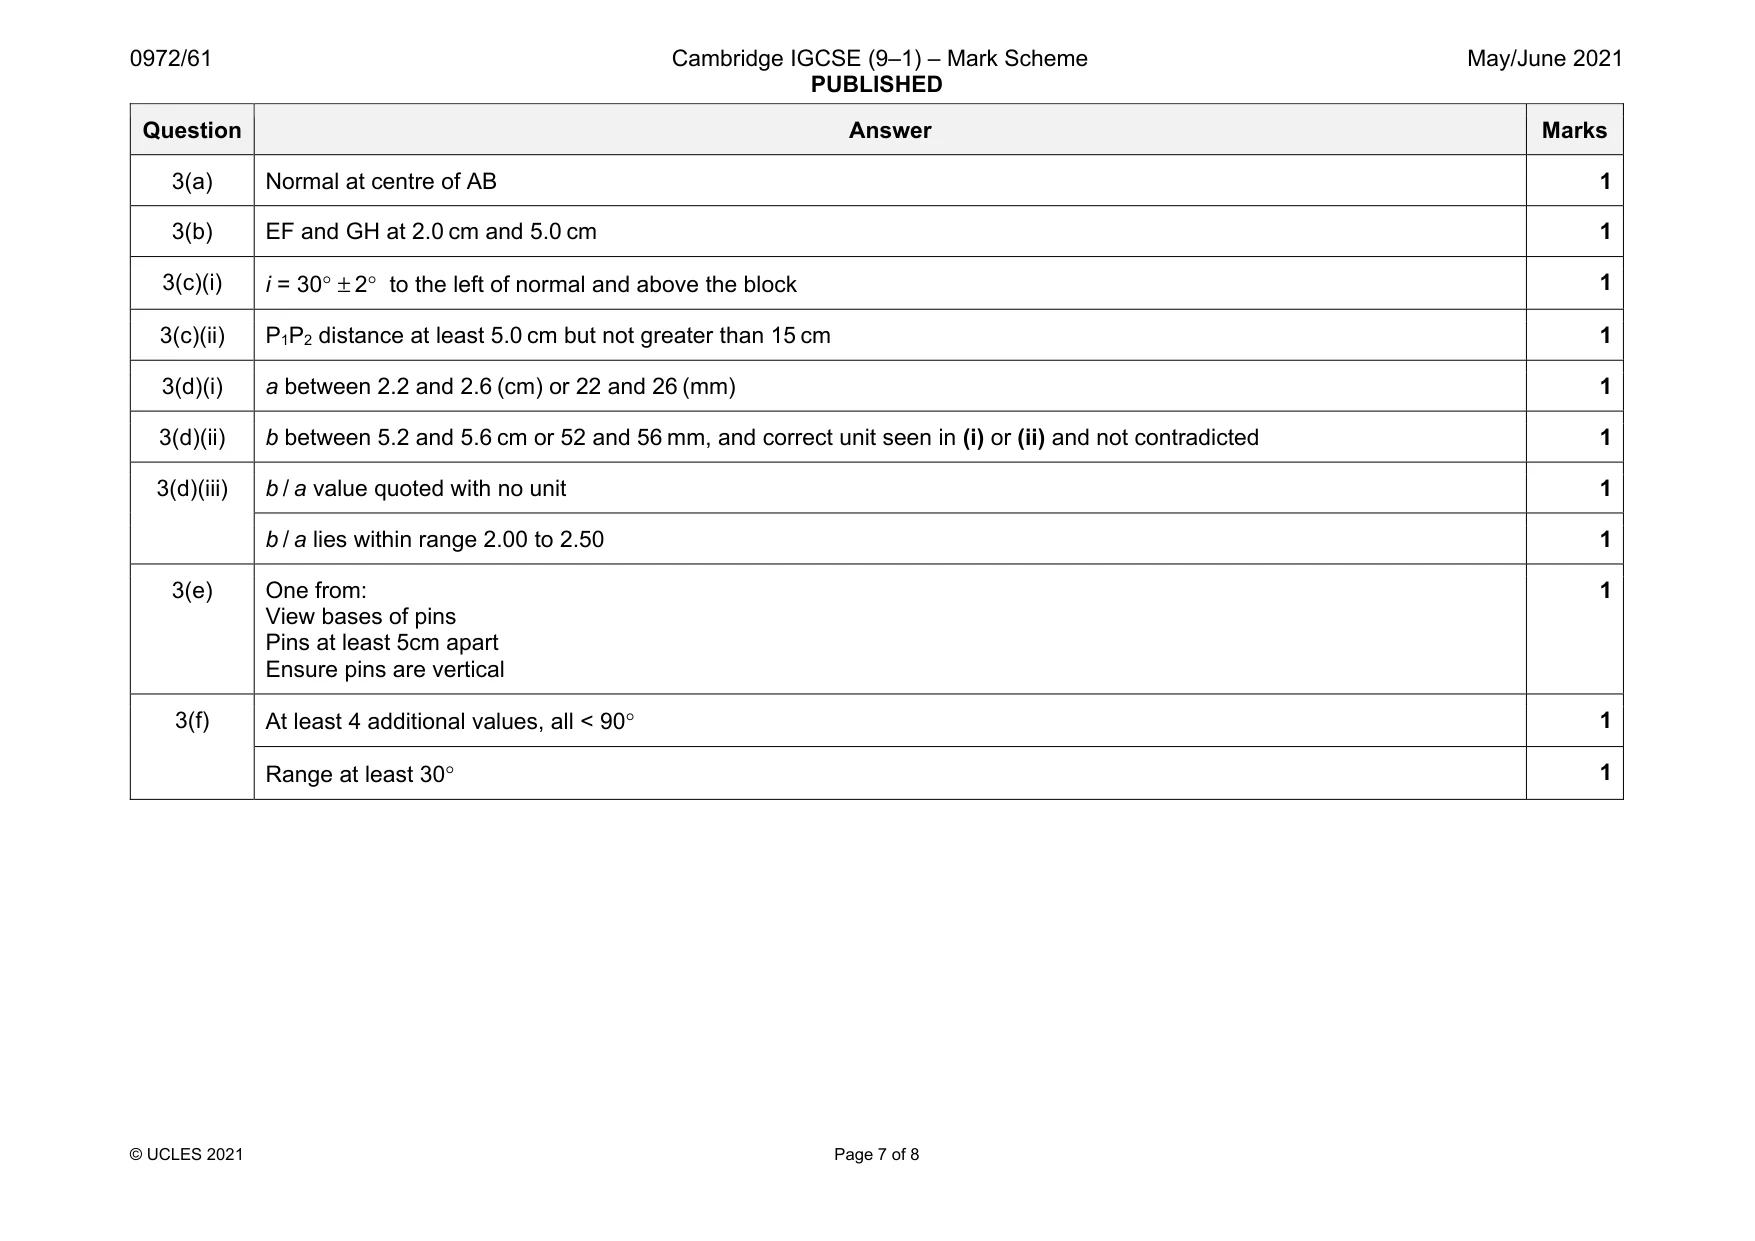
Mark scheme: 3(a) Normal at centre of AB 1 3(b) EF and GH at 2.0 cm and 5.0 cm 1 3(c)(i) i = 30° ± 2° to the left of normal and above the block 1 3(c)(ii) P1P2 distance at least 5.0 cm but not greater than 15 cm 1 3(d)(i) a between 2.2 and 2.6 (cm) or 22 and 26 (mm) 1 3(d)(ii) b between 5.2 and 5.6 cm or 52 and 56 mm, and correct unit seen in (i) or (ii) and not contradicted 1 3(d)(iii) b / a value quoted with no unit 1 b / a lies within range 2.00 to 2.50 1 3(e) One from: View bases of pins Pins at least 5cm apart Ensure pins are vertical 1 3(f) At least 4 additional values, all < 90° 1 Range at least 30° 1
Q4 · A student investigates the rate of cooling, in air, of heated blocks made of different…
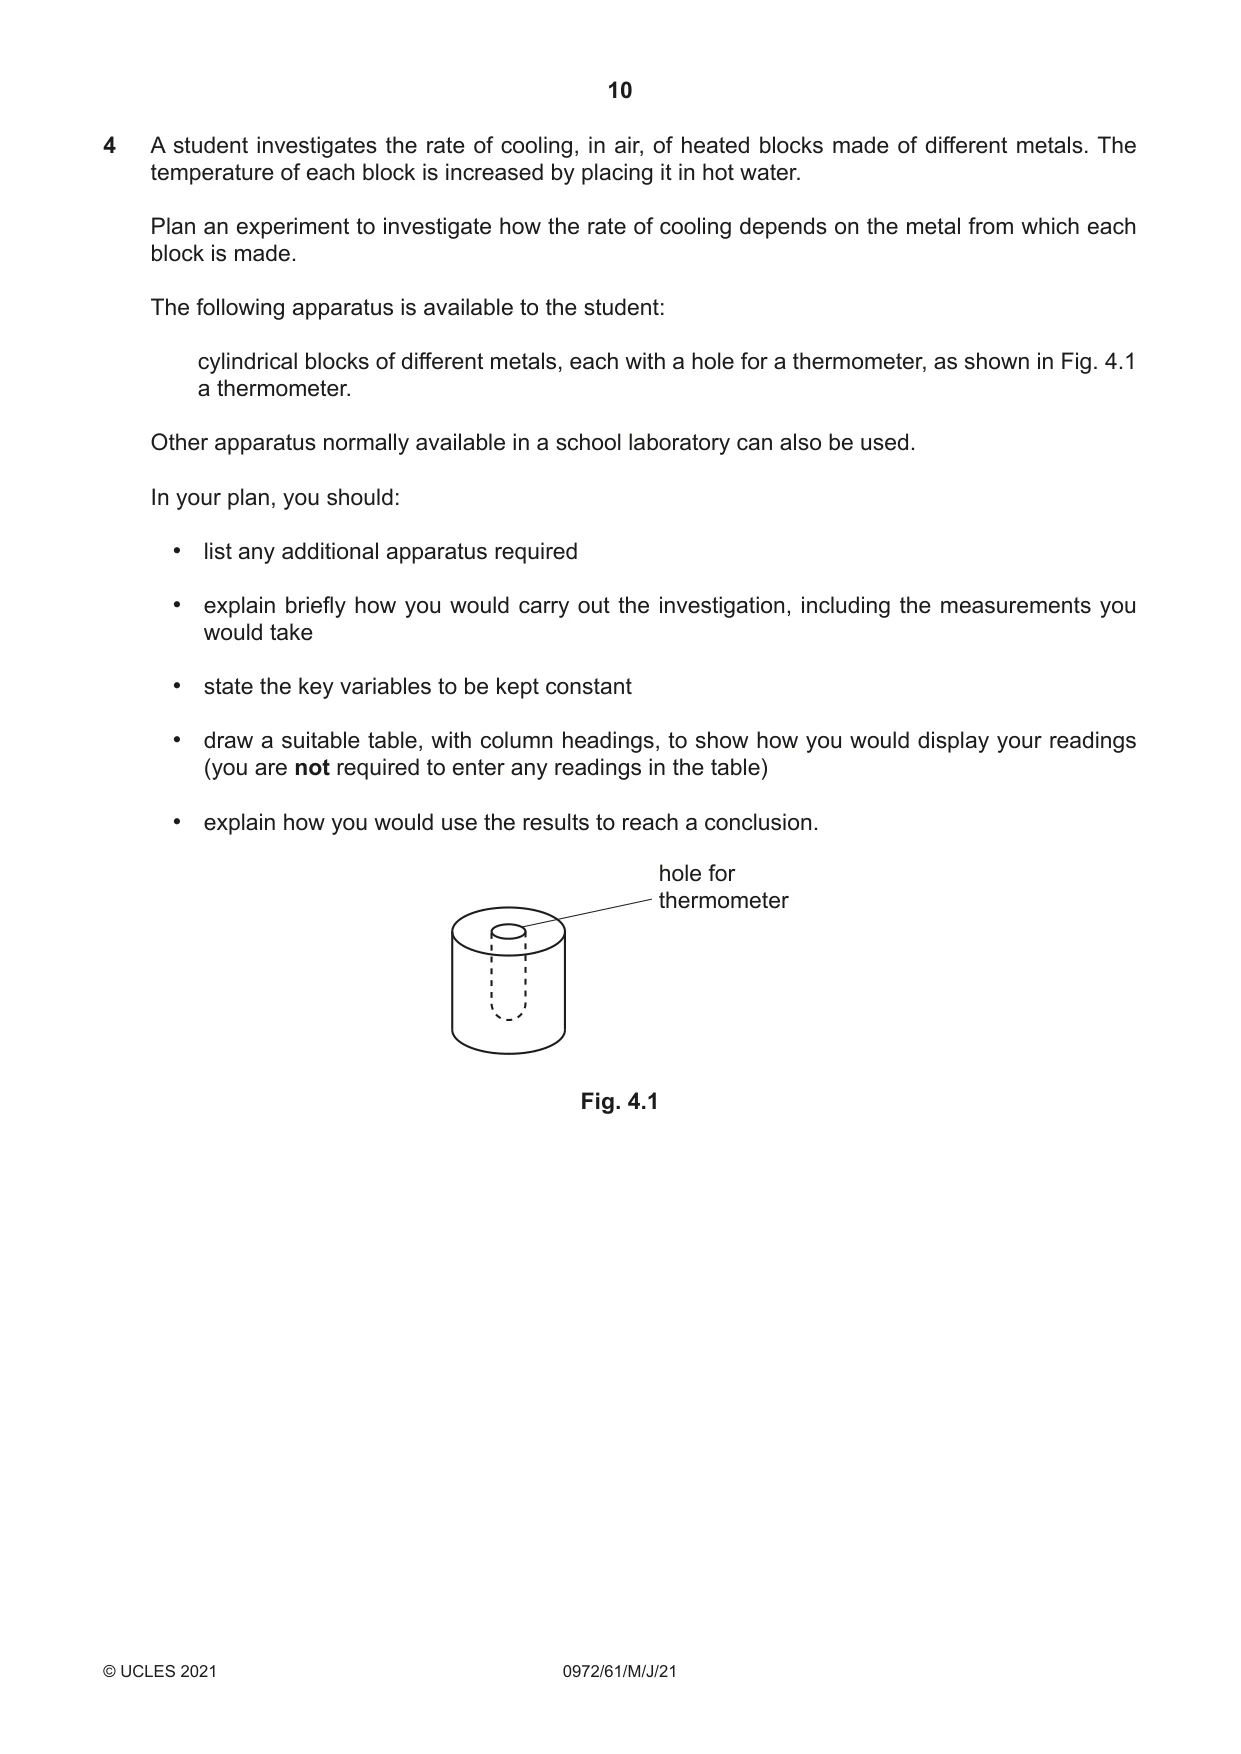
4 A student investigates the rate of cooling, in air, of heated blocks made of different metals. The temperature of each block is increased by placing it in hot water. Plan an experiment to investigate how the rate of cooling depends on the metal from which each block is made. The following apparatus is available to the student: cylindrical blocks of different metals, each with a hole for a thermometer, as shown in Fig. 4.1 a thermometer. Other apparatus normally available in a school laboratory can also be used. In your plan, you should: • list any additional apparatus required • explain briefly how you would carry out the investigation, including the measurements you would take • state the key variables to be kept constant • draw a suitable table, with column headings, to show how you would display your readings (you are not required to enter any readings in the table) • explain how you would use the results to reach a conclusion. hole for thermometer Fig. 4.1 .......................................................................................................................................................... .......................................................................................................................................................... .......................................................................................................................................................... .......................................................................................................................................................... .......................................................................................................................................................... .......................................................................................................................................................... .......................................................................................................................................................... .......................................................................................................................................................... .......................................................................................................................................................... .......................................................................................................................................................... .......................................................................................................................................................... .......................................................................................................................................................... .......................................................................................................................................................... .......................................................................................................................................................... .......................................................................................................................................................... .......................................................................................................................................................... .......................................................................................................................................................... .................................................................................................................................................... [7]
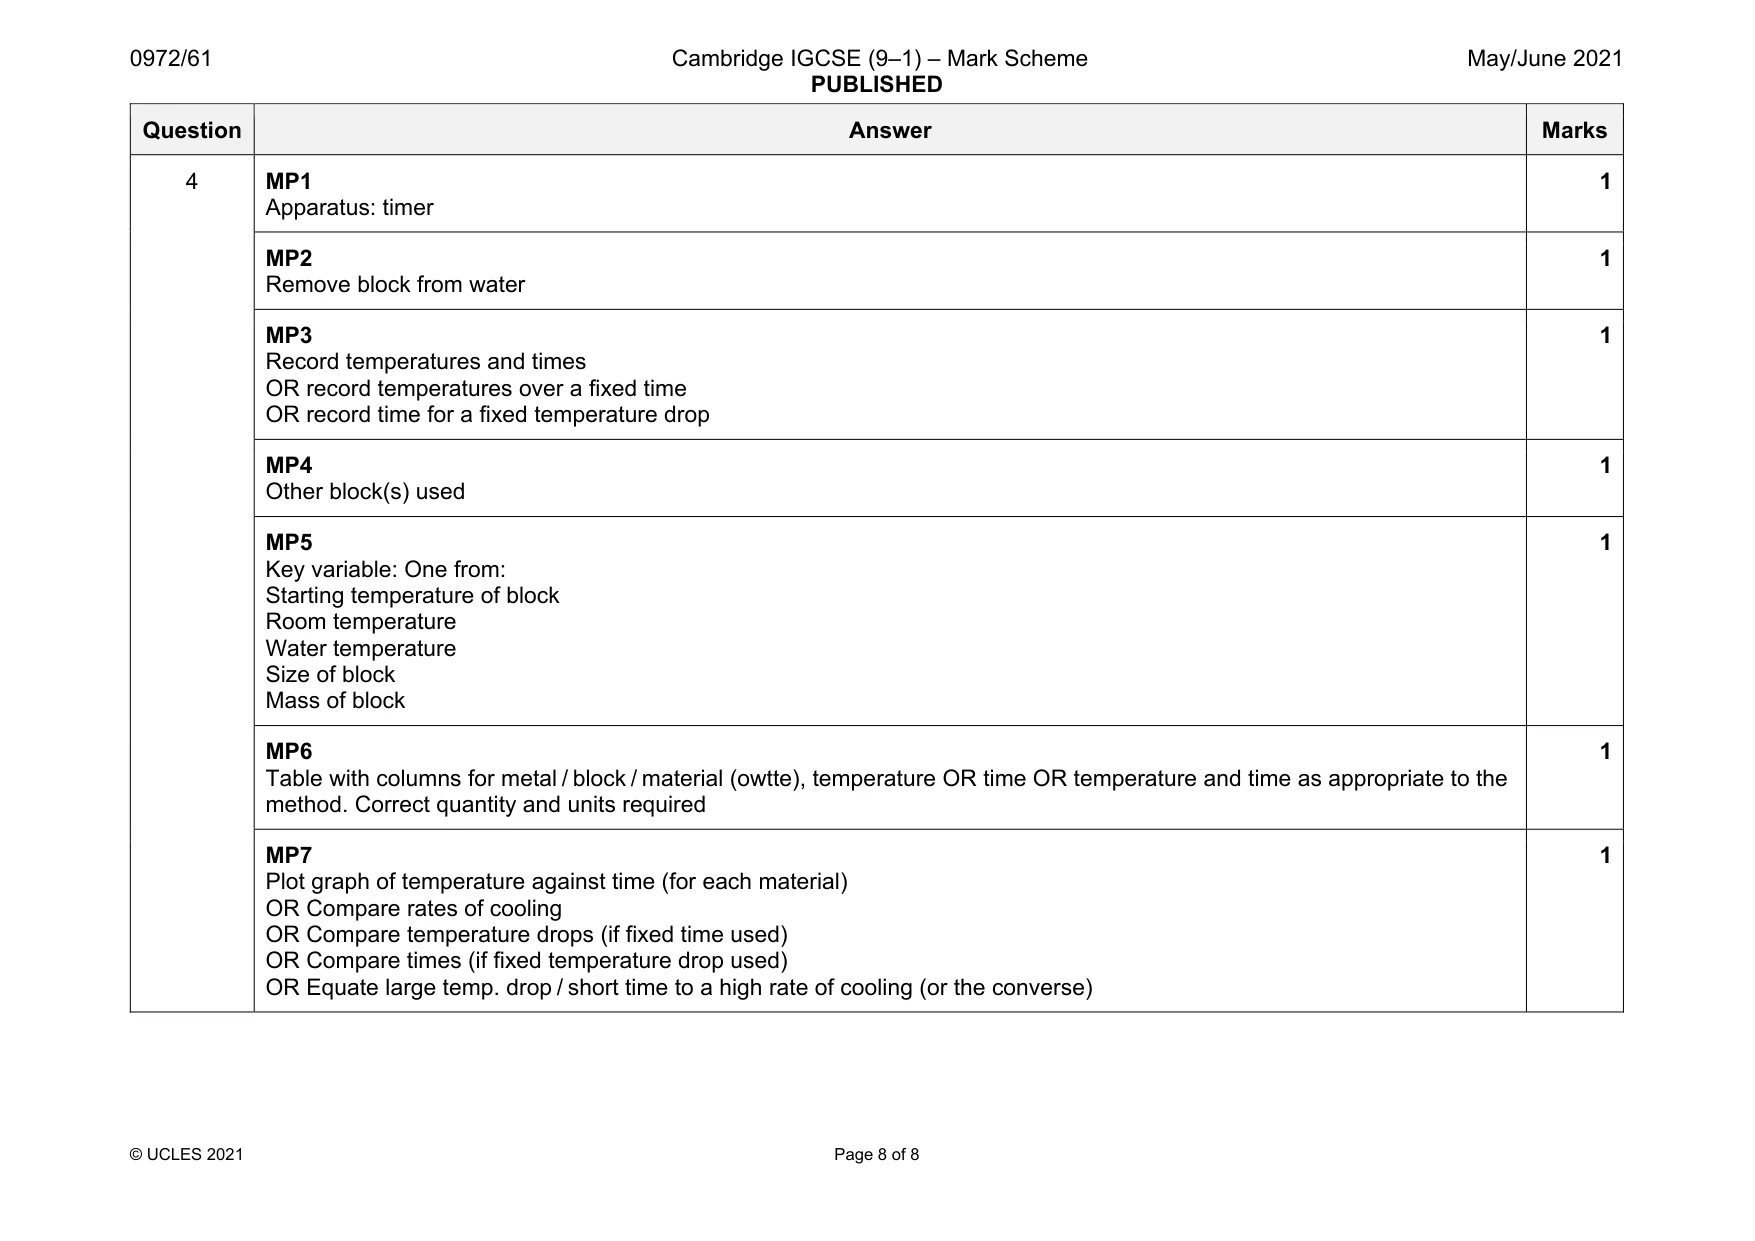
Mark scheme: 4 MP1 Apparatus: timer 1 MP2 Remove block from water 1 MP3 Record temperatures and times OR record temperatures over a fixed time OR record time for a fixed temperature drop 1 MP4 Other block(s) used 1 MP5 Key variable: One from: Starting temperature of block Room temperature Water temperature Size of block Mass of block 1 MP6 Table with columns for metal / block / material (owtte), temperature OR time OR temperature and time as appropriate to the method. Correct quantity and units required 1 MP7 Plot graph of temperature against time (for each material) OR Compare rates of cooling OR Compare temperature drops (if fixed time used) OR Compare times (if fixed temperature drop used) OR Equate large temp. drop / short time to a high rate of cooling (or the converse) 1
What was in this paper
The subtopics covered by these 4 questions, and how many questions each got. Open one in a new tab to see every Cambridge question on it.
What you needed in this session
Cambridge’s own grade thresholds for 2021 May/June, Paper 6 · Variant 1. A higher threshold means an easier paper — the bar moves with how the cohort did.