Cambridge IGCSE Physics (9-1) 0972 — 2023 May/June Paper 6 · Variant 1
0972/61/M/J/23 · 4 questions · 40 marks · ≈45 min
The question paper and its mark scheme, free to read here and free to download. This is Cambridge’s own paper, exactly as it was sat.
Question paper12 pages
Mark scheme9 pages
Answers below. Sit the paper first if you are practising.
Questions as text
Q1 · A student investigates the balancing of a metre ruler
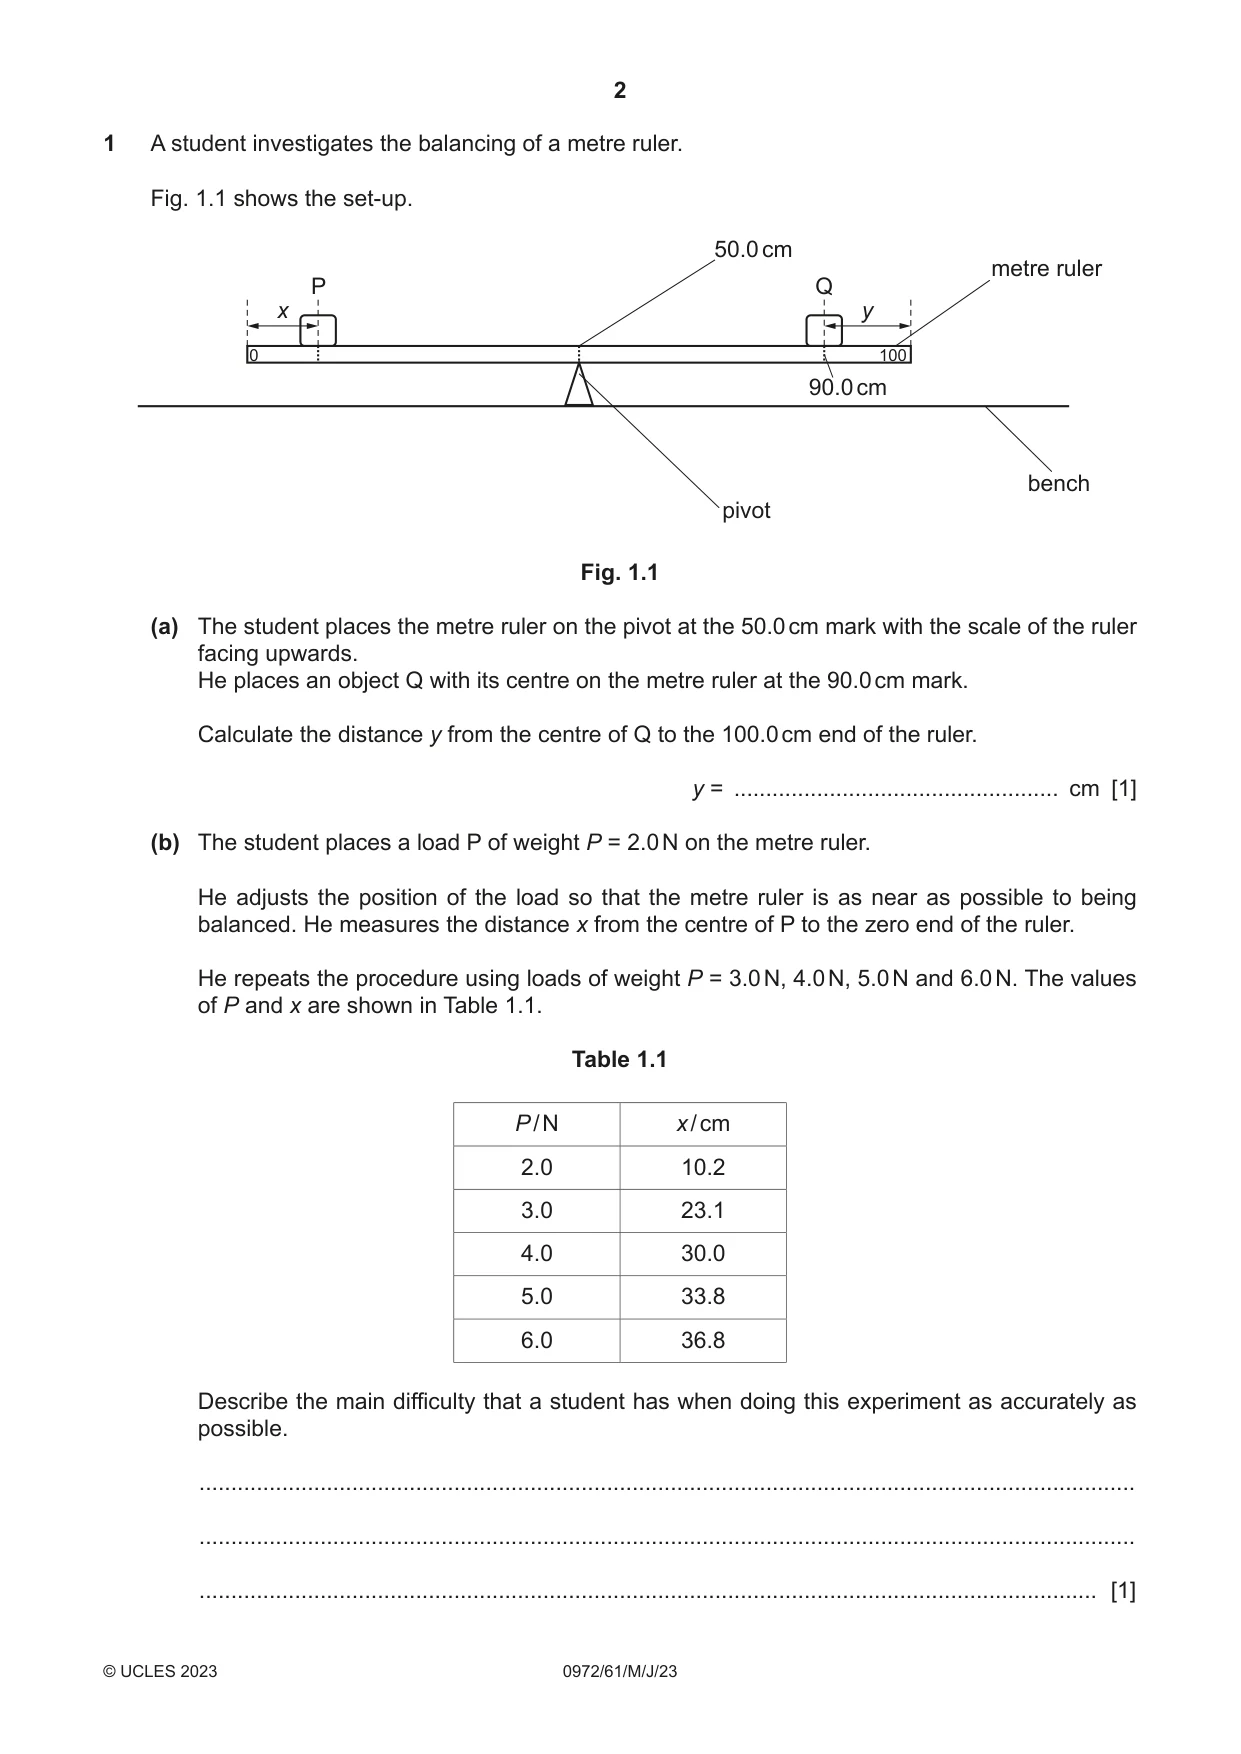
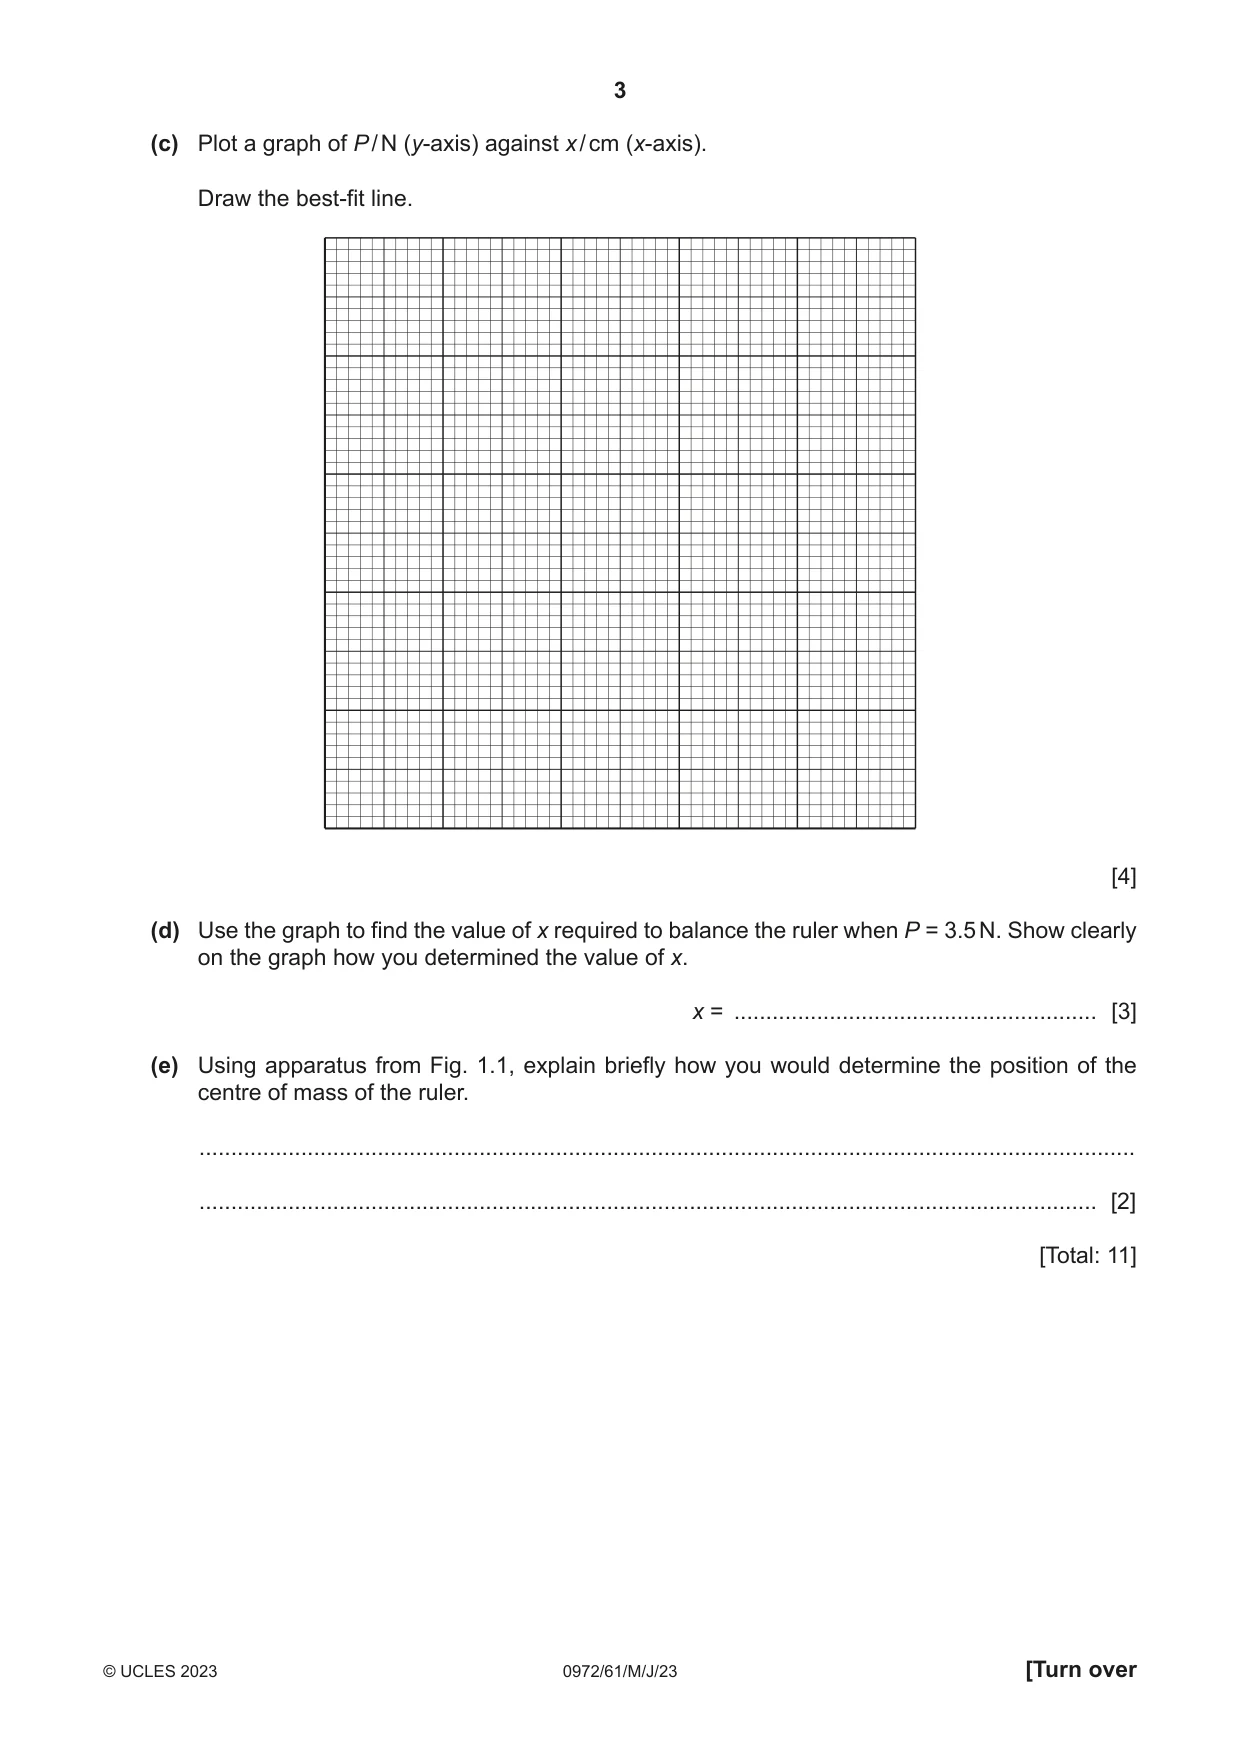
1 A student investigates the balancing of a metre ruler. Fig. 1.1 shows the set-up. 50.0 cm metre ruler P Q x y 0 100 90.0 cm bench pivot Fig. 1.1 (a) The student places the metre ruler on the pivot at the 50.0 cm mark with the scale of the ruler facing upwards. He places an object Q with its centre on the metre ruler at the 90.0 cm mark. Calculate the distance y from the centre of Q to the 100.0 cm end of the ruler. y = ................................................... cm [1] (b) The student places a load P of weight P = 2.0 N on the metre ruler. He adjusts the position of the load so that the metre ruler is as near as possible to being balanced. He measures the distance x from the centre of P to the zero end of the ruler. He repeats the procedure using loads of weight P = 3.0 N, 4.0 N, 5.0 N and 6.0 N. The values of P and x are shown in Table 1.1. Table 1.1 P / N x / cm 2.0 10.2 3.0 23.1 4.0 30.0 5.0 33.8 6.0 36.8 Describe the main difficulty that a student has when doing this experiment as accurately as possible. ................................................................................................................................................... ................................................................................................................................................... ............................................................................................................................................. [1] (c) Plot a graph of P / N (y-axis) against x / cm (x-axis). Draw the best-fit line. [4] (d) Use the graph to find the value of x required to balance the ruler when P = 3.5 N. Show clearly on the graph how you determined the value of x. x = ......................................................... [3] (e) Using apparatus from Fig. 1.1, explain briefly how you would determine the position of the centre of mass of the ruler. ................................................................................................................................................... ............................................................................................................................................. [2] [Total: 11]
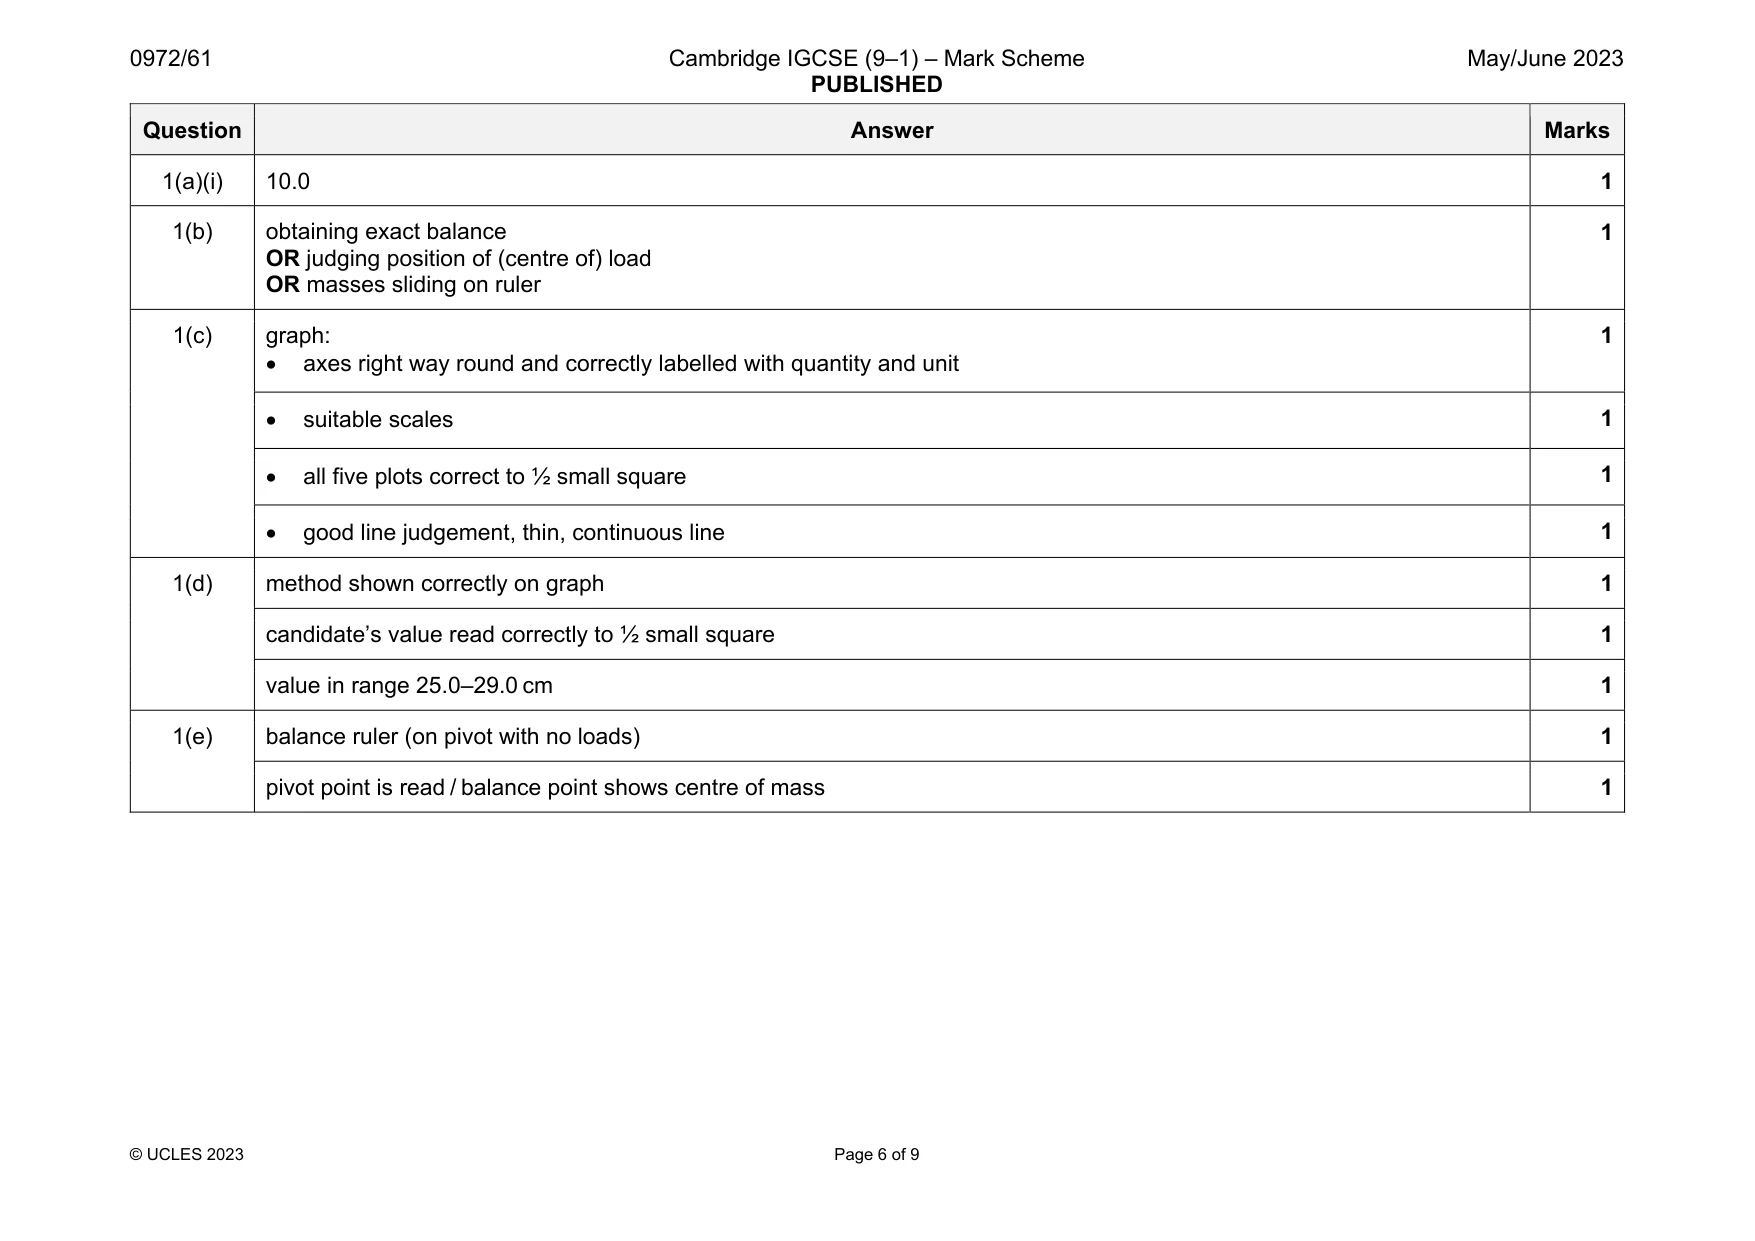
Mark scheme: 1(a)(i) 10.0 1 1(b) obtaining exact balance OR judging position of (centre of) load OR masses sliding on ruler 1 1(c) graph: axes right way round and correctly labelled with quantity and unit 1 suitable scales 1 all five plots correct to ½ small square 1 good line judgement, thin, continuous line 1 1(d) method shown correctly on graph 1 candidate’s value read correctly to ½ small square 1 value in range 25.0–29.0 cm 1 1(e) balance ruler (on pivot with no loads) 1 pivot point is read / balance point shows centre of mass 1
Q2 · A student investigates the cooling of water under different conditions
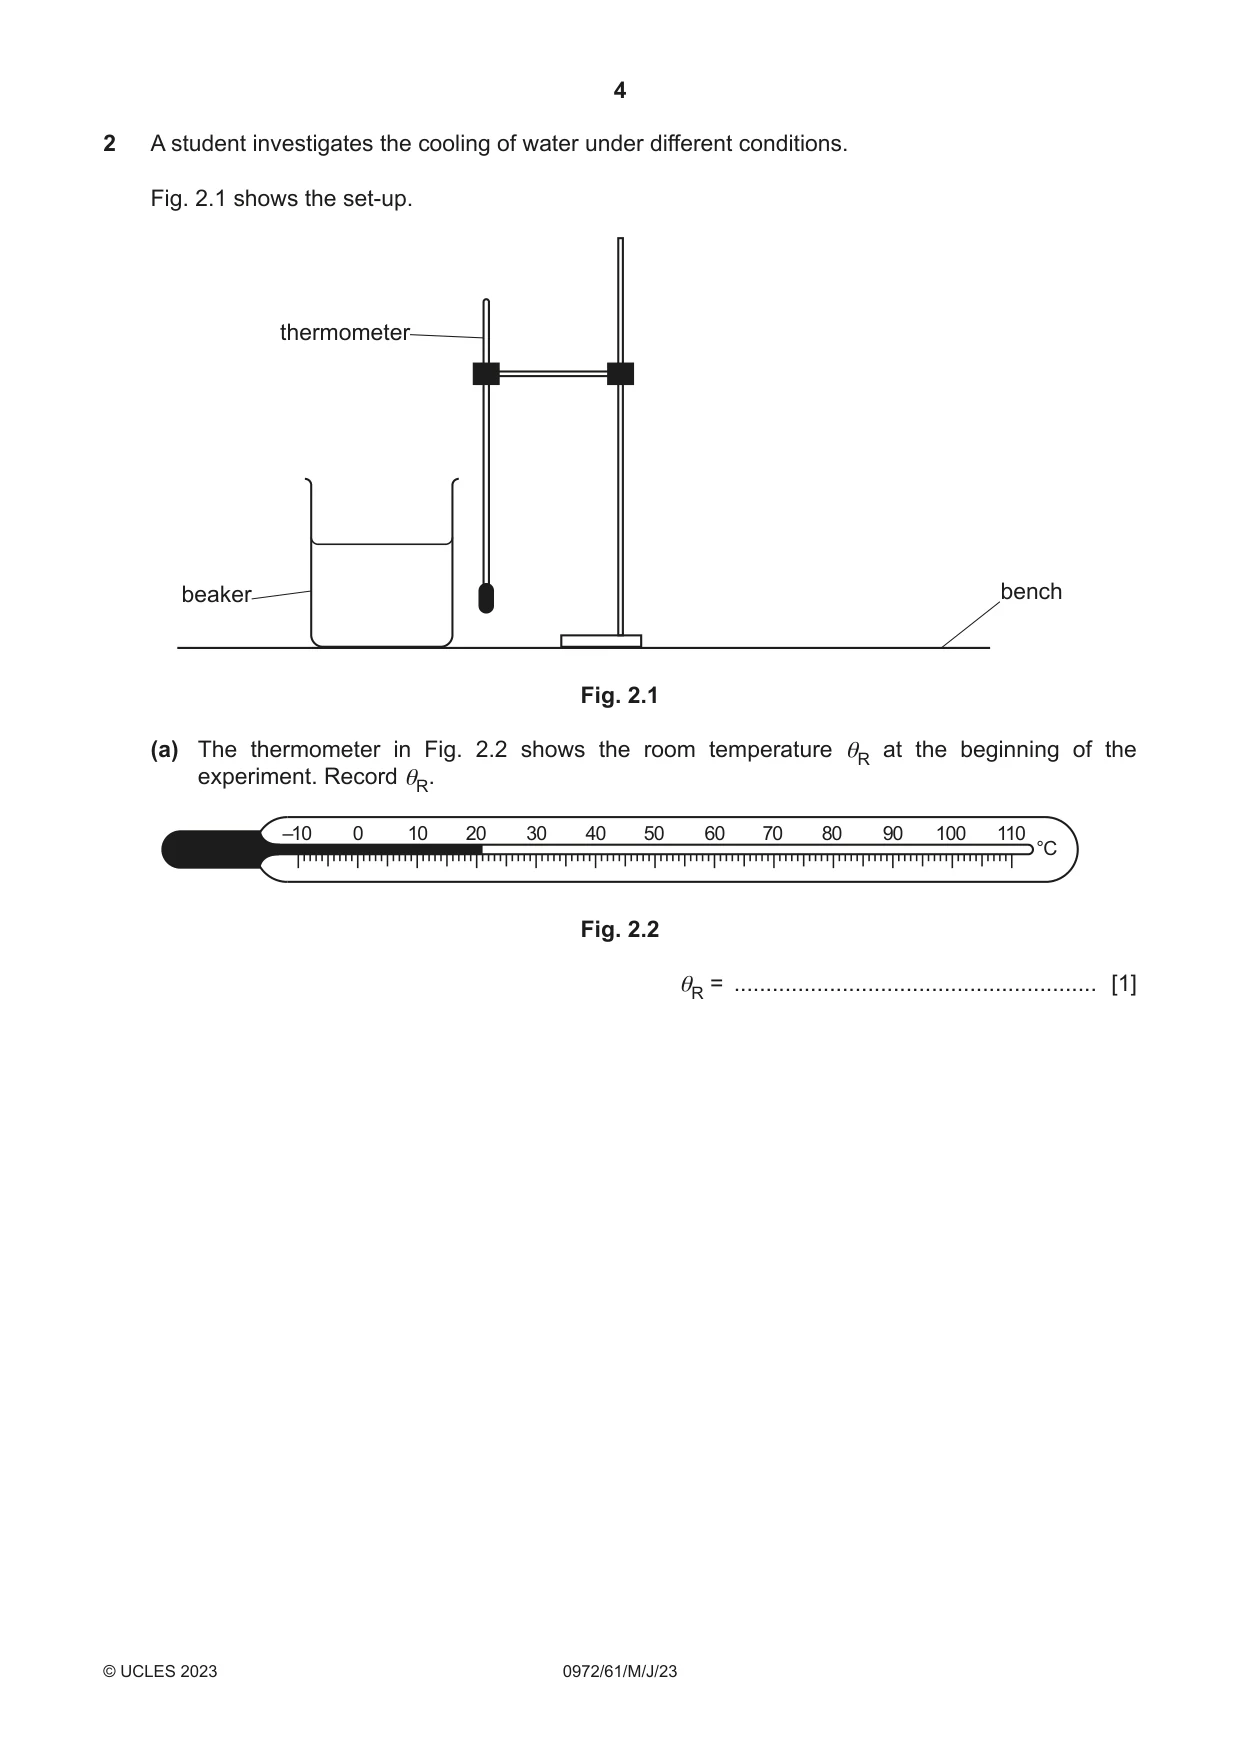
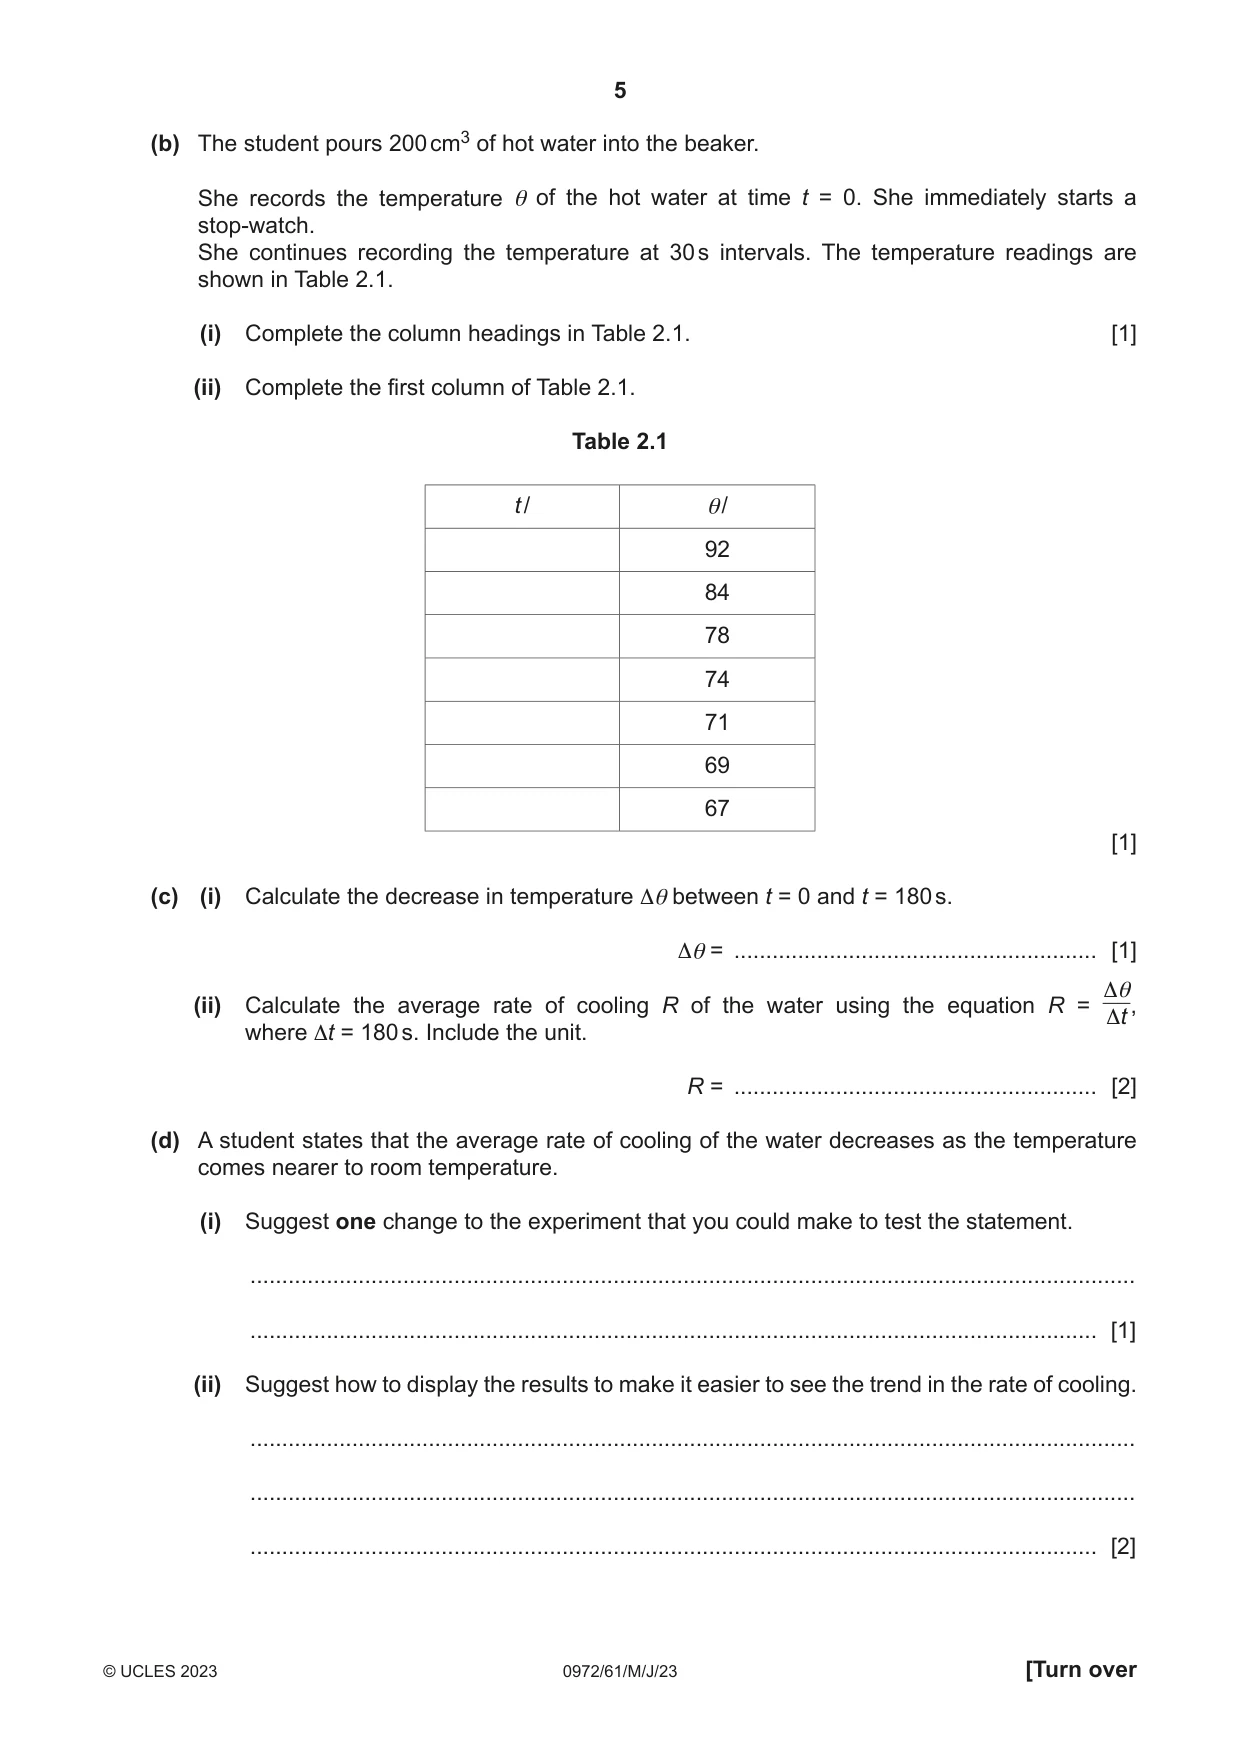
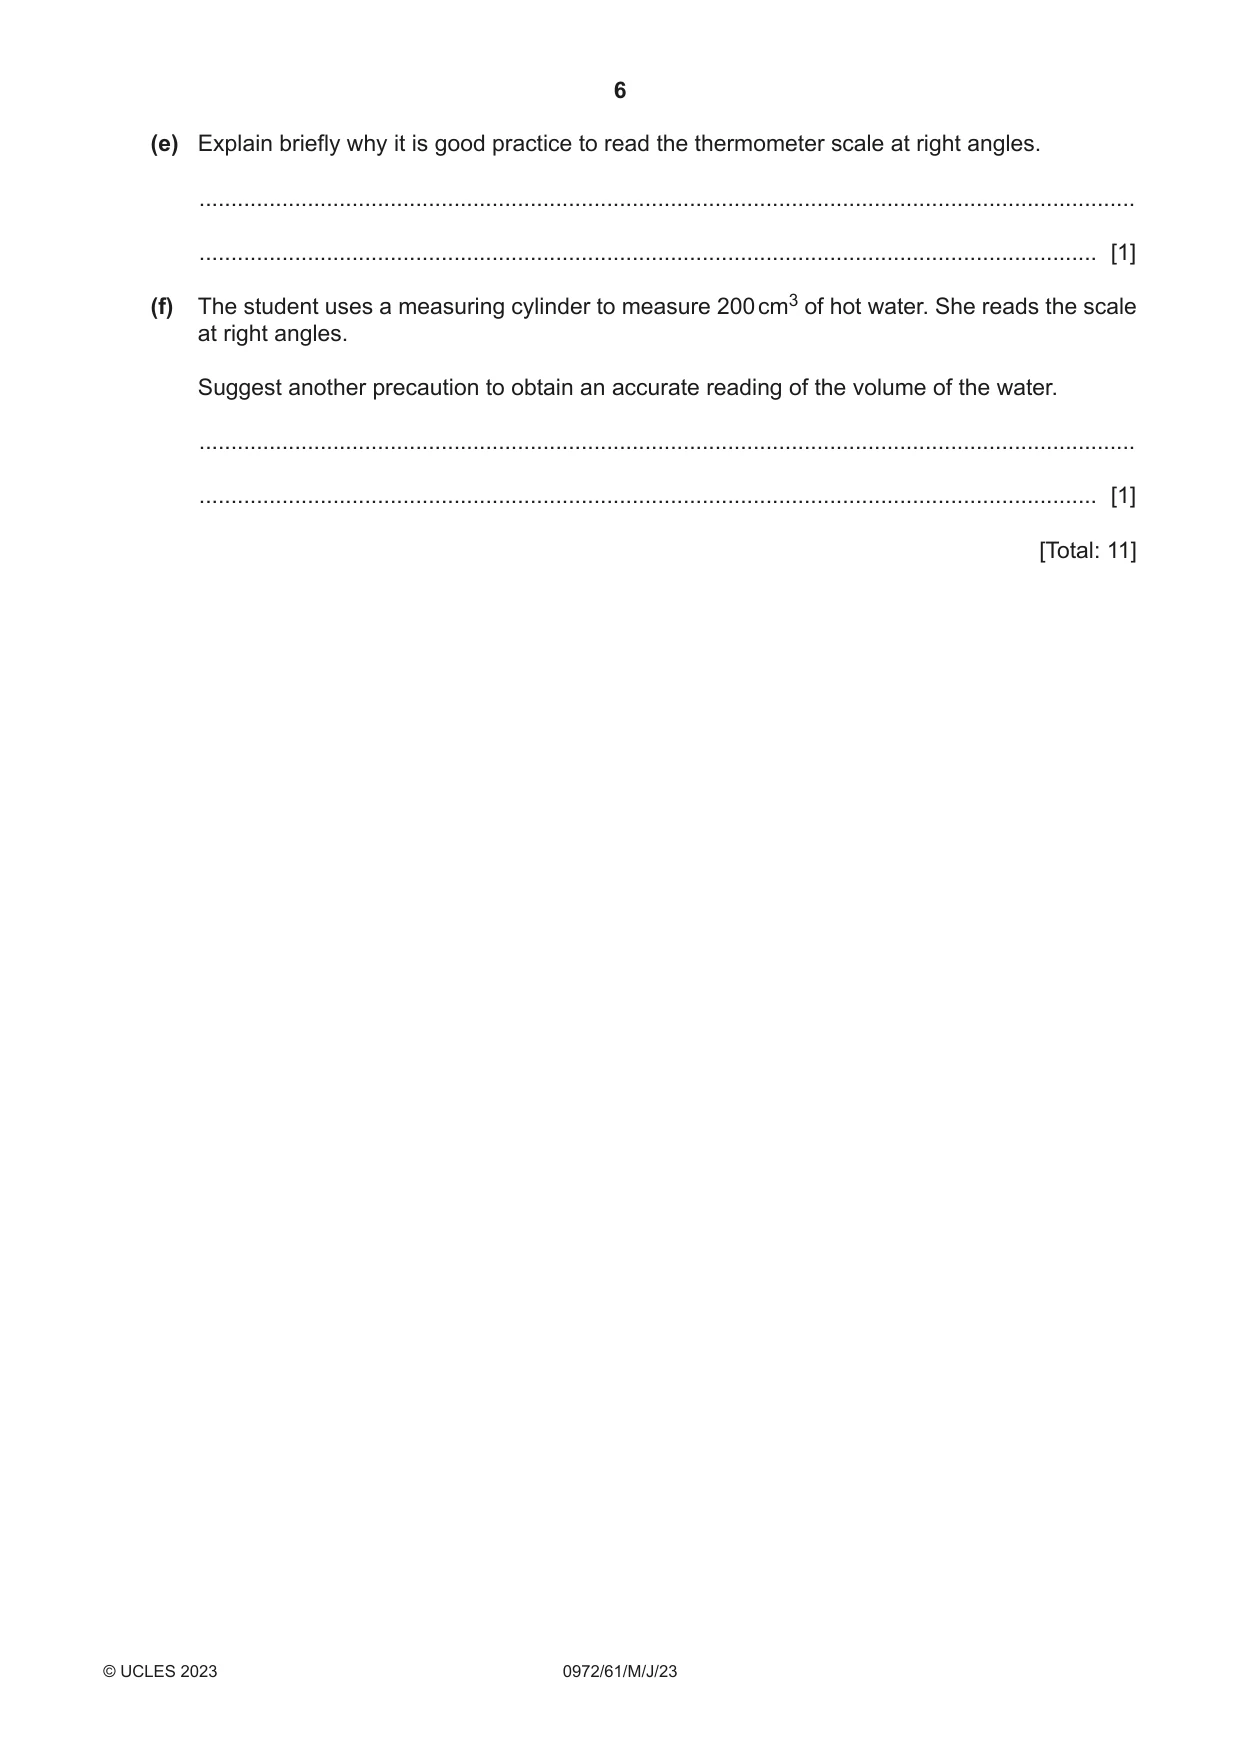
2 A student investigates the cooling of water under different conditions. Fig. 2.1 shows the set-up. thermometer beaker bench Fig. 2.1 (a) The thermometer in Fig. 2.2 shows the room temperature θR at the beginning of the experiment. Record θR. –10 0 10 20 30 40 50 60 70 80 90 100 110 °C Fig. 2.2 θR = ......................................................... [1] (b) The student pours 200 cm3 of hot water into the beaker. She records the temperature θ of the hot water at time t = 0. She immediately starts a stop-watch. She continues recording the temperature at 30 s intervals. The temperature readings are shown in Table 2.1. (i) Complete the column headings in Table 2.1. [1] (ii) Complete the first column of Table 2.1. Table 2.1 t / θ/ 92 84 78 74 71 69 67 [1] (c) (i) Calculate the decrease in temperature Δθ between t = 0 and t = 180 s. Δθ = ......................................................... [1] Δθ (ii) Calculate the average rate of cooling R of the water using the equation R = , Δt where Δt = 180 s. Include the unit. R = ......................................................... [2] (d) A student states that the average rate of cooling of the water decreases as the temperature comes nearer to room temperature. (i) Suggest one change to the experiment that you could make to test the statement. ........................................................................................................................................... ..................................................................................................................................... [1] (ii) Suggest how to display the results to make it easier to see the trend in the rate of cooling. ........................................................................................................................................... ........................................................................................................................................... ..................................................................................................................................... [2] (e) Explain briefly why it is good practice to read the thermometer scale at right angles. ................................................................................................................................................... ............................................................................................................................................. [1] (f) The student uses a measuring cylinder to measure 200 cm3 of hot water. She reads the scale at right angles. Suggest another precaution to obtain an accurate reading of the volume of the water. ................................................................................................................................................... ............................................................................................................................................. [1] [Total: 11]
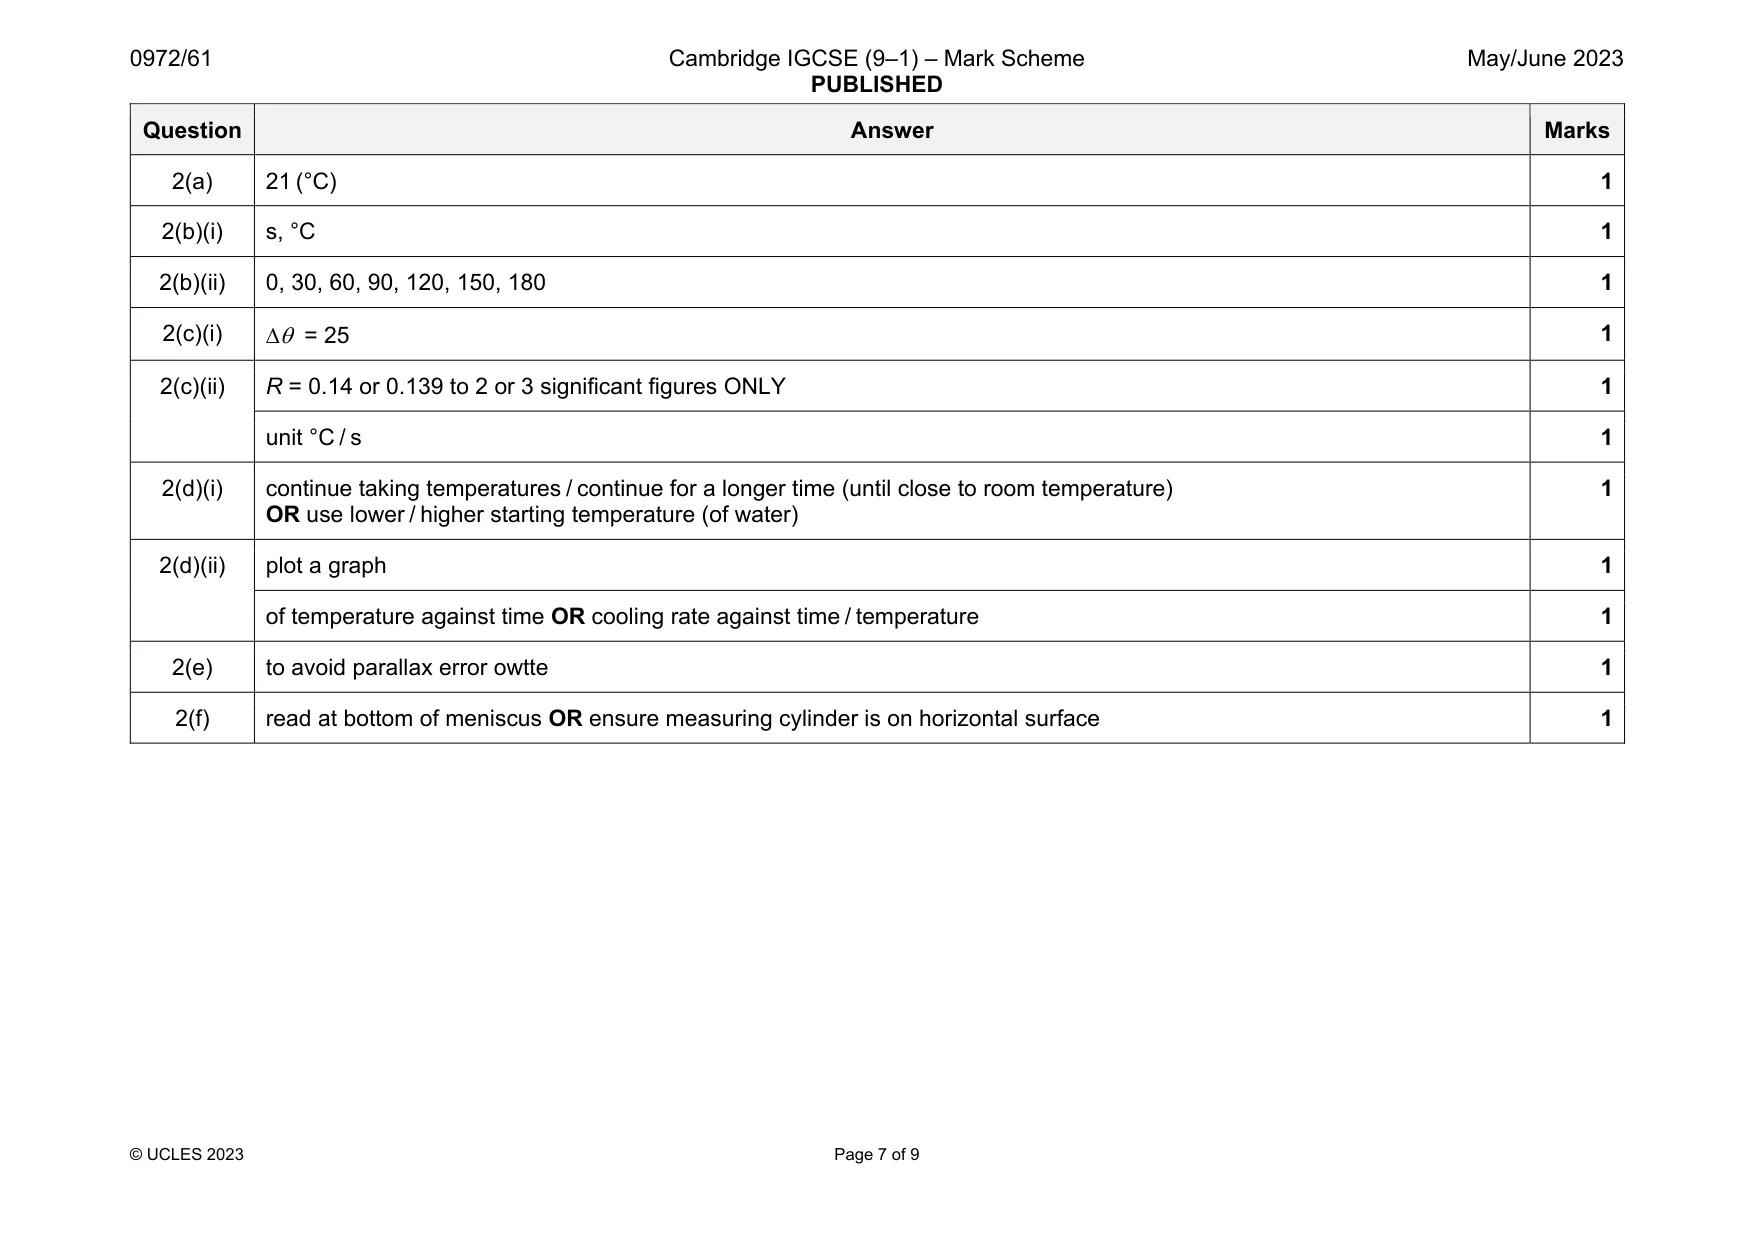
Mark scheme: 2(a) 21 (°C) 1 2(b)(i) s, °C 1 2(b)(ii) 0, 30, 60, 90, 120, 150, 180 1 2(c)(i) = 25 1 2(c)(ii) R = 0.14 or 0.139 to 2 or 3 significant figures ONLY 1 unit °C / s 1 2(d)(i) continue taking temperatures / continue for a longer time (until close to room temperature) OR use lower / higher starting temperature (of water) 1 2(d)(ii) plot a graph 1 of temperature against time OR cooling rate against time / temperature 1 2(e) to avoid parallax error owtte 1 2(f) read at bottom of meniscus OR ensure measuring cylinder is on horizontal surface 1
More questions on Physical quantities and measurement techniques
Q3 · A student investigates the refraction of light using a semicircular transparent block
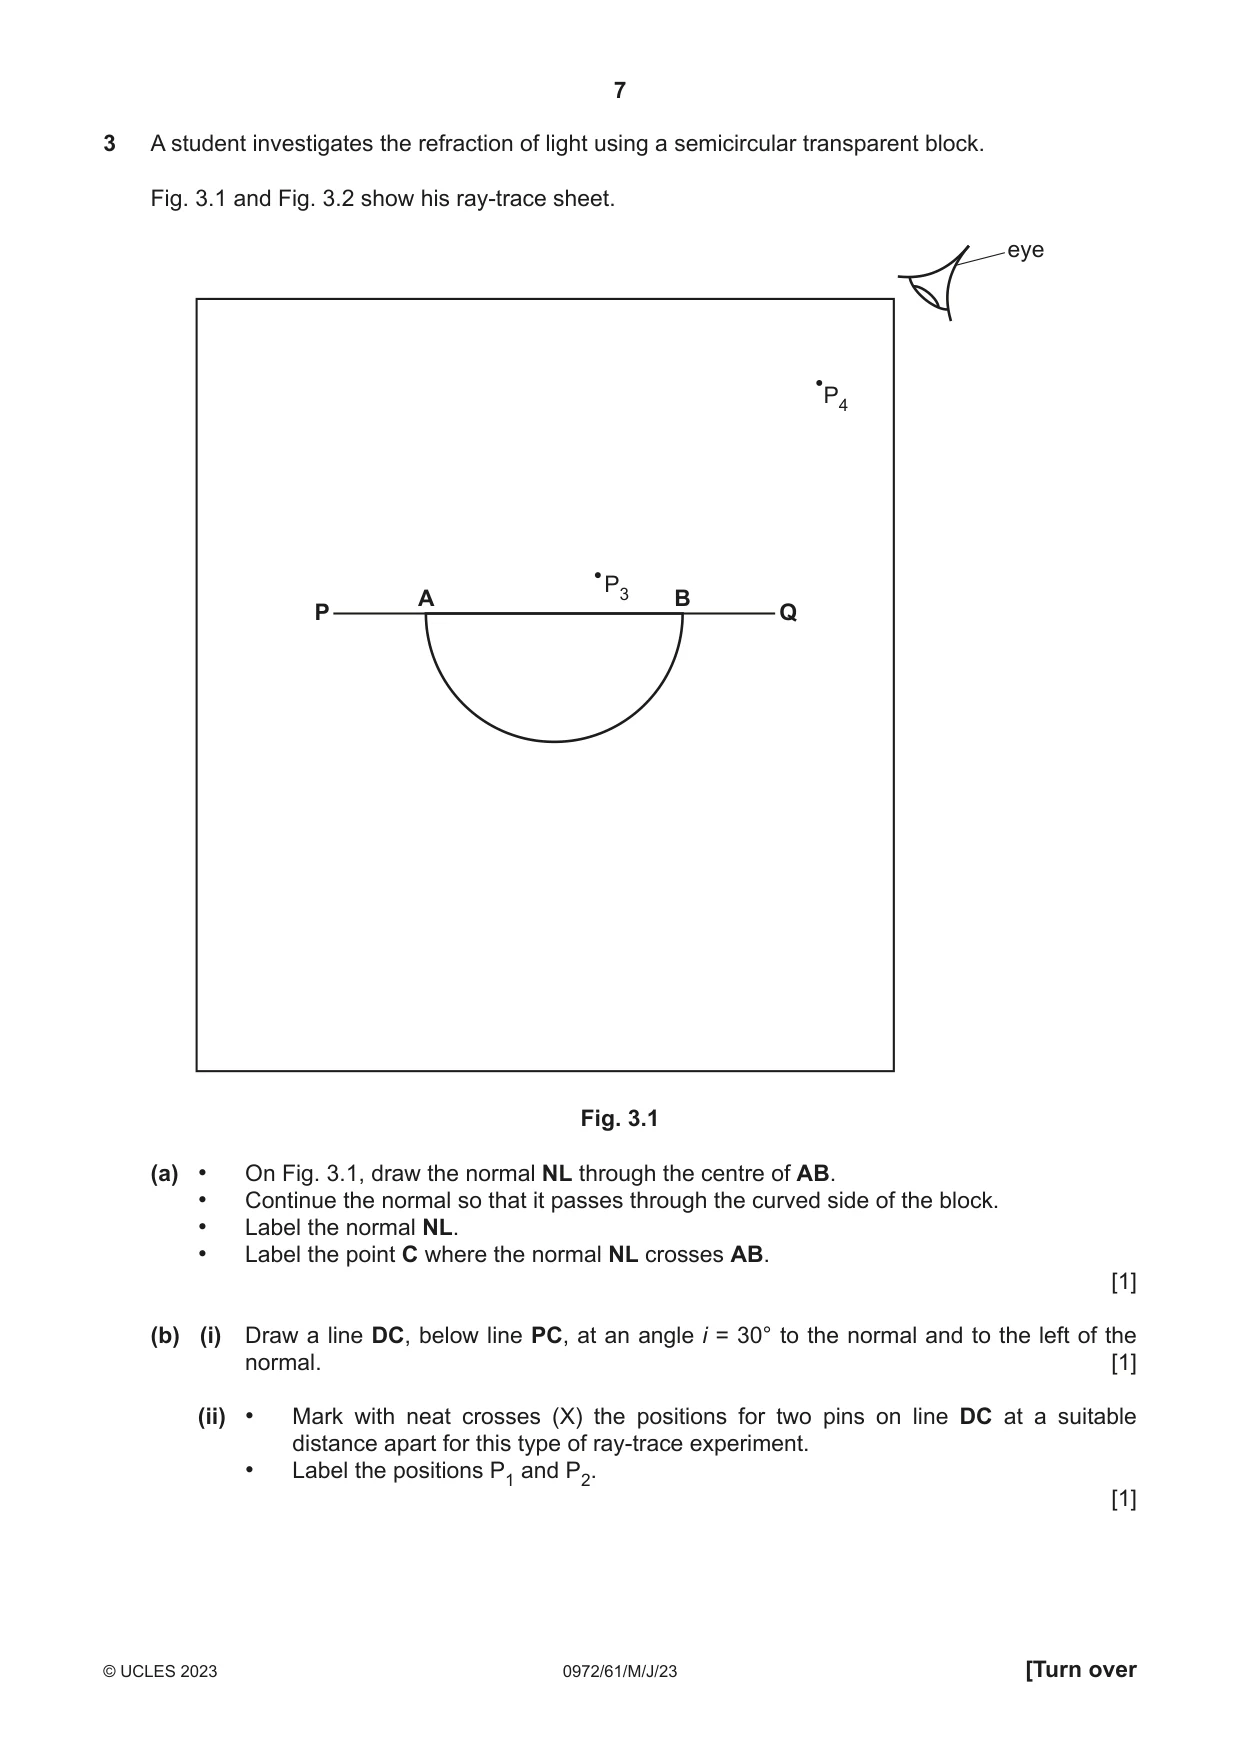
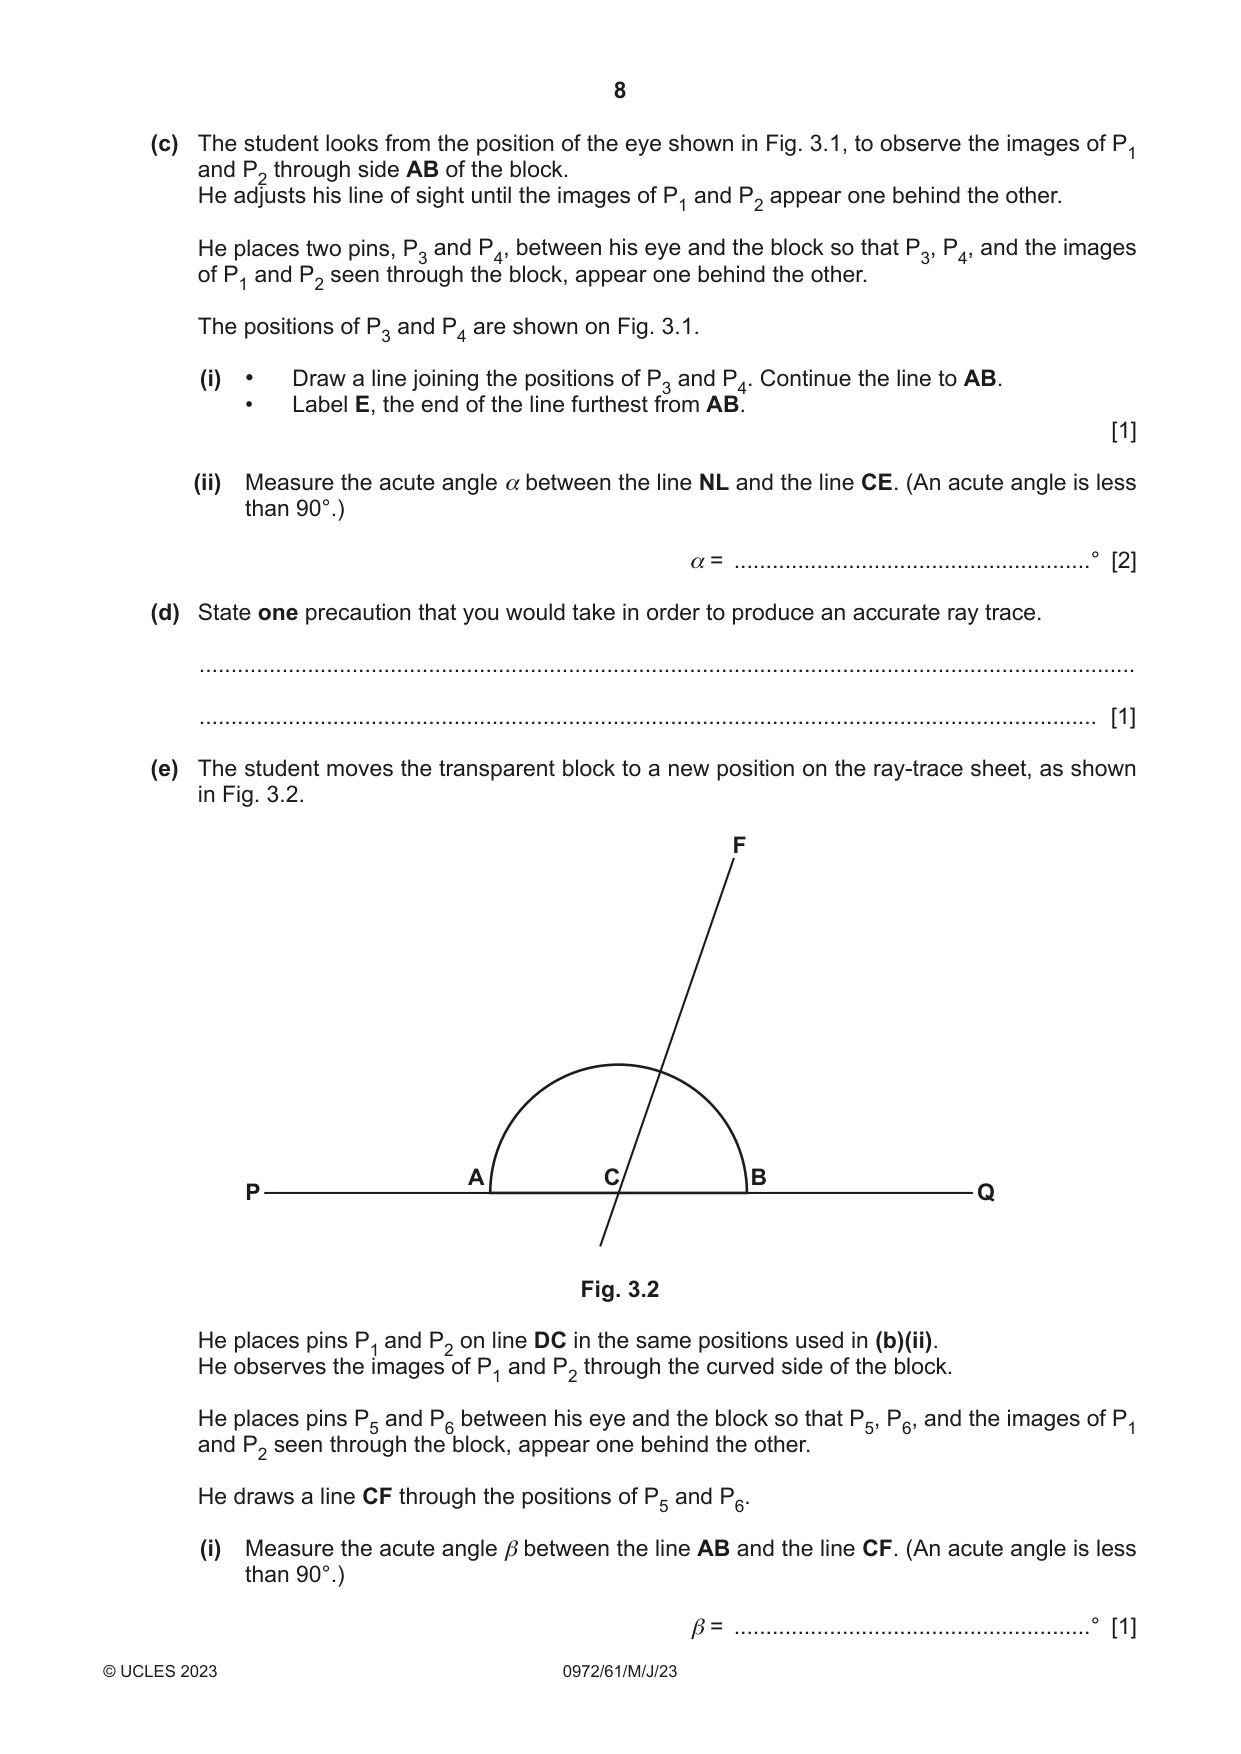
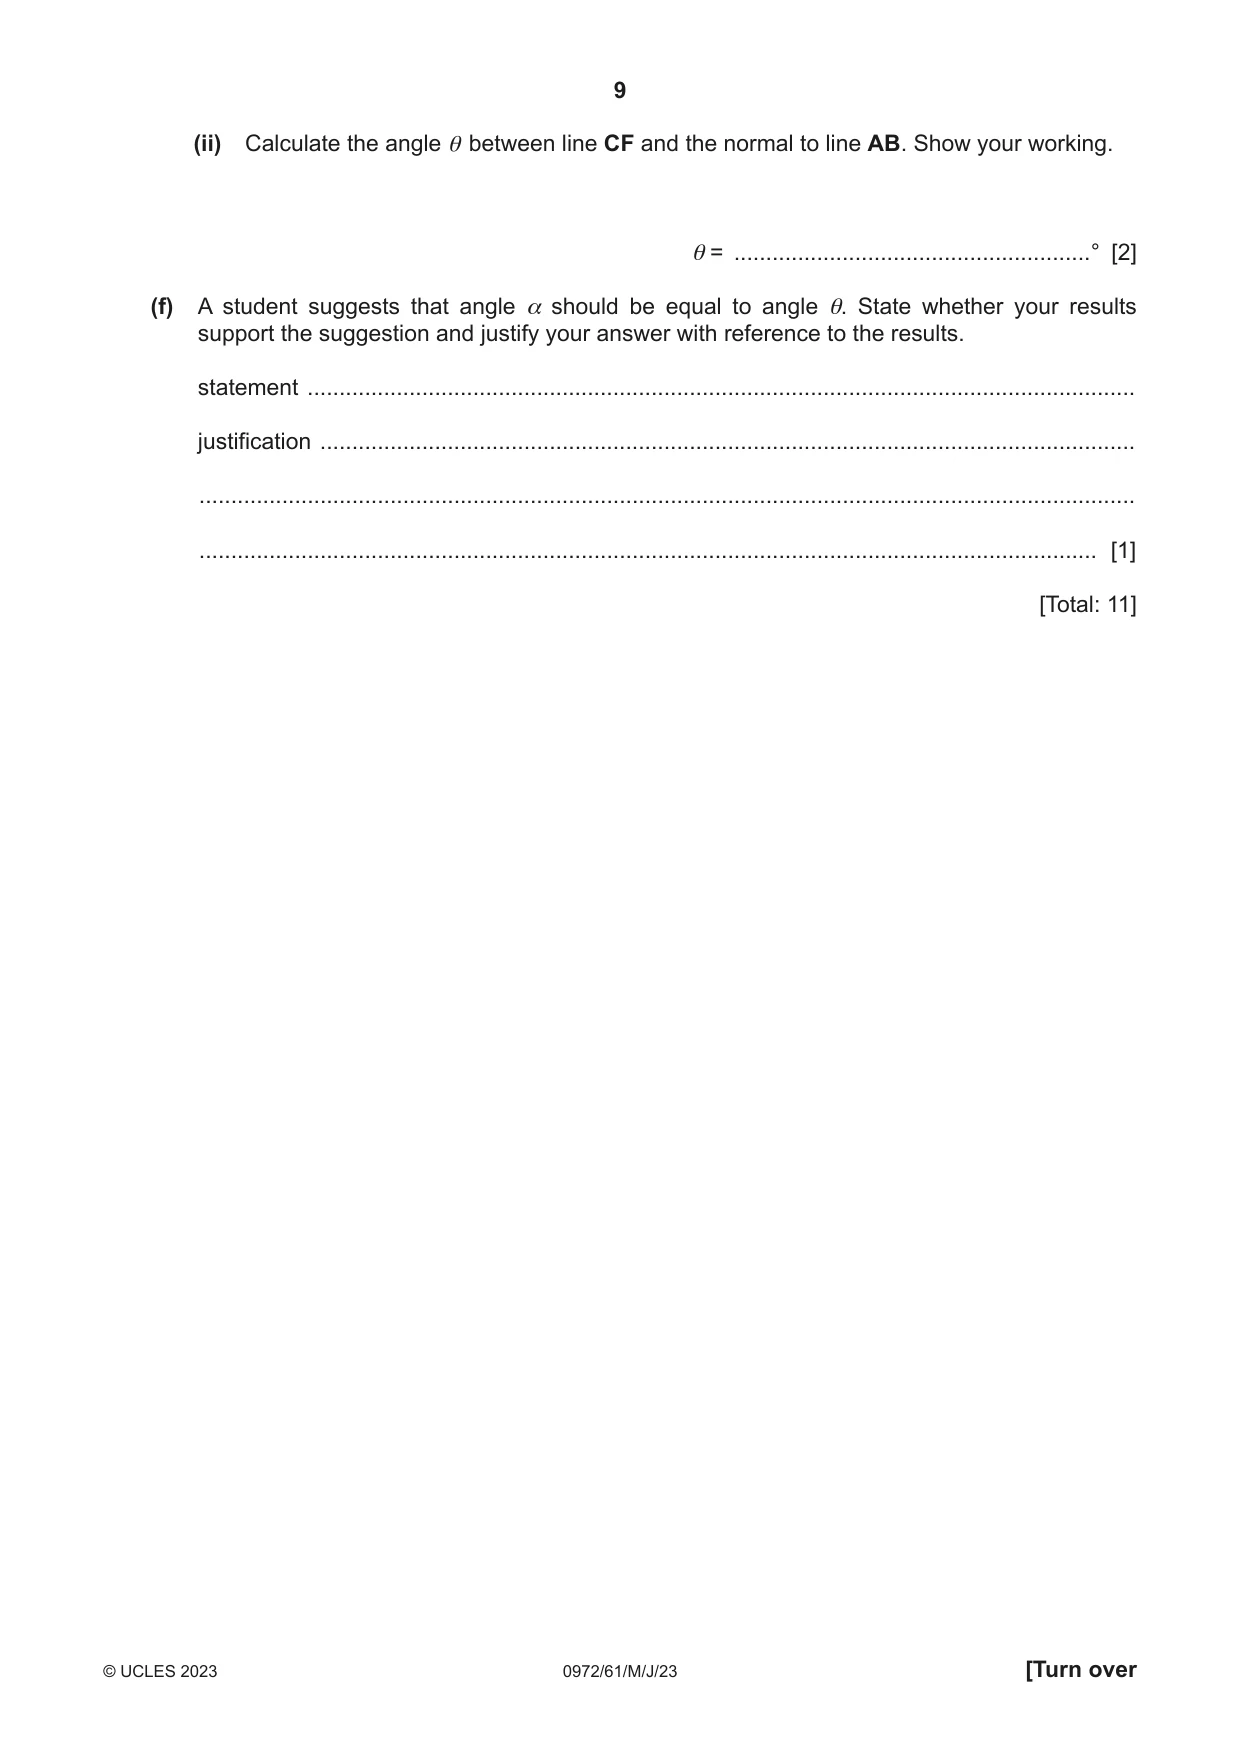
3 A student investigates the refraction of light using a semicircular transparent block. Fig. 3.1 and Fig. 3.2 show his ray-trace sheet. eye P4 P3 A B P Q Fig. 3.1 (a) • On Fig. 3.1, draw the normal NL through the centre of AB. • Continue the normal so that it passes through the curved side of the block. • Label the normal NL. • Label the point C where the normal NL crosses AB. [1] (b) (i) Draw a line DC, below line PC, at an angle i = 30° to the normal and to the left of the normal. [1] (ii) • Mark with neat crosses (X) the positions for two pins on line DC at a suitable distance apart for this type of ray-trace experiment. • Label the positions P1 and P2. [1] (c) The student looks from the position of the eye shown in Fig. 3.1, to observe the images of P1 and P2 through side AB of the block. He adjusts his line of sight until the images of P1 and P2 appear one behind the other. He places two pins, P3 and P4, between his eye and the block so that P3, P4, and the images of P1 and P2 seen through the block, appear one behind the other. The positions of P3 and P4 are shown on Fig. 3.1. (i) • Draw a line joining the positions of P3 and P4. Continue the line to AB. • Label E, the end of the line furthest from AB. [1] (ii) Measure the acute angle α between the line NL and the line CE. (An acute angle is less than 90°.) α = ........................................................° [2] (d) State one precaution that you would take in order to produce an accurate ray trace. ................................................................................................................................................... ............................................................................................................................................. [1] (e) The student moves the transparent block to a new position on the ray-trace sheet, as shown in Fig. 3.2. F A C B P Q Fig. 3.2 He places pins P1 and P2 on line DC in the same positions used in (b)(ii). He observes the images of P1 and P2 through the curved side of the block. He places pins P5 and P6 between his eye and the block so that P5, P6, and the images of P1 and P2 seen through the block, appear one behind the other. He draws a line CF through the positions of P5 and P6. (i) Measure the acute angle β between the line AB and the line CF. (An acute angle is less than 90°.) β = ........................................................° [1] (ii) Calculate the angle θ between line CF and the normal to line AB. Show your working. θ = ........................................................° [2] (f) A student suggests that angle α should be equal to angle θ. State whether your results support the suggestion and justify your answer with reference to the results. statement .................................................................................................................................. justification ................................................................................................................................ ................................................................................................................................................... ............................................................................................................................................. [1] [Total: 11]
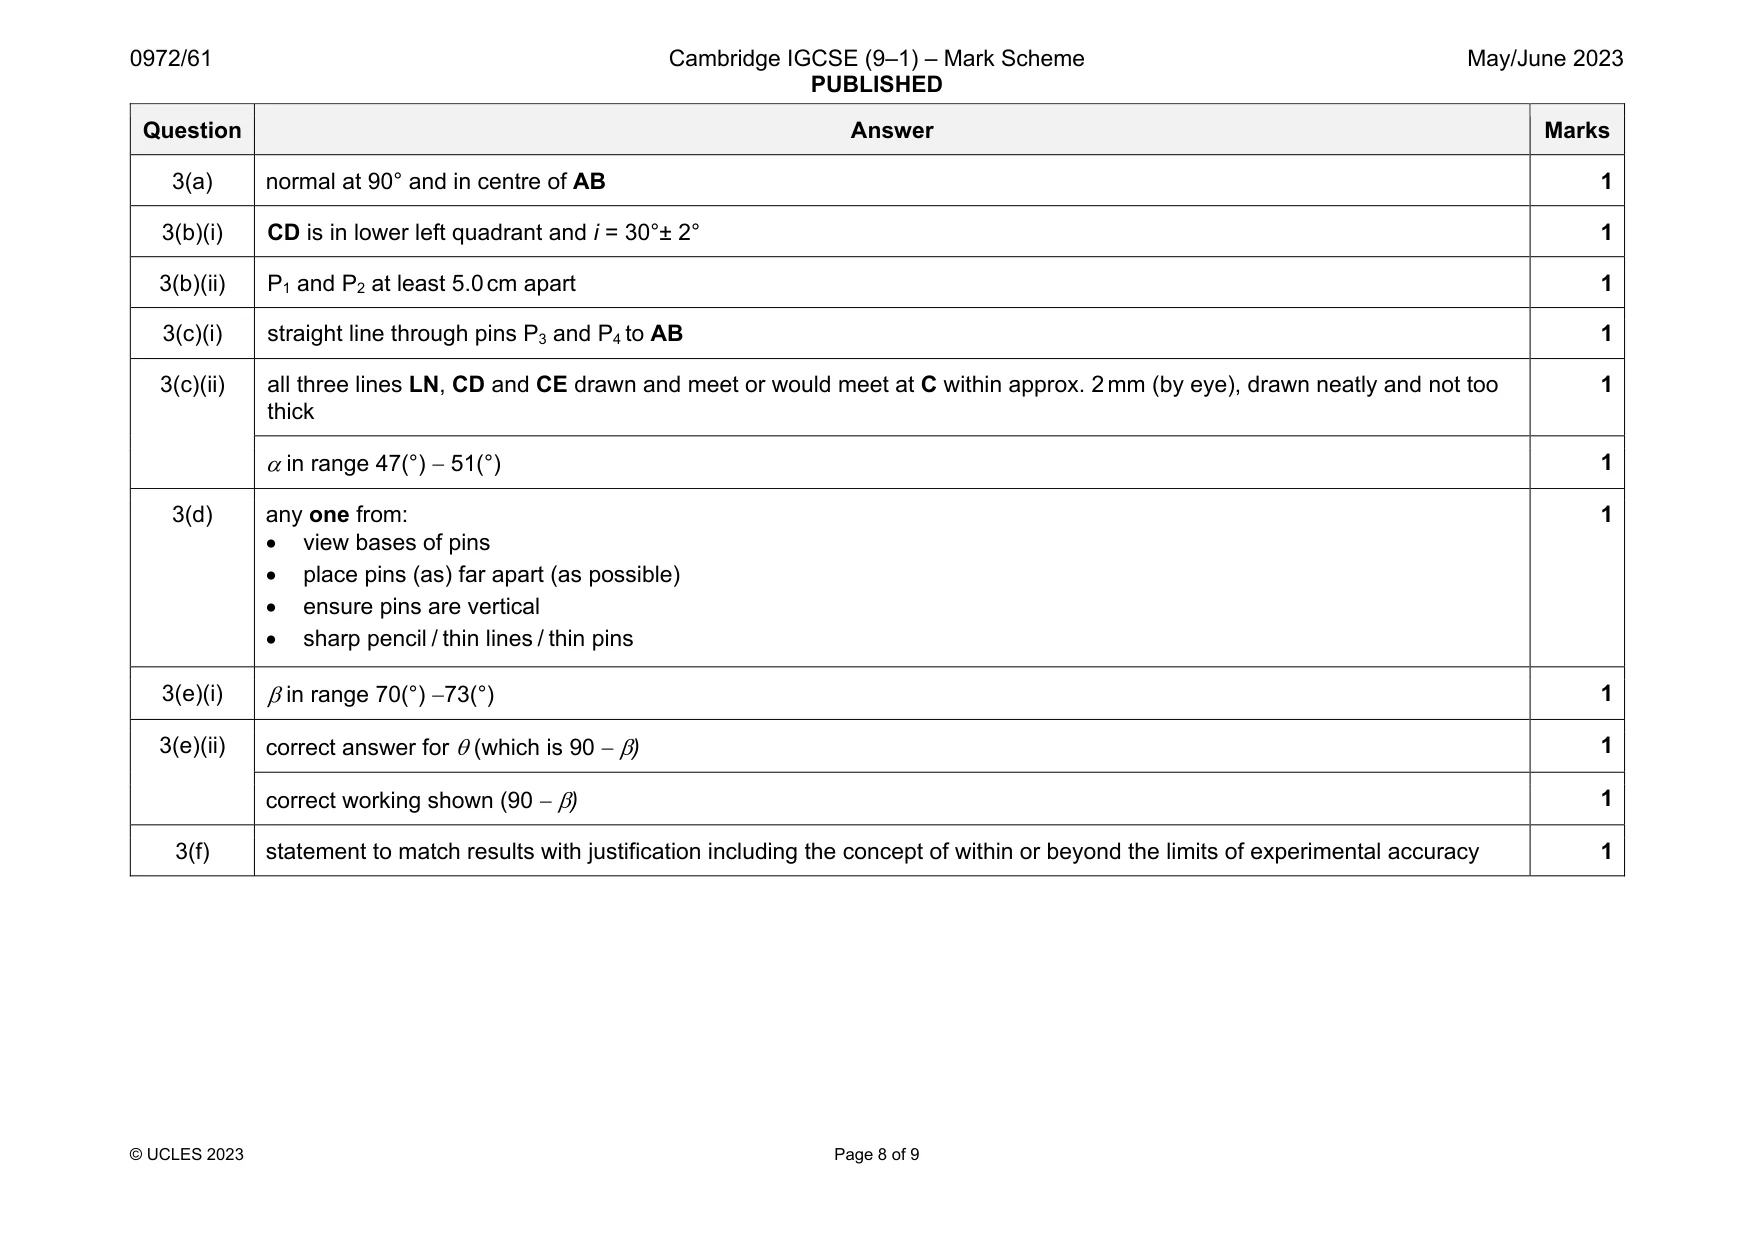
Mark scheme: 3(a) normal at 90° and in centre of AB 1 3(b)(i) CD is in lower left quadrant and i = 30°± 2° 1 3(b)(ii) P1 and P2 at least 5.0 cm apart 1 3(c)(i) straight line through pins P3 and P4 to AB 1 3(c)(ii) all three lines LN, CD and CE drawn and meet or would meet at C within approx. 2 mm (by eye), drawn neatly and not too thick 1 in range 47(°) 51(°) 1 3(d) any one from: view bases of pins place pins (as) far apart (as possible) ensure pins are vertical sharp pencil / thin lines / thin pins 1 3(e)(i) in range 70(°) 73(°) 1 3(e)(ii) correct answer for (which is 90 ) 1 correct working shown (90 ) 1 3(f) statement to match results with justification including the concept of within or beyond the limits of experimental accuracy 1
Q4 · A student investigates the change in resistance of a lamp filament when the current in…
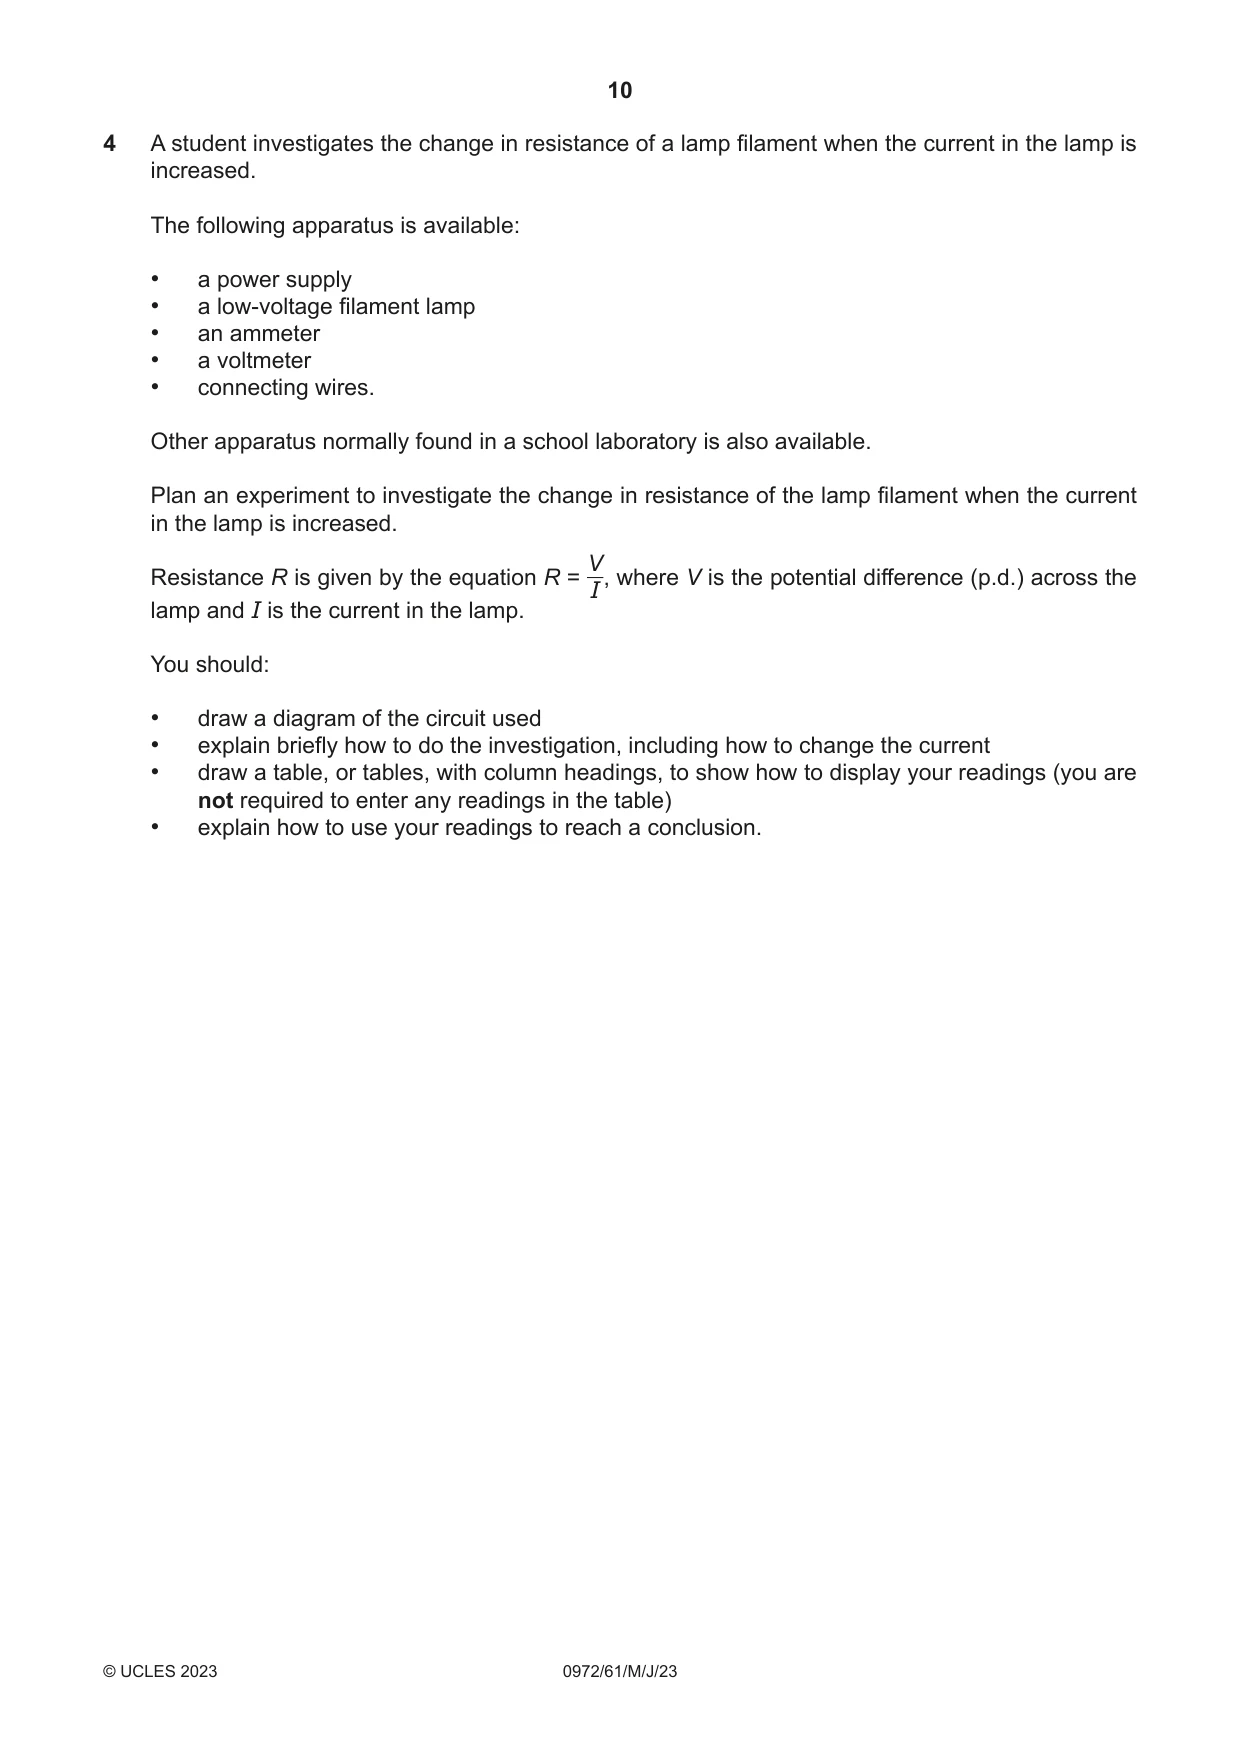
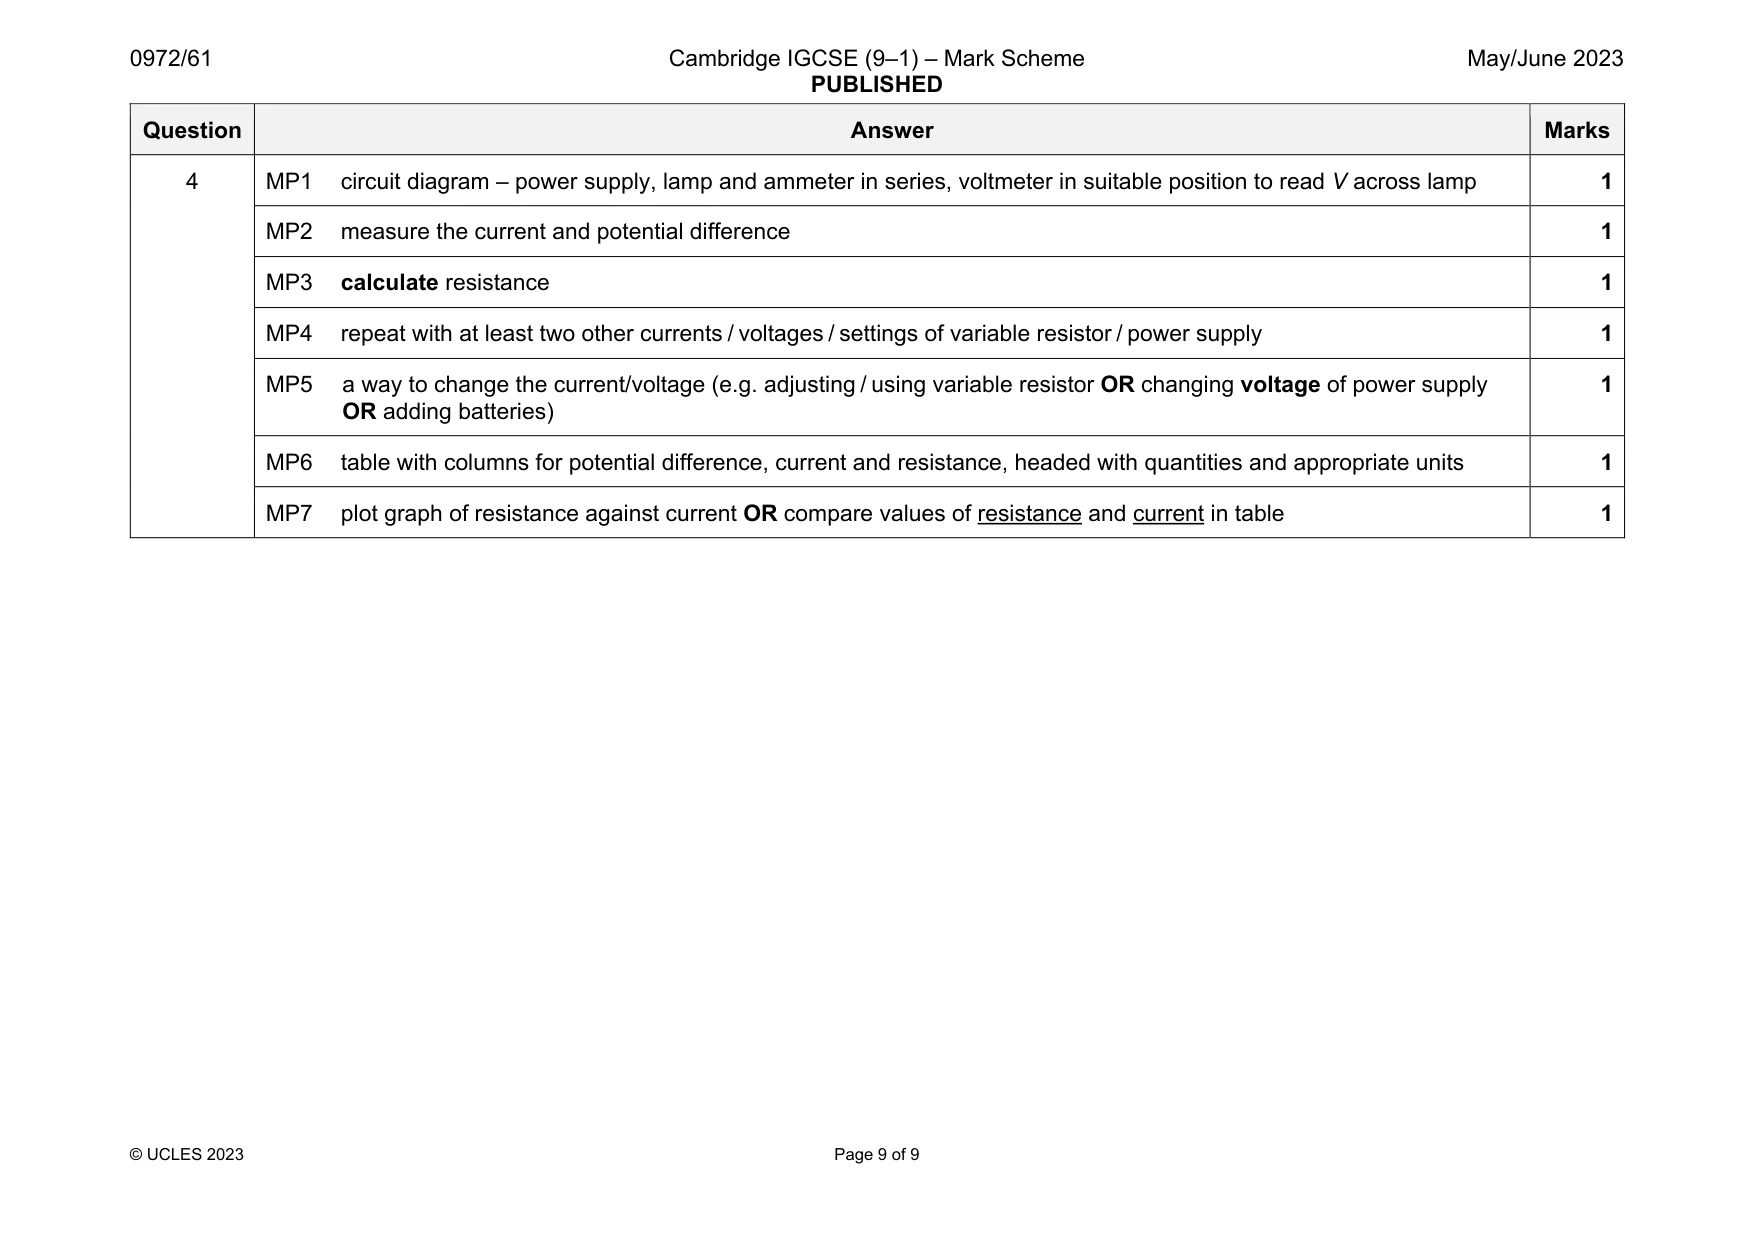
4 A student investigates the change in resistance of a lamp filament when the current in the lamp is increased. The following apparatus is available: • a power supply • a low-voltage filament lamp • an ammeter • a voltmeter • connecting wires. Other apparatus normally found in a school laboratory is also available. Plan an experiment to investigate the change in resistance of the lamp filament when the current in the lamp is increased. V Resistance R is given by the equation R = I, where V is the potential difference (p.d.) across the lamp and I is the current in the lamp. You should: • draw a diagram of the circuit used • explain briefly how to do the investigation, including how to change the current • draw a table, or tables, with column headings, to show how to display your readings (you are not required to enter any readings in the table) • explain how to use your readings to reach a conclusion. .......................................................................................................................................................... .......................................................................................................................................................... .......................................................................................................................................................... .......................................................................................................................................................... .......................................................................................................................................................... .......................................................................................................................................................... .......................................................................................................................................................... .......................................................................................................................................................... .......................................................................................................................................................... .......................................................................................................................................................... .......................................................................................................................................................... .......................................................................................................................................................... .......................................................................................................................................................... .......................................................................................................................................................... .......................................................................................................................................................... .......................................................................................................................................................... .......................................................................................................................................................... .......................................................................................................................................................... .......................................................................................................................................................... .................................................................................................................................................... [7]
Mark scheme: 4 MP1 circuit diagram – power supply, lamp and ammeter in series, voltmeter in suitable position to read V across lamp 1 MP2 measure the current and potential difference 1 MP3 calculate resistance 1 MP4 repeat with at least two other currents / voltages / settings of variable resistor / power supply 1 MP5 a way to change the current/voltage (e.g. adjusting / using variable resistor OR changing voltage of power supply OR adding batteries) 1 MP6 table with columns for potential difference, current and resistance, headed with quantities and appropriate units 1 MP7 plot graph of resistance against current OR compare values of resistance and current in table 1
What was in this paper
The subtopics covered by these 4 questions, and how many questions each got. Open one in a new tab to see every Cambridge question on it.
What you needed in this session
Cambridge’s own grade thresholds for 2023 May/June, Paper 6 · Variant 1. A higher threshold means an easier paper — the bar moves with how the cohort did.