Cambridge IGCSE Physics (9-1) 0972 — 2025 Oct/Nov Paper 6 · Variant 1
0972/61/O/N/25 · 4 questions · 40 marks · ≈45 min
The question paper and its mark scheme, free to read here and free to download. This is Cambridge’s own paper, exactly as it was sat.
Question paper12 pages
Mark scheme14 pages
Answers below. Sit the paper first if you are practising.
Questions as text
Q1 · A student investigates the balancing of a metre ruler
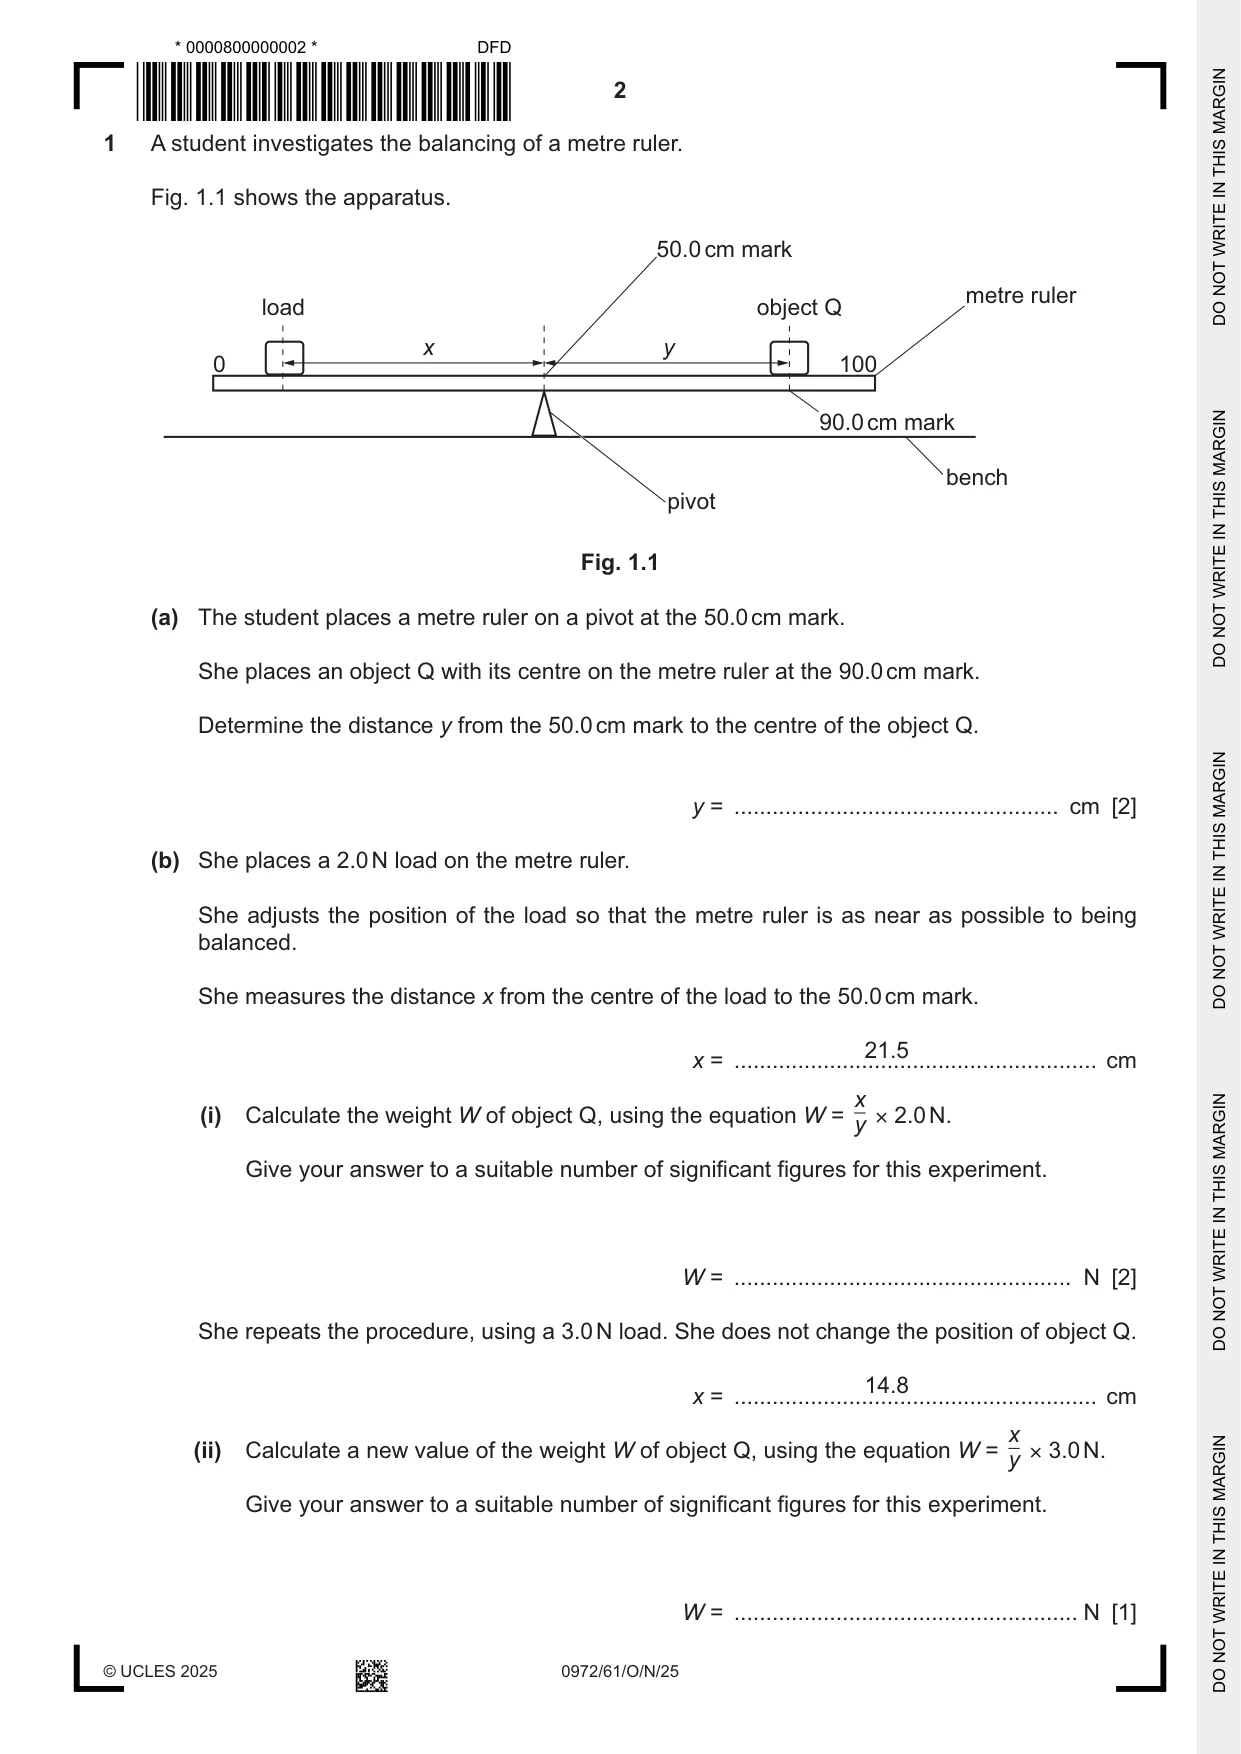
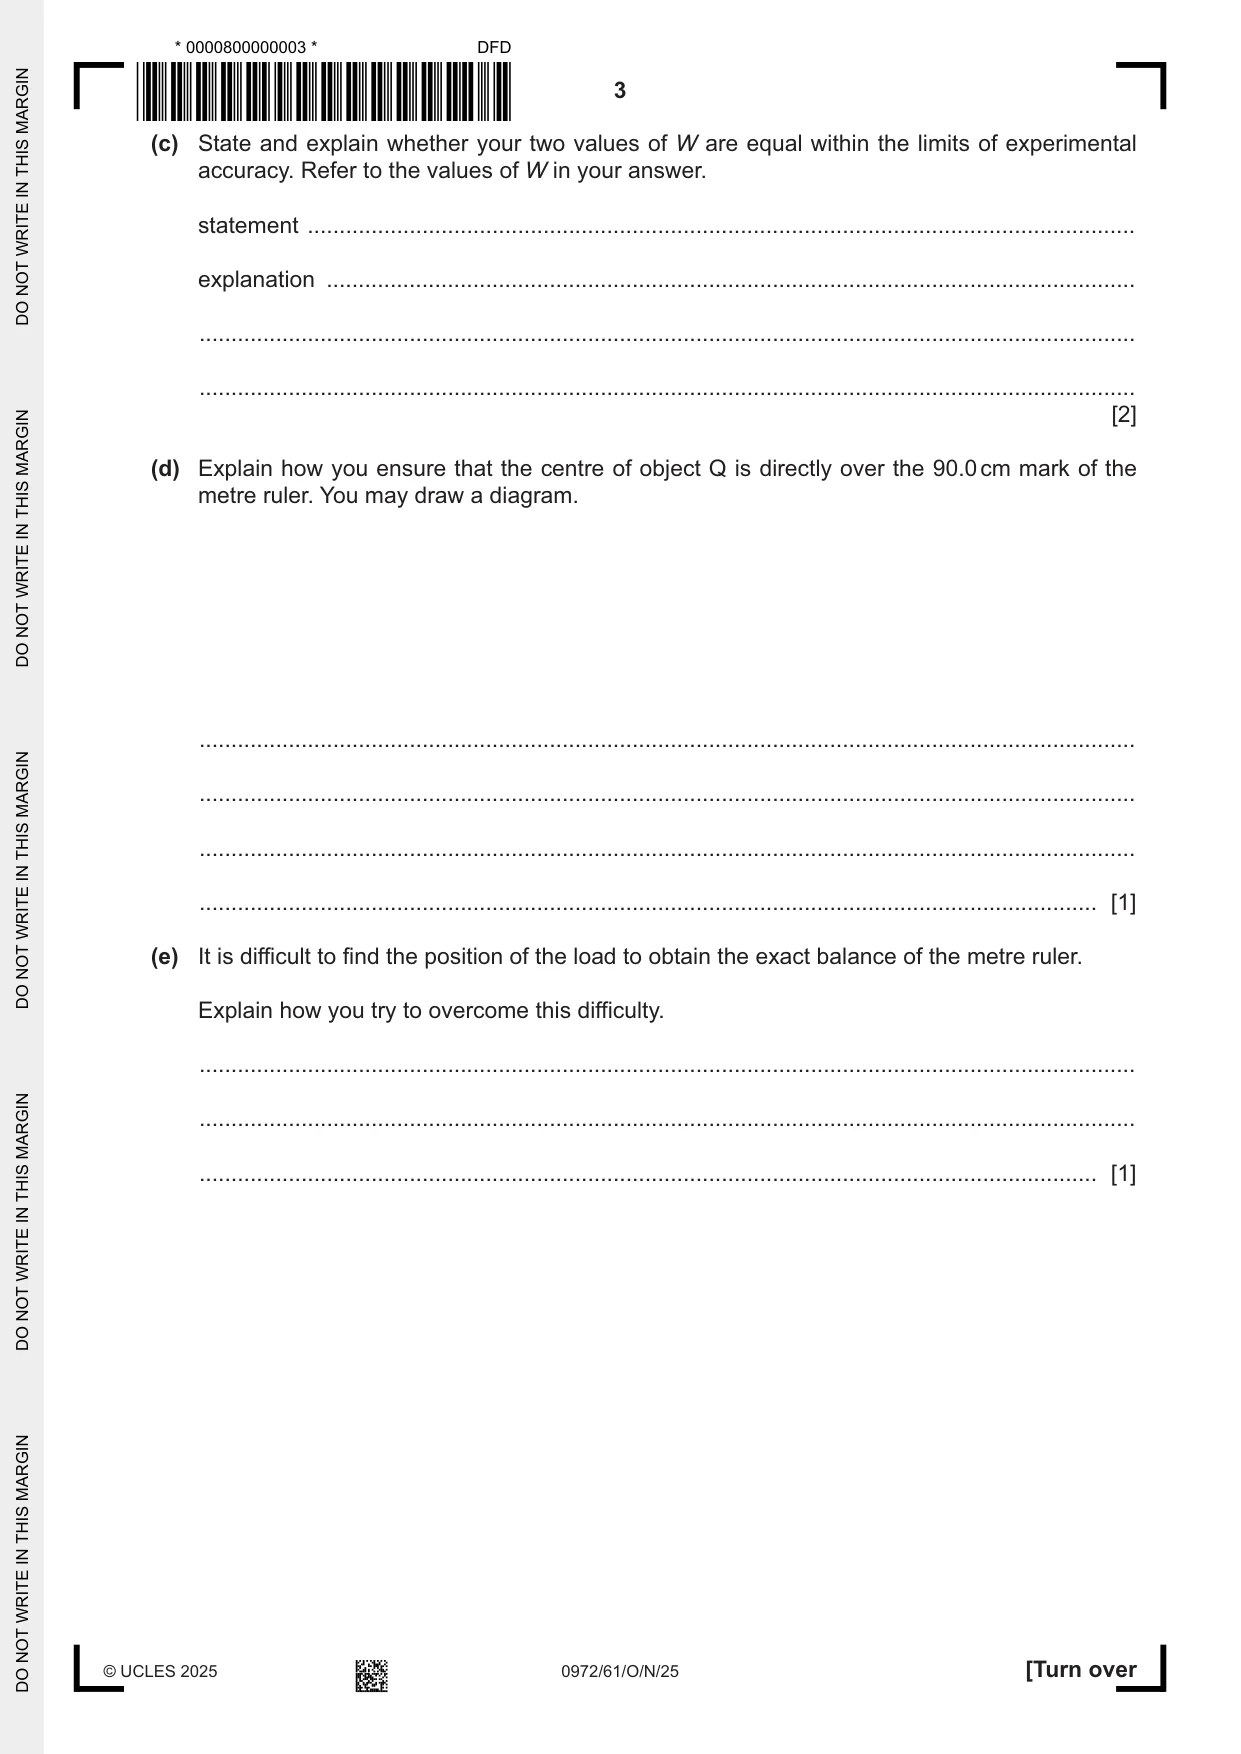
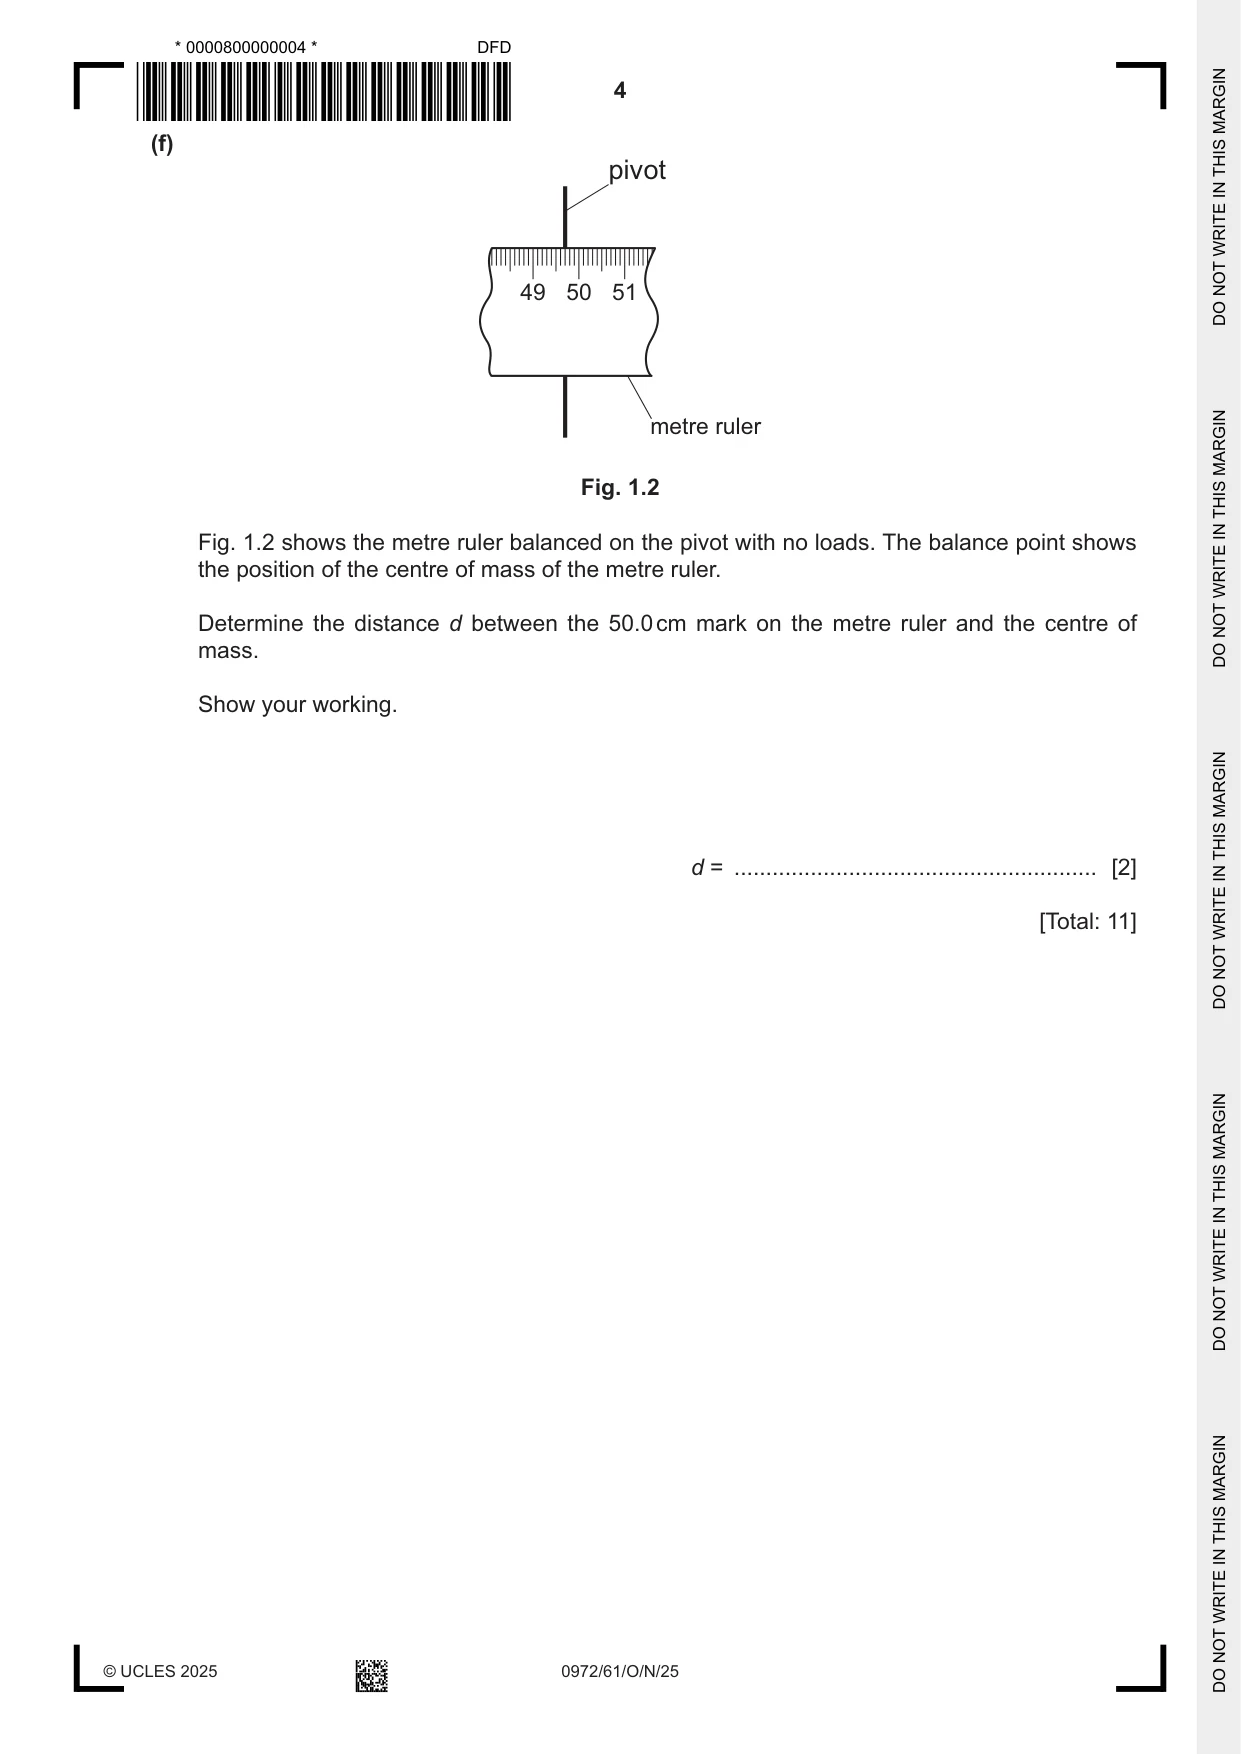
1 A student investigates the balancing of a metre ruler. Fig. 1.1 shows the apparatus. 50.0 cm mark metre ruler load object Q x y 0 100 90.0 cm mark bench pivot Fig. 1.1 (a) The student places a metre ruler on a pivot at the 50.0 cm mark. She places an object Q with its centre on the metre ruler at the 90.0 cm mark. Determine the distance y from the 50.0 cm mark to the centre of the object Q. y = ................................................... cm [2] (b) She places a 2.0 N load on the metre ruler. She adjusts the position of the load so that the metre ruler is as near as possible to being balanced. She measures the distance x from the centre of the load to the 50.0 cm mark. 21.5 x = ......................................................... cm x (i) Calculate the weight W of object Q, using the equation W = × 2.0 N. y Give your answer to a suitable number of significant figures for this experiment. W = ..................................................... N [2] She repeats the procedure, using a 3.0 N load. She does not change the position of object Q. 14.8 x = ......................................................... cm x (ii) Calculate a new value of the weight W of object Q, using the equation W = × 3.0 N. y Give your answer to a suitable number of significant figures for this experiment. W = ...................................................... N [1] (c) State and explain whether your two values of W are equal within the limits of experimental accuracy. Refer to the values of W in your answer. statement .................................................................................................................................. explanation ............................................................................................................................... ................................................................................................................................................... ................................................................................................................................................... [2] (d) Explain how you ensure that the centre of object Q is directly over the 90.0 cm mark of the metre ruler. You may draw a diagram. ................................................................................................................................................... ................................................................................................................................................... ................................................................................................................................................... ............................................................................................................................................. [1] (e) It is difficult to find the position of the load to obtain the exact balance of the metre ruler. Explain how you try to overcome this difficulty. ................................................................................................................................................... ................................................................................................................................................... ............................................................................................................................................. [1] (f) pivot 49 50 51 metre ruler Fig. 1.2 Fig. 1.2 shows the metre ruler balanced on the pivot with no loads. The balance point shows the position of the centre of mass of the metre ruler. Determine the distance d between the 50.0 cm mark on the metre ruler and the centre of mass. Show your working. d = ......................................................... [2] [Total: 11]
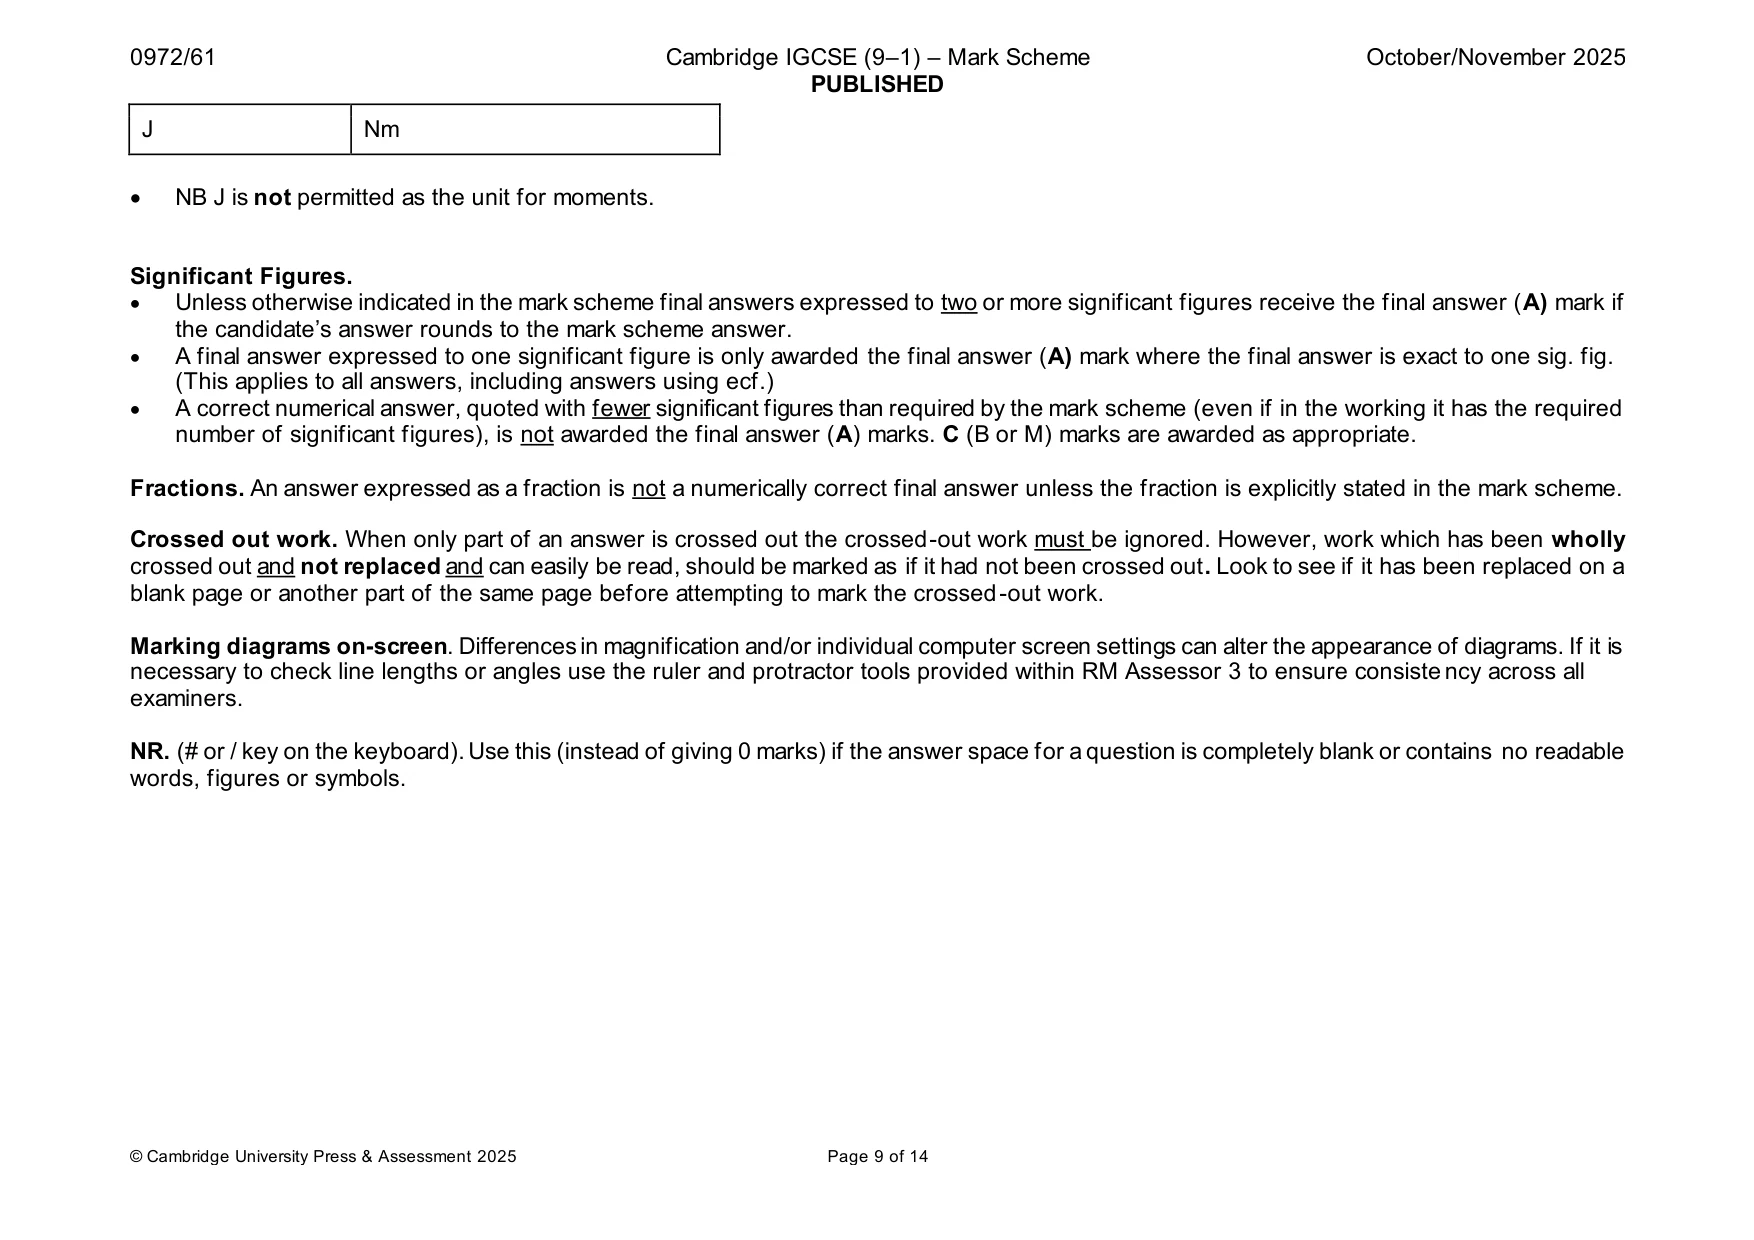
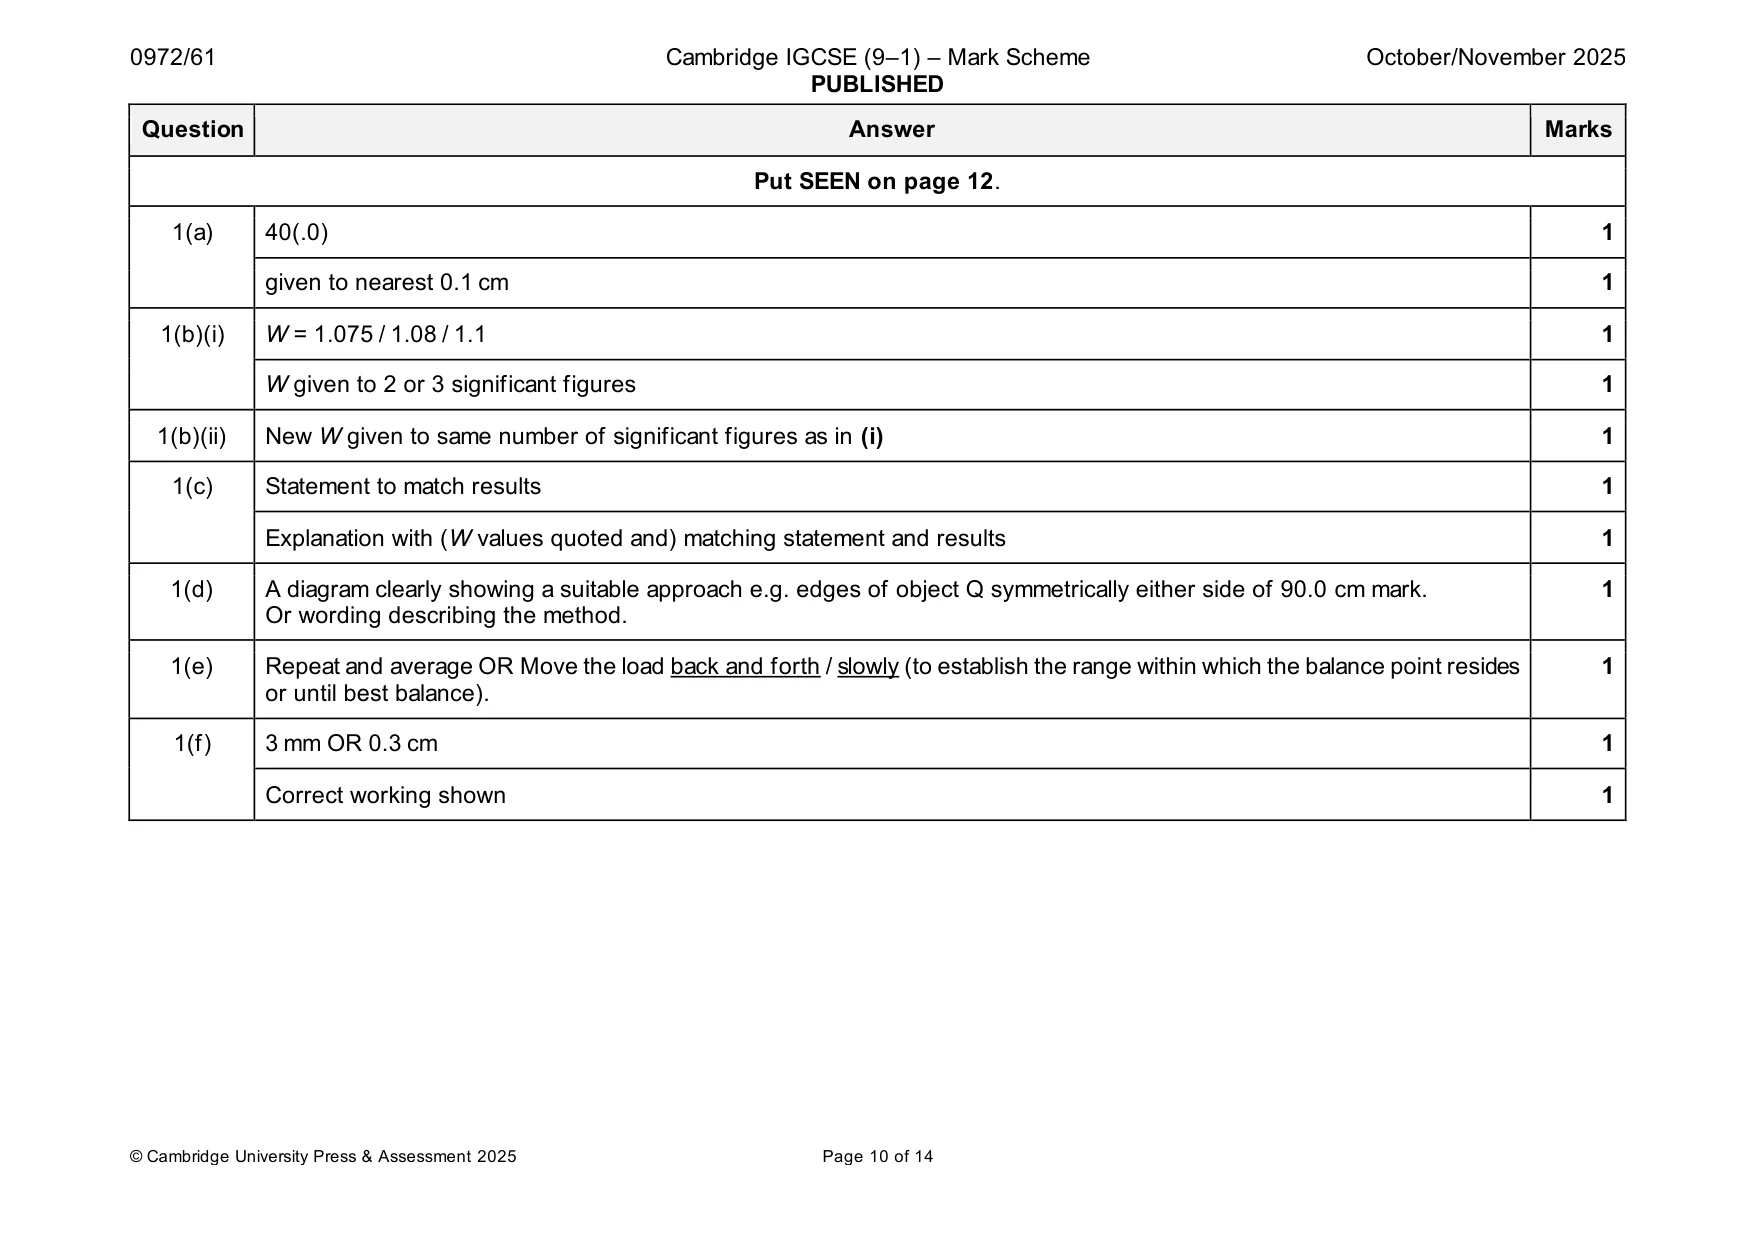
Mark scheme: Question Answer Marks Put SEEN on page 12. 1(a) 40(.0) 1 given to nearest 0.1 cm 1 1(b)(i) W = 1.075 / 1.08 / 1.1 1 W given to 2 or 3 significant figures 1 1(b)(ii) New W given to same number of significant figures as in (i) 1 1(c) Statement to match results 1 Explanation with (W values quoted and) matching statement and results 1 1(d) A diagram clearly showing a suitable approach e.g. edges of object Q symmetrically either side of 90.0 cm mark. 1 Or wording describing the method. 1(e) Repeat and average OR Move the load back and forth / slowly (to establish the range within which the balance point resides 1 or until best balance). 1(f) 3 mm OR 0.3 cm 1 Correct working shown 1
Q2 · A student investigates the resistance of a wire
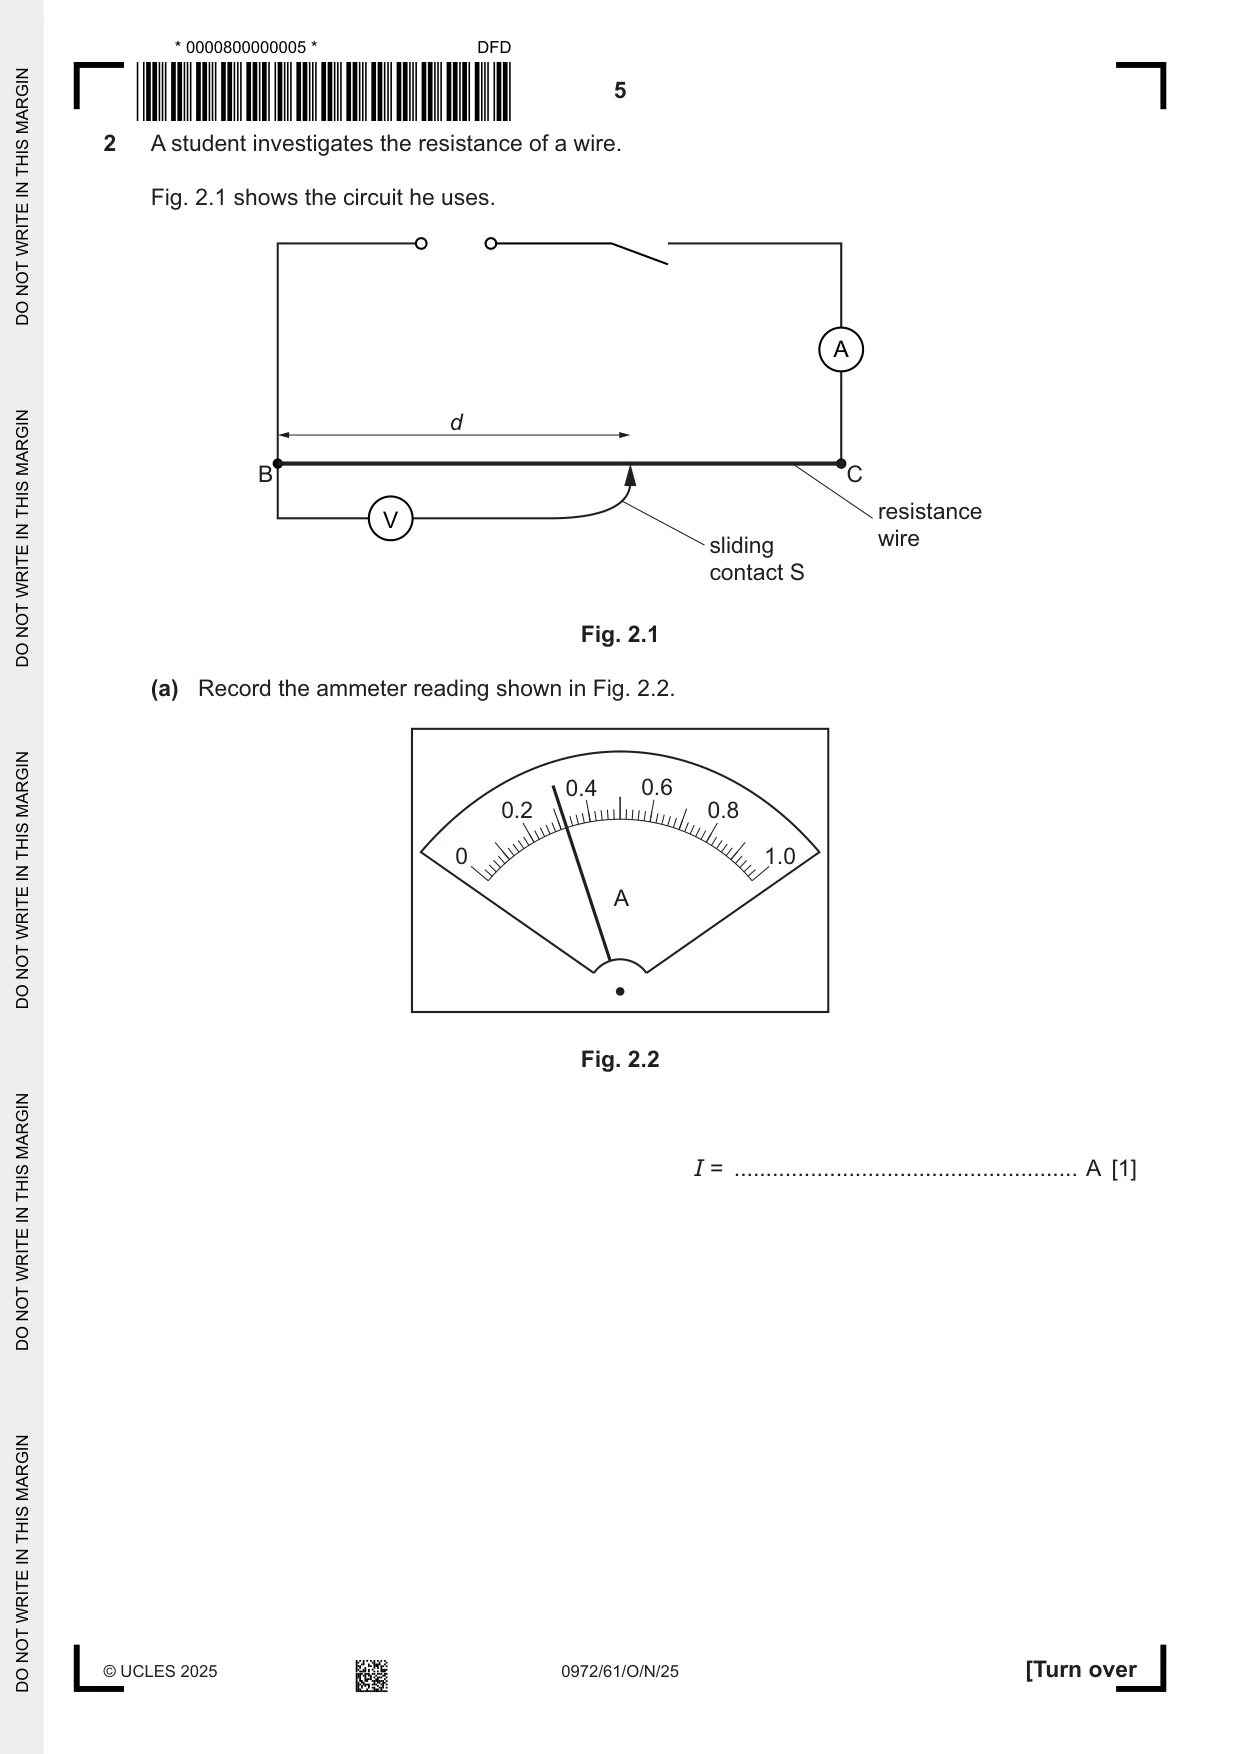
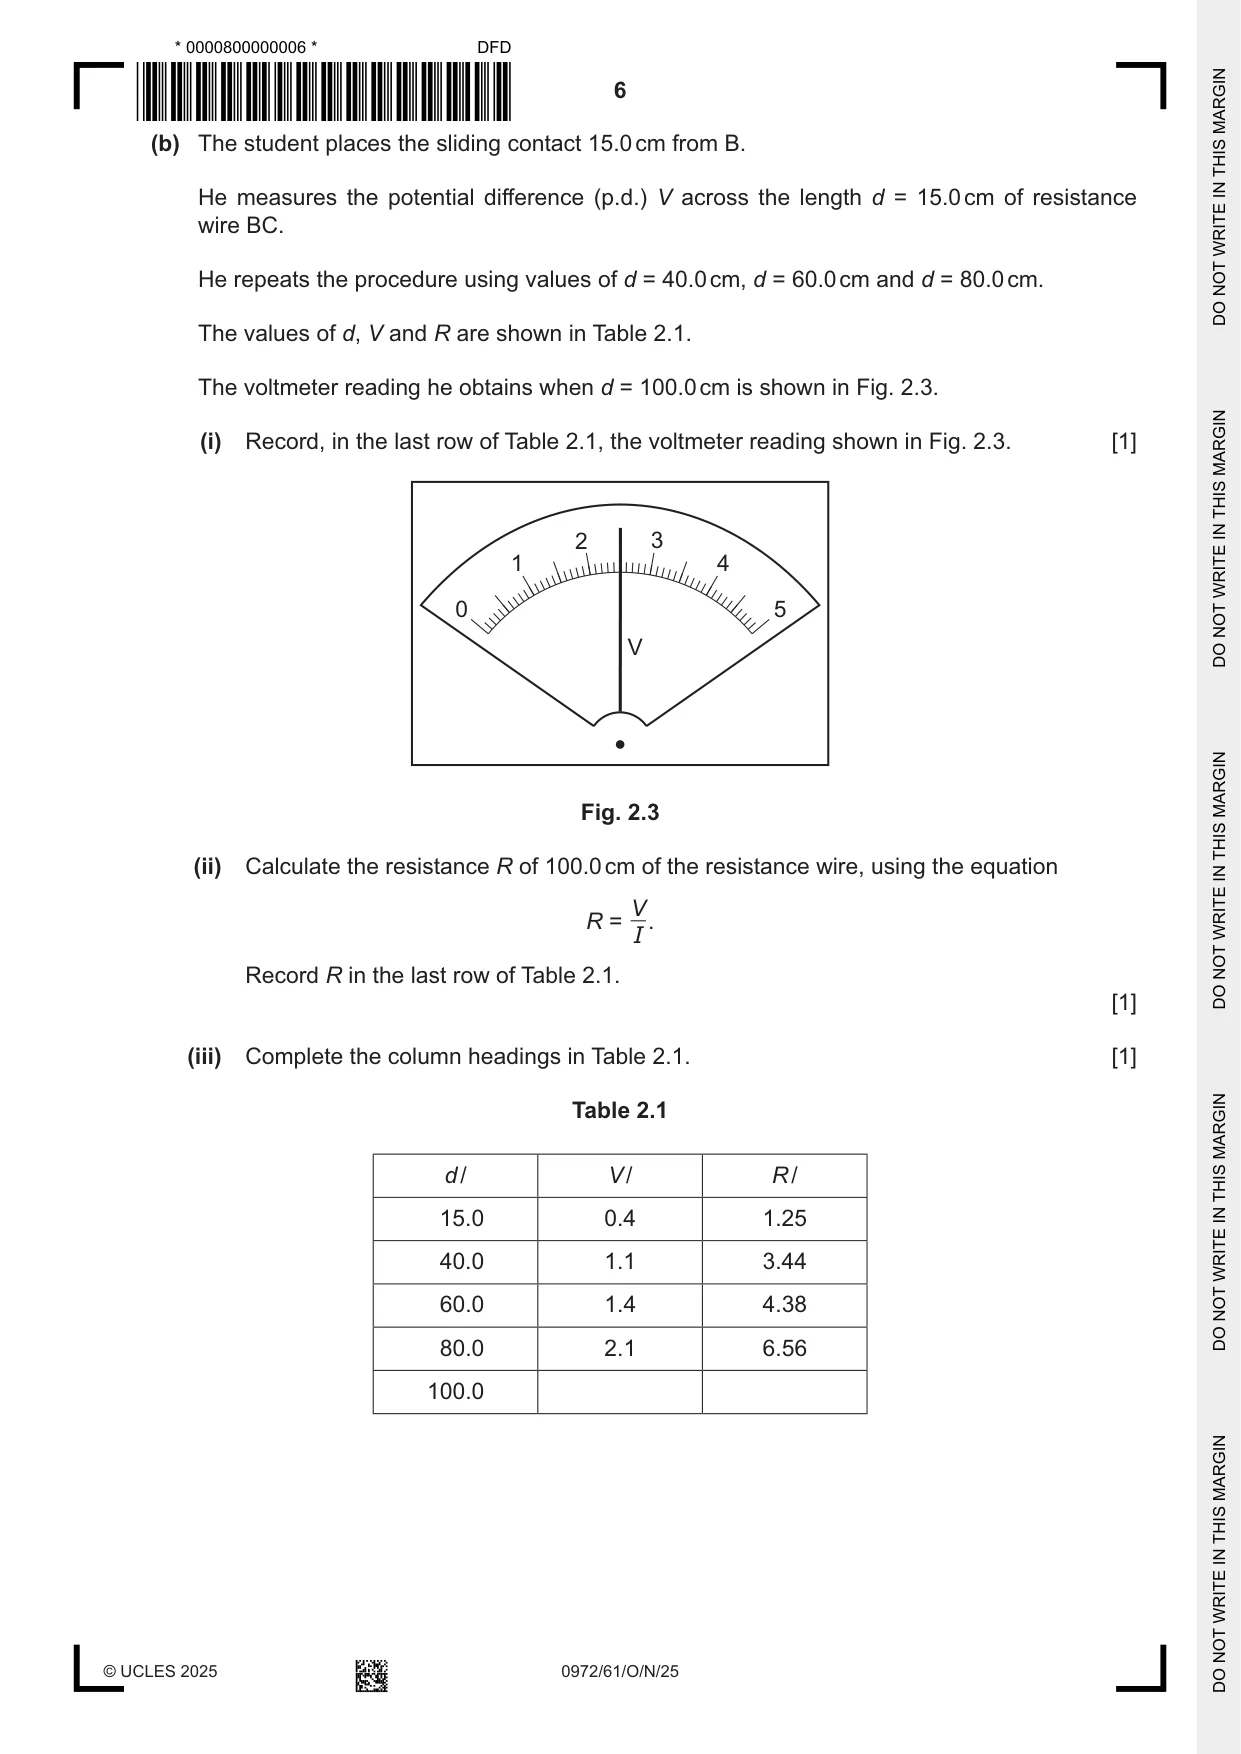
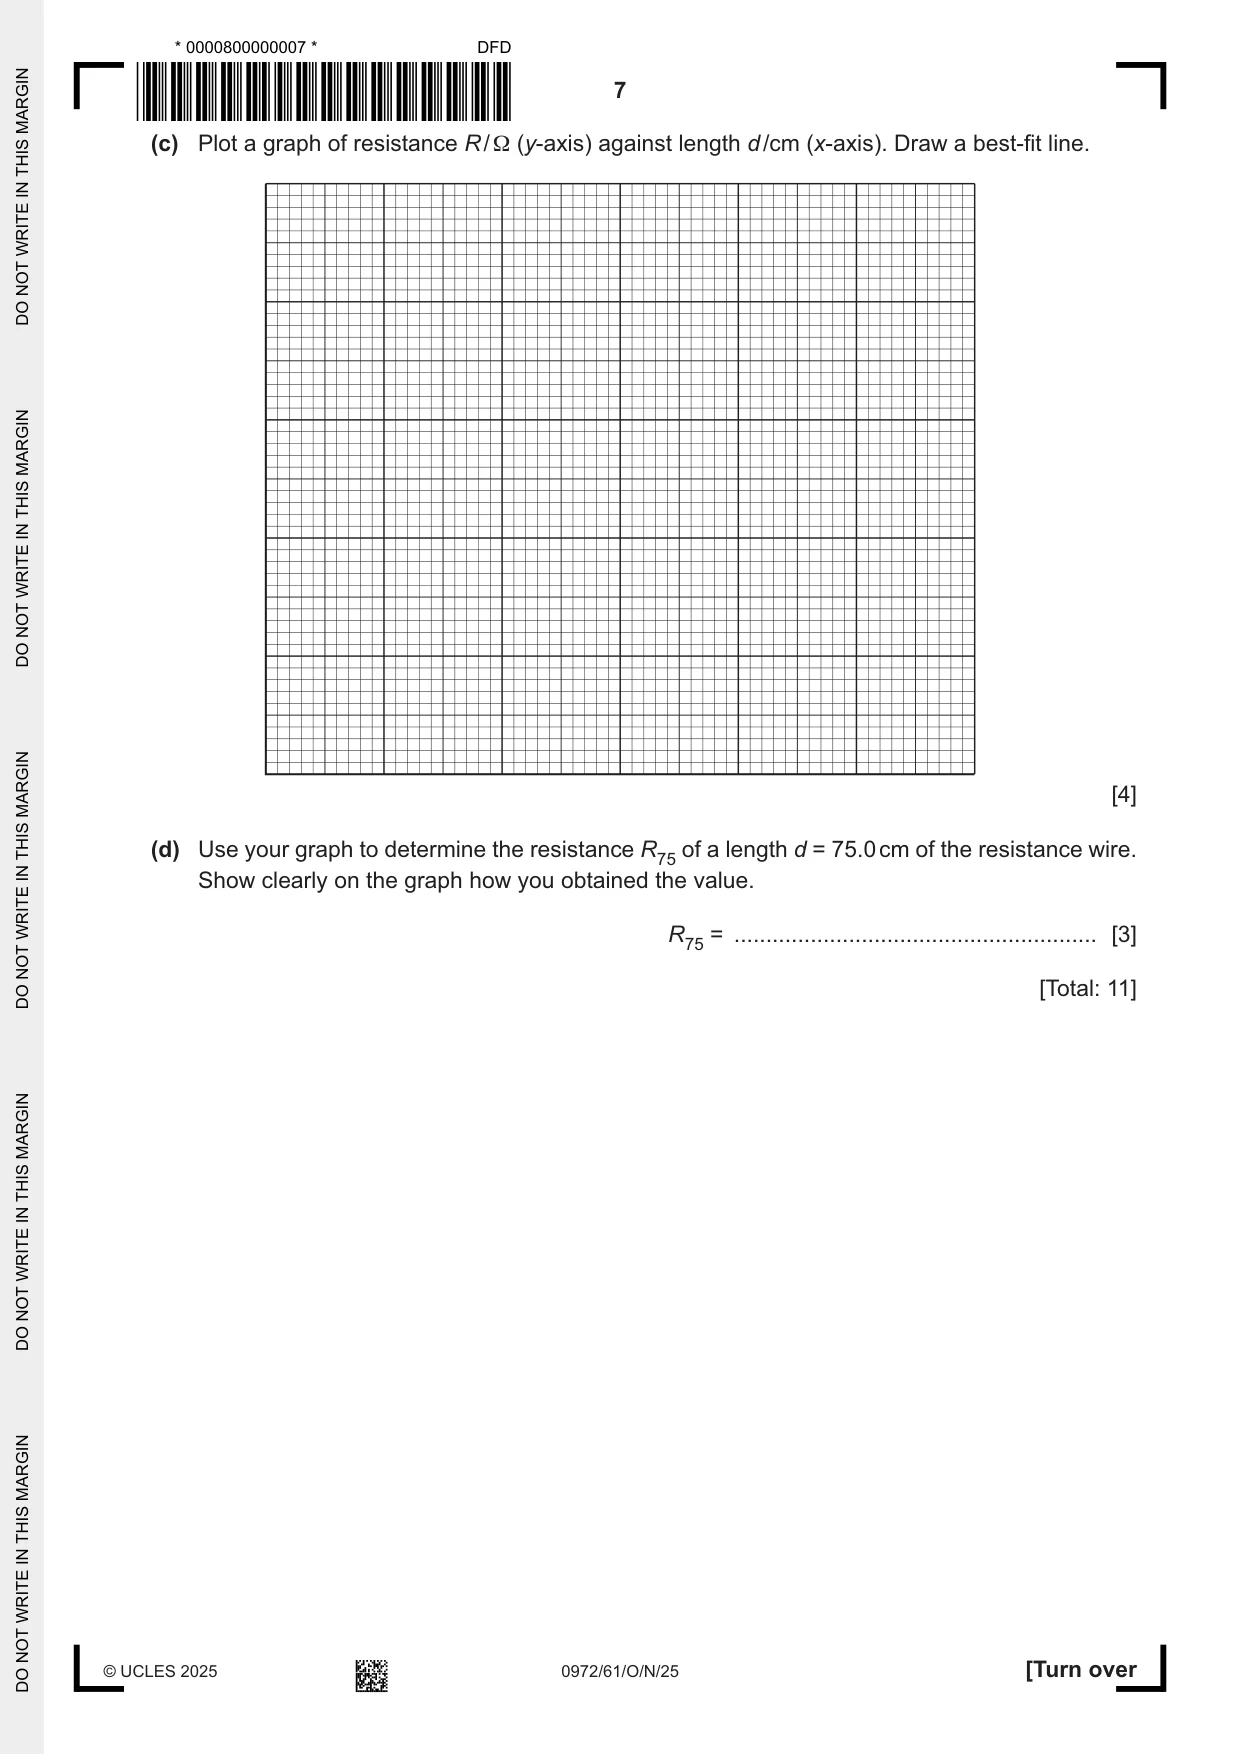
2 A student investigates the resistance of a wire. Fig. 2.1 shows the circuit he uses. A d B C resistance V wire sliding contact S Fig. 2.1 (a) Record the ammeter reading shown in Fig. 2.2. 0.4 0.6 0.2 0.8 0 1.0 A Fig. 2.2 I = ...................................................... A [1] (b) The student places the sliding contact 15.0 cm from B. He measures the potential difference (p.d.) V across the length d = 15.0 cm of resistance wire BC. He repeats the procedure using values of d = 40.0 cm, d = 60.0 cm and d = 80.0 cm. The values of d, V and R are shown in Table 2.1. The voltmeter reading he obtains when d = 100.0 cm is shown in Fig. 2.3. (i) Record, in the last row of Table 2.1, the voltmeter reading shown in Fig. 2.3. [1] 2 3 1 4 0 5 V Fig. 2.3 (ii) Calculate the resistance R of 100.0 cm of the resistance wire, using the equation V R = . I Record R in the last row of Table 2.1. [1] (iii) Complete the column headings in Table 2.1. [1] Table 2.1 d / V / R / 15.0 0.4 1.25 40.0 1.1 3.44 60.0 1.4 4.38 80.0 2.1 6.56 100.0 (c) Plot a graph of resistance R / Ω (y-axis) against length d /cm (x-axis). Draw a best-fit line. [4] (d) Use your graph to determine the resistance R75 of a length d = 75.0 cm of the resistance wire. Show clearly on the graph how you obtained the value. R75 = ......................................................... [3] [Total: 11]
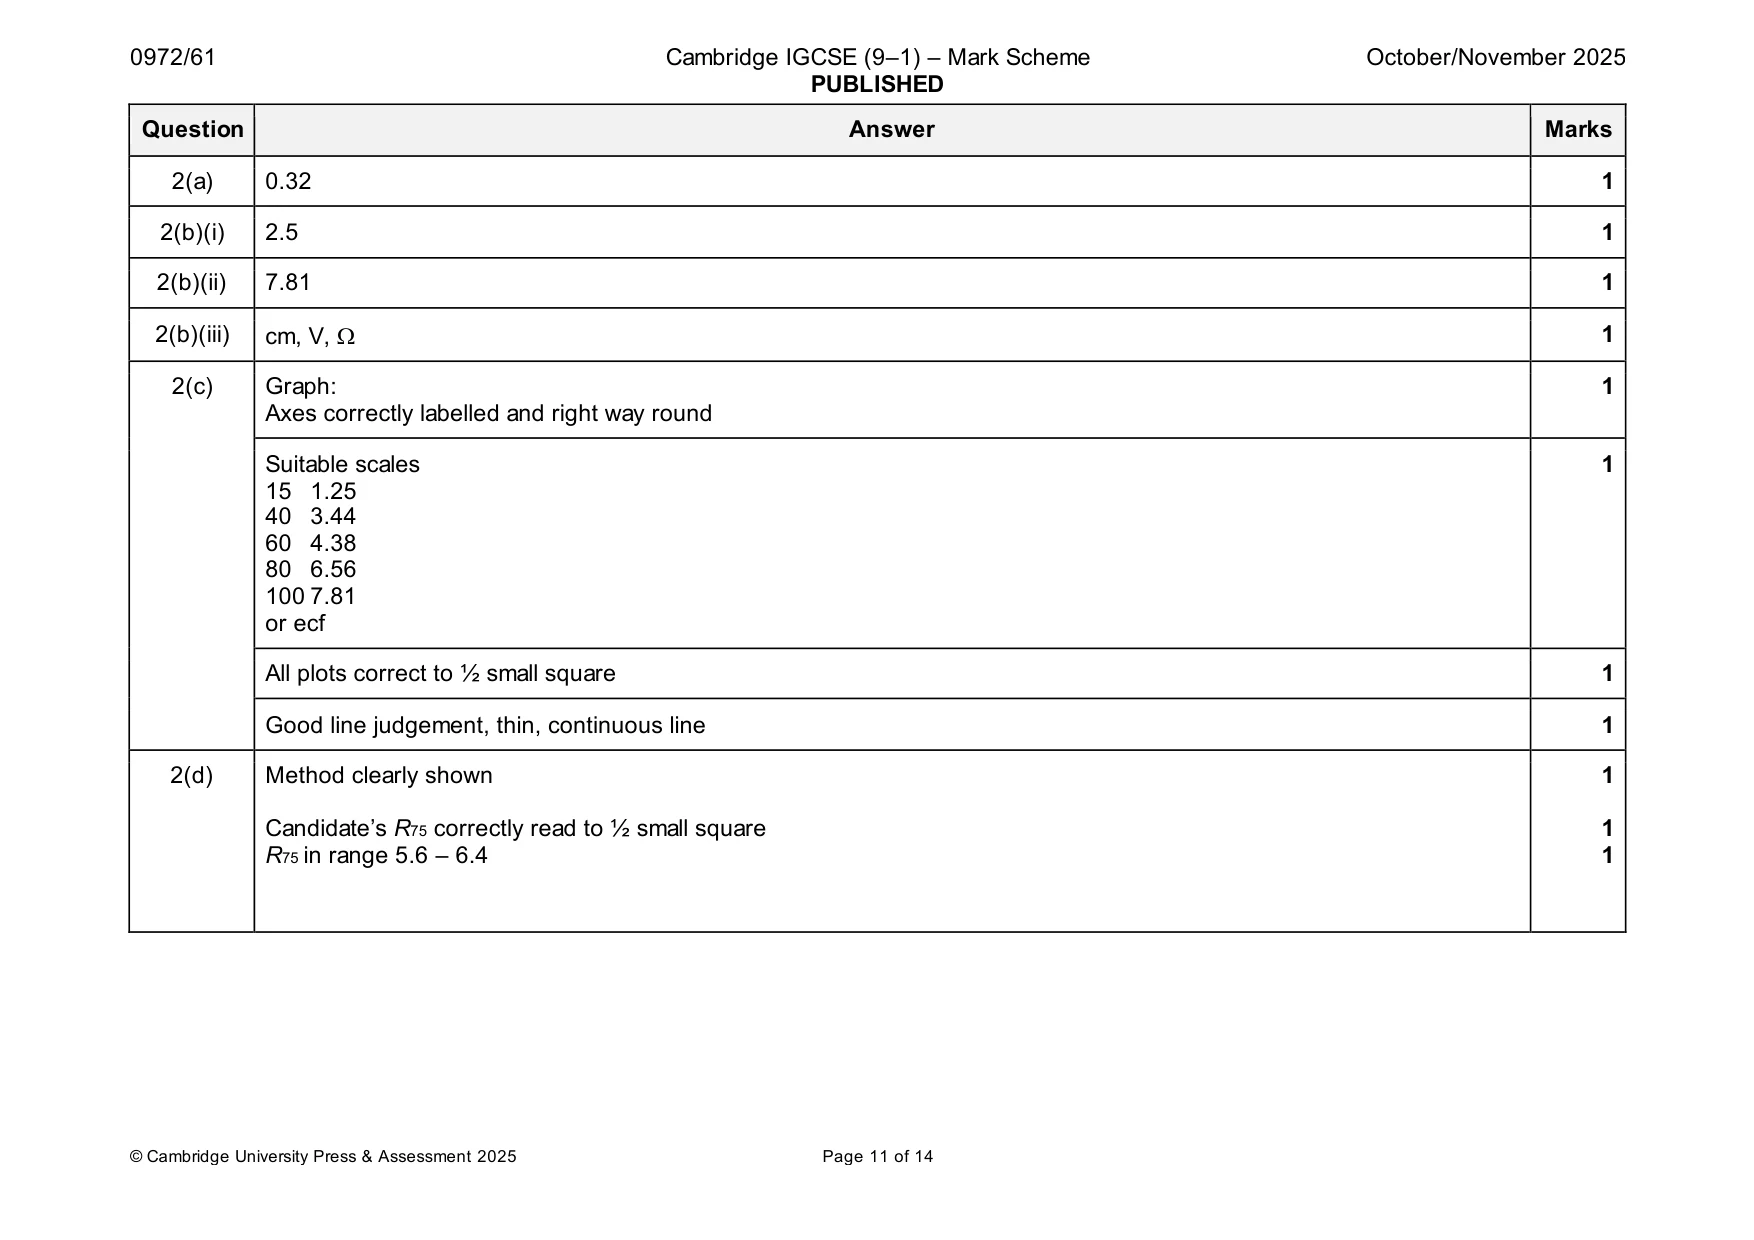
Mark scheme: 2(a) 0.32 1 2(b)(i) 2.5 1 2(b)(ii) 7.81 1 2(b)(iii) cm, V, 1 2(c) Graph: 1 Axes correctly labelled and right way round Suitable scales 1 15 1.25 40 3.44 60 4.38 80 6.56 100 7.81 or ecf All plots correct to ½ small square 1 Good line judgement, thin, continuous line 1 2(d) Method clearly shown 1 Candidate’s R75 correctly read to ½ small square 1 R75 in range 5.6 – 6.4 1
More questions on Physical quantities and measurement techniques
Q3 · A student investigates the refraction of light in the material of a transparent block
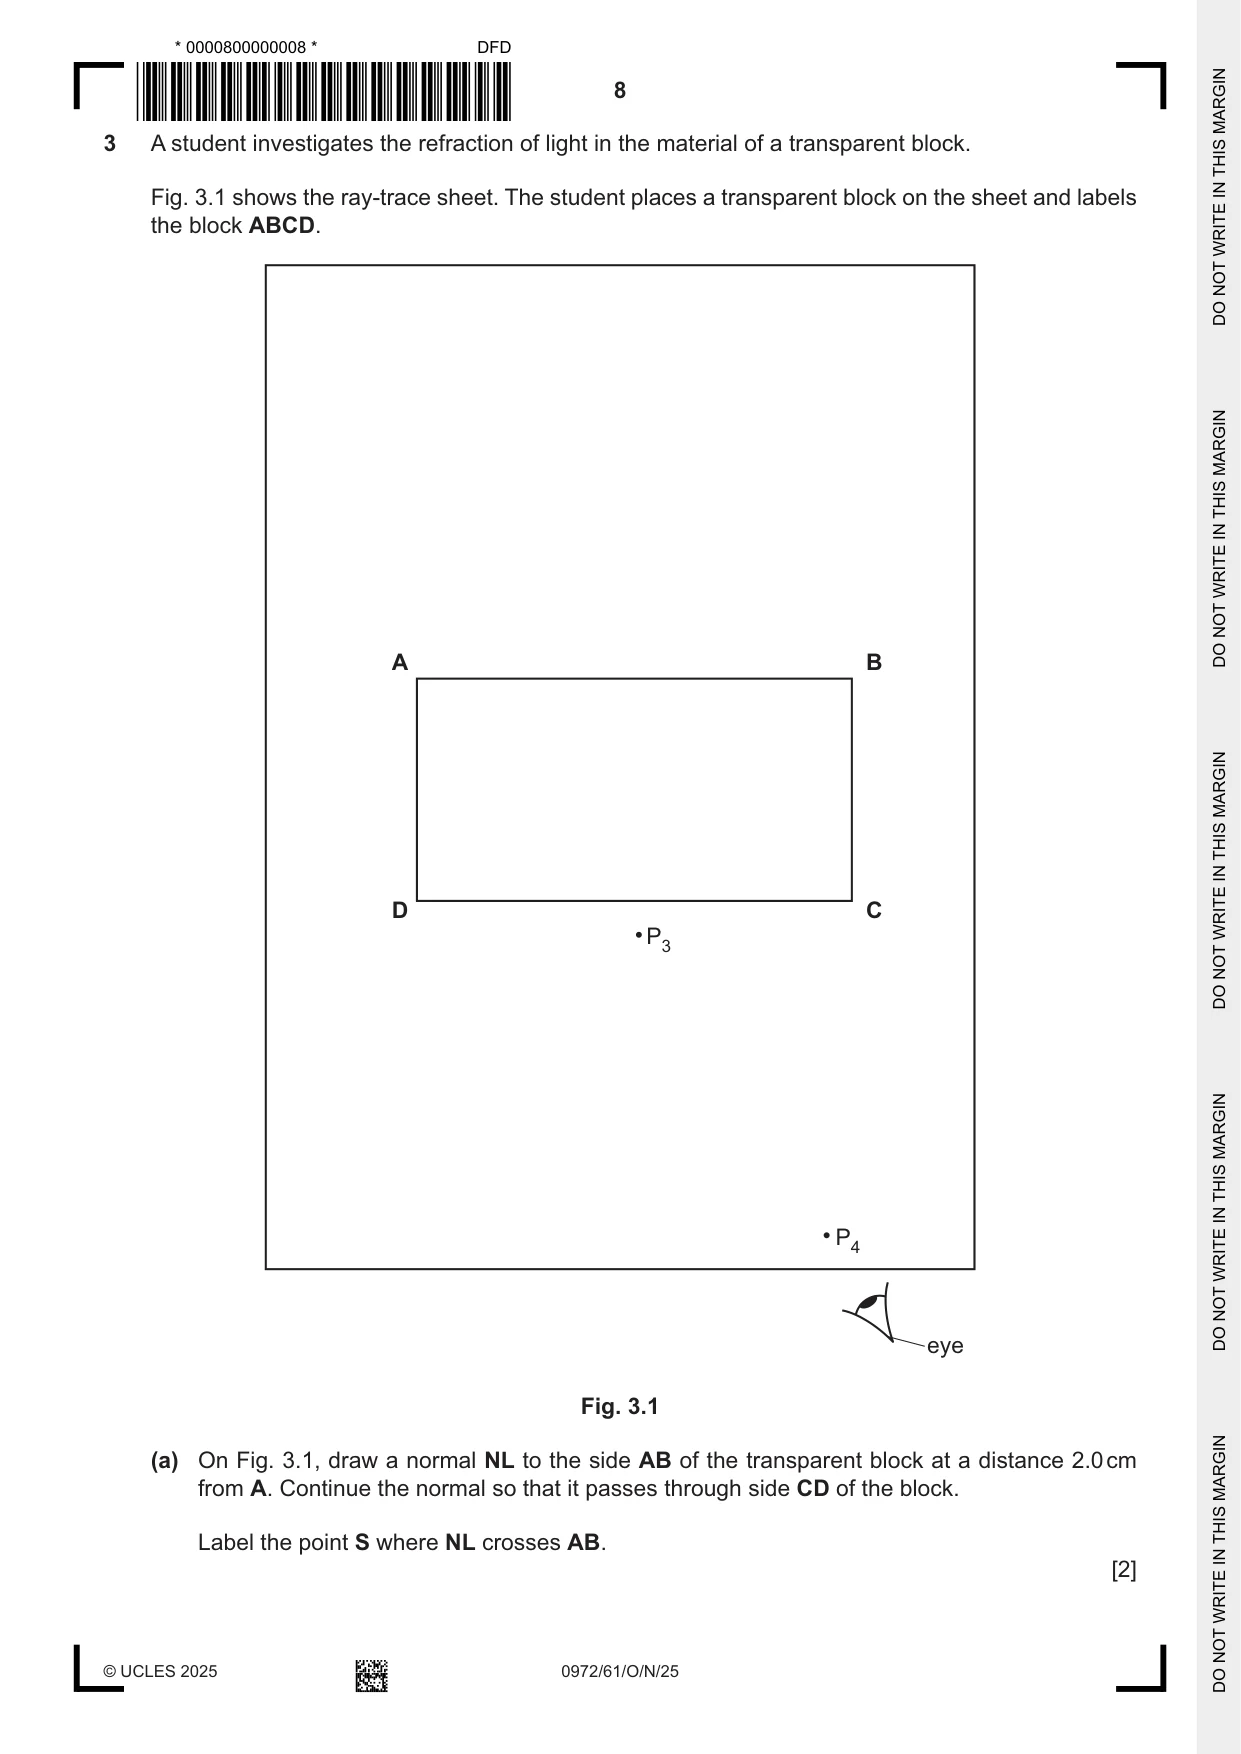
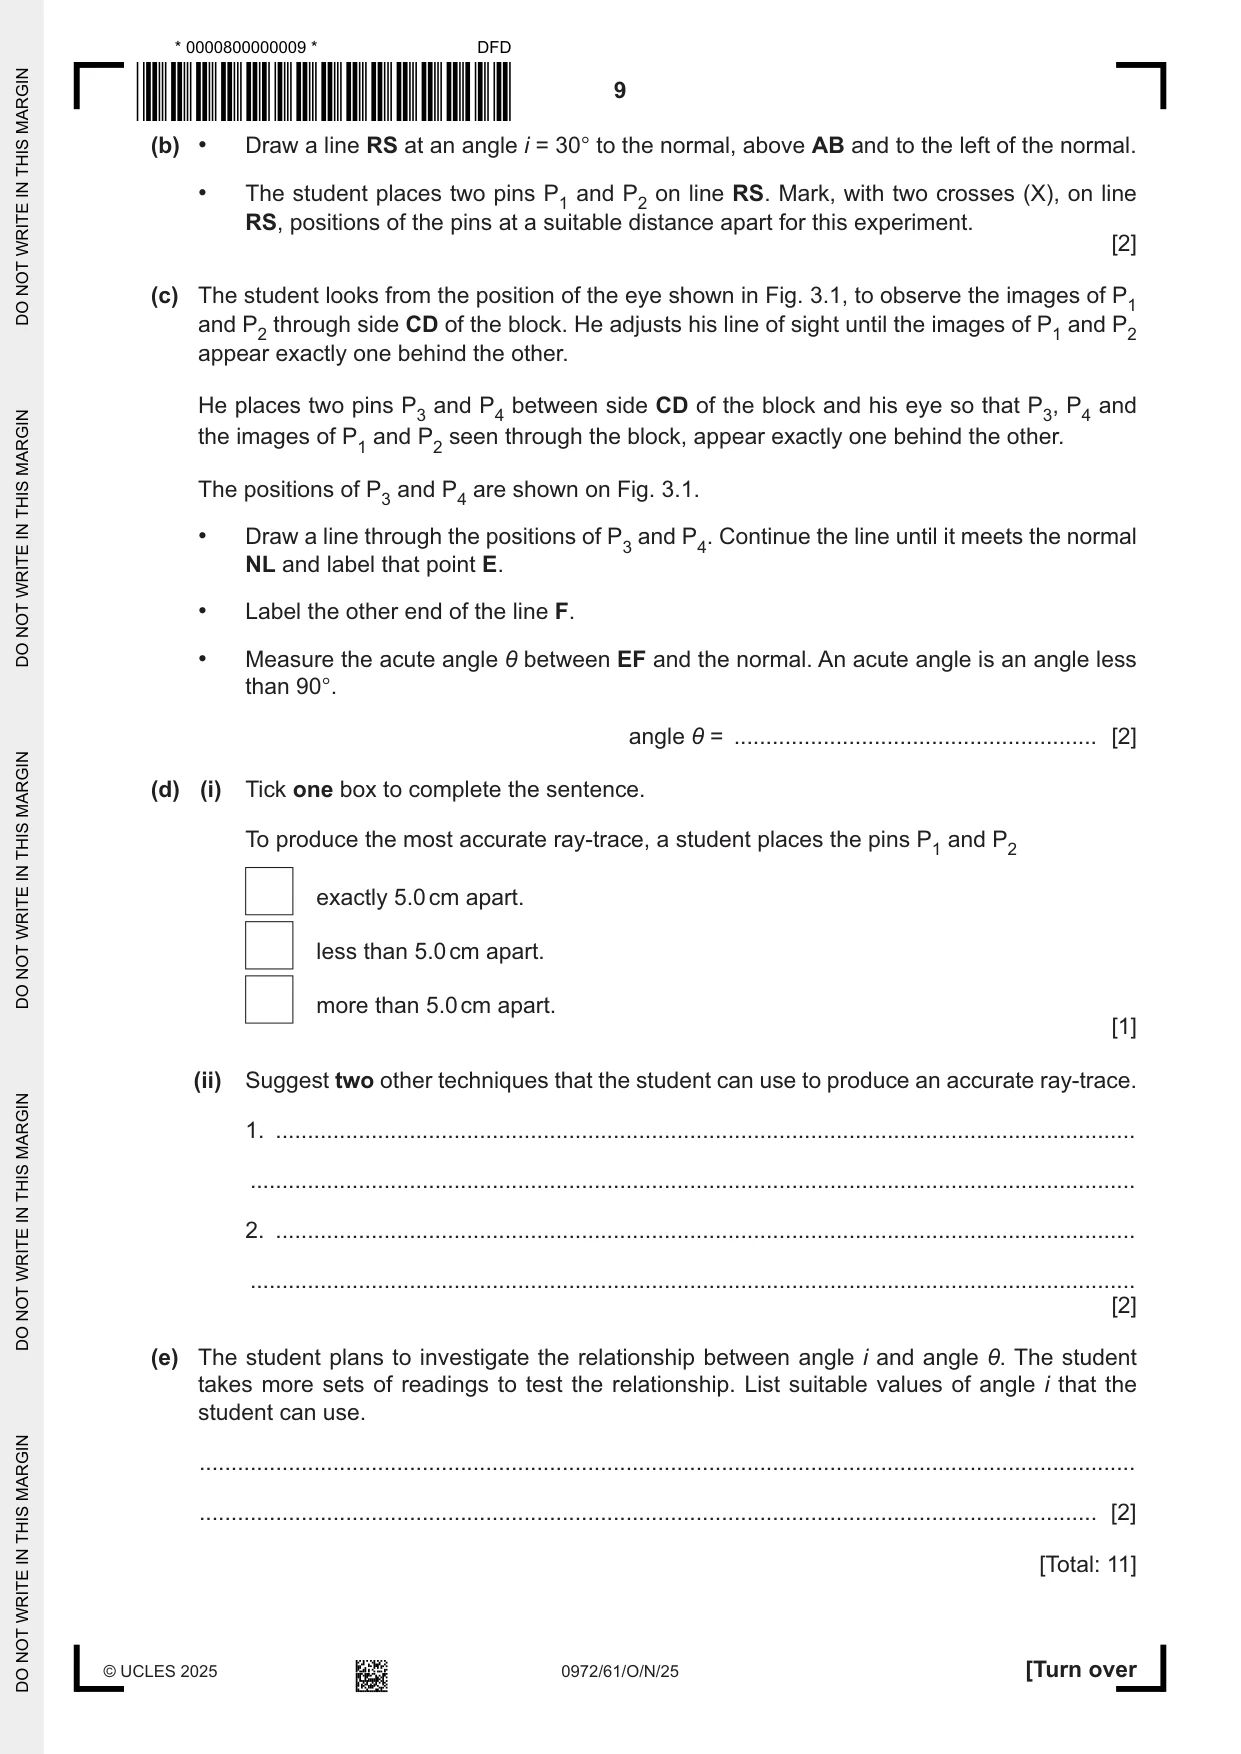
3 A student investigates the refraction of light in the material of a transparent block. Fig. 3.1 shows the ray-trace sheet. The student places a transparent block on the sheet and labels the block ABCD. A B D C P3 P4 eye Fig. 3.1 (a) On Fig. 3.1, draw a normal NL to the side AB of the transparent block at a distance 2.0 cm from A. Continue the normal so that it passes through side CD of the block. Label the point S where NL crosses AB. [2] (b) • Draw a line RS at an angle i = 30° to the normal, above AB and to the left of the normal. • The student places two pins P1 and P2 on line RS. Mark, with two crosses (X), on line RS, positions of the pins at a suitable distance apart for this experiment. [2] (c) The student looks from the position of the eye shown in Fig. 3.1, to observe the images of P1 and P2 through side CD of the block. He adjusts his line of sight until the images of P1 and P2 appear exactly one behind the other. He places two pins P3 and P4 between side CD of the block and his eye so that P3, P4 and the images of P1 and P2 seen through the block, appear exactly one behind the other. The positions of P3 and P4 are shown on Fig. 3.1. • Draw a line through the positions of P3 and P4. Continue the line until it meets the normal NL and label that point E. • Label the other end of the line F. • Measure the acute angle θ between EF and the normal. An acute angle is an angle less than 90°. angle θ = ......................................................... [2] (d) (i) Tick one box to complete the sentence. To produce the most accurate ray-trace, a student places the pins P1 and P2 exactly 5.0 cm apart. less than 5.0 cm apart. more than 5.0 cm apart. [1] (ii) Suggest two other techniques that the student can use to produce an accurate ray-trace. 1. ....................................................................................................................................... ........................................................................................................................................... 2. ....................................................................................................................................... ........................................................................................................................................... [2] (e) The student plans to investigate the relationship between angle i and angle θ. The student takes more sets of readings to test the relationship. List suitable values of angle i that the student can use. ................................................................................................................................................... ............................................................................................................................................. [2] [Total: 11]
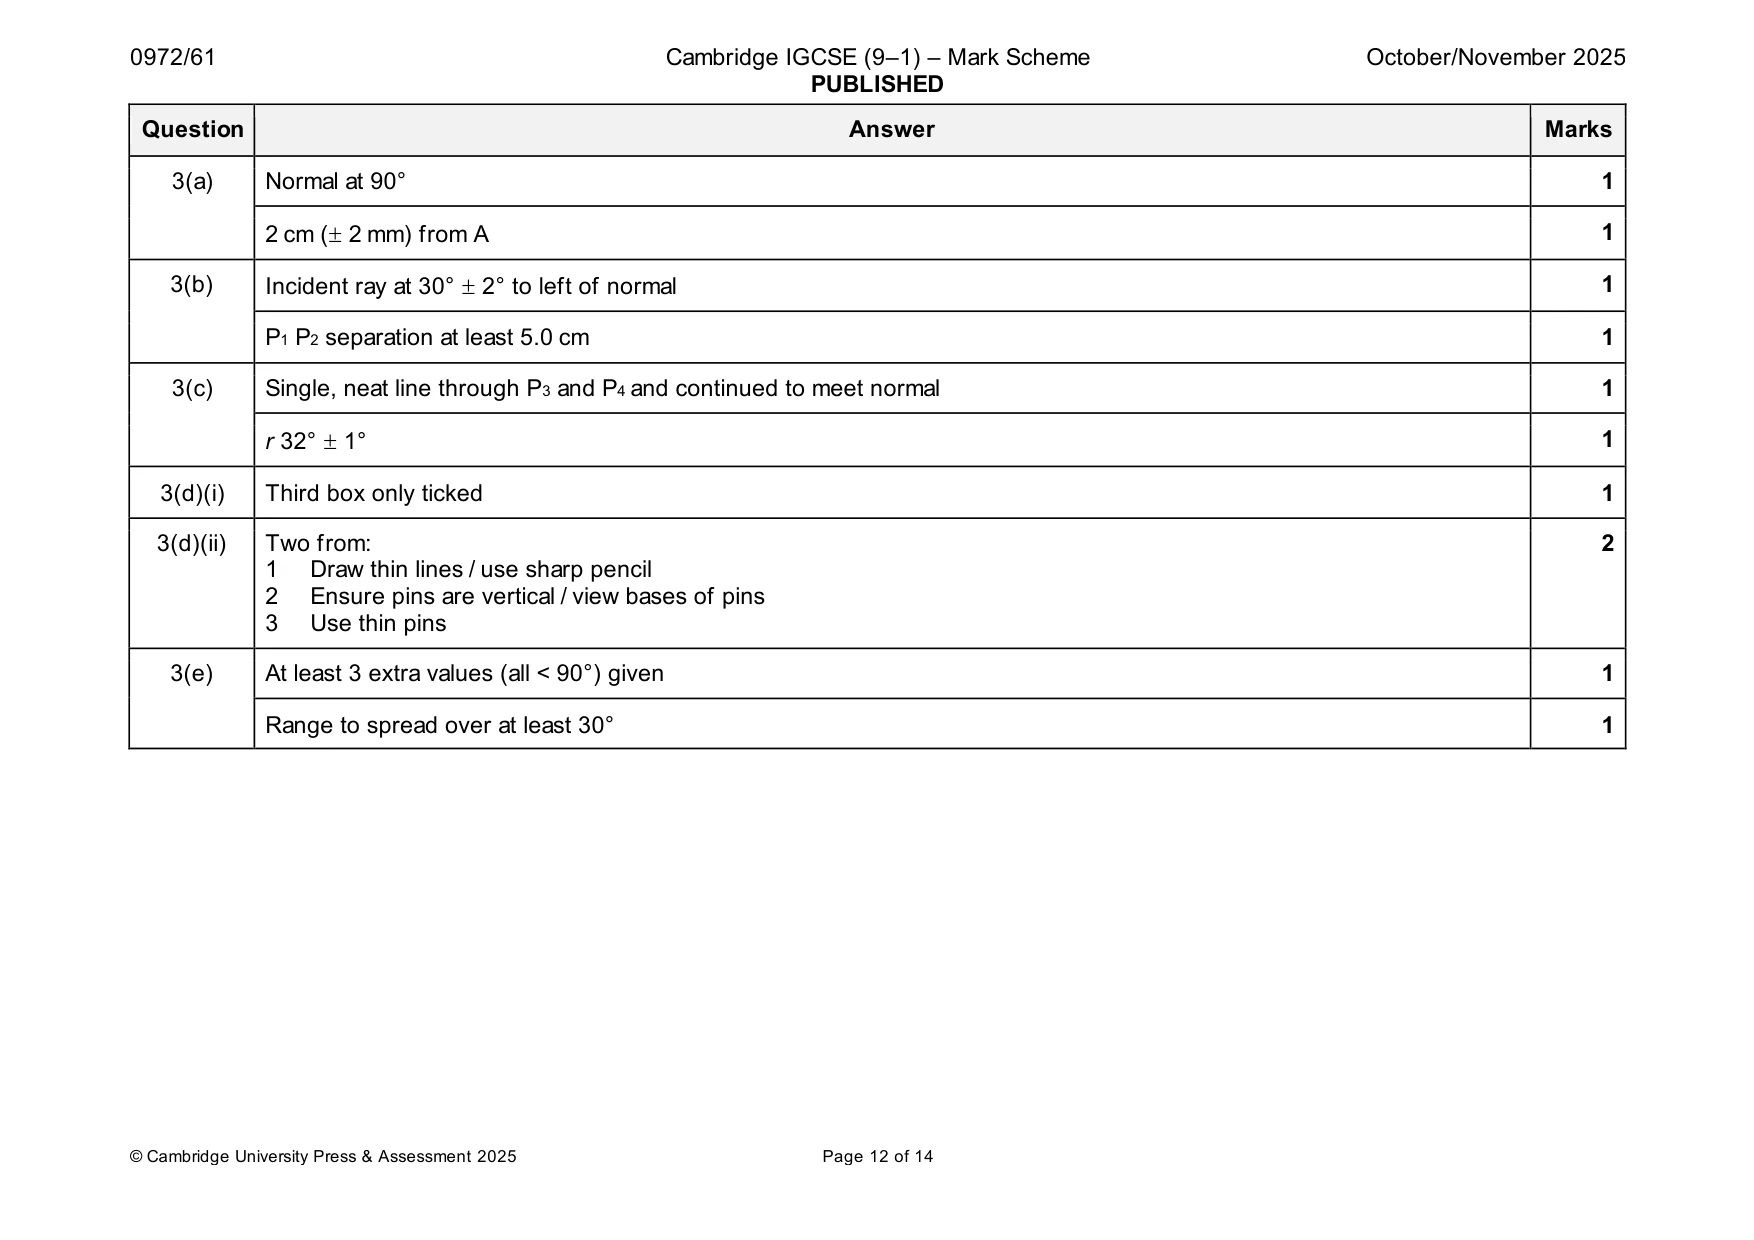
Mark scheme: 3(a) Normal at 90° 1 2 cm ( 2 mm) from A 1 3(b) Incident ray at 30° 2° to left of normal 1 P1 P2 separation at least 5.0 cm 1 3(c) Single, neat line through P3 and P4 and continued to meet normal 1 r 32° 1° 1 3(d)(i) Third box only ticked 1 3(d)(ii) Two from: 2 1 Draw thin lines / use sharp pencil 2 Ensure pins are vertical / view bases of pins 3 Use thin pins 3(e) At least 3 extra values (all < 90°) given 1 Range to spread over at least 30° 1
Q4 · A student is investigating electrical heaters that are used in the school laboratory to…
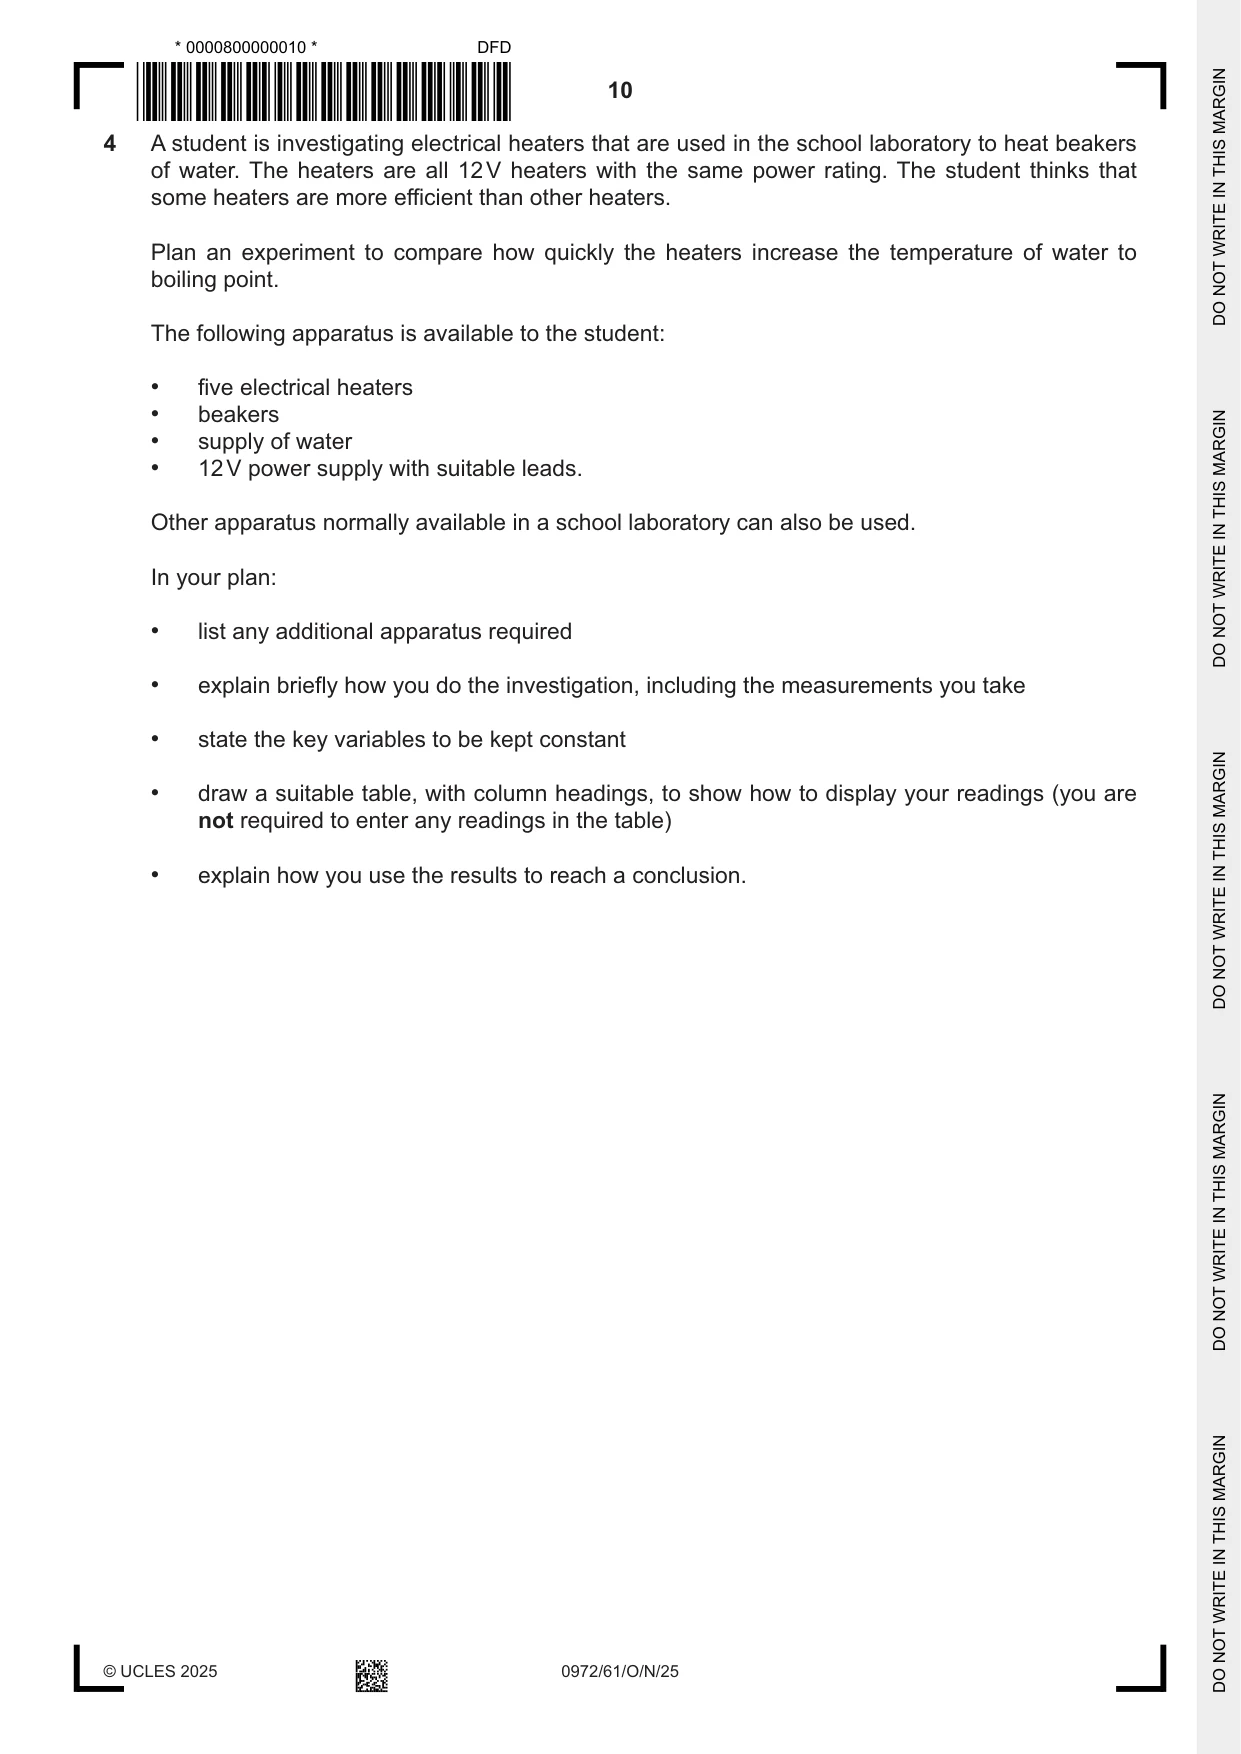
4 A student is investigating electrical heaters that are used in the school laboratory to heat beakers of water. The heaters are all 12 V heaters with the same power rating. The student thinks that some heaters are more efficient than other heaters. Plan an experiment to compare how quickly the heaters increase the temperature of water to boiling point. The following apparatus is available to the student: • five electrical heaters • beakers • supply of water • 12 V power supply with suitable leads. Other apparatus normally available in a school laboratory can also be used. In your plan: • list any additional apparatus required • explain briefly how you do the investigation, including the measurements you take • state the key variables to be kept constant • draw a suitable table, with column headings, to show how to display your readings (you are not required to enter any readings in the table) • explain how you use the results to reach a conclusion. .......................................................................................................................................................... .......................................................................................................................................................... .......................................................................................................................................................... .......................................................................................................................................................... .......................................................................................................................................................... .......................................................................................................................................................... .......................................................................................................................................................... .......................................................................................................................................................... .......................................................................................................................................................... .......................................................................................................................................................... .......................................................................................................................................................... .......................................................................................................................................................... .......................................................................................................................................................... .......................................................................................................................................................... .......................................................................................................................................................... .......................................................................................................................................................... .......................................................................................................................................................... .......................................................................................................................................................... .......................................................................................................................................................... .......................................................................................................................................................... .......................................................................................................................................................... .......................................................................................................................................................... .......................................................................................................................................................... .......................................................................................................................................................... .......................................................................................................................................................... .......................................................................................................................................................... .......................................................................................................................................................... .................................................................................................................................................... [7]
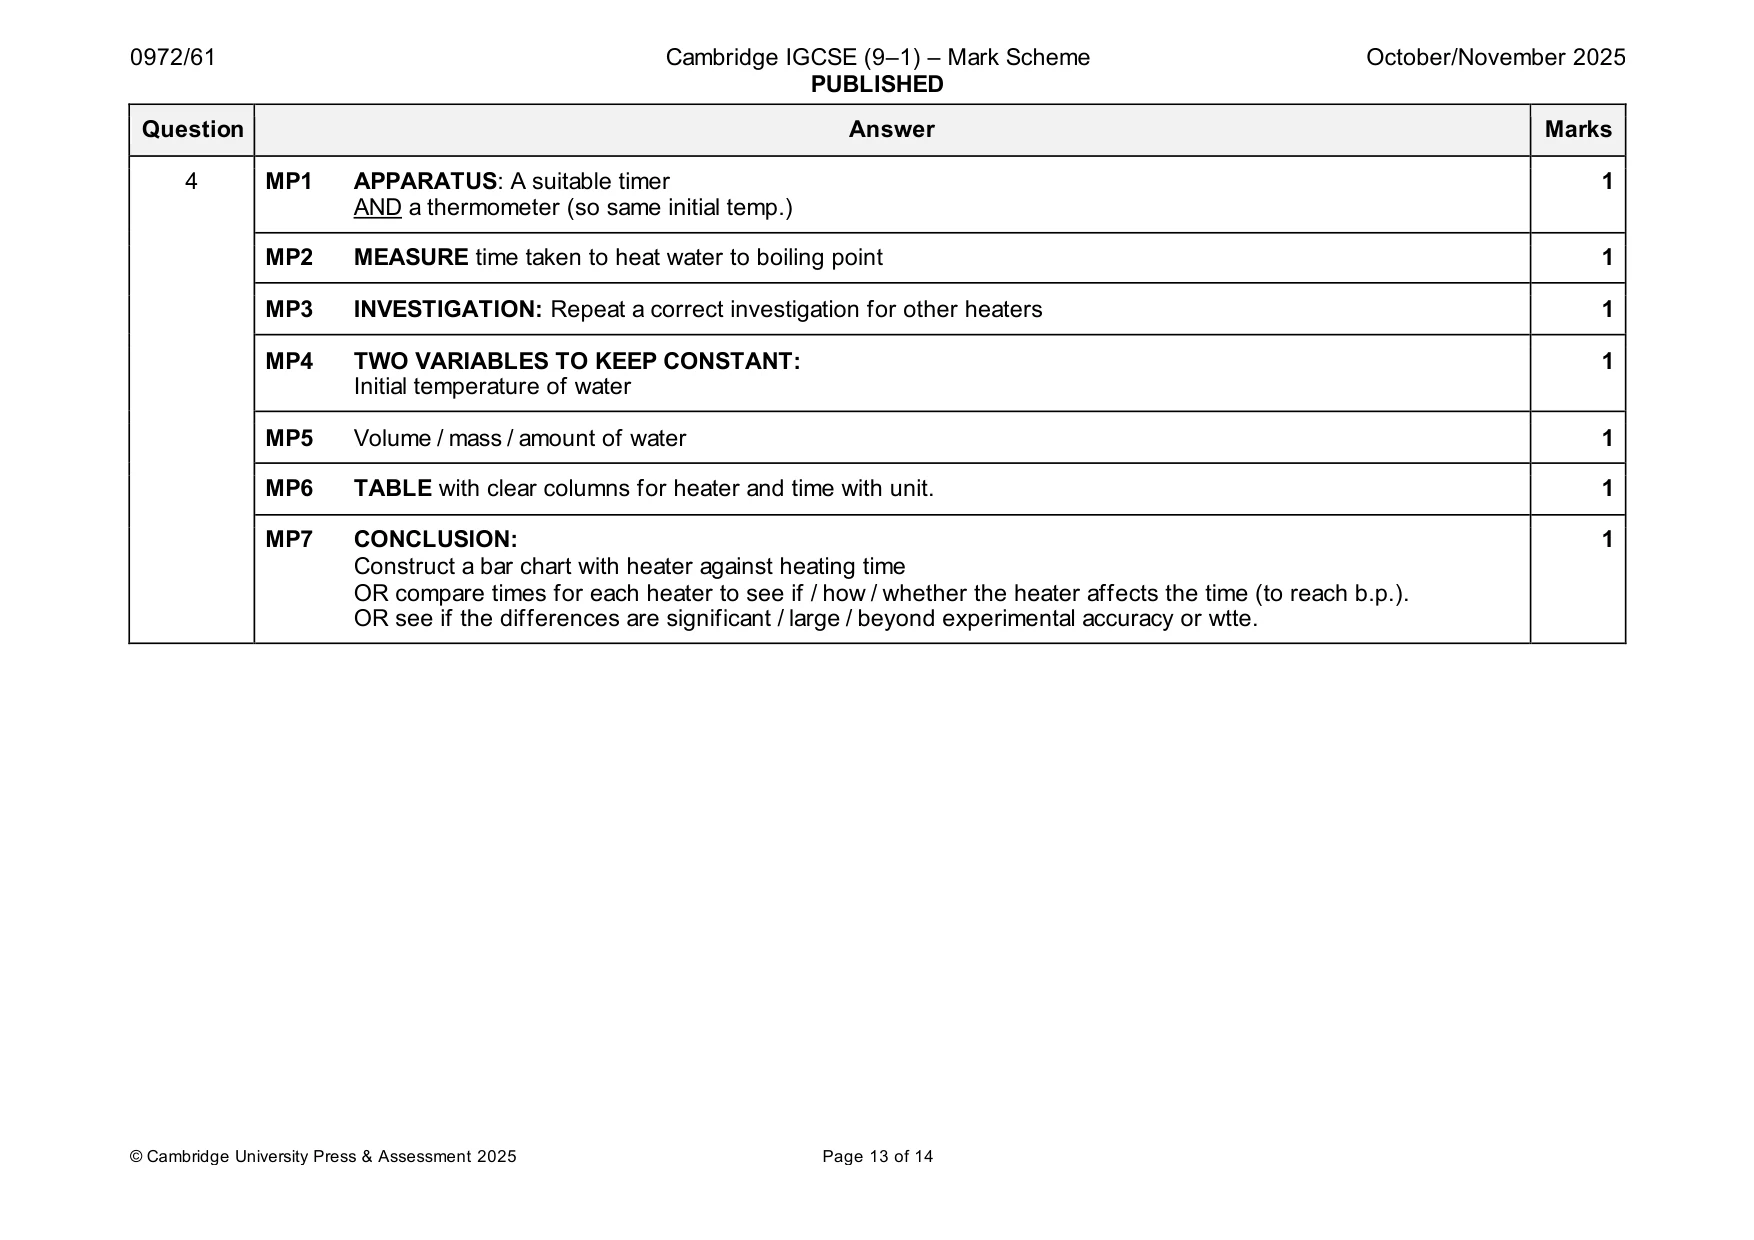
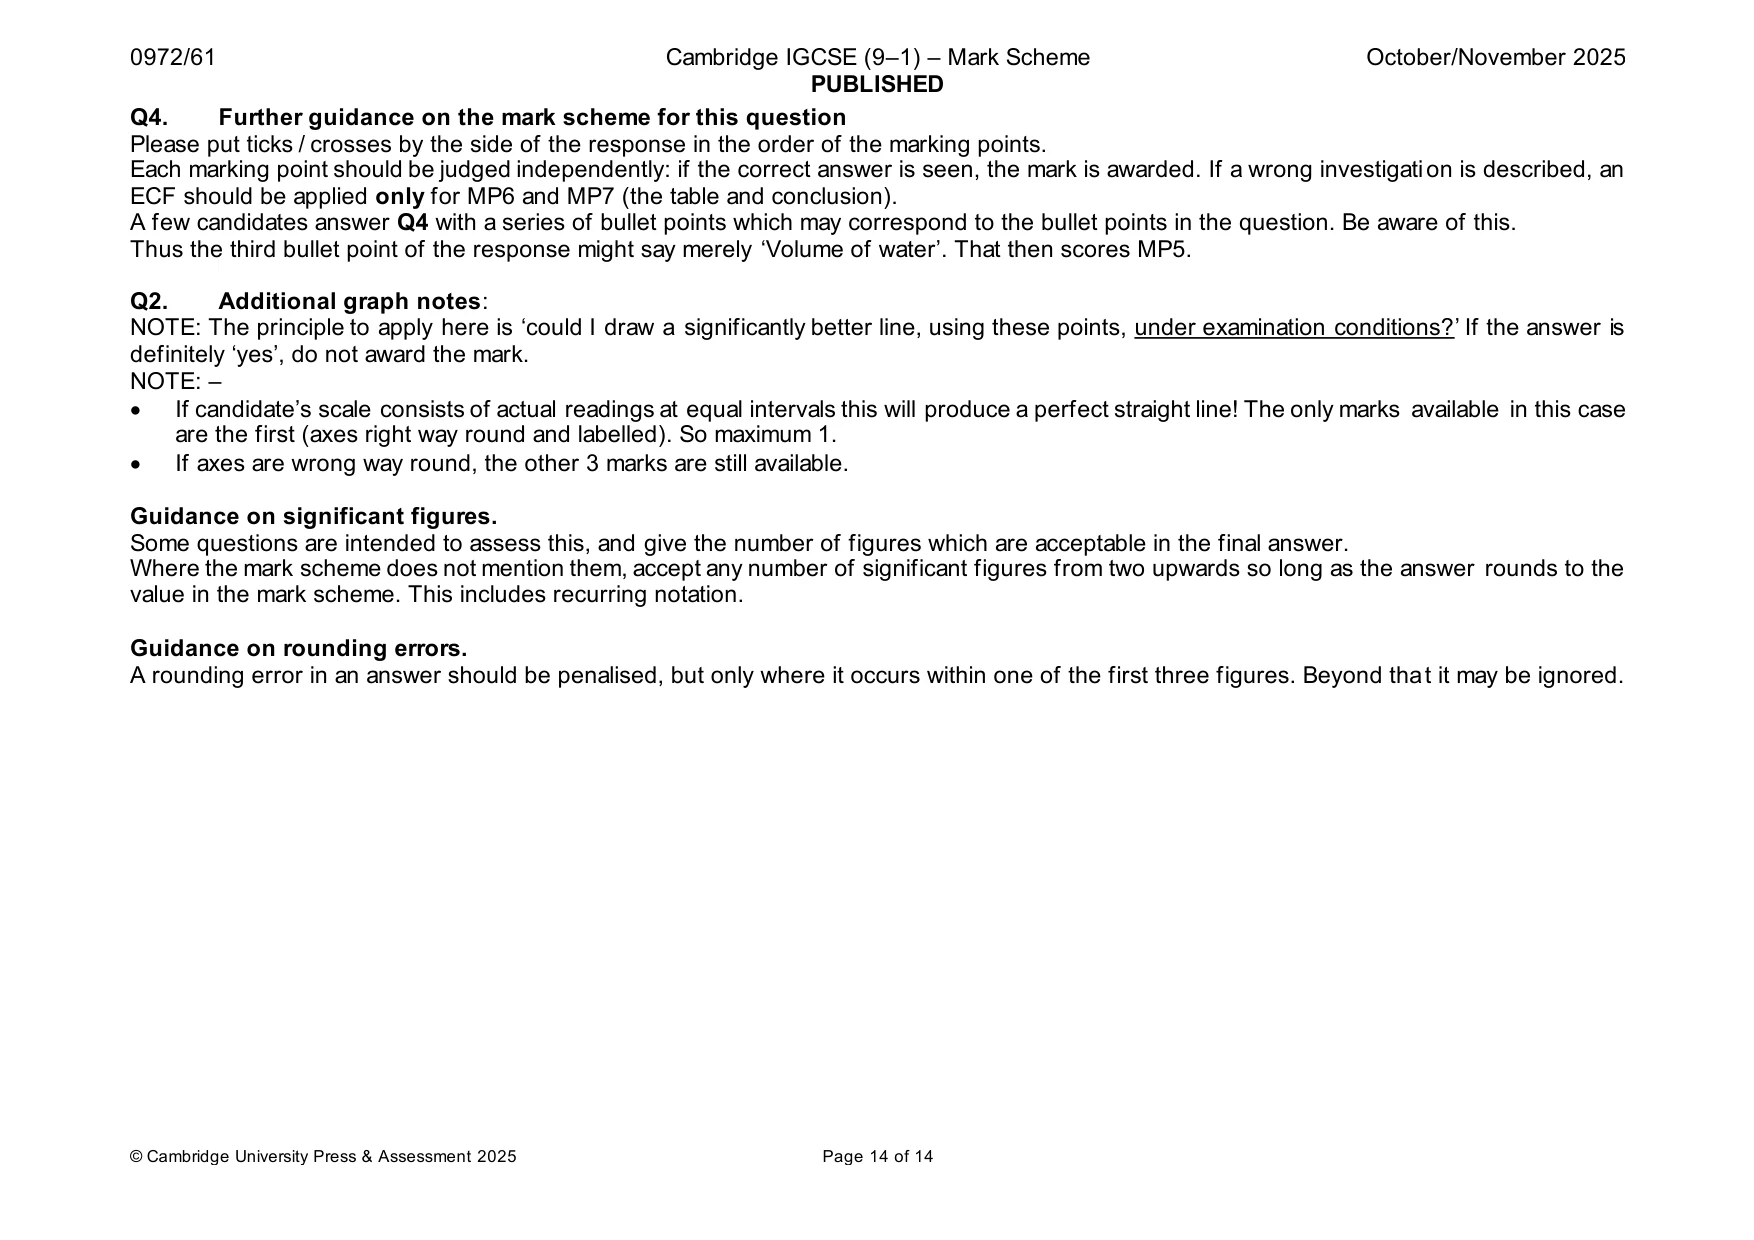
Mark scheme: 4 MP1 APPARATUS: A suitable timer 1 AND a thermometer (so same initial temp.) MP2 MEASURE time taken to heat water to boiling point 1 MP3 INVESTIGATION: Repeat a correct investigation for other heaters 1 MP4 TWO VARIABLES TO KEEP CONSTANT: 1 Initial temperature of water MP5 Volume / mass / amount of water 1 MP6 TABLE with clear columns for heater and time with unit. 1 MP7 CONCLUSION: 1 Construct a bar chart with heater against heating time OR compare times for each heater to see if / how / whether the heater affects the time (to reach b.p.). OR see if the differences are significant / large / beyond experimental accuracy or wtte. Please put ticks / crosses by the side of the response in the order of the marking points. Each marking point should be judged independently: if the correct answer is seen, the mark is awarded. If a wrong investigation is described, an ECF should be applied only for MP6 and MP7 (the table and conclusion). A few candidates answer Q4 with a series of bullet points which may correspond to the bullet points in the question. Be aware of this. Thus the third bullet point of the response might say merely ‘Volume of water’. That then scores MP5. Q2. Additional graph notes: NOTE: The principle to apply here is ‘could I draw a significantly better line, using these points, under examination conditions?’ If the answer is definitely ‘yes’, do not award the mark. NOTE: – • If candidate’s scale consists of actual readings at equal intervals this will produce a perfect straight line! The only marks available in this case are the first (axes right way round and labelled). So maximum 1. • If axes are wrong way round, the other 3 marks are still available. Guidance on significant figures. Some questions are intended to assess this, and give the number of figures which are acceptable in the final answer. Where the mark scheme does not mention them, accept any number of significant figures from two upwards so long as the answer rounds to the value in the mark scheme. This includes recurring notation. Guidance on rounding errors. A rounding error in an answer should be penalised, but only where it occurs within one of the first three figures. Beyond that it may be ignored.
What was in this paper
The subtopics covered by these 4 questions, and how many questions each got. Open one in a new tab to see every Cambridge question on it.
What you needed in this session
Cambridge’s own grade thresholds for 2025 Oct/Nov, Paper 6 · Variant 1. A higher threshold means an easier paper — the bar moves with how the cohort did.