Cambridge IGCSE Physics (9-1) 0972 — 2020 May/June Paper 5 · Variant 1
0972/51/M/J/20 · 4 questions · 40 marks · ≈45 min
The question paper and its mark scheme, free to read here and free to download. This is Cambridge’s own paper, exactly as it was sat.
Question paper12 pages
Mark scheme7 pages
Answers below. Sit the paper first if you are practising.
Questions as text
Q1 · In this experiment, you will investigate the balancing of a metre rule
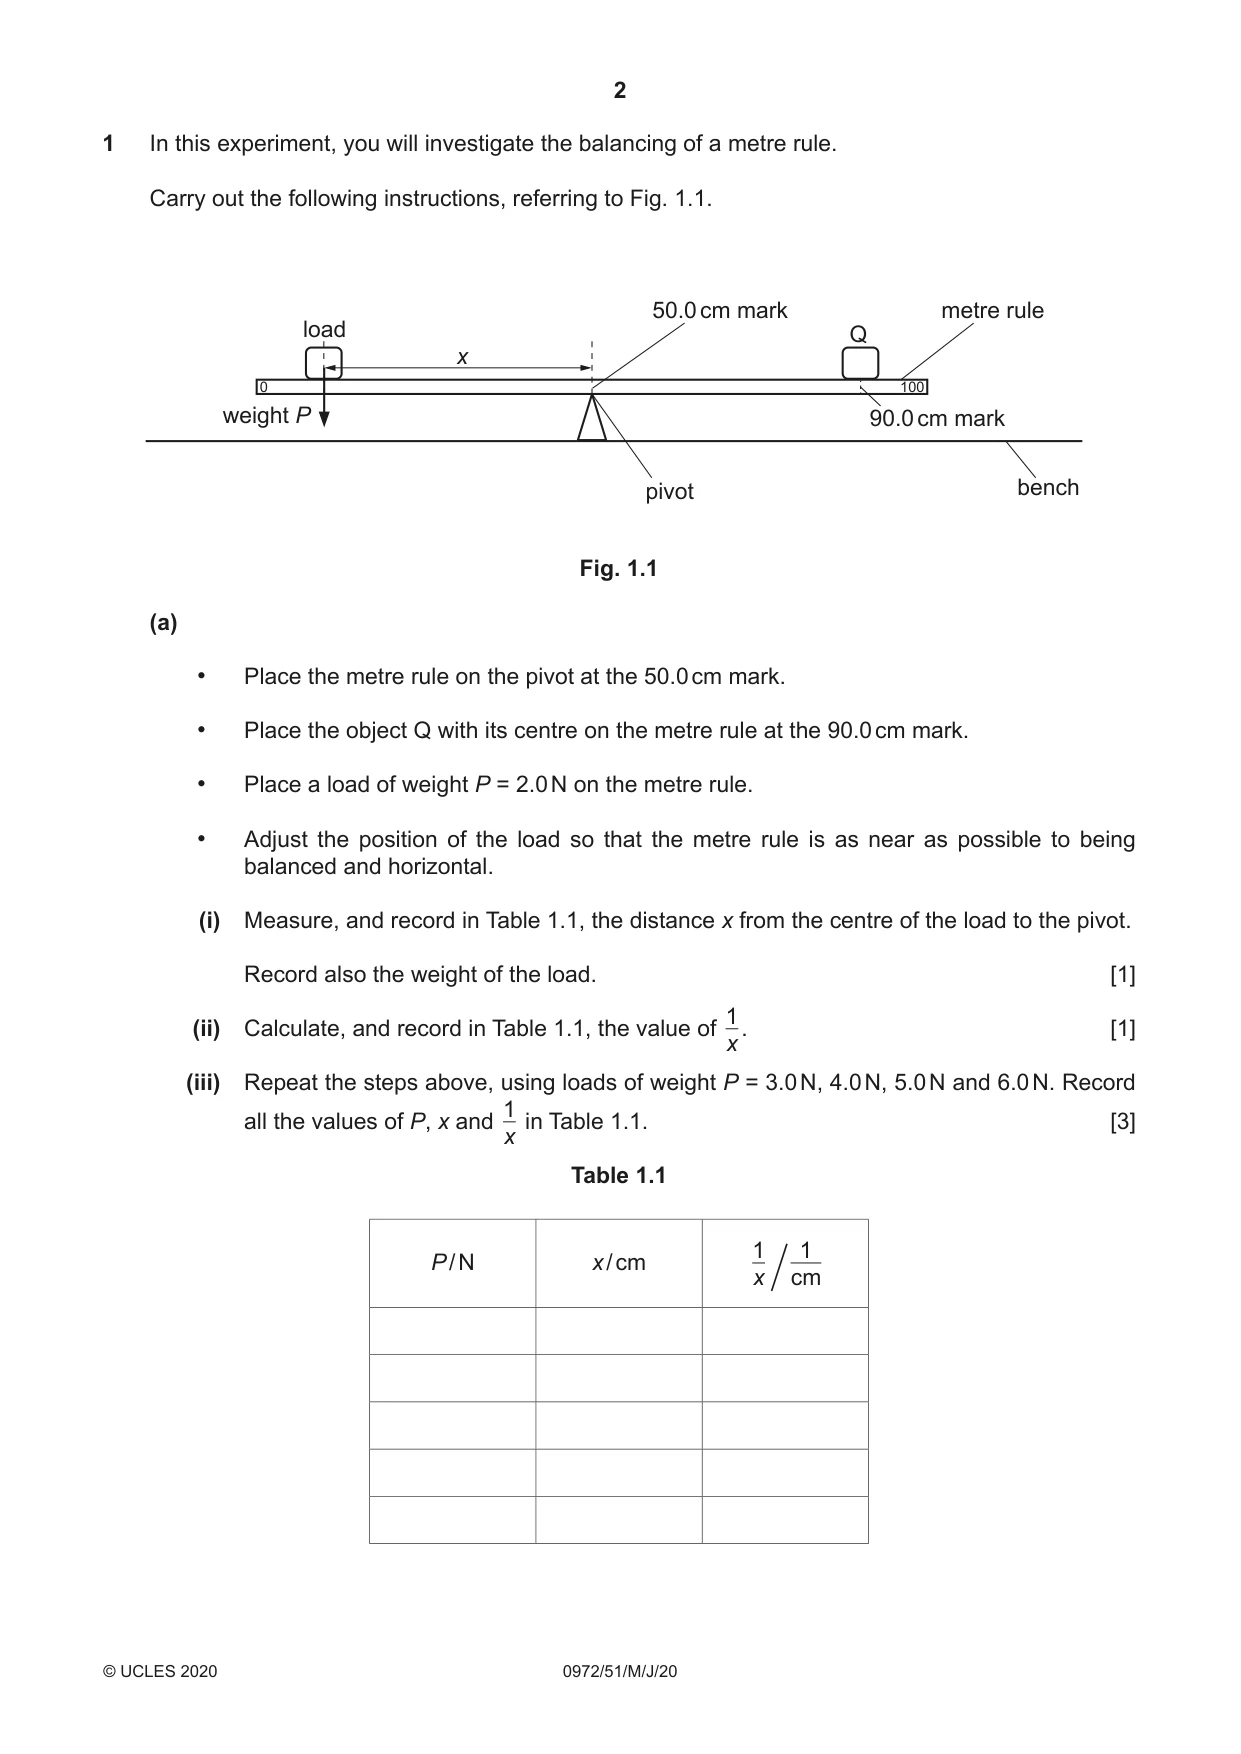
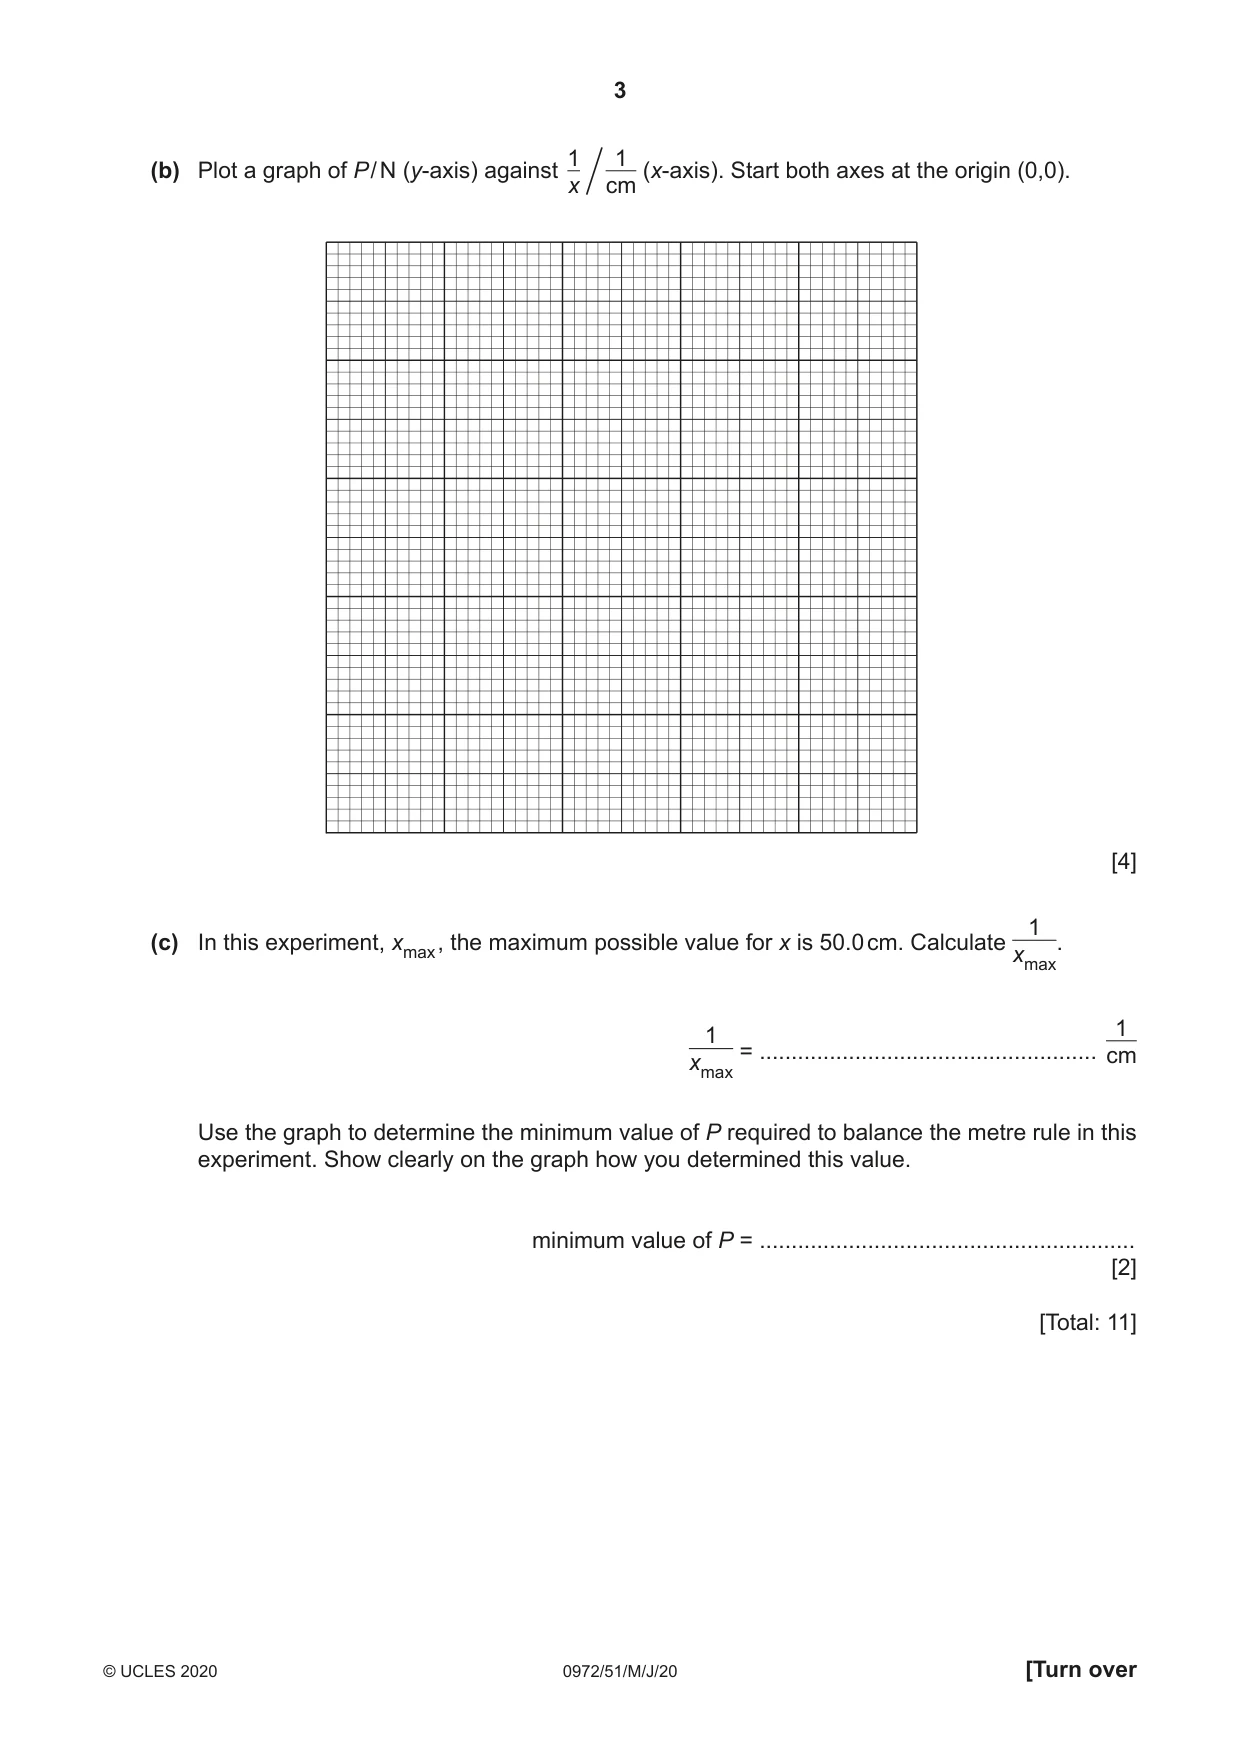
1 In this experiment, you will investigate the balancing of a metre rule. Carry out the following instructions, referring to Fig. 1.1. 50.0 cm mark metre rule load Q x 0 100 weight P 90.0 cm mark pivot bench Fig. 1.1 (a) • Place the metre rule on the pivot at the 50.0 cm mark. • Place the object Q with its centre on the metre rule at the 90.0 cm mark. • Place a load of weight P = 2.0 N on the metre rule. • Adjust the position of the load so that the metre rule is as near as possible to being balanced and horizontal. (i) Measure, and record in Table 1.1, the distance x from the centre of the load to the pivot. Record also the weight of the load. [1] 1 (ii) Calculate, and record in Table 1.1, the value of . [1] x (iii) Repeat the steps above, using loads of weight P = 3.0 N, 4.0 N, 5.0 N and 6.0 N. Record 1 all the values of P, x and in Table 1.1. [3] x Table 1.1 1 1 P / N x / cm x cm 1 1(b) Plot a graph of P / N (y-axis) against (x-axis). Start both axes at the origin (0,0). x cm [4] 1 (c) In this experiment, xmax , the maximum possible value for x is 50.0 cm. Calculate . xmax 1 1 = ..................................................... cm xmax Use the graph to determine the minimum value of P required to balance the metre rule in this experiment. Show clearly on the graph how you determined this value. minimum value of P = ........................................................... [2] [Total: 11]
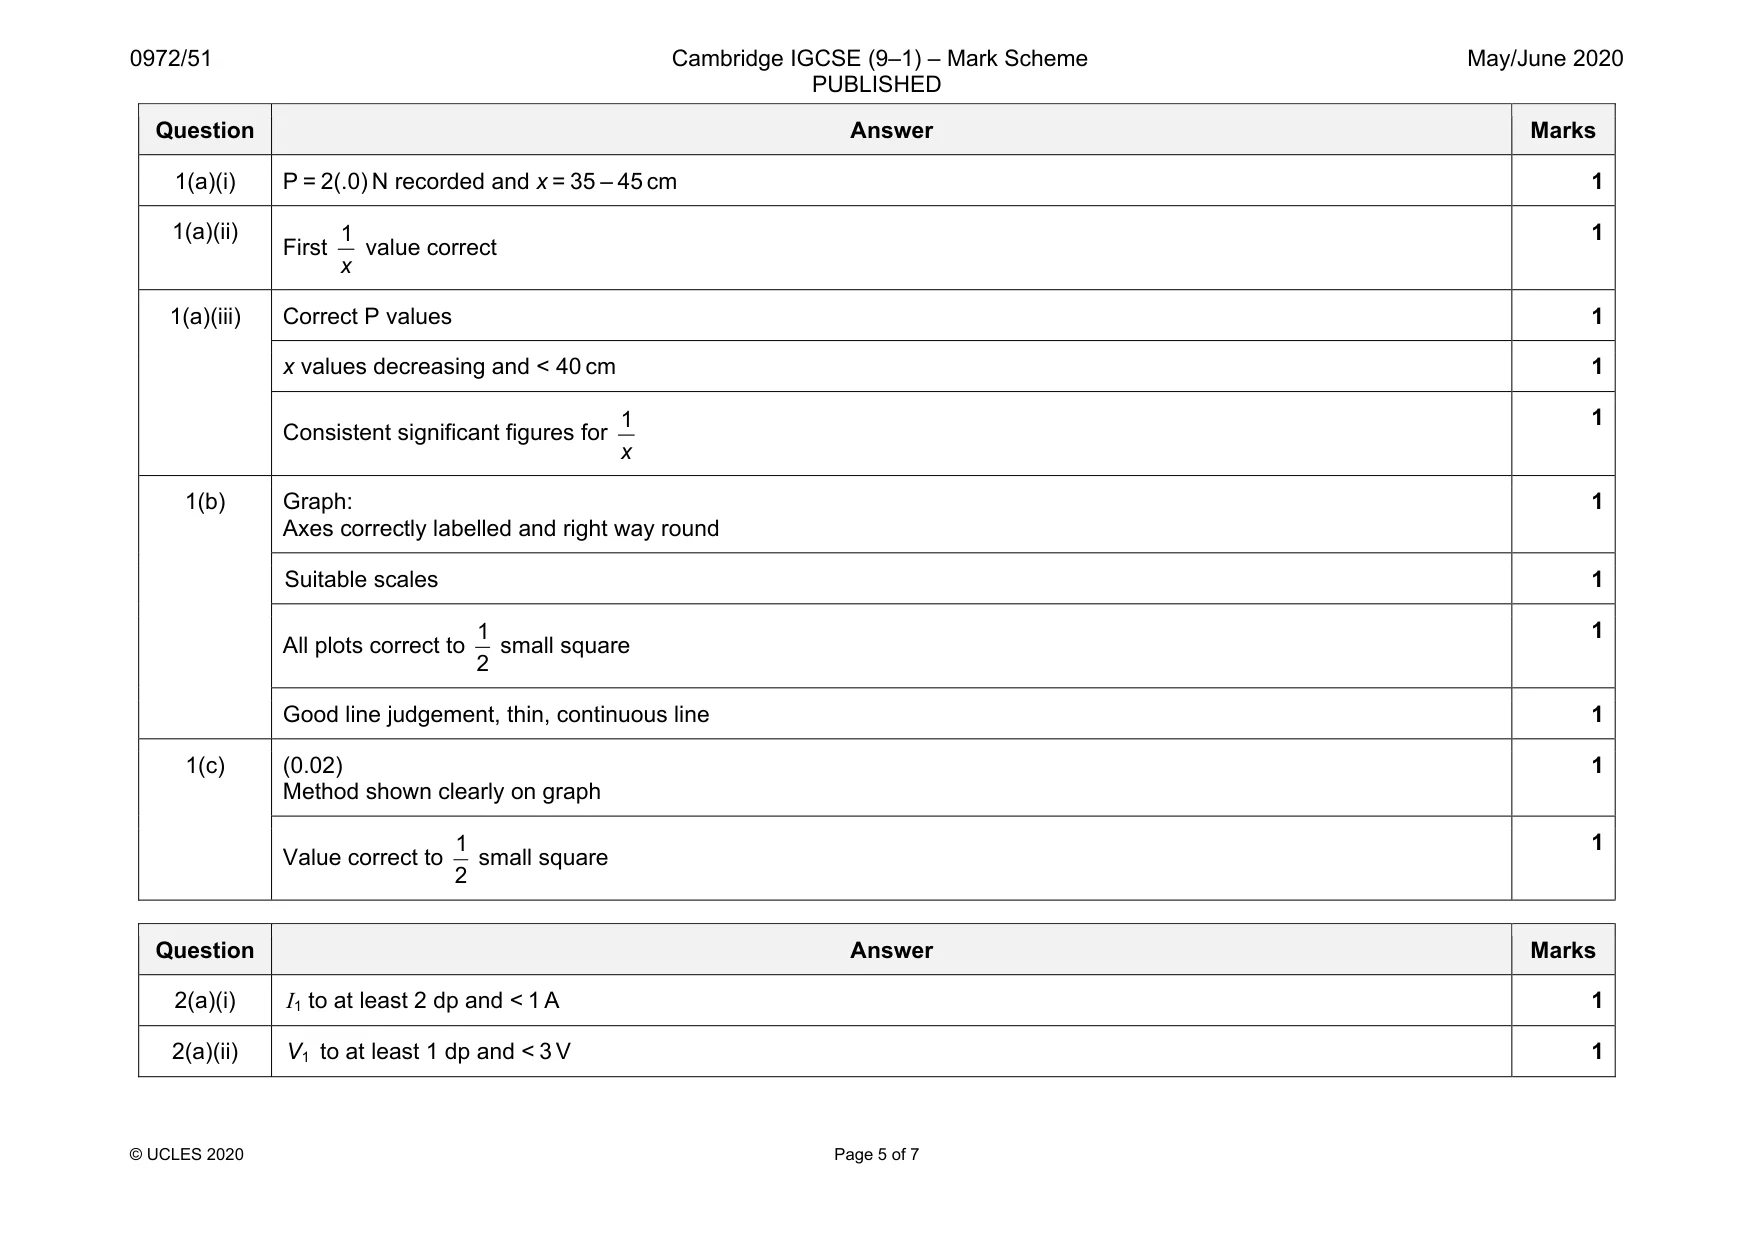
Mark scheme: 1(a)(i) P = 2(.0) N recorded and x = 35 – 45 cm 1 1(a)(ii) First 1 x value correct 1 1(a)(iii) Correct P values 1 x values decreasing and < 40 cm 1 Consistent significant figures for 1 x 1 1(b) Graph: Axes correctly labelled and right way round 1 Suitable scales 1 All plots correct to 1 2 small square 1 Good line judgement, thin, continuous line 1 1(c) (0.02) Method shown clearly on graph 1 Value correct to 1 2 small square 1
Q2 · In this experiment, you will determine the resistances of filament lamps
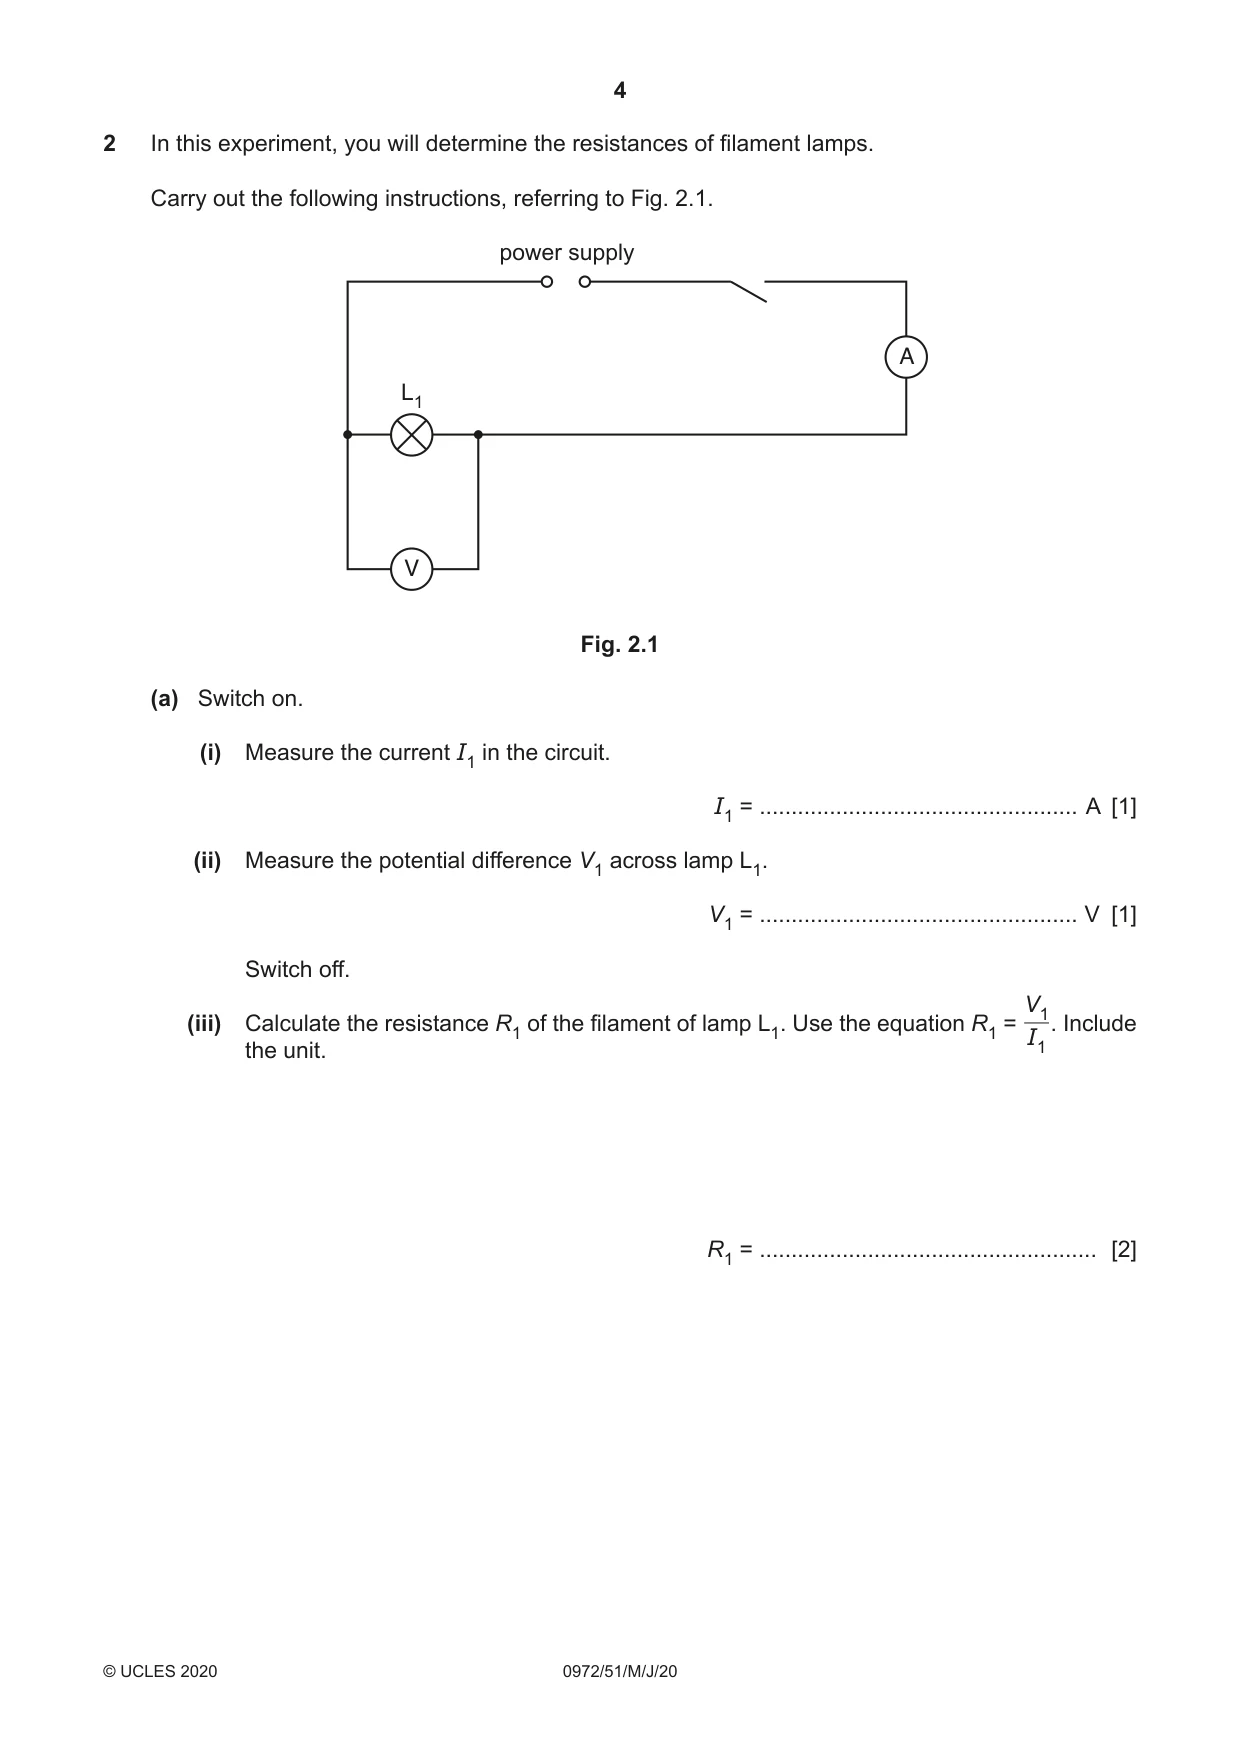
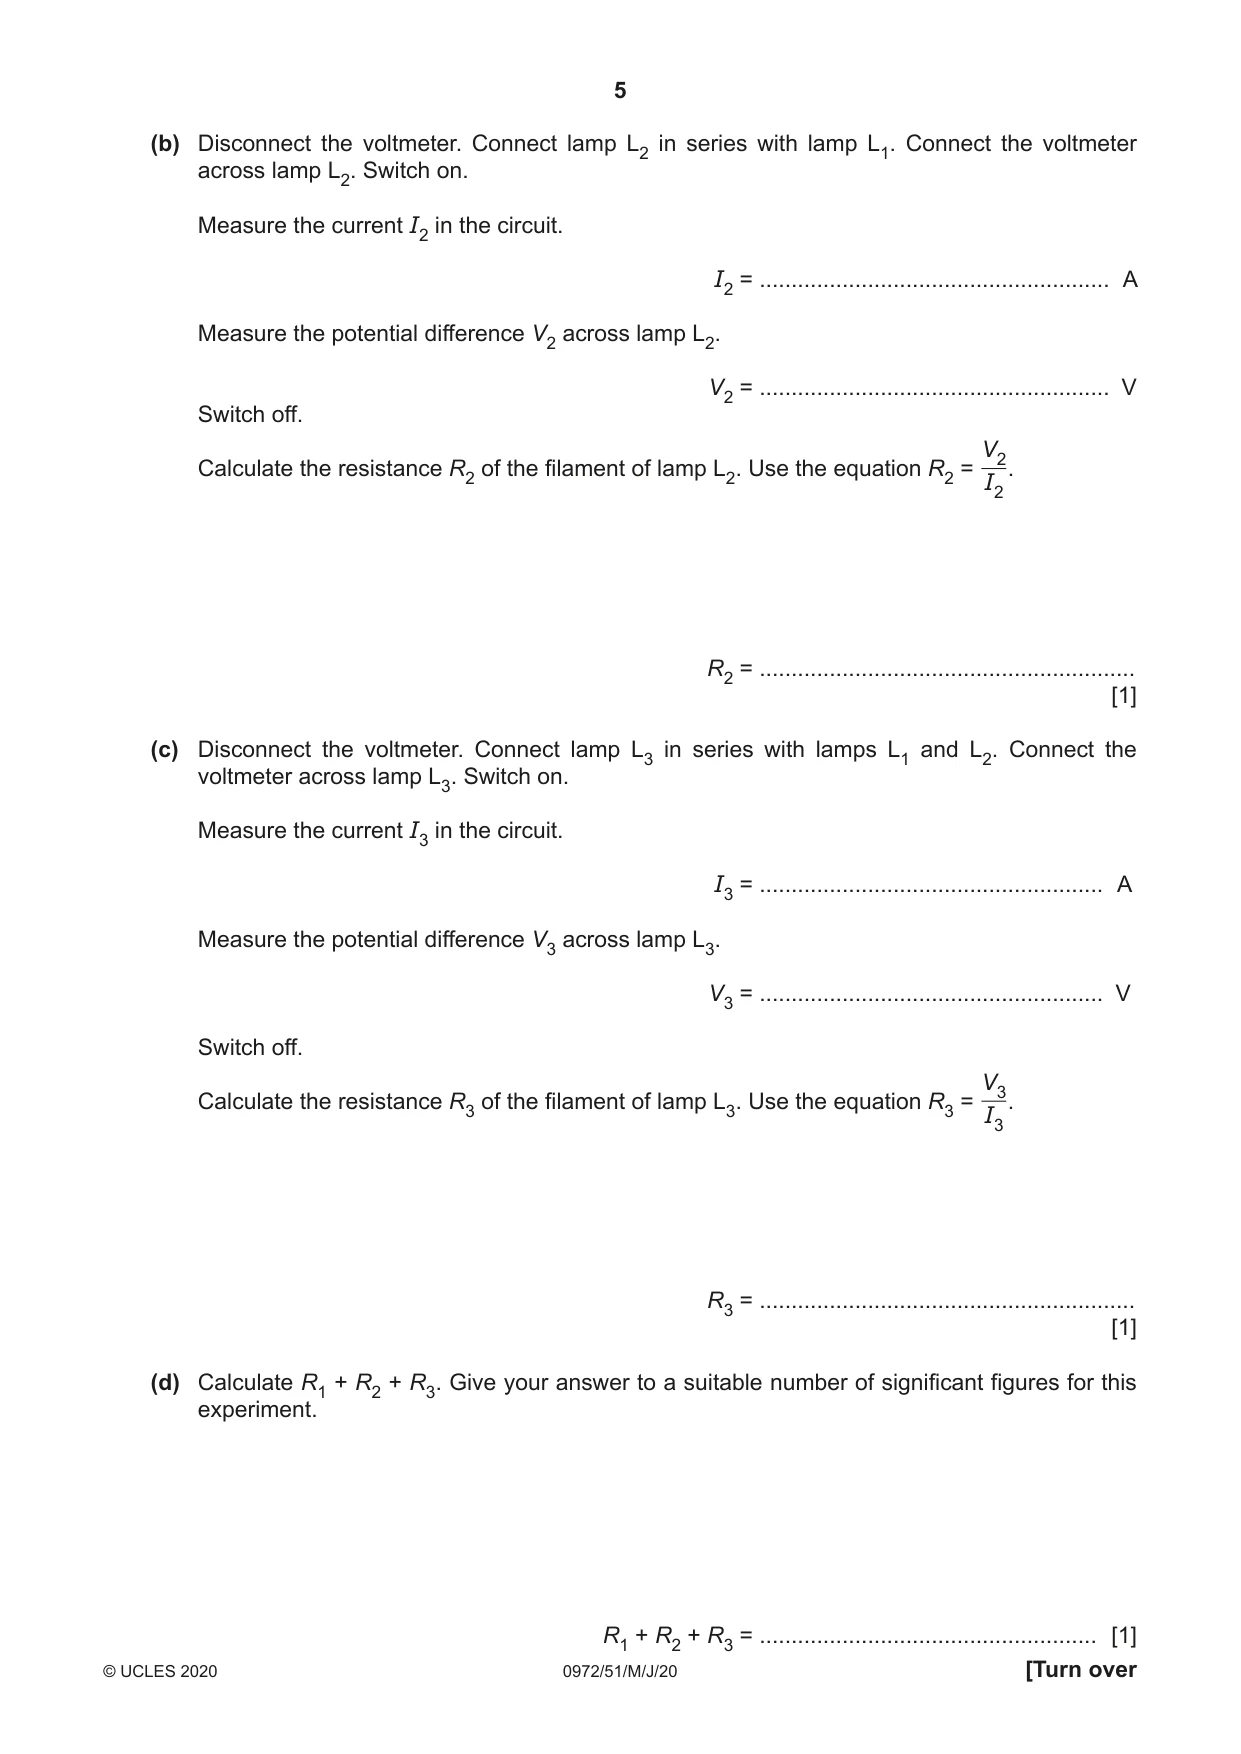
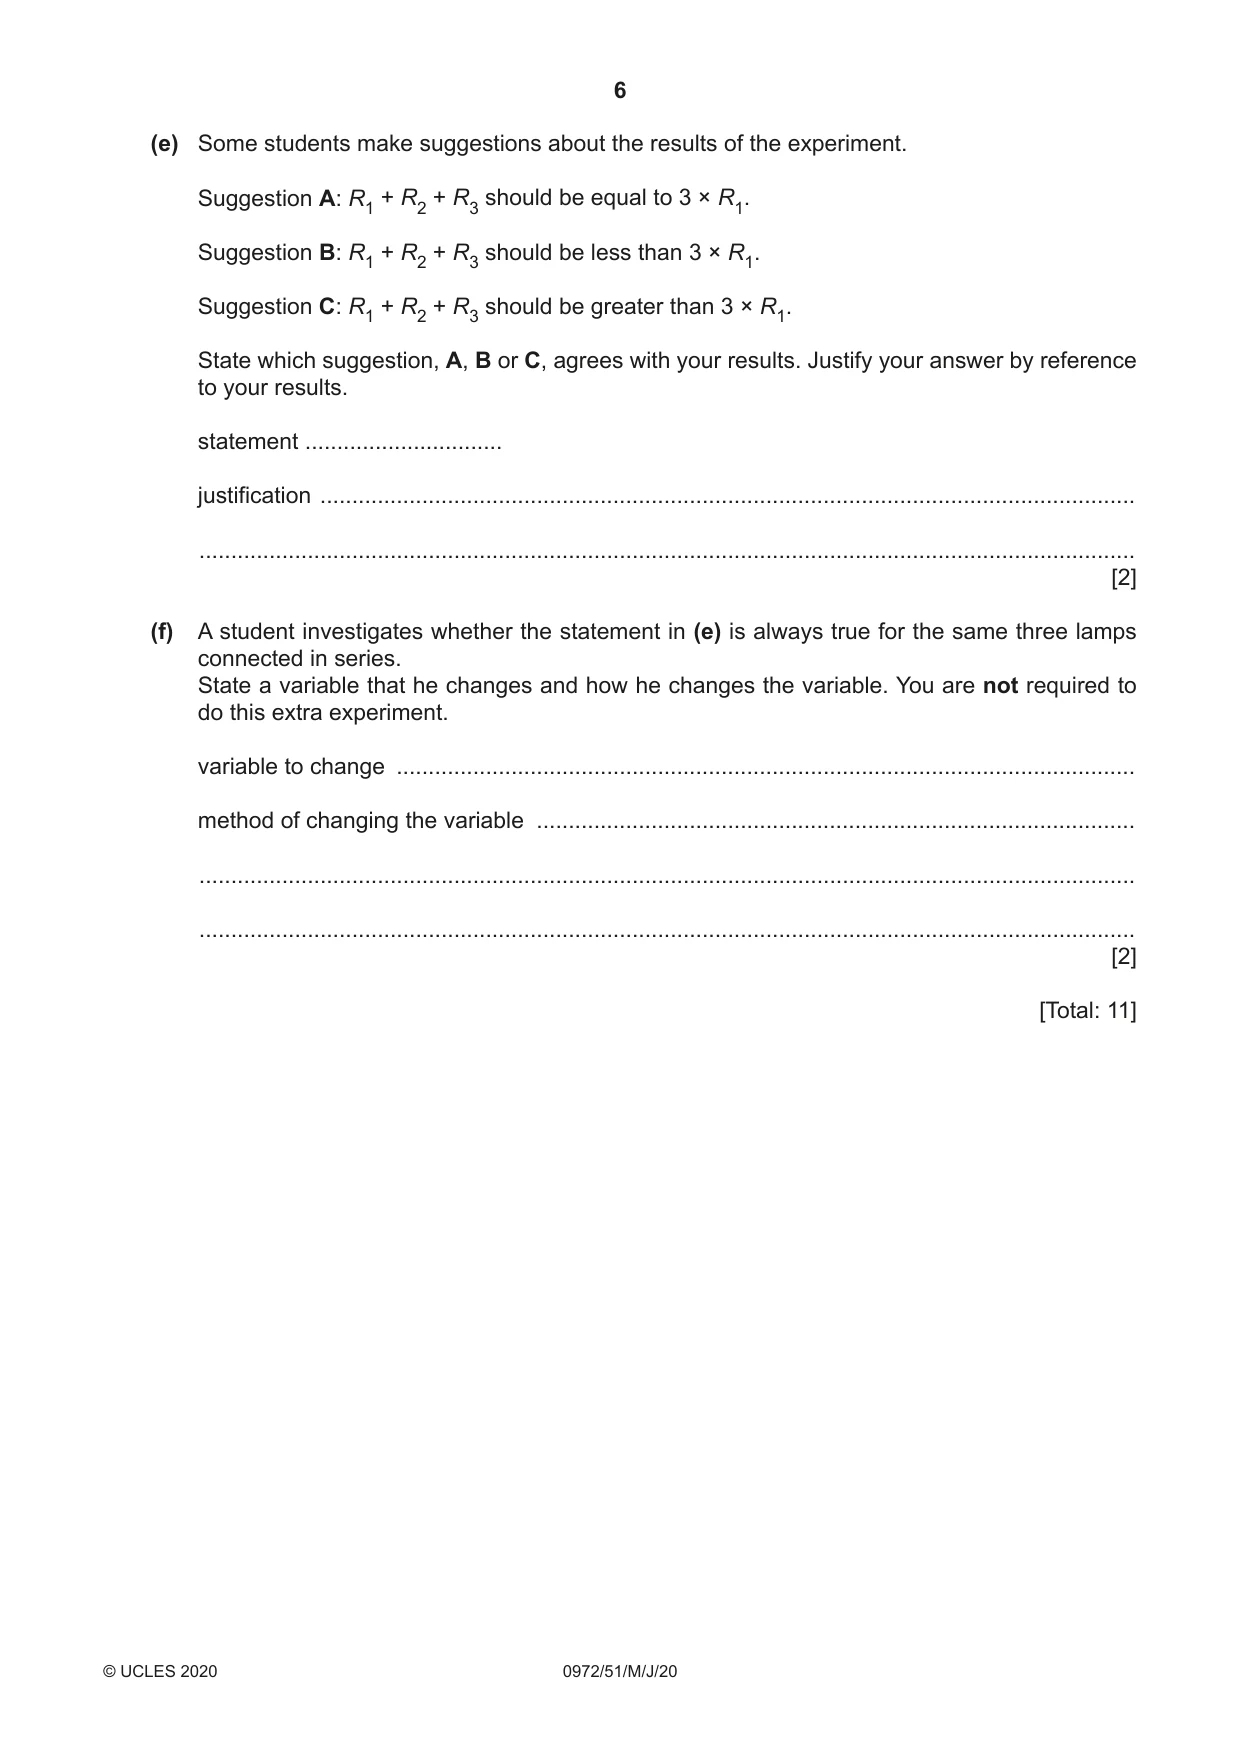
2 In this experiment, you will determine the resistances of filament lamps. Carry out the following instructions, referring to Fig. 2.1. power supply A L1 V Fig. 2.1 (a) Switch on. (i) Measure the current I1 in the circuit. I1 = .................................................. A [1] (ii) Measure the potential difference V1 across lamp L1. V1 = .................................................. V [1] Switch off. V1 (iii) Calculate the resistance R1 of the filament of lamp L1. Use the equation R1 = . Include I1 the unit. R1 = ..................................................... [2] (b) Disconnect the voltmeter. Connect lamp L2 in series with lamp L1. Connect the voltmeter across lamp L2. Switch on. Measure the current I2 in the circuit. I2 = ....................................................... A Measure the potential difference V2 across lamp L2. V2 = ....................................................... V Switch off. V2 Calculate the resistance R2 of the filament of lamp L2. Use the equation R2 = . I2 R2 = ........................................................... [1] (c) Disconnect the voltmeter. Connect lamp L3 in series with lamps L1 and L2. Connect the voltmeter across lamp L3. Switch on. Measure the current I3 in the circuit. I3 = ...................................................... A Measure the potential difference V3 across lamp L3. V3 = ...................................................... V Switch off. V3 Calculate the resistance R3 of the filament of lamp L3. Use the equation R3 = . I3 R3 = ........................................................... [1] (d) Calculate R1 + R2 + R3. Give your answer to a suitable number of significant figures for this experiment. R1 + R2 + R3 = ..................................................... [1] (e) Some students make suggestions about the results of the experiment. Suggestion A: R1 + R2 + R3 should be equal to 3 × R1. Suggestion B: R1 + R2 + R3 should be less than 3 × R1. Suggestion C: R1 + R2 + R3 should be greater than 3 × R1. State which suggestion, A, B or C, agrees with your results. Justify your answer by reference to your results. statement ............................... justification ................................................................................................................................ ................................................................................................................................................... [2] (f) A student investigates whether the statement in (e) is always true for the same three lamps connected in series. State a variable that he changes and how he changes the variable. You are not required to do this extra experiment. variable to change .................................................................................................................... method of changing the variable .............................................................................................. ................................................................................................................................................... ................................................................................................................................................... [2] [Total: 11]
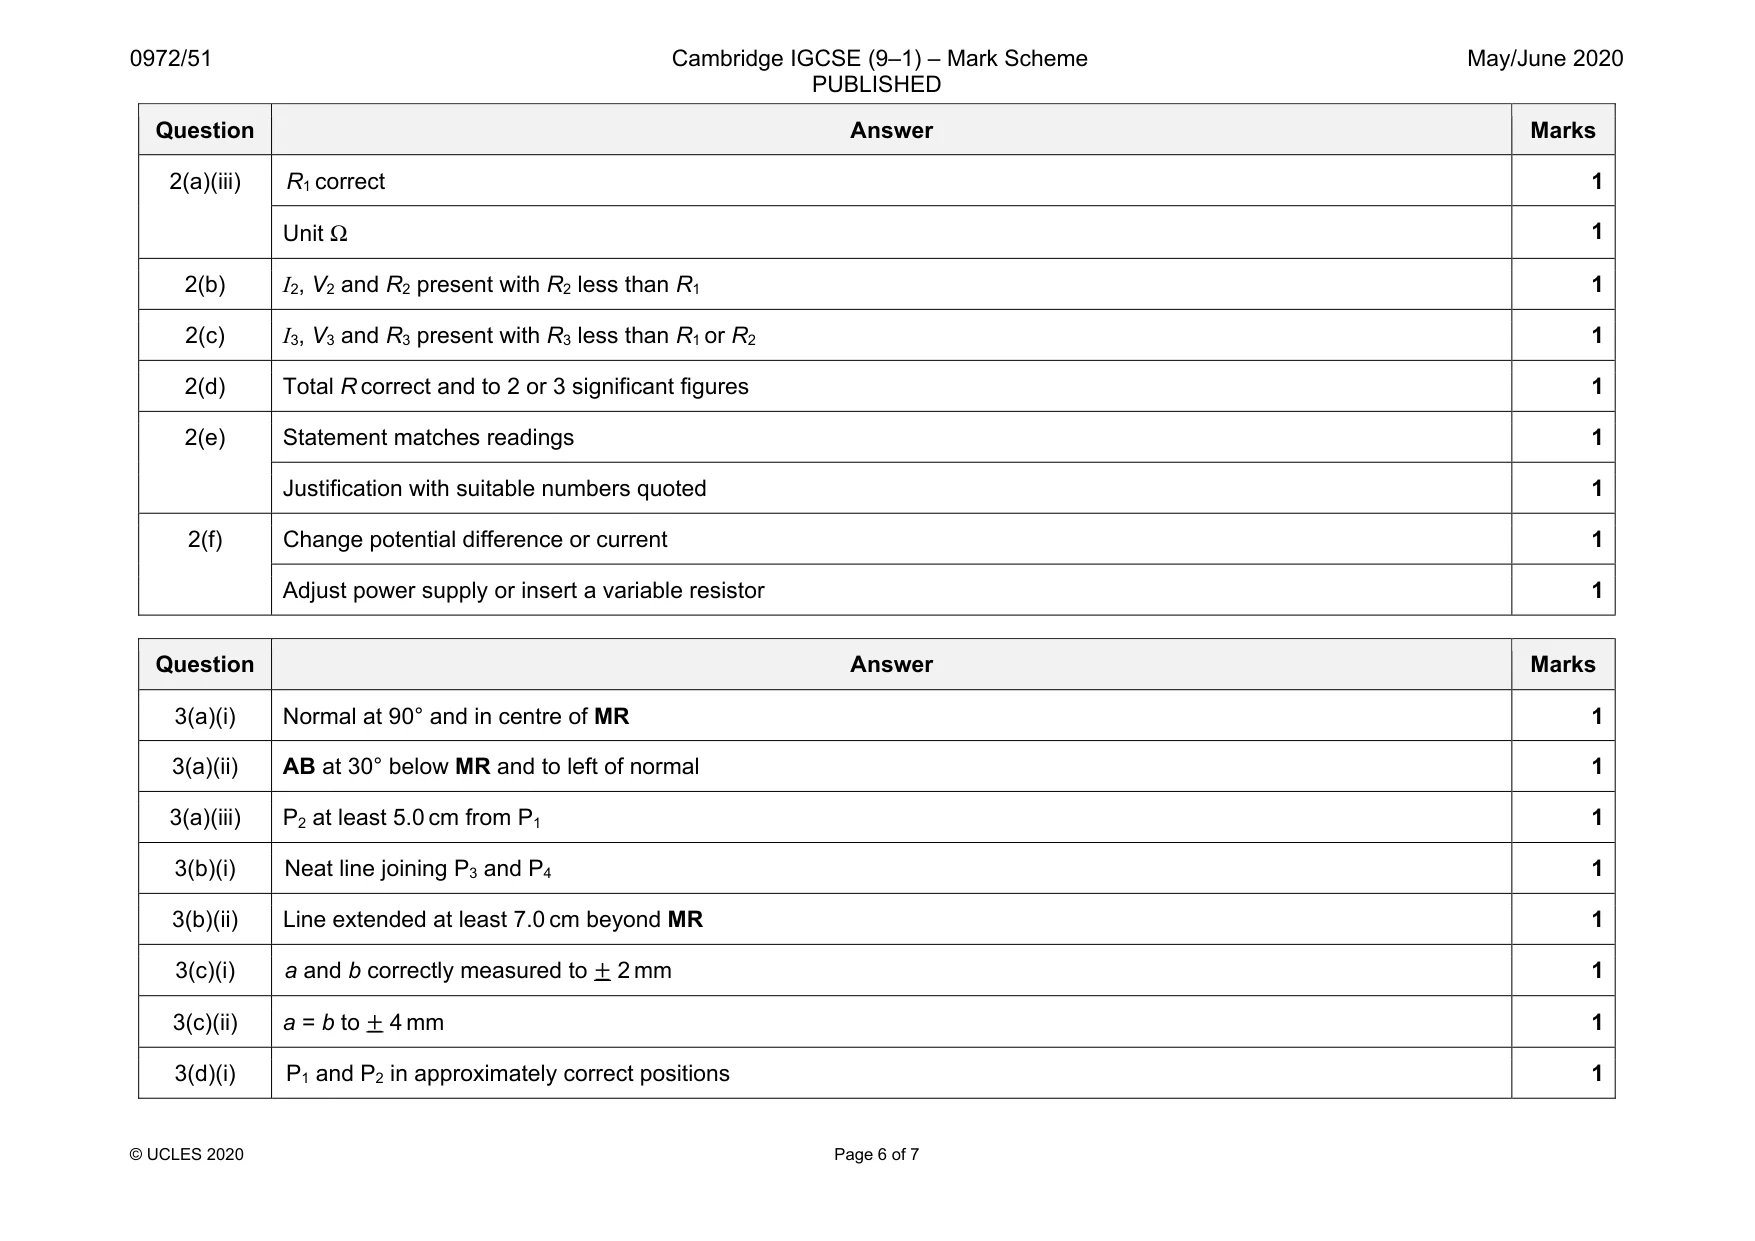
Mark scheme: 2(a)(i) I1 to at least 2 dp and < 1 A 1 2(a)(ii) V1 to at least 1 dp and < 3 V 1 Question Answer Marks 2(a)(iii) R1 correct 1 Unit Ω 1 2(b) I2, V2 and R2 present with R2 less than R1 1 2(c) I3, V3 and R3 present with R3 less than R1 or R2 1 2(d) Total R correct and to 2 or 3 significant figures 1 2(e) Statement matches readings 1 Justification with suitable numbers quoted 1 2(f) Change potential difference or current 1 Adjust power supply or insert a variable resistor 1
Q3 · In this experiment you will investigate the position of the image in a plane mirror
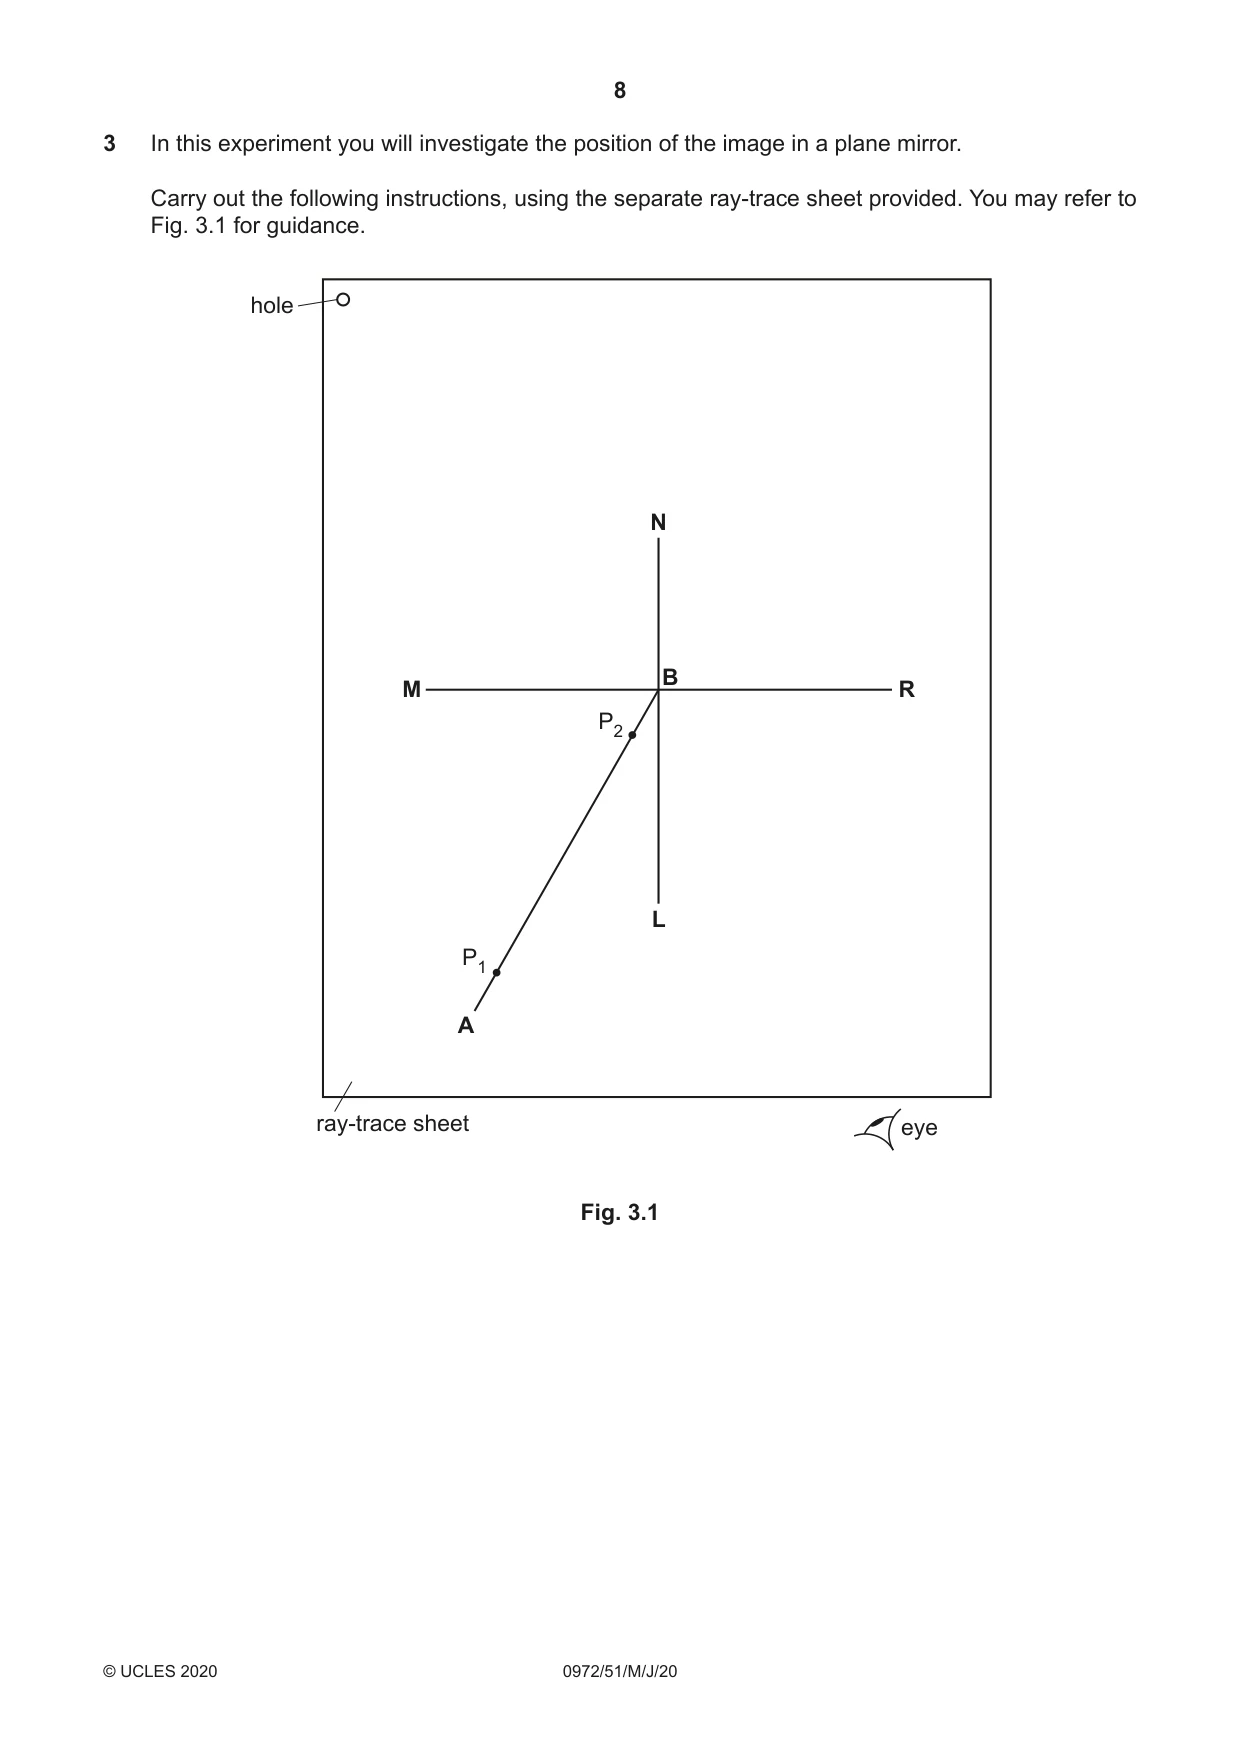
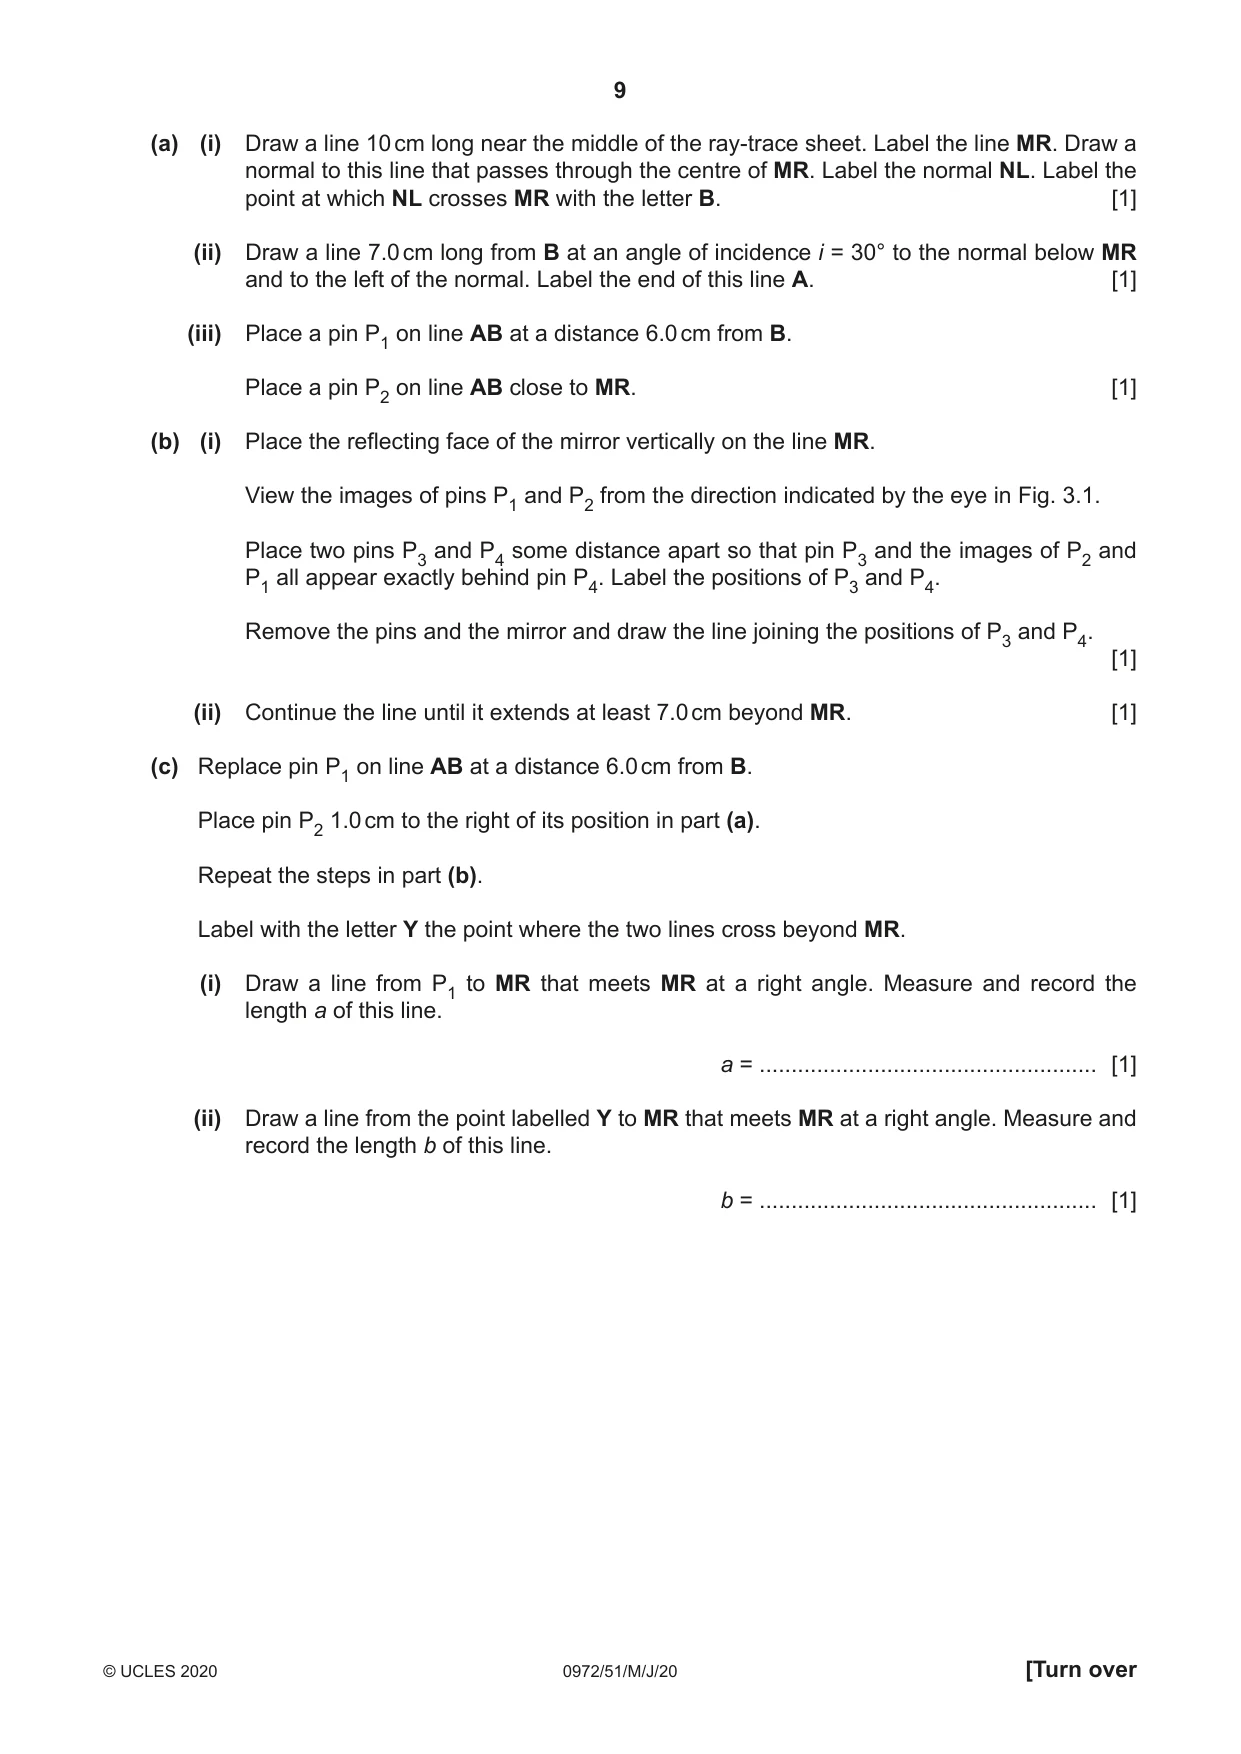
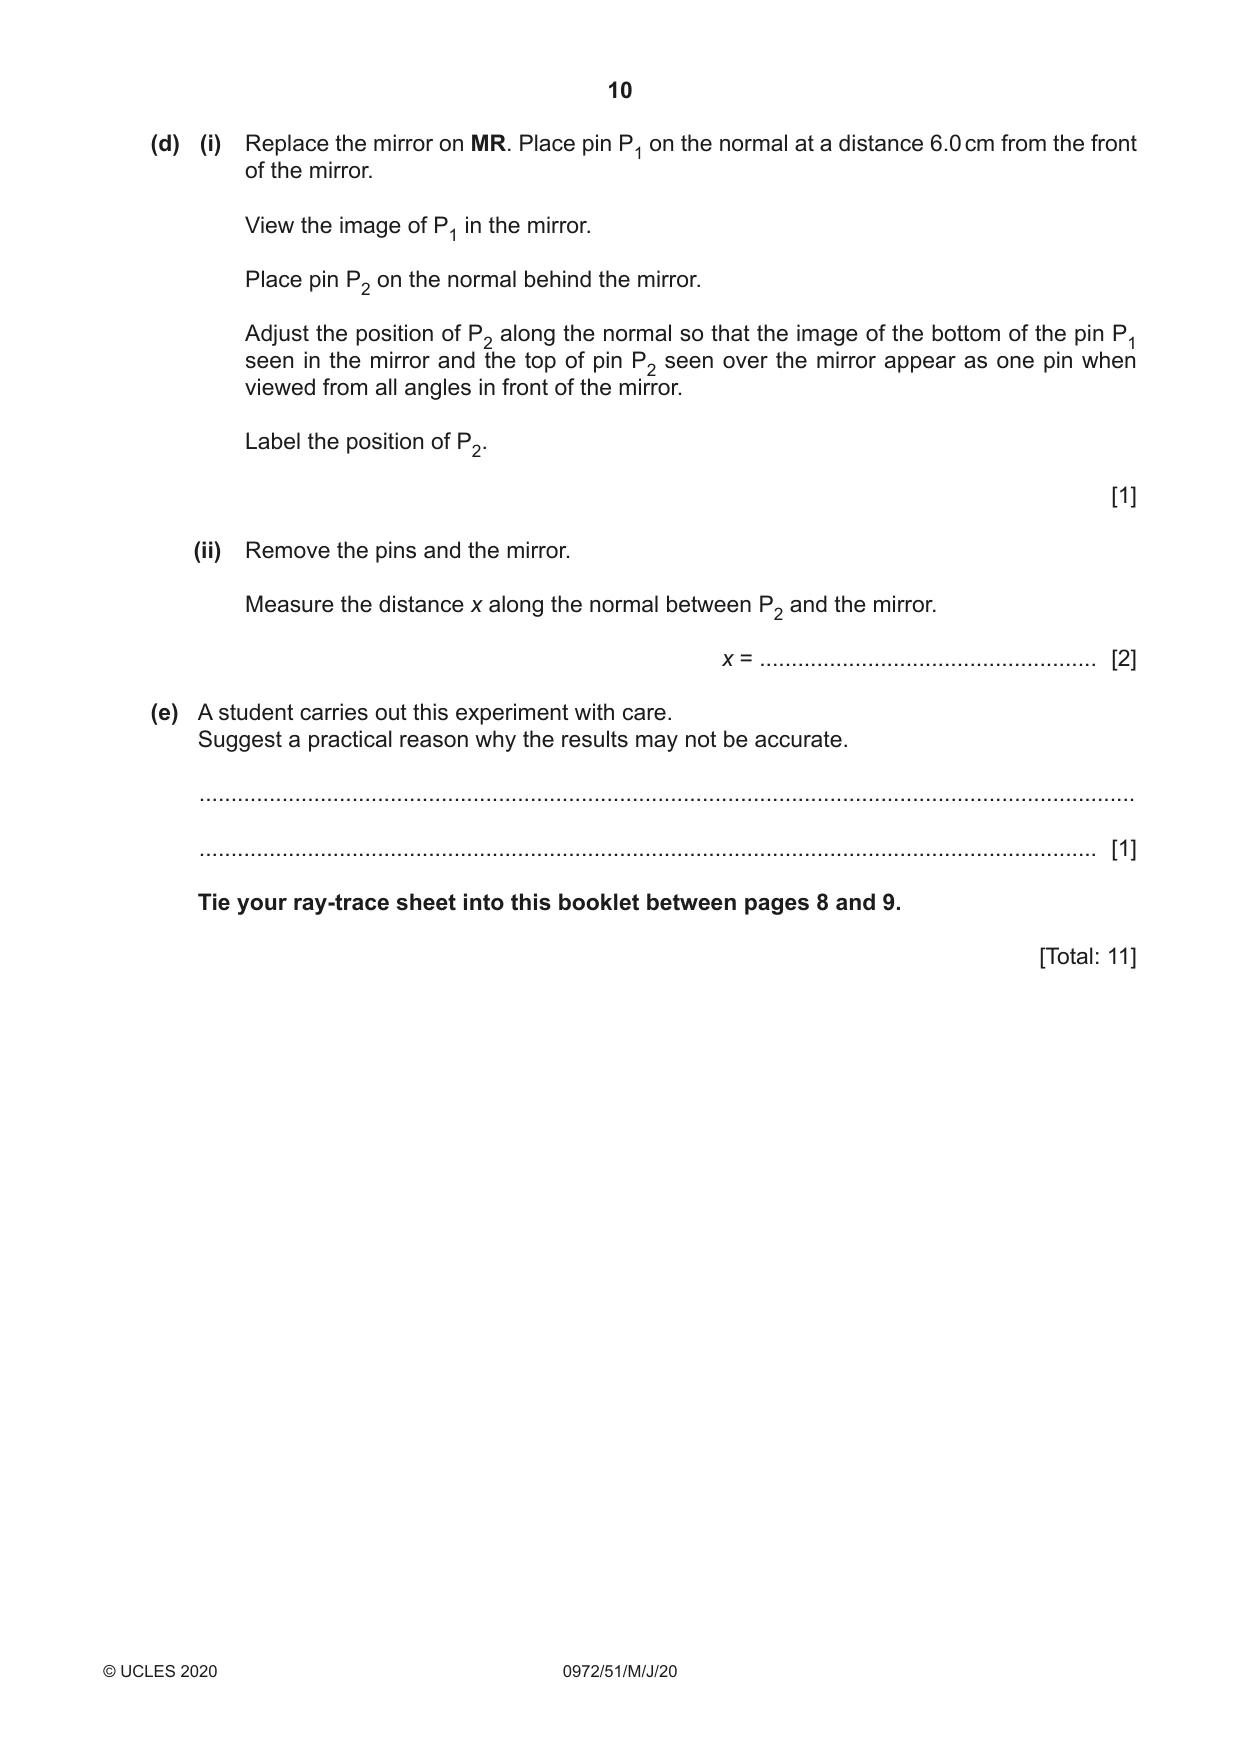
3 In this experiment you will investigate the position of the image in a plane mirror. Carry out the following instructions, using the separate ray-trace sheet provided. You may refer to Fig. 3.1 for guidance. hole N B M R P2 L P1 A ray-trace sheet eye Fig. 3.1 (a) (i) Draw a line 10 cm long near the middle of the ray-trace sheet. Label the line MR. Draw a normal to this line that passes through the centre of MR. Label the normal NL. Label the point at which NL crosses MR with the letter B. [1] (ii) Draw a line 7.0 cm long from B at an angle of incidence i = 30° to the normal below MR and to the left of the normal. Label the end of this line A. [1] (iii) Place a pin P1 on line AB at a distance 6.0 cm from B. Place a pin P2 on line AB close to MR. [1] (b) (i) Place the reflecting face of the mirror vertically on the line MR. View the images of pins P1 and P2 from the direction indicated by the eye in Fig. 3.1. Place two pins P3 and P4 some distance apart so that pin P3 and the images of P2 and P1 all appear exactly behind pin P4. Label the positions of P3 and P4. Remove the pins and the mirror and draw the line joining the positions of P3 and P4. [1] (ii) Continue the line until it extends at least 7.0 cm beyond MR. [1] (c) Replace pin P1 on line AB at a distance 6.0 cm from B. Place pin P2 1.0 cm to the right of its position in part (a). Repeat the steps in part (b). Label with the letter Y the point where the two lines cross beyond MR. (i) Draw a line from P1 to MR that meets MR at a right angle. Measure and record the length a of this line. a = ..................................................... [1] (ii) Draw a line from the point labelled Y to MR that meets MR at a right angle. Measure and record the length b of this line. b = ..................................................... [1] (d) (i) Replace the mirror on MR. Place pin P1 on the normal at a distance 6.0 cm from the front of the mirror. View the image of P1 in the mirror. Place pin P2 on the normal behind the mirror. Adjust the position of P2 along the normal so that the image of the bottom of the pin P1 seen in the mirror and the top of pin P2 seen over the mirror appear as one pin when viewed from all angles in front of the mirror. Label the position of P2. [1] (ii) Remove the pins and the mirror. Measure the distance x along the normal between P2 and the mirror. x = ..................................................... [2] (e) A student carries out this experiment with care. Suggest a practical reason why the results may not be accurate. ................................................................................................................................................... ............................................................................................................................................. [1] Tie your ray-trace sheet into this booklet between pages 8 and 9. [Total: 11]
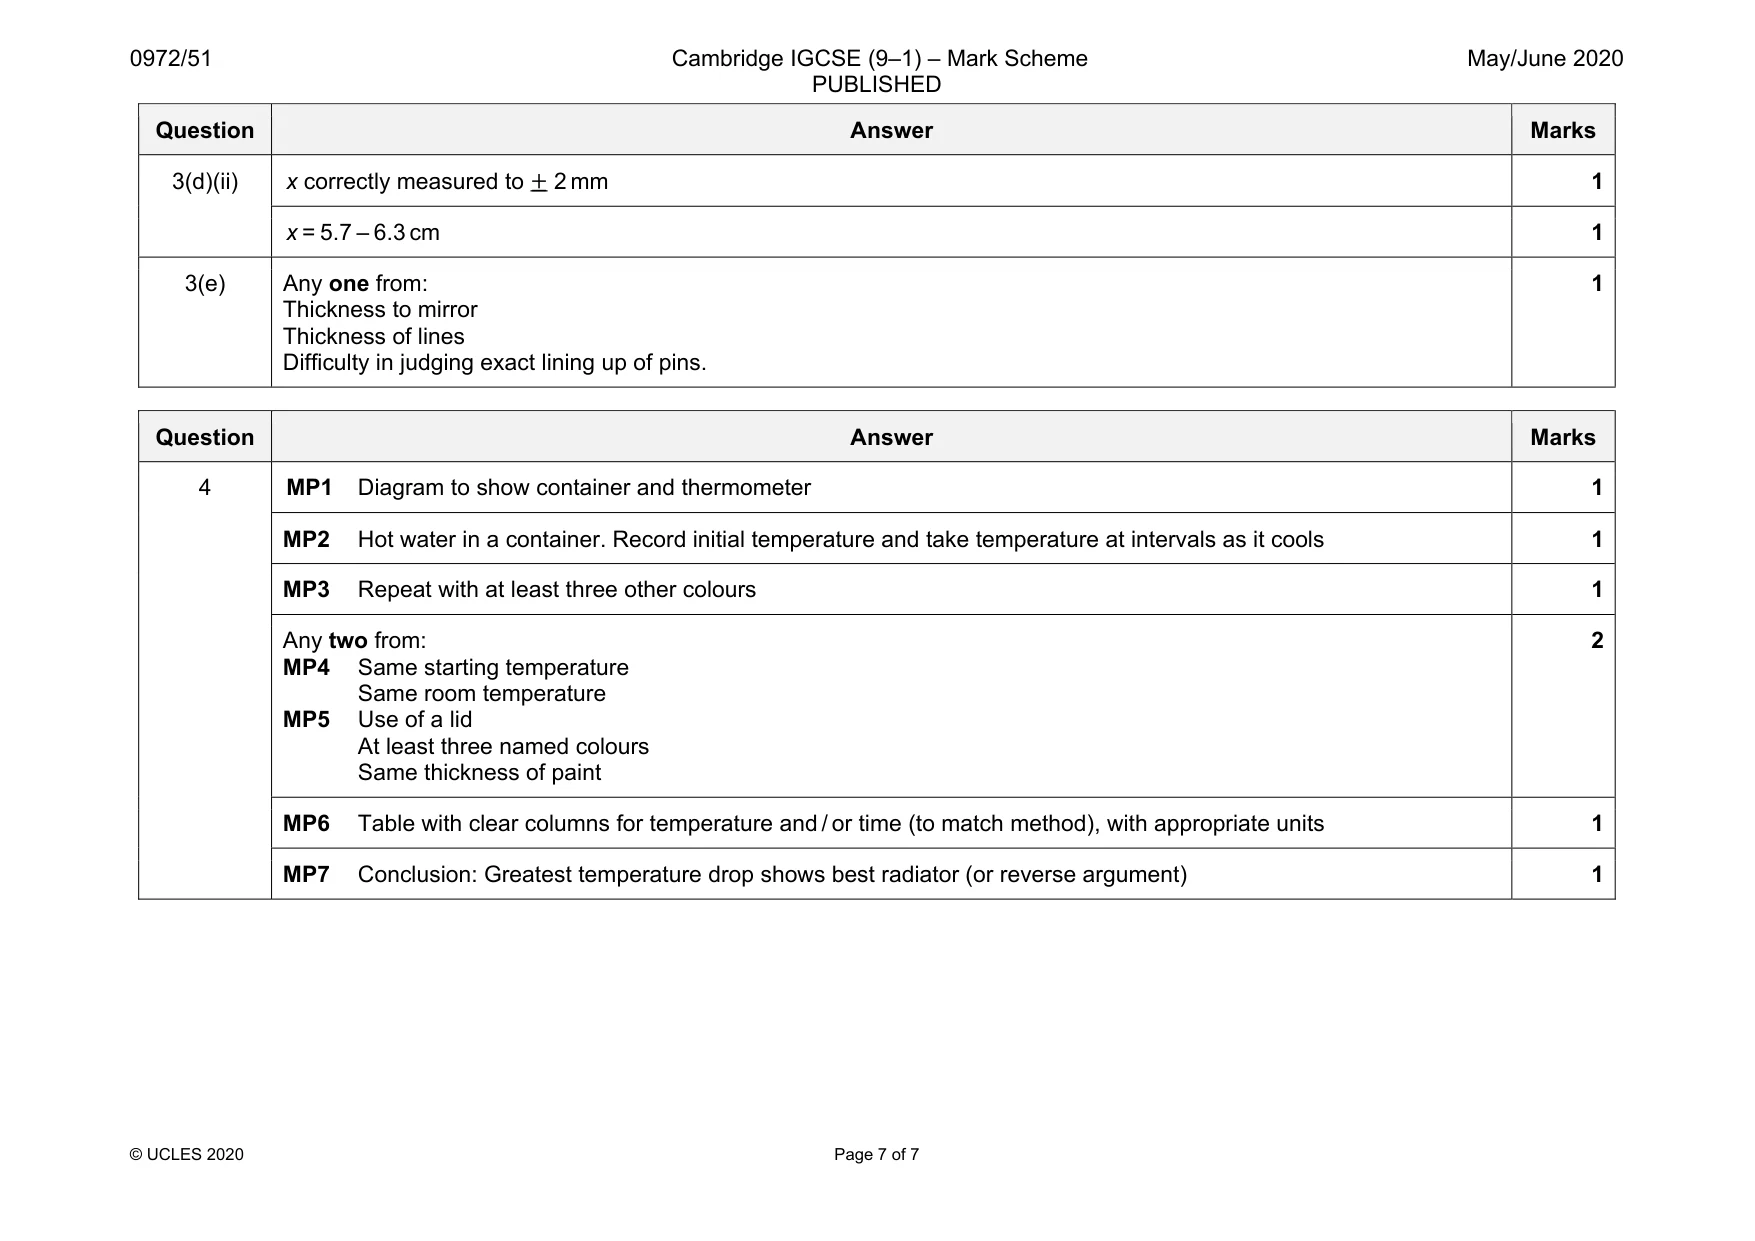
Mark scheme: 3(a)(i) Normal at 90° and in centre of MR 1 3(a)(ii) AB at 30° below MR and to left of normal 1 3(a)(iii) P2 at least 5.0 cm from P1 1 3(b)(i) Neat line joining P3 and P4 1 3(b)(ii) Line extended at least 7.0 cm beyond MR 1 3(c)(i) a and b correctly measured to ± 2 mm 1 3(c)(ii) a = b to ± 4 mm 1 3(d)(i) P1 and P2 in approximately correct positions 1 Question Answer Marks 3(d)(ii) x correctly measured to ± 2 mm 1 x = 5.7 – 6.3 cm 1 3(e) Any one from: Thickness to mirror Thickness of lines Difficulty in judging exact lining up of pins. 1
Q4 · A student investigates the effect of the colour of the surface of a metal container on…
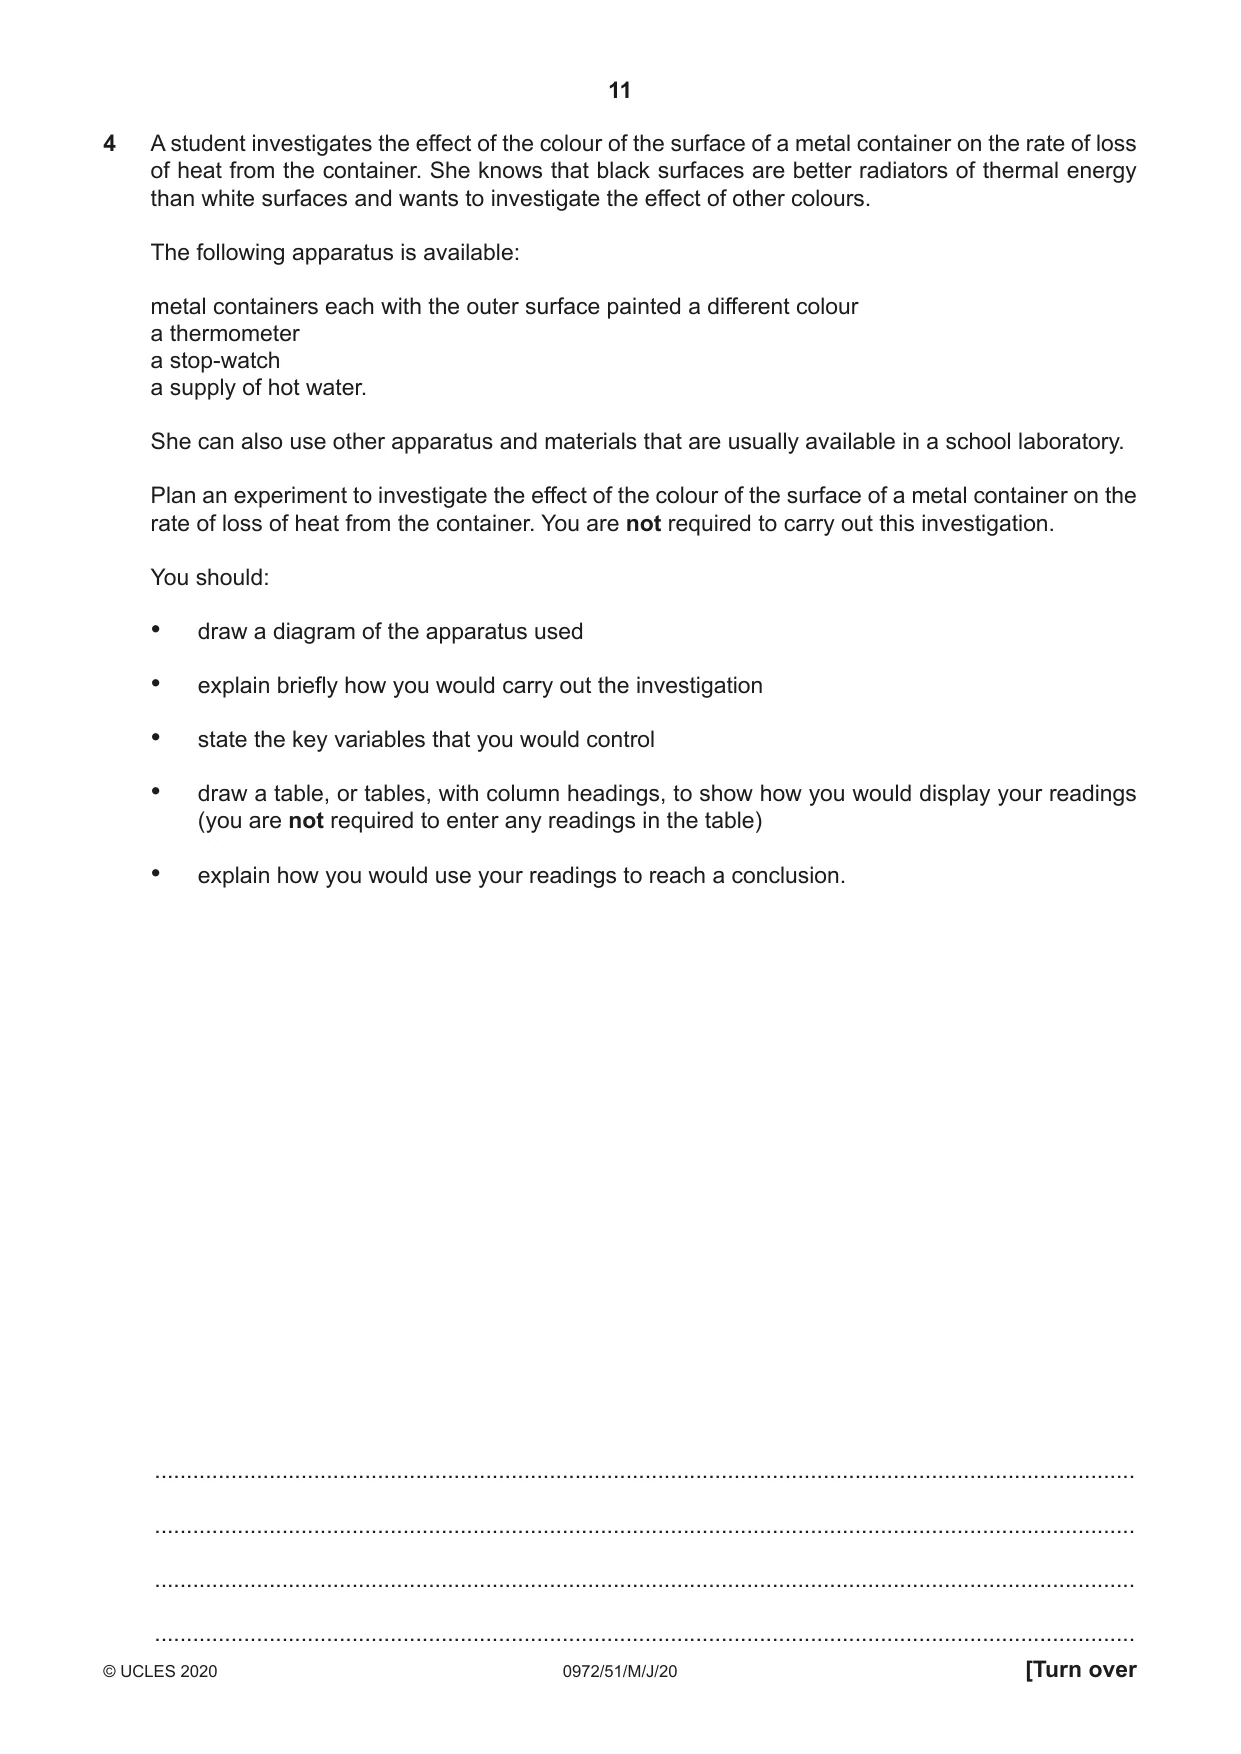
4 A student investigates the effect of the colour of the surface of a metal container on the rate of loss of heat from the container. She knows that black surfaces are better radiators of thermal energy than white surfaces and wants to investigate the effect of other colours. The following apparatus is available: metal containers each with the outer surface painted a different colour a thermometer a stop-watch a supply of hot water. She can also use other apparatus and materials that are usually available in a school laboratory. Plan an experiment to investigate the effect of the colour of the surface of a metal container on the rate of loss of heat from the container. You are not required to carry out this investigation. You should: • draw a diagram of the apparatus used • explain briefly how you would carry out the investigation • state the key variables that you would control • draw a table, or tables, with column headings, to show how you would display your readings (you are not required to enter any readings in the table) • explain how you would use your readings to reach a conclusion. .......................................................................................................................................................... .......................................................................................................................................................... .......................................................................................................................................................... .......................................................................................................................................................... .......................................................................................................................................................... .......................................................................................................................................................... .......................................................................................................................................................... .......................................................................................................................................................... .......................................................................................................................................................... .......................................................................................................................................................... .......................................................................................................................................................... .......................................................................................................................................................... .......................................................................................................................................................... .......................................................................................................................................................... .......................................................................................................................................................... .......................................................................................................................................................... .......................................................................................................................................................... .......................................................................................................................................................... .......................................................................................................................................................... .......................................................................................................................................................... .......................................................................................................................................................... .................................................................................................................................................... [7] [Total: 7]
Mark scheme: 4 MP1 Diagram to show container and thermometer 1 MP2 Hot water in a container. Record initial temperature and take temperature at intervals as it cools 1 MP3 Repeat with at least three other colours 1 Any two from: MP4 Same starting temperature Same room temperature MP5 Use of a lid At least three named colours Same thickness of paint 2 MP6 Table with clear columns for temperature and / or time (to match method), with appropriate units 1 MP7 Conclusion: Greatest temperature drop shows best radiator (or reverse argument) 1
What was in this paper
The subtopics covered by these 4 questions, and how many questions each got. Open one in a new tab to see every Cambridge question on it.