Cambridge IGCSE Physics (9-1) 0972 — 2025 May/June Paper 5 · Variant 1
0972/51/M/J/25 · 4 questions · 40 marks · ≈45 min
The question paper and its mark scheme, free to read here and free to download. This is Cambridge’s own paper, exactly as it was sat.
Question paper12 pages
Mark scheme
No mark scheme is in the library for this paper.
Questions as text
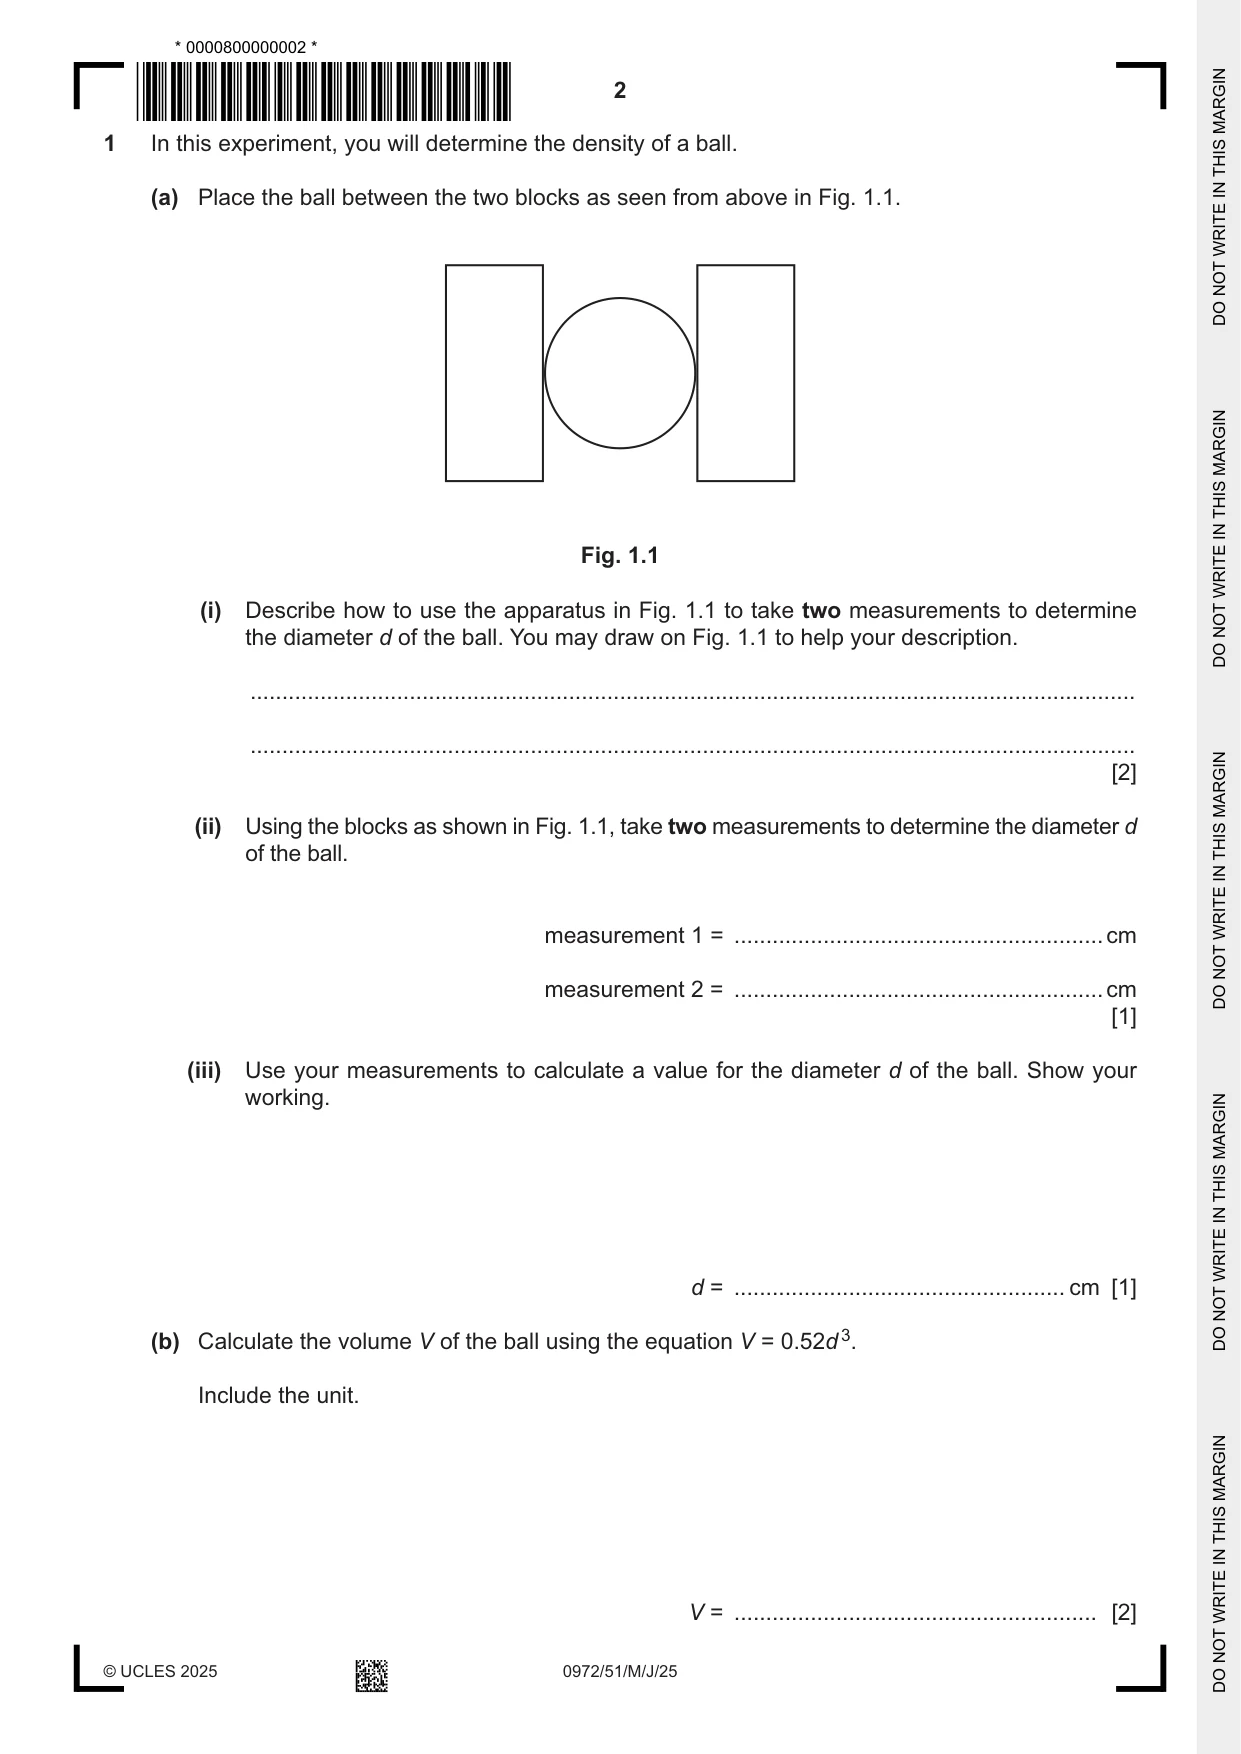
Q1 · In this experiment, you will determine the density of a ball
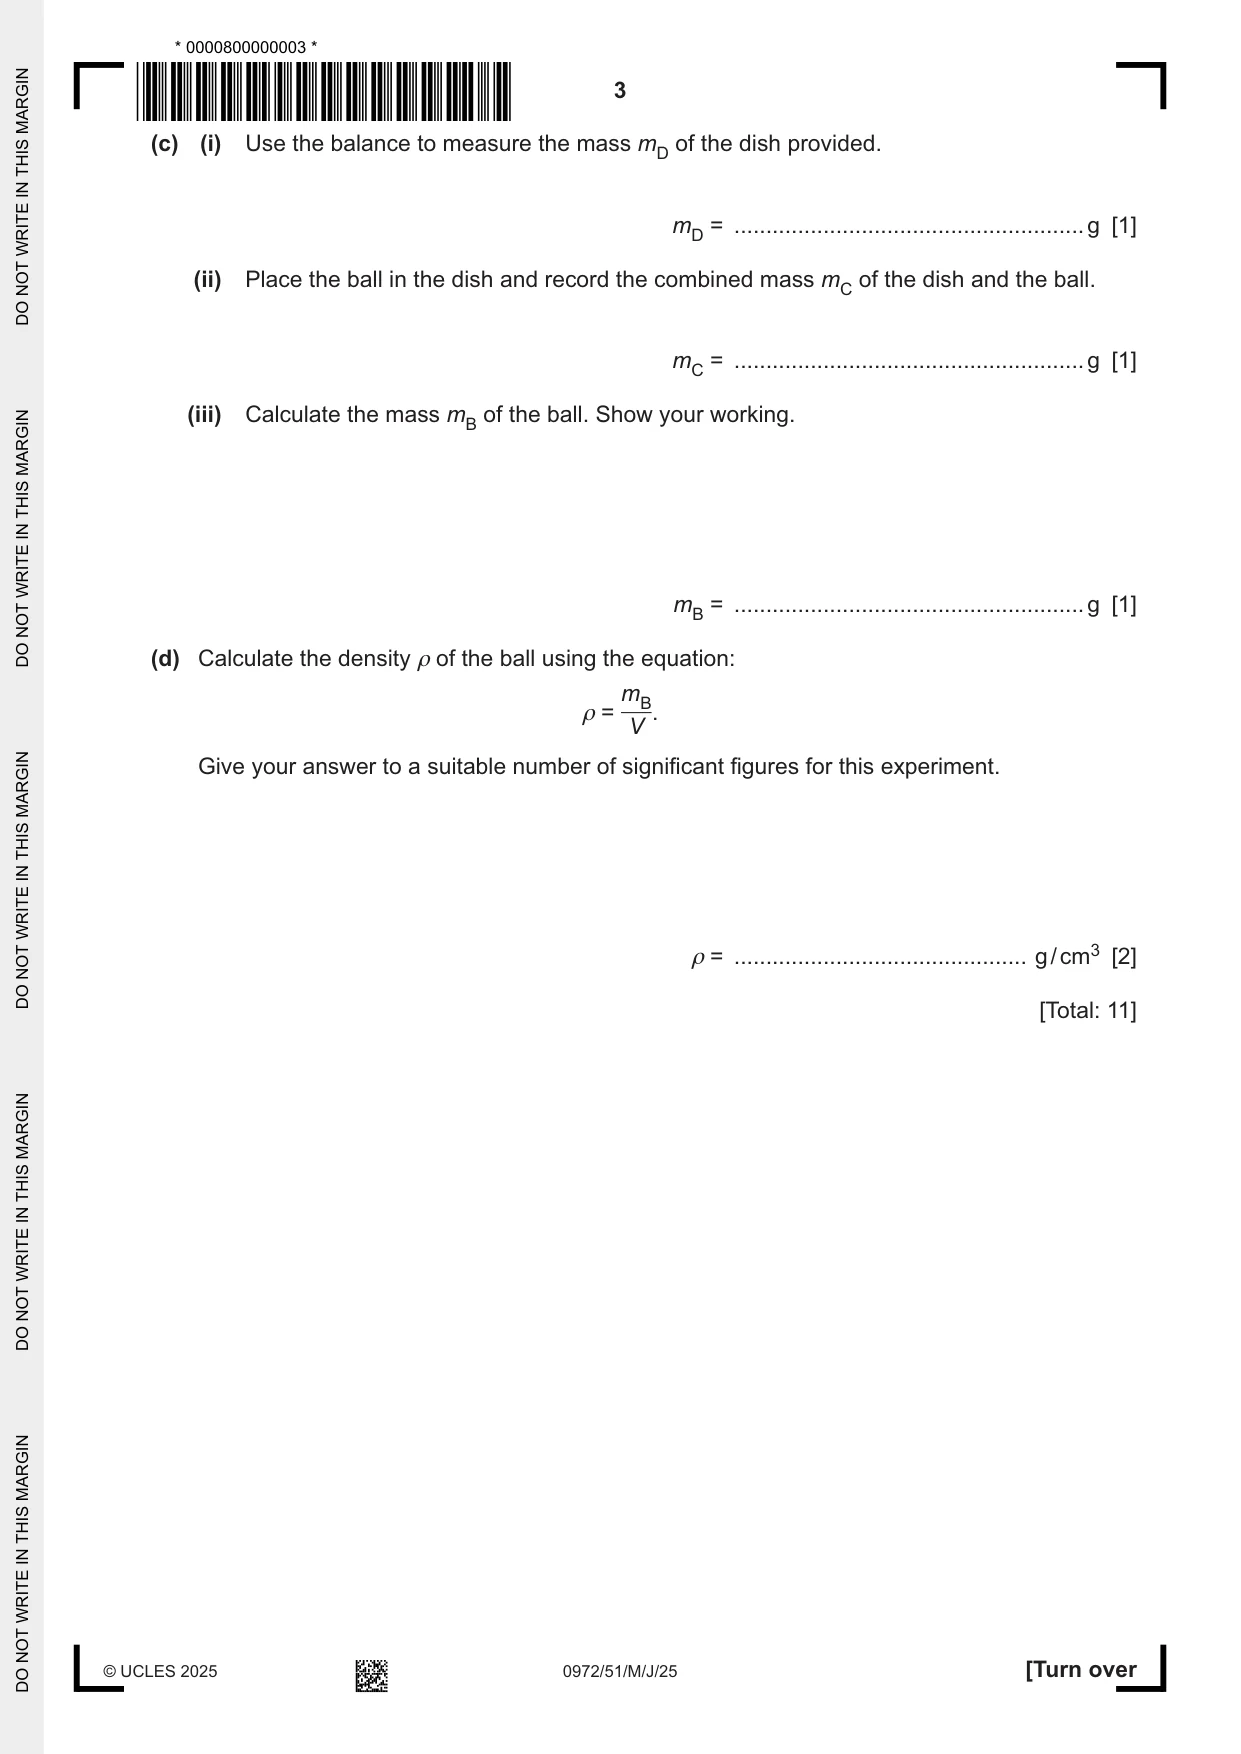
1 In this experiment, you will determine the density of a ball. (a) Place the ball between the two blocks as seen from above in Fig. 1.1. Fig. 1.1 (i) Describe how to use the apparatus in Fig. 1.1 to take two measurements to determine the diameter d of the ball. You may draw on Fig. 1.1 to help your description. ........................................................................................................................................... ........................................................................................................................................... [2] (ii) Using the blocks as shown in Fig. 1.1, take two measurements to determine the diameter d of the ball. measurement 1 = .......................................................... cm measurement 2 = .......................................................... cm [1] (iii) Use your measurements to calculate a value for the diameter d of the ball. Show your working. d = .................................................... cm [1] (b) Calculate the volume V of the ball using the equation V = 0.52d 3. Include the unit. V = ......................................................... [2] (c) (i) Use the balance to measure the mass mD of the dish provided. mD = ....................................................... g [1] (ii) Place the ball in the dish and record the combined mass mC of the dish and the ball. mC = ....................................................... g [1] (iii) Calculate the mass mB of the ball. Show your working. mB = ....................................................... g [1] (d) Calculate the density ρ of the ball using the equation: mB ρ = . V Give your answer to a suitable number of significant figures for this experiment. ρ = .............................................. g / cm3 [2] [Total: 11]
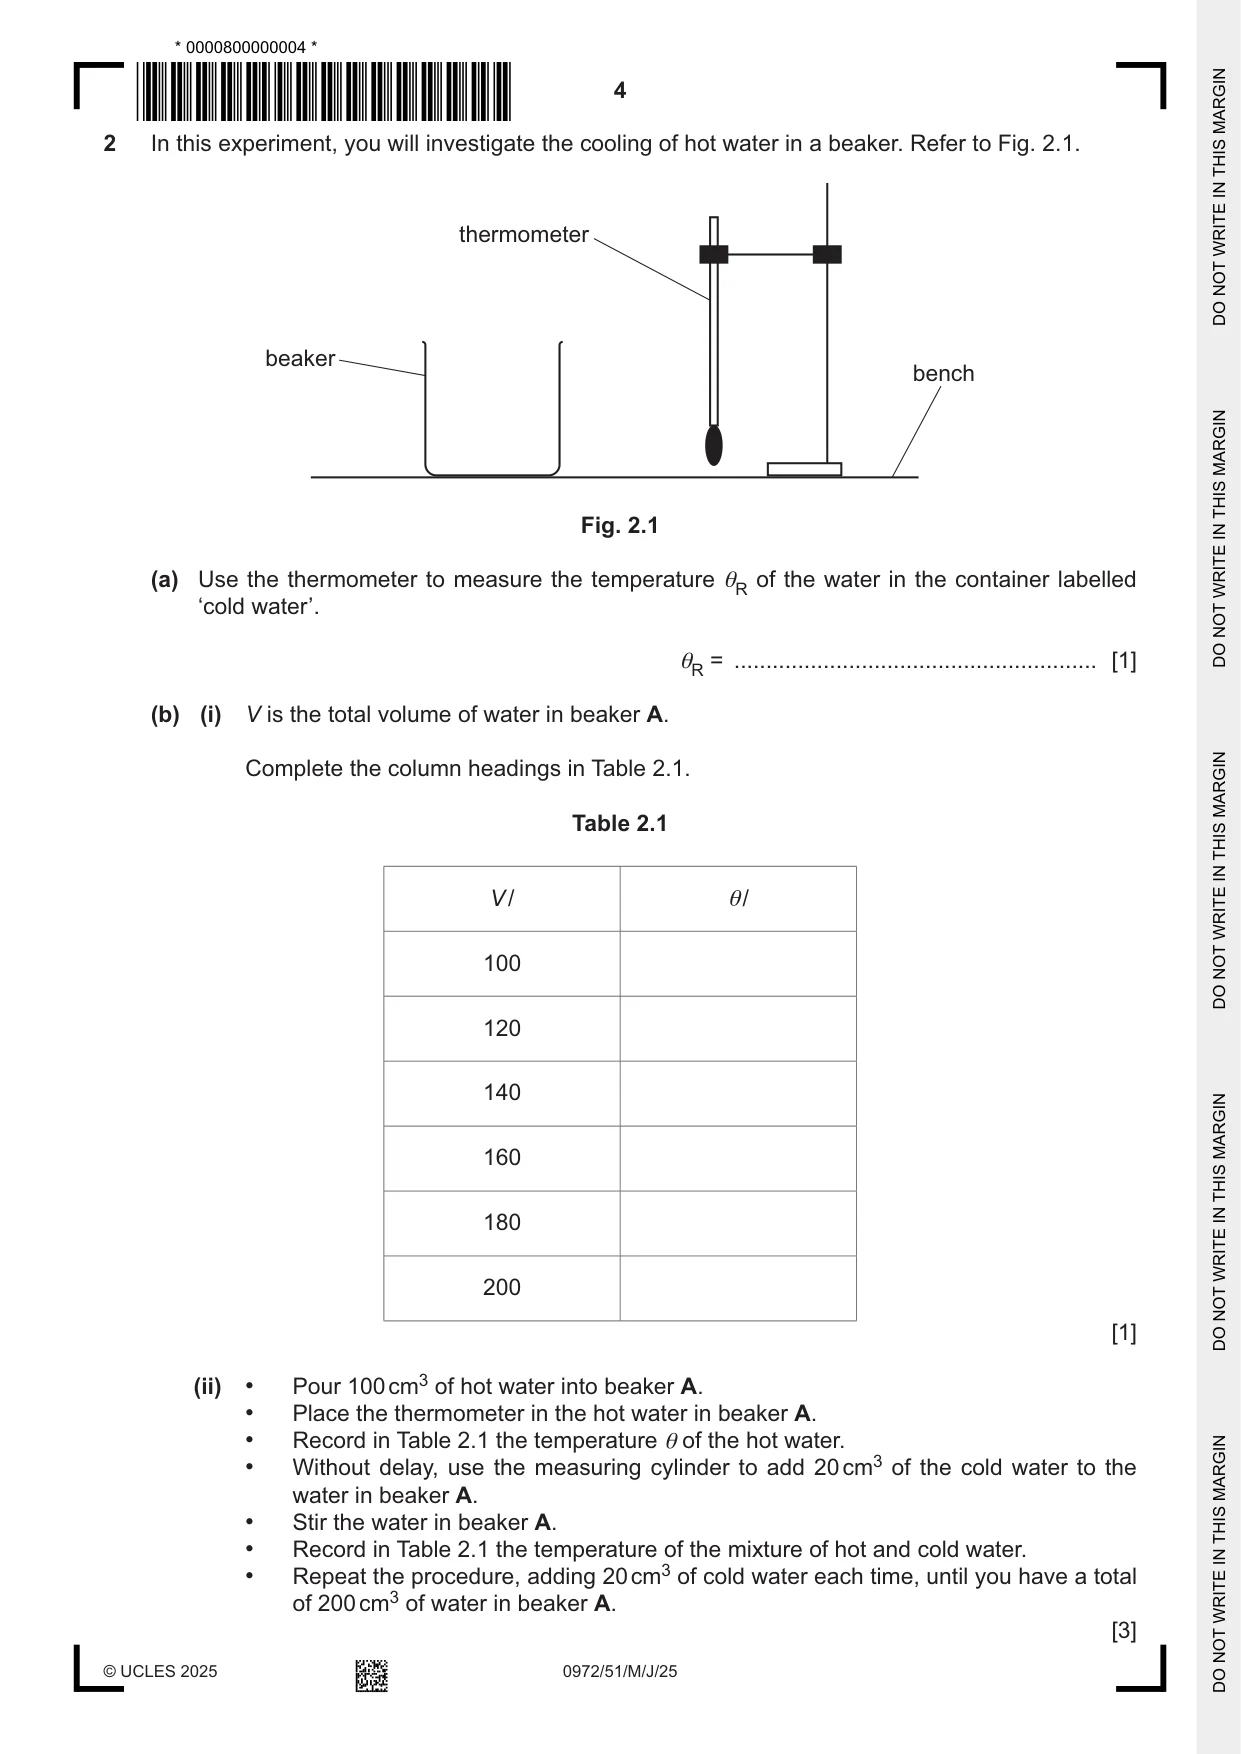
Q2 · In this experiment, you will investigate the cooling of hot water in a beaker
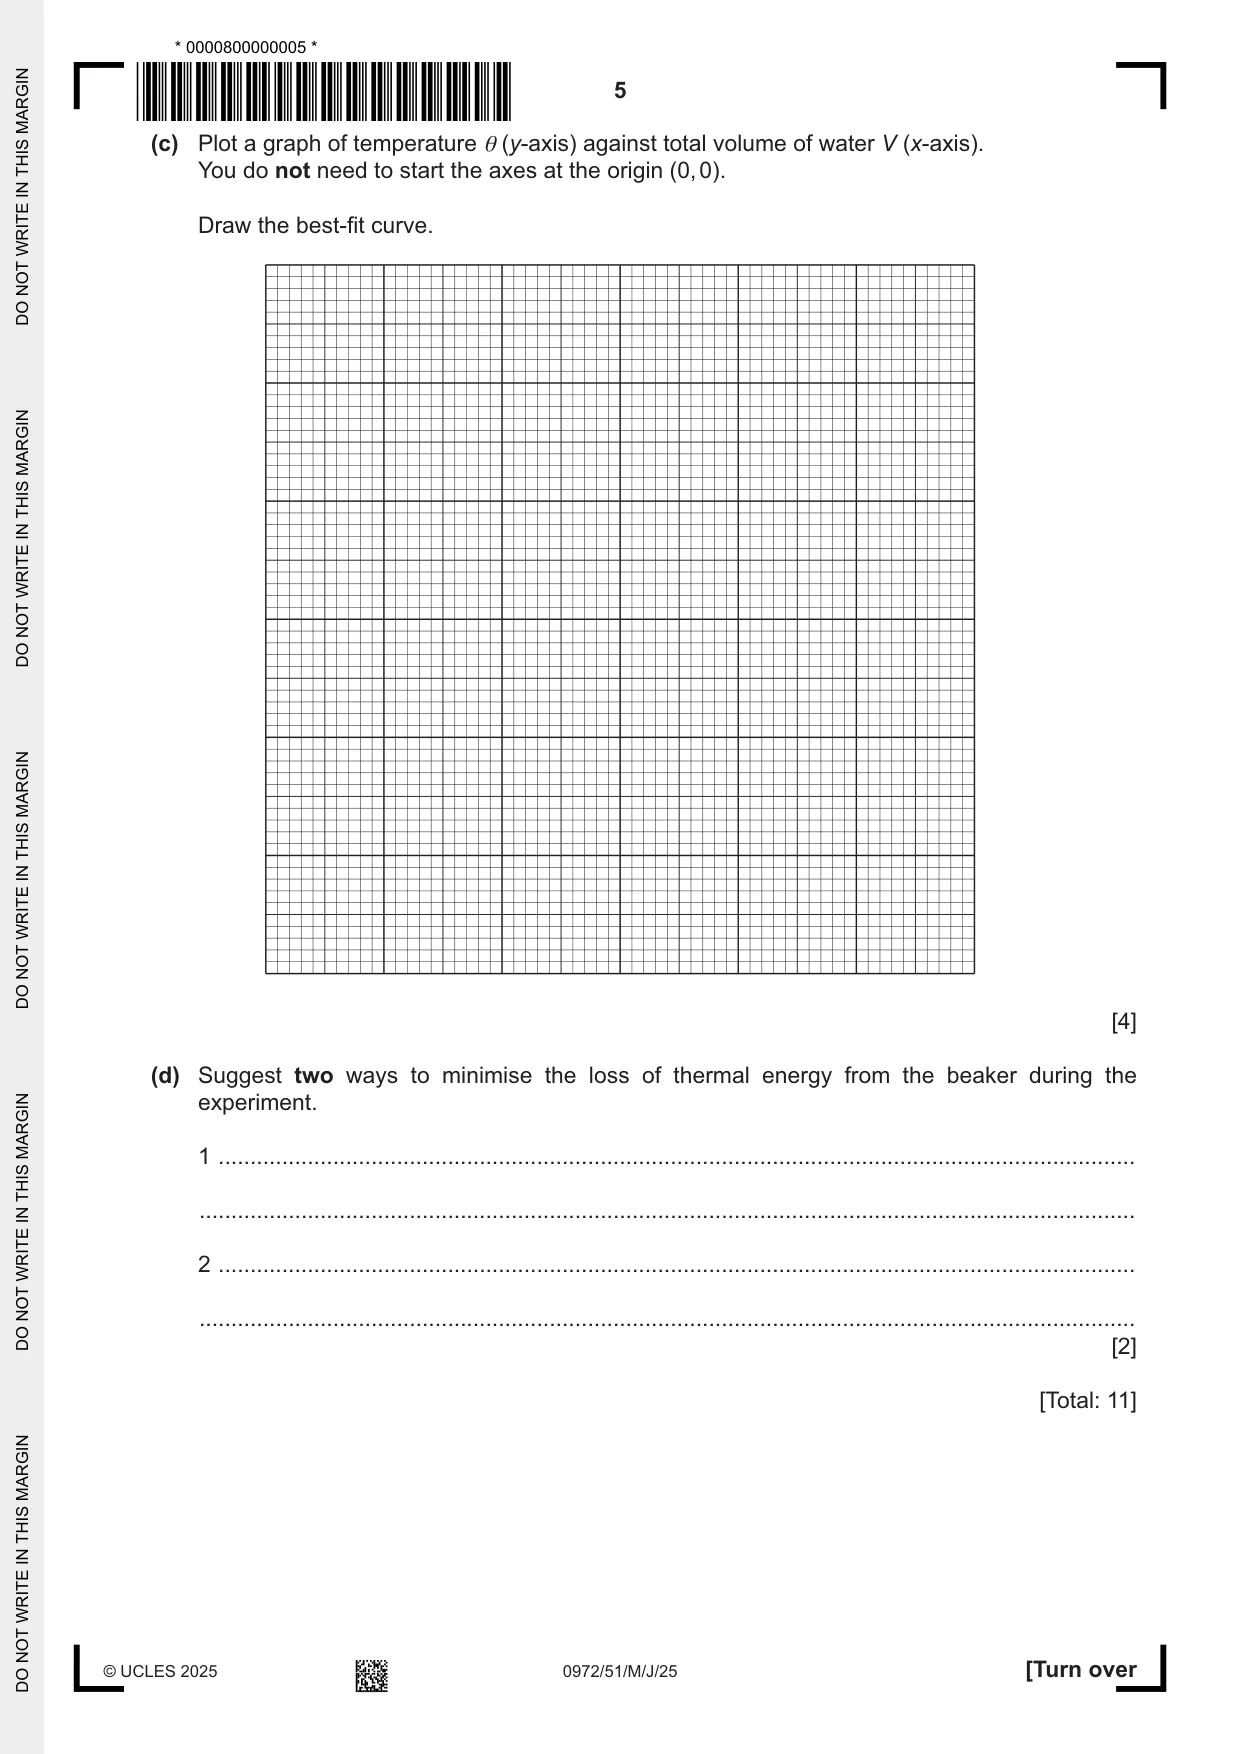
2 In this experiment, you will investigate the cooling of hot water in a beaker. Refer to Fig. 2.1. thermometer beaker bench Fig. 2.1 (a) Use the thermometer to measure the temperature θR of the water in the container labelled ‘cold water’. θR = ......................................................... [1] (b) (i) V is the total volume of water in beaker A. Complete the column headings in Table 2.1. Table 2.1 V / θ/ 100 120 140 160 180 200 [1] (ii) • Pour 100 cm3 of hot water into beaker A. • Place the thermometer in the hot water in beaker A. • Record in Table 2.1 the temperature θ of the hot water. • Without delay, use the measuring cylinder to add 20 cm3 of the cold water to the water in beaker A. • Stir the water in beaker A. • Record in Table 2.1 the temperature of the mixture of hot and cold water. • Repeat the procedure, adding 20 cm3 of cold water each time, until you have a total of 200 cm3 of water in beaker A. [3] (c) Plot a graph of temperature θ (y-axis) against total volume of water V (x-axis). You do not need to start the axes at the origin (0, 0). Draw the best-fit curve. [4] (d) Suggest two ways to minimise the loss of thermal energy from the beaker during the experiment. 1 ................................................................................................................................................ ................................................................................................................................................... 2 ................................................................................................................................................ ................................................................................................................................................... [2] [Total: 11]
More questions on Physical quantities and measurement techniques
Q3 · In this experiment, you will investigate the position of the image in a plane mirror
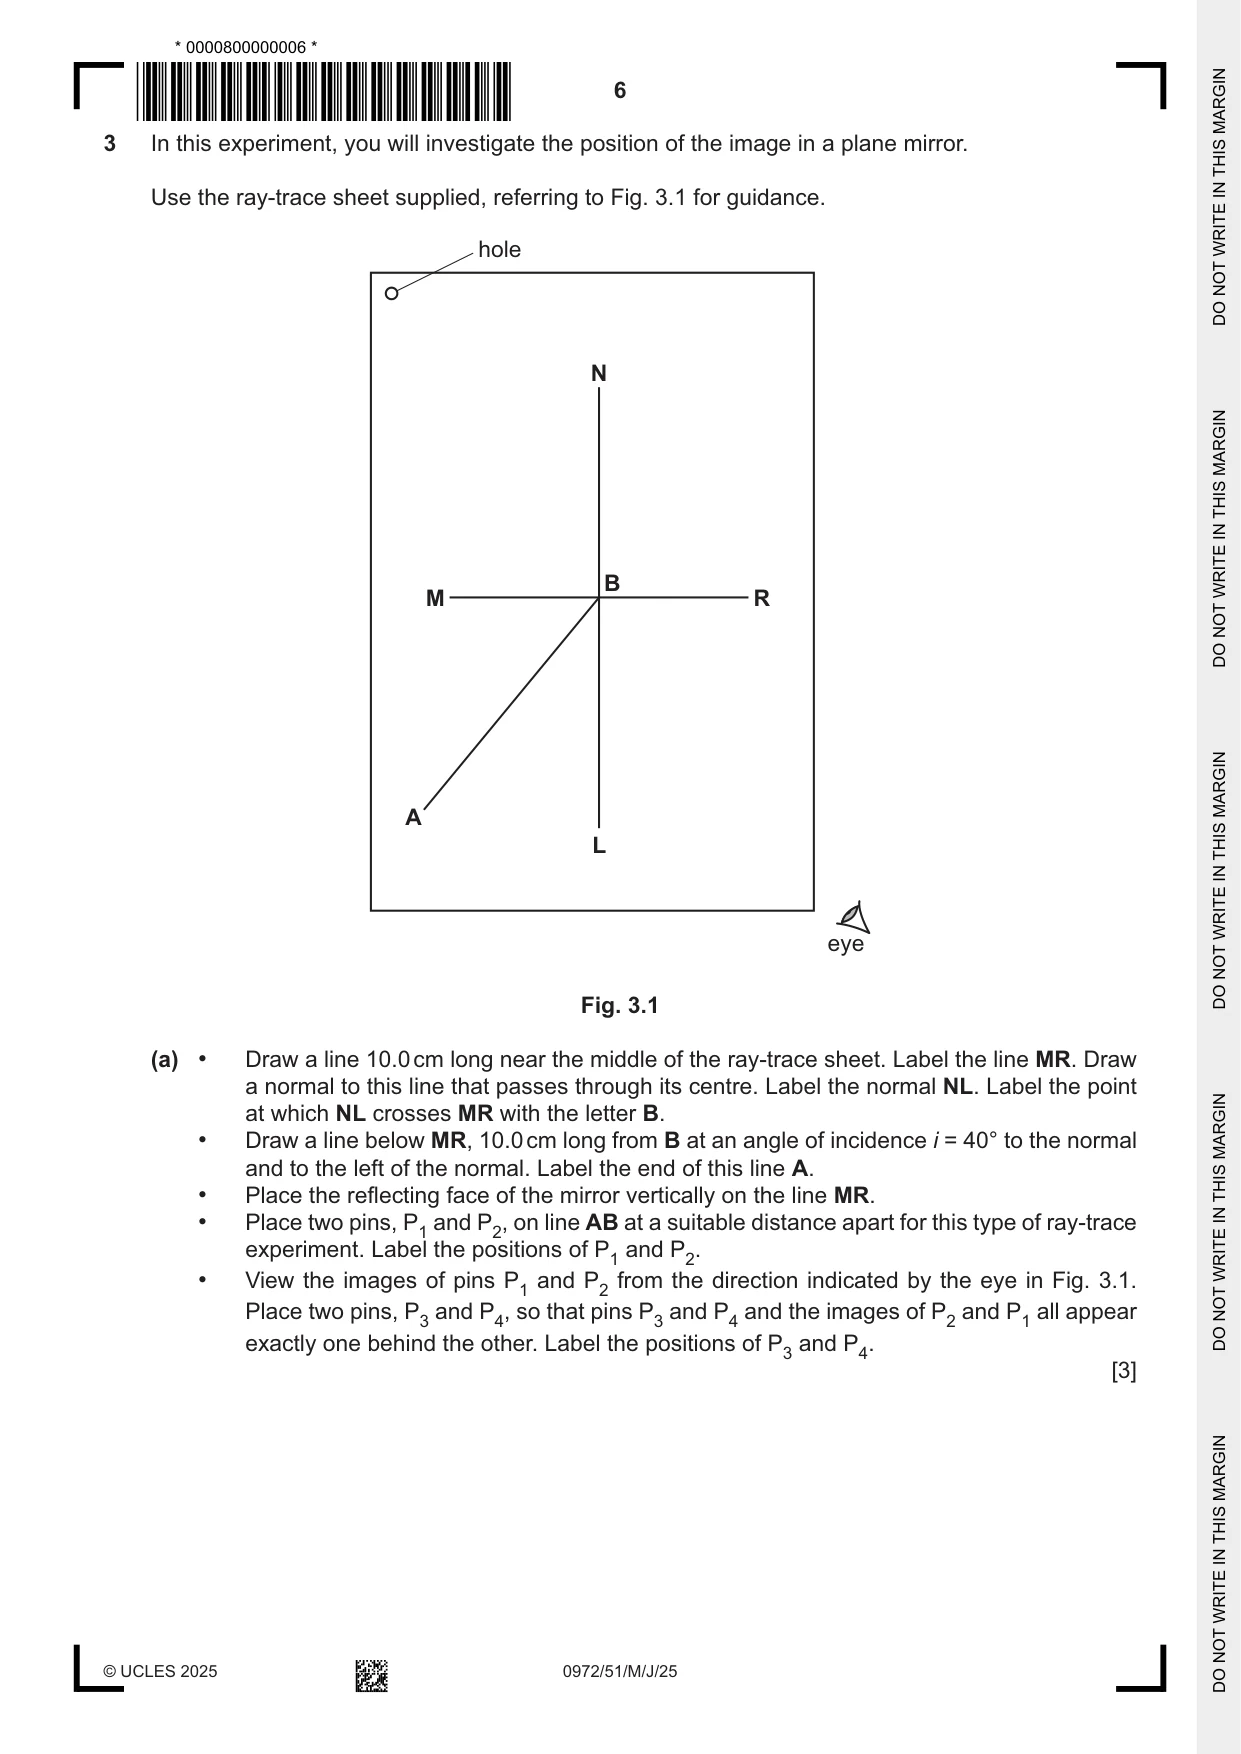
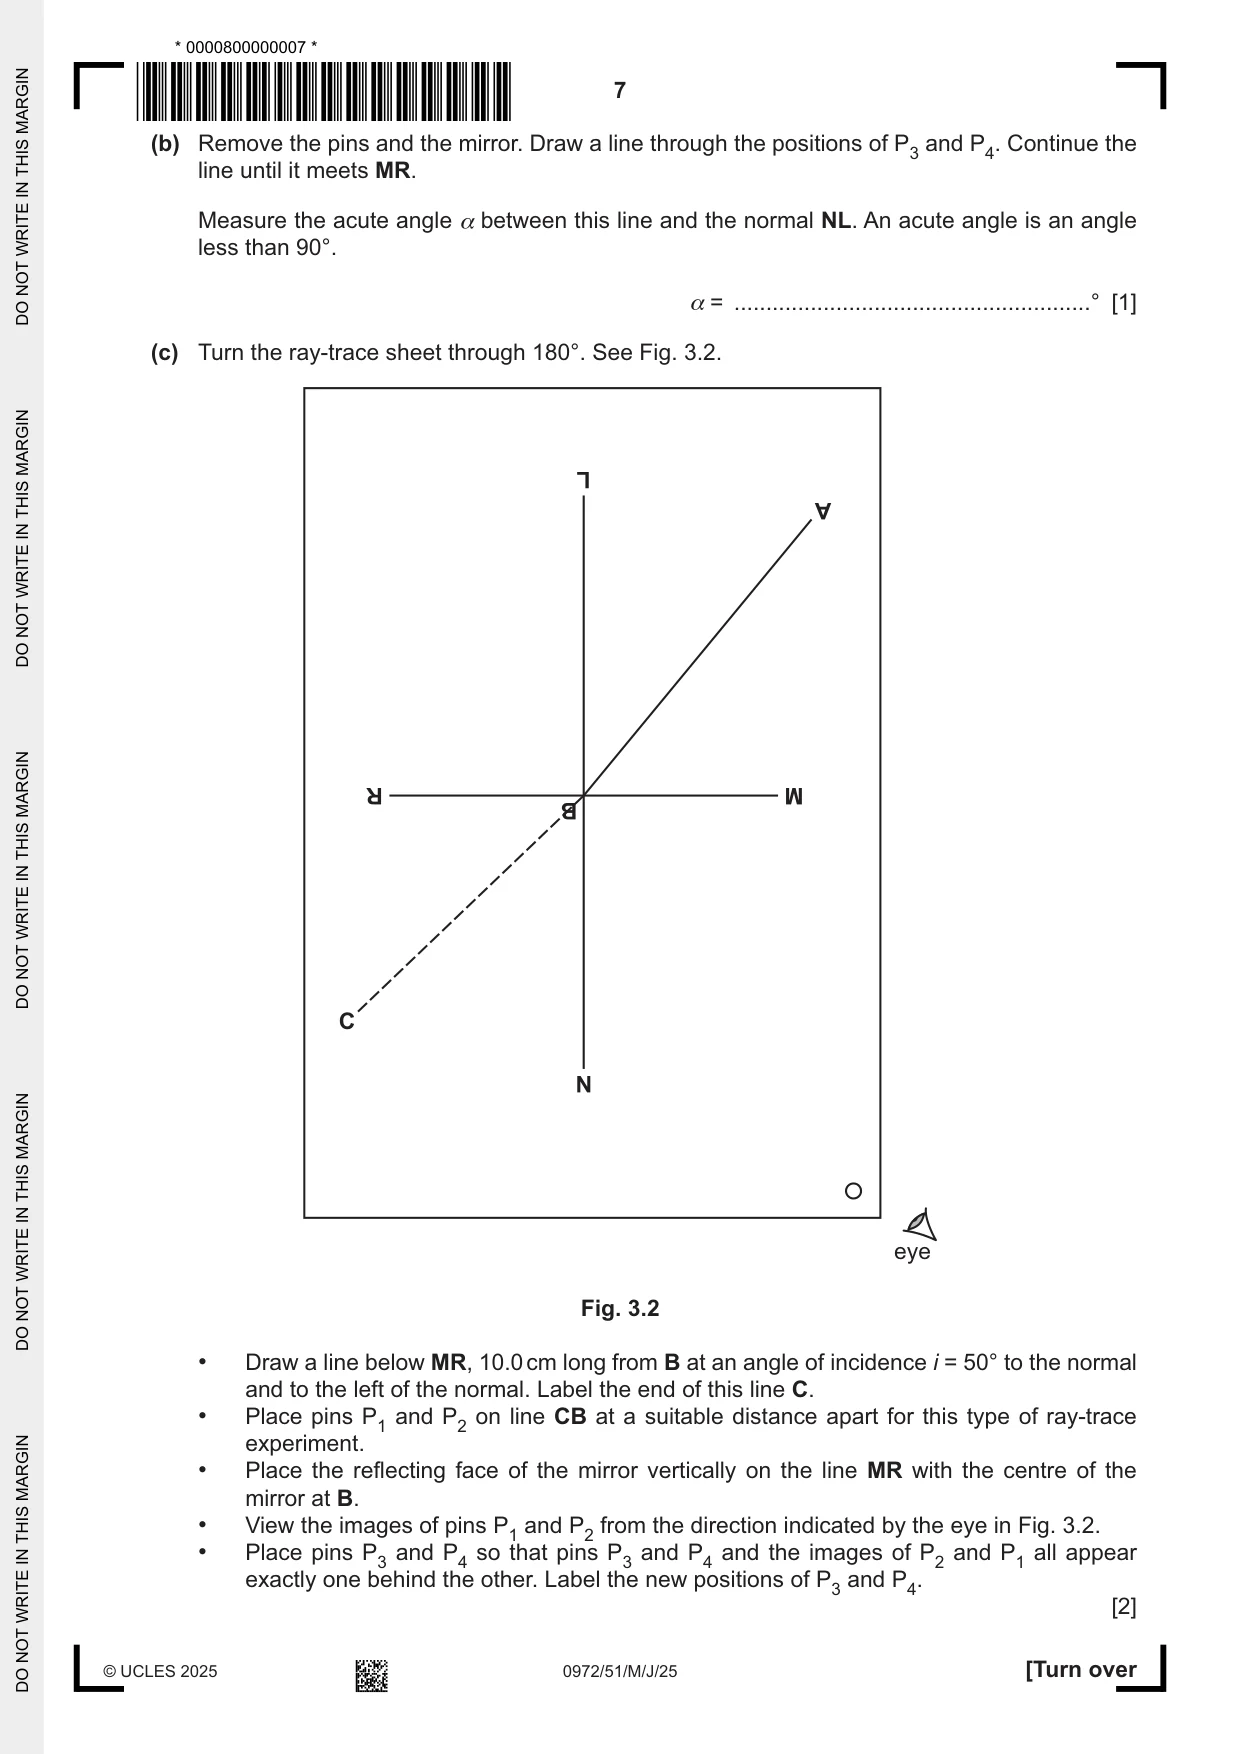
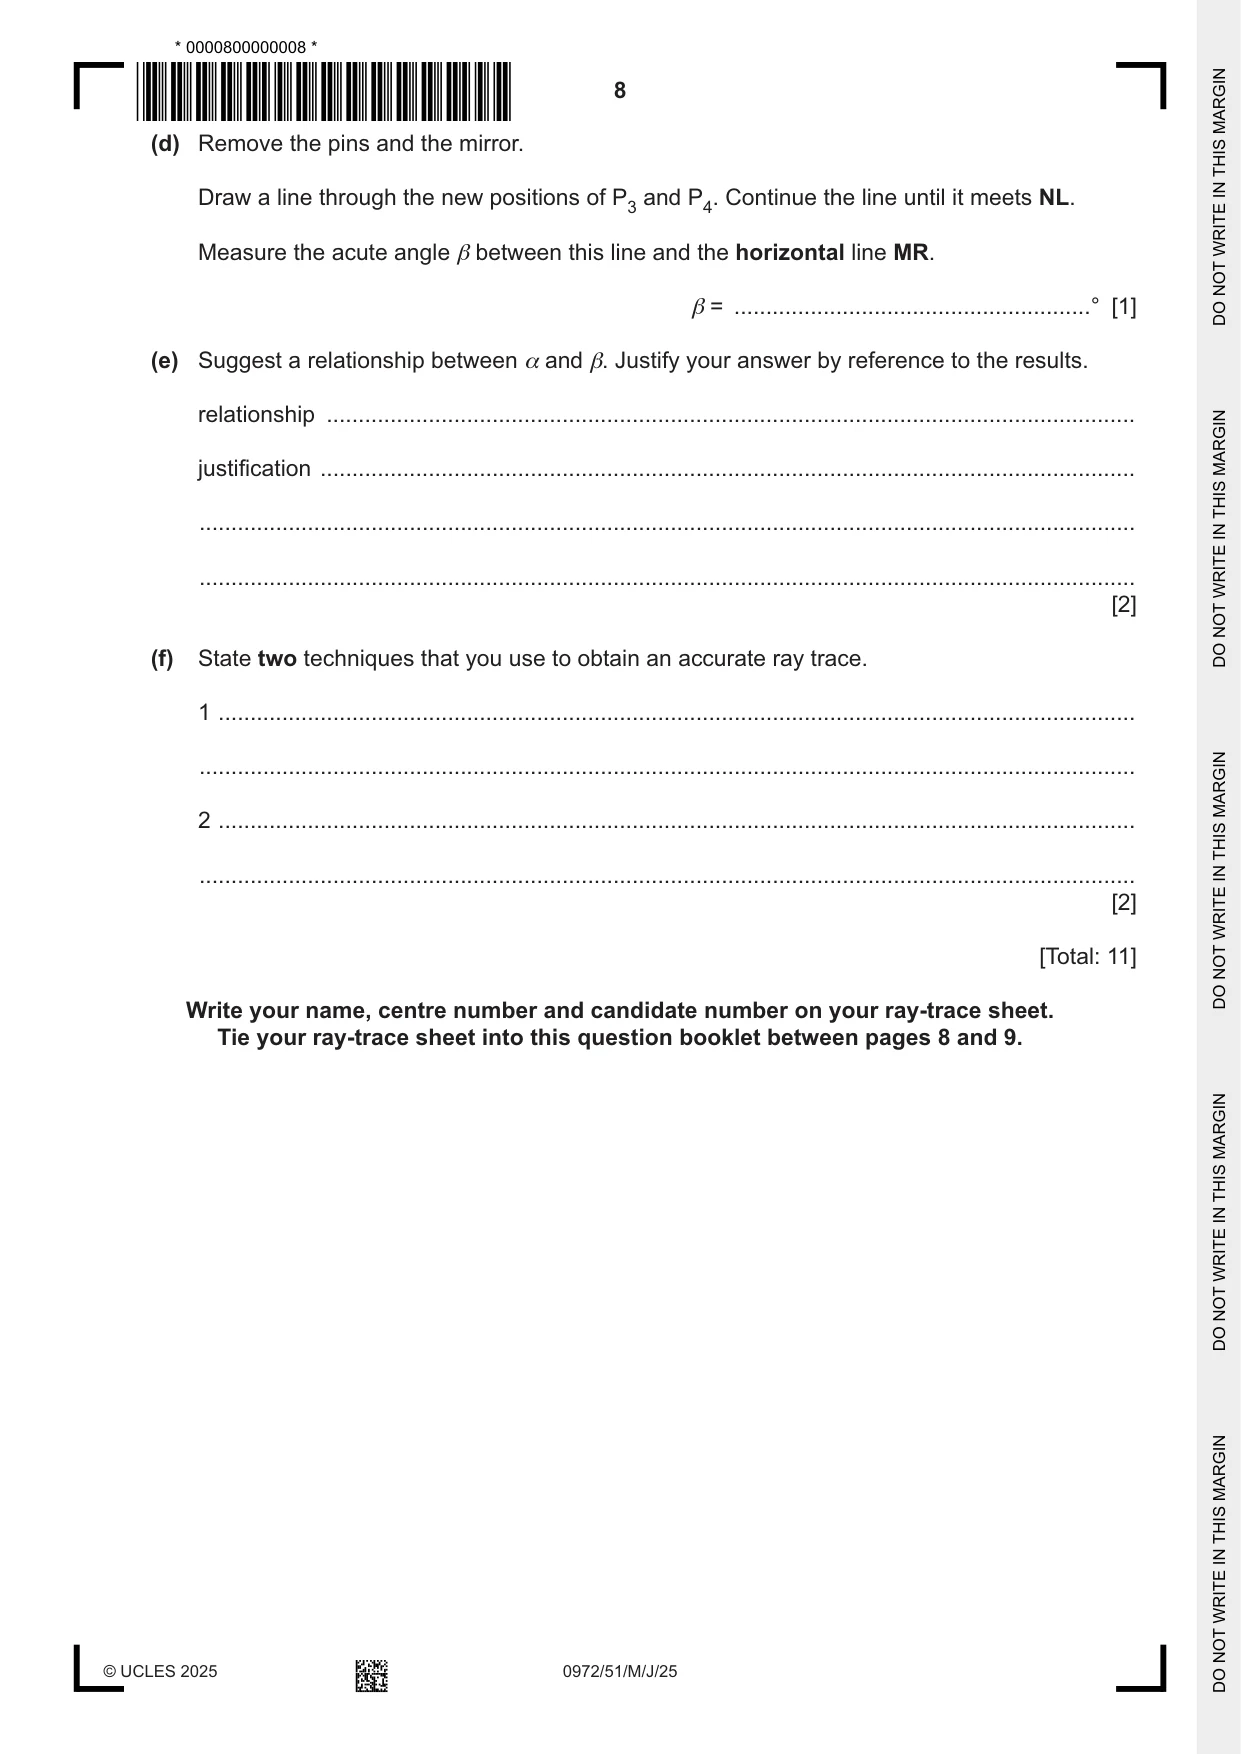
3 In this experiment, you will investigate the position of the image in a plane mirror. Use the ray-trace sheet supplied, referring to Fig. 3.1 for guidance. hole N B M R A L eye Fig. 3.1 (a) • Draw a line 10.0 cm long near the middle of the ray-trace sheet. Label the line MR. Draw a normal to this line that passes through its centre. Label the normal NL. Label the point at which NL crosses MR with the letter B. • Draw a line below MR, 10.0 cm long from B at an angle of incidence i = 40° to the normal and to the left of the normal. Label the end of this line A. • Place the reflecting face of the mirror vertically on the line MR. • Place two pins, P1 and P2, on line AB at a suitable distance apart for this type of ray-trace experiment. Label the positions of P1 and P2. • View the images of pins P1 and P2 from the direction indicated by the eye in Fig. 3.1. Place two pins, P3 and P4, so that pins P3 and P4 and the images of P2 and P1 all appear exactly one behind the other. Label the positions of P3 and P4. [3] (b) Remove the pins and the mirror. Draw a line through the positions of P3 and P4. Continue the line until it meets MR. Measure the acute angle α between this line and the normal NL. An acute angle is an angle less than 90°. α = ........................................................° [1] (c) Turn the ray-trace sheet through 180°. See Fig. 3.2. L A R M B C N eye Fig. 3.2 • Draw a line below MR, 10.0 cm long from B at an angle of incidence i = 50° to the normal and to the left of the normal. Label the end of this line C. • Place pins P1 and P2 on line CB at a suitable distance apart for this type of ray-trace experiment. • Place the reflecting face of the mirror vertically on the line MR with the centre of the mirror at B. • View the images of pins P1 and P2 from the direction indicated by the eye in Fig. 3.2. • Place pins P3 and P4 so that pins P3 and P4 and the images of P2 and P1 all appear exactly one behind the other. Label the new positions of P3 and P4. [2] (d) Remove the pins and the mirror. Draw a line through the new positions of P3 and P4. Continue the line until it meets NL. Measure the acute angle β between this line and the horizontal line MR. β = ........................................................° [1] (e) Suggest a relationship between α and β. Justify your answer by reference to the results. relationship ............................................................................................................................... justification ................................................................................................................................ ................................................................................................................................................... ................................................................................................................................................... [2] (f) State two techniques that you use to obtain an accurate ray trace. 1 ................................................................................................................................................ ................................................................................................................................................... 2 ................................................................................................................................................ ................................................................................................................................................... [2] [Total: 11] Write your name, centre number and candidate number on your ray-trace sheet. Tie your ray-trace sheet into this question booklet between pages 8 and 9.
Q4 · A student investigates the relationship between the diameter and the resistance of wires
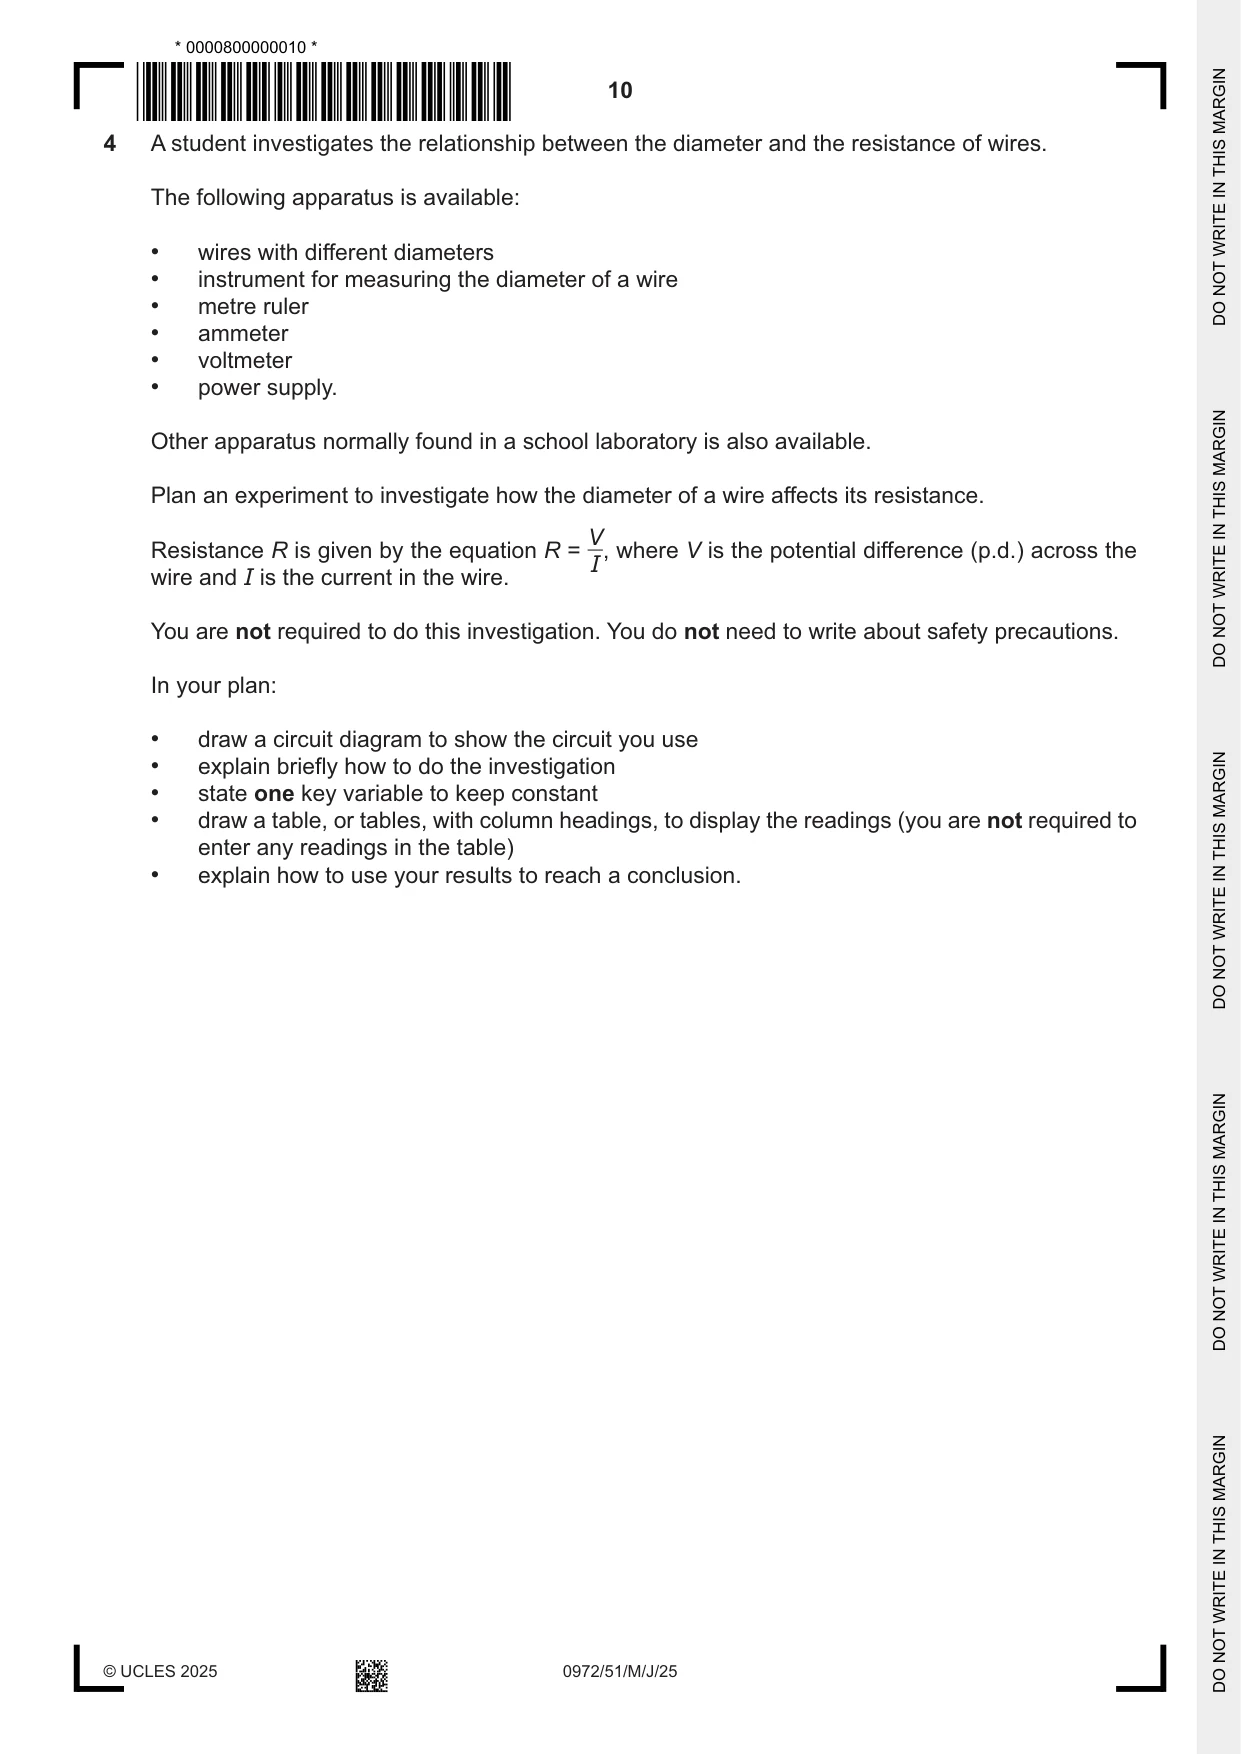
4 A student investigates the relationship between the diameter and the resistance of wires. The following apparatus is available: • wires with different diameters • instrument for measuring the diameter of a wire • metre ruler • ammeter • voltmeter • power supply. Other apparatus normally found in a school laboratory is also available. Plan an experiment to investigate how the diameter of a wire affects its resistance. V Resistance R is given by the equation R = I, where V is the potential difference (p.d.) across the wire and I is the current in the wire. You are not required to do this investigation. You do not need to write about safety precautions. In your plan: • draw a circuit diagram to show the circuit you use • explain briefly how to do the investigation • state one key variable to keep constant • draw a table, or tables, with column headings, to display the readings (you are not required to enter any readings in the table) • explain how to use your results to reach a conclusion. .......................................................................................................................................................... .......................................................................................................................................................... .......................................................................................................................................................... .......................................................................................................................................................... .......................................................................................................................................................... .......................................................................................................................................................... .......................................................................................................................................................... .......................................................................................................................................................... .......................................................................................................................................................... .......................................................................................................................................................... .......................................................................................................................................................... .......................................................................................................................................................... .......................................................................................................................................................... .......................................................................................................................................................... .......................................................................................................................................................... .......................................................................................................................................................... .......................................................................................................................................................... .......................................................................................................................................................... .......................................................................................................................................................... .................................................................................................................................................... [7]
What was in this paper
The subtopics covered by these 4 questions, and how many questions each got. Open one in a new tab to see every Cambridge question on it.
What you needed in this session
Cambridge’s own grade thresholds for 2025 May/June, Paper 5 · Variant 1. A higher threshold means an easier paper — the bar moves with how the cohort did.