Cambridge IGCSE Physics (9-1) 0972 — 2023 Oct/Nov Paper 5 · Variant 1
0972/51/O/N/23 · 4 questions · 40 marks · ≈45 min
The question paper and its mark scheme, free to read here and free to download. This is Cambridge’s own paper, exactly as it was sat.
Question paper12 pages


Mark scheme8 pages
Answers below. Sit the paper first if you are practising.
Questions as text
Q1 · In this experiment, you will determine the weight of a metre ruler using a balancing…
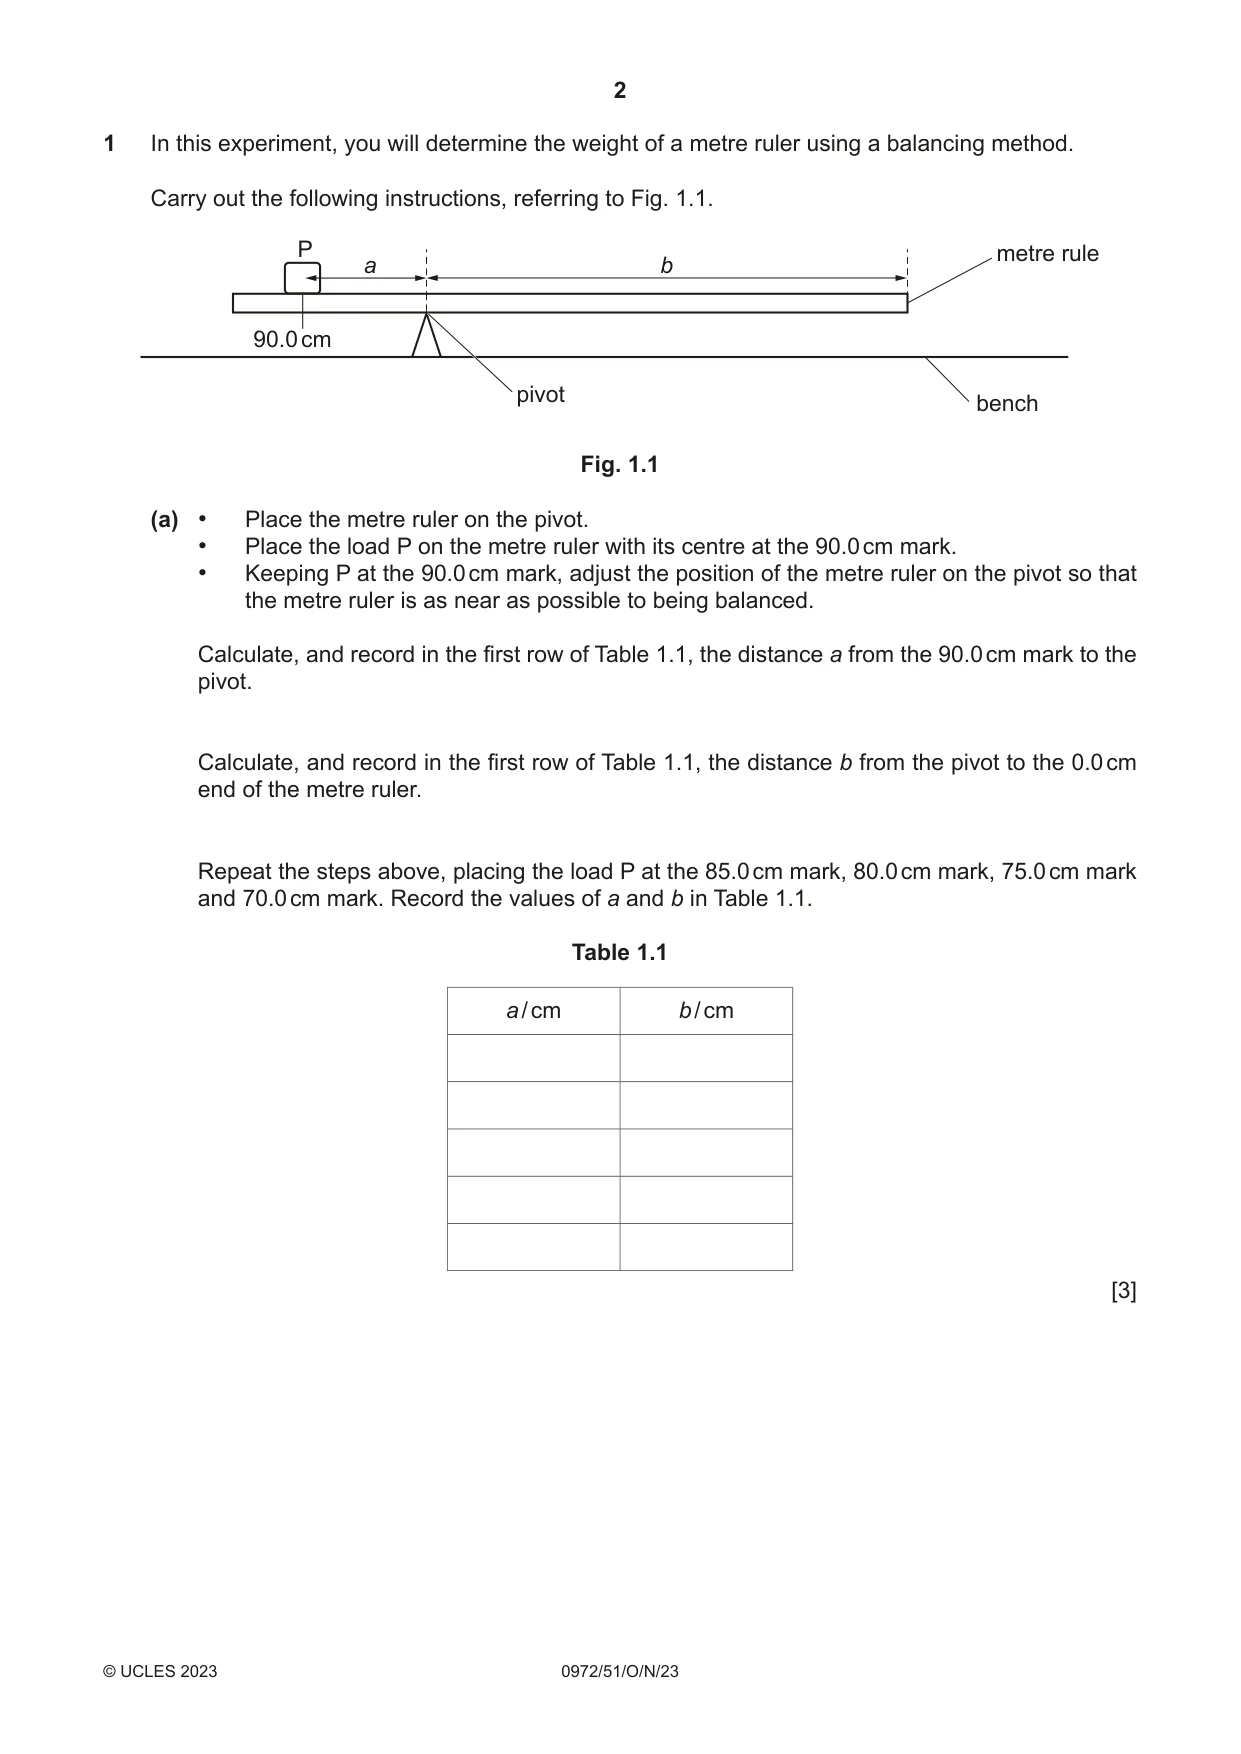
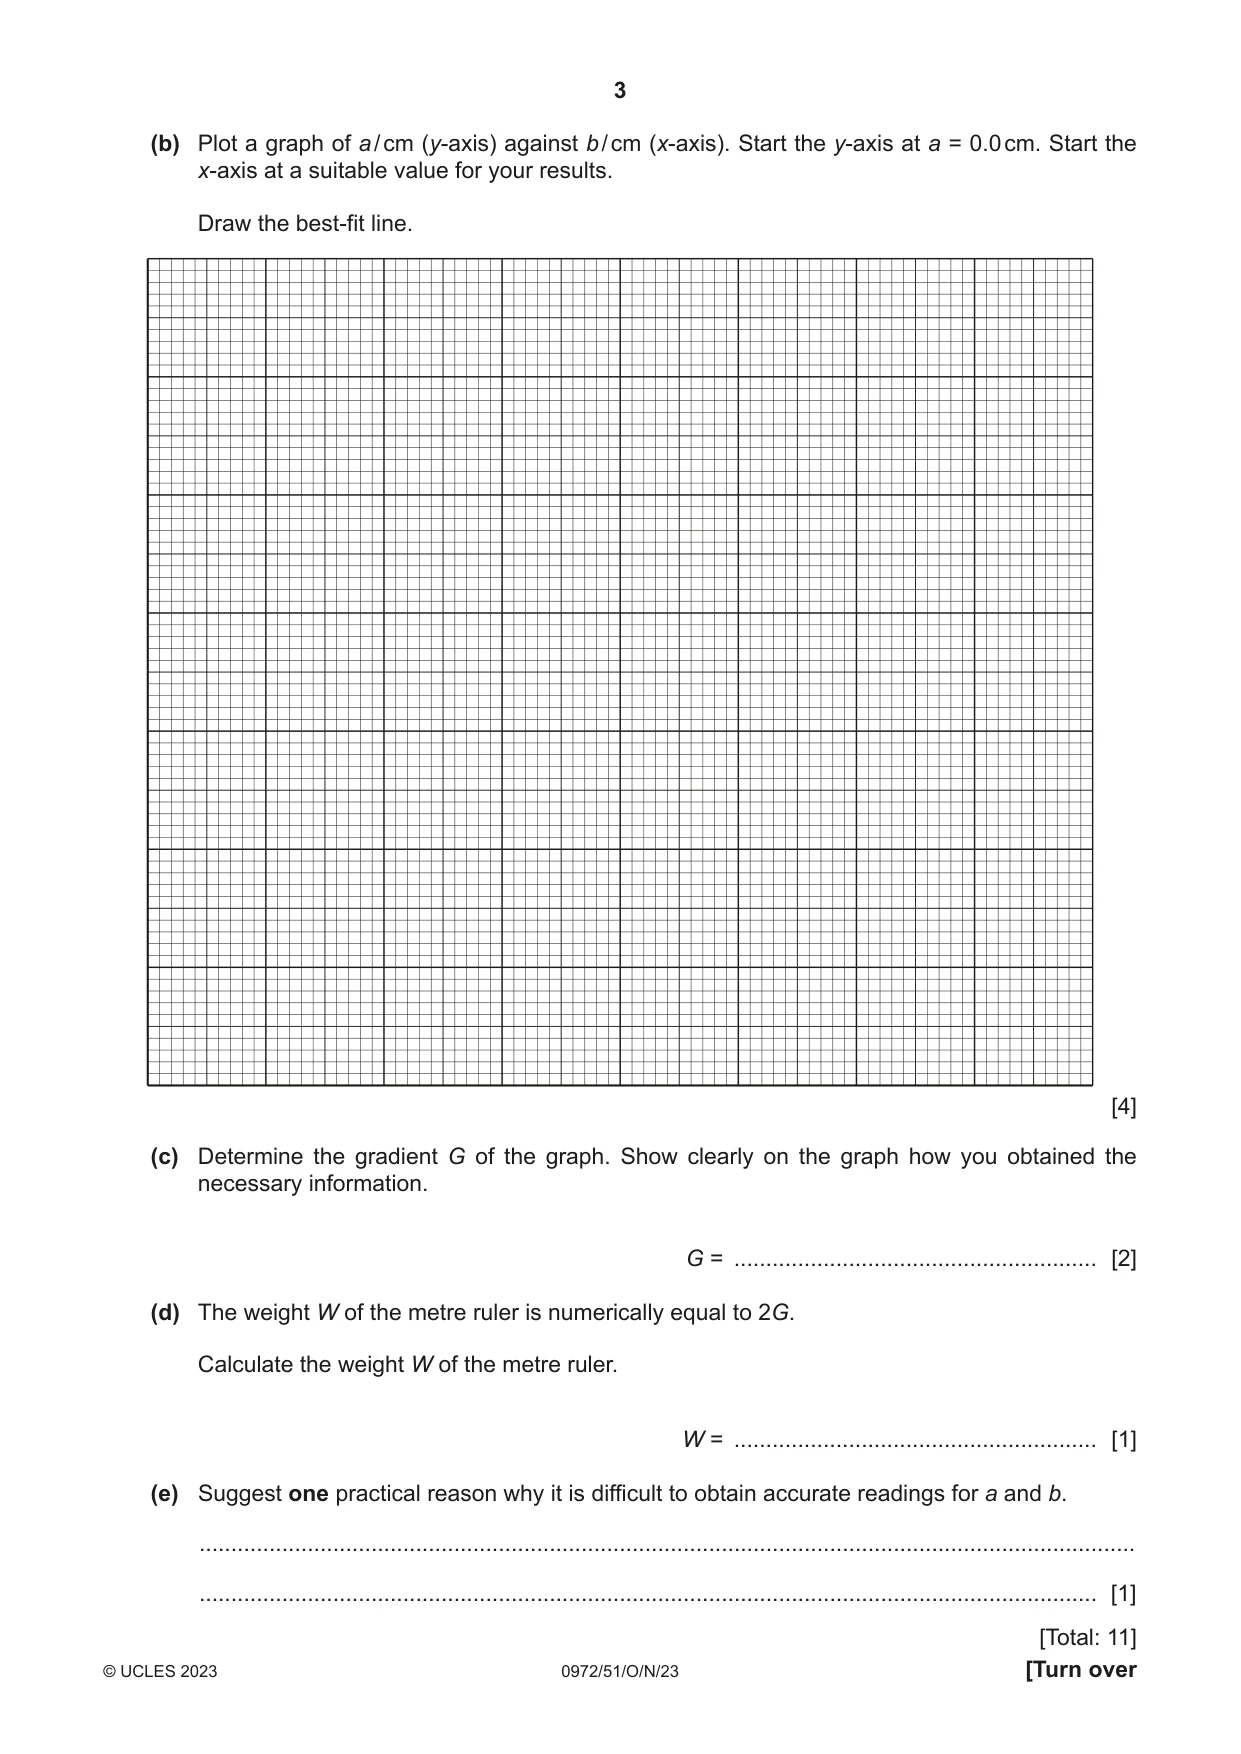
1 In this experiment, you will determine the weight of a metre ruler using a balancing method. Carry out the following instructions, referring to Fig. 1.1. P metre rule a b 90.0 cm pivot bench Fig. 1.1 (a) • Place the metre ruler on the pivot. • Place the load P on the metre ruler with its centre at the 90.0 cm mark. • Keeping P at the 90.0 cm mark, adjust the position of the metre ruler on the pivot so that the metre ruler is as near as possible to being balanced. Calculate, and record in the first row of Table 1.1, the distance a from the 90.0 cm mark to the pivot. Calculate, and record in the first row of Table 1.1, the distance b from the pivot to the 0.0 cm end of the metre ruler. Repeat the steps above, placing the load P at the 85.0 cm mark, 80.0 cm mark, 75.0 cm mark and 70.0 cm mark. Record the values of a and b in Table 1.1. Table 1.1 a / cm b / cm [3] (b) Plot a graph of a / cm (y-axis) against b / cm (x-axis). Start the y-axis at a = 0.0 cm. Start the x-axis at a suitable value for your results. Draw the best-fit line. [4] (c) Determine the gradient G of the graph. Show clearly on the graph how you obtained the necessary information. G = ......................................................... [2] (d) The weight W of the metre ruler is numerically equal to 2G. Calculate the weight W of the metre ruler. W = ......................................................... [1] (e) Suggest one practical reason why it is difficult to obtain accurate readings for a and b. ................................................................................................................................................... ............................................................................................................................................. [1] [Total: 11]
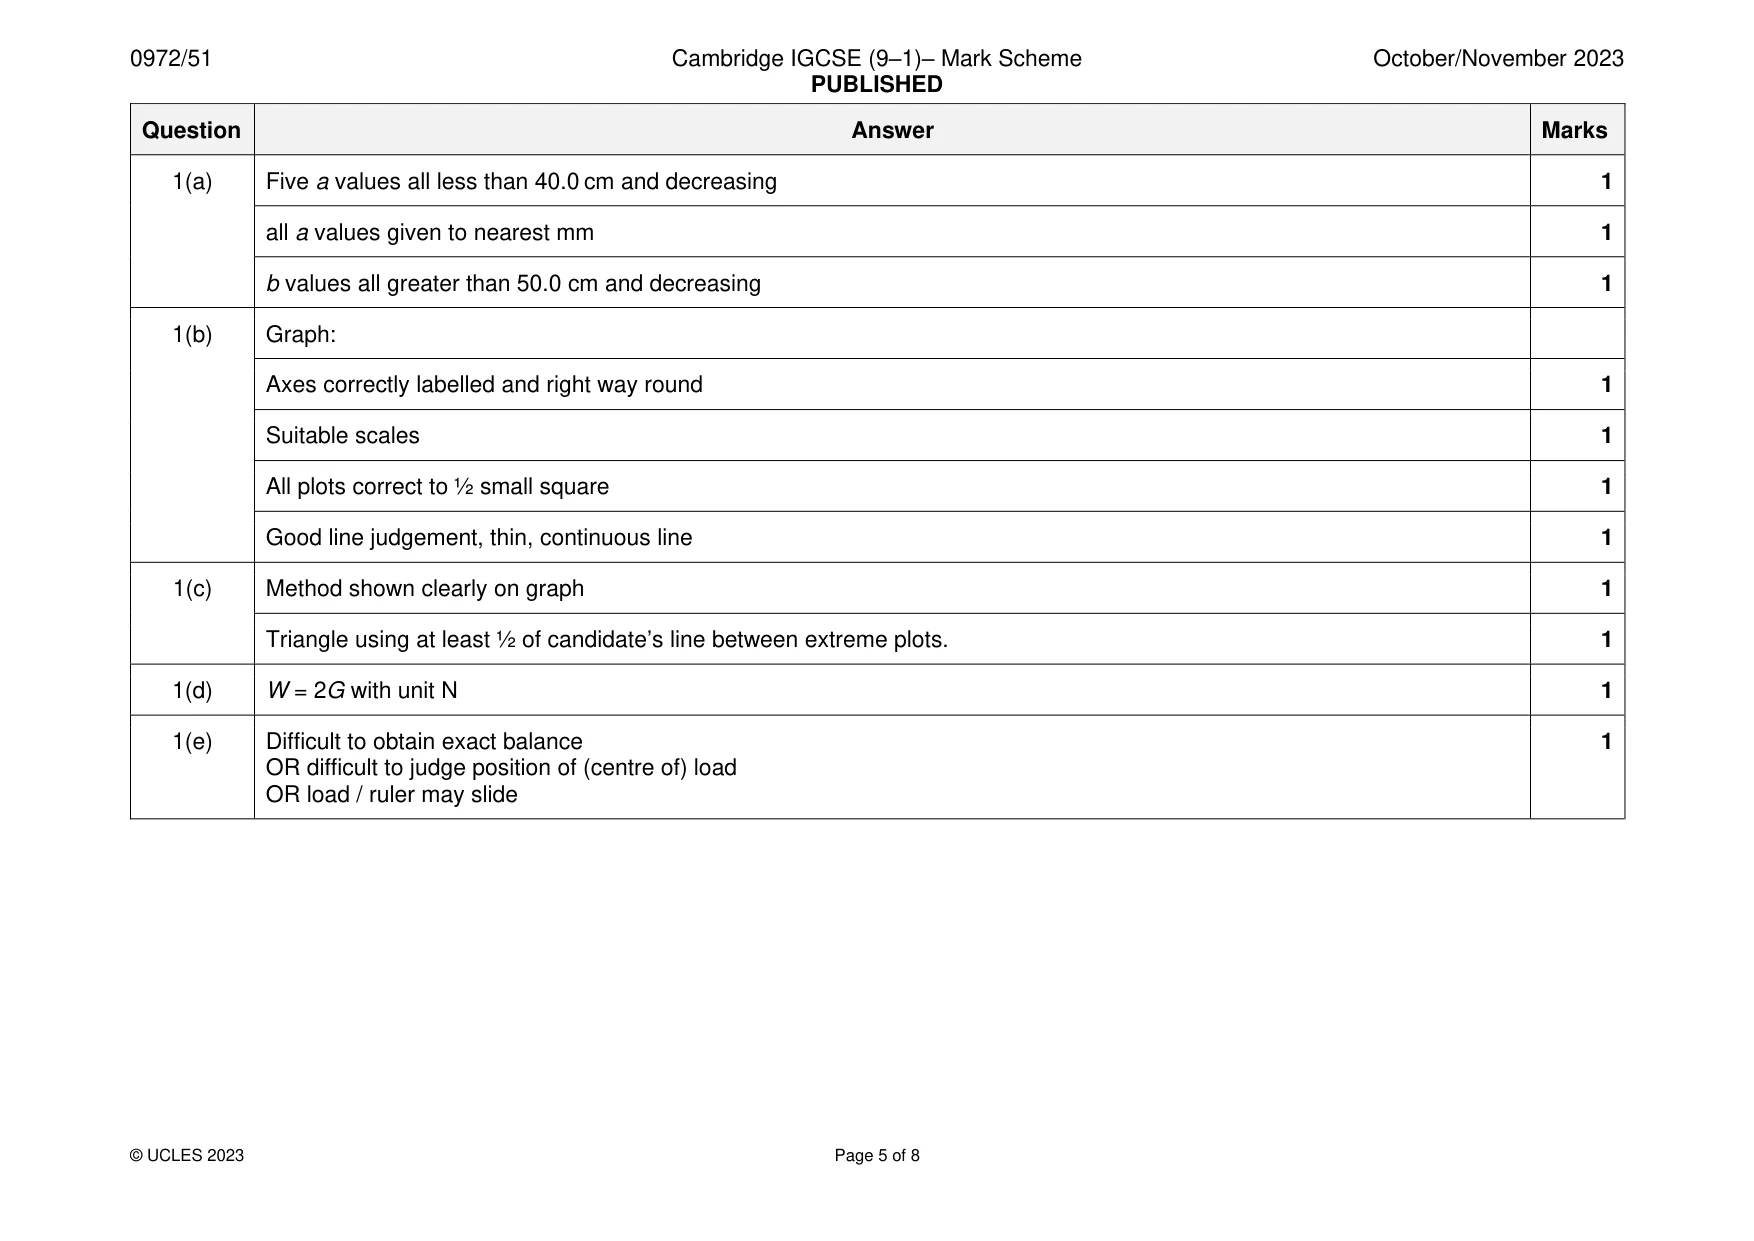
Mark scheme: Question Answer Marks 1(a) Five a values all less than 40.0 cm and decreasing 1 all a values given to nearest mm 1 b values all greater than 50.0 cm and decreasing 1 1(b) Graph: Axes correctly labelled and right way round 1 Suitable scales 1 All plots correct to ½ small square 1 Good line judgement, thin, continuous line 1 1(c) Method shown clearly on graph 1 Triangle using at least ½ of candidate’s line between extreme plots. 1 1(d) W = 2G with unit N 1 1(e) Difficult to obtain exact balance 1 OR difficult to judge position of (centre of) load OR load / ruler may slide
Q2 · In this experiment, you will investigate the resistance of a resistance wire
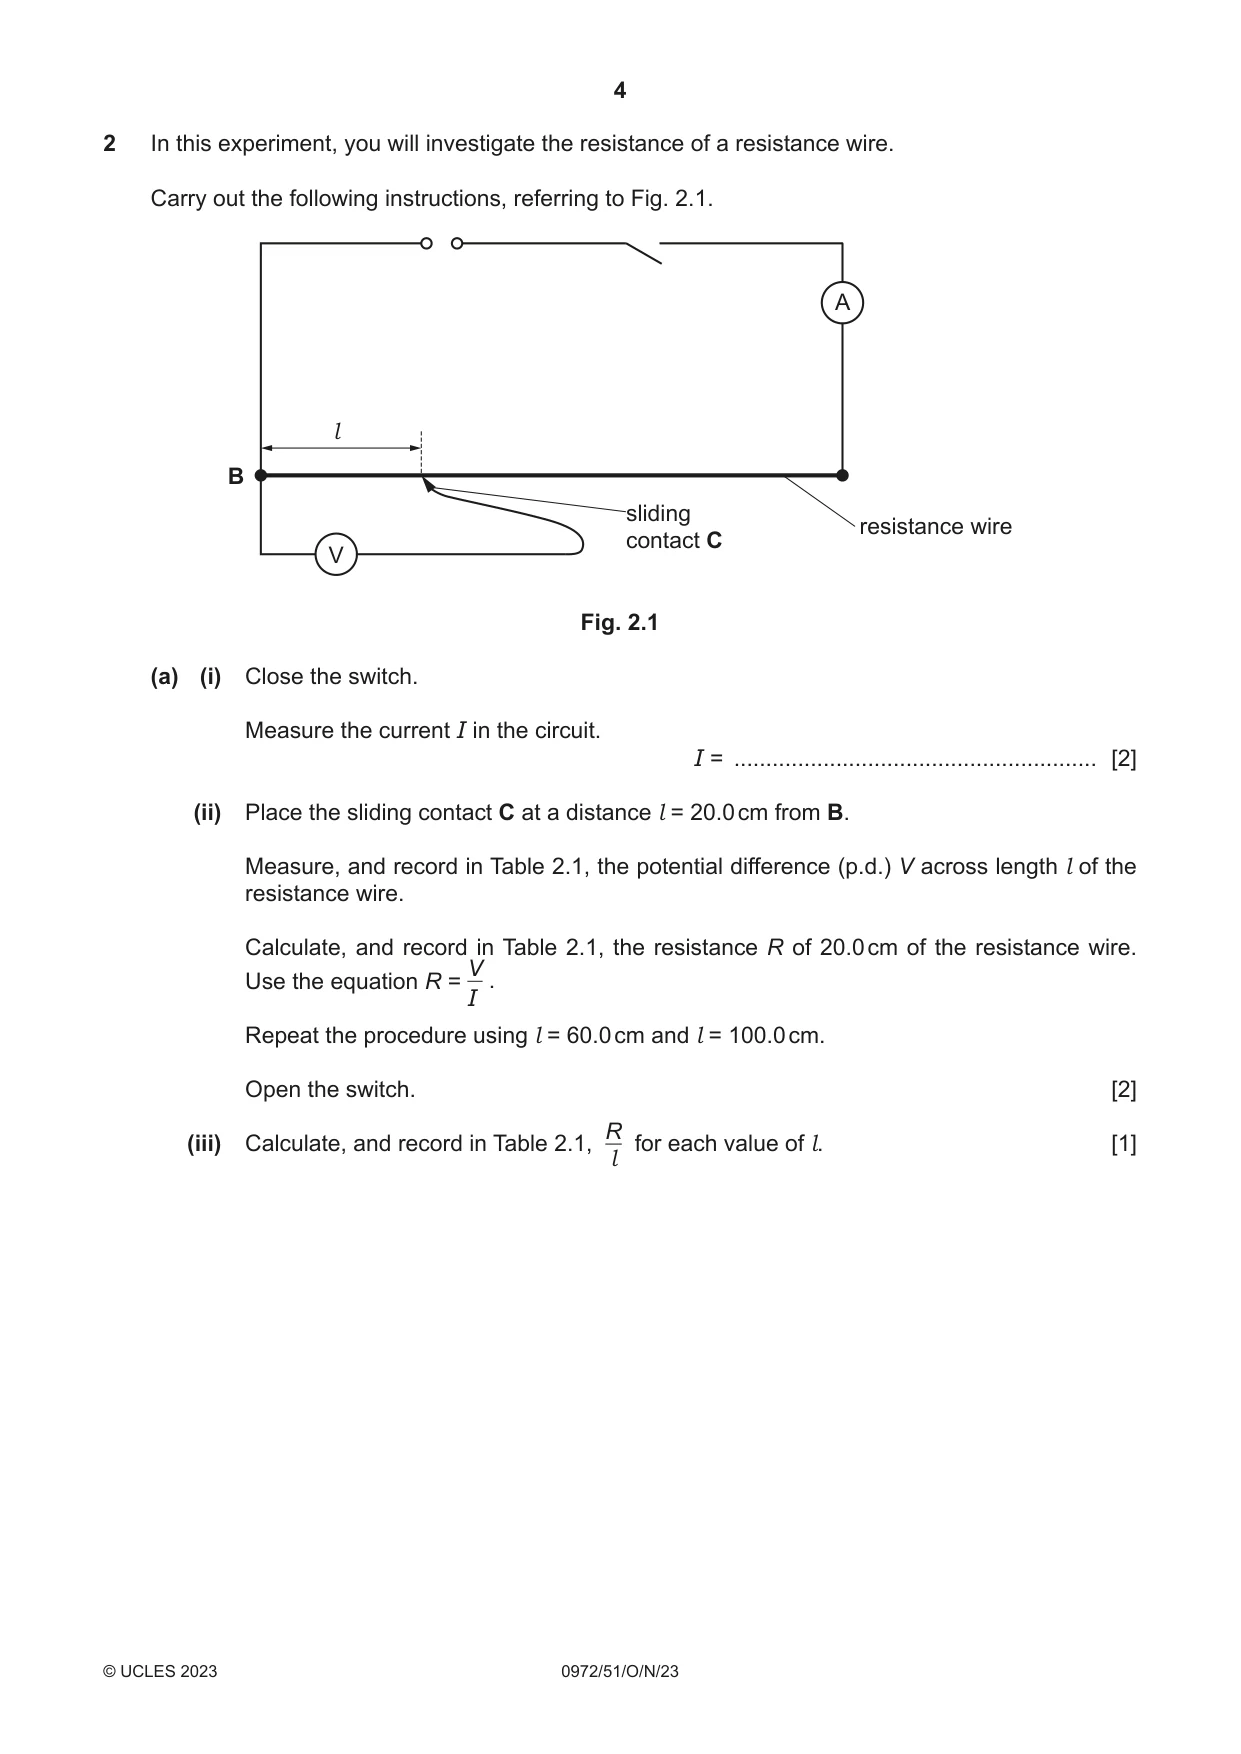
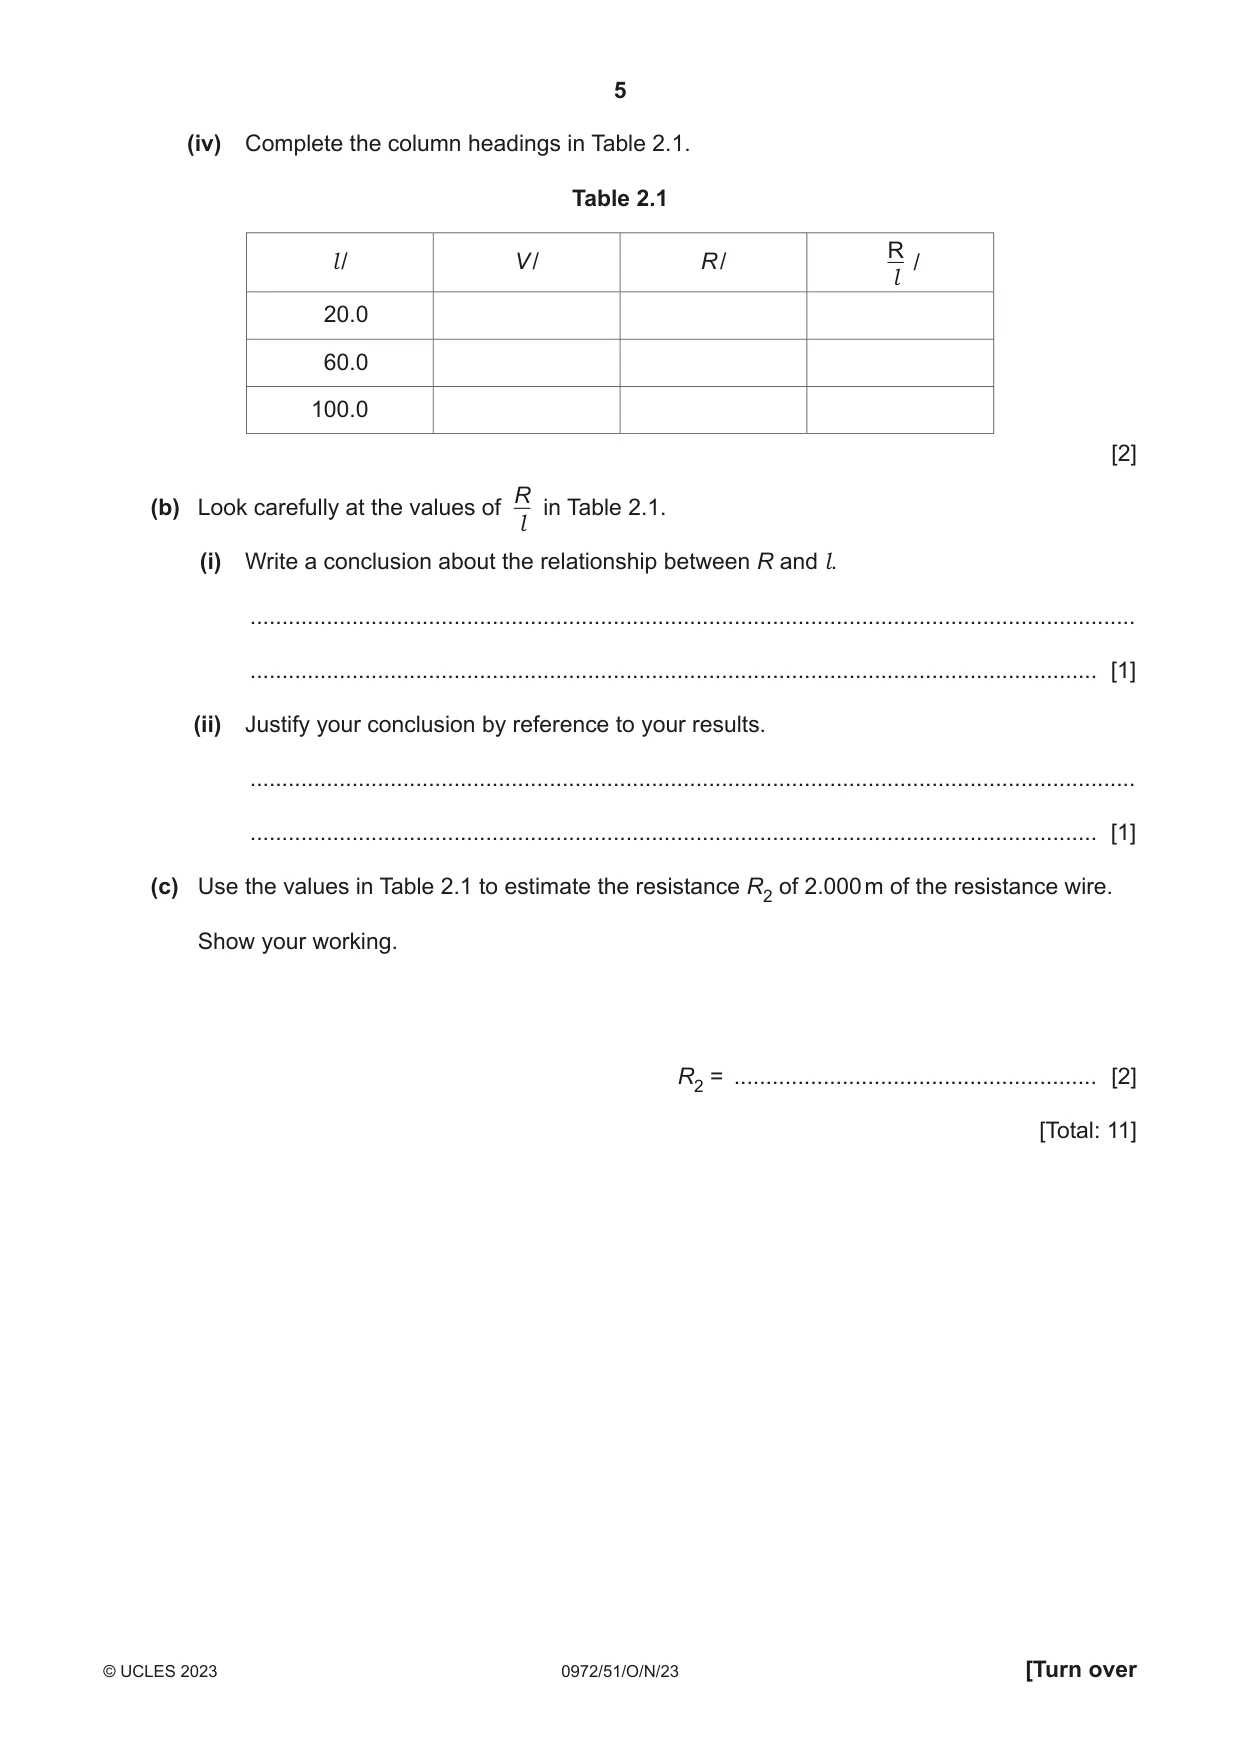
2 In this experiment, you will investigate the resistance of a resistance wire. Carry out the following instructions, referring to Fig. 2.1. A l B sliding resistance wire contact C V Fig. 2.1 (a) (i) Close the switch. Measure the current I in the circuit. I = ......................................................... [2] (ii) Place the sliding contact C at a distance l = 20.0 cm from B. Measure, and record in Table 2.1, the potential difference (p.d.) V across length l of the resistance wire. Calculate, and record in Table 2.1, the resistance R of 20.0 cm of the resistance wire. V Use the equation R = . I Repeat the procedure using l = 60.0 cm and l = 100.0 cm. Open the switch. [2] R (iii) Calculate, and record in Table 2.1, for each value of l. [1] l (iv) Complete the column headings in Table 2.1. Table 2.1 R l / V / R / / l 20.0 60.0 100.0 [2] R(b) Look carefully at the values of in Table 2.1. l (i) Write a conclusion about the relationship between R and l. ........................................................................................................................................... ..................................................................................................................................... [1] (ii) Justify your conclusion by reference to your results. ........................................................................................................................................... ..................................................................................................................................... [1] (c) Use the values in Table 2.1 to estimate the resistance R2 of 2.000 m of the resistance wire. Show your working. R2 = ......................................................... [2] [Total: 11]
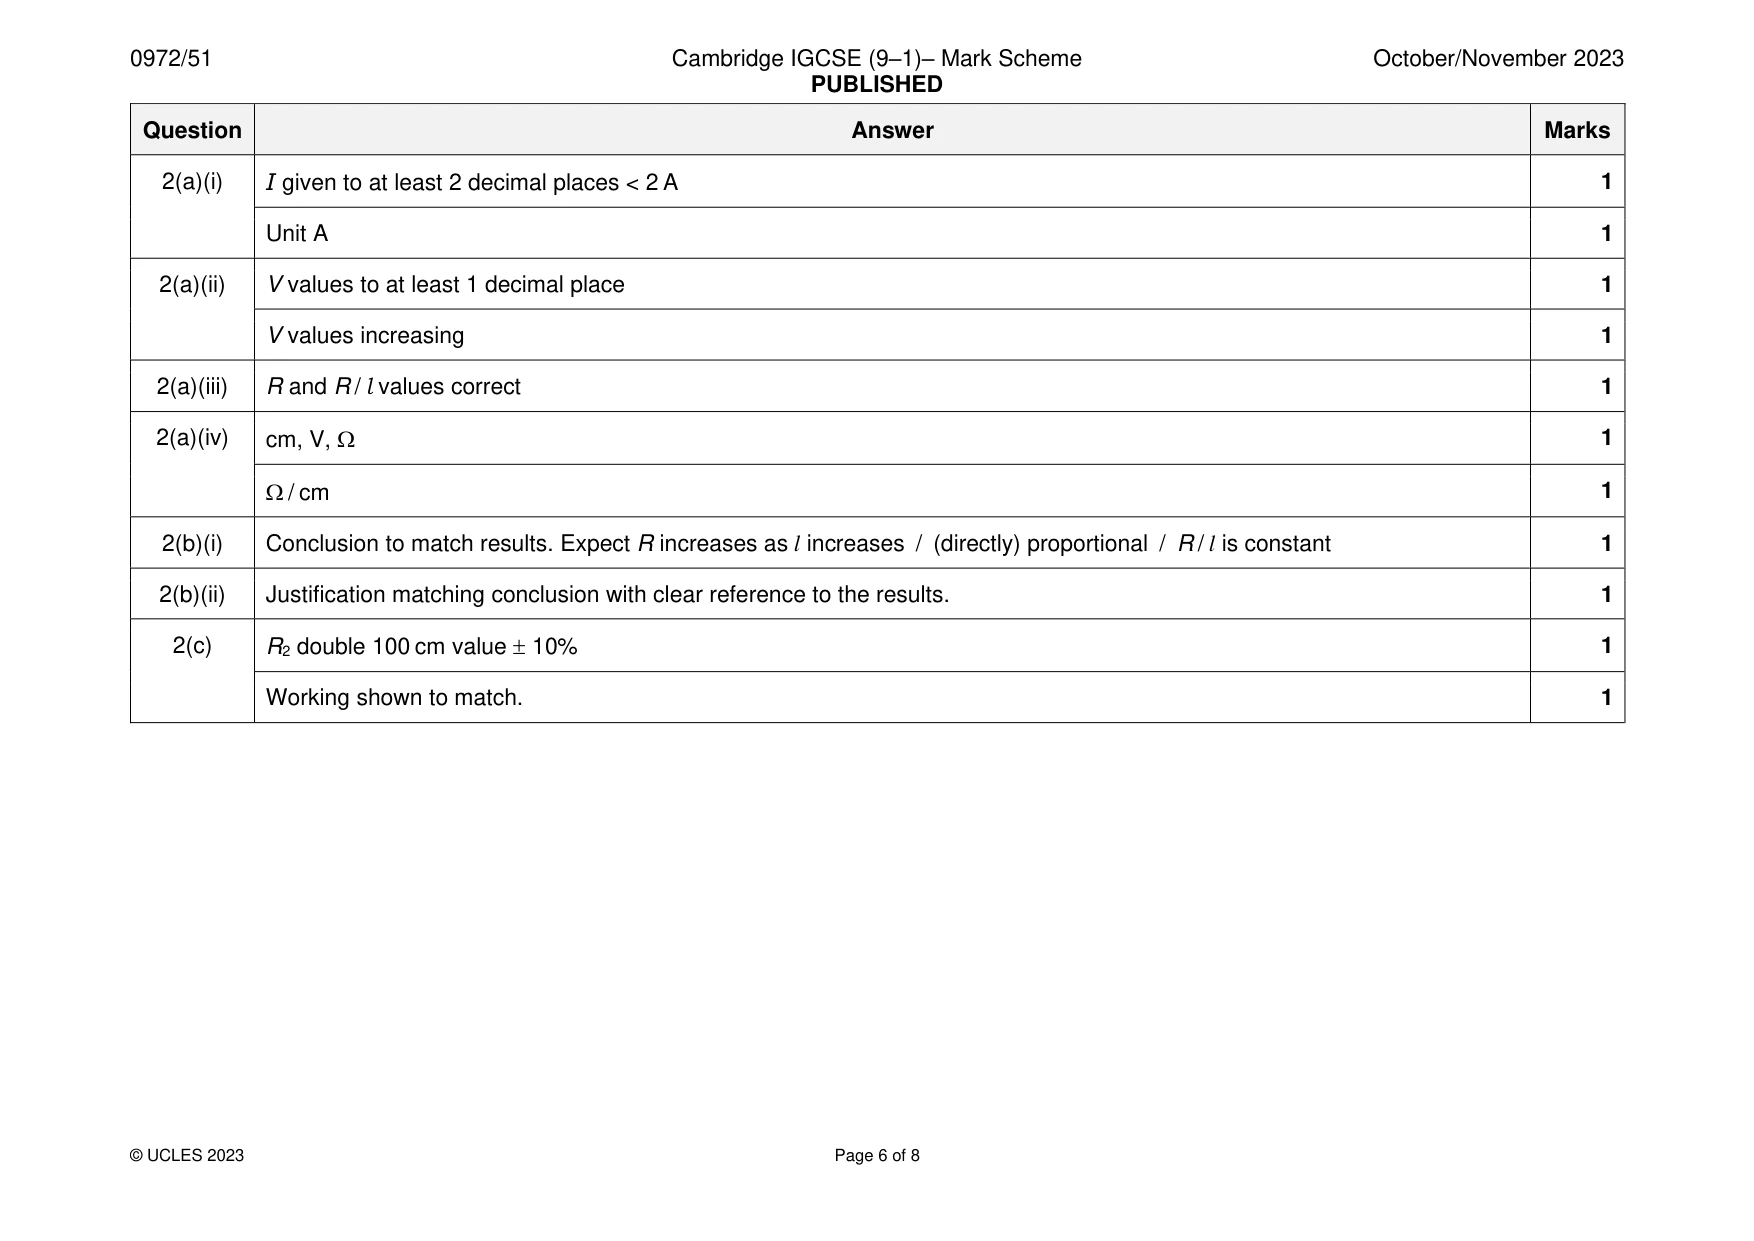
Mark scheme: 2(a)(i) I given to at least 2 decimal places < 2 A 1 Unit A 1 2(a)(ii) V values to at least 1 decimal place 1 V values increasing 1 2(a)(iii) R and R / l values correct 1 2(a)(iv) cm, V, 1 / cm 1 2(b)(i) Conclusion to match results. Expect R increases as l increases / (directly) proportional / R / l is constant 1 2(b)(ii) Justification matching conclusion with clear reference to the results. 1 2(c) R2 double 100 cm value 10% 1 Working shown to match. 1
Q3 · In this experiment, you will investigate the magnification of the image produced by a lens
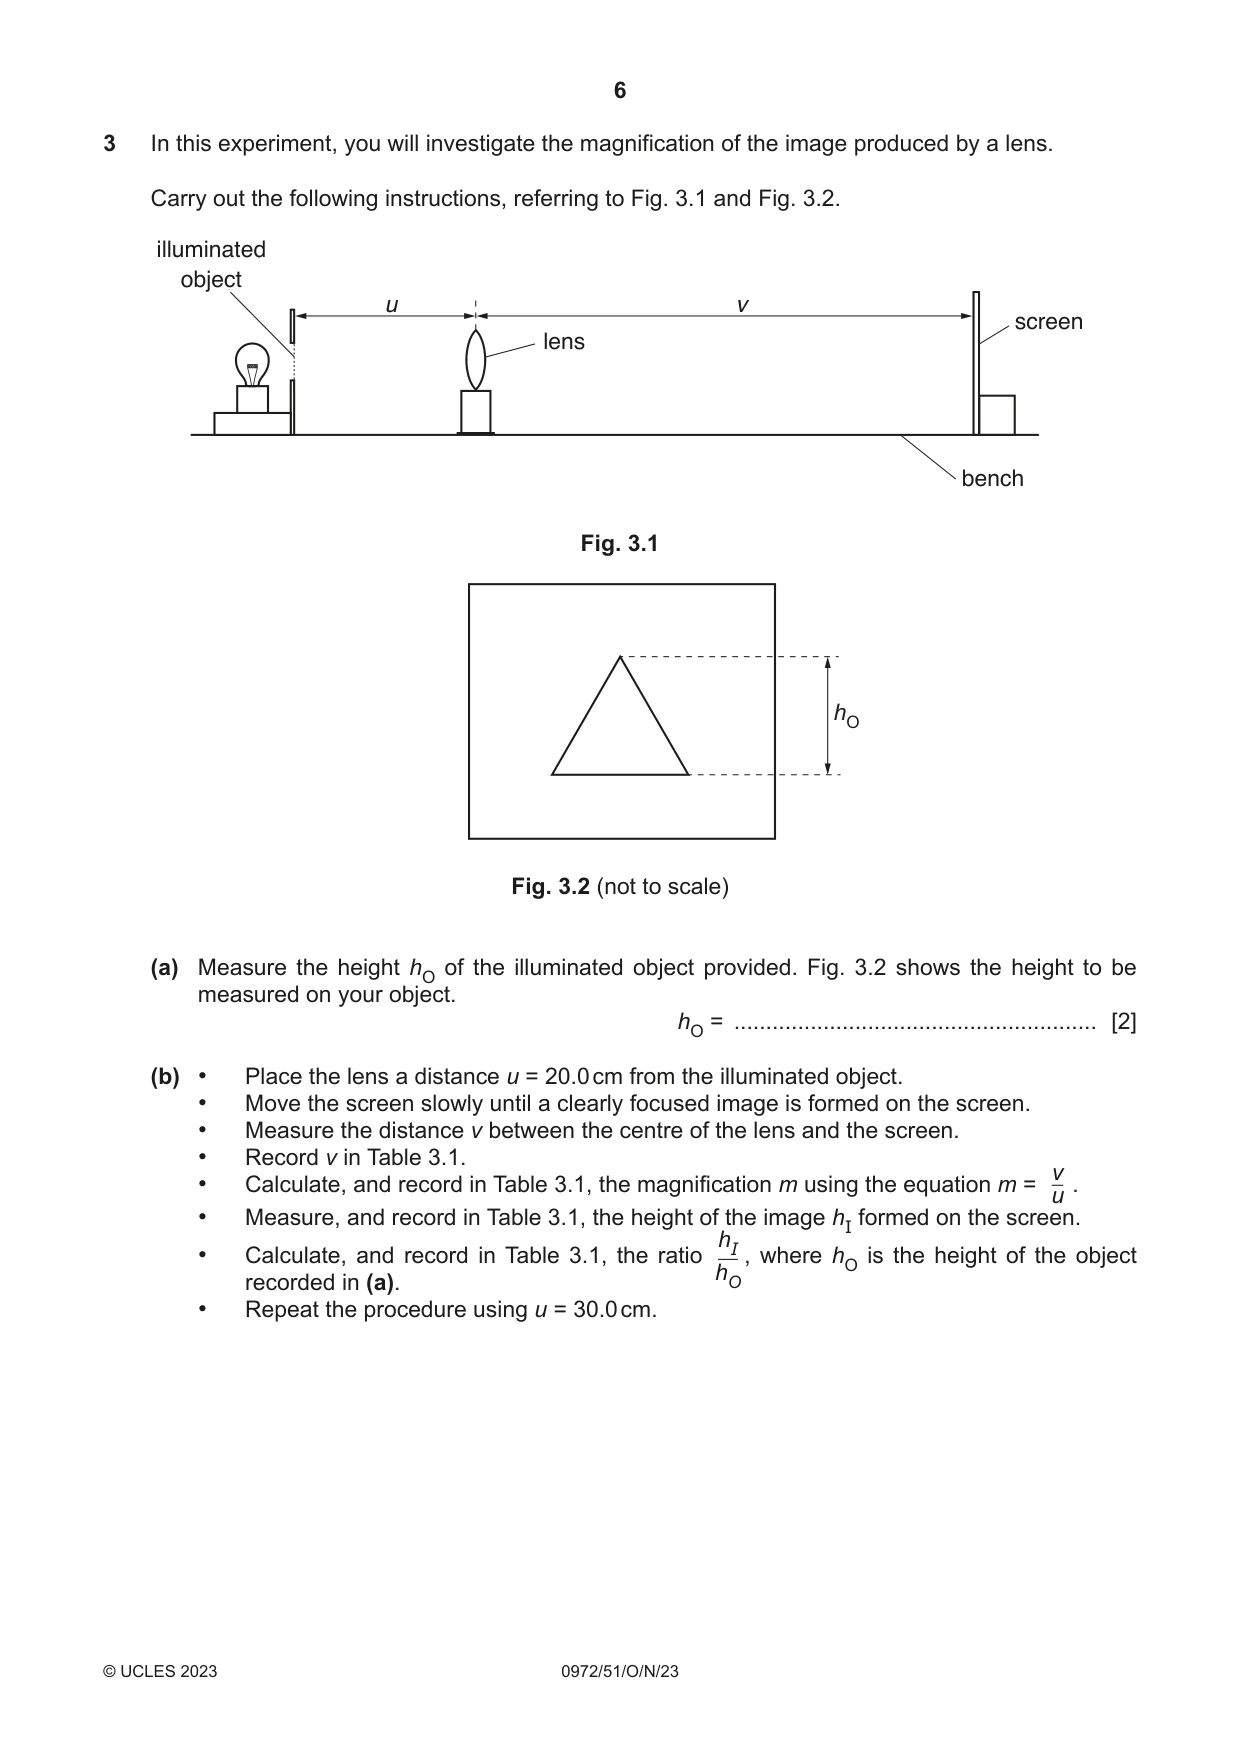
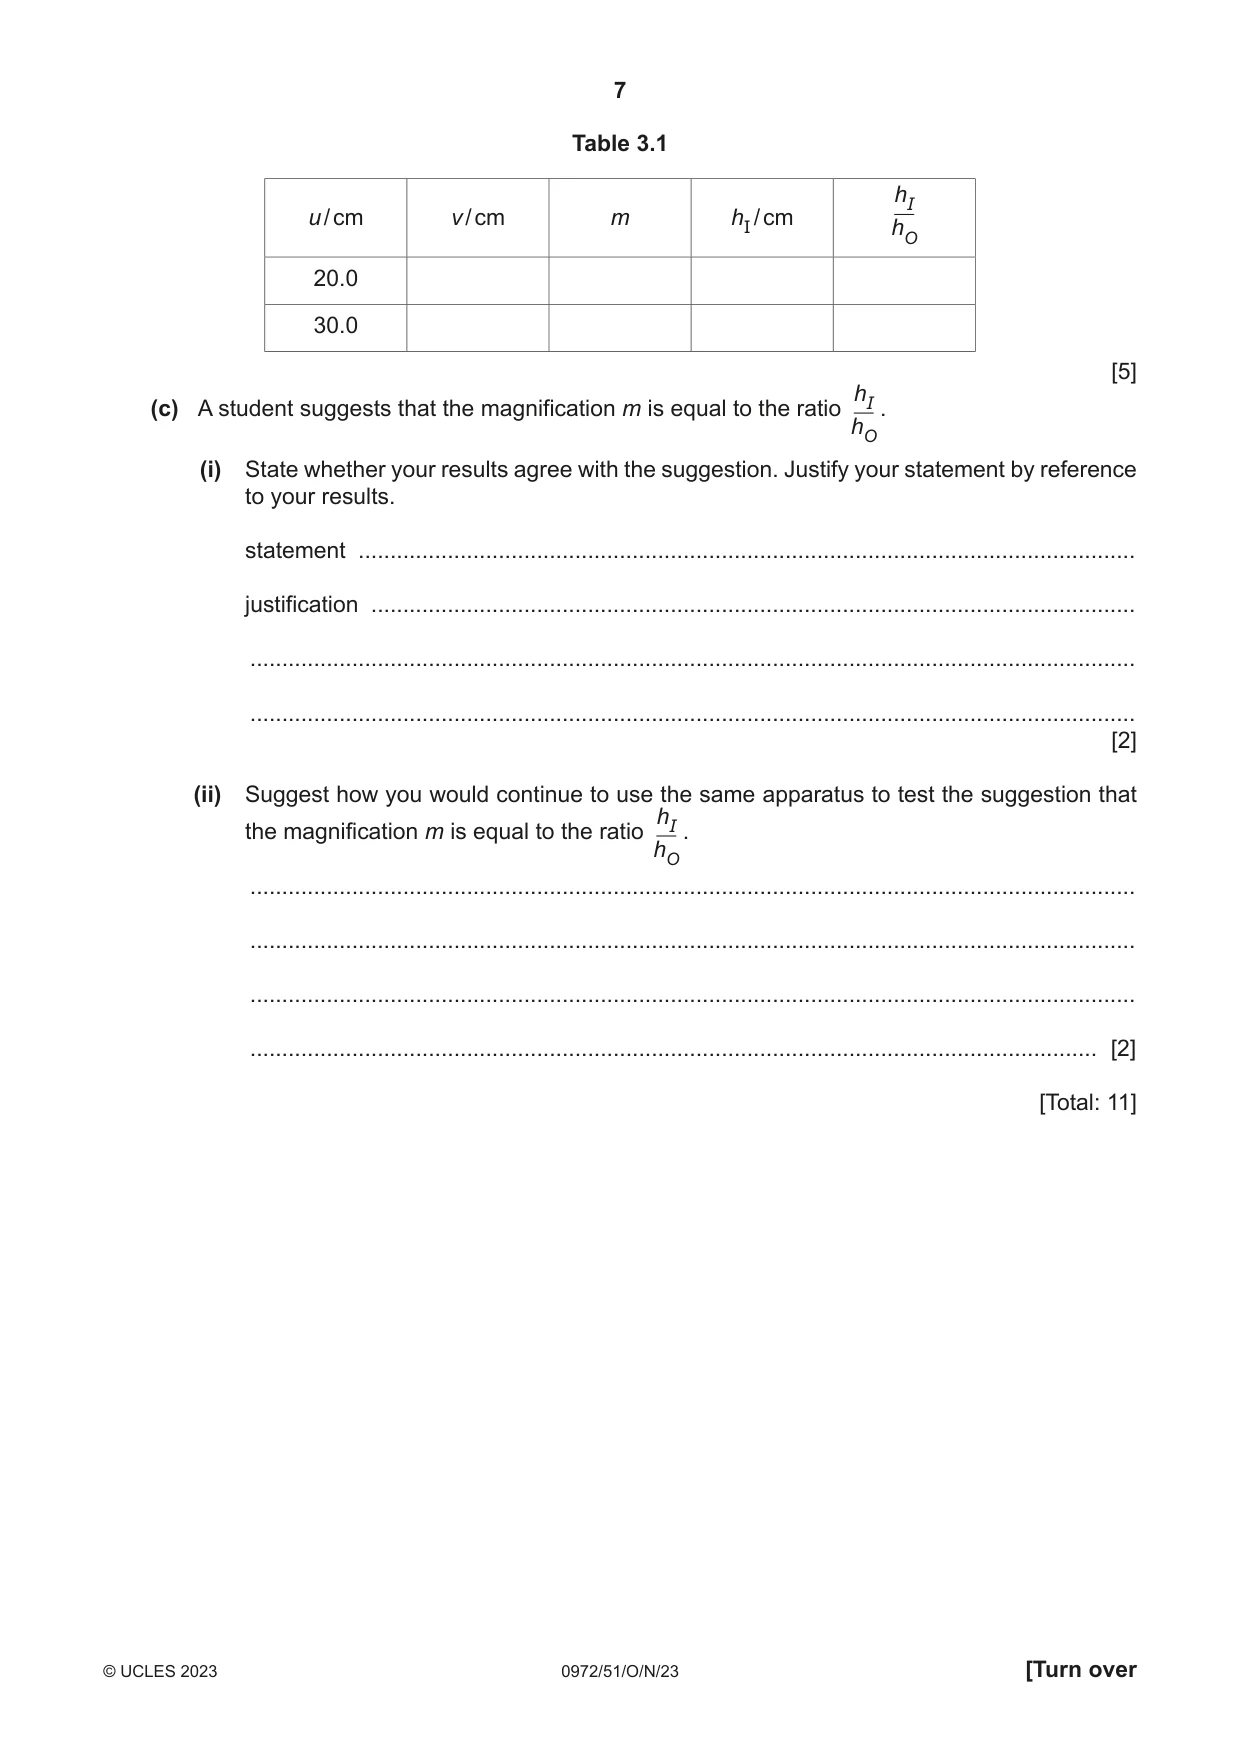
3 In this experiment, you will investigate the magnification of the image produced by a lens. Carry out the following instructions, referring to Fig. 3.1 and Fig. 3.2. illuminated object u v screen lens bench Fig. 3.1 hO Fig. 3.2 (not to scale) (a) Measure the height hO of the illuminated object provided. Fig. 3.2 shows the height to be measured on your object. hO = ......................................................... [2] (b) • Place the lens a distance u = 20.0 cm from the illuminated object. • Move the screen slowly until a clearly focused image is formed on the screen. • Measure the distance v between the centre of the lens and the screen. • Record v in Table 3.1. v • Calculate, and record in Table 3.1, the magnification m using the equation m = . u • Measure, and record in Table 3.1, the height of the image hI formed on the screen. hI • Calculate, and record in Table 3.1, the ratio , where hO is the height of the object recorded in (a). hO • Repeat the procedure using u = 30.0 cm. Table 3.1 hI u / cm v / cm m hI / cm hO 20.0 30.0 [5] hI(c) A student suggests that the magnification m is equal to the ratio . hO (i) State whether your results agree with the suggestion. Justify your statement by reference to your results. statement .......................................................................................................................... justification ........................................................................................................................ ........................................................................................................................................... ........................................................................................................................................... [2] (ii) Suggest how you would continue to use the same apparatus to test the suggestion that hI the magnification m is equal to the ratio . hO ........................................................................................................................................... ........................................................................................................................................... ........................................................................................................................................... ..................................................................................................................................... [2] [Total: 11]
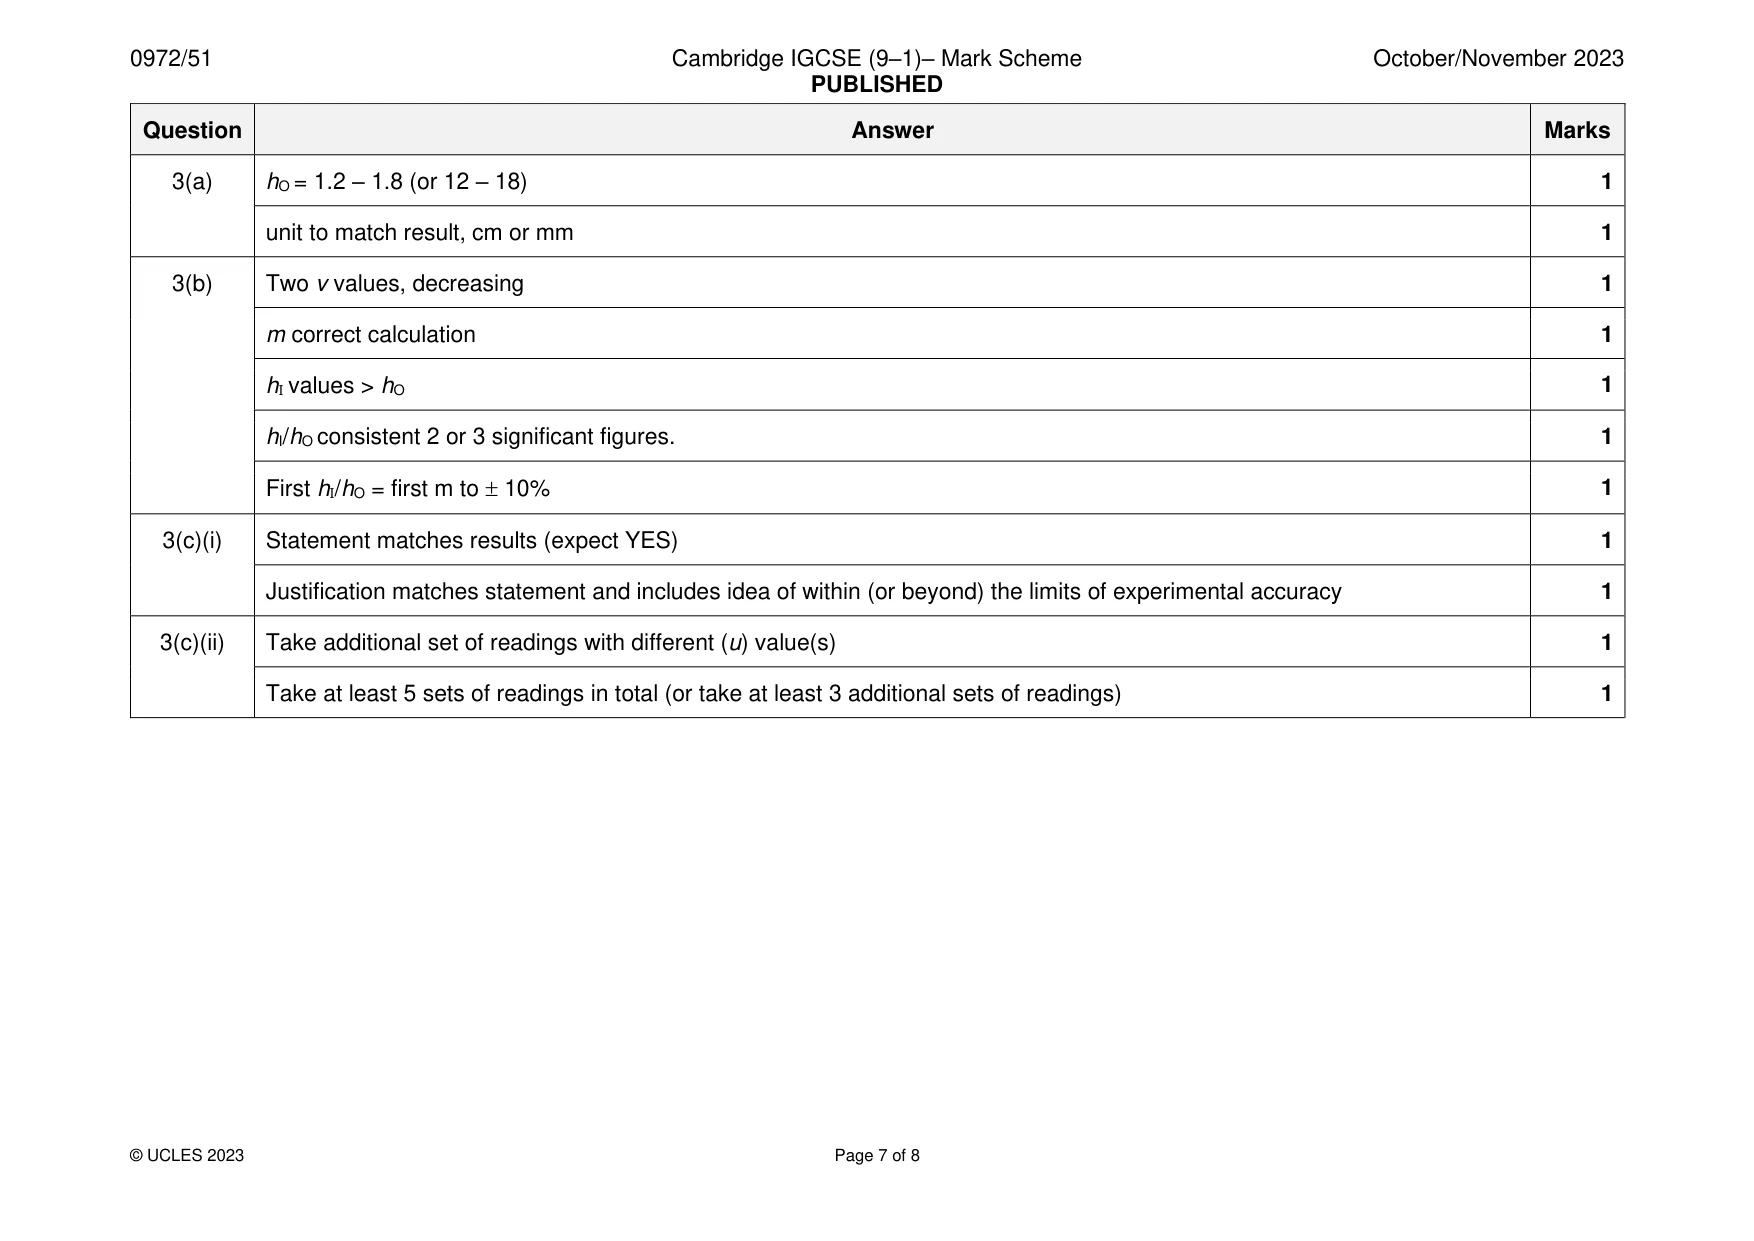
Mark scheme: 3(a) hO = 1.2 – 1.8 (or 12 – 18) 1 unit to match result, cm or mm 1 3(b) Two v values, decreasing 1 m correct calculation 1 hI values > hO 1 hI/hO consistent 2 or 3 significant figures. 1 First hI/hO = first m to 10% 1 3(c)(i) Statement matches results (expect YES) 1 Justification matches statement and includes idea of within (or beyond) the limits of experimental accuracy 1 3(c)(ii) Take additional set of readings with different (u) value(s) 1 Take at least 5 sets of readings in total (or take at least 3 additional sets of readings) 1
Q4 · A student investigates the time taken for water to evaporate to dryness when heated from…
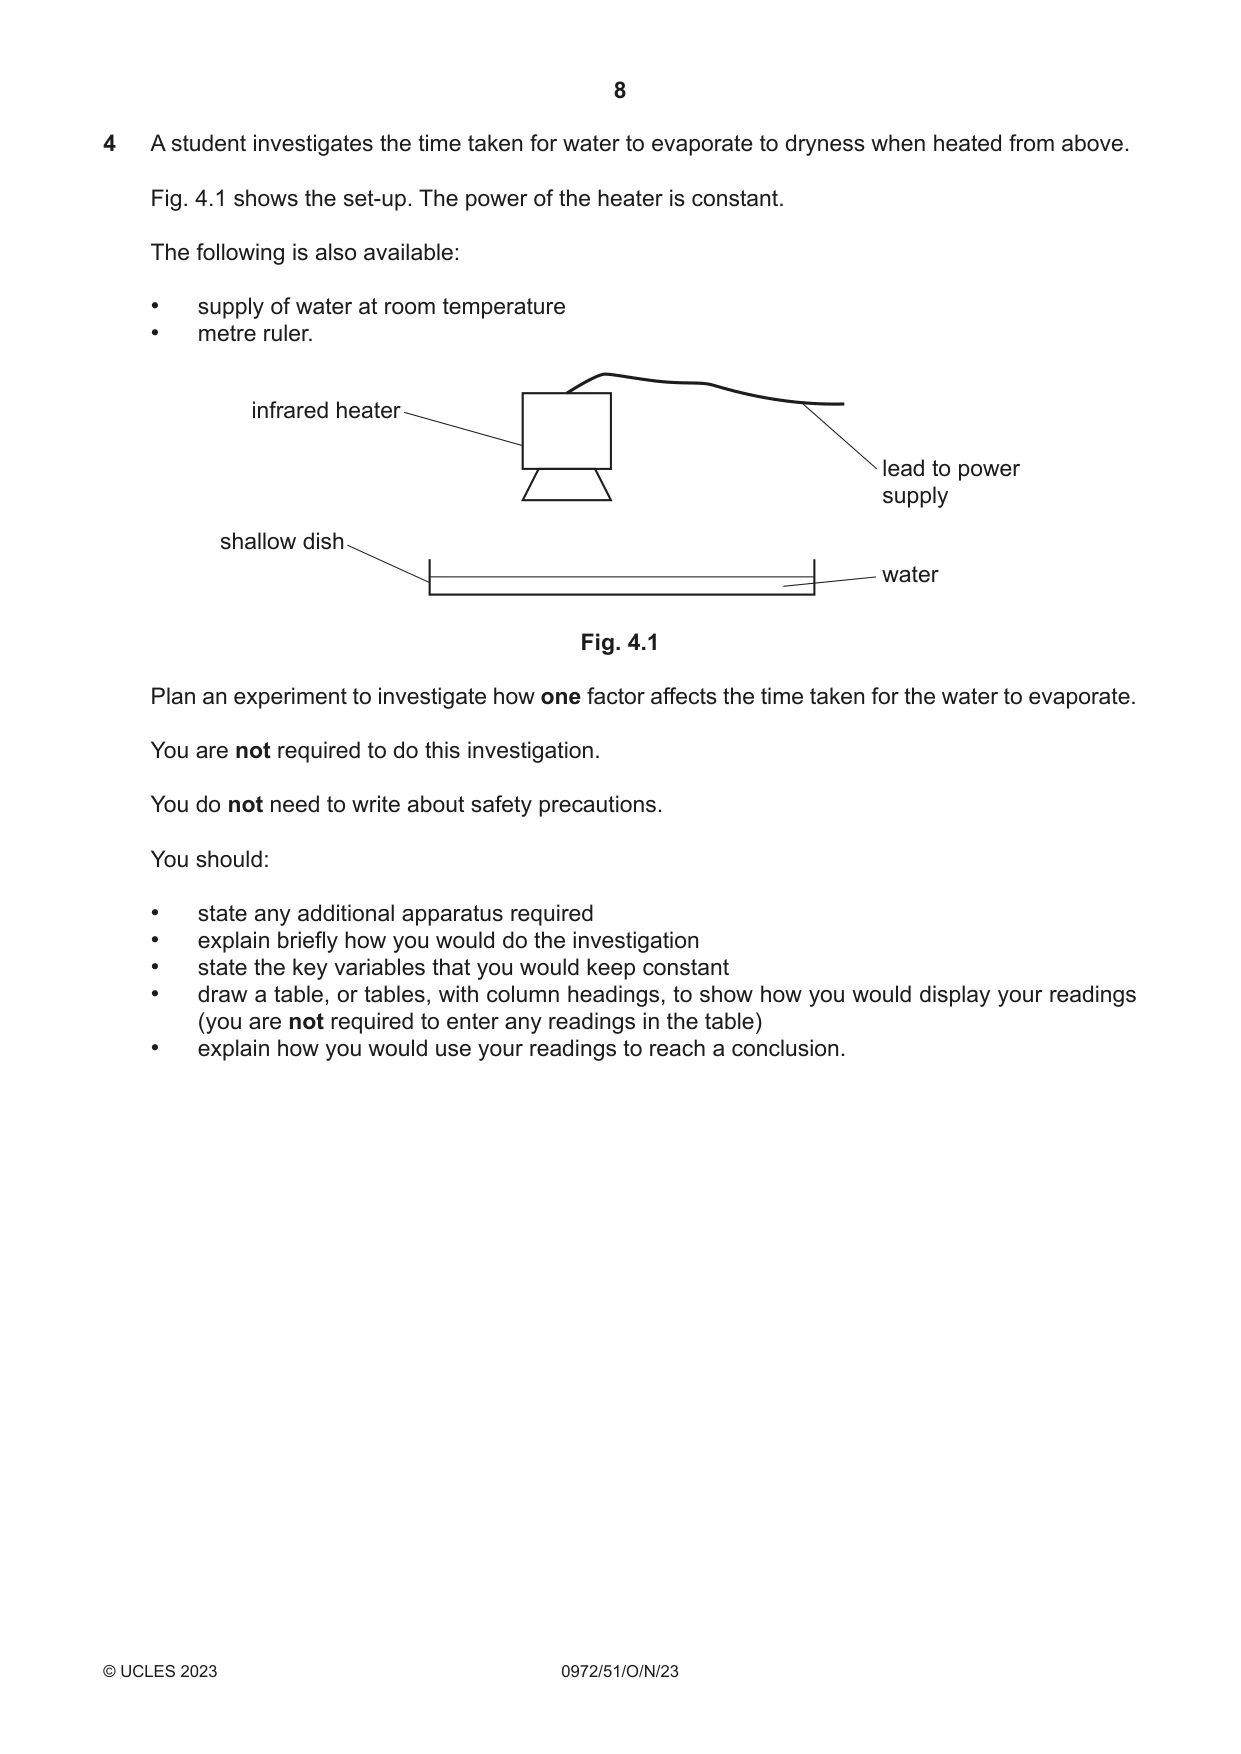
4 A student investigates the time taken for water to evaporate to dryness when heated from above. Fig. 4.1 shows the set-up. The power of the heater is constant. The following is also available: • supply of water at room temperature • metre ruler. infrared heater lead to power supply shallow dish water Fig. 4.1 Plan an experiment to investigate how one factor affects the time taken for the water to evaporate. You are not required to do this investigation. You do not need to write about safety precautions. You should: • state any additional apparatus required • explain briefly how you would do the investigation • state the key variables that you would keep constant • draw a table, or tables, with column headings, to show how you would display your readings (you are not required to enter any readings in the table) • explain how you would use your readings to reach a conclusion. .......................................................................................................................................................... .......................................................................................................................................................... .......................................................................................................................................................... .......................................................................................................................................................... .......................................................................................................................................................... .......................................................................................................................................................... .......................................................................................................................................................... .......................................................................................................................................................... .......................................................................................................................................................... .......................................................................................................................................................... .......................................................................................................................................................... .......................................................................................................................................................... .......................................................................................................................................................... .......................................................................................................................................................... .......................................................................................................................................................... .......................................................................................................................................................... .......................................................................................................................................................... .......................................................................................................................................................... .......................................................................................................................................................... .................................................................................................................................................... [7]
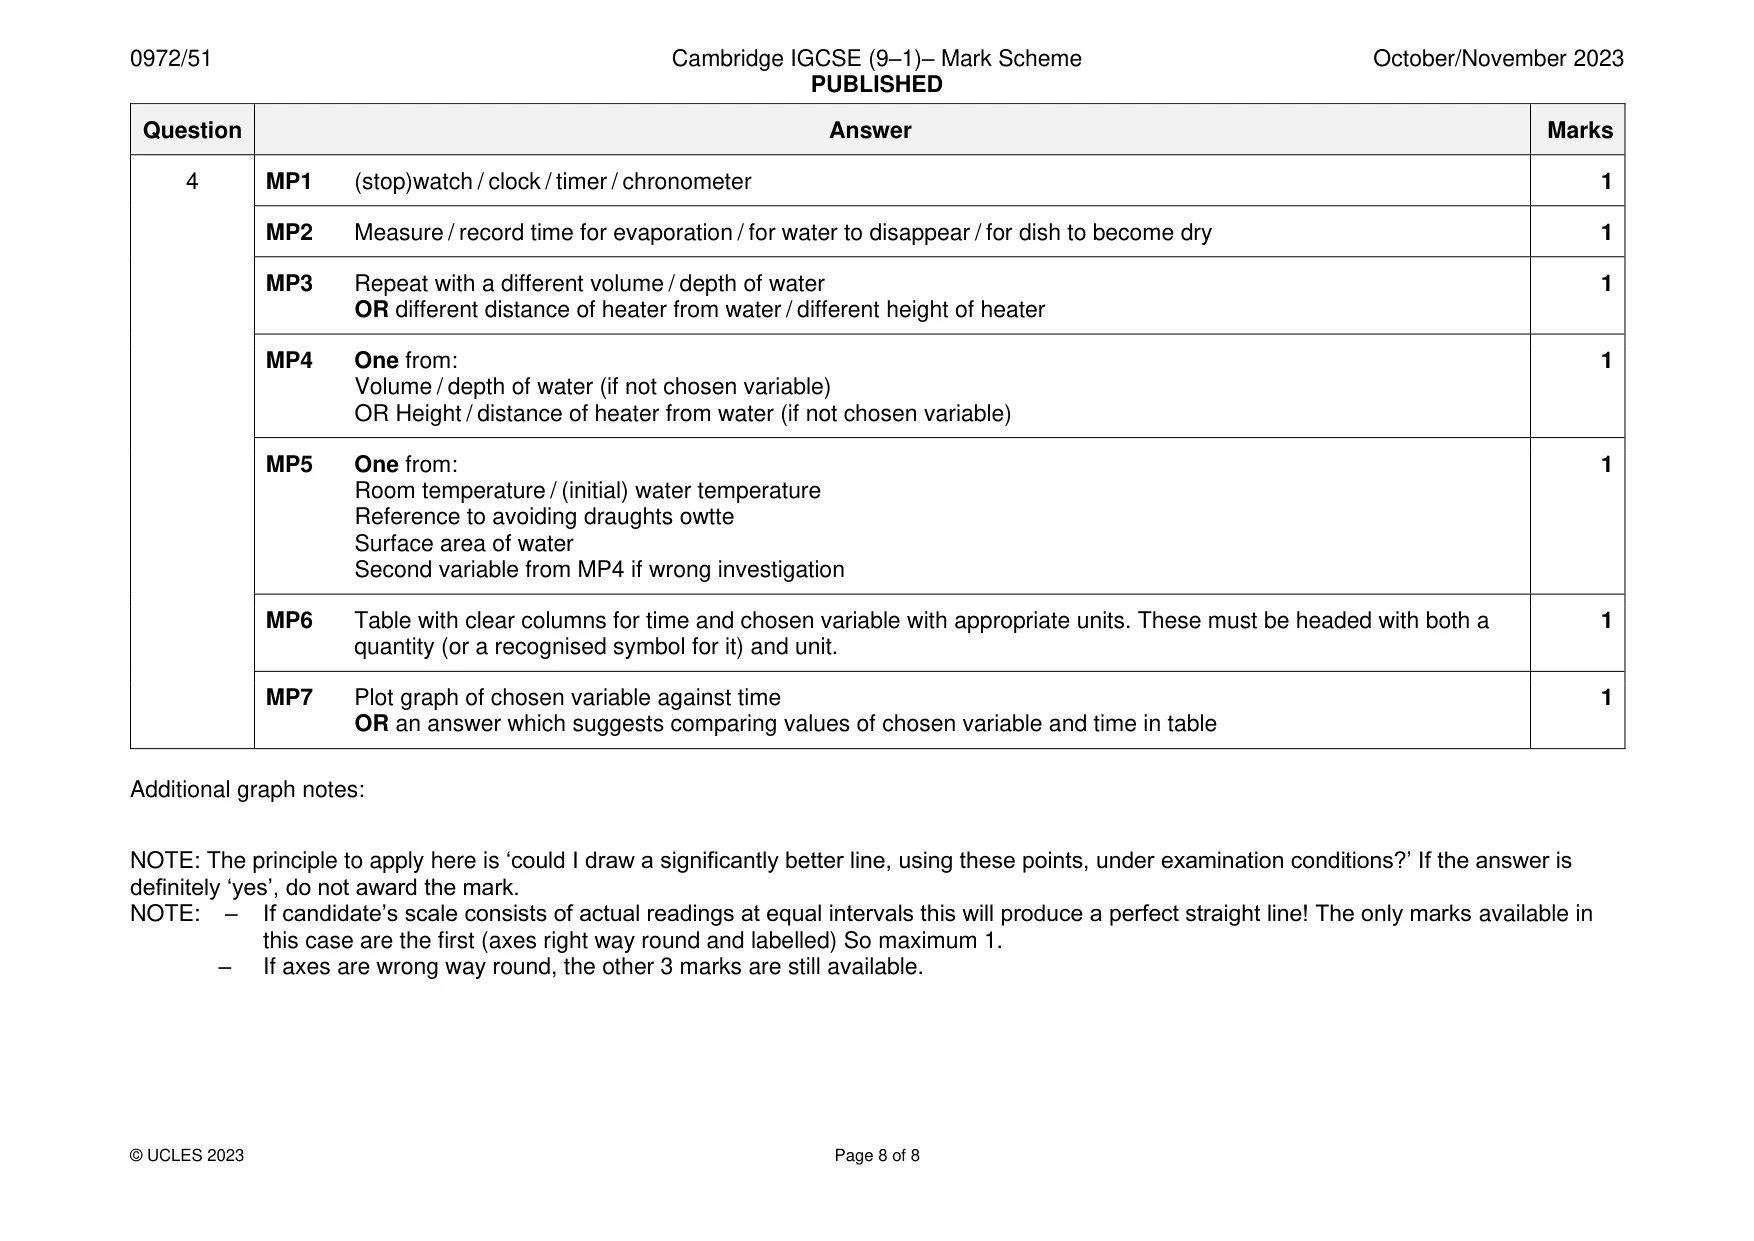
Mark scheme: 4 MP1 (stop)watch / clock / timer / chronometer 1 MP2 Measure / record time for evaporation / for water to disappear / for dish to become dry 1 MP3 Repeat with a different volume / depth of water 1 OR different distance of heater from water / different height of heater MP4 One from: 1 Volume / depth of water (if not chosen variable) OR Height / distance of heater from water (if not chosen variable) MP5 One from: 1 Room temperature / (initial) water temperature Reference to avoiding draughts owtte Surface area of water Second variable from MP4 if wrong investigation MP6 Table with clear columns for time and chosen variable with appropriate units. These must be headed with both a 1 quantity (or a recognised symbol for it) and unit. MP7 Plot graph of chosen variable against time 1 OR an answer which suggests comparing values of chosen variable and time in table Additional graph notes: NOTE: The principle to apply here is ‘could I draw a significantly better line, using these points, under examination conditions?’ If the answer is definitely ‘yes’, do not award the mark. NOTE: – If candidate’s scale consists of actual readings at equal intervals this will produce a perfect straight line! The only marks available in this case are the first (axes right way round and labelled) So maximum 1. – If axes are wrong way round, the other 3 marks are still available.
What was in this paper
The subtopics covered by these 4 questions, and how many questions each got. Open one in a new tab to see every Cambridge question on it.
What you needed in this session
Cambridge’s own grade thresholds for 2023 Oct/Nov, Paper 5 · Variant 1. A higher threshold means an easier paper — the bar moves with how the cohort did.