Cambridge IGCSE Physics (9-1) 0972 — 2019 May/June Paper 6 · Variant 1
0972/61/M/J/19 · 4 questions · 40 marks · ≈45 min
The question paper and its mark scheme, free to read here and free to download. This is Cambridge’s own paper, exactly as it was sat.
Question paper12 pages
Mark scheme7 pages
Answers below. Sit the paper first if you are practising.
Questions as text
Q1 · A student is determining the weight of a metre rule using a balancing method
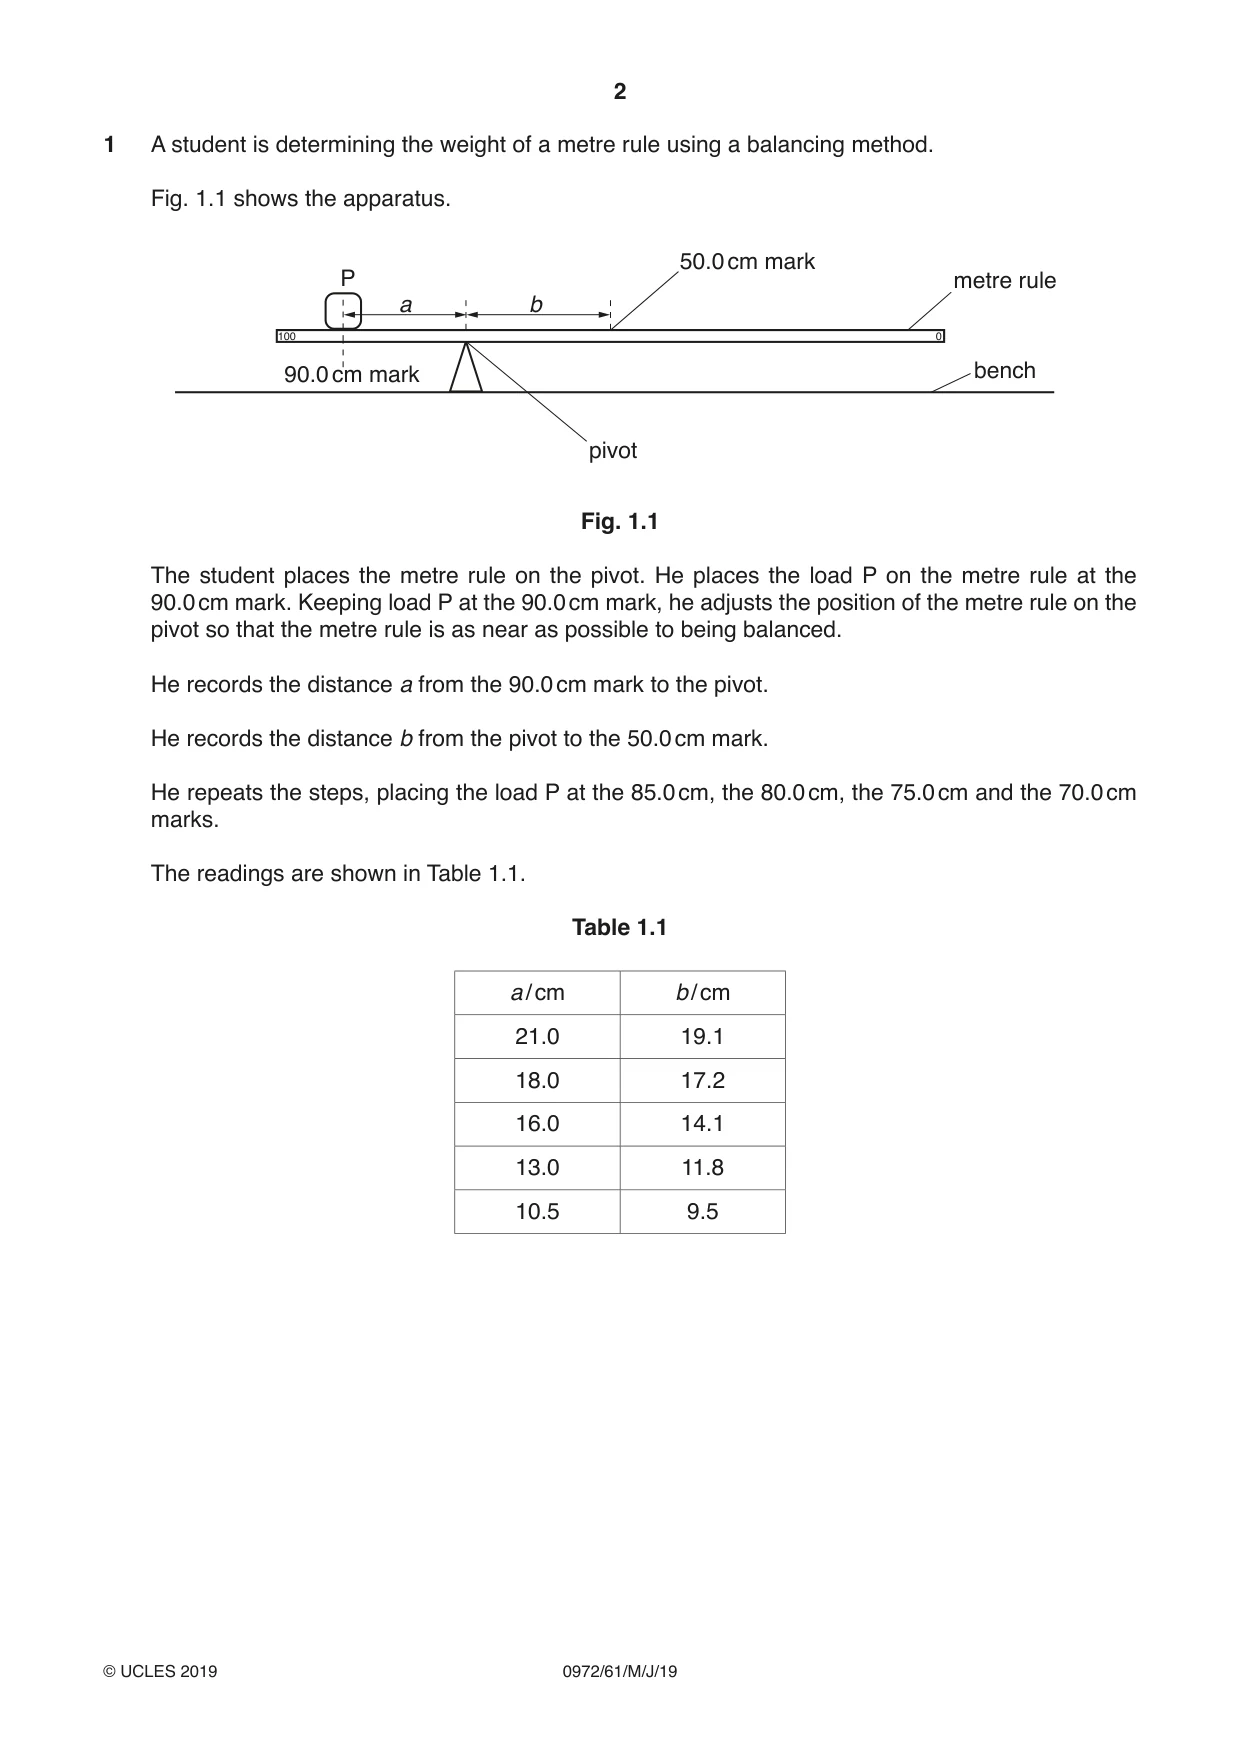
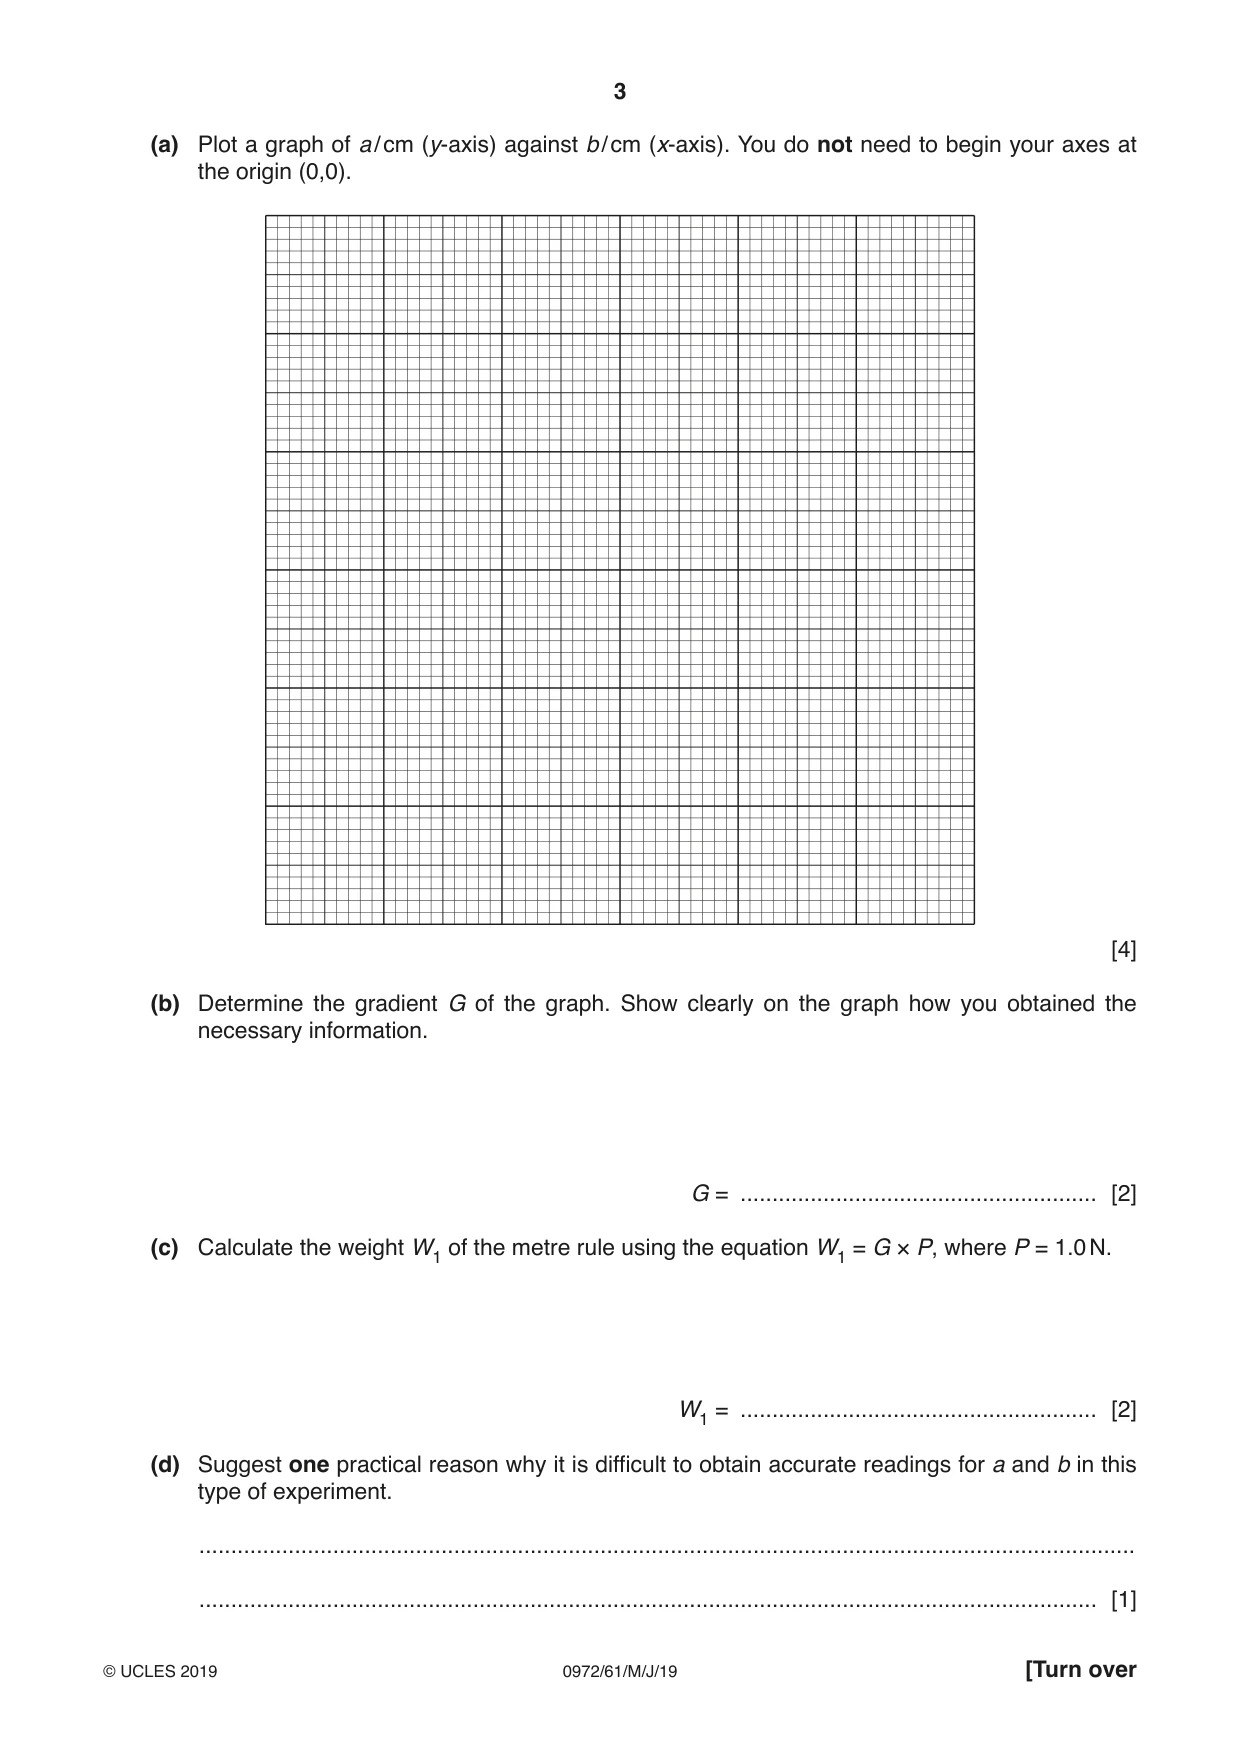
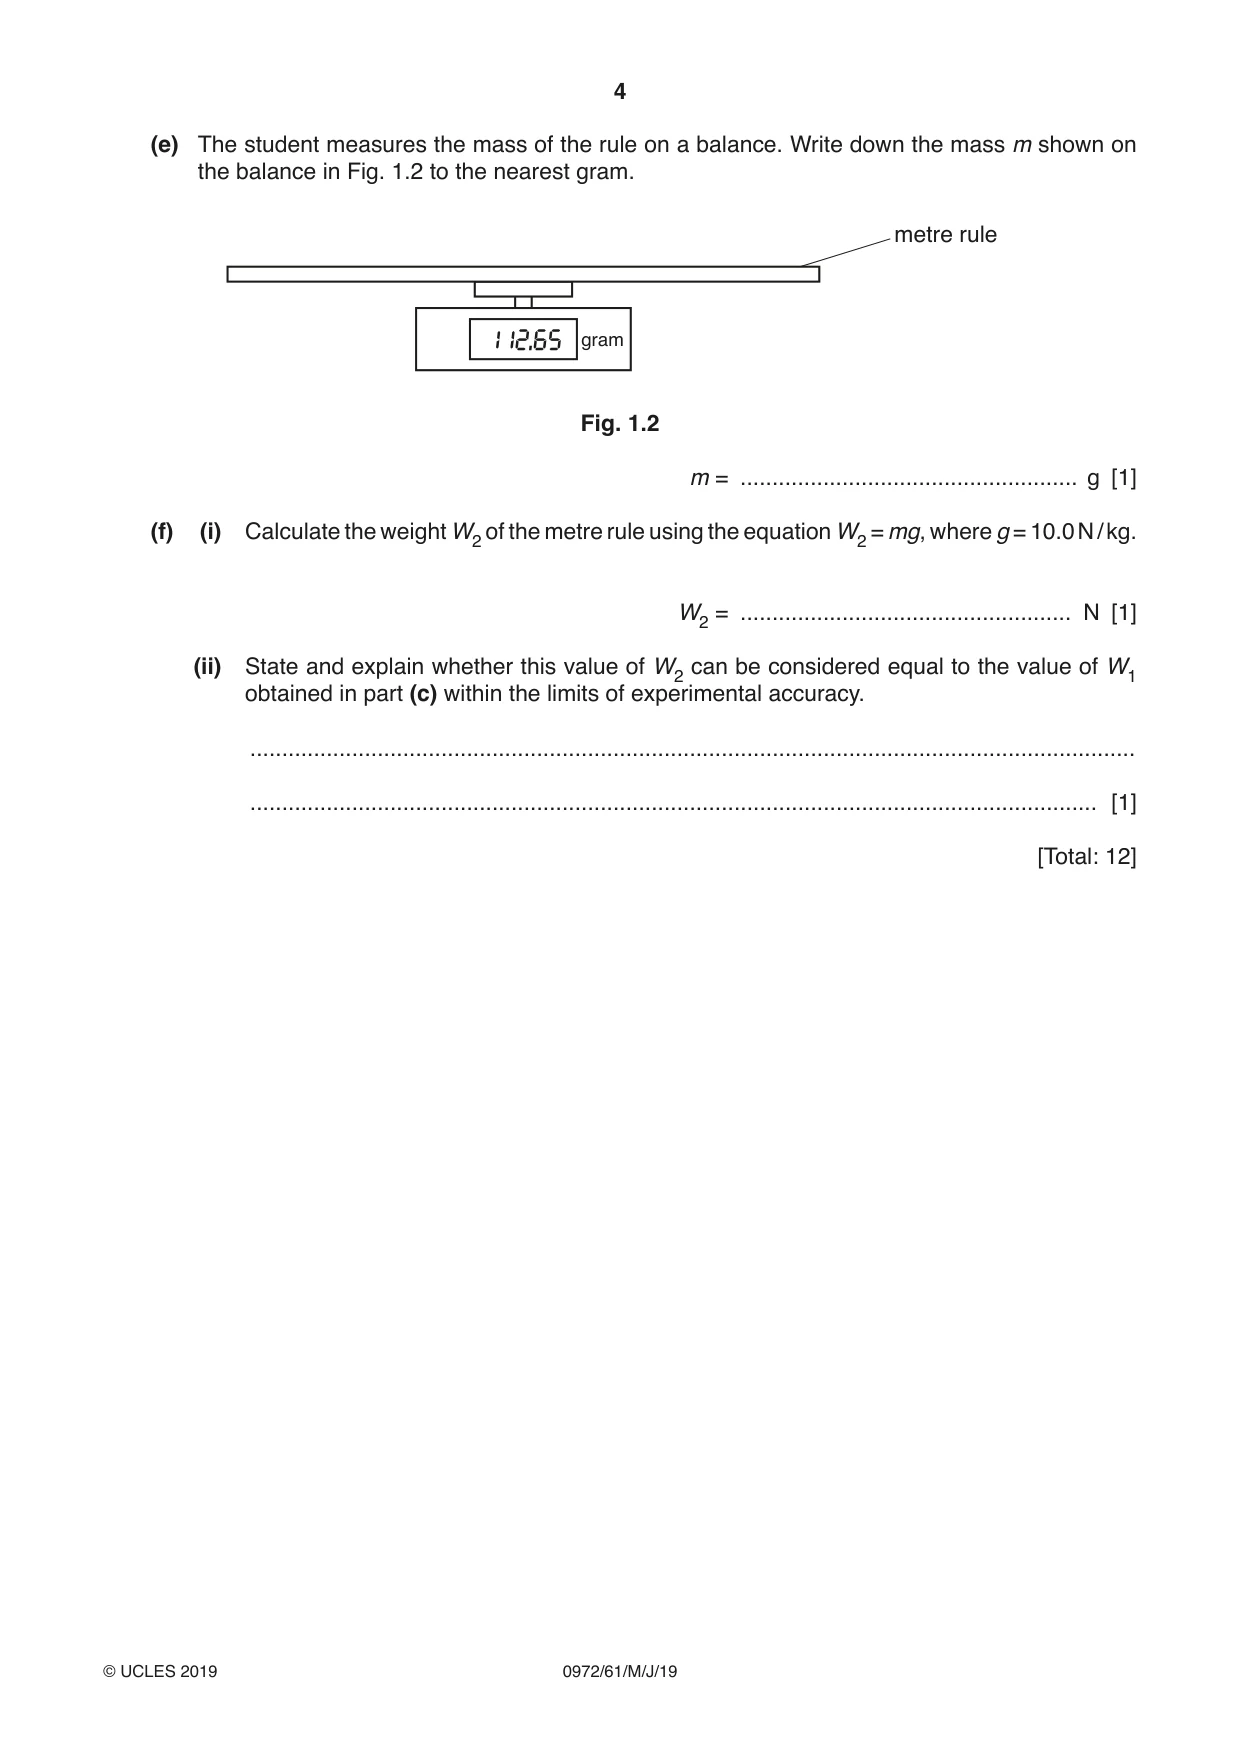
1 A student is determining the weight of a metre rule using a balancing method. Fig. 1.1 shows the apparatus. 50.0 cm mark P metre rule a b 100 0 90.0 cm mark bench pivot Fig. 1.1 The student places the metre rule on the pivot. He places the load P on the metre rule at the 90.0 cm mark. Keeping load P at the 90.0 cm mark, he adjusts the position of the metre rule on the pivot so that the metre rule is as near as possible to being balanced. He records the distance a from the 90.0 cm mark to the pivot. He records the distance b from the pivot to the 50.0 cm mark. He repeats the steps, placing the load P at the 85.0 cm, the 80.0 cm, the 75.0 cm and the 70.0 cm marks. The readings are shown in Table 1.1. Table 1.1 a / cm b / cm 21.0 19.1 18.0 17.2 16.0 14.1 13.0 11.8 10.5 9.5 (a) Plot a graph of a / cm (y-axis) against b / cm (x-axis). You do not need to begin your axes at the origin (0,0). [4] (b) Determine the gradient G of the graph. Show clearly on the graph how you obtained the necessary information. G = ........................................................ [2] (c) Calculate the weight W1 of the metre rule using the equation W1 = G × P, where P = 1.0 N. W1 = ........................................................ [2] (d) Suggest one practical reason why it is difficult to obtain accurate readings for a and b in this type of experiment. ................................................................................................................................................... ............................................................................................................................................. [1] (e) The student measures the mass of the rule on a balance. Write down the mass m shown on the balance in Fig. 1.2 to the nearest gram. metre rule gram Fig. 1.2 m = ..................................................... g [1] (f) (i) Calculate the weight W2 of the metre rule using the equation W2 = mg, where g = 10.0 N / kg. W2 = .................................................... N [1] (ii) State and explain whether this value of W2 can be considered equal to the value of W1 obtained in part (c) within the limits of experimental accuracy. ........................................................................................................................................... ..................................................................................................................................... [1] [Total: 12]
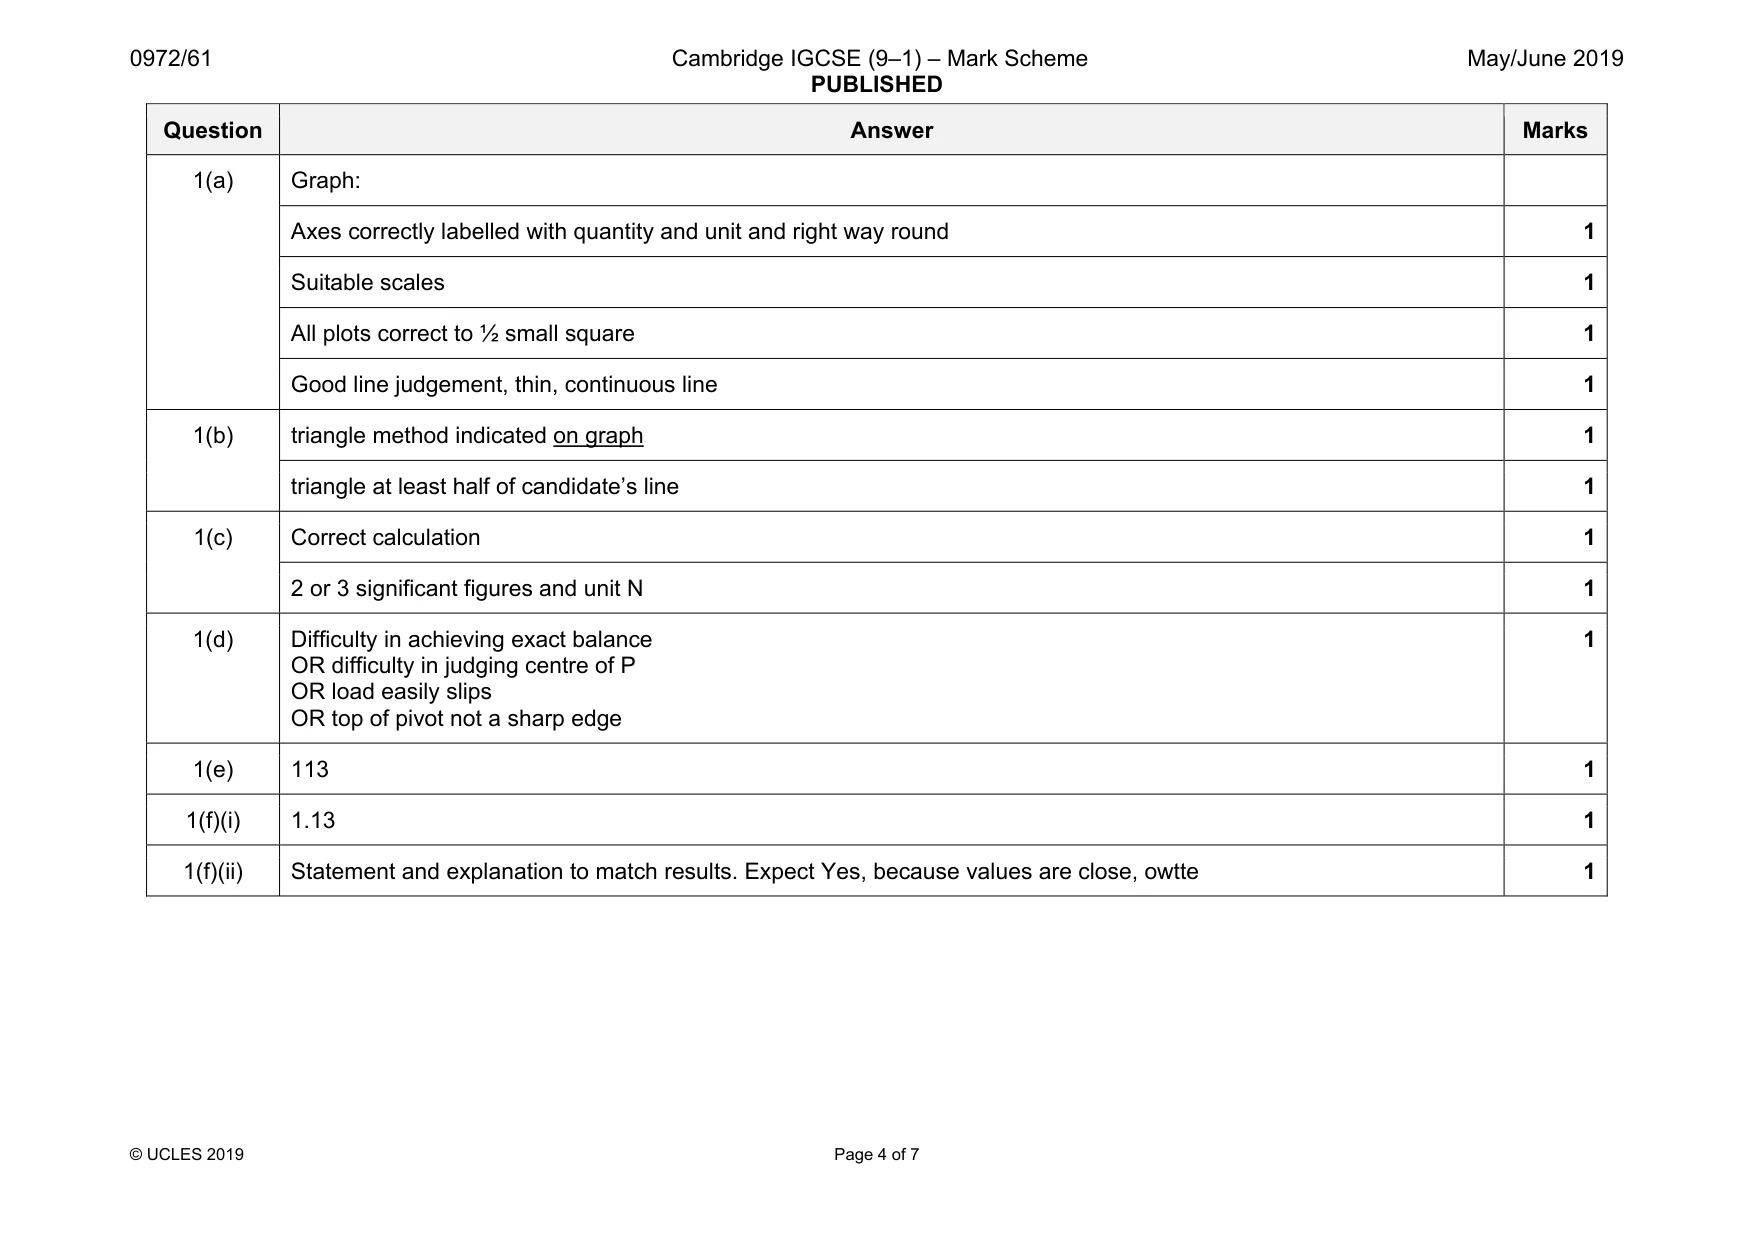
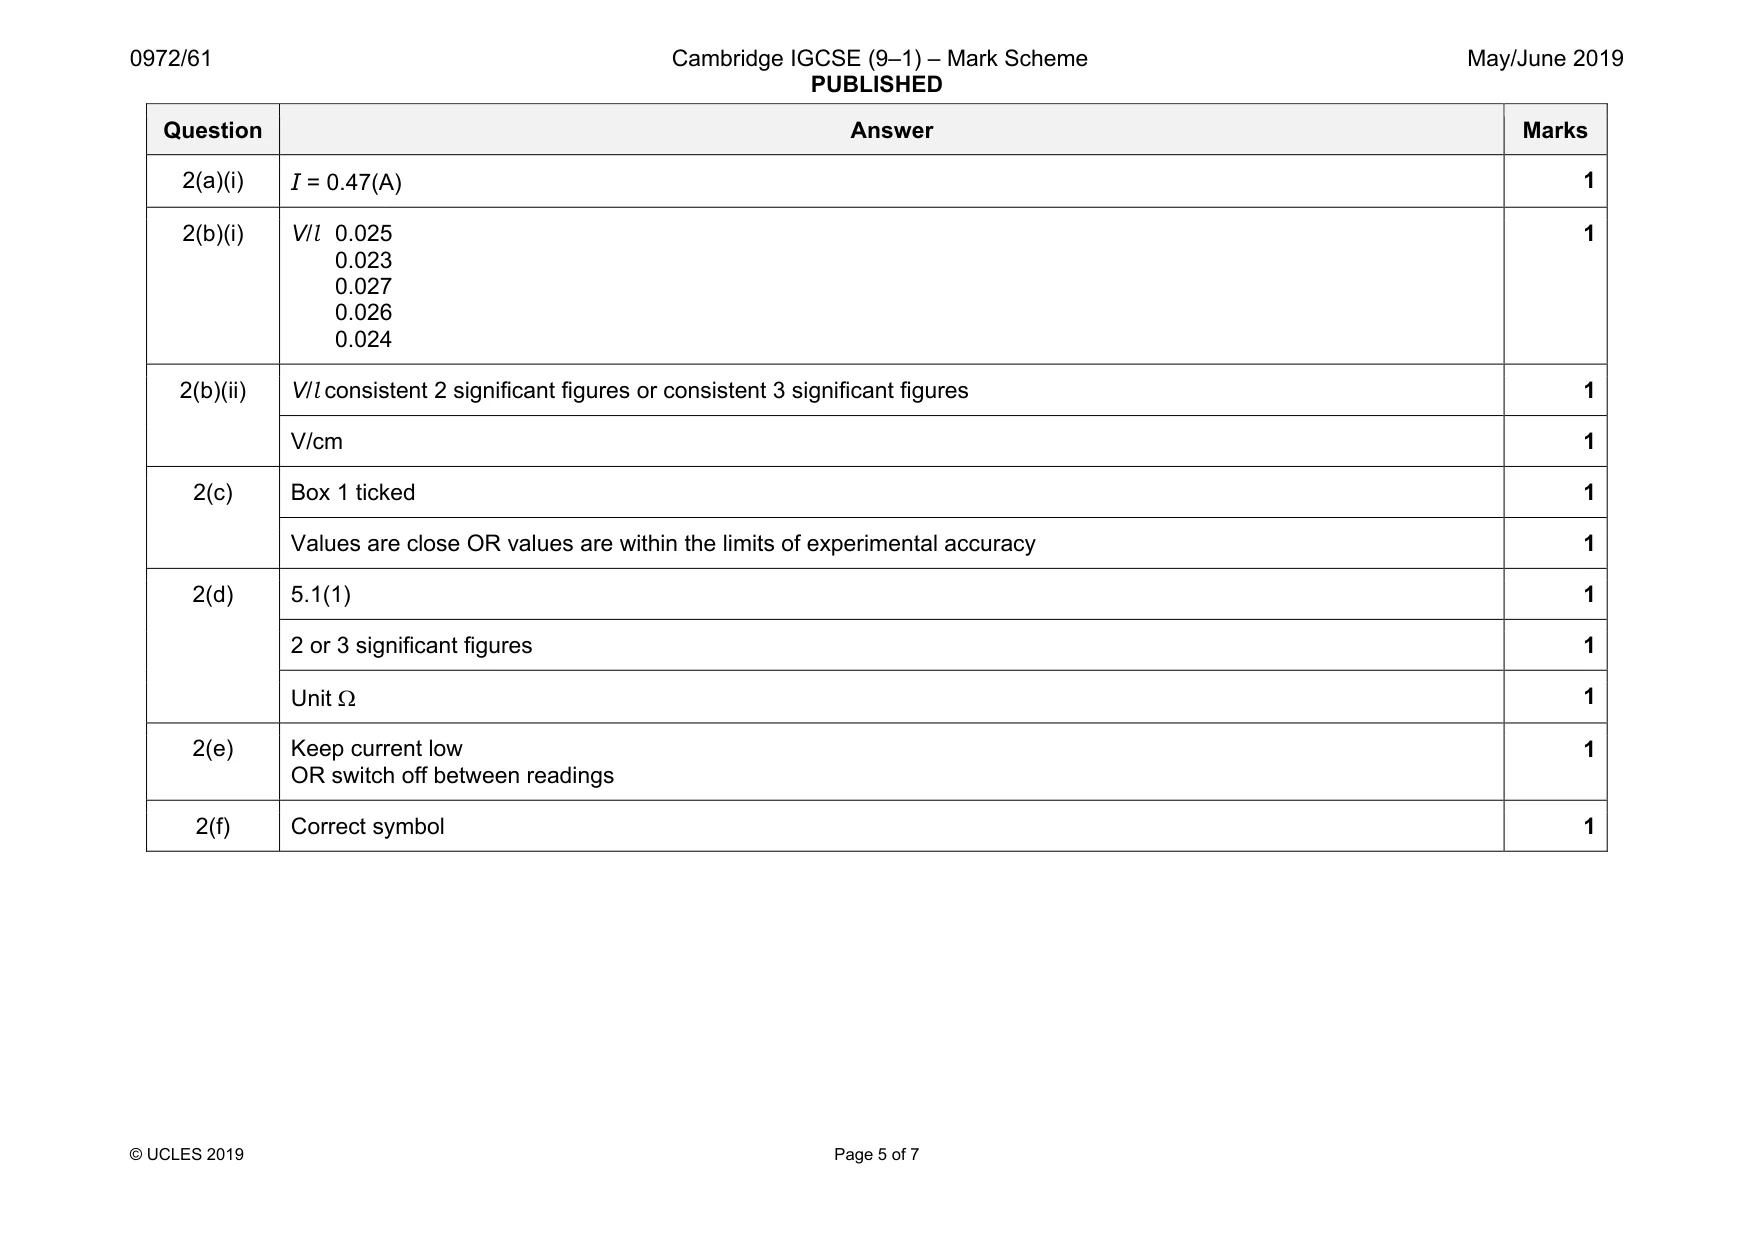
Mark scheme: 1(a) Graph: Axes correctly labelled with quantity and unit and right way round 1 Suitable scales 1 All plots correct to ½ small square 1 Good line judgement, thin, continuous line 1 1(b) triangle method indicated on graph 1 triangle at least half of candidate’s line 1 1(c) Correct calculation 1 2 or 3 significant figures and unit N 1 1(d) Difficulty in achieving exact balance OR difficulty in judging centre of P OR load easily slips OR top of pivot not a sharp edge 1 1(e) 113 1 1(f)(i) 1.13 1 1(f)(ii) Statement and explanation to match results. Expect Yes, because values are close, owtte 1
Q2 · A student is determining the resistance of a resistance wire
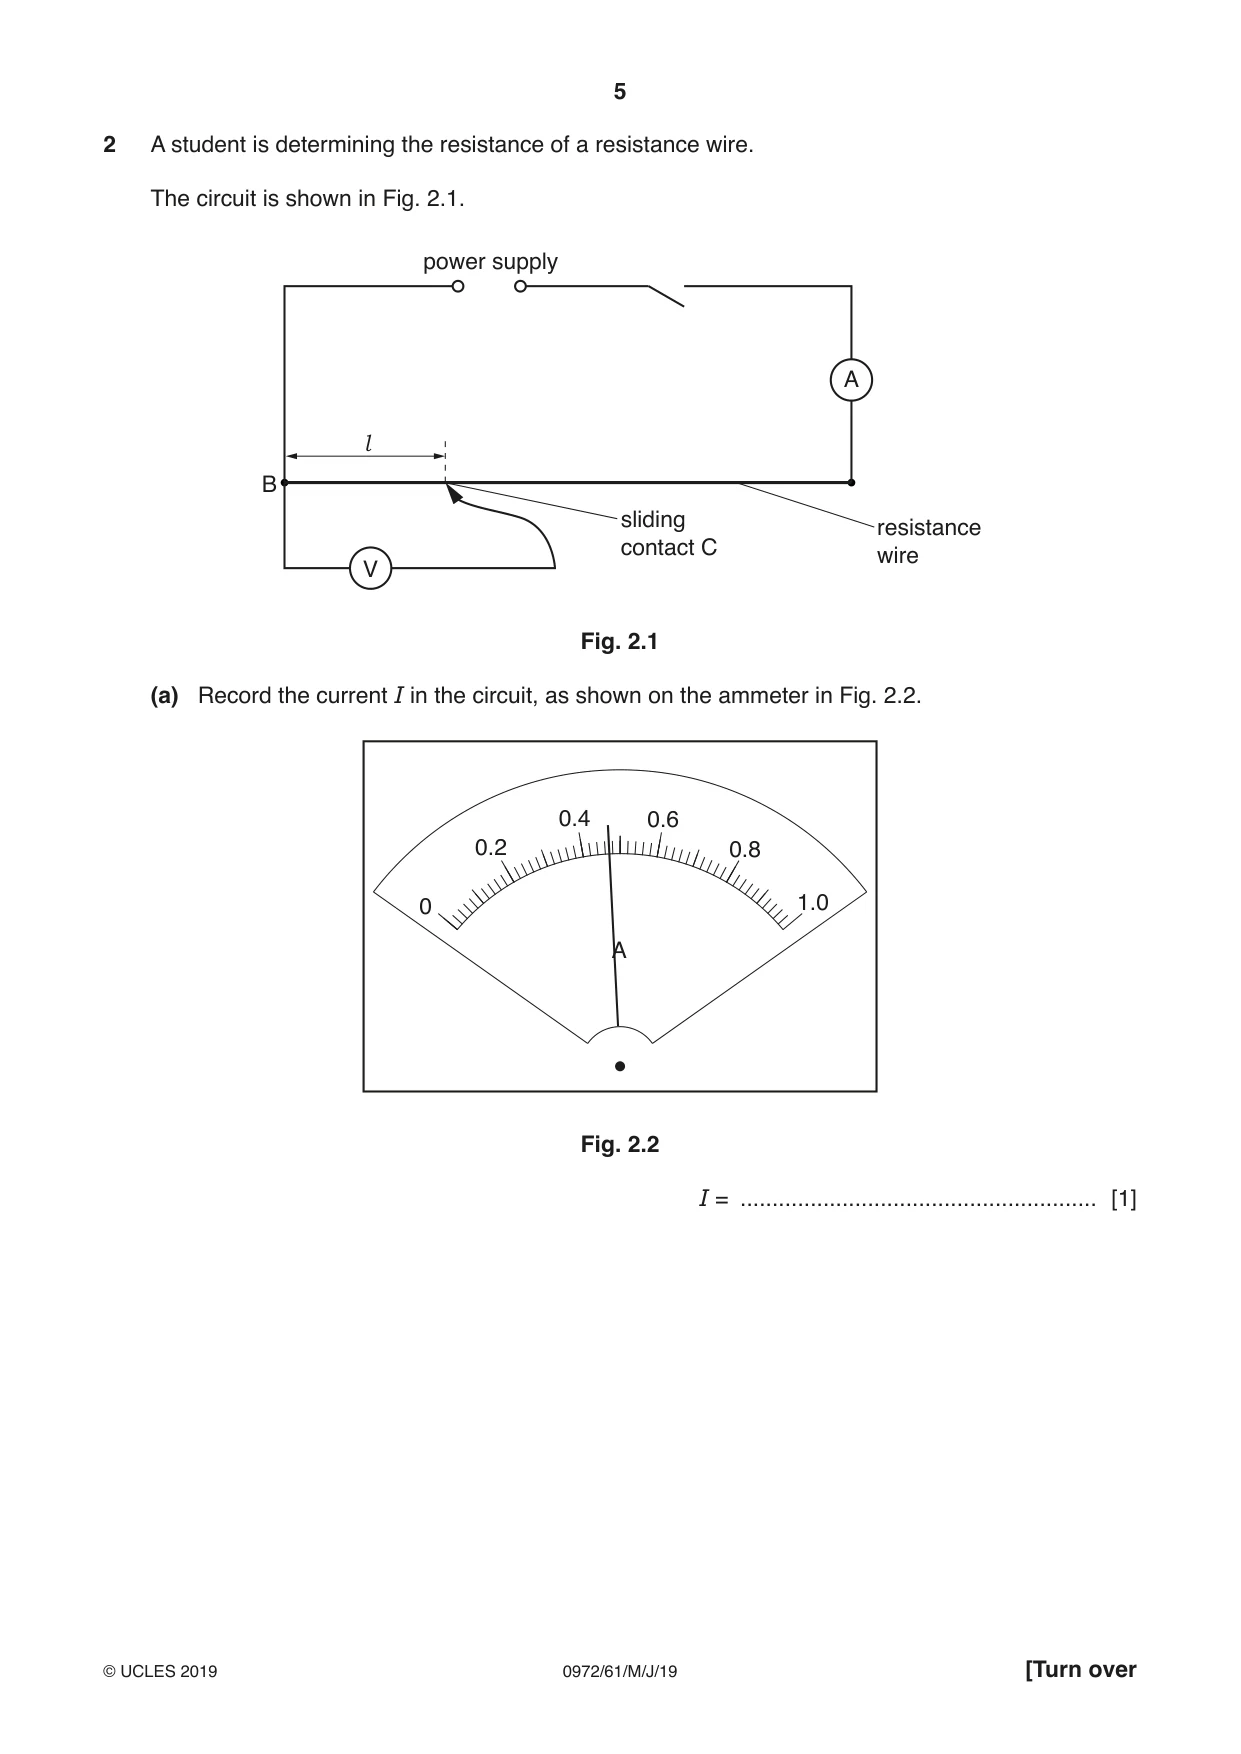
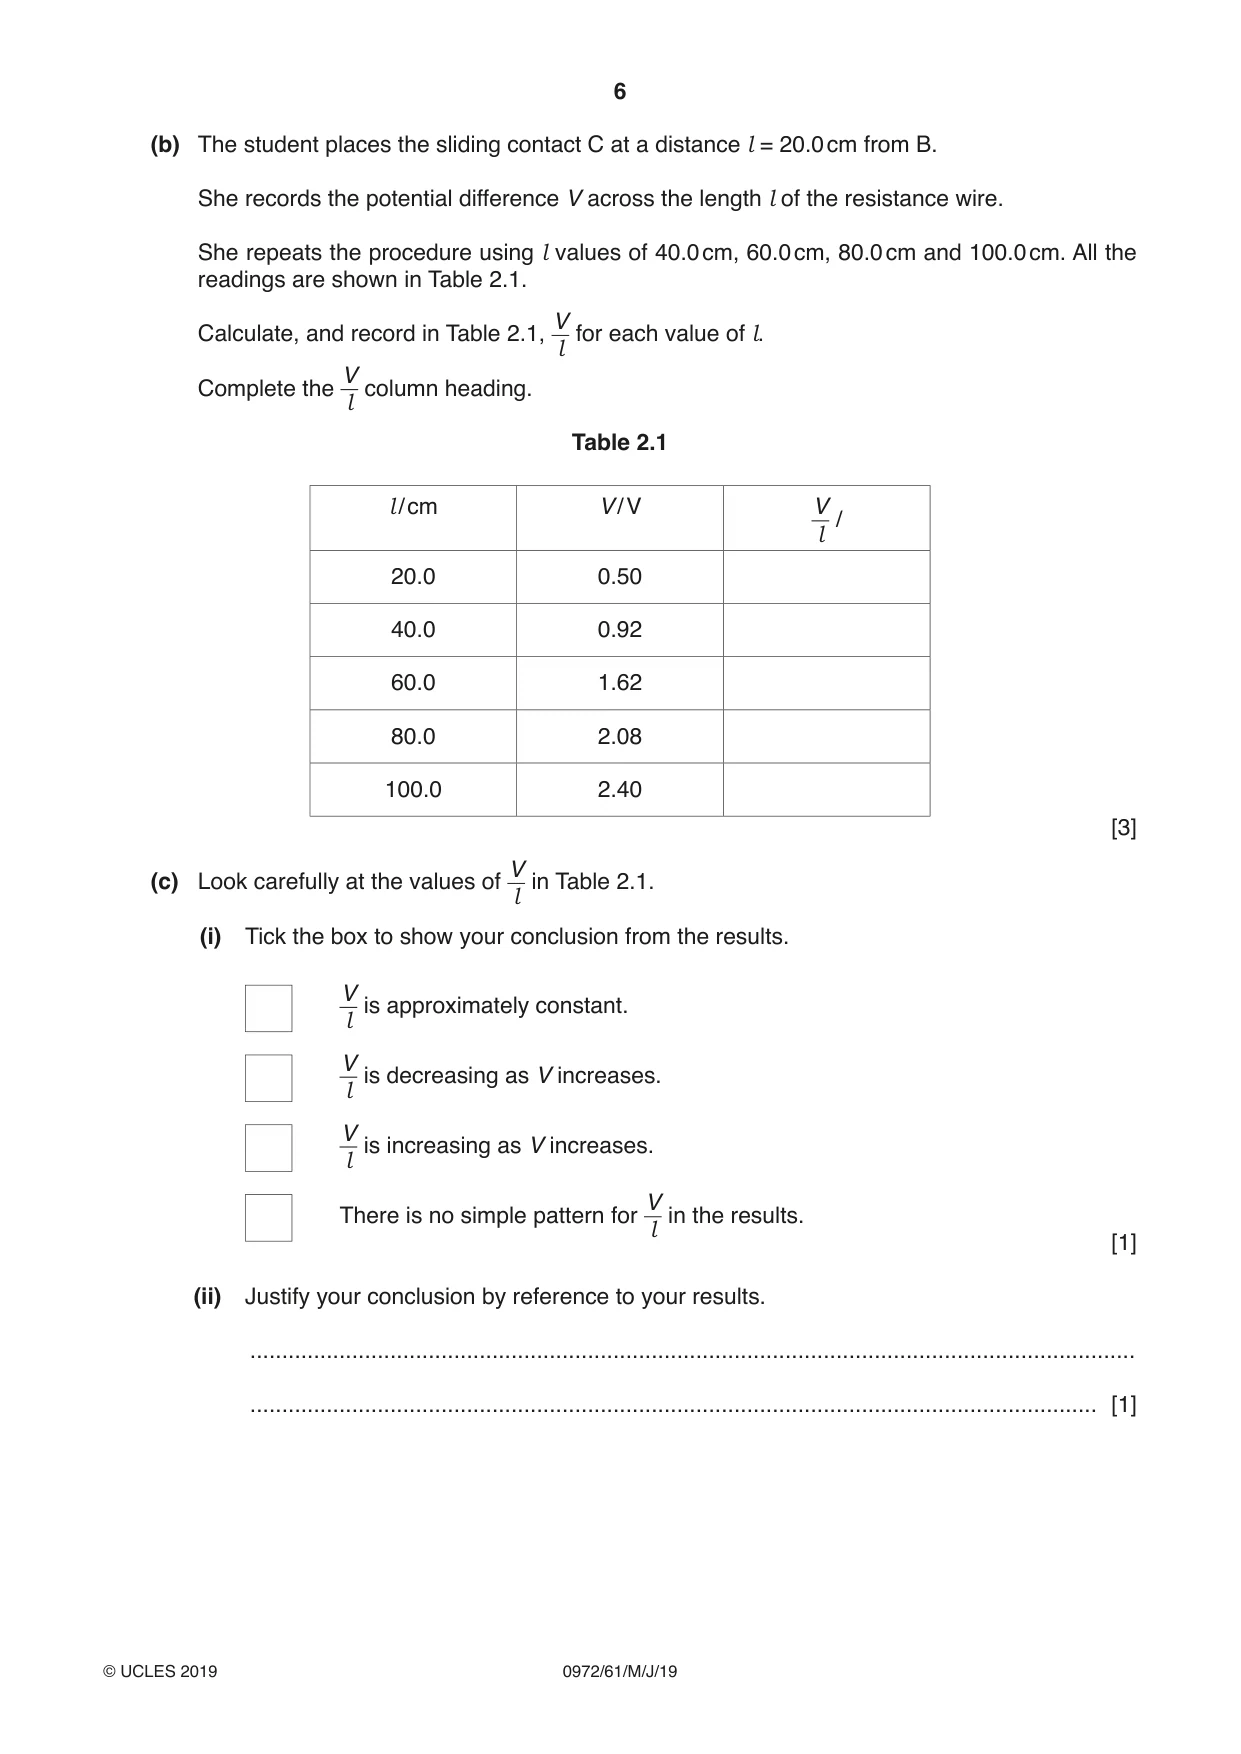
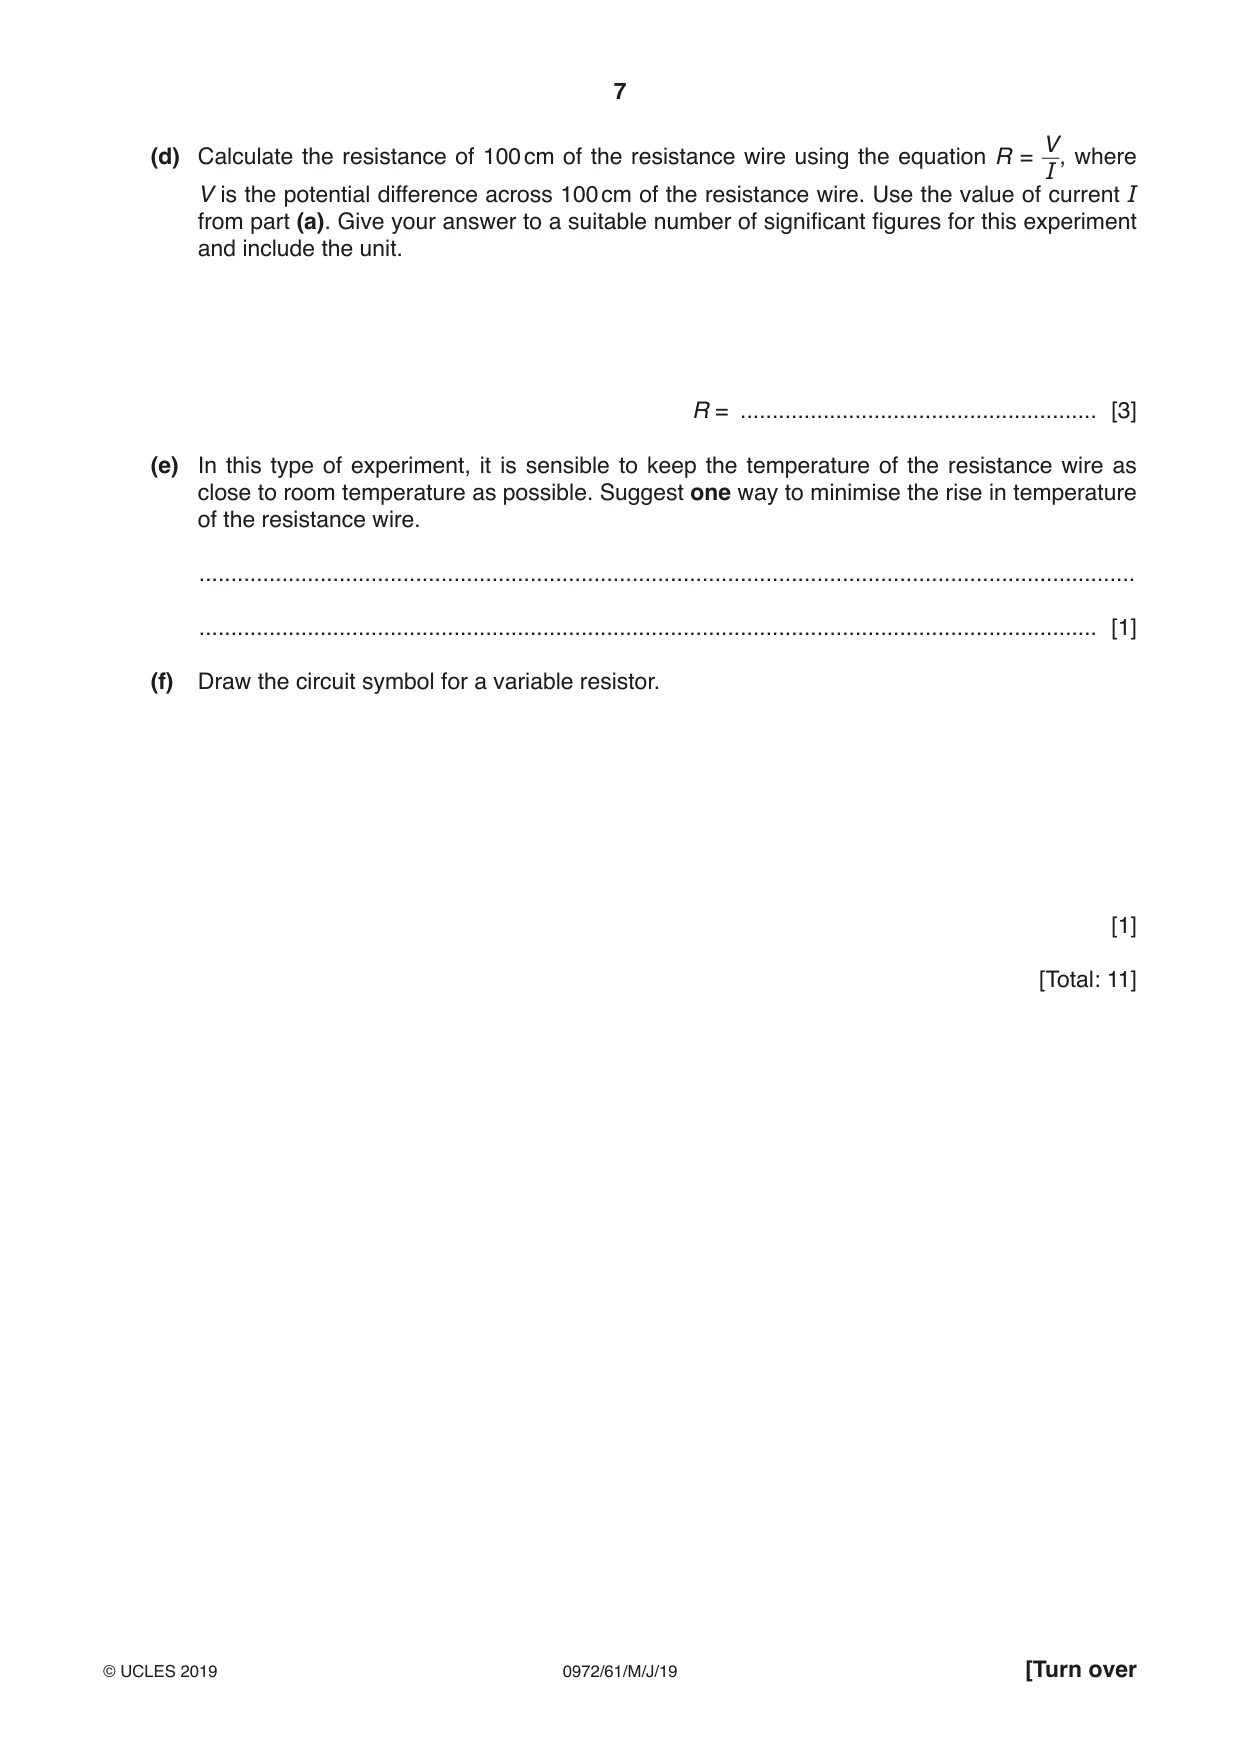
2 A student is determining the resistance of a resistance wire. The circuit is shown in Fig. 2.1. power supply A l B sliding resistance contact C wire V Fig. 2.1 (a) Record the current I in the circuit, as shown on the ammeter in Fig. 2.2. 0.4 0.6 0.2 0.8 0 1.0 A Fig. 2.2 I = ........................................................ [1] (b) The student places the sliding contact C at a distance l = 20.0 cm from B. She records the potential difference V across the length l of the resistance wire. She repeats the procedure using l values of 40.0 cm, 60.0 cm, 80.0 cm and 100.0 cm. All the readings are shown in Table 2.1. V Calculate, and record in Table 2.1, for each value of l. l V Complete the column heading. l Table 2.1 l / cm V / V V / l 20.0 0.50 40.0 0.92 60.0 1.62 80.0 2.08 100.0 2.40 [3] V(c) Look carefully at the values of in Table 2.1. l (i) Tick the box to show your conclusion from the results. V is approximately constant. l V is decreasing as V increases. l V is increasing as V increases. l V There is no simple pattern for in the results. l [1] (ii) Justify your conclusion by reference to your results. ........................................................................................................................................... ..................................................................................................................................... [1] V(d) Calculate the resistance of 100 cm of the resistance wire using the equation R = , where I V is the potential difference across 100 cm of the resistance wire. Use the value of current I from part (a). Give your answer to a suitable number of significant figures for this experiment and include the unit. R = ........................................................ [3] (e) In this type of experiment, it is sensible to keep the temperature of the resistance wire as close to room temperature as possible. Suggest one way to minimise the rise in temperature of the resistance wire. ................................................................................................................................................... ............................................................................................................................................. [1] (f) Draw the circuit symbol for a variable resistor. [1] [Total: 11]
Mark scheme: 2(a)(i) 1 2(b)(i) V/l 0.025 0.023 0.027 0.026 0.024 1 2(b)(ii) V/l consistent 2 significant figures or consistent 3 significant figures 1 V/cm 1 2(c) Box 1 ticked 1 Values are close OR values are within the limits of experimental accuracy 1 2(d) 5.1(1) 1 2 or 3 significant figures 1 Unit Ω 1 2(e) Keep current low OR switch off between readings 1 2(f) Correct symbol 1
Q3 · A student is investigating the rate of cooling of water under different conditions
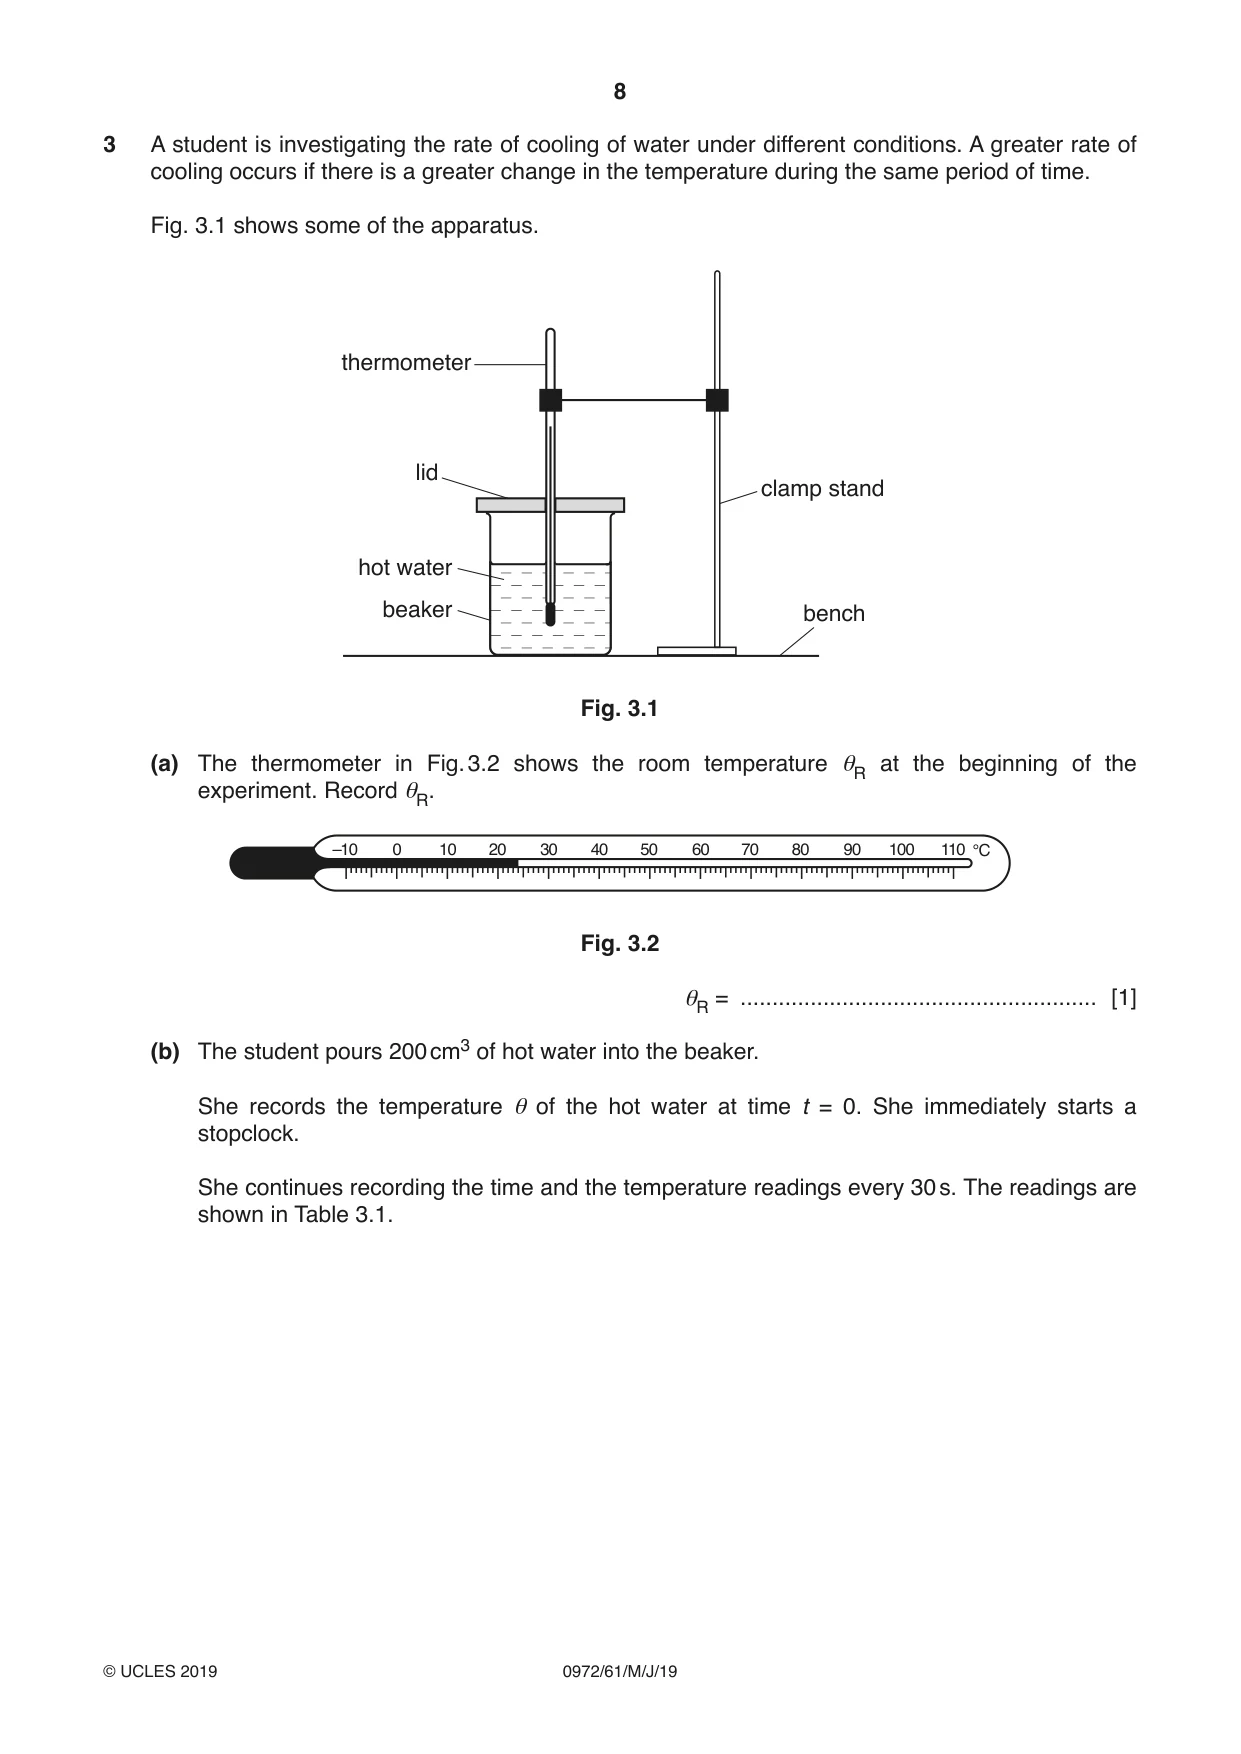
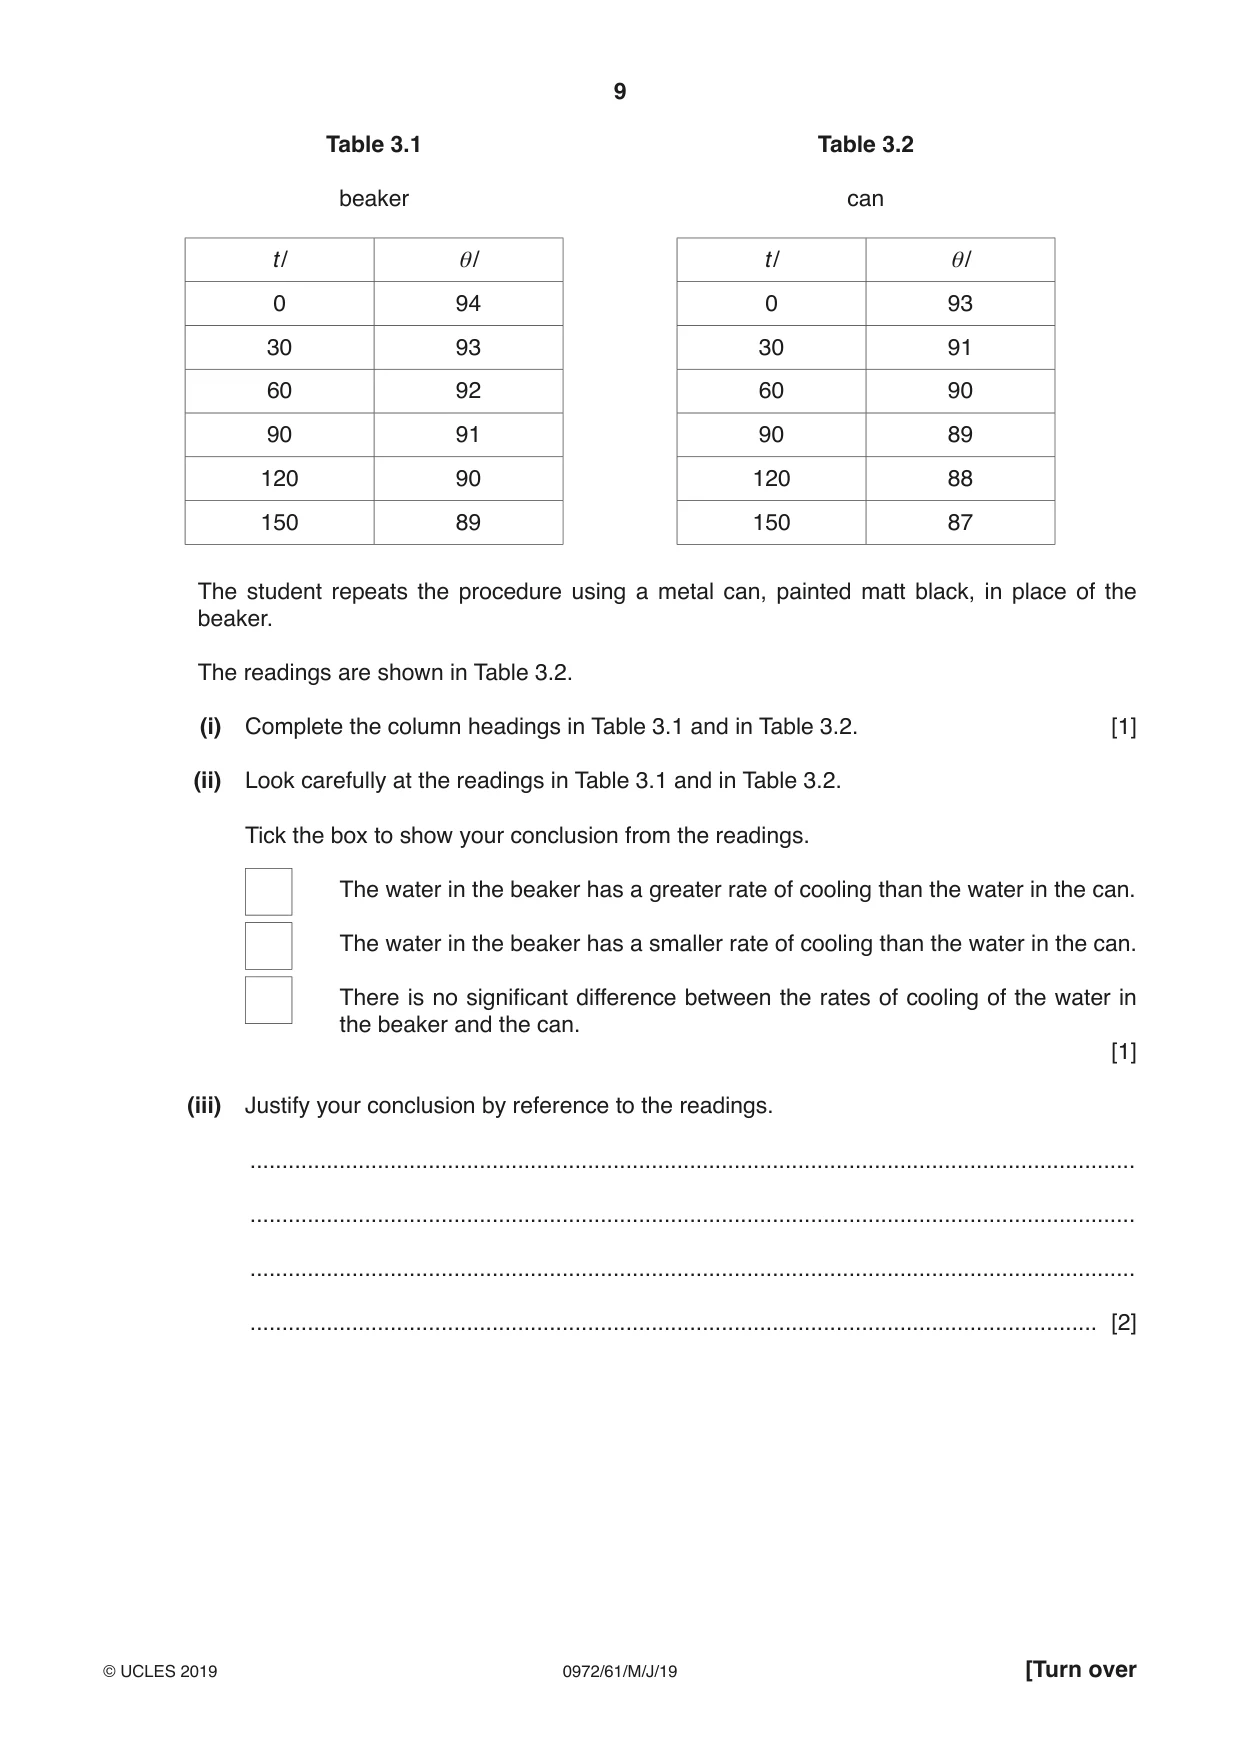
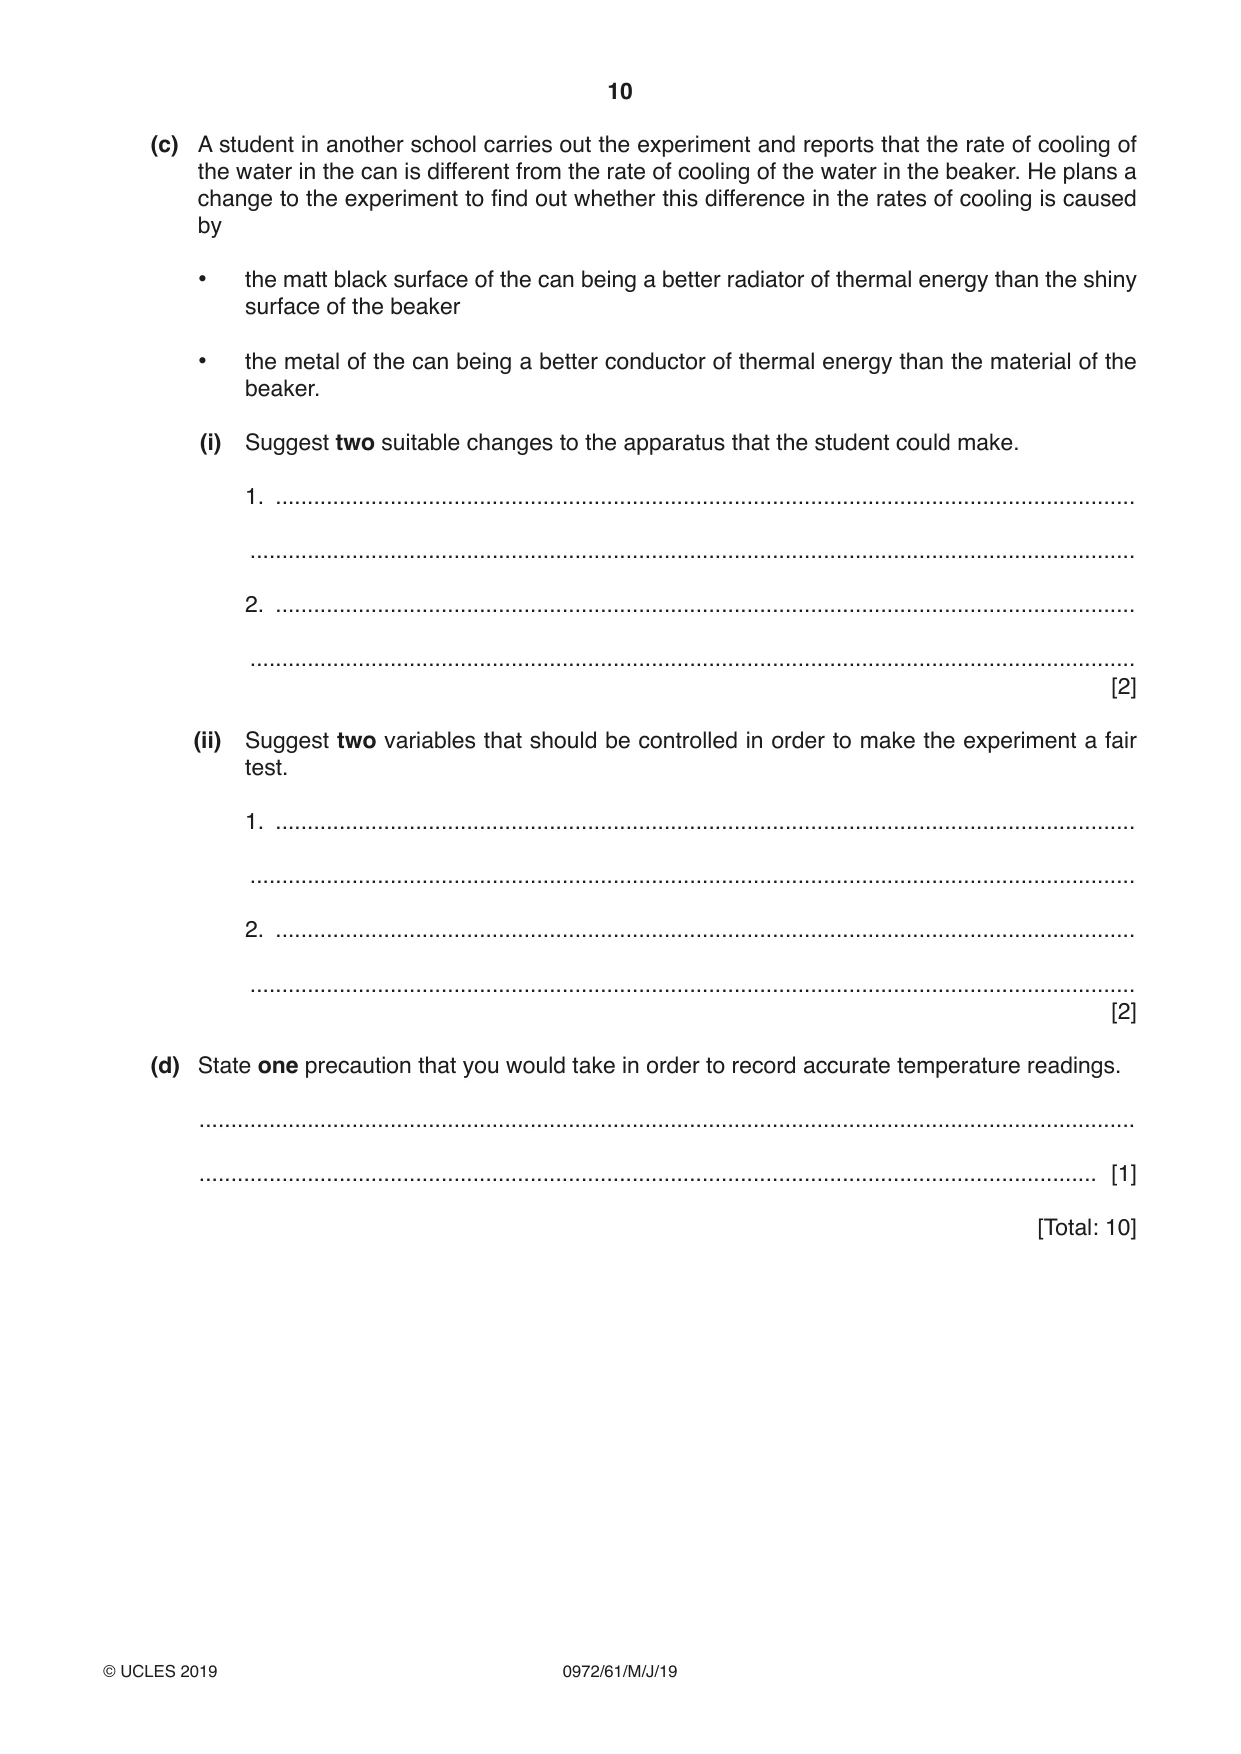
3 A student is investigating the rate of cooling of water under different conditions. A greater rate of cooling occurs if there is a greater change in the temperature during the same period of time. Fig. 3.1 shows some of the apparatus. thermometer lid clamp stand hot water beaker bench Fig. 3.1 (a) The thermometer in Fig. 3.2 shows the room temperature θR at the beginning of the experiment. Record θR. –10 0 10 20 30 40 50 60 70 80 90 100 110 °C Fig. 3.2 θR = ........................................................ [1] (b) The student pours 200 cm3 of hot water into the beaker. She records the temperature θ of the hot water at time t = 0. She immediately starts a stopclock. She continues recording the time and the temperature readings every 30 s. The readings are shown in Table 3.1. Table 3.1 Table 3.2 beaker can t / θ/ t / θ/ 0 94 0 93 30 93 30 91 60 92 60 90 90 91 90 89 120 90 120 88 150 89 150 87 The student repeats the procedure using a metal can, painted matt black, in place of the beaker. The readings are shown in Table 3.2. (i) Complete the column headings in Table 3.1 and in Table 3.2. [1] (ii) Look carefully at the readings in Table 3.1 and in Table 3.2. Tick the box to show your conclusion from the readings. The water in the beaker has a greater rate of cooling than the water in the can. The water in the beaker has a smaller rate of cooling than the water in the can. There is no significant difference between the rates of cooling of the water in the beaker and the can. [1] (iii) Justify your conclusion by reference to the readings. ........................................................................................................................................... ........................................................................................................................................... ........................................................................................................................................... ..................................................................................................................................... [2] (c) A student in another school carries out the experiment and reports that the rate of cooling of the water in the can is different from the rate of cooling of the water in the beaker. He plans a change to the experiment to find out whether this difference in the rates of cooling is caused by • the matt black surface of the can being a better radiator of thermal energy than the shiny surface of the beaker • the metal of the can being a better conductor of thermal energy than the material of the beaker. (i) Suggest two suitable changes to the apparatus that the student could make. 1. ....................................................................................................................................... ........................................................................................................................................... 2. ....................................................................................................................................... ........................................................................................................................................... [2] (ii) Suggest two variables that should be controlled in order to make the experiment a fair test. 1. ....................................................................................................................................... ........................................................................................................................................... 2. ....................................................................................................................................... ........................................................................................................................................... [2] (d) State one precaution that you would take in order to record accurate temperature readings. ................................................................................................................................................... ............................................................................................................................................. [1] [Total: 10]
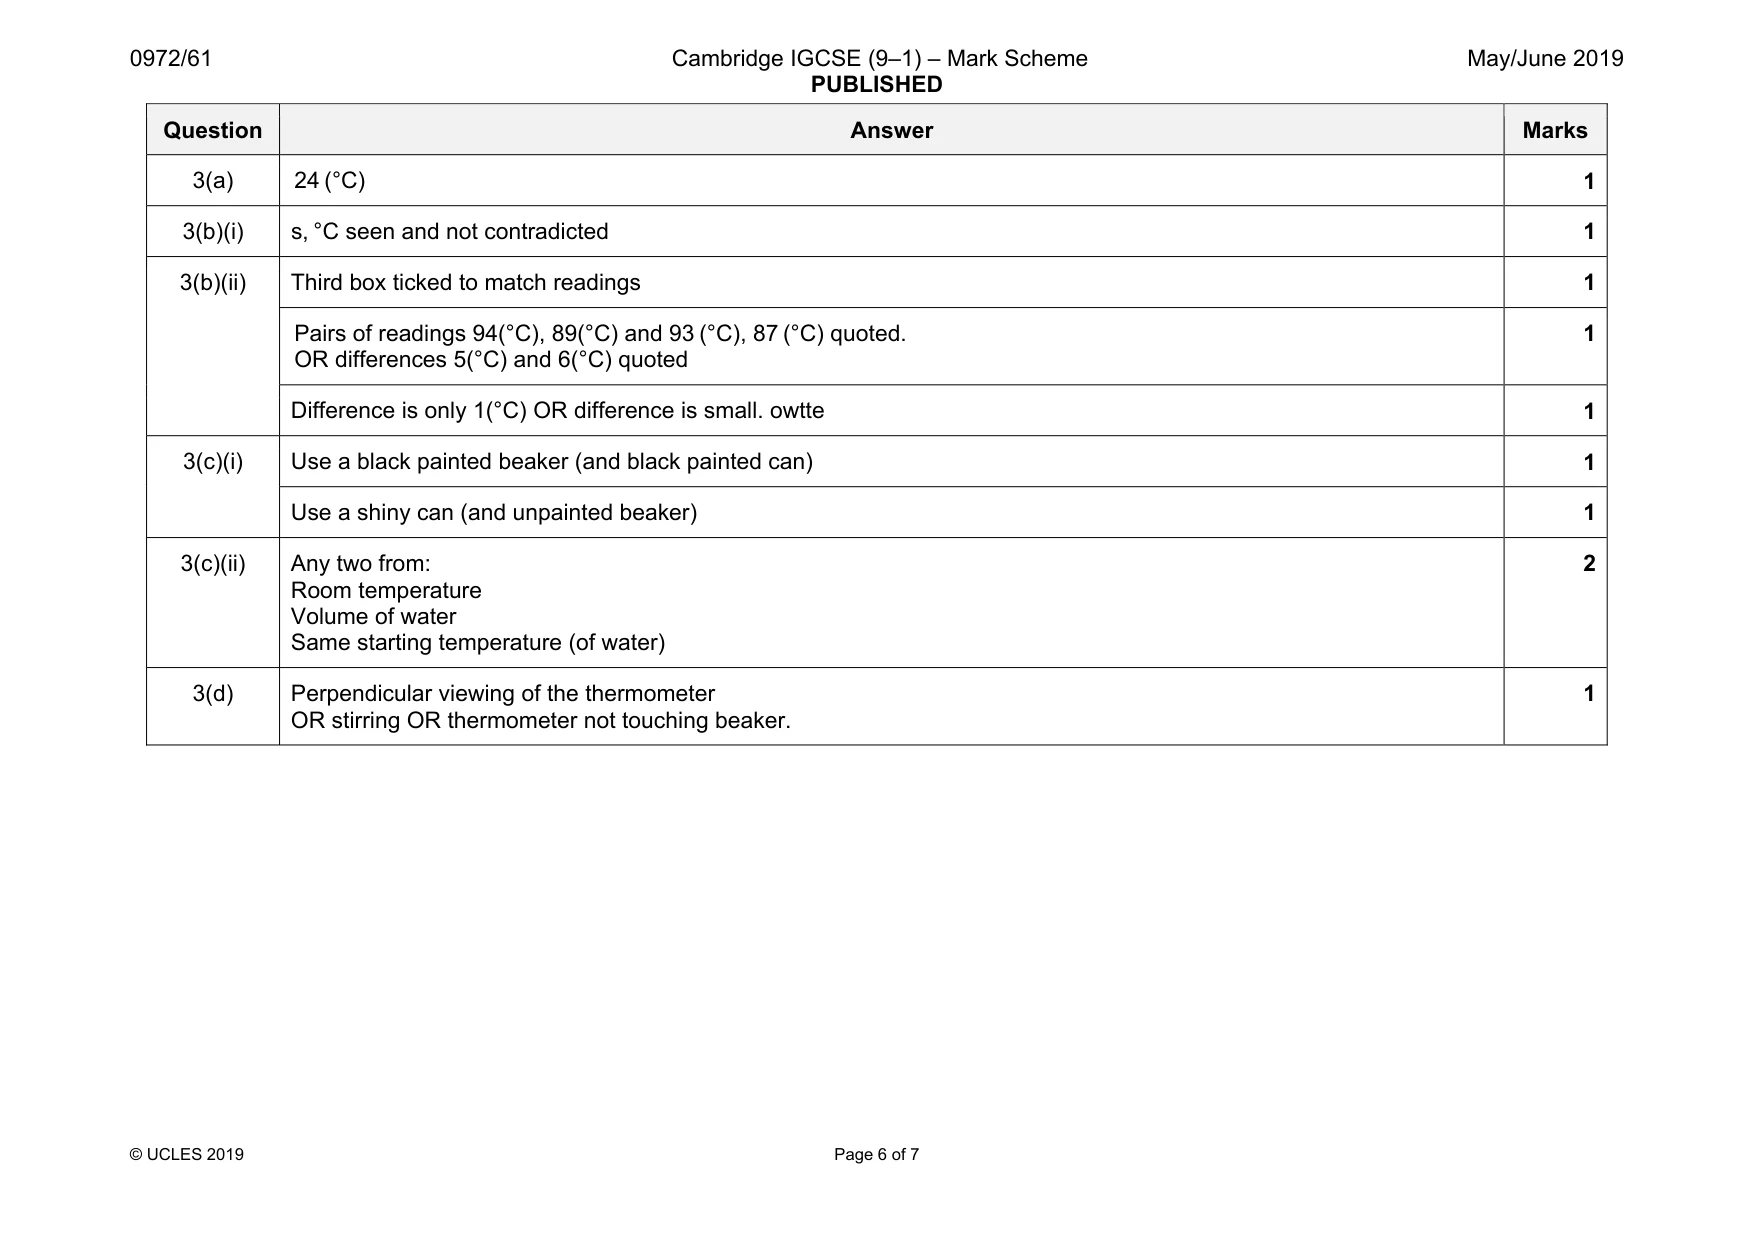
Mark scheme: 3(a) 24 (°C) 1 3(b)(i) s, °C seen and not contradicted 1 3(b)(ii) Third box ticked to match readings 1 Pairs of readings 94(°C), 89(°C) and 93 (°C), 87 (°C) quoted. OR differences 5(°C) and 6(°C) quoted 1 Difference is only 1(°C) OR difference is small. owtte 1 3(c)(i) Use a black painted beaker (and black painted can) 1 Use a shiny can (and unpainted beaker) 1 3(c)(ii) Any two from: Room temperature Volume of water Same starting temperature (of water) 2 3(d) Perpendicular viewing of the thermometer OR stirring OR thermometer not touching beaker. 1
Q4 · A student is investigating the work required to pull a box containing some masses up a…
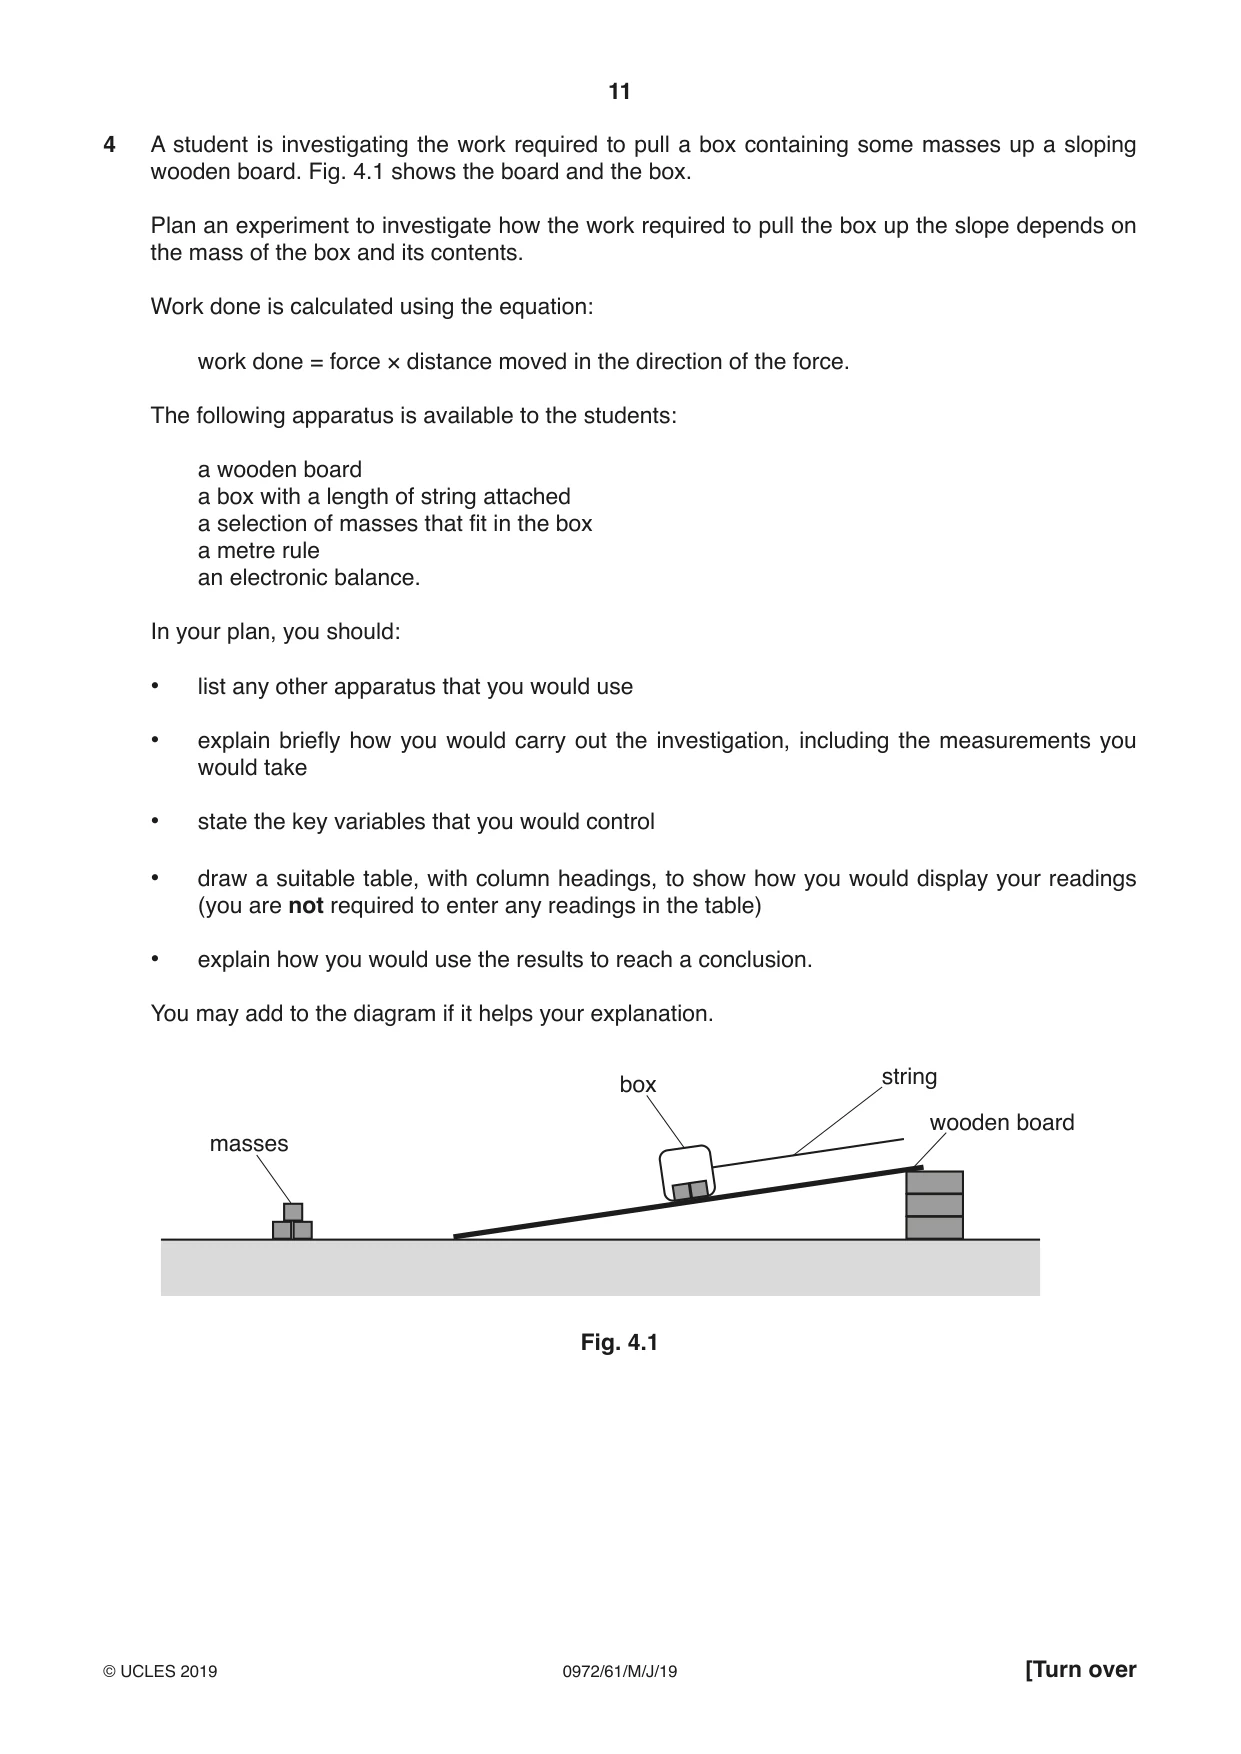
4 A student is investigating the work required to pull a box containing some masses up a sloping wooden board. Fig. 4.1 shows the board and the box. Plan an experiment to investigate how the work required to pull the box up the slope depends on the mass of the box and its contents. Work done is calculated using the equation: work done = force × distance moved in the direction of the force. The following apparatus is available to the students: a wooden board a box with a length of string attached a selection of masses that fit in the box a metre rule an electronic balance. In your plan, you should: • list any other apparatus that you would use • explain briefly how you would carry out the investigation, including the measurements you would take • state the key variables that you would control • draw a suitable table, with column headings, to show how you would display your readings (you are not required to enter any readings in the table) • explain how you would use the results to reach a conclusion. You may add to the diagram if it helps your explanation. string box wooden board masses Fig. 4.1 .......................................................................................................................................................... .......................................................................................................................................................... .......................................................................................................................................................... .......................................................................................................................................................... .......................................................................................................................................................... .......................................................................................................................................................... .......................................................................................................................................................... .......................................................................................................................................................... .......................................................................................................................................................... .......................................................................................................................................................... .......................................................................................................................................................... .......................................................................................................................................................... .......................................................................................................................................................... .......................................................................................................................................................... .......................................................................................................................................................... .......................................................................................................................................................... .......................................................................................................................................................... .......................................................................................................................................................... .......................................................................................................................................................... .......................................................................................................................................................... .......................................................................................................................................................... .......................................................................................................................................................... .................................................................................................................................................... [7] [Total: 7]
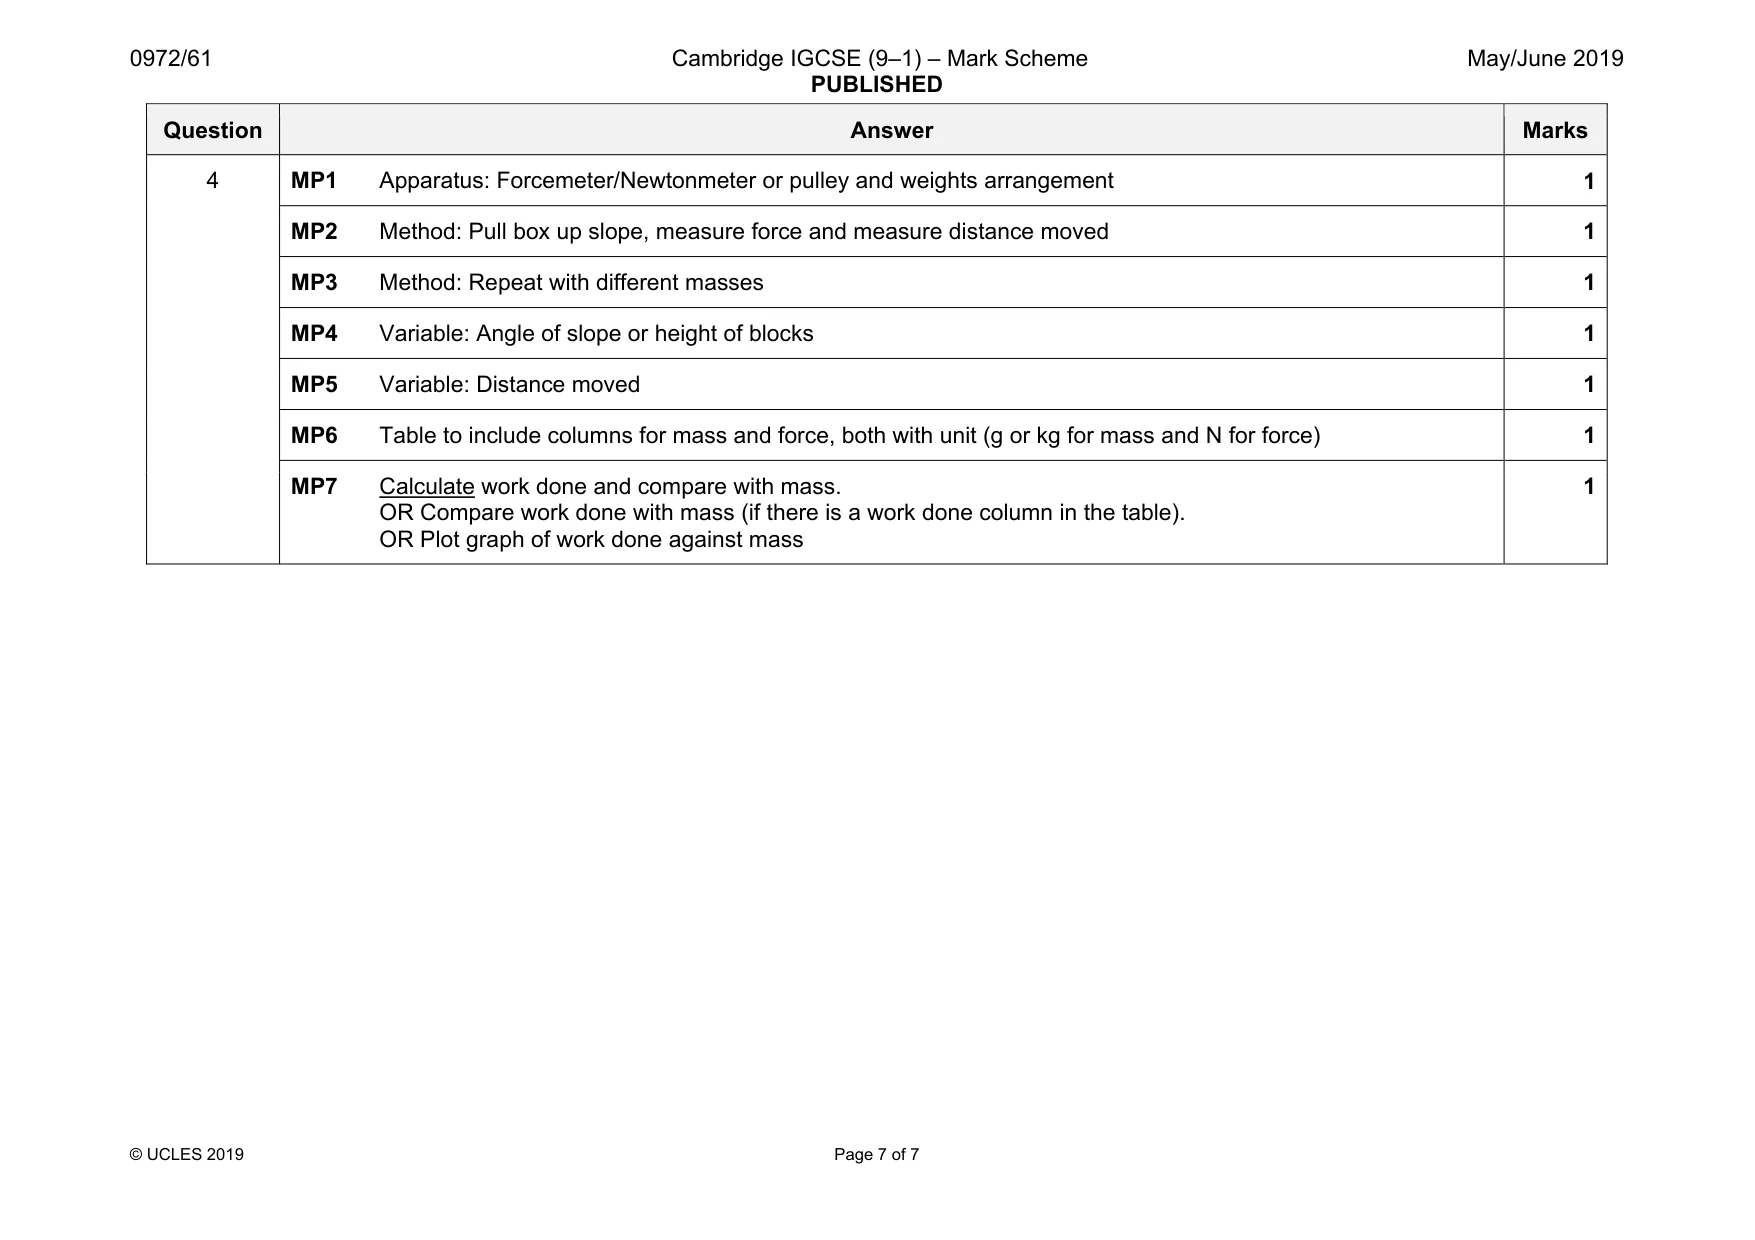
Mark scheme: 4 MP1 Apparatus: Forcemeter/Newtonmeter or pulley and weights arrangement 1 MP2 Method: Pull box up slope, measure force and measure distance moved 1 MP3 Method: Repeat with different masses 1 MP4 Variable: Angle of slope or height of blocks 1 MP5 Variable: Distance moved 1 MP6 Table to include columns for mass and force, both with unit (g or kg for mass and N for force) 1 MP7 Calculate work done and compare with mass. OR Compare work done with mass (if there is a work done column in the table). OR Plot graph of work done against mass 1
What was in this paper
The subtopics covered by these 4 questions, and how many questions each got. Open one in a new tab to see every Cambridge question on it.
What you needed in this session
Cambridge’s own grade thresholds for 2019 May/June, Paper 6 · Variant 1. A higher threshold means an easier paper — the bar moves with how the cohort did.