Cambridge IGCSE Physics (9-1) 0972 — 2018 May/June Paper 6 · Variant 1
0972/61/M/J/18 · 4 questions · 40 marks · ≈45 min
The question paper and its mark scheme, free to read here and free to download. This is Cambridge’s own paper, exactly as it was sat.
Question paper12 pages

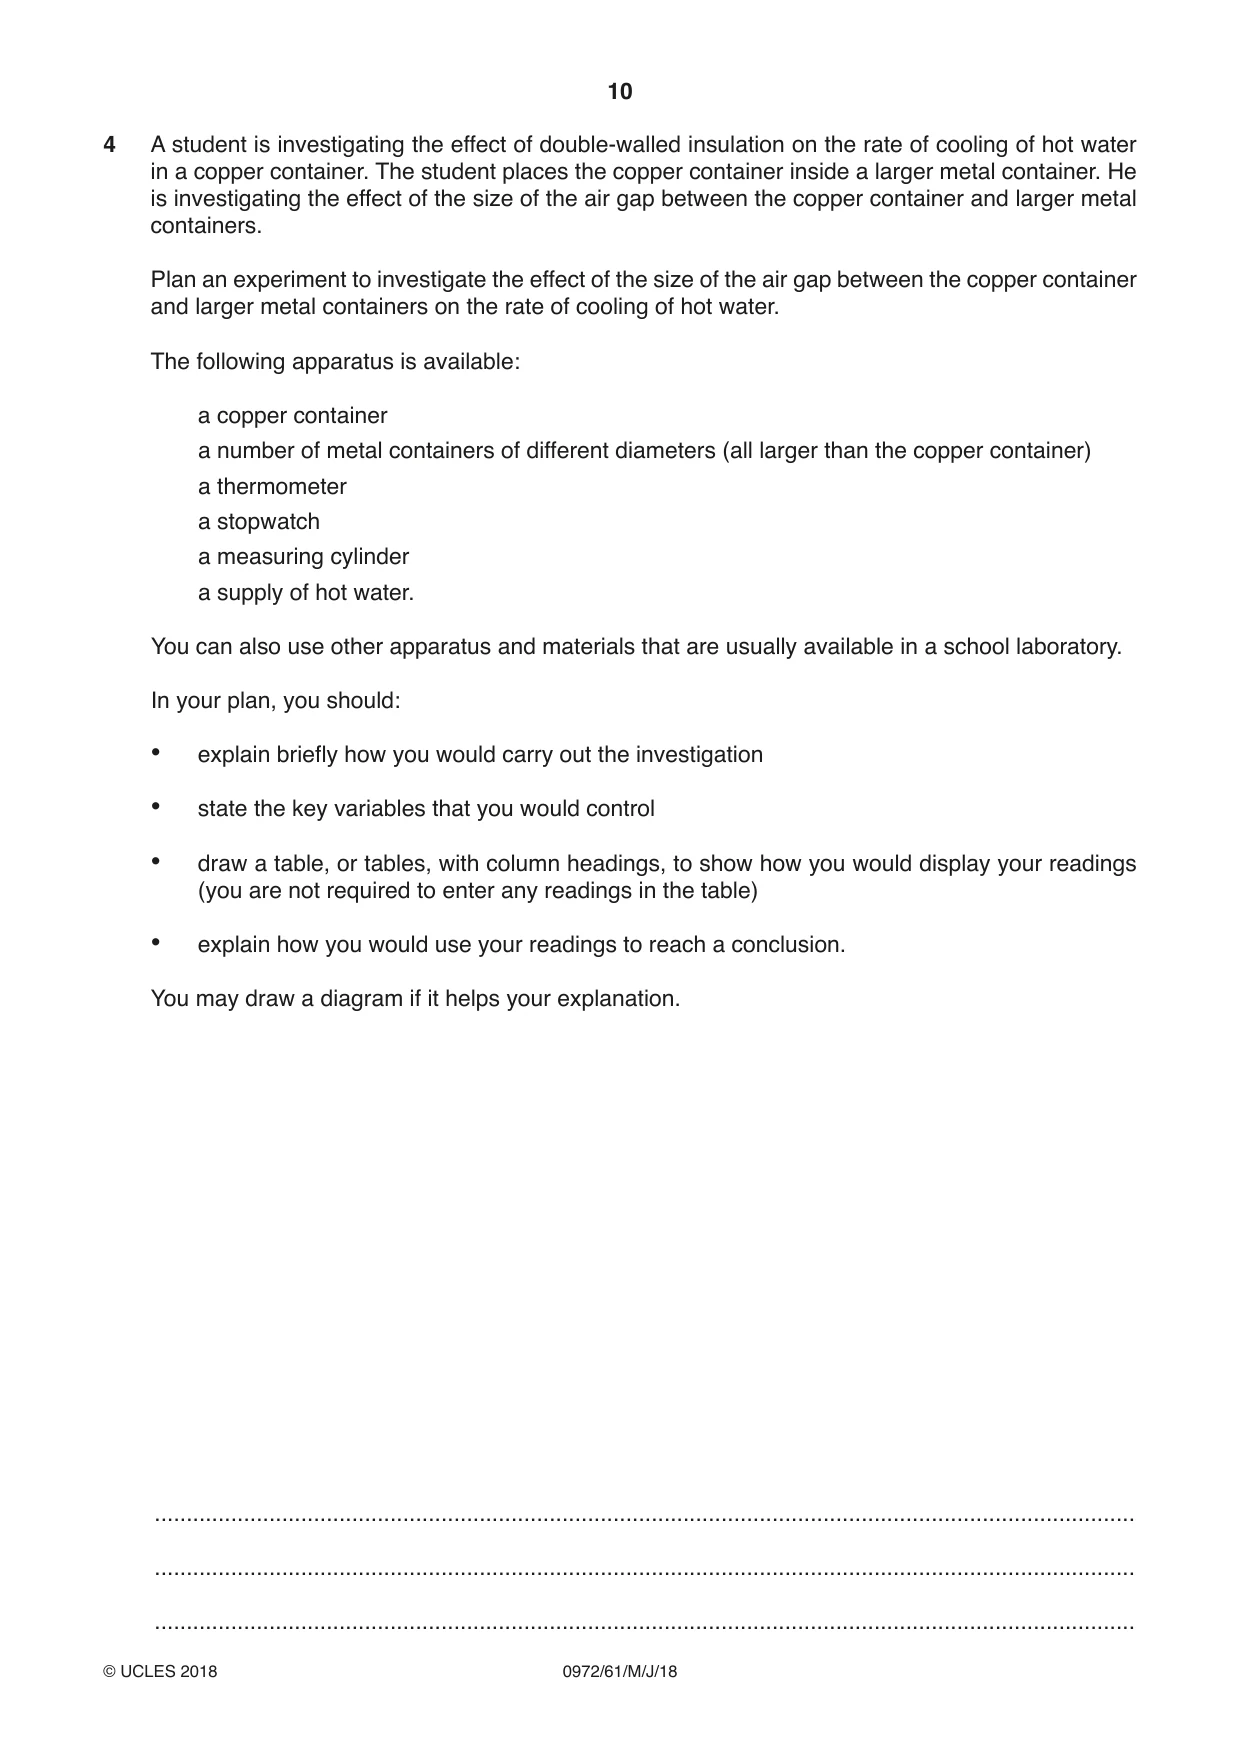

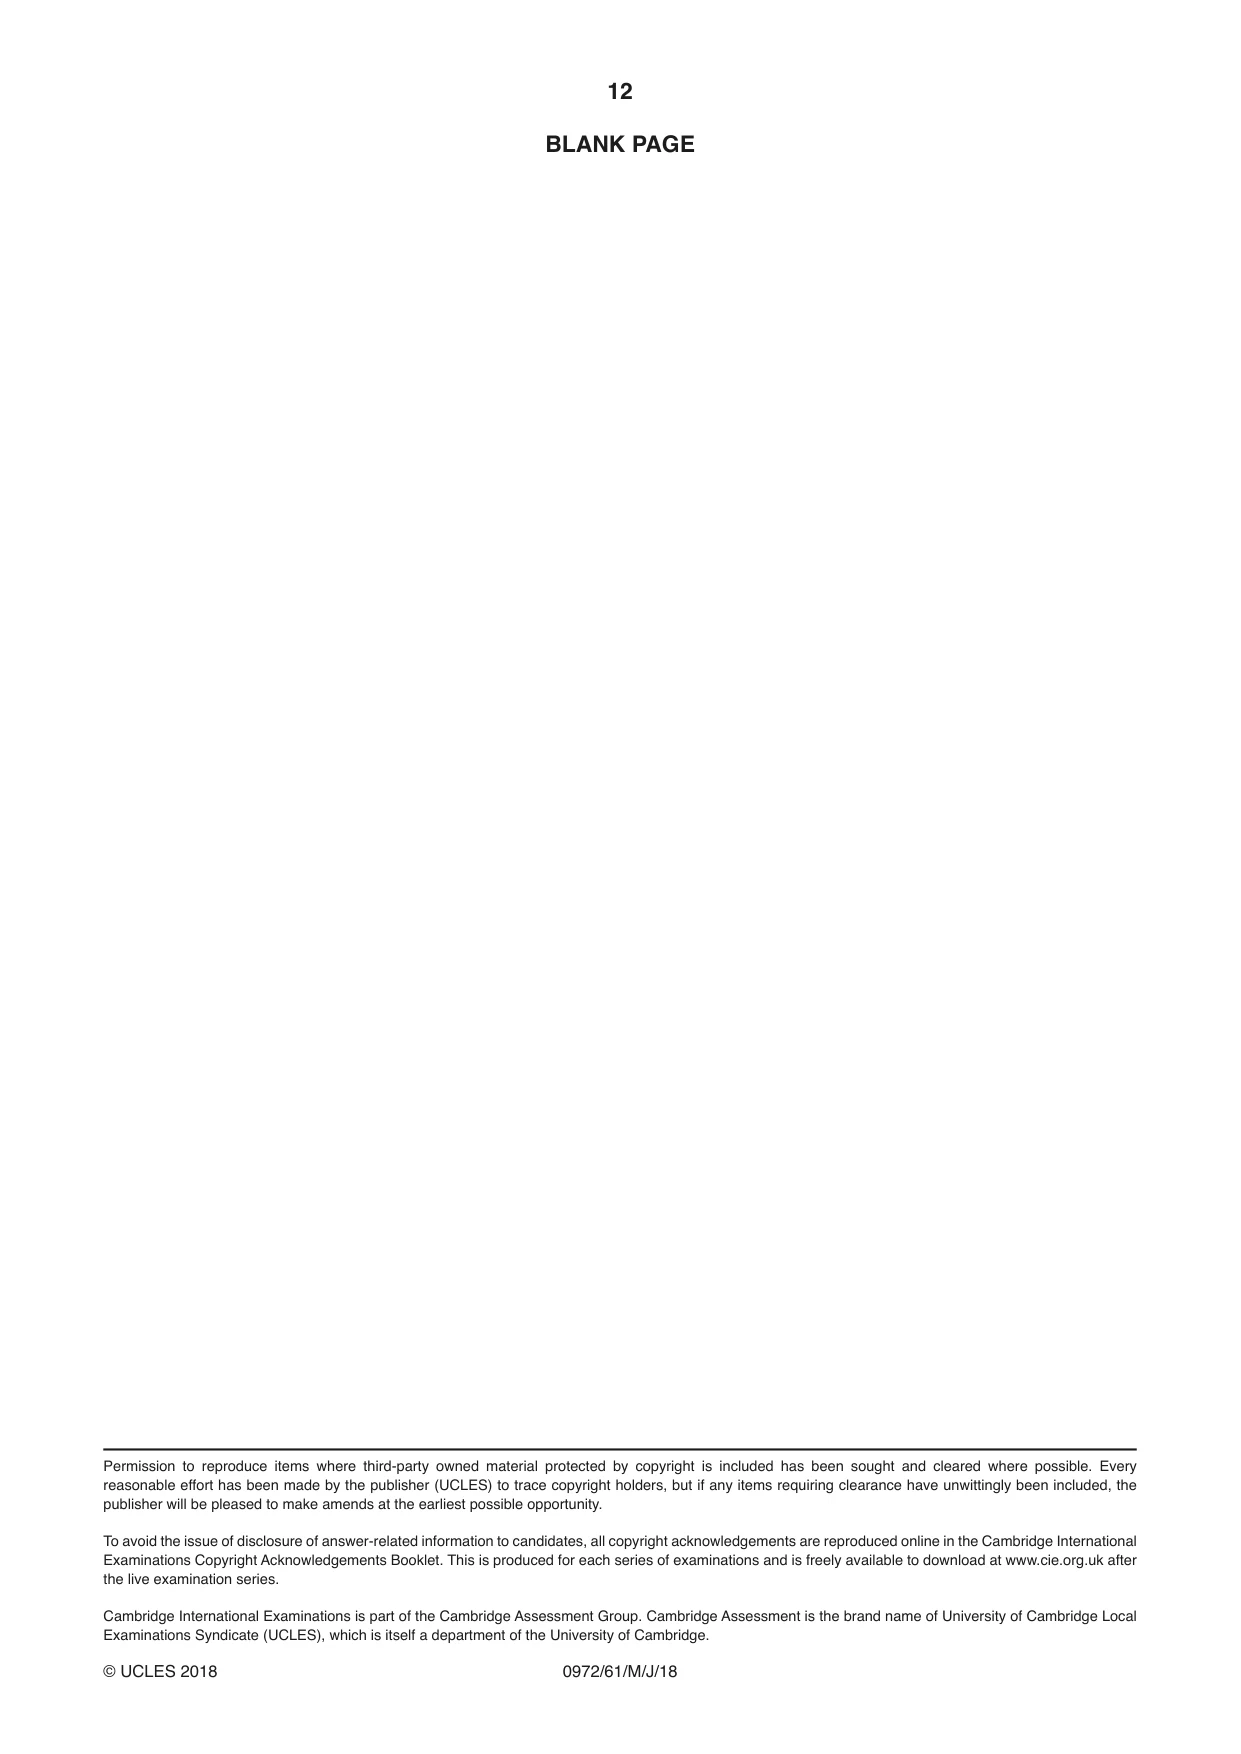
Mark scheme7 pages
Answers below. Sit the paper first if you are practising.
Questions as text
Q1 · A student is determining the acceleration of free fall g using a pendulum
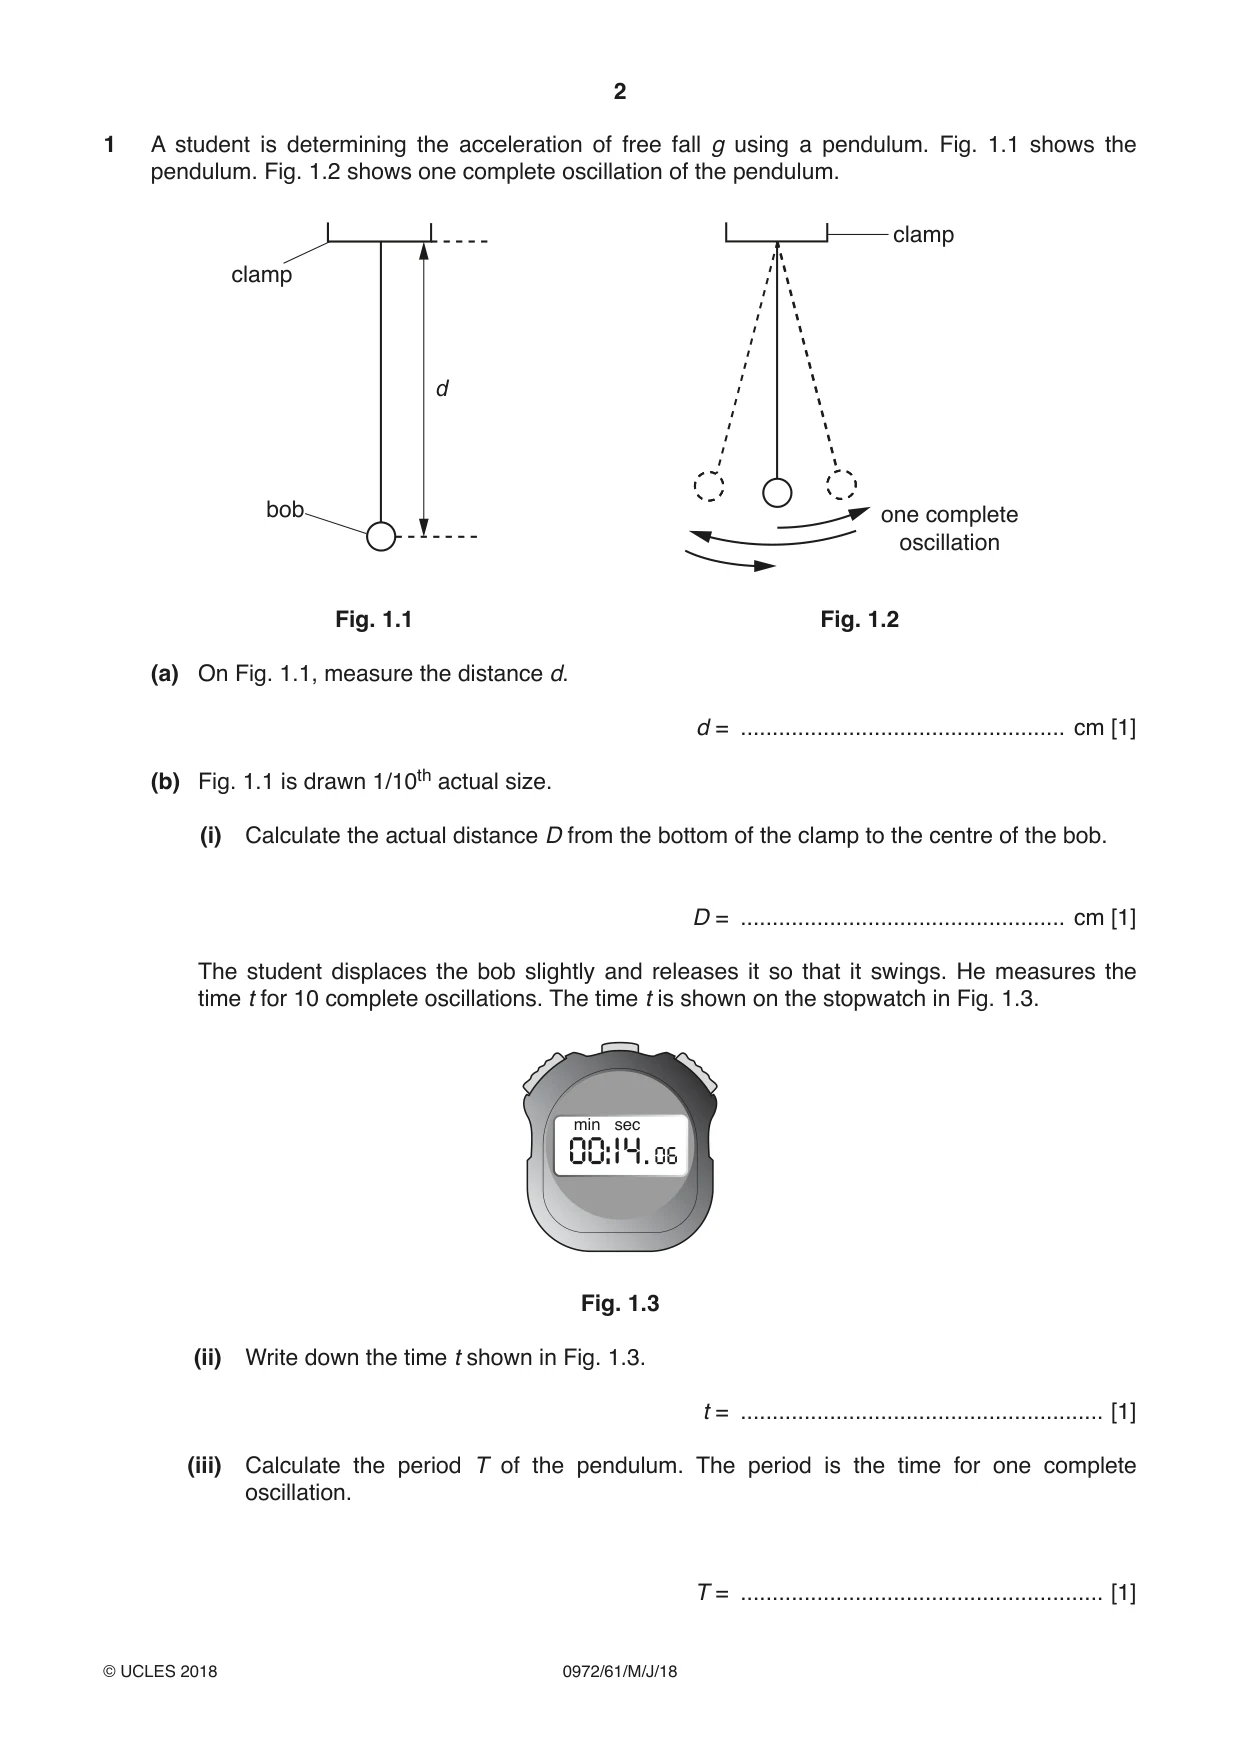
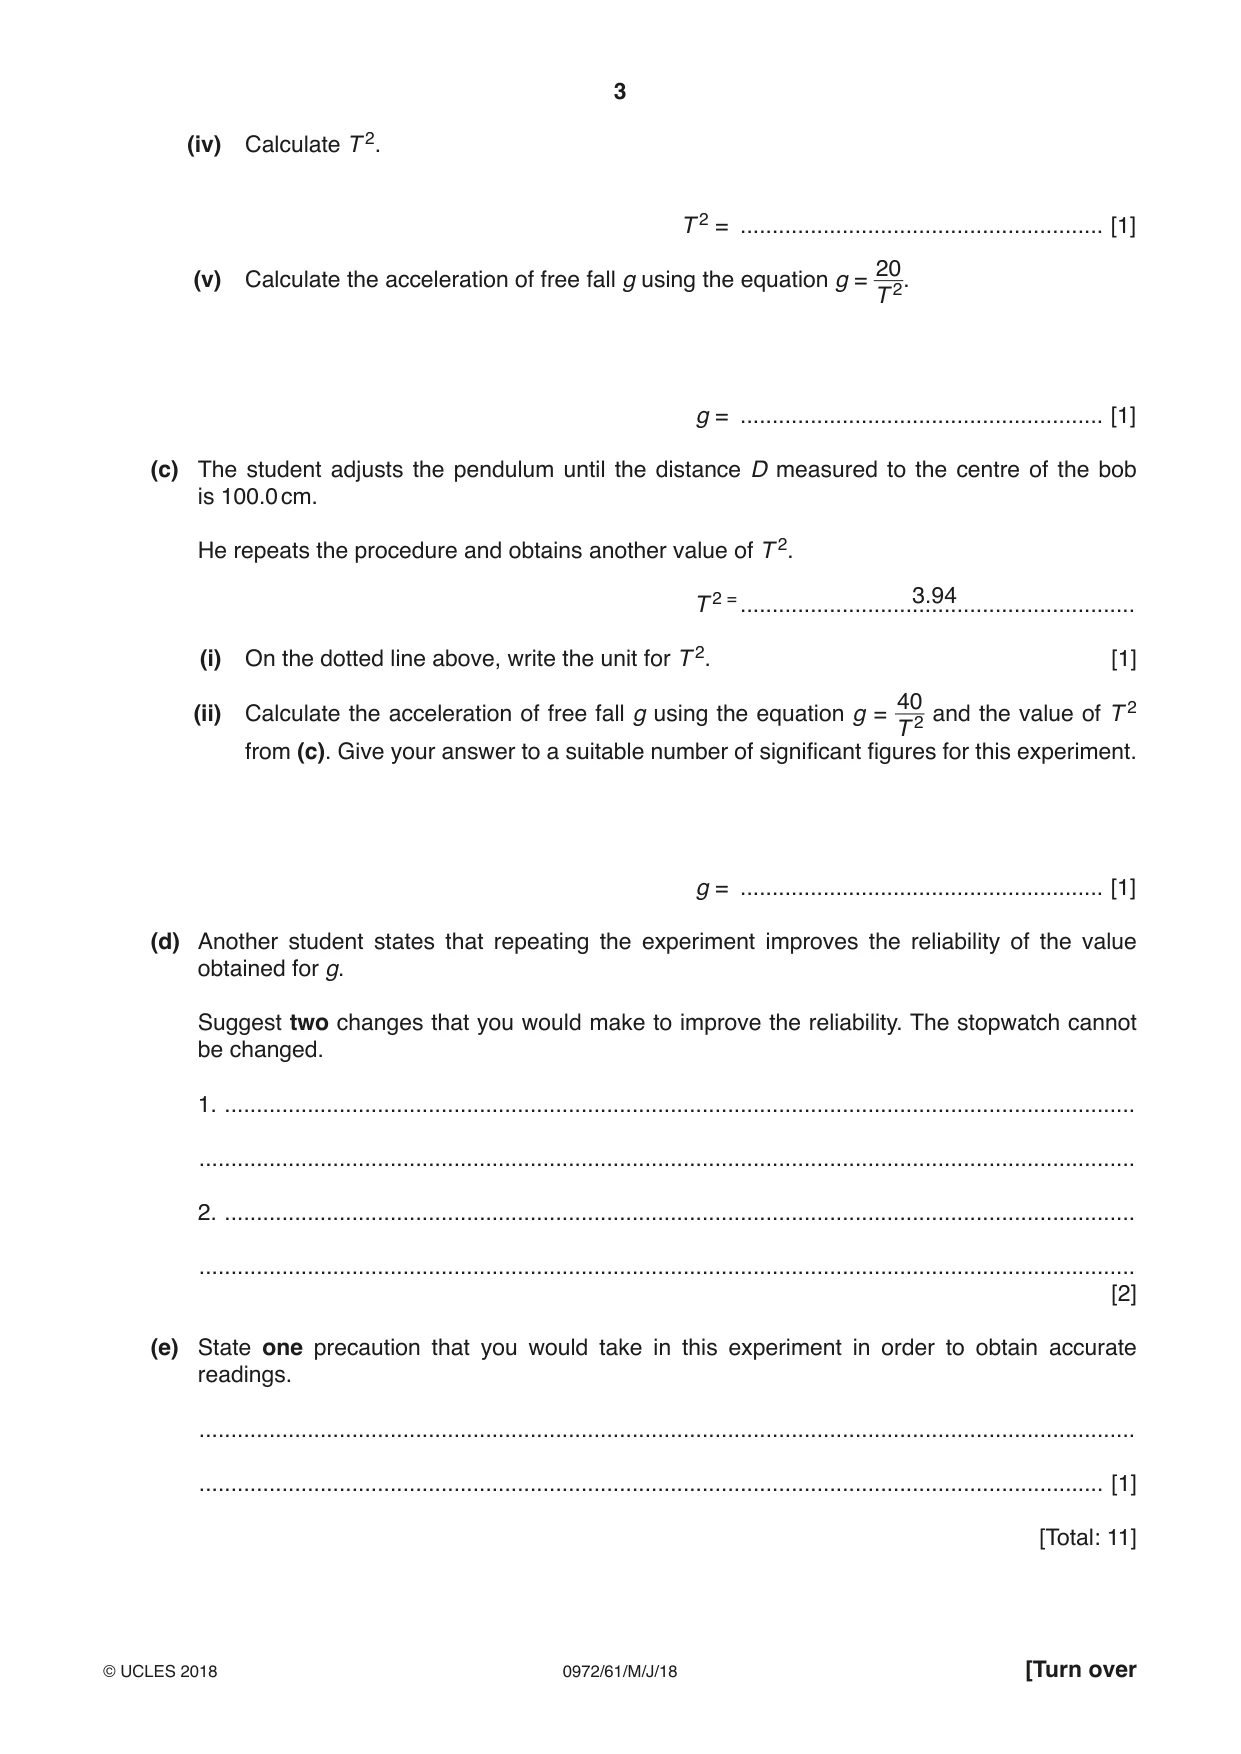
1 A student is determining the acceleration of free fall g using a pendulum. Fig. 1.1 shows the pendulum. Fig. 1.2 shows one complete oscillation of the pendulum. clamp clamp d bob one complete oscillation Fig. 1.1 Fig. 1.2 (a) On Fig. 1.1, measure the distance d. d = ................................................... cm [1] (b) Fig. 1.1 is drawn 1/10th actual size. (i) Calculate the actual distance D from the bottom of the clamp to the centre of the bob. D = ................................................... cm [1] The student displaces the bob slightly and releases it so that it swings. He measures the time t for 10 complete oscillations. The time t is shown on the stopwatch in Fig. 1.3. min sec Fig. 1.3 (ii) Write down the time t shown in Fig. 1.3. t = ......................................................... [1] (iii) Calculate the period T of the pendulum. The period is the time for one complete oscillation. T = ......................................................... [1] (iv) Calculate T 2. T 2 = ......................................................... [1] 20 (v) Calculate the acceleration of free fall g using the equation g = 2. T g = ......................................................... [1] (c) The student adjusts the pendulum until the distance D measured to the centre of the bob is 100.0 cm. He repeats the procedure and obtains another value of T 2. 2 = 3.94 T .............................................................. (i) On the dotted line above, write the unit for T 2. [1] 40 2 (ii) Calculate the acceleration of free fall g using the equation g = 2 and the value of T T from (c). Give your answer to a suitable number of significant figures for this experiment. g = ......................................................... [1] (d) Another student states that repeating the experiment improves the reliability of the value obtained for g. Suggest two changes that you would make to improve the reliability. The stopwatch cannot be changed. 1. ............................................................................................................................................... ................................................................................................................................................... 2. ............................................................................................................................................... ................................................................................................................................................... [2] (e) State one precaution that you would take in this experiment in order to obtain accurate readings. ................................................................................................................................................... .............................................................................................................................................. [1] [Total: 11]
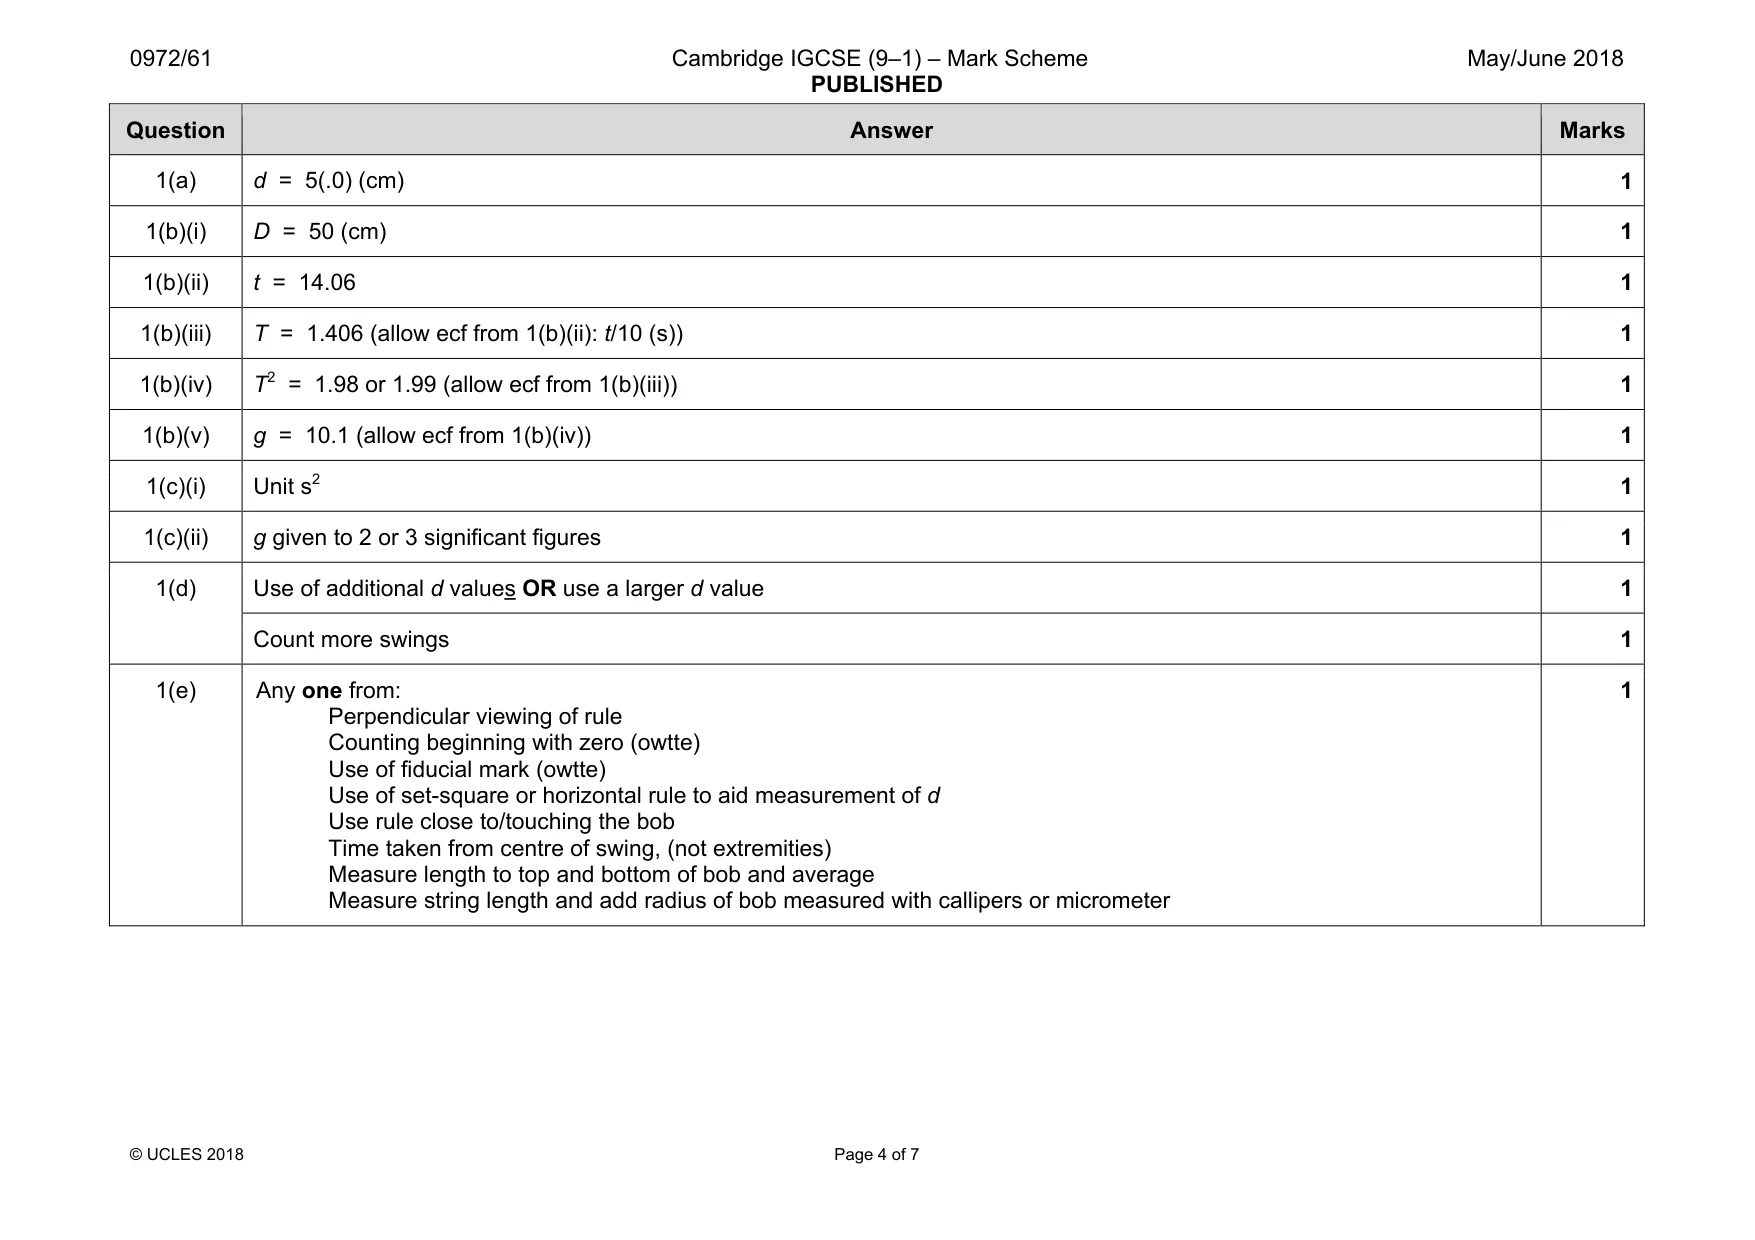
Mark scheme: 1(a) d = 5(.0) (cm) 1 1(b)(i) D = 50 (cm) 1 1(b)(ii) t = 14.06 1 1(b)(iii) T = 1.406 (allow ecf from 1(b)(ii): t/10 (s)) 1 1(b)(iv) T2 = 1.98 or 1.99 (allow ecf from 1(b)(iii)) 1 1(b)(v) g = 10.1 (allow ecf from 1(b)(iv)) 1 1(c)(i) Unit s2 1 1(c)(ii) g given to 2 or 3 significant figures 1 1(d) Use of additional d values OR use a larger d value 1 Count more swings 1 1(e) Any one from: Perpendicular viewing of rule Counting beginning with zero (owtte) Use of fiducial mark (owtte) Use of set-square or horizontal rule to aid measurement of d Use rule close to/touching the bob Time taken from centre of swing, (not extremities) Measure length to top and bottom of bob and average Measure string length and add radius of bob measured with callipers or micrometer 1
More questions on Physical quantities and measurement techniques
Q2 · A student is investigating resistance
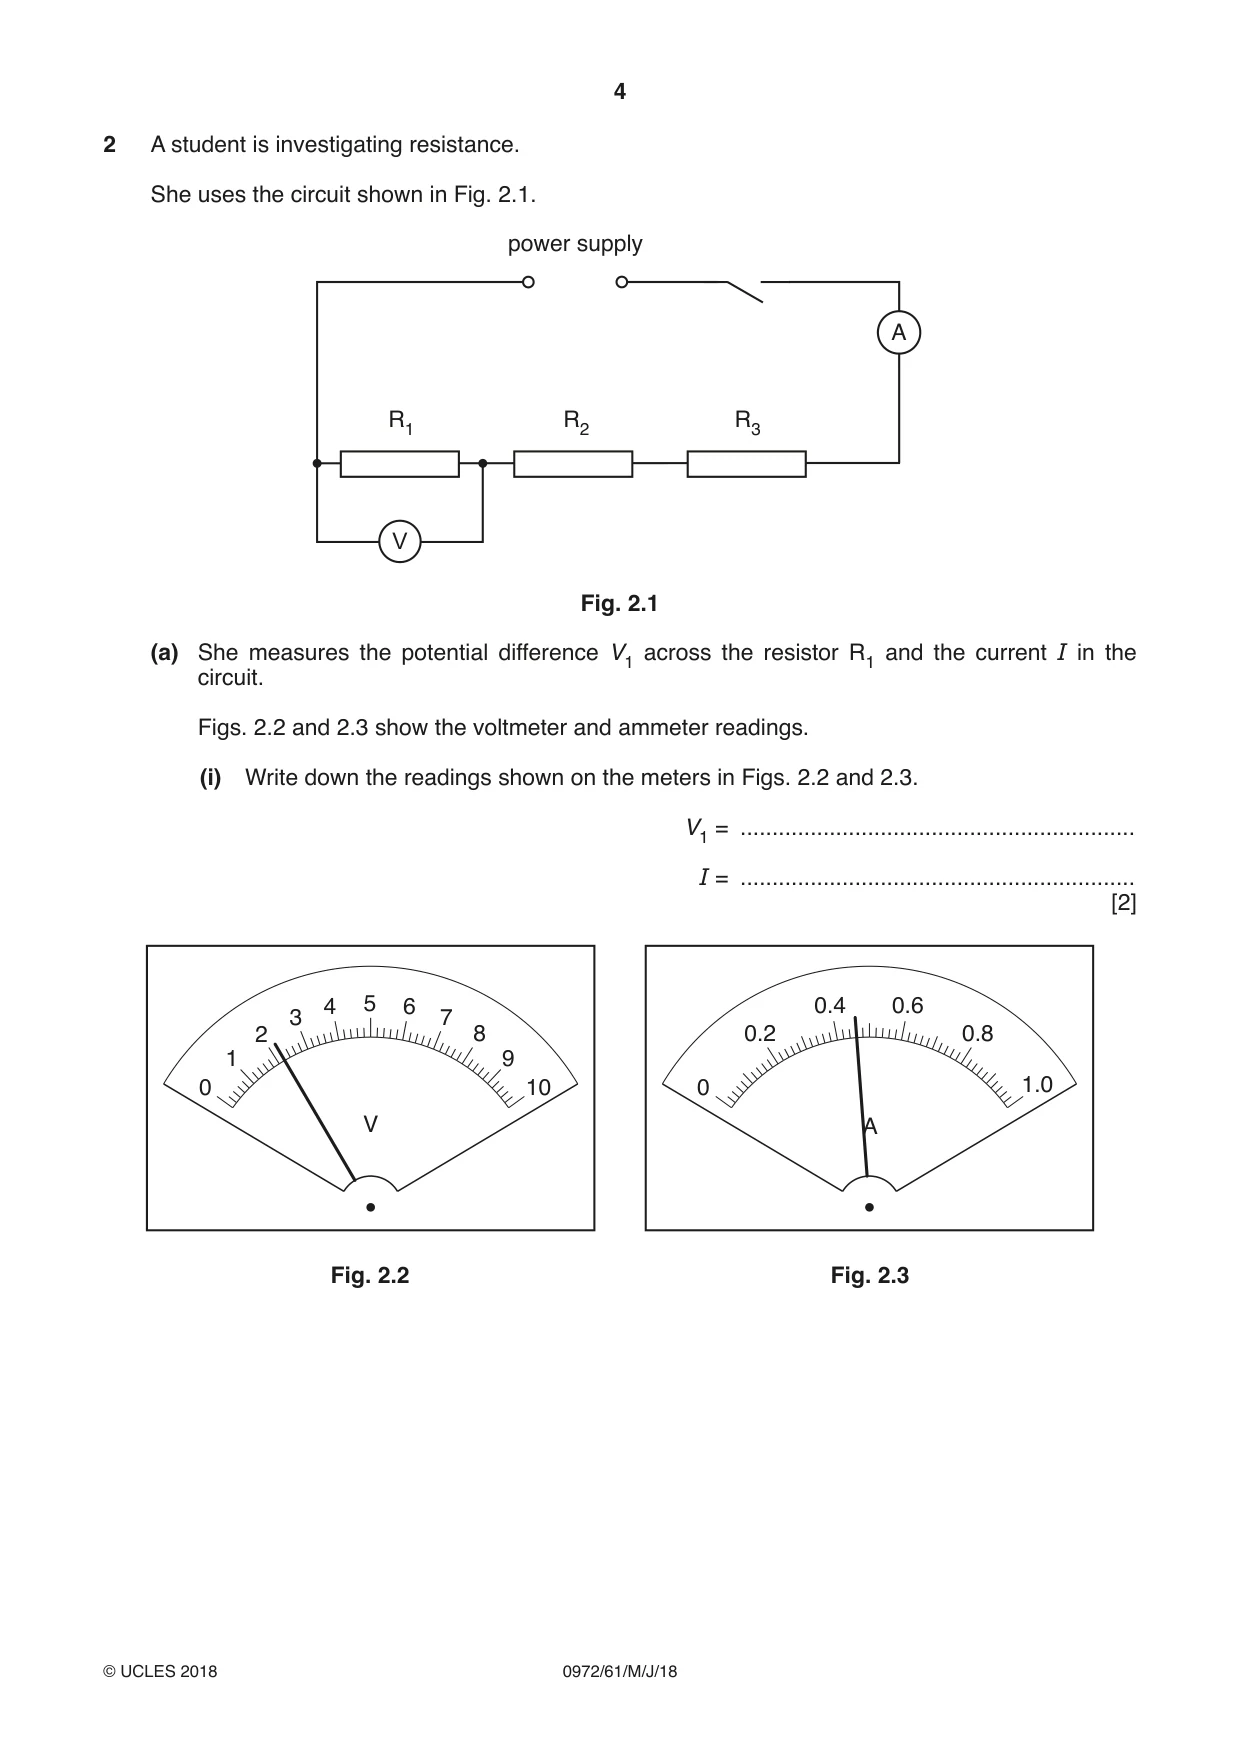
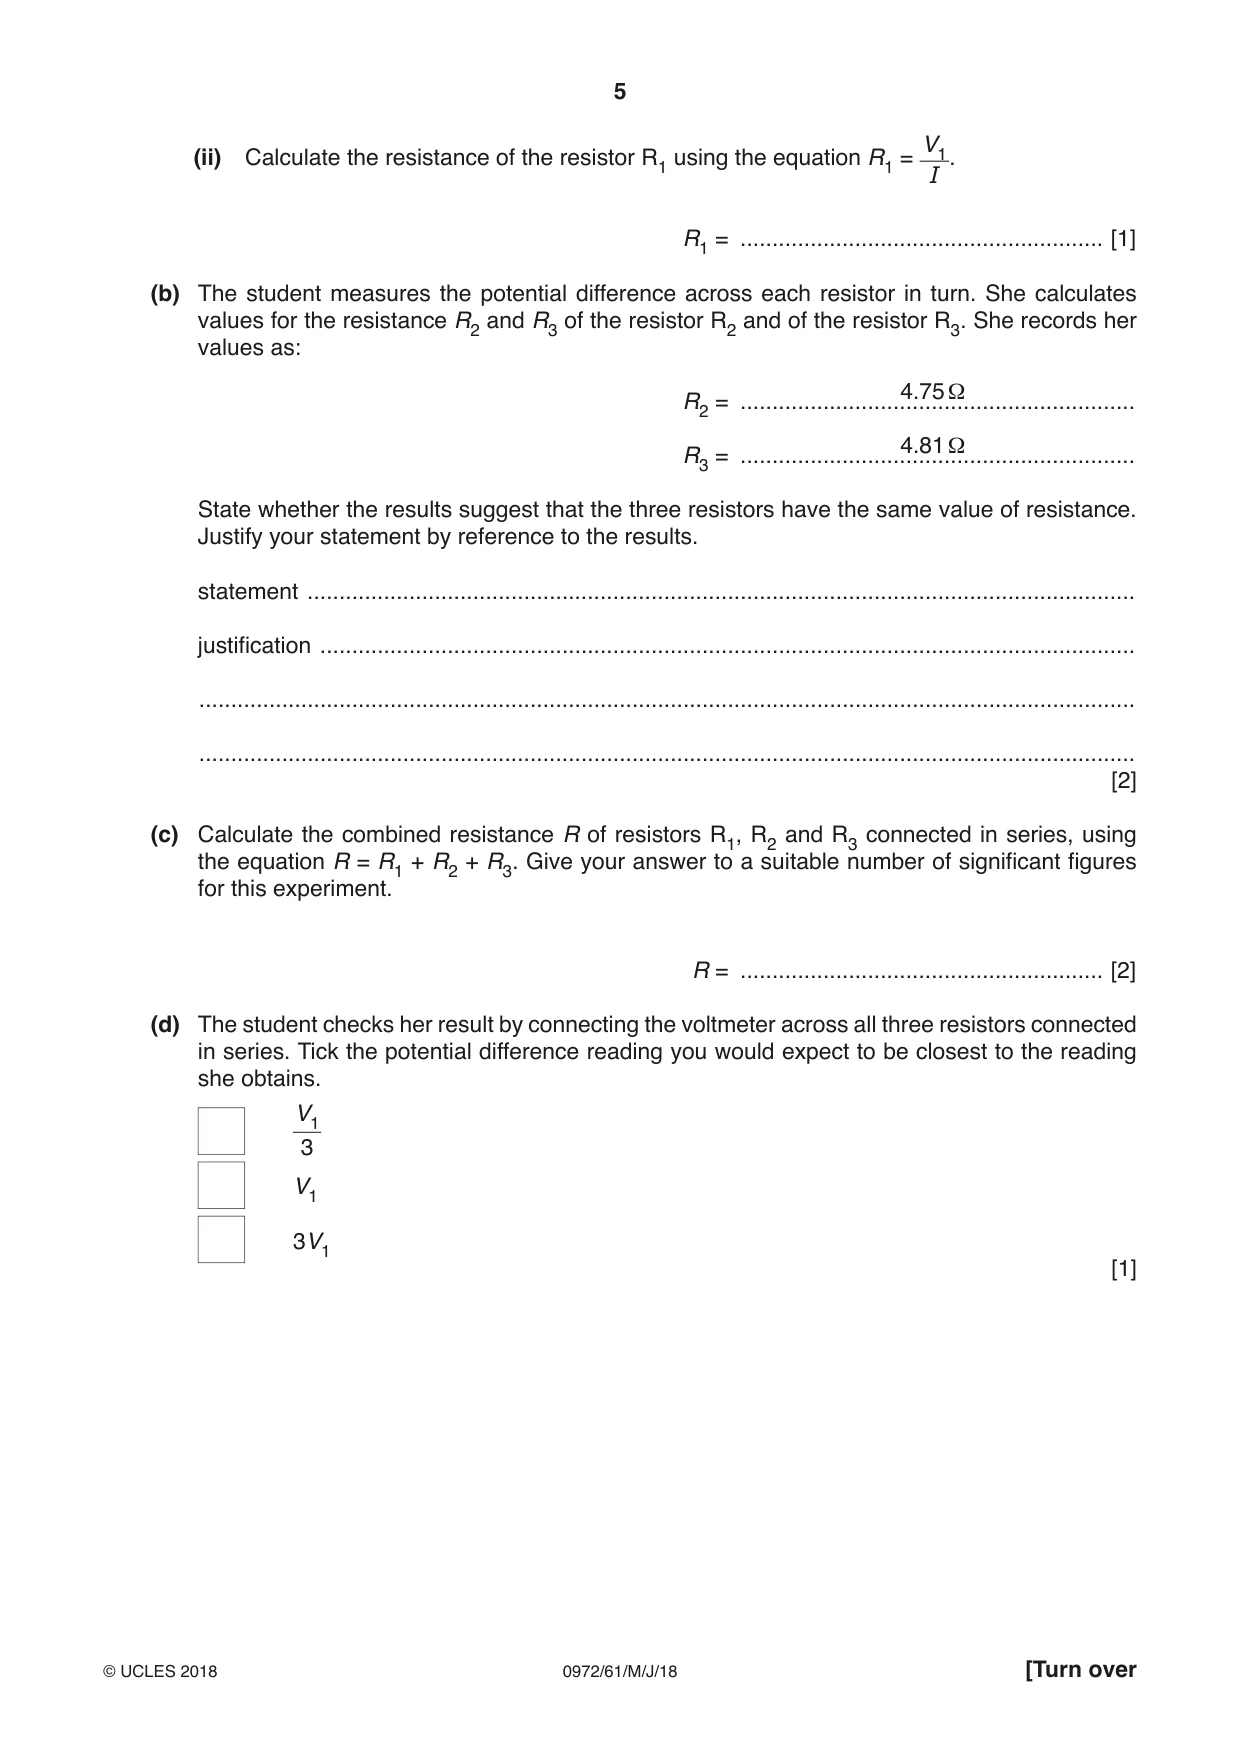
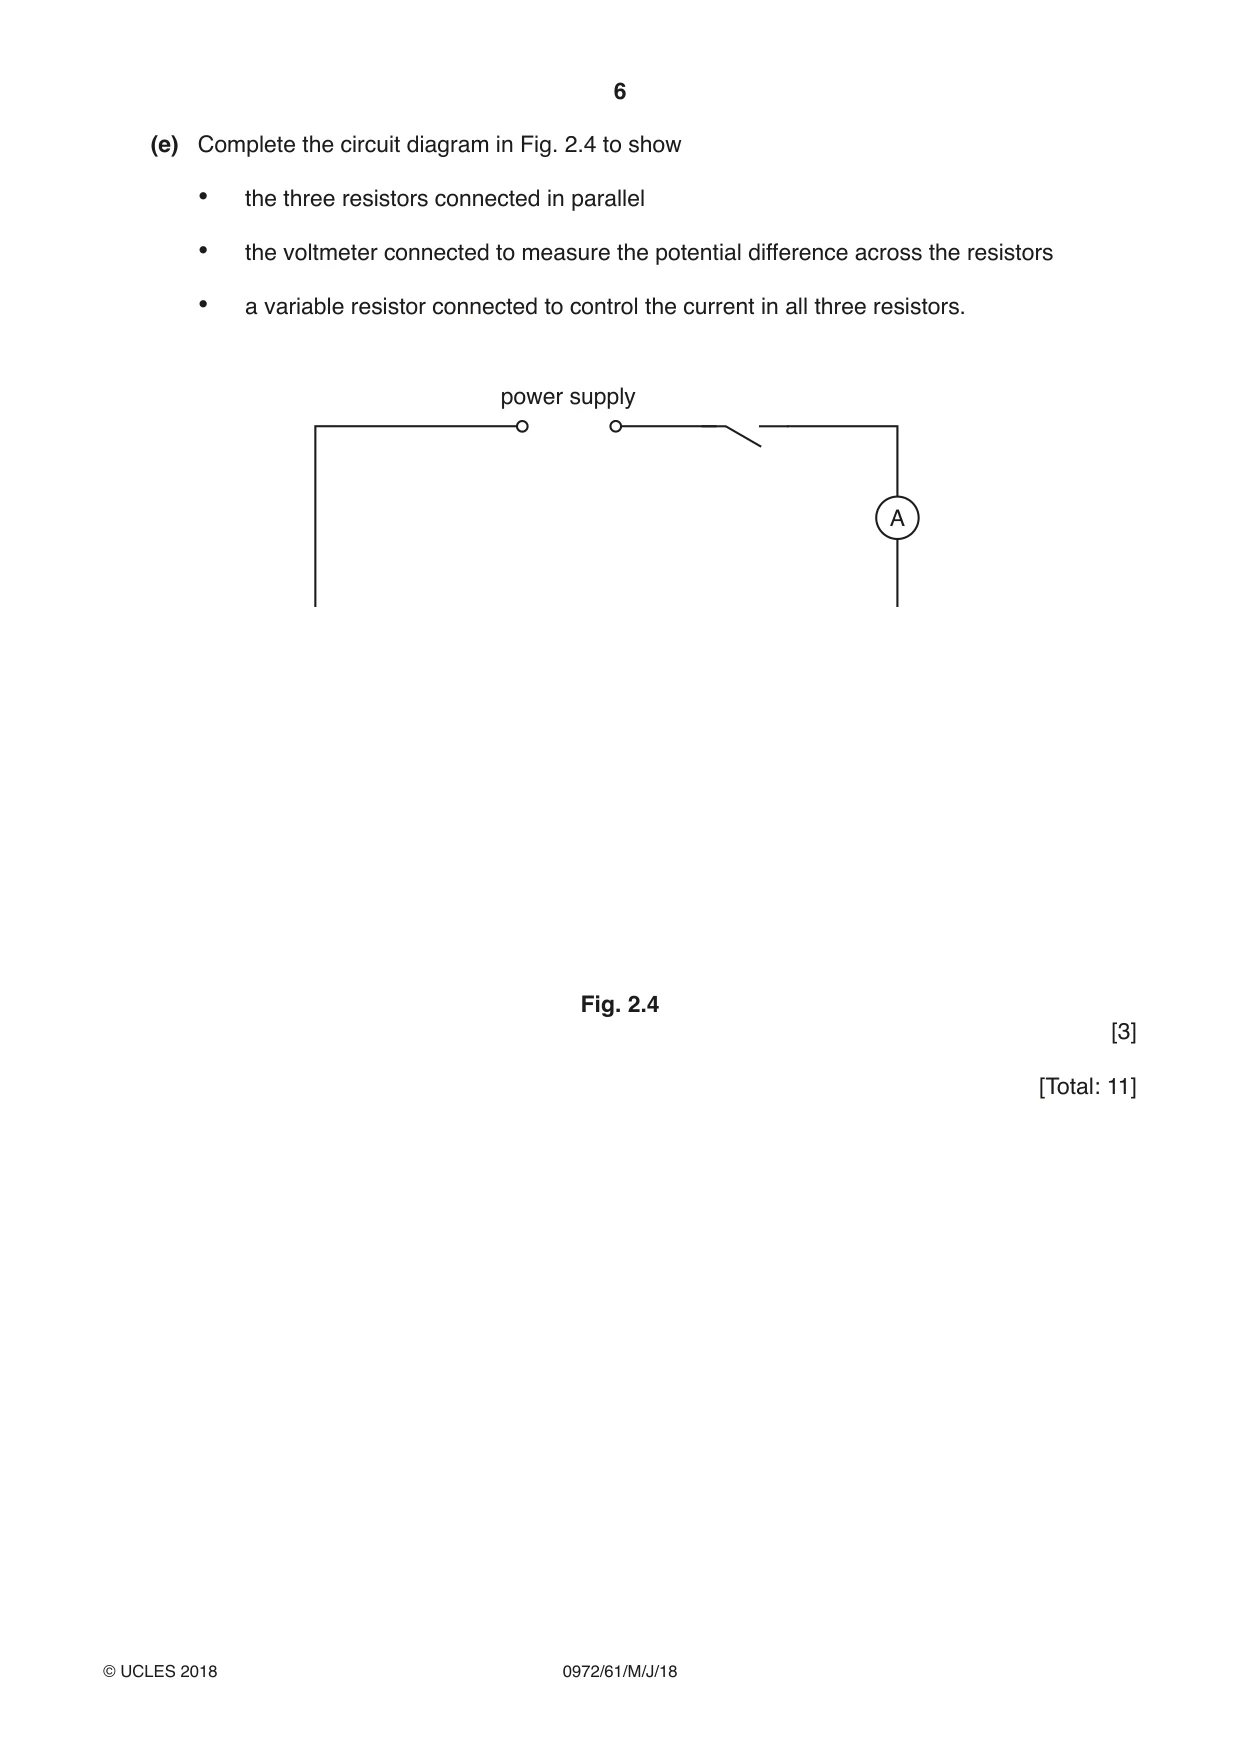
2 A student is investigating resistance. She uses the circuit shown in Fig. 2.1. power supply A R1 R2 R3 V Fig. 2.1 (a) She measures the potential difference V1 across the resistor R1 and the current I in the circuit. Figs. 2.2 and 2.3 show the voltmeter and ammeter readings. (i) Write down the readings shown on the meters in Figs. 2.2 and 2.3. V1 = .............................................................. I = .............................................................. [2] 4 5 6 0.4 0.6 3 7 2 8 0.2 0.8 1 9 0 10 0 1.0 V A Fig. 2.2 Fig. 2.3 V1 (ii) Calculate the resistance of the resistor R1 using the equation R1 = . I R1 = ......................................................... [1] (b) The student measures the potential difference across each resistor in turn. She calculates values for the resistance R2 and R3 of the resistor R2 and of the resistor R3. She records her values as: 4.75 Ω R2 = .............................................................. 4.81 Ω R3 = .............................................................. State whether the results suggest that the three resistors have the same value of resistance. Justify your statement by reference to the results. statement .................................................................................................................................. justification ................................................................................................................................ ................................................................................................................................................... ................................................................................................................................................... [2] (c) Calculate the combined resistance R of resistors R1, R2 and R3 connected in series, using the equation R = R1 + R2 + R3. Give your answer to a suitable number of significant figures for this experiment. R = ......................................................... [2] (d) The student checks her result by connecting the voltmeter across all three resistors connected in series. Tick the potential difference reading you would expect to be closest to the reading she obtains. V1 3 V1 3V1 [1] (e) Complete the circuit diagram in Fig. 2.4 to show • the three resistors connected in parallel • the voltmeter connected to measure the potential difference across the resistors • a variable resistor connected to control the current in all three resistors. power supply A Fig. 2.4 [3] [Total: 11] Question 3 starts on the next page.
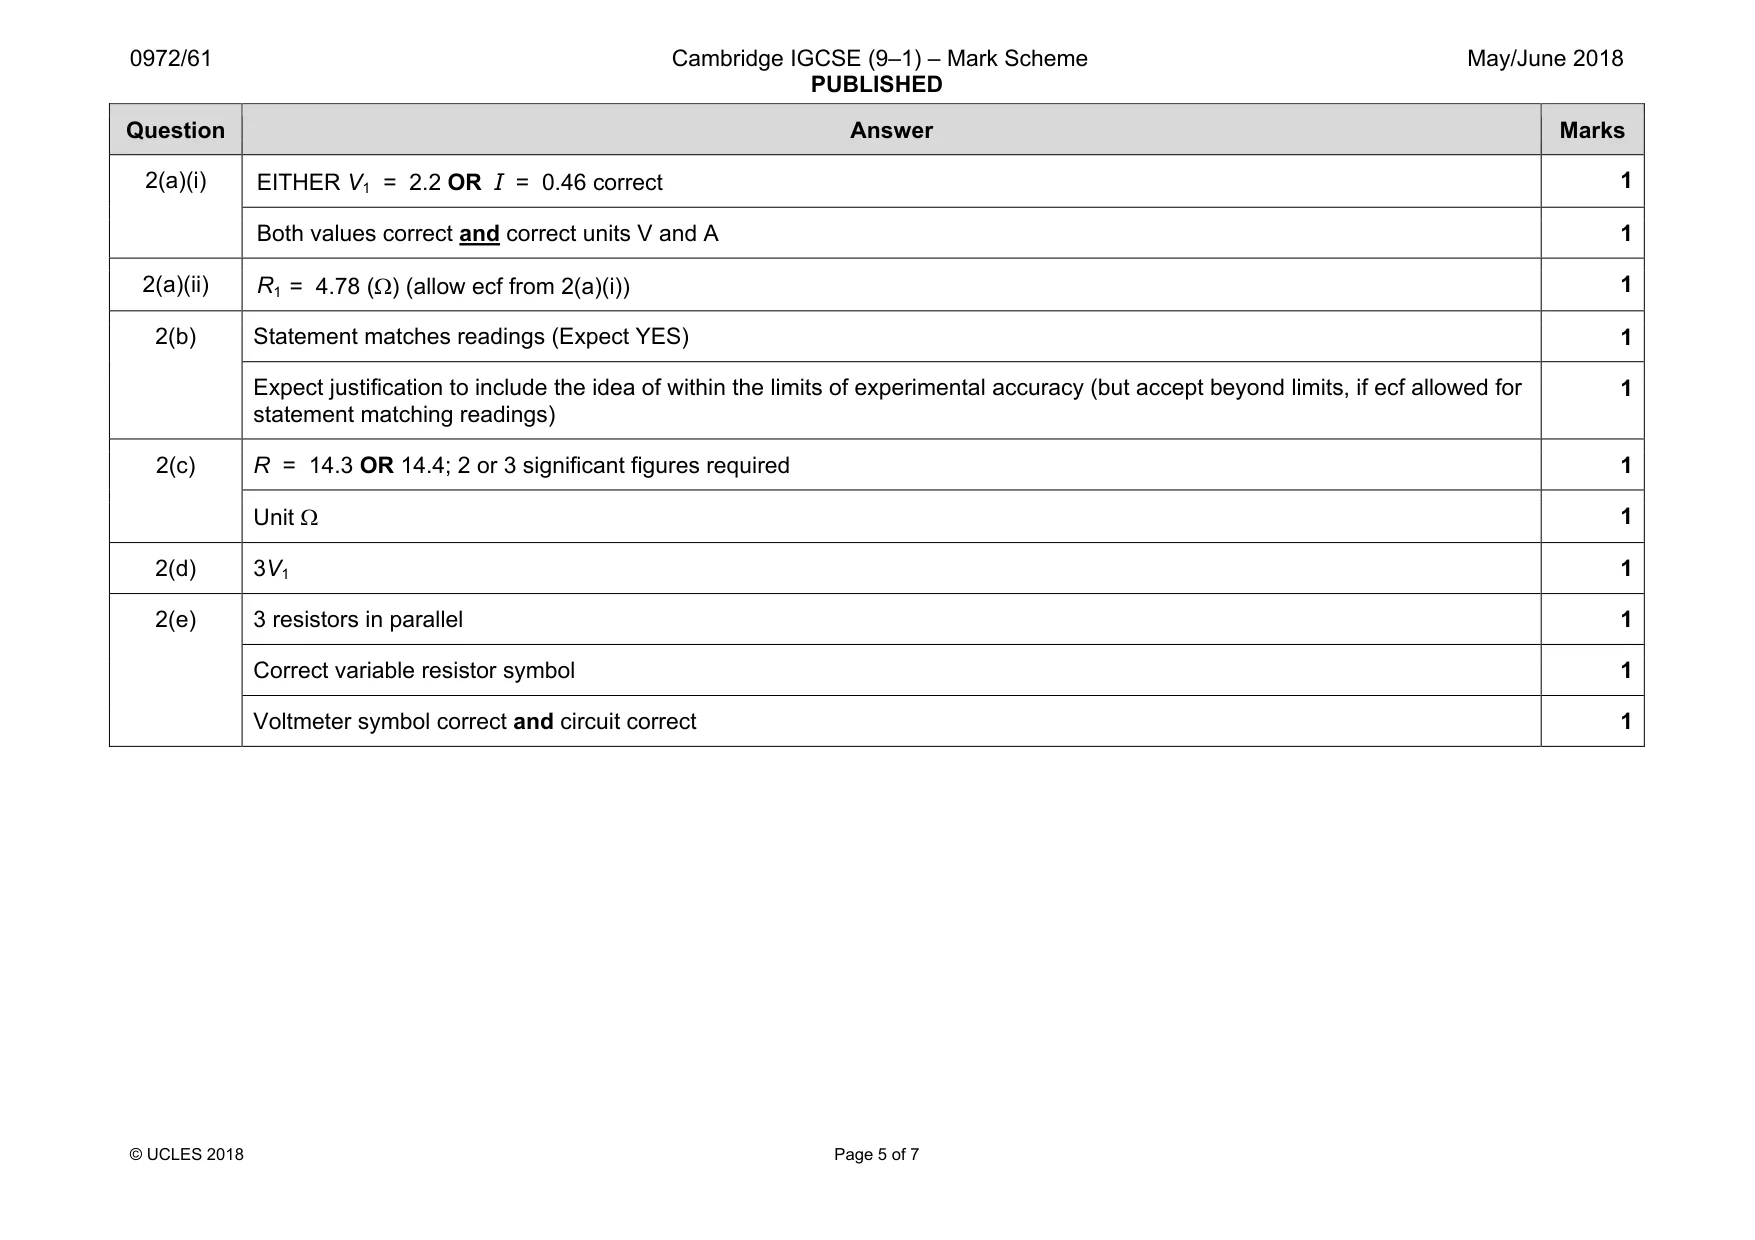
Mark scheme: 2(a)(i) 1 Both values correct and correct units V and A 1 2(a)(ii) R1 = 4.78 (Ω) (allow ecf from 2(a)(i)) 1 2(b) Statement matches readings (Expect YES) 1 Expect justification to include the idea of within the limits of experimental accuracy (but accept beyond limits, if ecf allowed for statement matching readings) 1 2(c) R = 14.3 OR 14.4; 2 or 3 significant figures required 1 Unit Ω 1 2(d) 3V1 1 2(e) 3 resistors in parallel 1 Correct variable resistor symbol 1 Voltmeter symbol correct and circuit correct 1
Q3 · A student is determining the focal length f of a lens
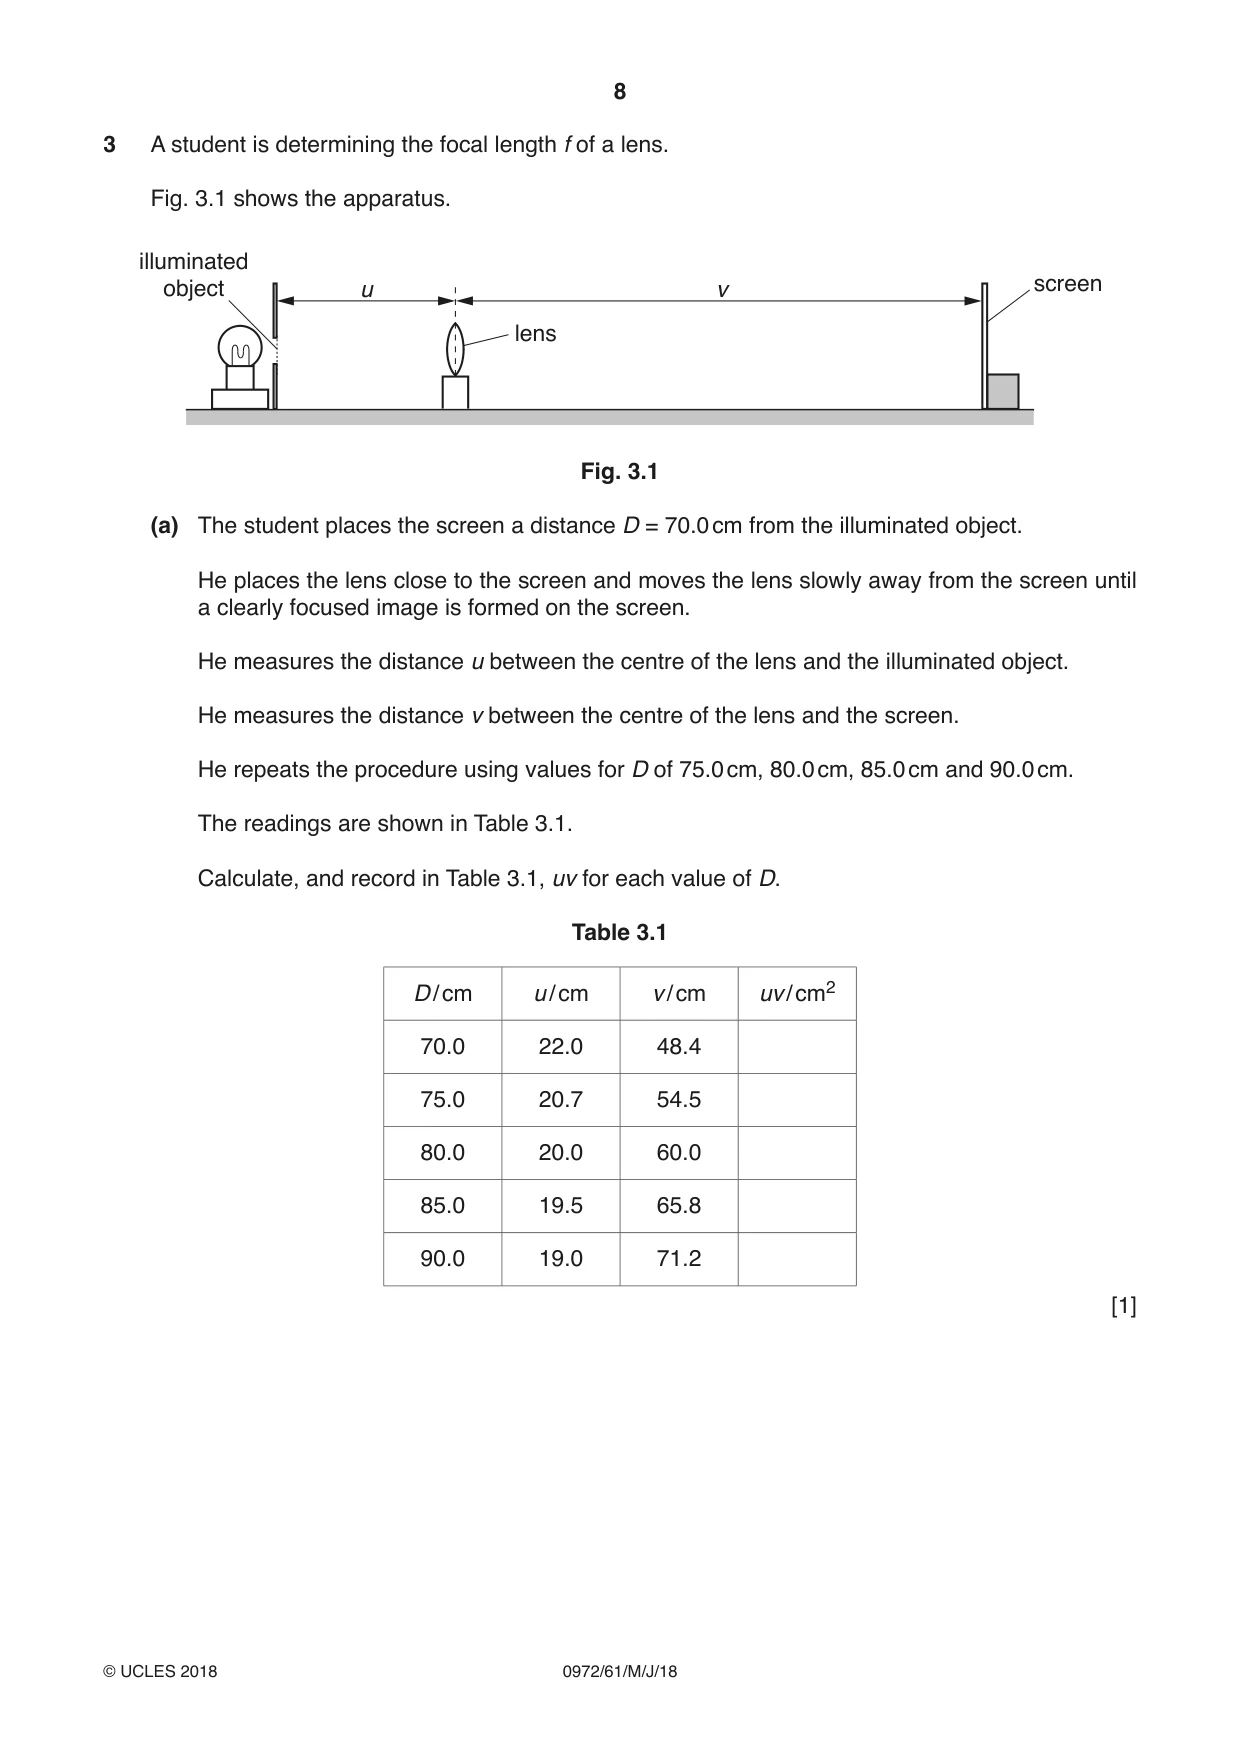
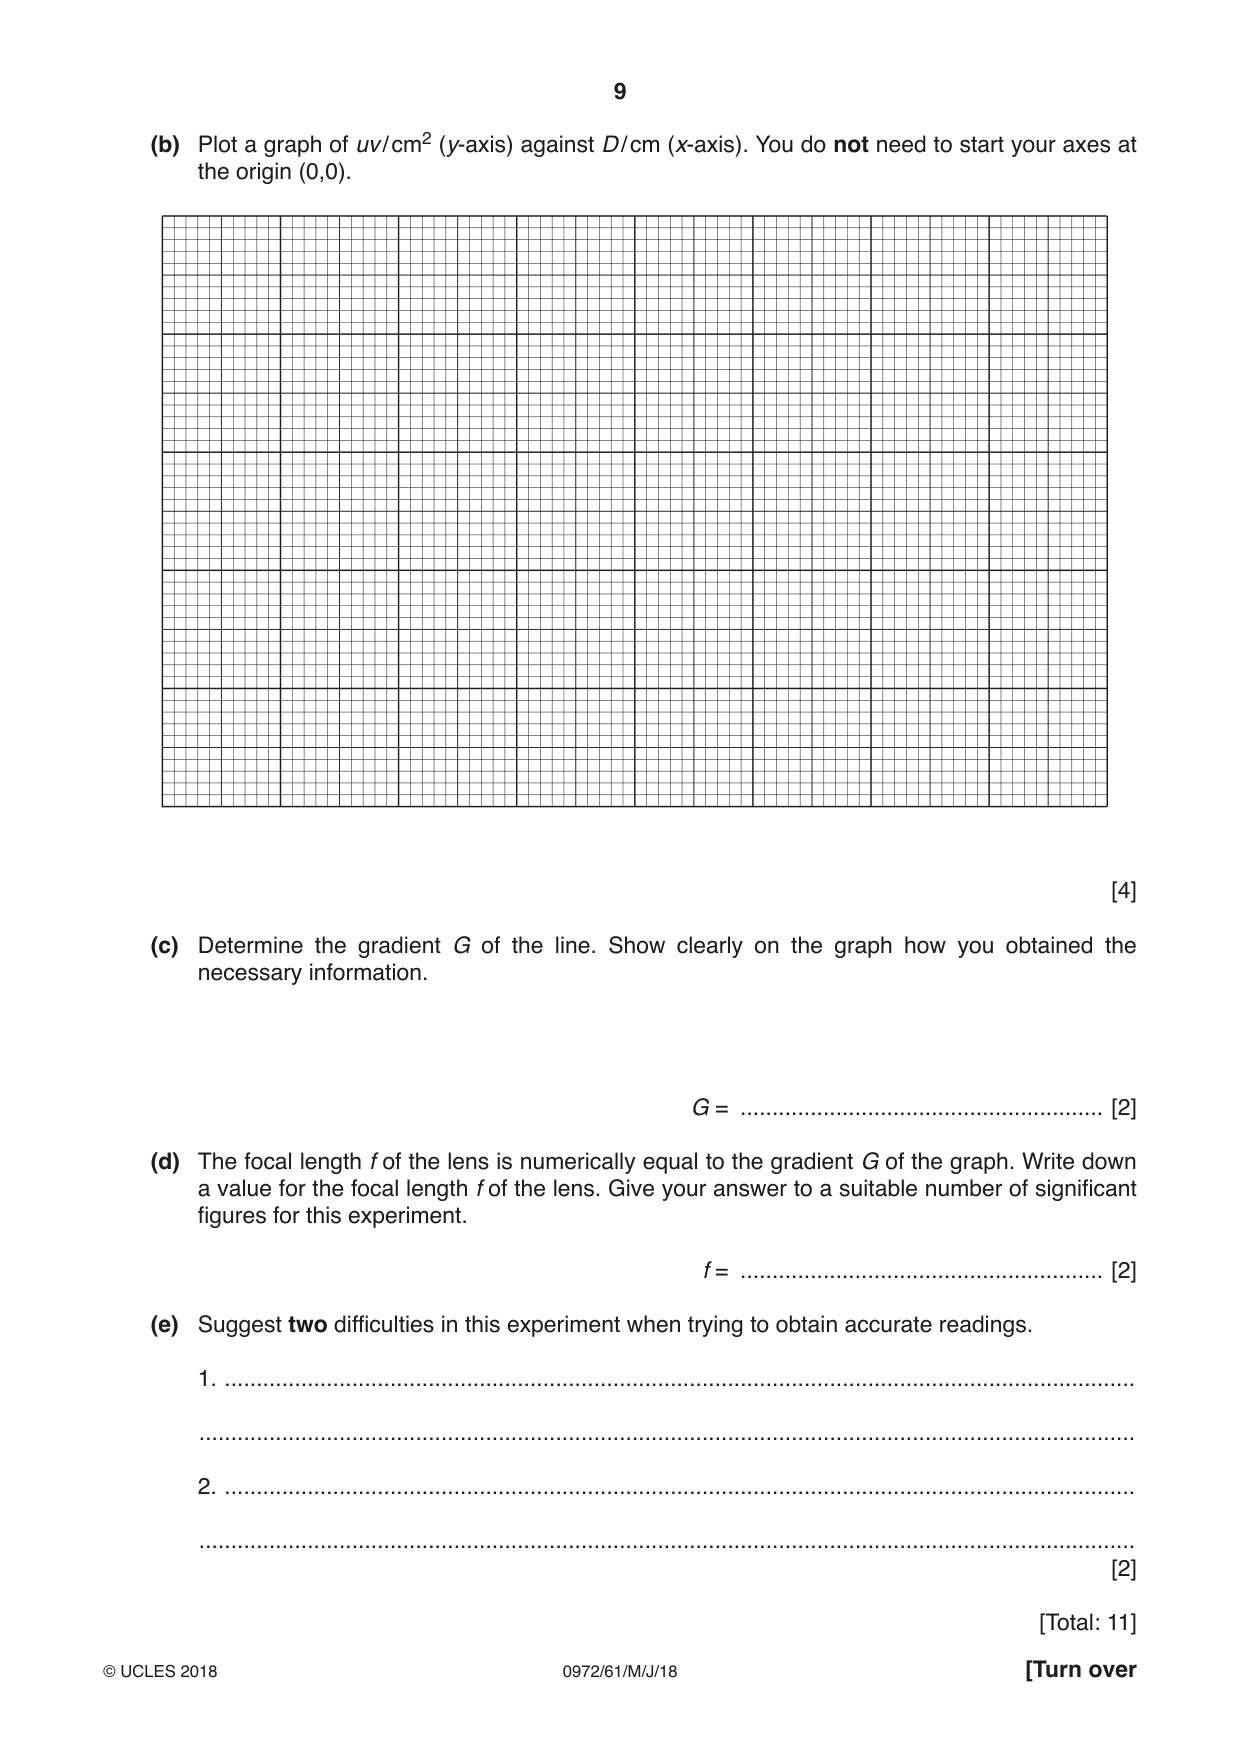
3 A student is determining the focal length f of a lens. Fig. 3.1 shows the apparatus. illuminated object u v screen lens Fig. 3.1 (a) The student places the screen a distance D = 70.0 cm from the illuminated object. He places the lens close to the screen and moves the lens slowly away from the screen until a clearly focused image is formed on the screen. He measures the distance u between the centre of the lens and the illuminated object. He measures the distance v between the centre of the lens and the screen. He repeats the procedure using values for D of 75.0 cm, 80.0 cm, 85.0 cm and 90.0 cm. The readings are shown in Table 3.1. Calculate, and record in Table 3.1, uv for each value of D. Table 3.1 D / cm u / cm v / cm uv / cm2 70.0 22.0 48.4 75.0 20.7 54.5 80.0 20.0 60.0 85.0 19.5 65.8 90.0 19.0 71.2 [1] (b) Plot a graph of uv / cm2 (y-axis) against D / cm (x-axis). You do not need to start your axes at the origin (0,0). [4] (c) Determine the gradient G of the line. Show clearly on the graph how you obtained the necessary information. G = ......................................................... [2] (d) The focal length f of the lens is numerically equal to the gradient G of the graph. Write down a value for the focal length f of the lens. Give your answer to a suitable number of significant figures for this experiment. f = ......................................................... [2] (e) Suggest two difficulties in this experiment when trying to obtain accurate readings. 1. ............................................................................................................................................... ................................................................................................................................................... 2. ............................................................................................................................................... ................................................................................................................................................... [2] [Total: 11]
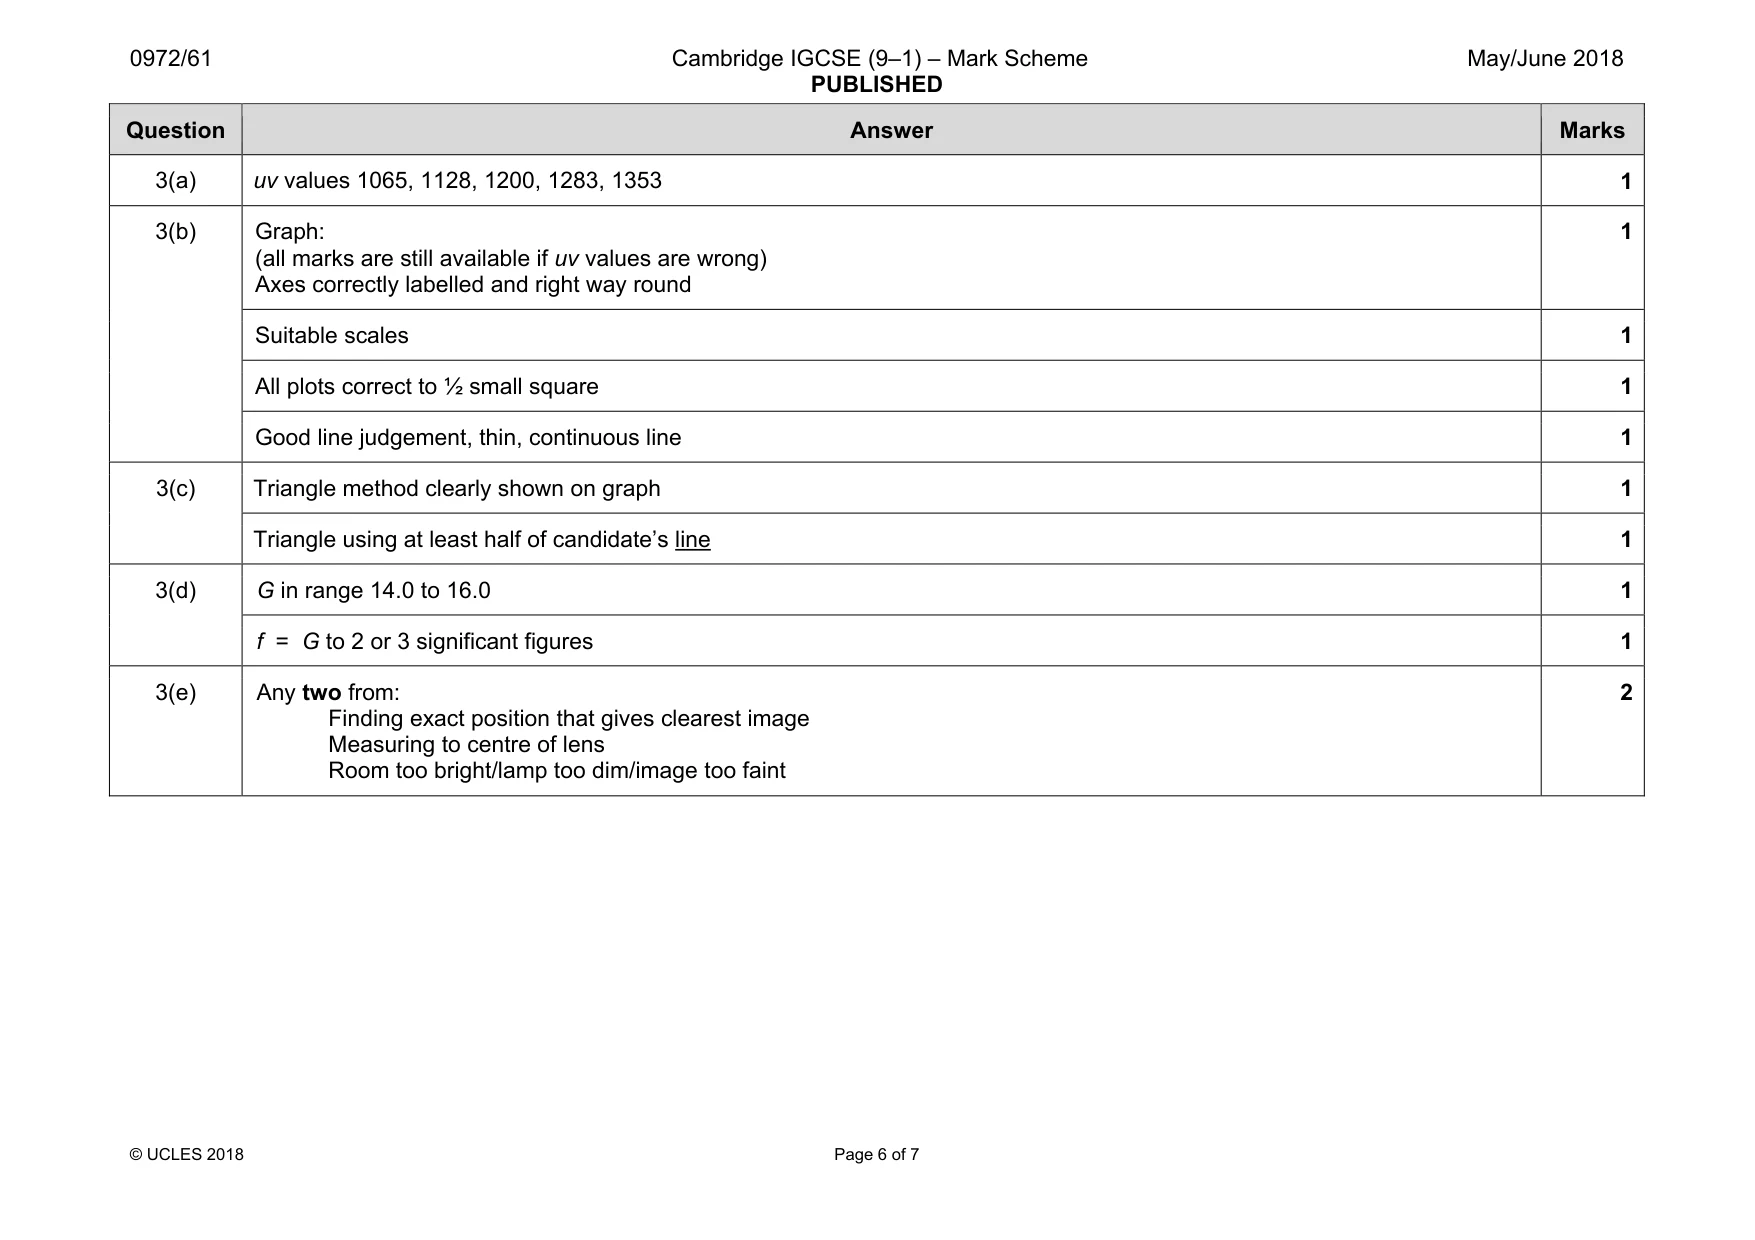
Mark scheme: 3(a) uv values 1065, 1128, 1200, 1283, 1353 1 3(b) Graph: (all marks are still available if uv values are wrong) Axes correctly labelled and right way round 1 Suitable scales 1 All plots correct to ½ small square 1 Good line judgement, thin, continuous line 1 3(c) Triangle method clearly shown on graph 1 Triangle using at least half of candidate’s line 1 3(d) G in range 14.0 to 16.0 1 f = G to 2 or 3 significant figures 1 3(e) Any two from: Finding exact position that gives clearest image Measuring to centre of lens Room too bright/lamp too dim/image too faint 2
Q4 · A student is investigating the effect of double-walled insulation on the rate of cooling…
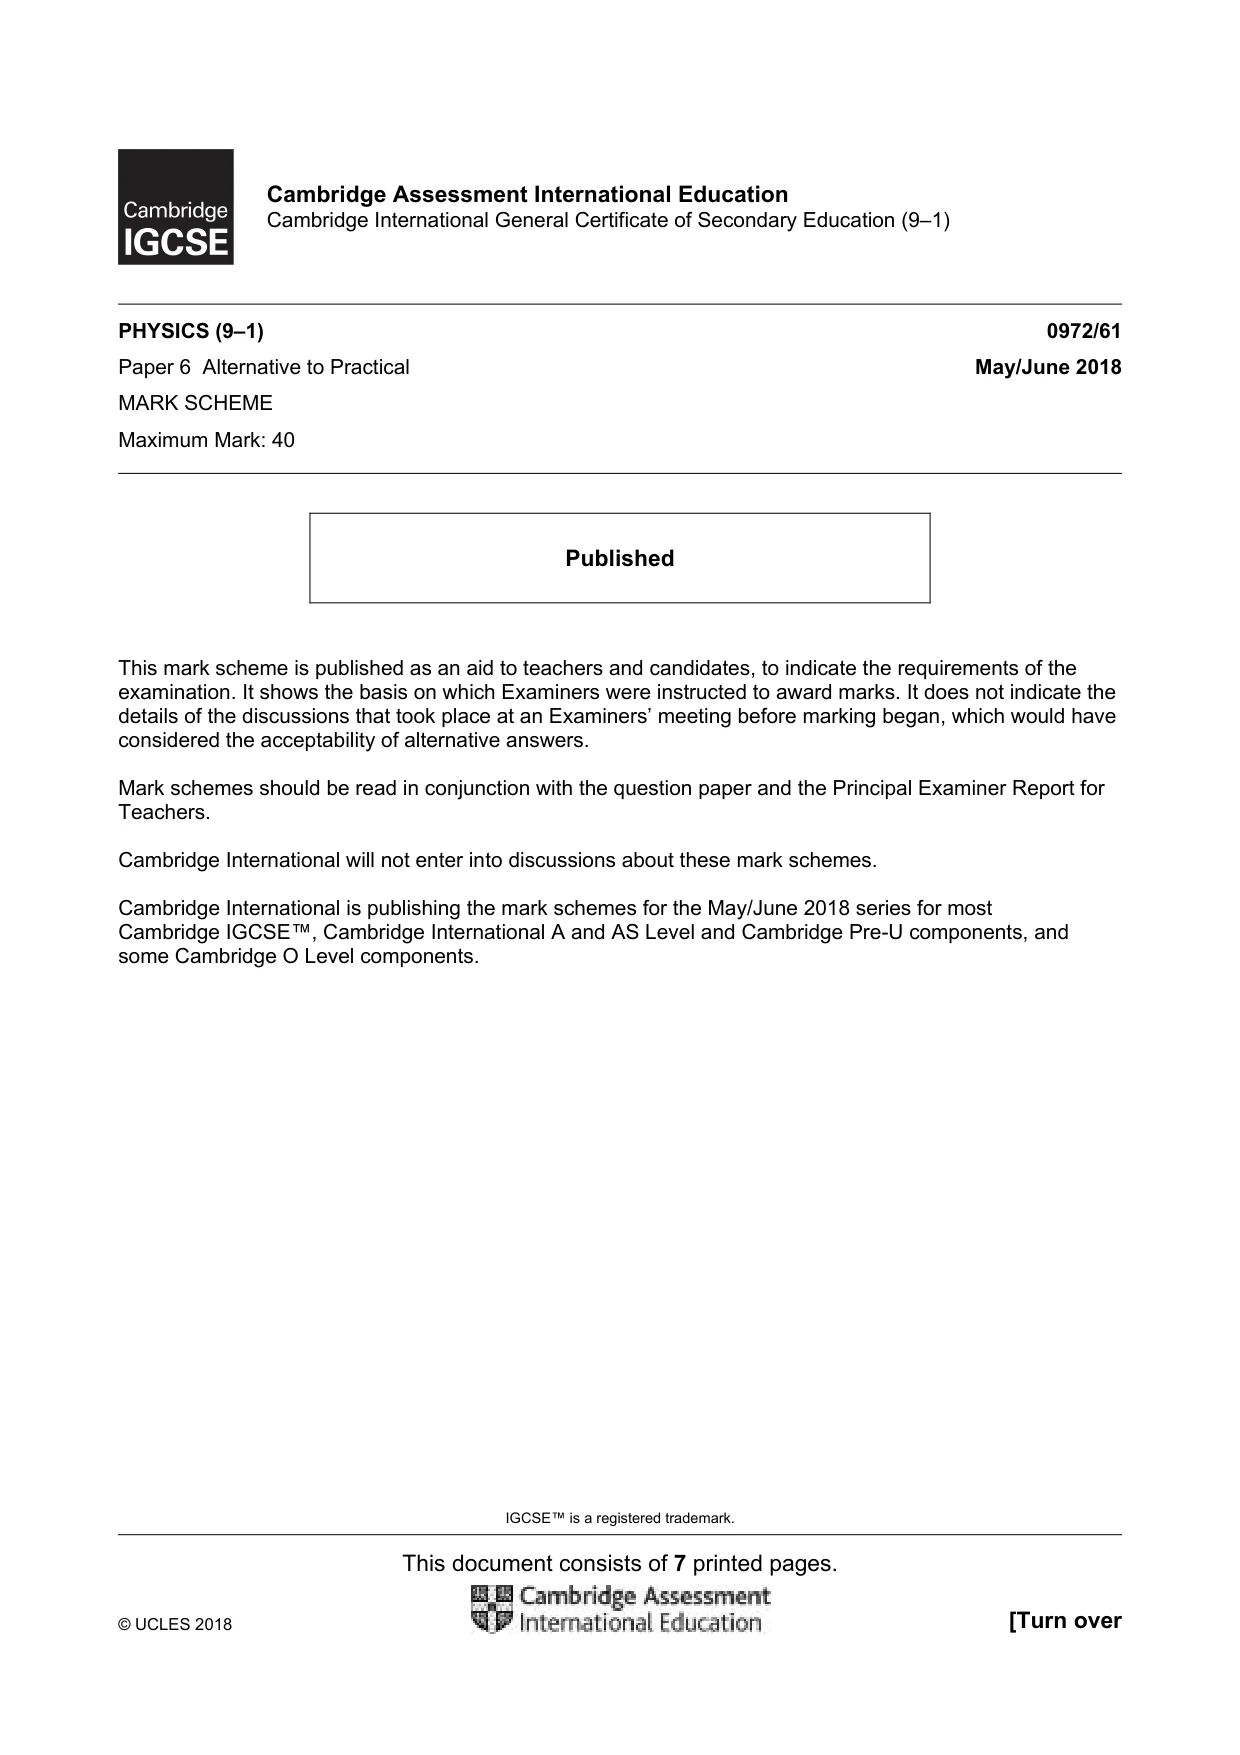
4 A student is investigating the effect of double-walled insulation on the rate of cooling of hot water in a copper container. The student places the copper container inside a larger metal container. He is investigating the effect of the size of the air gap between the copper container and larger metal containers. Plan an experiment to investigate the effect of the size of the air gap between the copper container and larger metal containers on the rate of cooling of hot water. The following apparatus is available: a copper container a number of metal containers of different diameters (all larger than the copper container) a thermometer a stopwatch a measuring cylinder a supply of hot water. You can also use other apparatus and materials that are usually available in a school laboratory. In your plan, you should: • explain briefly how you would carry out the investigation • state the key variables that you would control • draw a table, or tables, with column headings, to show how you would display your readings (you are not required to enter any readings in the table) • explain how you would use your readings to reach a conclusion. You may draw a diagram if it helps your explanation. .......................................................................................................................................................... .......................................................................................................................................................... .......................................................................................................................................................... .......................................................................................................................................................... .......................................................................................................................................................... .......................................................................................................................................................... .......................................................................................................................................................... .......................................................................................................................................................... .......................................................................................................................................................... .......................................................................................................................................................... .......................................................................................................................................................... .......................................................................................................................................................... .......................................................................................................................................................... .......................................................................................................................................................... .......................................................................................................................................................... .......................................................................................................................................................... .......................................................................................................................................................... .......................................................................................................................................................... ......................................................................................................................................................[7] [Total: 7]
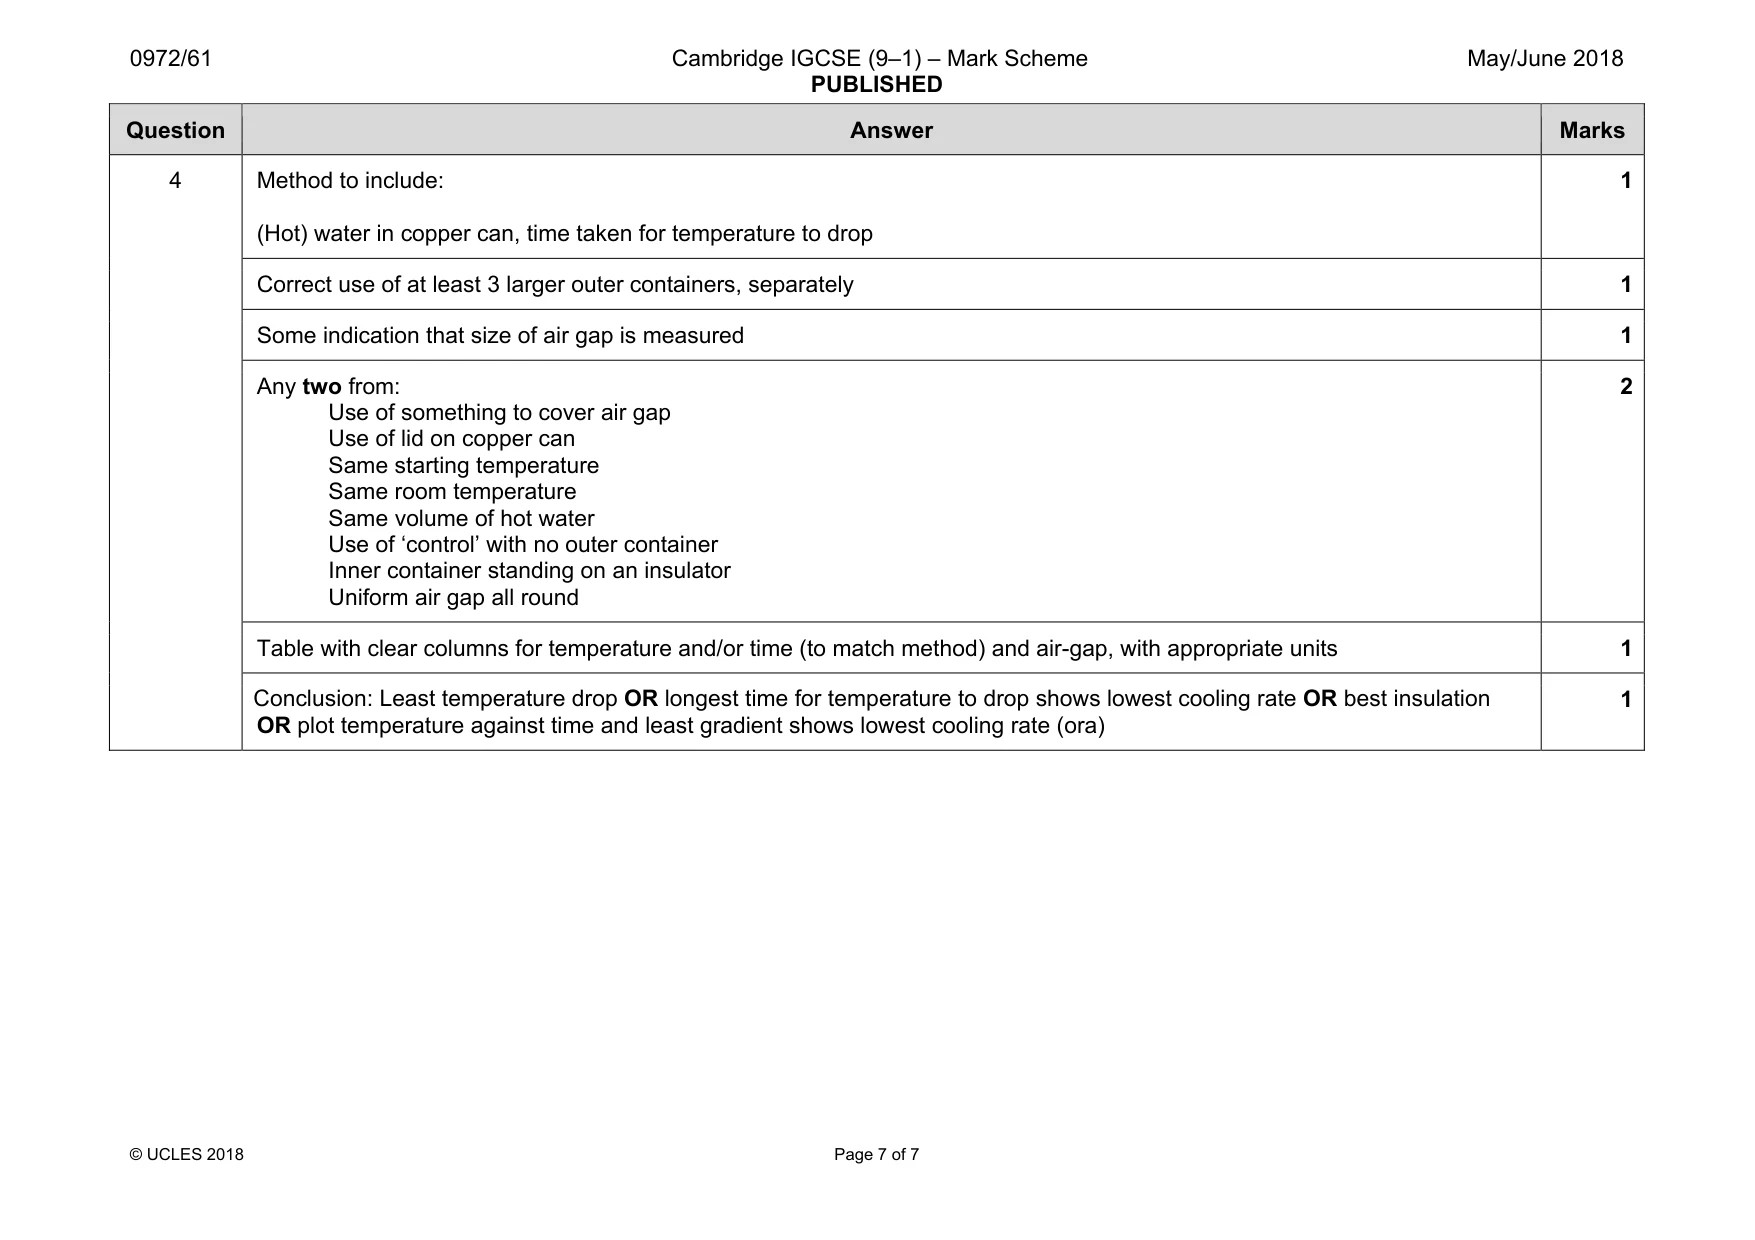
Mark scheme: 4 Method to include: (Hot) water in copper can, time taken for temperature to drop 1 Correct use of at least 3 larger outer containers, separately 1 Some indication that size of air gap is measured 1 Any two from: Use of something to cover air gap Use of lid on copper can Same starting temperature Same room temperature Same volume of hot water Use of ‘control’ with no outer container Inner container standing on an insulator Uniform air gap all round 2 Table with clear columns for temperature and/or time (to match method) and air-gap, with appropriate units 1 Conclusion: Least temperature drop OR longest time for temperature to drop shows lowest cooling rate OR best insulation OR plot temperature against time and least gradient shows lowest cooling rate (ora) 1
What was in this paper
The subtopics covered by these 4 questions, and how many questions each got. Open one in a new tab to see every Cambridge question on it.
What you needed in this session
Cambridge’s own grade thresholds for 2018 May/June, Paper 6 · Variant 1. A higher threshold means an easier paper — the bar moves with how the cohort did.