Cambridge IGCSE Physics 0625 — 2021 Oct/Nov Paper 5 · Variant 1
0625/51/O/N/21 · 4 questions · 40 marks · ≈45 min
The question paper and its mark scheme, free to read here and free to download. This is Cambridge’s own paper, exactly as it was sat.
Question paper12 pages

Mark scheme10 pages
Answers below. Sit the paper first if you are practising.
Questions as text
Q1 · In this experiment, you will investigate the stretching of a spring
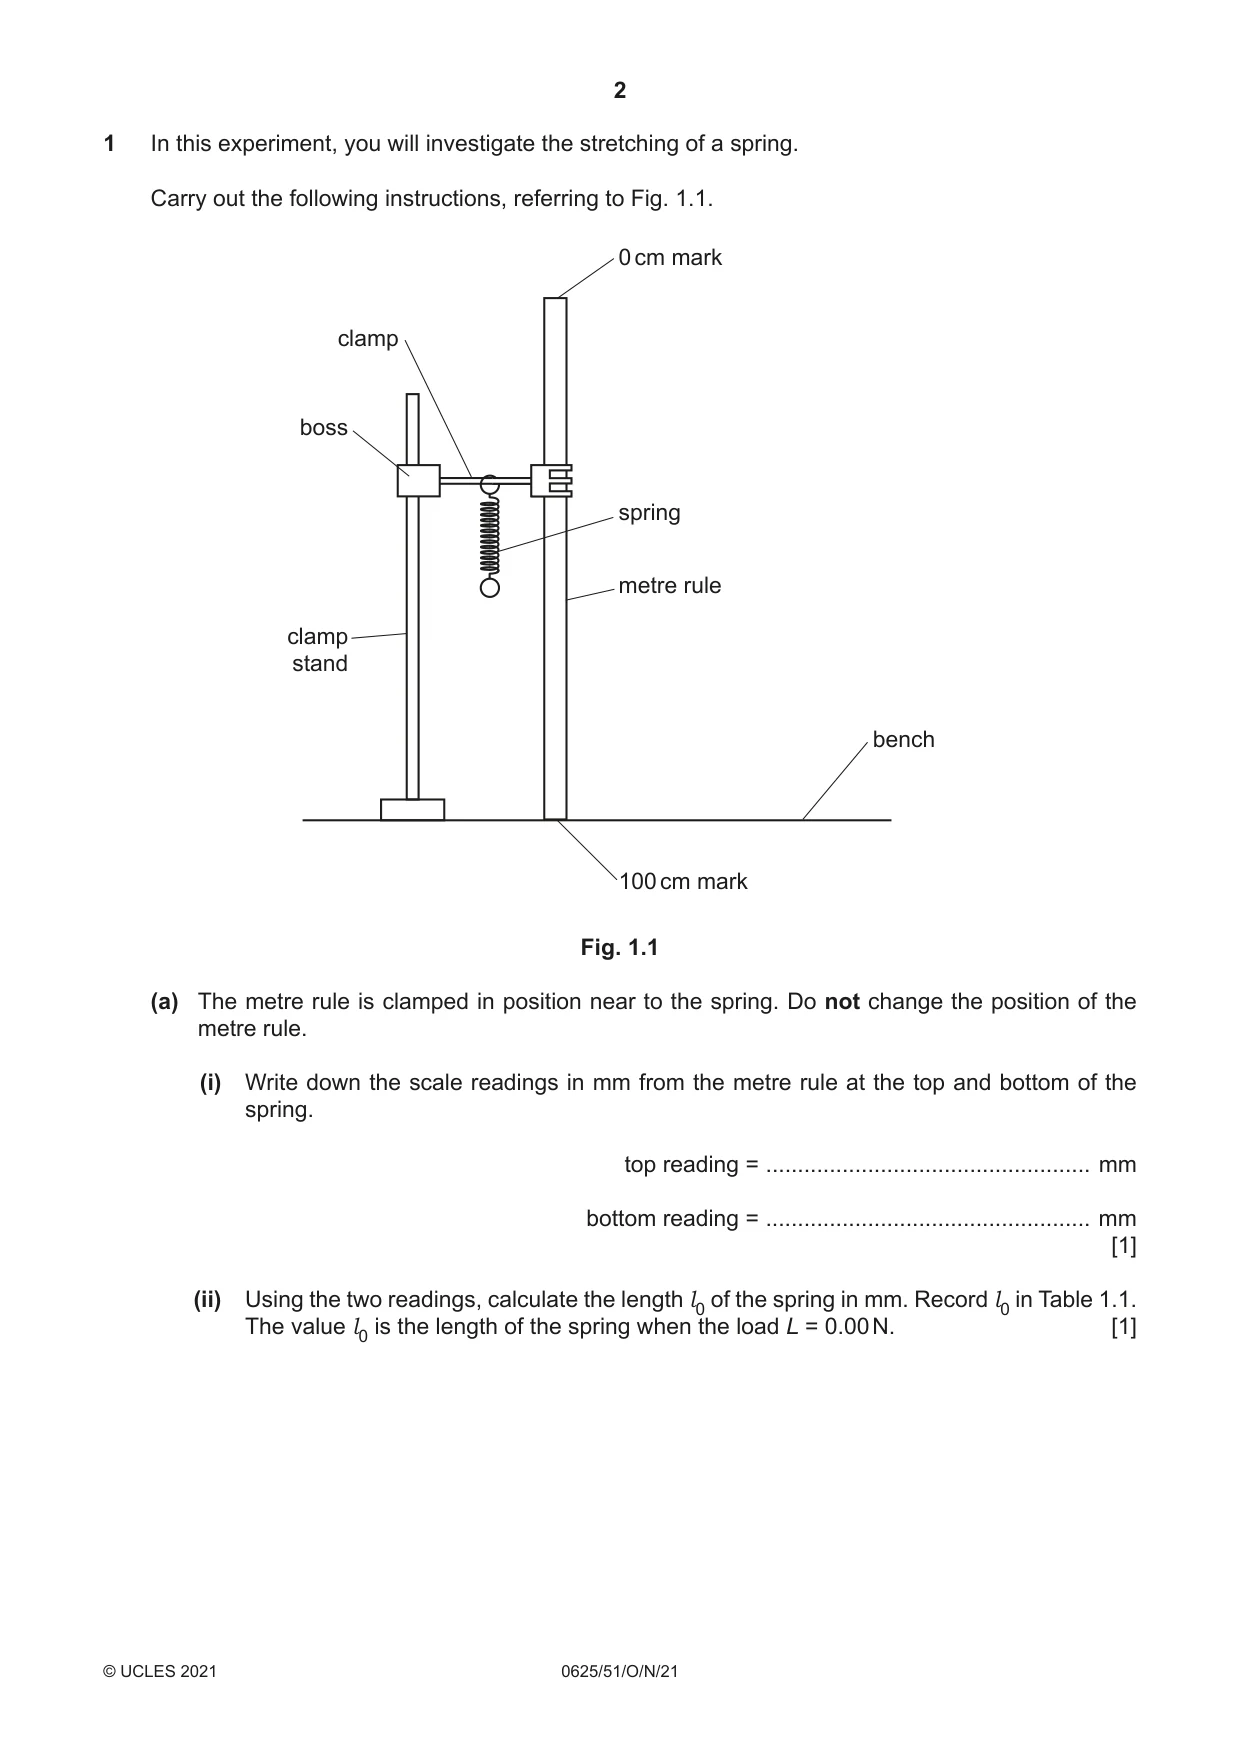
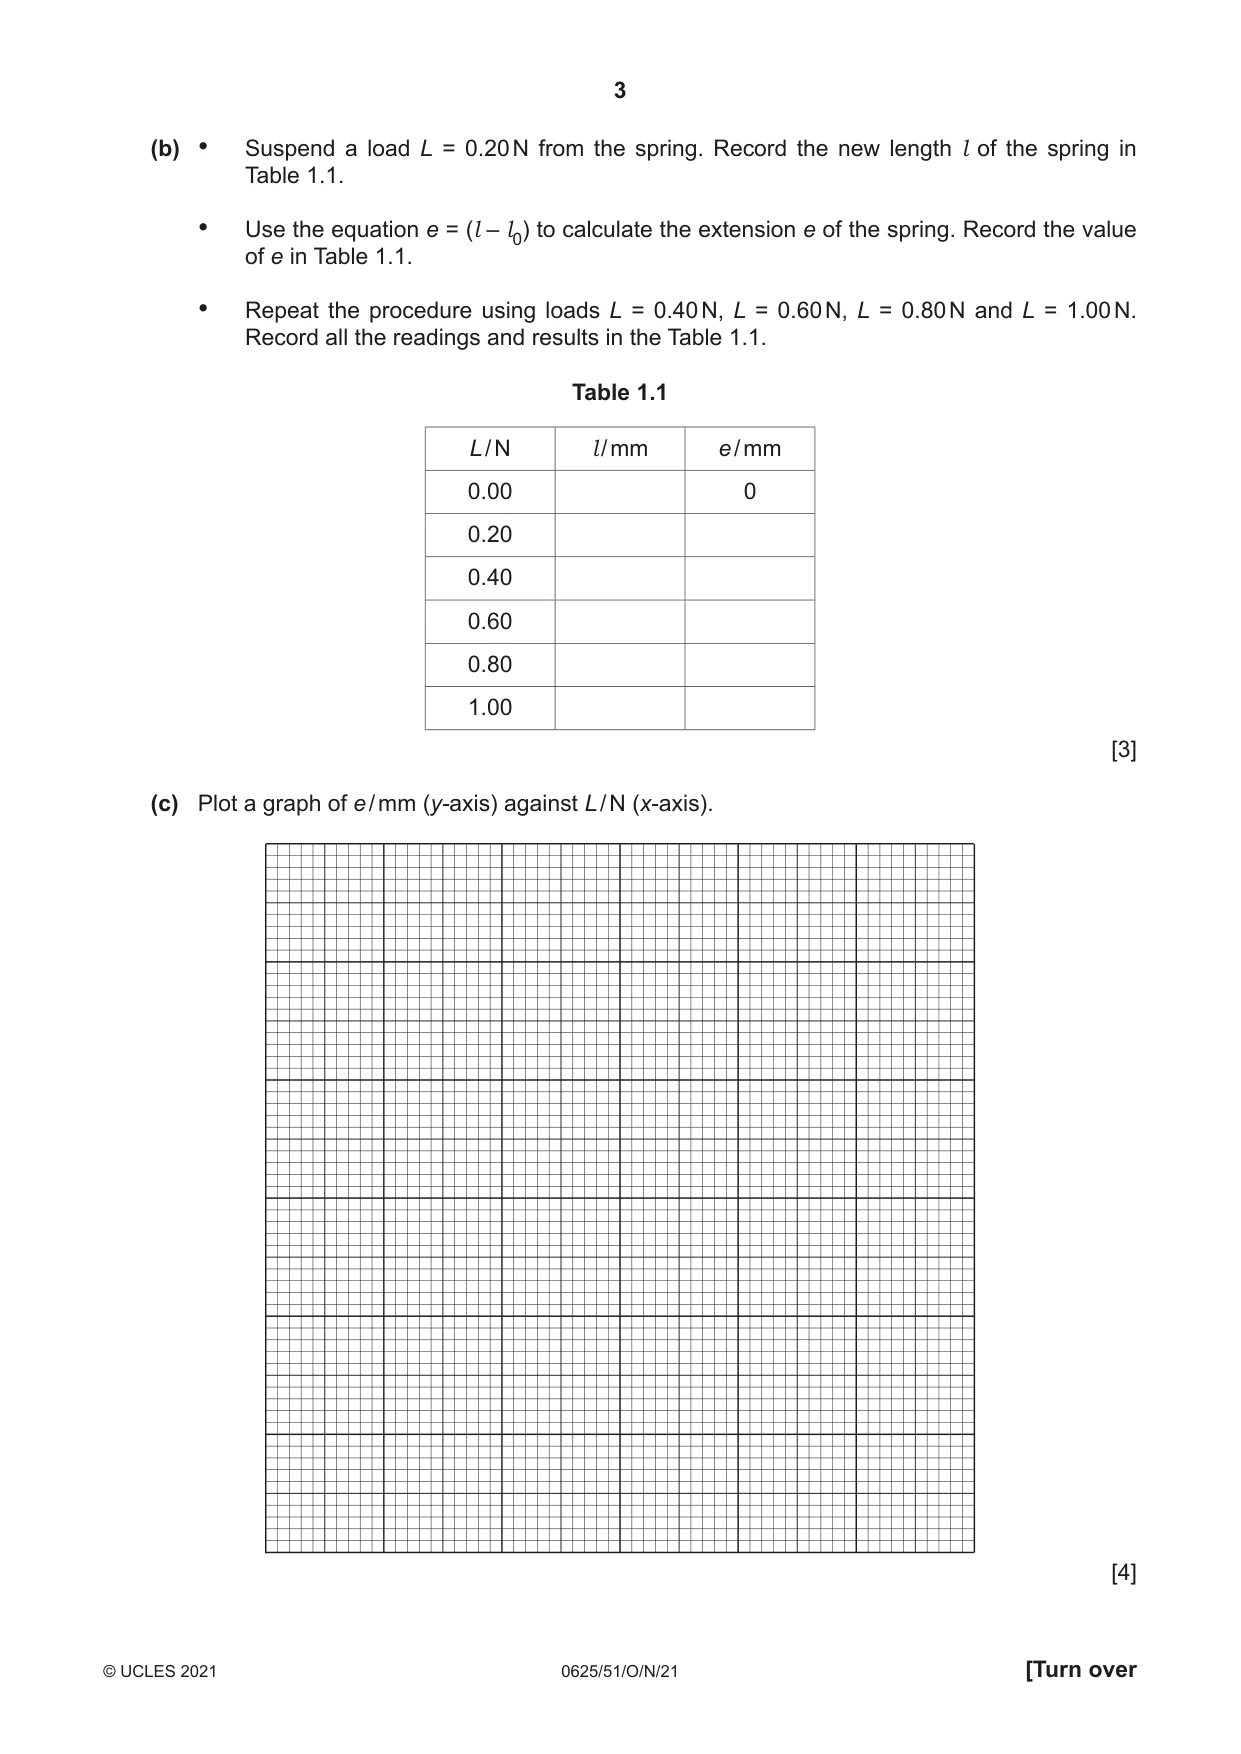
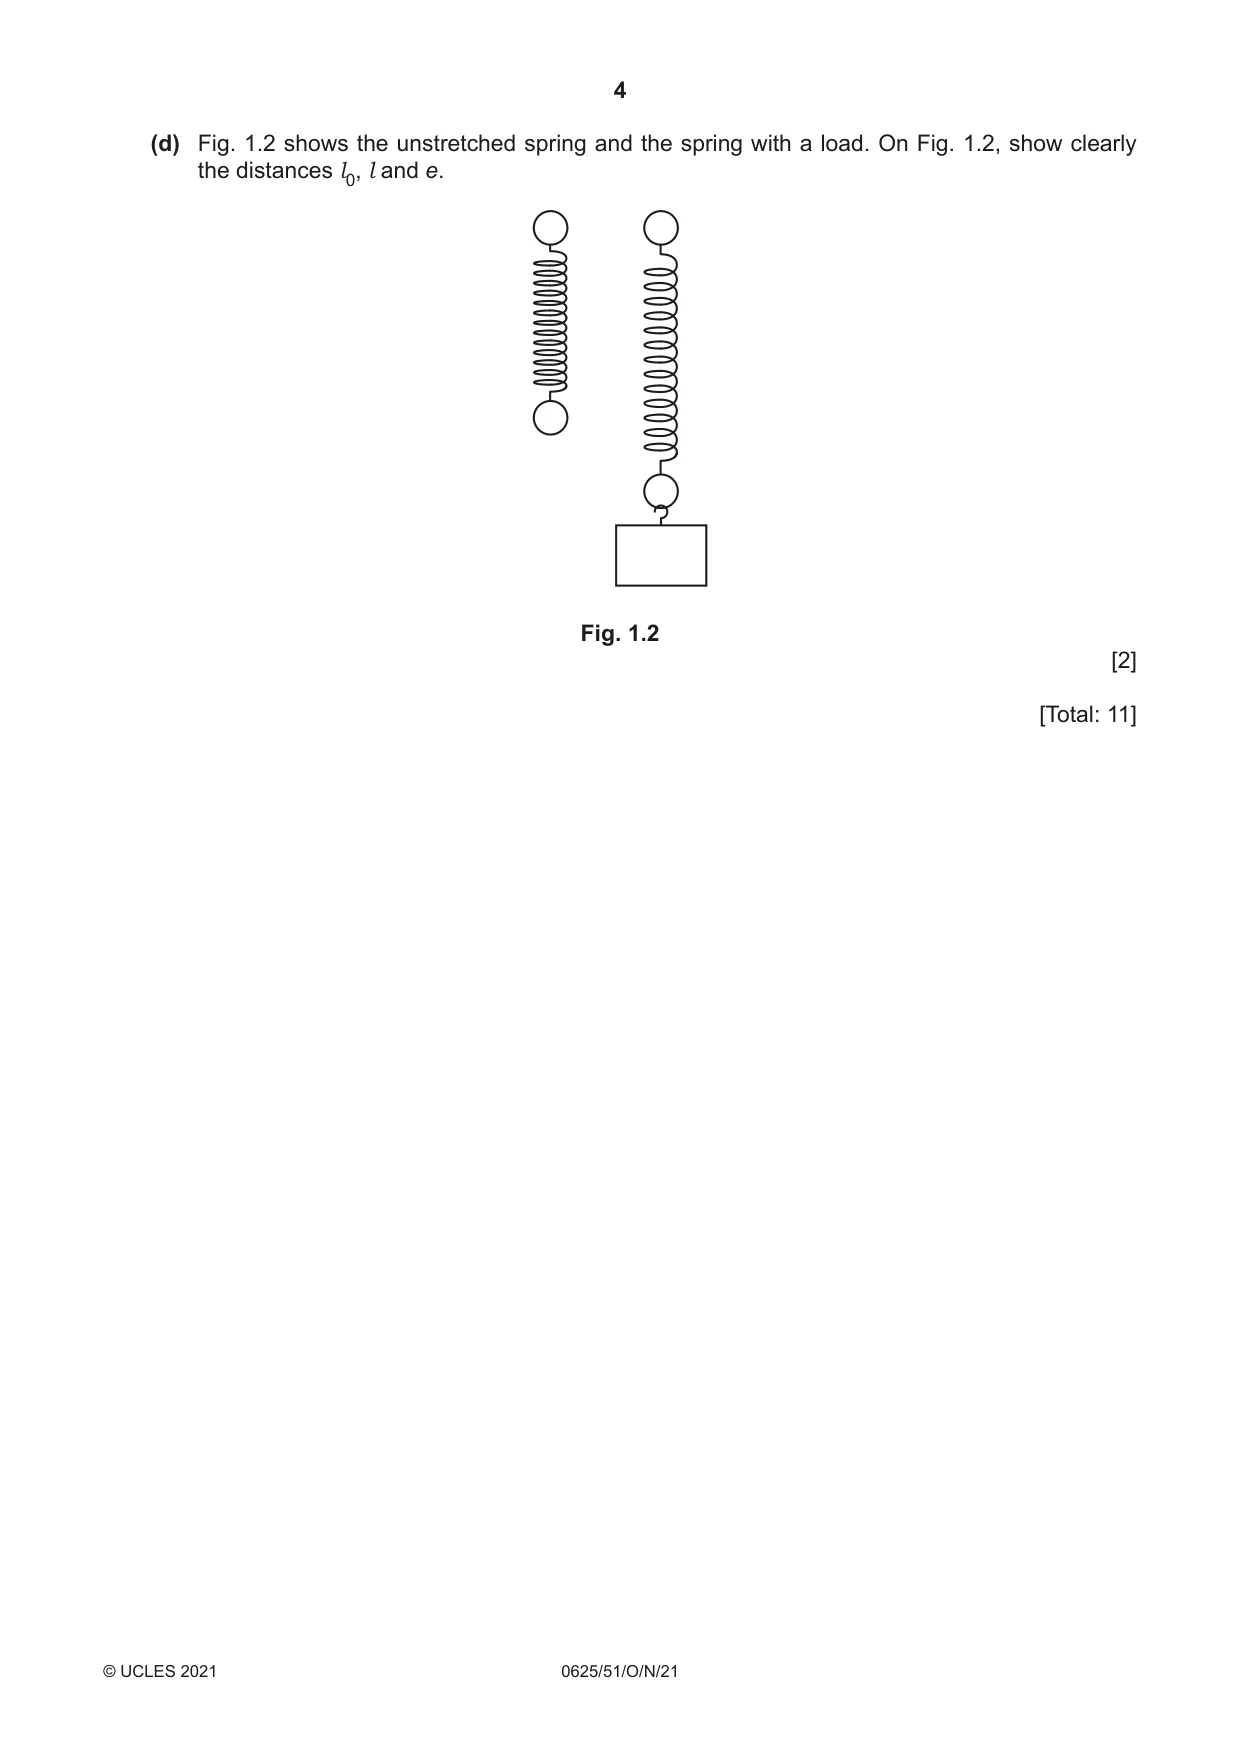
1 In this experiment, you will investigate the stretching of a spring. Carry out the following instructions, referring to Fig. 1.1. 0 cm mark clamp boss spring metre rule clamp stand bench 100 cm mark Fig. 1.1 (a) The metre rule is clamped in position near to the spring. Do not change the position of the metre rule. (i) Write down the scale readings in mm from the metre rule at the top and bottom of the spring. top reading = ................................................... mm bottom reading = ................................................... mm [1] (ii) Using the two readings, calculate the length l0 of the spring in mm. Record l0 in Table 1.1. The value l0 is the length of the spring when the load L = 0.00 N. [1] (b) • Suspend a load L = 0.20 N from the spring. Record the new length l of the spring in Table 1.1. • Use the equation e = (l – l0) to calculate the extension e of the spring. Record the value of e in Table 1.1. • Repeat the procedure using loads L = 0.40 N, L = 0.60 N, L = 0.80 N and L = 1.00 N. Record all the readings and results in the Table 1.1. Table 1.1 L / N l / mm e / mm 0.00 0 0.20 0.40 0.60 0.80 1.00 [3] (c) Plot a graph of e / mm (y-axis) against L / N (x-axis). [4] (d) Fig. 1.2 shows the unstretched spring and the spring with a load. On Fig. 1.2, show clearly the distances l0, l and e. Fig. 1.2 [2] [Total: 11]
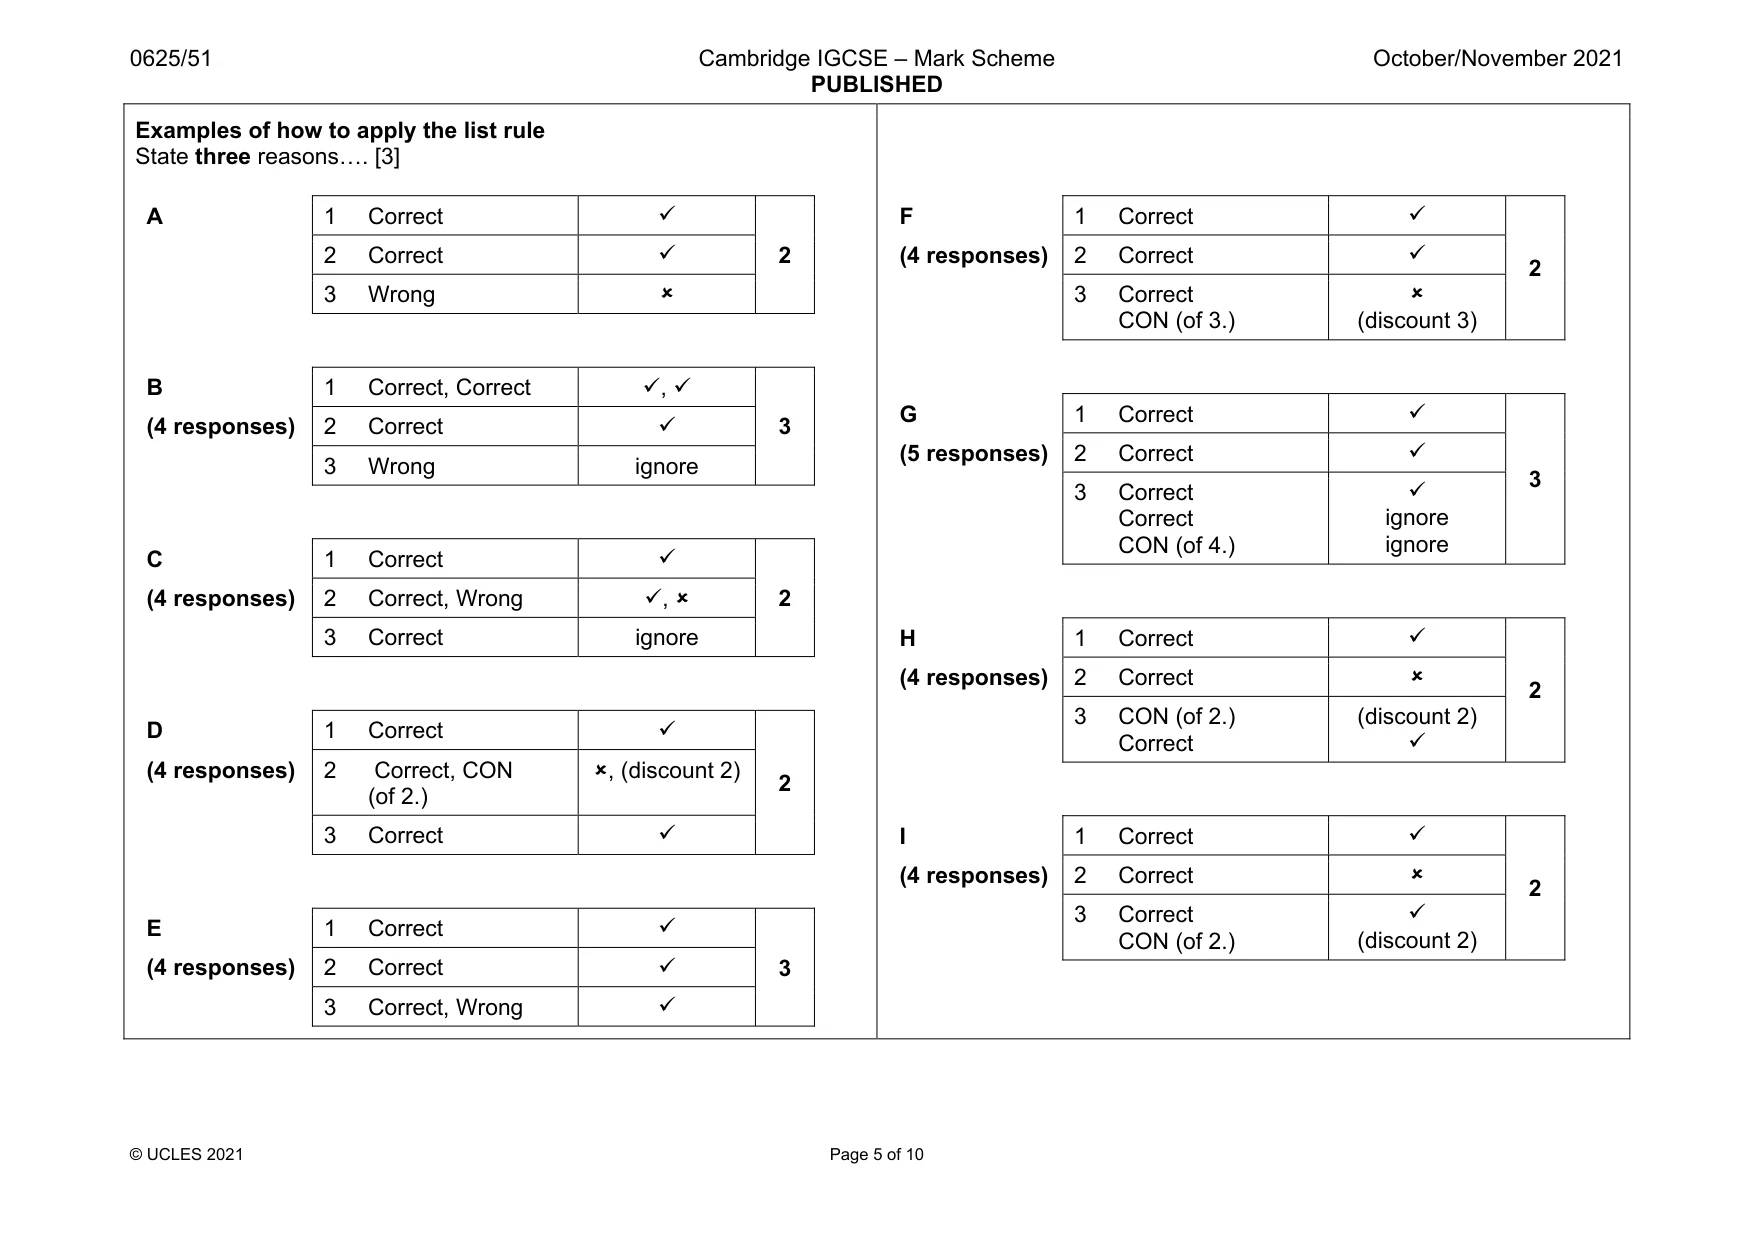
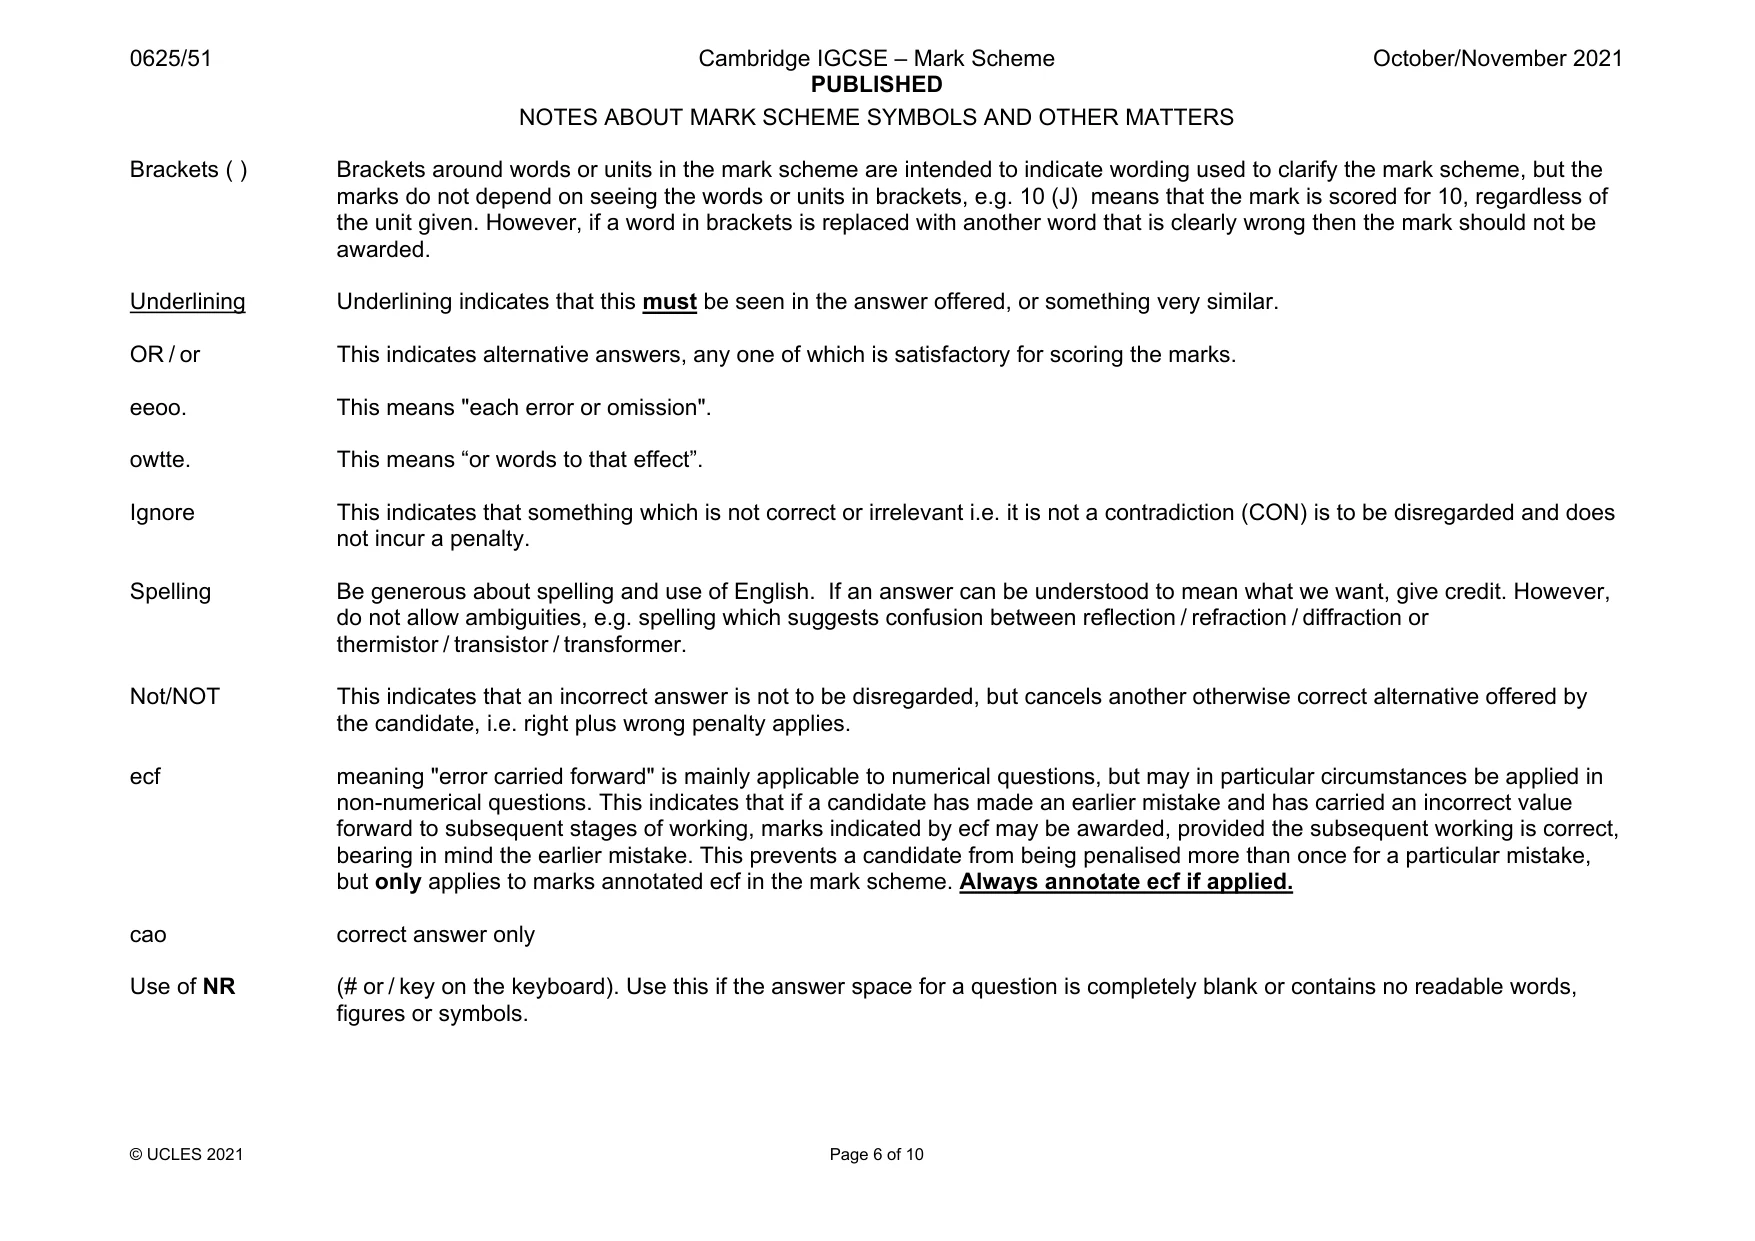
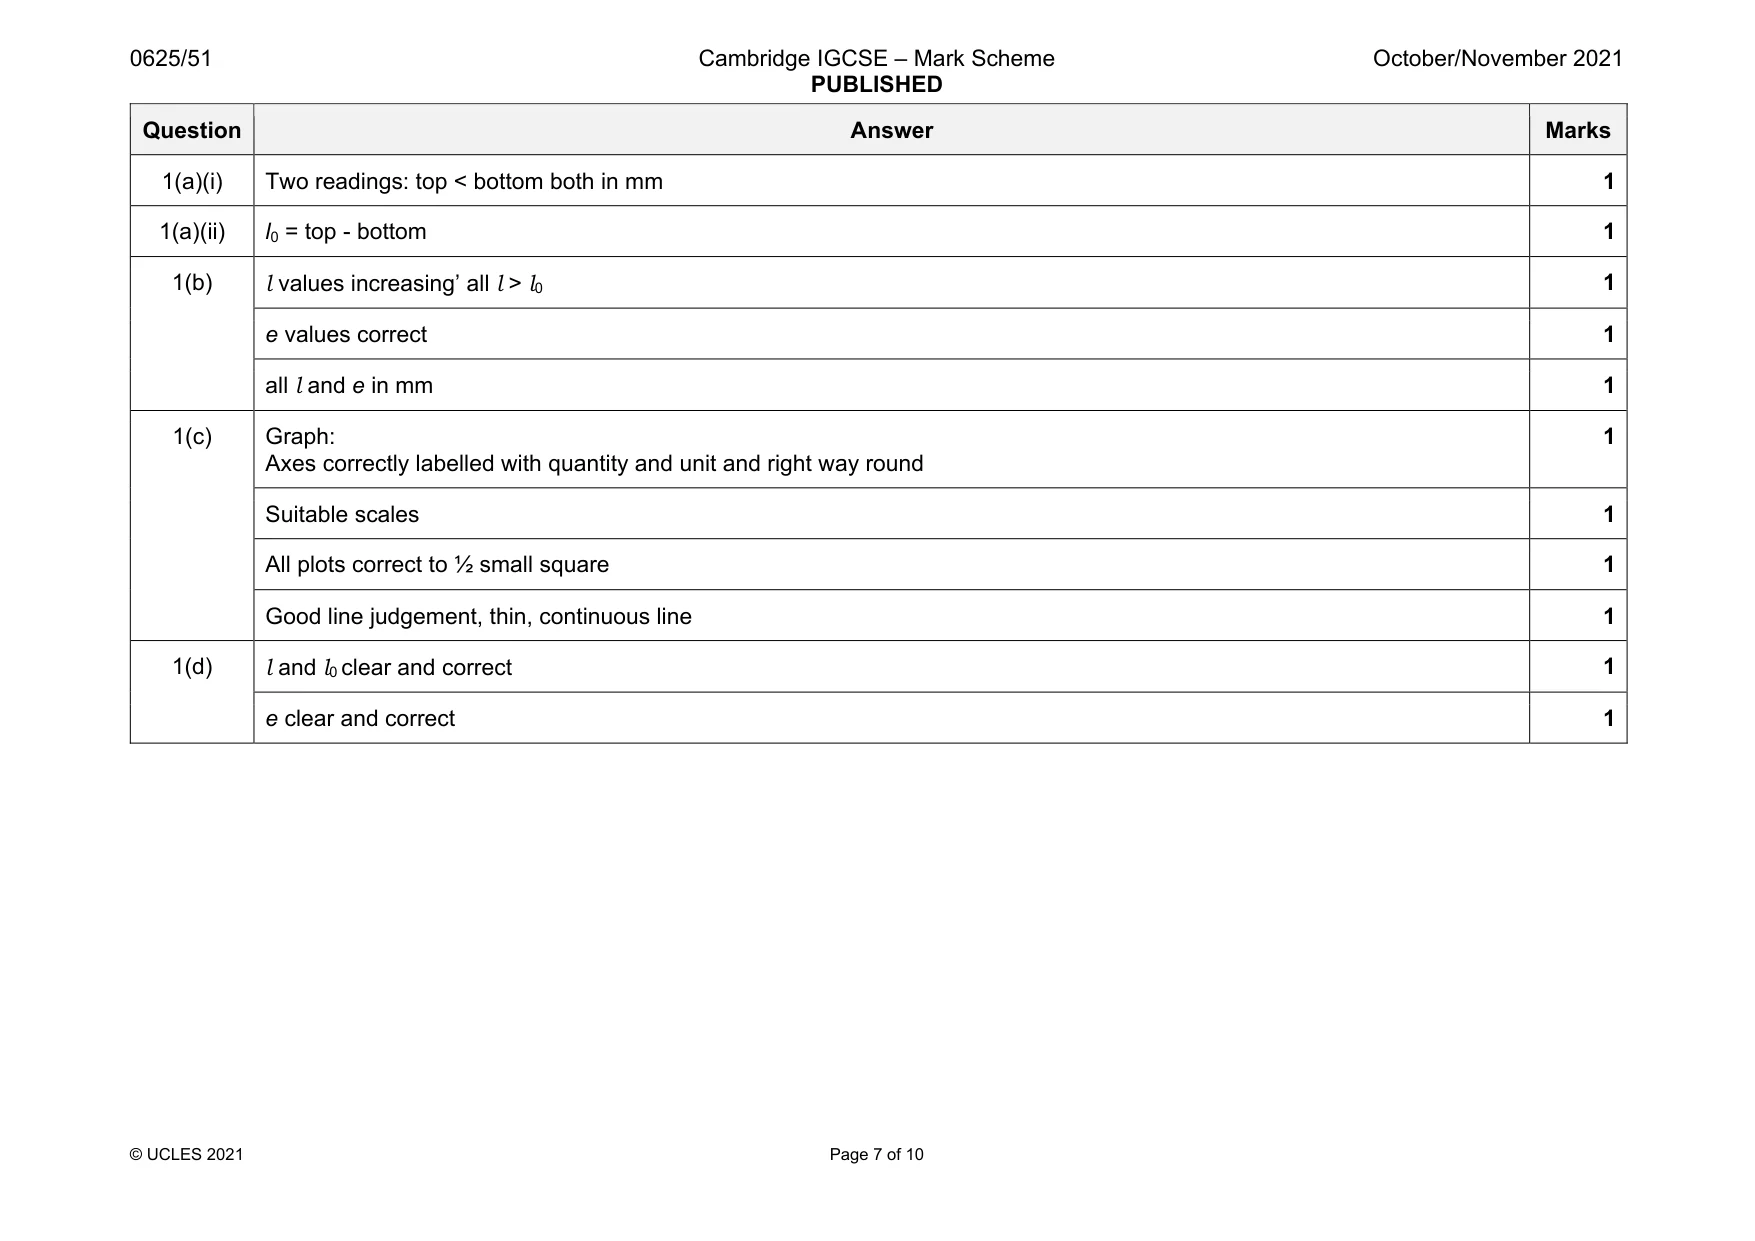
Mark scheme: 1(a)(i) Two readings: top < bottom both in mm 1 1(a)(ii) l0 = top - bottom 1 1(b) l values increasing’ all l > l0 1 e values correct 1 all l and e in mm 1 1(c) Graph: Axes correctly labelled with quantity and unit and right way round 1 Suitable scales 1 All plots correct to ½ small square 1 Good line judgement, thin, continuous line 1 1(d) l and l0 clear and correct 1 e clear and correct 1
More questions on Physical quantities and measurement techniques
Q2 · In this experiment, you will investigate the resistance of combinations of resistors
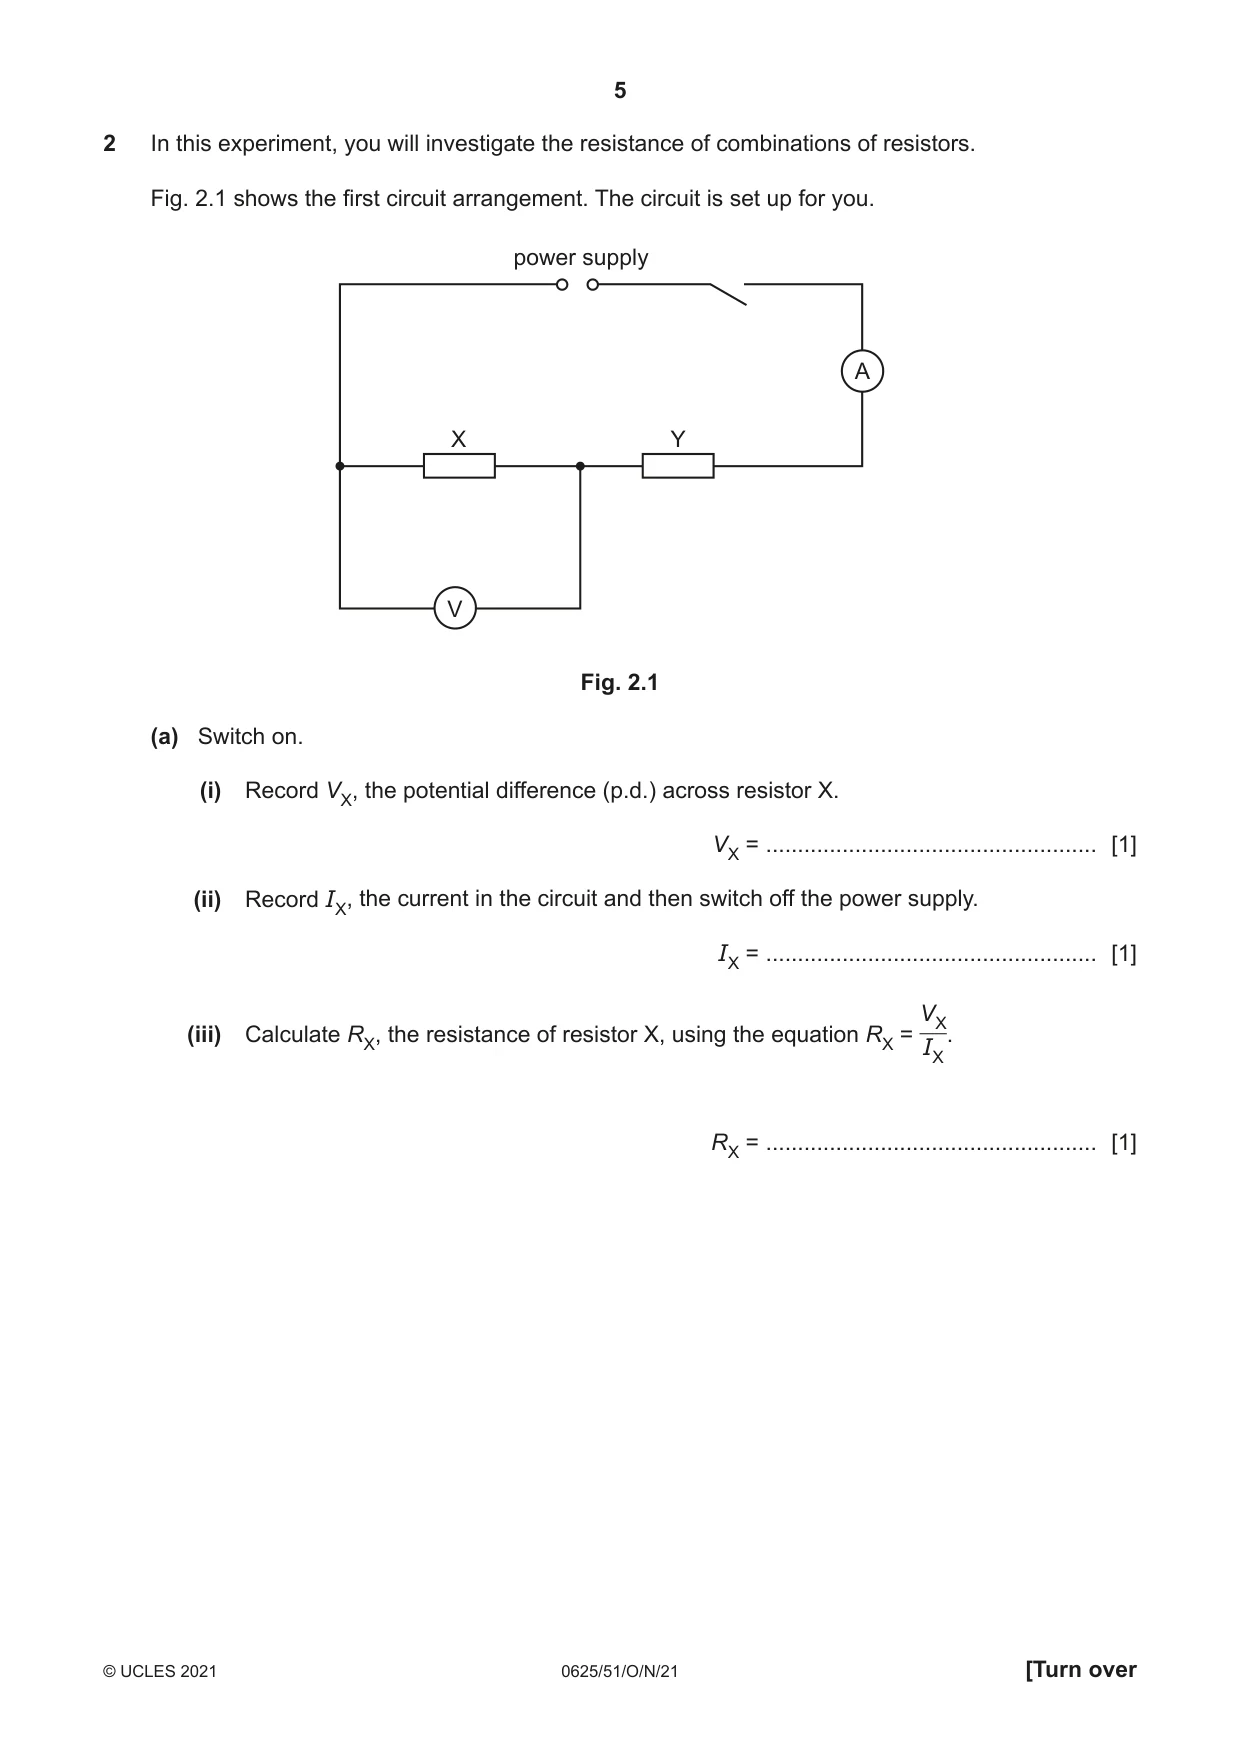
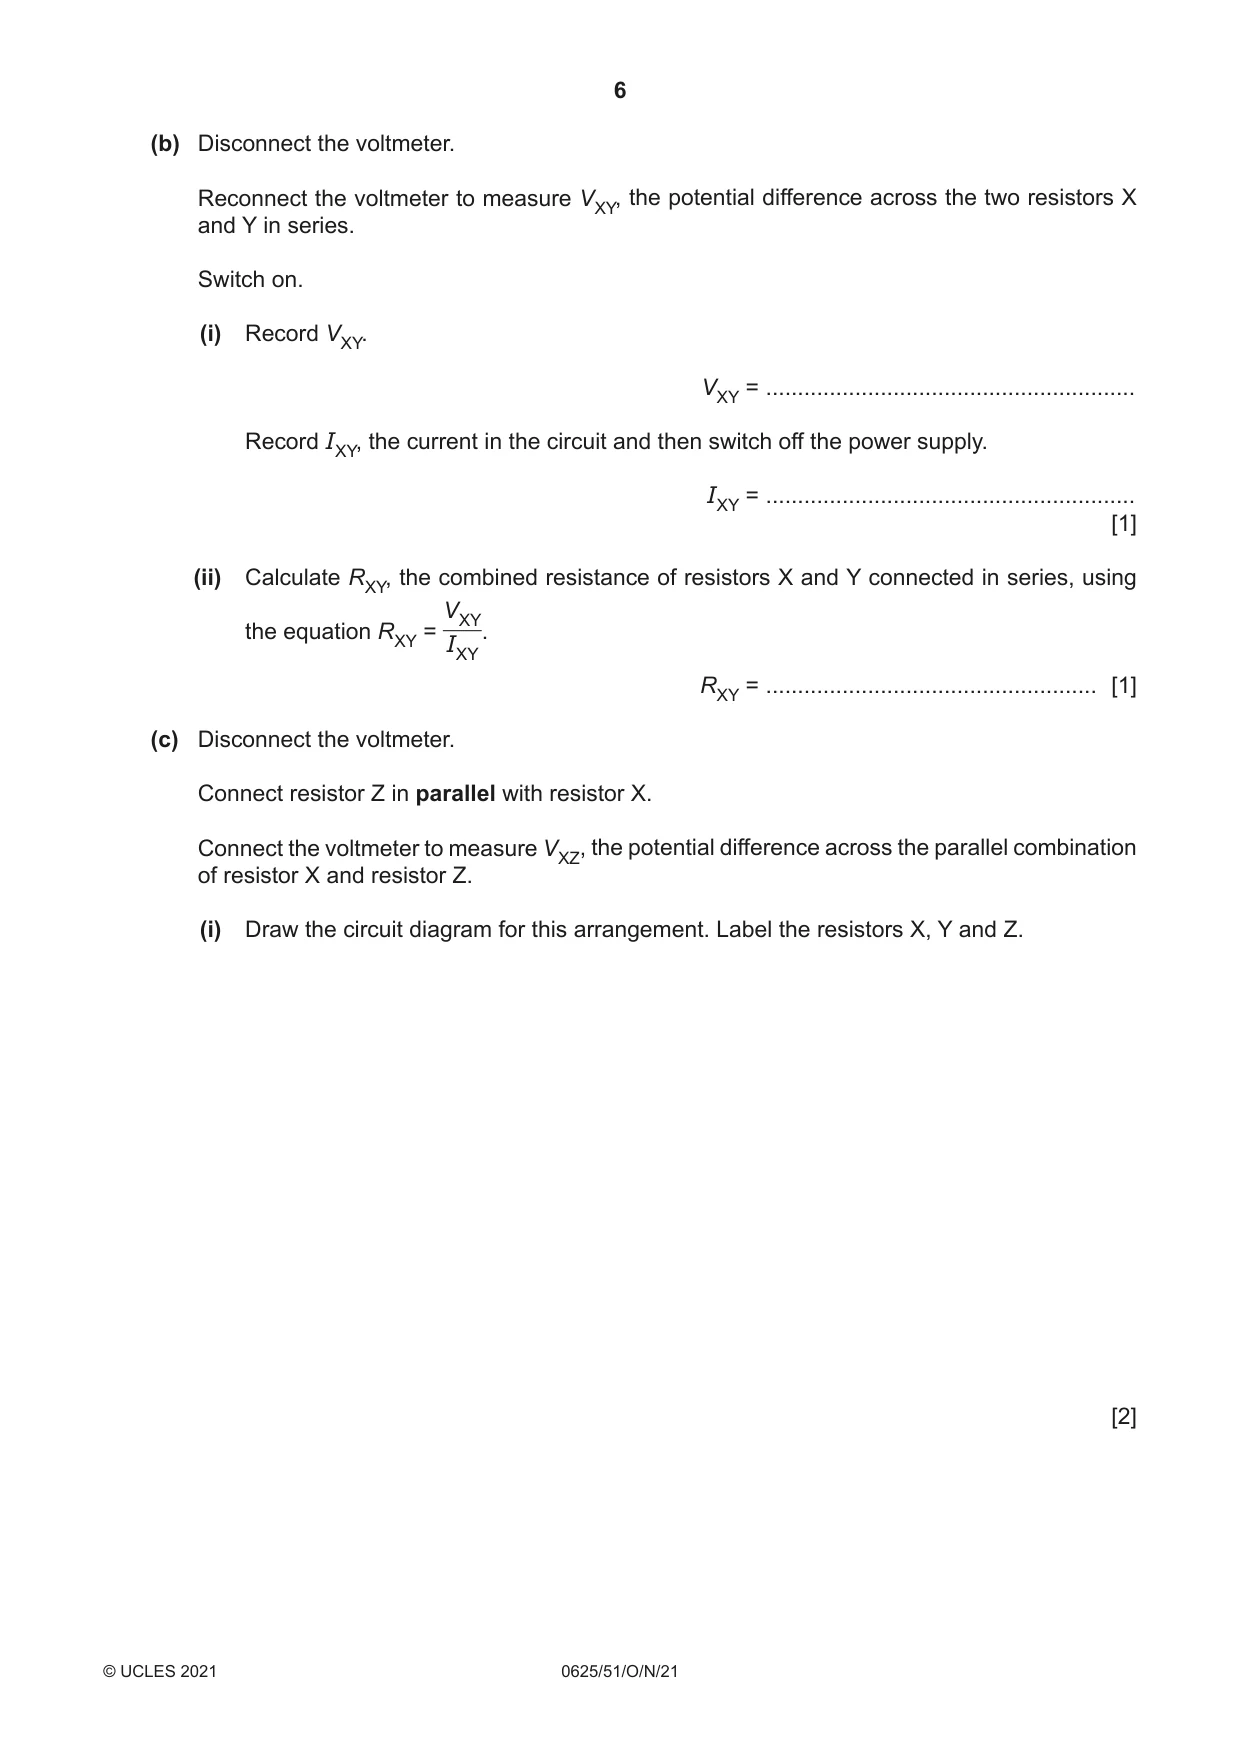
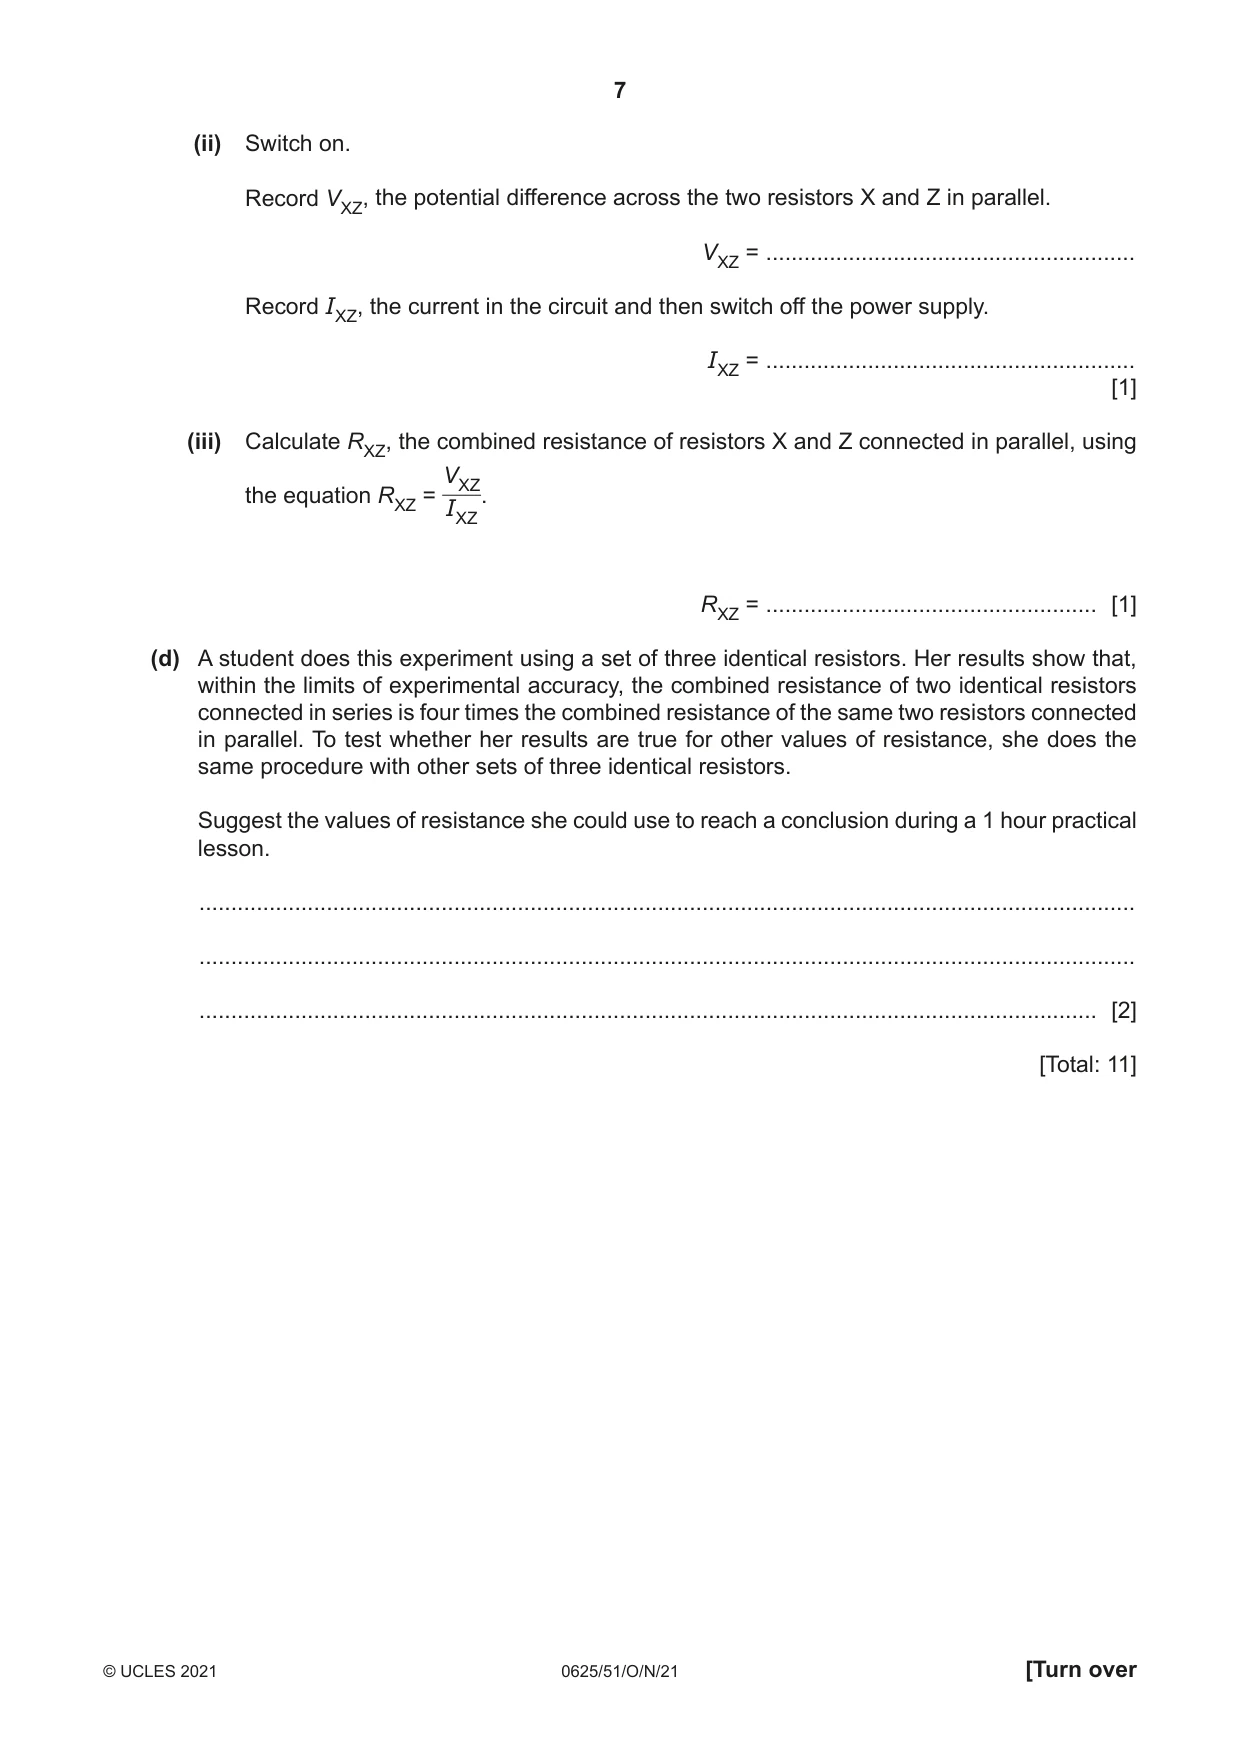
2 In this experiment, you will investigate the resistance of combinations of resistors. Fig. 2.1 shows the first circuit arrangement. The circuit is set up for you. power supply A X Y V Fig. 2.1 (a) Switch on. (i) Record VX, the potential difference (p.d.) across resistor X. VX = .................................................... [1] (ii) Record IX, the current in the circuit and then switch off the power supply. IX = .................................................... [1] VX (iii) Calculate RX, the resistance of resistor X, using the equation RX = . IX RX = .................................................... [1] (b) Disconnect the voltmeter. Reconnect the voltmeter to measure VXY, the potential difference across the two resistors X and Y in series. Switch on. (i) Record VXY. VXY = .......................................................... Record IXY, the current in the circuit and then switch off the power supply. IXY = .......................................................... [1] (ii) Calculate RXY, the combined resistance of resistors X and Y connected in series, using VXY the equation RXY = . IXY RXY = .................................................... [1] (c) Disconnect the voltmeter. Connect resistor Z in parallel with resistor X. Connect the voltmeter to measure VXZ, the potential difference across the parallel combination of resistor X and resistor Z. (i) Draw the circuit diagram for this arrangement. Label the resistors X, Y and Z. [2] (ii) Switch on. Record VXZ, the potential difference across the two resistors X and Z in parallel. VXZ = .......................................................... Record IXZ, the current in the circuit and then switch off the power supply. IXZ = .......................................................... [1] (iii) Calculate RXZ, the combined resistance of resistors X and Z connected in parallel, using VXZ the equation RXZ = . IXZ RXZ = .................................................... [1] (d) A student does this experiment using a set of three identical resistors. Her results show that, within the limits of experimental accuracy, the combined resistance of two identical resistors connected in series is four times the combined resistance of the same two resistors connected in parallel. To test whether her results are true for other values of resistance, she does the same procedure with other sets of three identical resistors. Suggest the values of resistance she could use to reach a conclusion during a 1 hour practical lesson. ................................................................................................................................................... ................................................................................................................................................... ............................................................................................................................................. [2] [Total: 11]
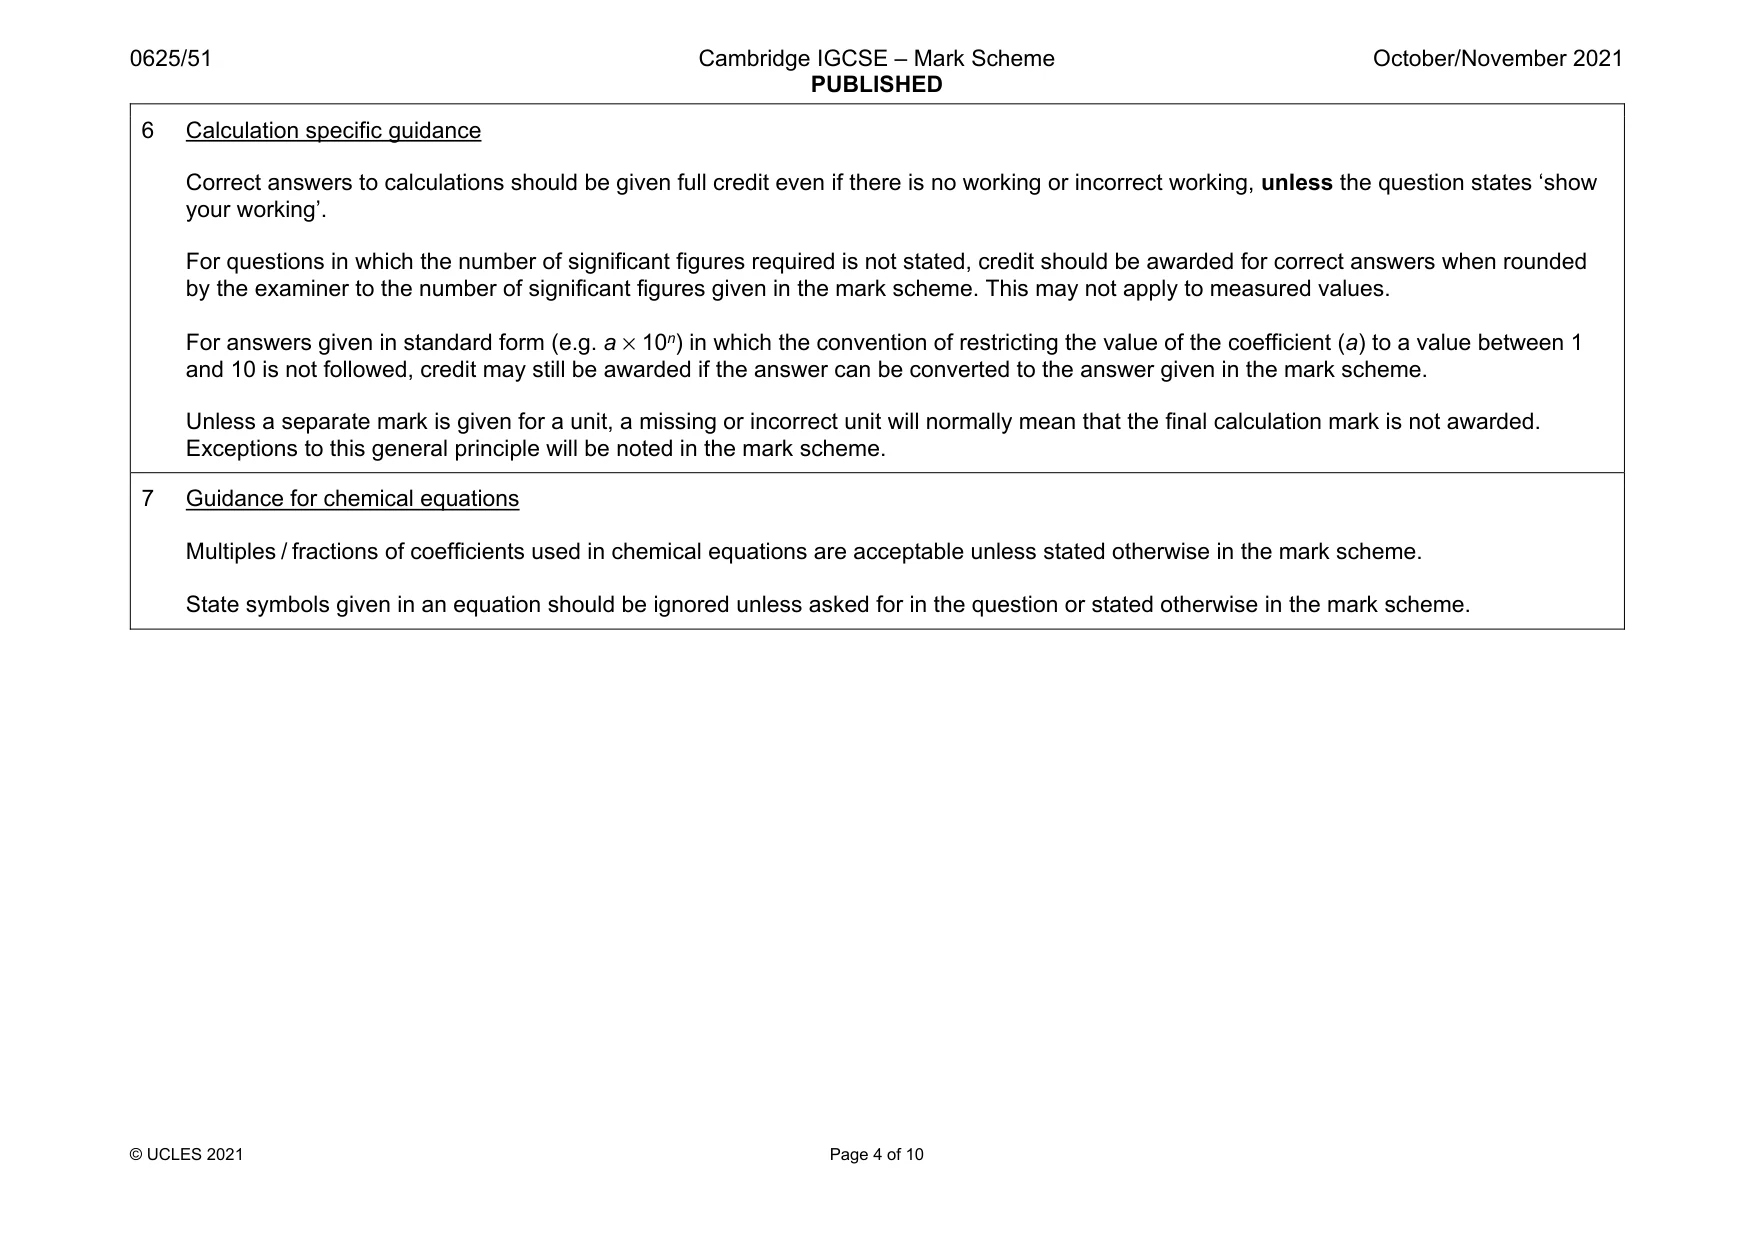
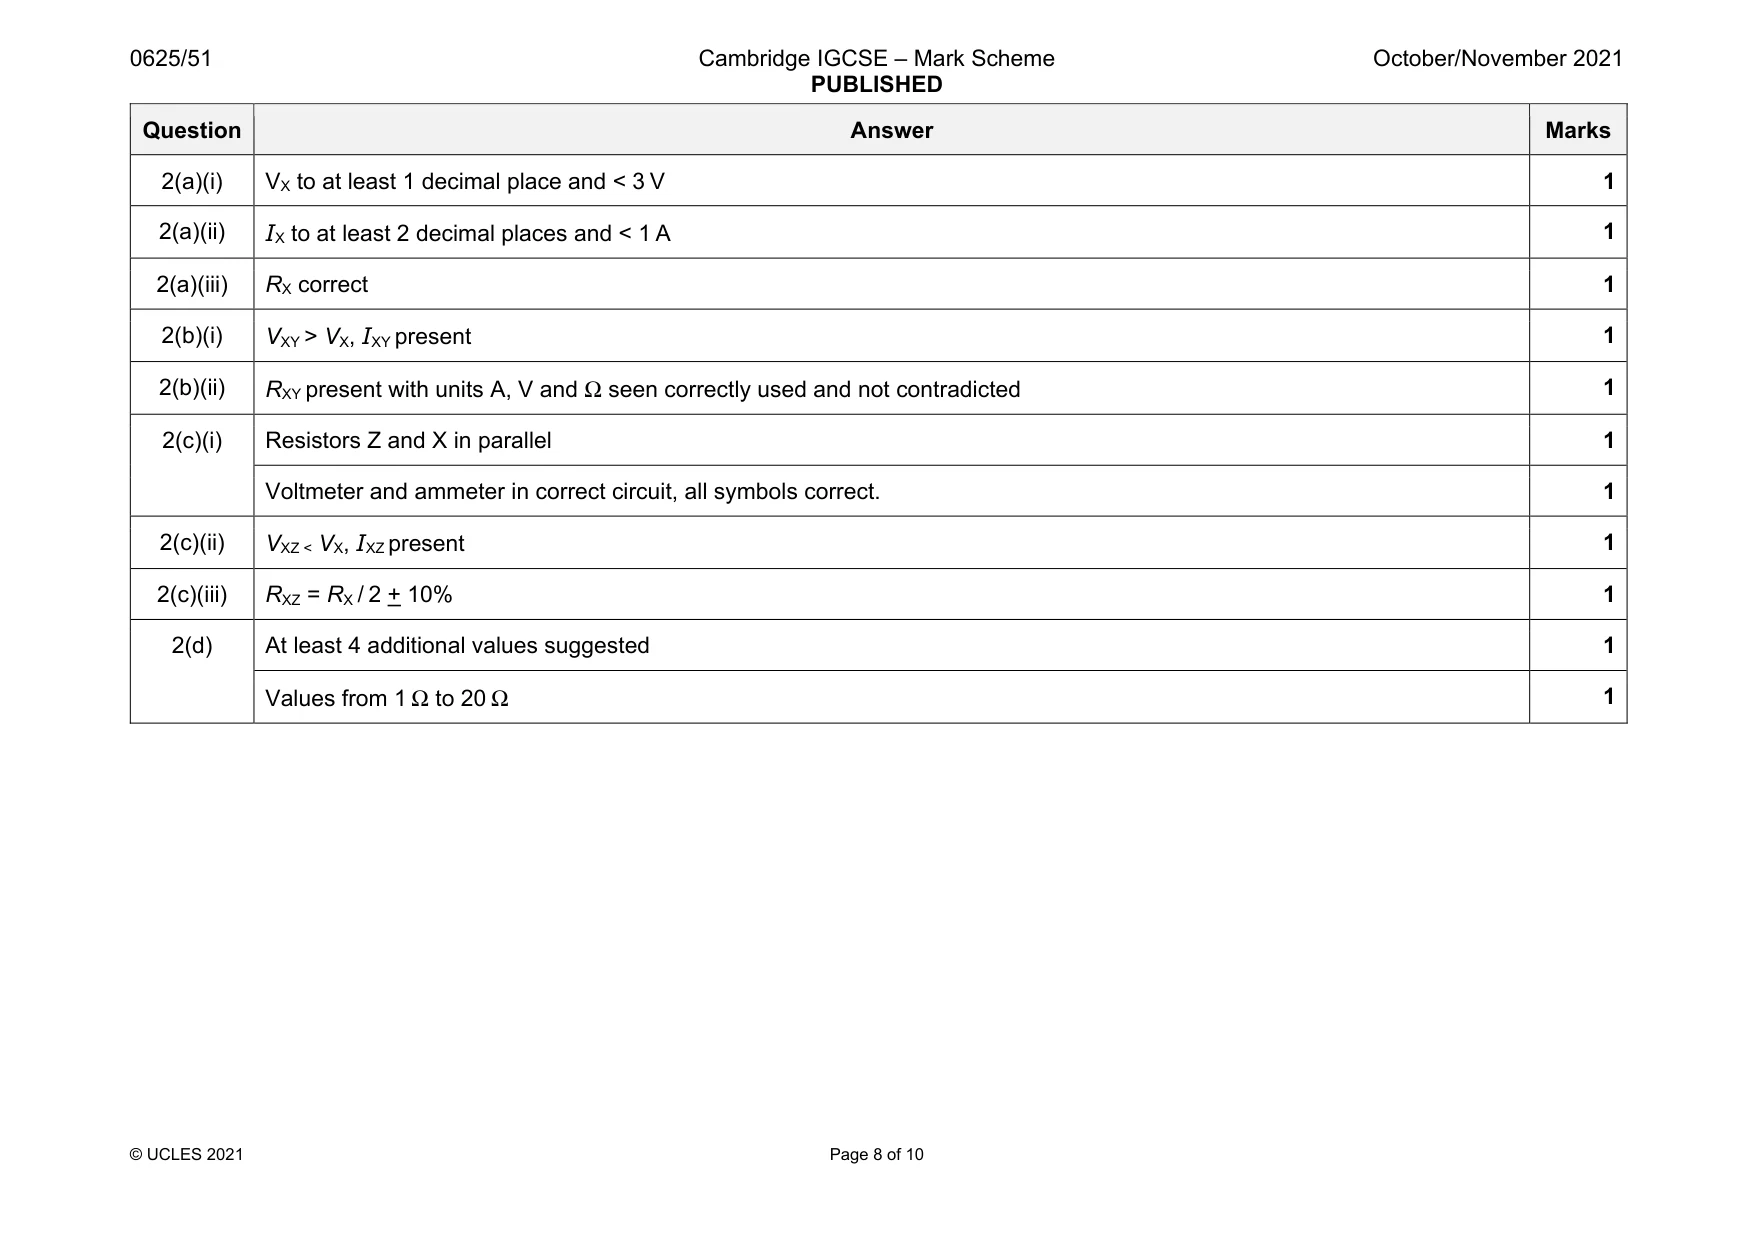
Mark scheme: 2(a)(i) VX to at least 1 decimal place and < 3 V 1 2(a)(ii) IX to at least 2 decimal places and < 1 A 1 2(a)(iii) RX correct 1 2(b)(i) VXY > VX, IXY present 1 2(b)(ii) RXY present with units A, V and Ω seen correctly used and not contradicted 1 2(c)(i) Resistors Z and X in parallel 1 Voltmeter and ammeter in correct circuit, all symbols correct. 1 2(c)(ii) VXZ < VX, IXZ present 1 2(c)(iii) RXZ = RX / 2 + 10% 1 2(d) At least 4 additional values suggested 1 Values from 1 Ω to 20 Ω 1
Q3 · In this experiment you will investigate the position of the image in a plane mirror
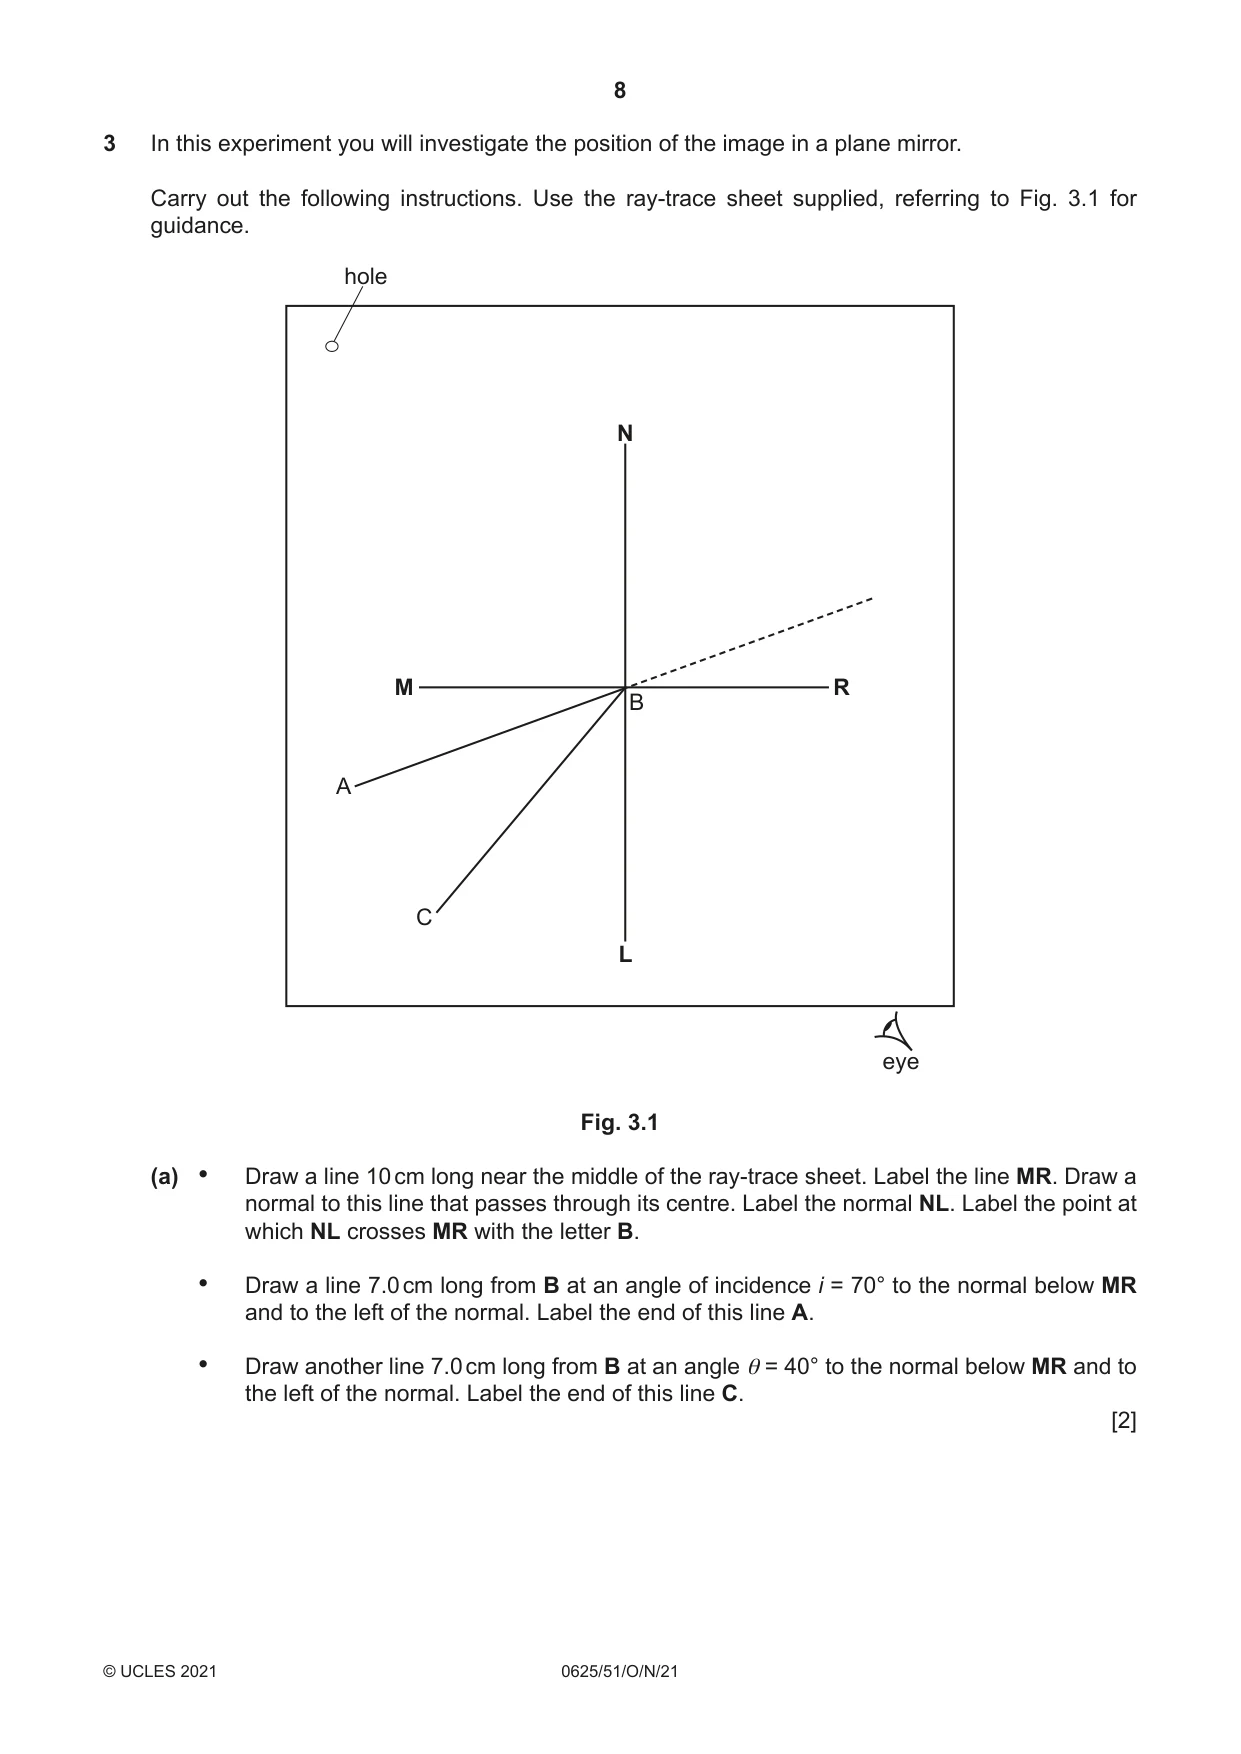
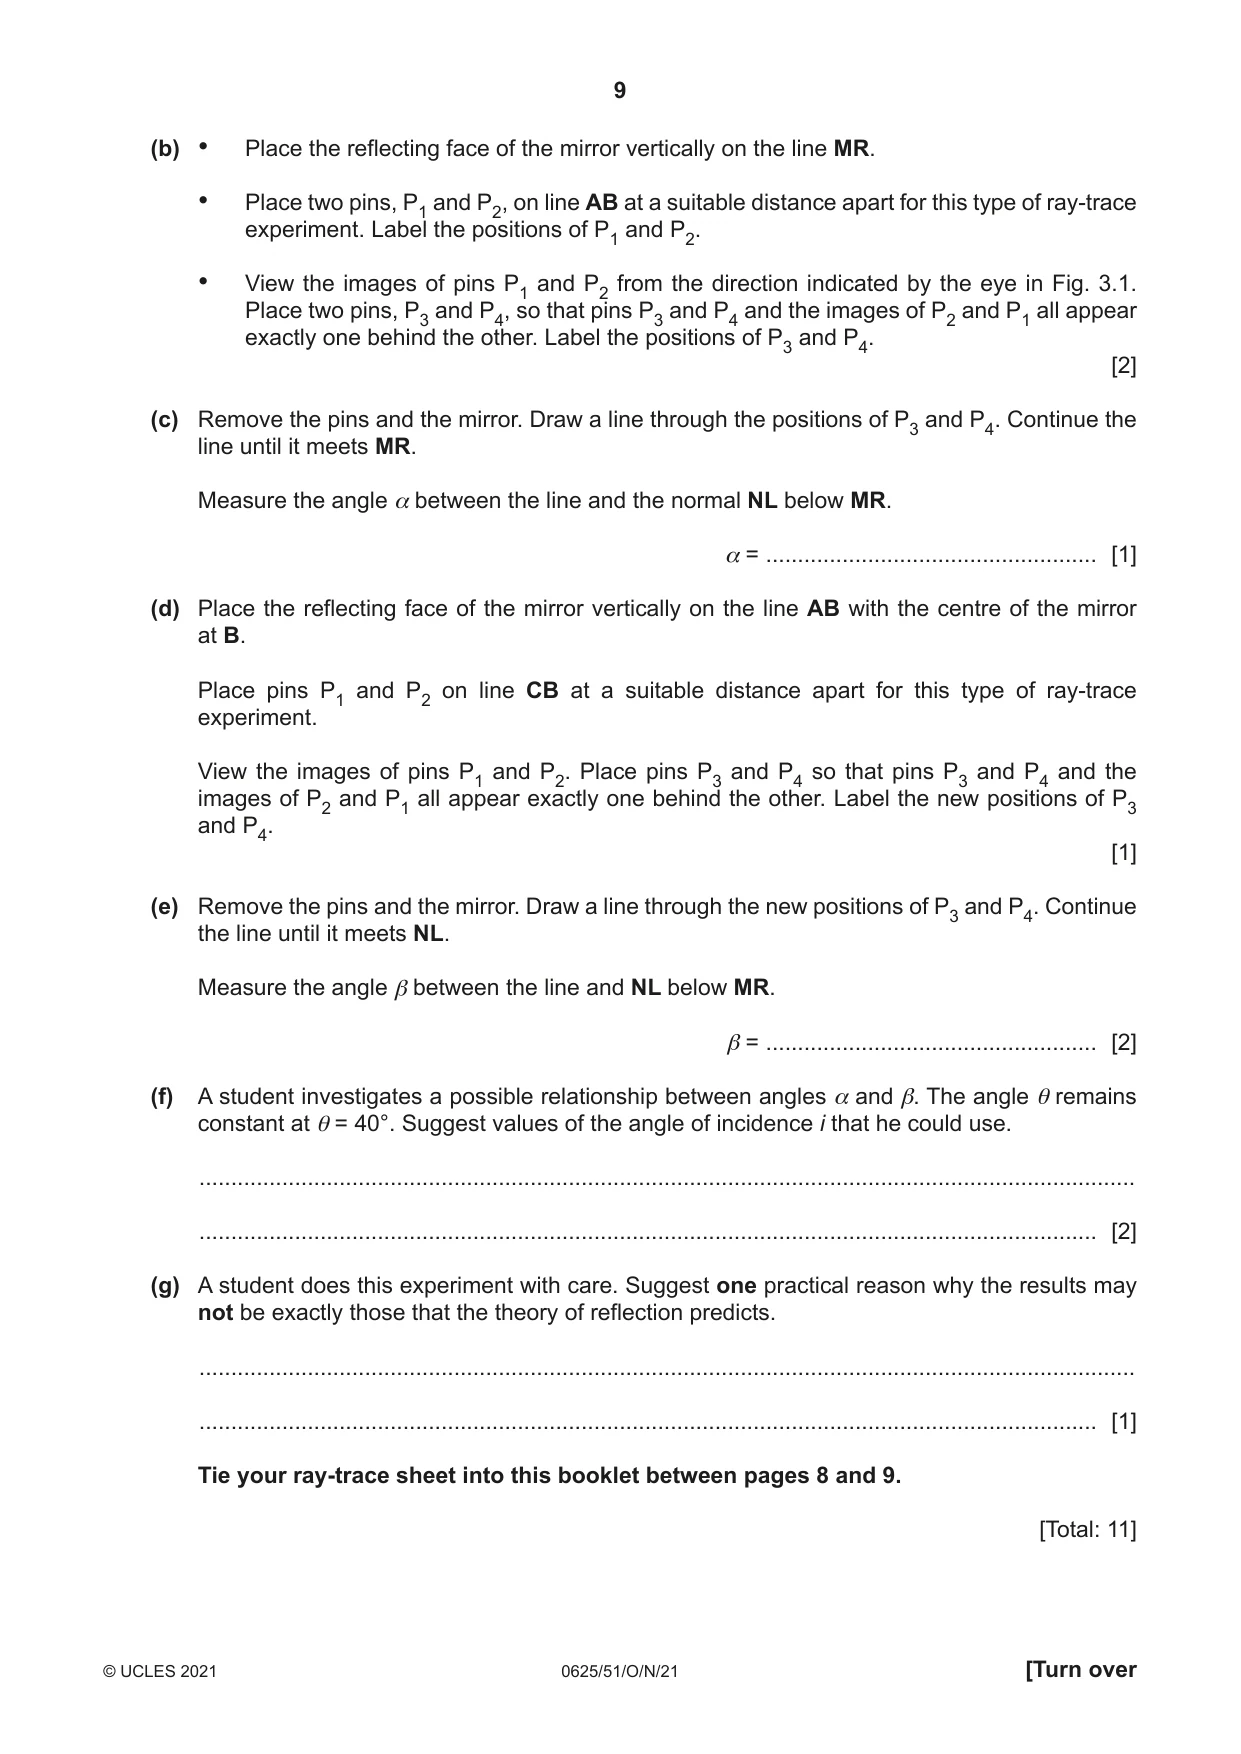
3 In this experiment you will investigate the position of the image in a plane mirror. Carry out the following instructions. Use the ray-trace sheet supplied, referring to Fig. 3.1 for guidance. hole N M R B A C L eye Fig. 3.1 (a) • Draw a line 10 cm long near the middle of the ray-trace sheet. Label the line MR. Draw a normal to this line that passes through its centre. Label the normal NL. Label the point at which NL crosses MR with the letter B. • Draw a line 7.0 cm long from B at an angle of incidence i = 70° to the normal below MR and to the left of the normal. Label the end of this line A. • Draw another line 7.0 cm long from B at an angle θ = 40° to the normal below MR and to the left of the normal. Label the end of this line C. [2] (b) • Place the reflecting face of the mirror vertically on the line MR. • Place two pins, P1 and P2, on line AB at a suitable distance apart for this type of ray-trace experiment. Label the positions of P1 and P2. • View the images of pins P1 and P2 from the direction indicated by the eye in Fig. 3.1. Place two pins, P3 and P4, so that pins P3 and P4 and the images of P2 and P1 all appear exactly one behind the other. Label the positions of P3 and P4. [2] (c) Remove the pins and the mirror. Draw a line through the positions of P3 and P4. Continue the line until it meets MR. Measure the angle α between the line and the normal NL below MR. α = .................................................... [1] (d) Place the reflecting face of the mirror vertically on the line AB with the centre of the mirror at B. Place pins P1 and P2 on line CB at a suitable distance apart for this type of ray-trace experiment. View the images of pins P1 and P2. Place pins P3 and P4 so that pins P3 and P4 and the images of P2 and P1 all appear exactly one behind the other. Label the new positions of P3 and P4. [1] (e) Remove the pins and the mirror. Draw a line through the new positions of P3 and P4. Continue the line until it meets NL. Measure the angle β between the line and NL below MR. β = .................................................... [2] (f) A student investigates a possible relationship between angles α and β. The angle θ remains constant at θ = 40°. Suggest values of the angle of incidence i that he could use. ................................................................................................................................................... ............................................................................................................................................. [2] (g) A student does this experiment with care. Suggest one practical reason why the results may not be exactly those that the theory of reflection predicts. ................................................................................................................................................... ............................................................................................................................................. [1] Tie your ray-trace sheet into this booklet between pages 8 and 9. [Total: 11]
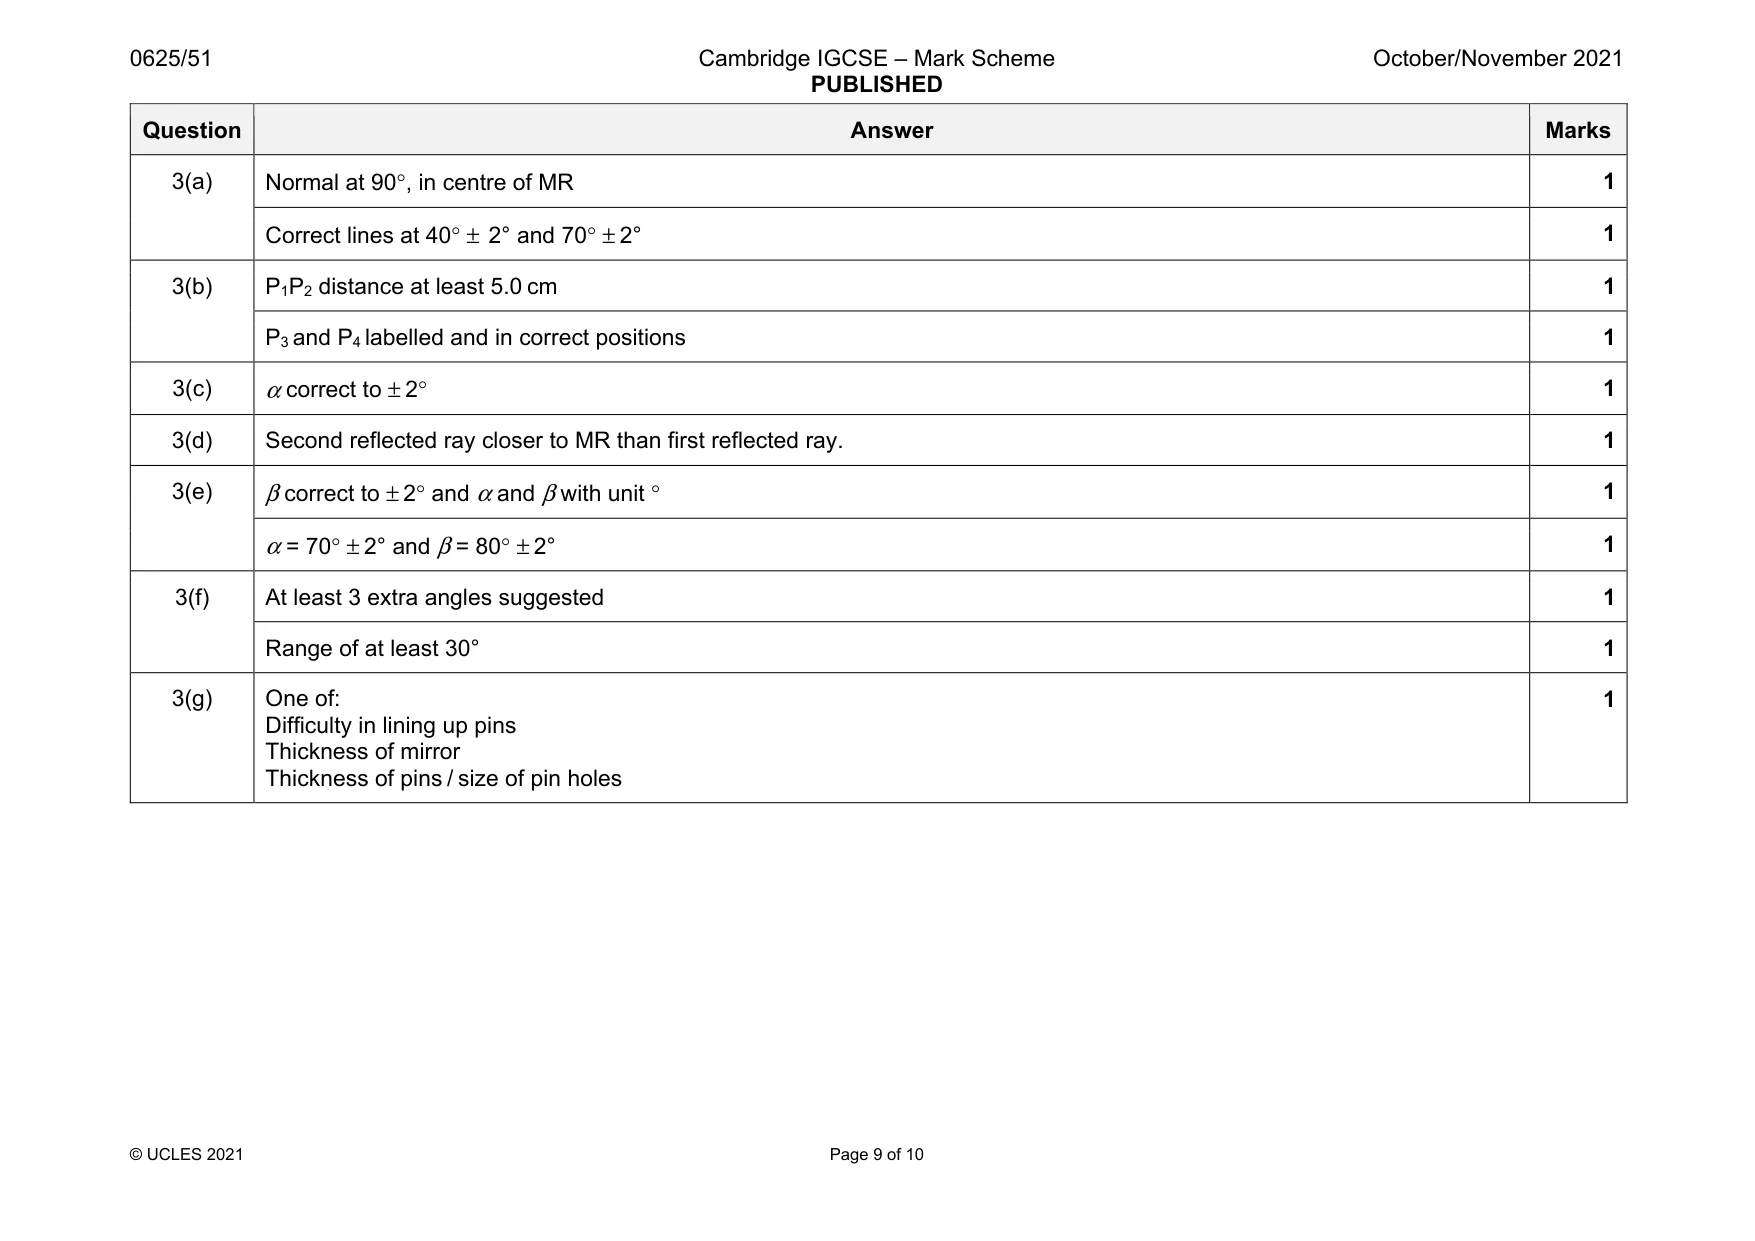
Mark scheme: 3(a) Normal at 90°, in centre of MR 1 Correct lines at 40° ± 2° and 70° ± 2° 1 3(b) P1P2 distance at least 5.0 cm 1 P3 and P4 labelled and in correct positions 1 3(c) α correct to ± 2° 1 3(d) Second reflected ray closer to MR than first reflected ray. 1 3(e) β correct to ± 2° and α and β with unit ° 1 α = 70° ± 2° and β = 80° ± 2° 1 3(f) At least 3 extra angles suggested 1 Range of at least 30° 1 3(g) One of: Difficulty in lining up pins Thickness of mirror Thickness of pins / size of pin holes 1
Q4 · A student investigates the time taken to heat water in different uninsulated containers
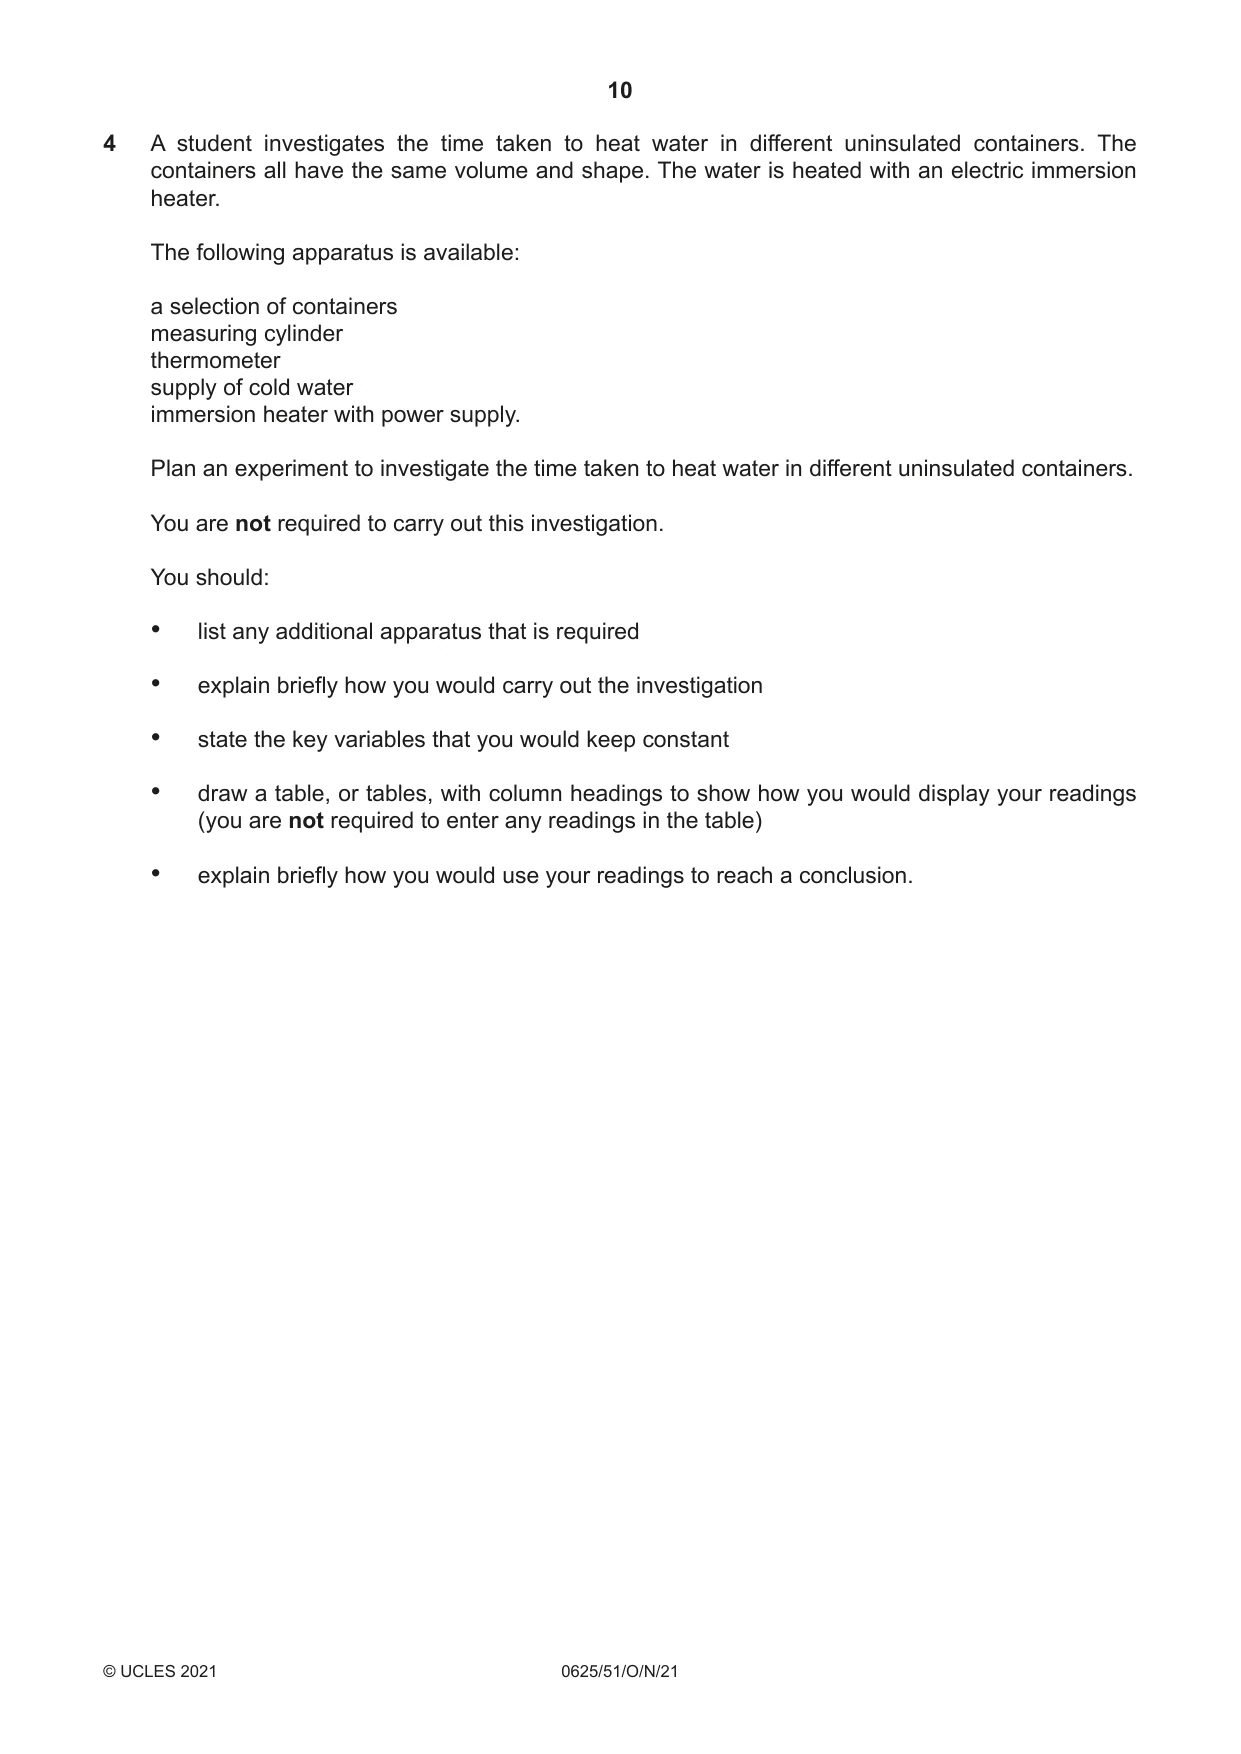
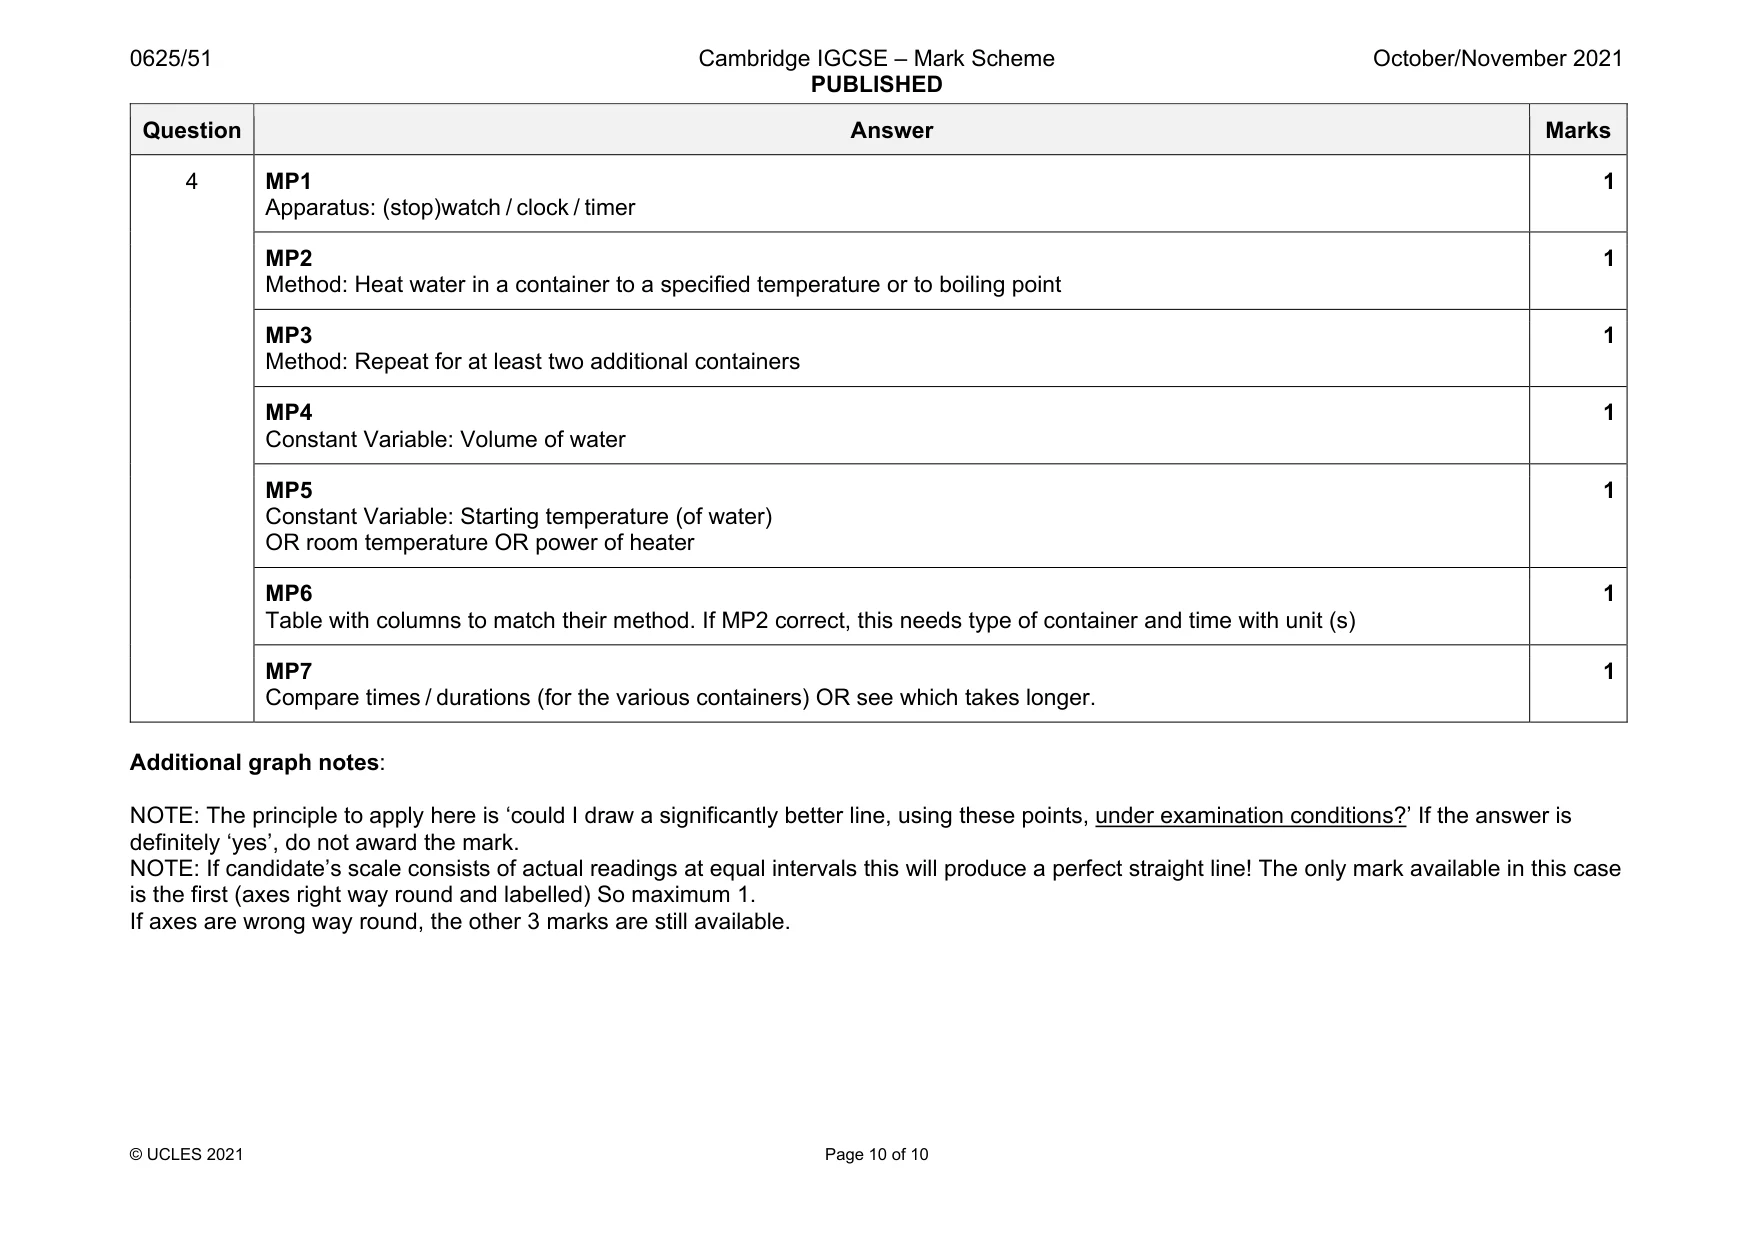
4 A student investigates the time taken to heat water in different uninsulated containers. The containers all have the same volume and shape. The water is heated with an electric immersion heater. The following apparatus is available: a selection of containers measuring cylinder thermometer supply of cold water immersion heater with power supply. Plan an experiment to investigate the time taken to heat water in different uninsulated containers. You are not required to carry out this investigation. You should: • list any additional apparatus that is required • explain briefly how you would carry out the investigation • state the key variables that you would keep constant • draw a table, or tables, with column headings to show how you would display your readings (you are not required to enter any readings in the table) • explain briefly how you would use your readings to reach a conclusion. .......................................................................................................................................................... .......................................................................................................................................................... .......................................................................................................................................................... .......................................................................................................................................................... .......................................................................................................................................................... .......................................................................................................................................................... .......................................................................................................................................................... .......................................................................................................................................................... .......................................................................................................................................................... .......................................................................................................................................................... .......................................................................................................................................................... .......................................................................................................................................................... .......................................................................................................................................................... .......................................................................................................................................................... .......................................................................................................................................................... .......................................................................................................................................................... .......................................................................................................................................................... .......................................................................................................................................................... .......................................................................................................................................................... .......................................................................................................................................................... .................................................................................................................................................... [7]
Mark scheme: 4 MP1 Apparatus: (stop)watch / clock / timer 1 MP2 Method: Heat water in a container to a specified temperature or to boiling point 1 MP3 Method: Repeat for at least two additional containers 1 MP4 Constant Variable: Volume of water 1 MP5 Constant Variable: Starting temperature (of water) OR room temperature OR power of heater 1 MP6 Table with columns to match their method. If MP2 correct, this needs type of container and time with unit (s) 1 MP7 Compare times / durations (for the various containers) OR see which takes longer. 1 Additional graph notes: NOTE: The principle to apply here is ‘could I draw a significantly better line, using these points, under examination conditions?’ If the answer is definitely ‘yes’, do not award the mark. NOTE: If candidate’s scale consists of actual readings at equal intervals this will produce a perfect straight line! The only mark available in this case is the first (axes right way round and labelled) So maximum 1. If axes are wrong way round, the other 3 marks are still available.
What was in this paper
The subtopics covered by these 4 questions, and how many questions each got. Open one in a new tab to see every Cambridge question on it.
What you needed in this session
Cambridge’s own grade thresholds for 2021 Oct/Nov, Paper 5 · Variant 1. A higher threshold means an easier paper — the bar moves with how the cohort did.