Cambridge IGCSE Physics 0625 — 2020 Oct/Nov Paper 6 · Variant 3
0625/63/O/N/20 · 4 questions · 40 marks · ≈45 min
The question paper and its mark scheme, free to read here and free to download. This is Cambridge’s own paper, exactly as it was sat.
Question paper12 pages
Mark scheme8 pages
Answers below. Sit the paper first if you are practising.
Questions as text
Q1 · Some students investigate the transfer of thermal energy from a beaker of hot water
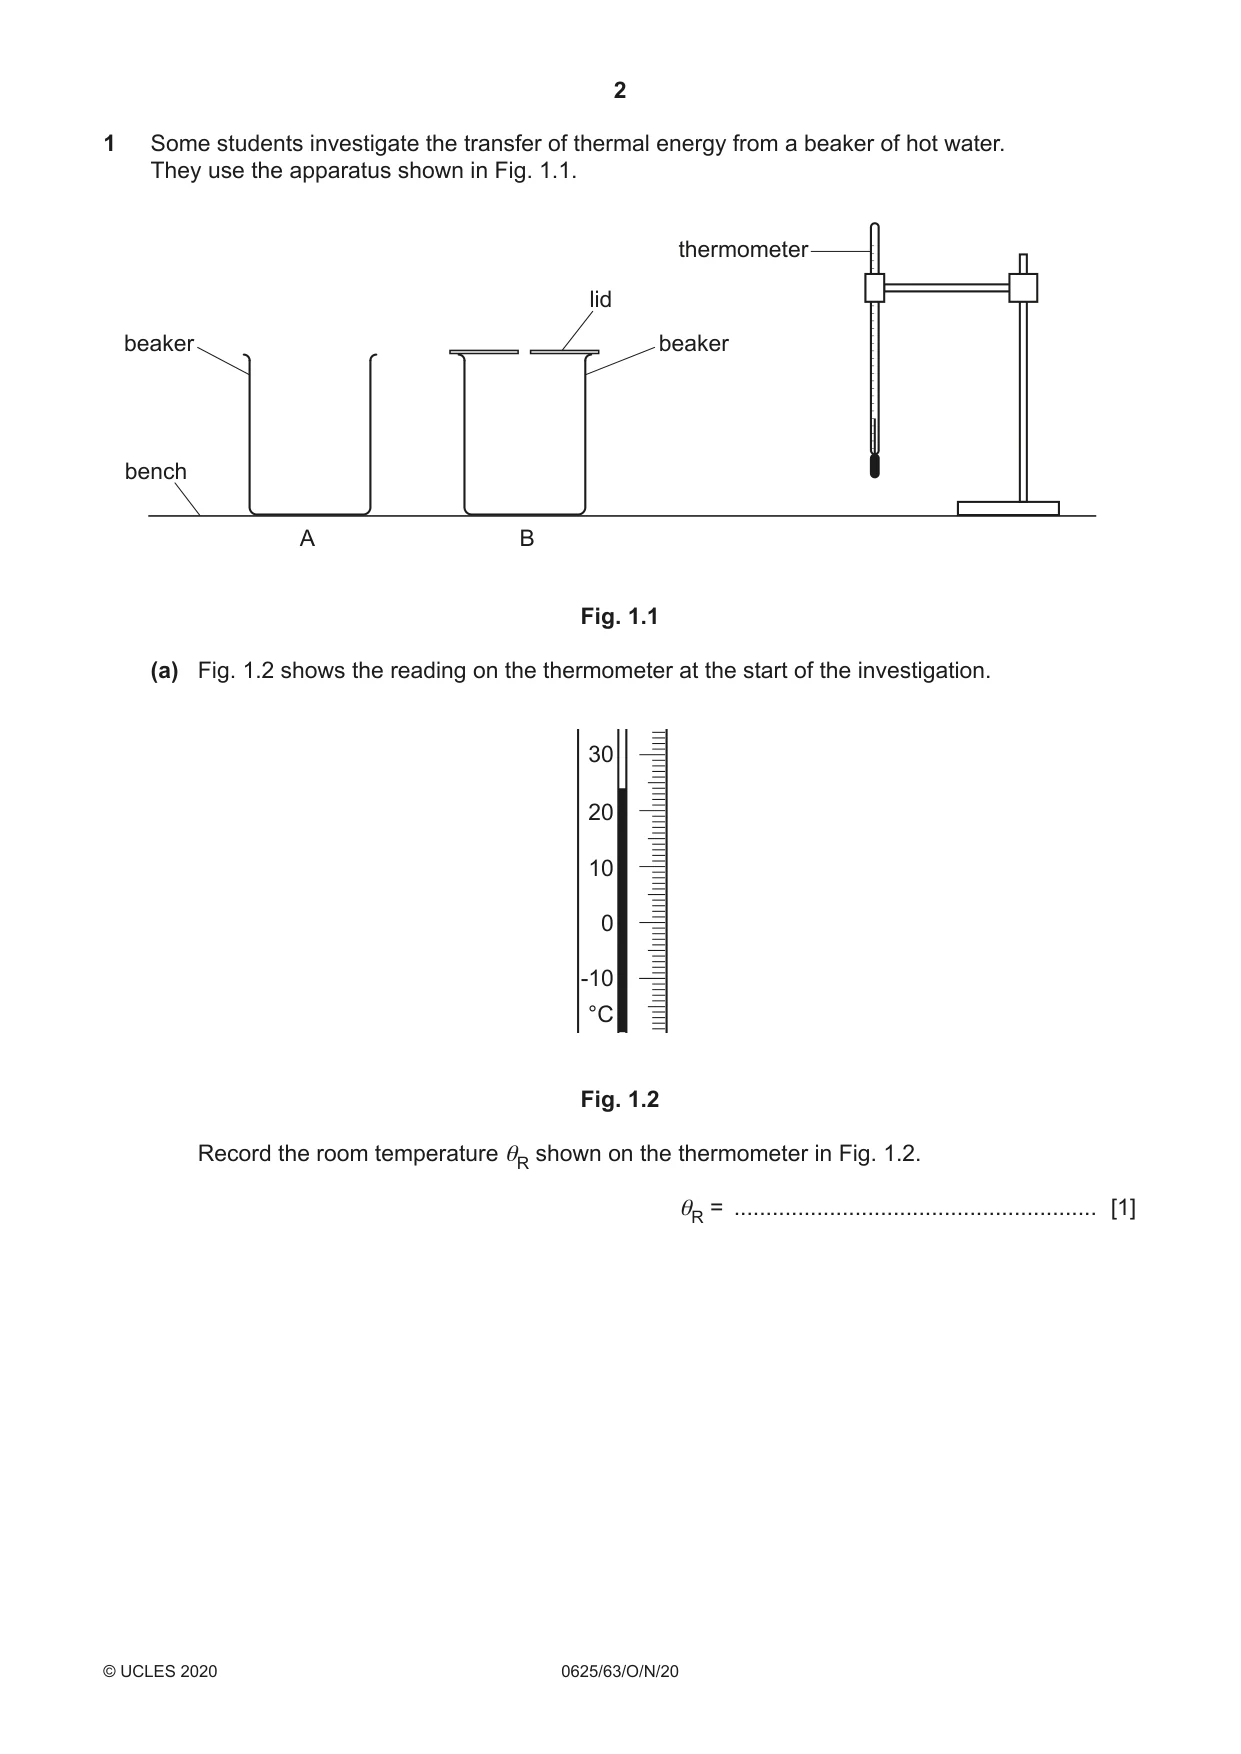
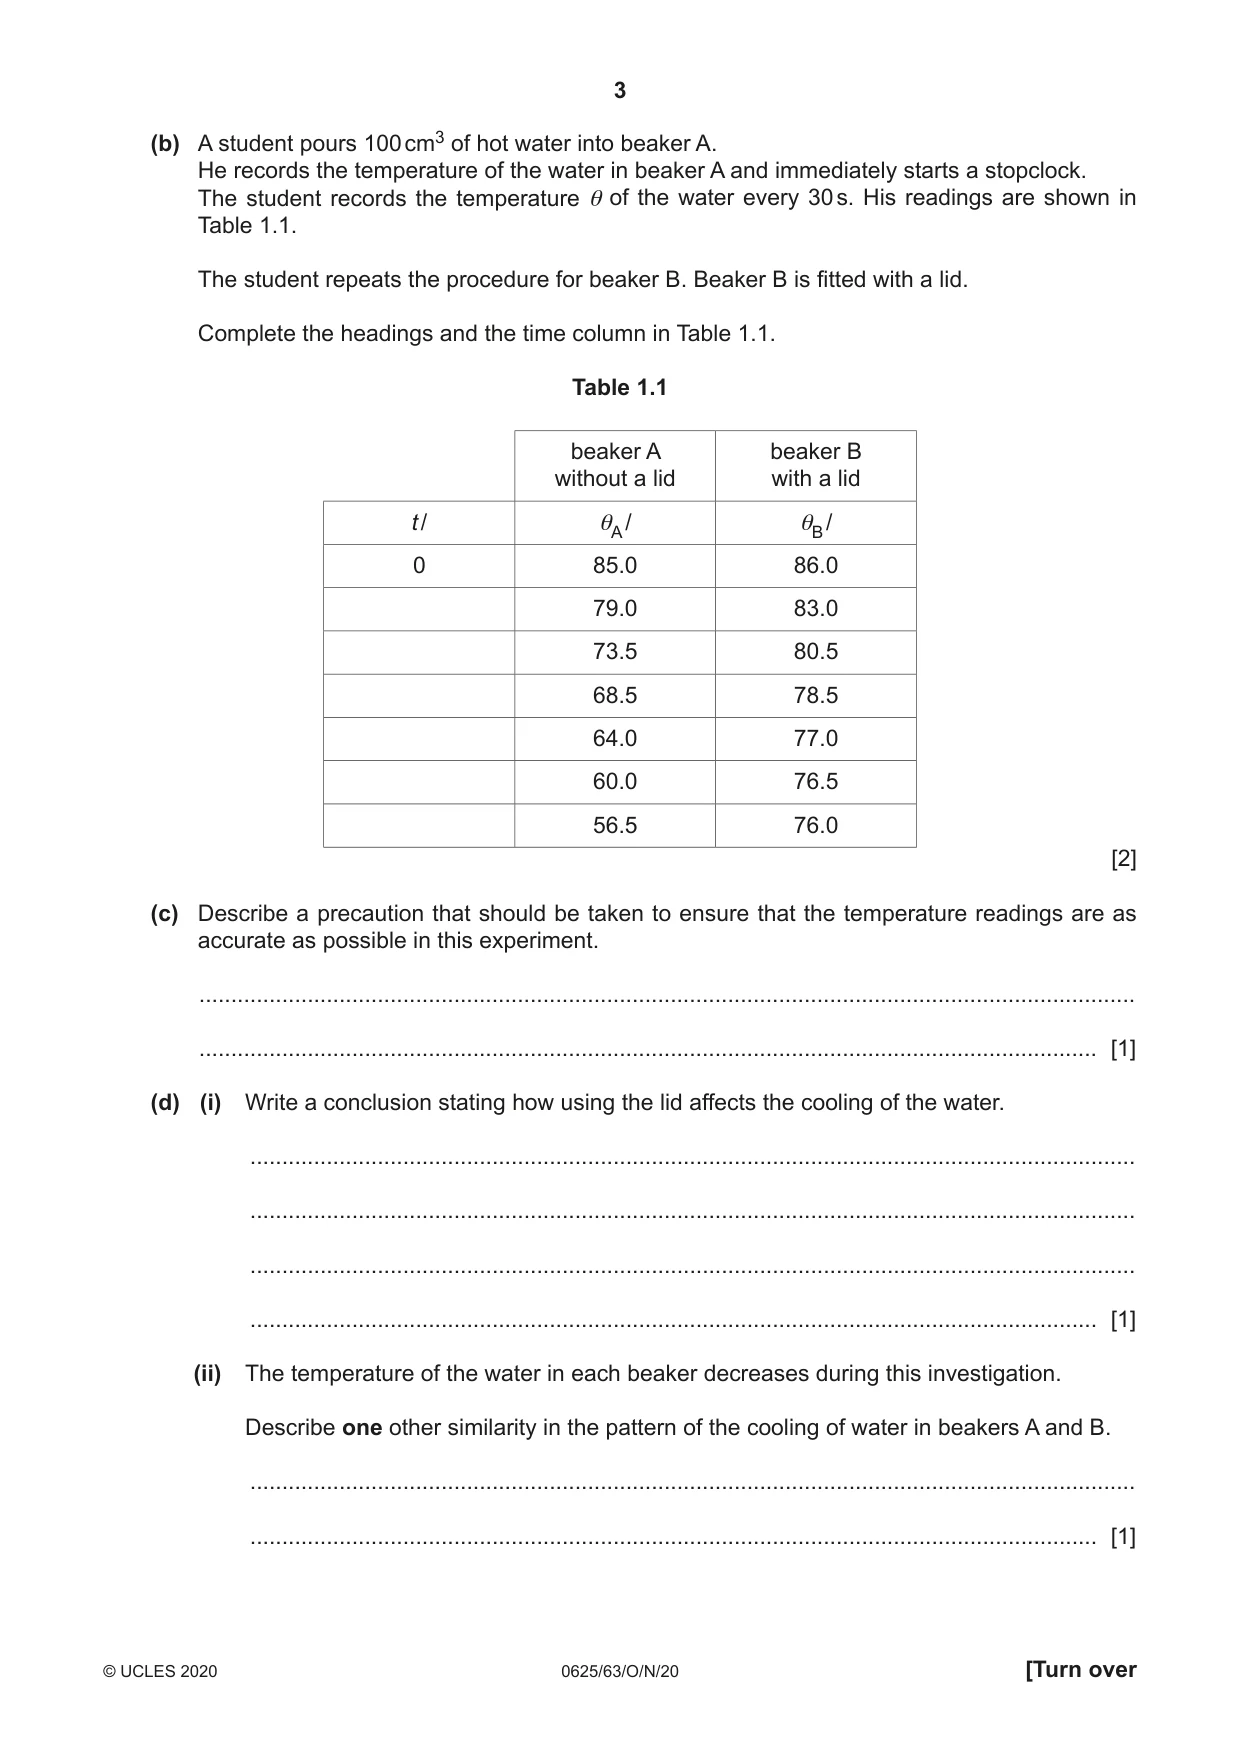
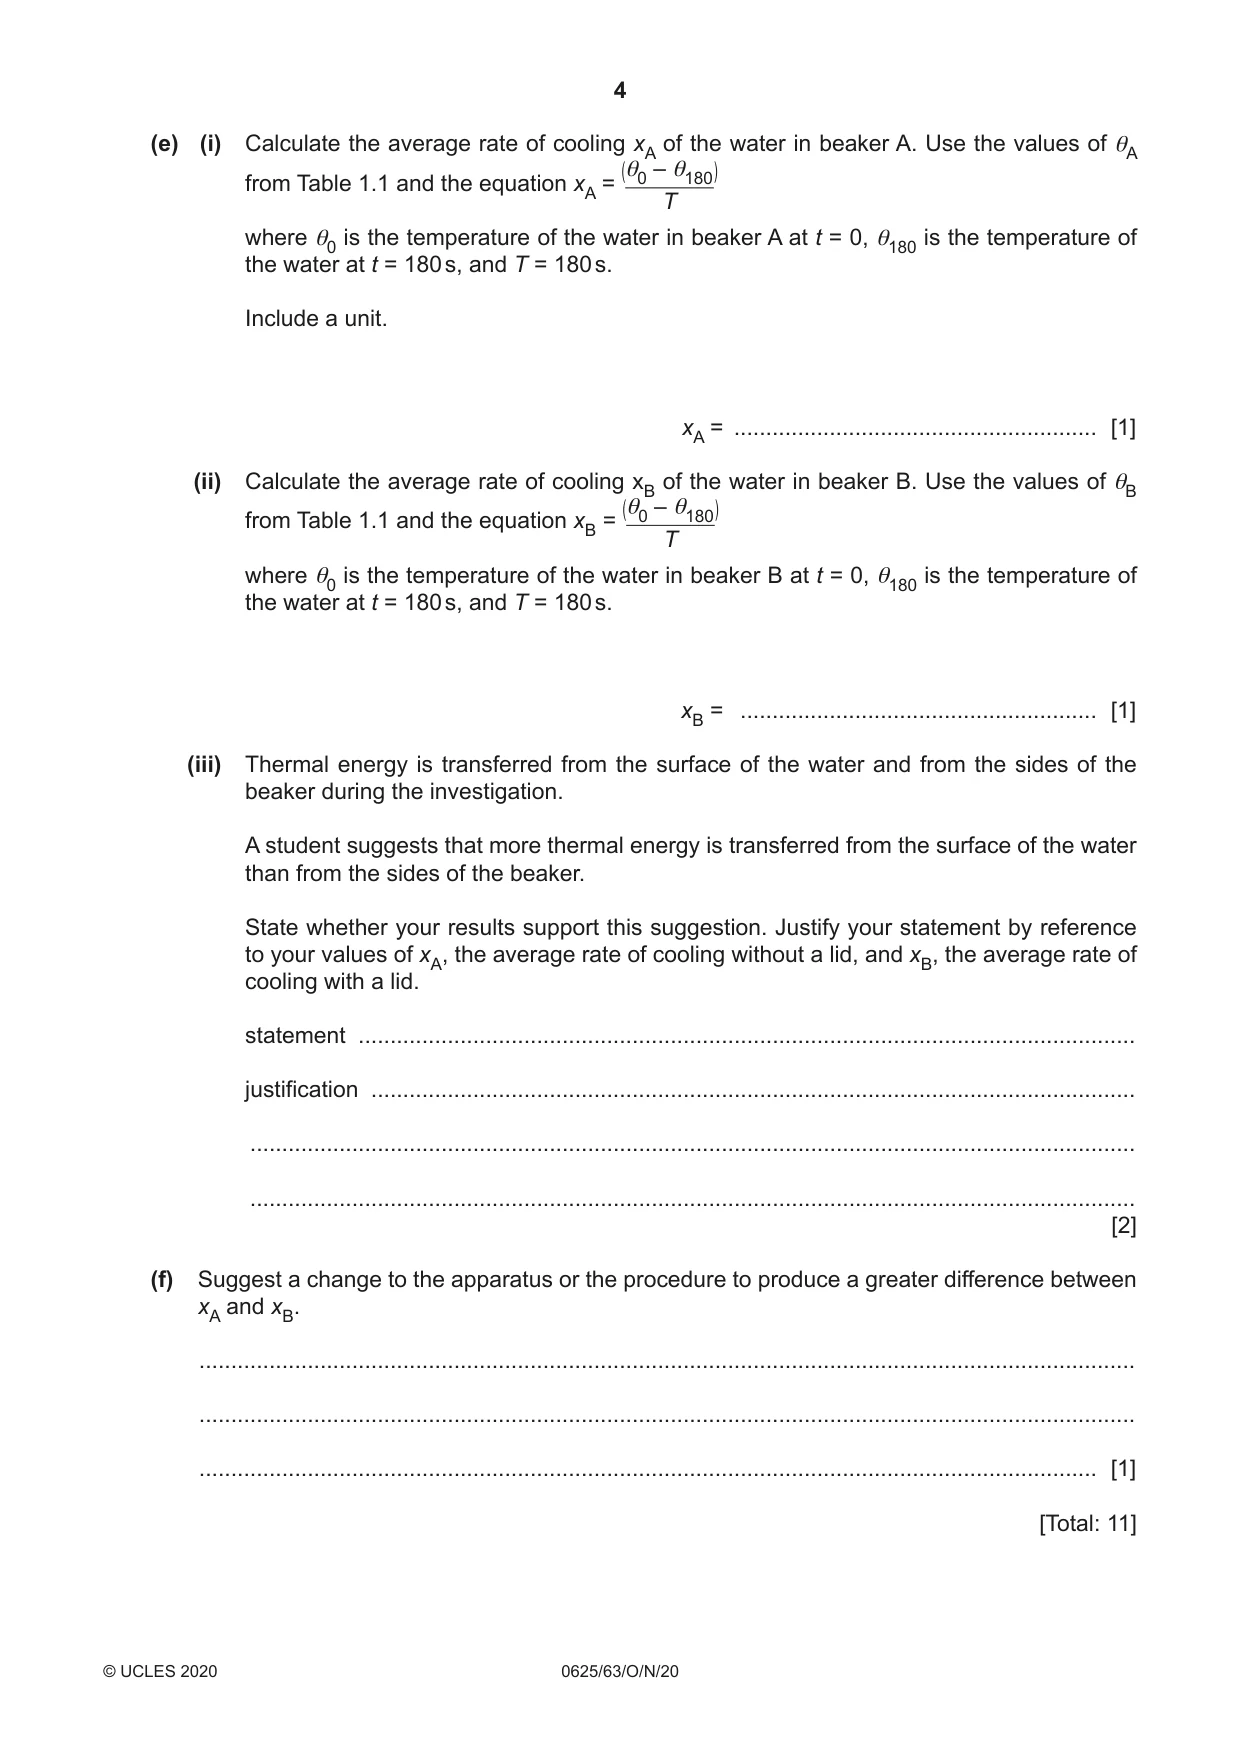
1 Some students investigate the transfer of thermal energy from a beaker of hot water. They use the apparatus shown in Fig. 1.1. thermometer lid beaker beaker bench A B Fig. 1.1 (a) Fig. 1.2 shows the reading on the thermometer at the start of the investigation. 30 20 10 0 -10 °C Fig. 1.2 Record the room temperature θR shown on the thermometer in Fig. 1.2. θR = ......................................................... [1] (b) A student pours 100 cm3 of hot water into beaker A. He records the temperature of the water in beaker A and immediately starts a stopclock. The student records the temperature θ of the water every 30 s. His readings are shown in Table 1.1. The student repeats the procedure for beaker B. Beaker B is fitted with a lid. Complete the headings and the time column in Table 1.1. Table 1.1 beaker A beaker B without a lid with a lid t / θA / θB / 0 85.0 86.0 79.0 83.0 73.5 80.5 68.5 78.5 64.0 77.0 60.0 76.5 56.5 76.0 [2] (c) Describe a precaution that should be taken to ensure that the temperature readings are as accurate as possible in this experiment. ................................................................................................................................................... ............................................................................................................................................. [1] (d) (i) Write a conclusion stating how using the lid affects the cooling of the water. ........................................................................................................................................... ........................................................................................................................................... ........................................................................................................................................... ..................................................................................................................................... [1] (ii) The temperature of the water in each beaker decreases during this investigation. Describe one other similarity in the pattern of the cooling of water in beakers A and B. ........................................................................................................................................... ..................................................................................................................................... [1] (e) (i) Calculate the average rate of cooling xA of the water in beaker A. Use the values of θA (θ0 – θ180 ) from Table 1.1 and the equation xA = T where θ0 is the temperature of the water in beaker A at t = 0, θ180 is the temperature of the water at t = 180 s, and T = 180 s. Include a unit. xA = ......................................................... [1] (ii) Calculate the average rate of cooling xB of the water in beaker B. Use the values of θB (θ0 – θ180 ) from Table 1.1 and the equation xB = T where θ0 is the temperature of the water in beaker B at t = 0, θ180 is the temperature of the water at t = 180 s, and T = 180 s. xB = ........................................................ [1] (iii) Thermal energy is transferred from the surface of the water and from the sides of the beaker during the investigation. A student suggests that more thermal energy is transferred from the surface of the water than from the sides of the beaker. State whether your results support this suggestion. Justify your statement by reference to your values of xA, the average rate of cooling without a lid, and xB, the average rate of cooling with a lid. statement .......................................................................................................................... justification ........................................................................................................................ ........................................................................................................................................... ........................................................................................................................................... [2] (f) Suggest a change to the apparatus or the procedure to produce a greater difference between xA and xB. ................................................................................................................................................... ................................................................................................................................................... ............................................................................................................................................. [1] [Total: 11]
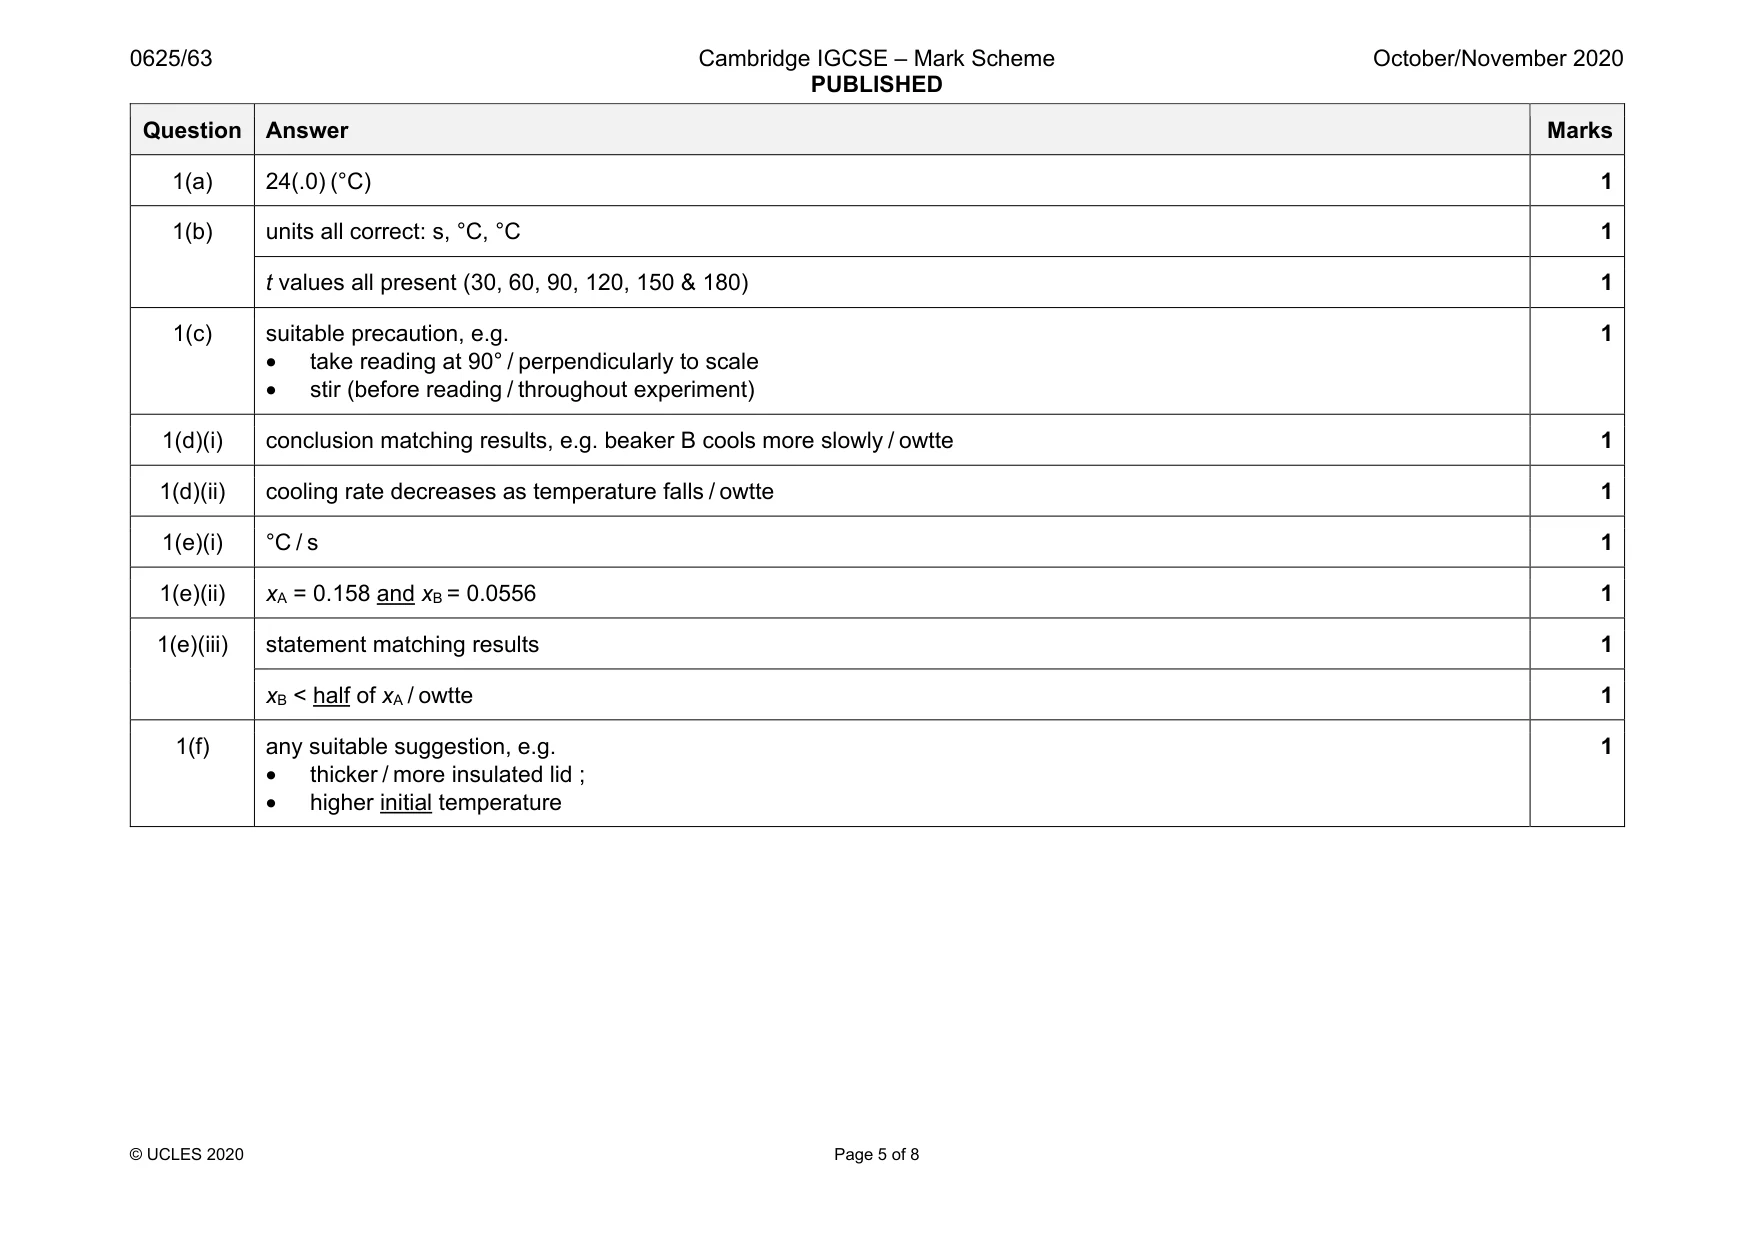
Mark scheme: 1(a) 24(.0) (°C) 1 1(b) units all correct: s, °C, °C 1 t values all present (30, 60, 90, 120, 150 & 180) 1 1(c) suitable precaution, e.g. • take reading at 90° / perpendicularly to scale • stir (before reading / throughout experiment) 1 1(d)(i) conclusion matching results, e.g. beaker B cools more slowly / owtte 1 1(d)(ii) cooling rate decreases as temperature falls / owtte 1 1(e)(i) °C / s 1 1(e)(ii) xA = 0.158 and xB = 0.0556 1 1(e)(iii) statement matching results 1 xB < half of xA / owtte 1 1(f) any suitable suggestion, e.g. • thicker / more insulated lid ; • higher initial temperature 1 Question Answer Marks
Q2 · Some students investigate an electrical circuit containing different combinations of…
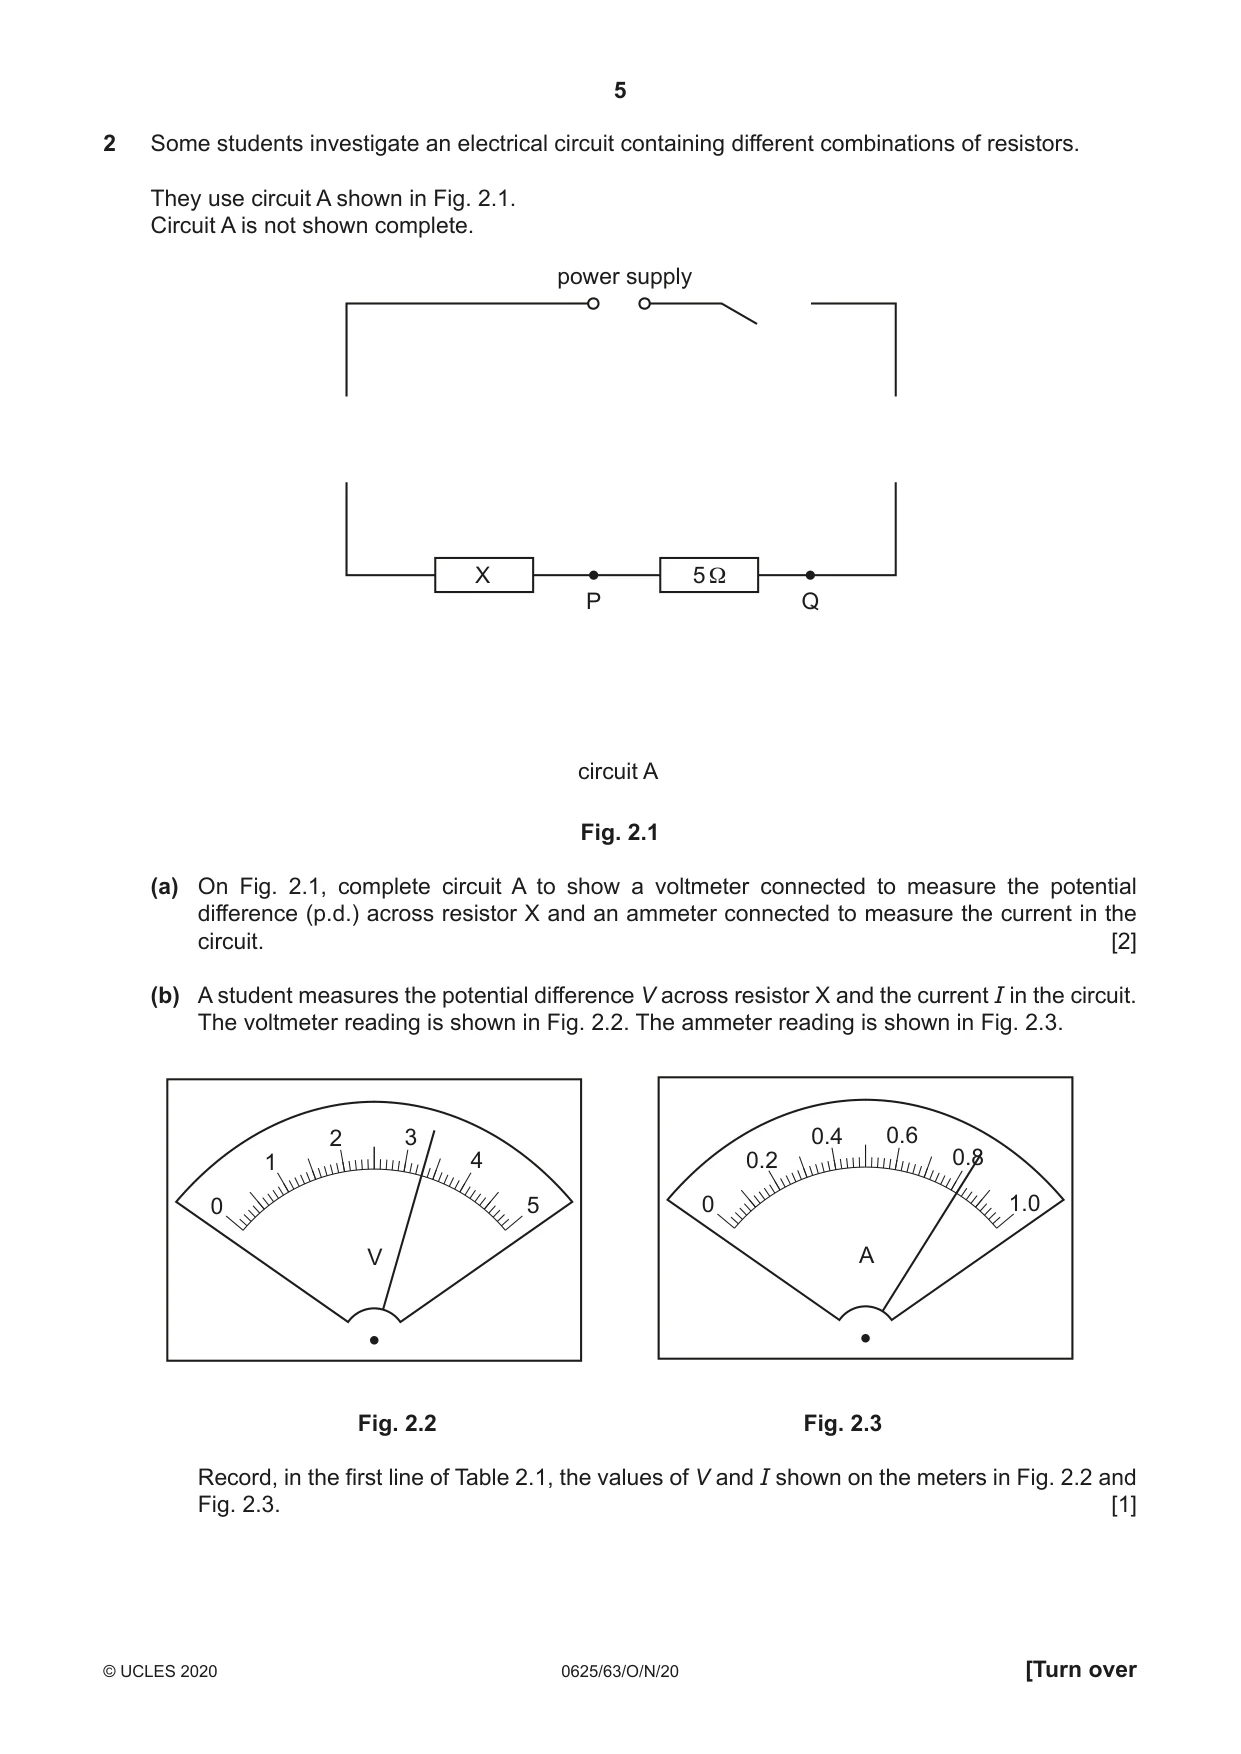
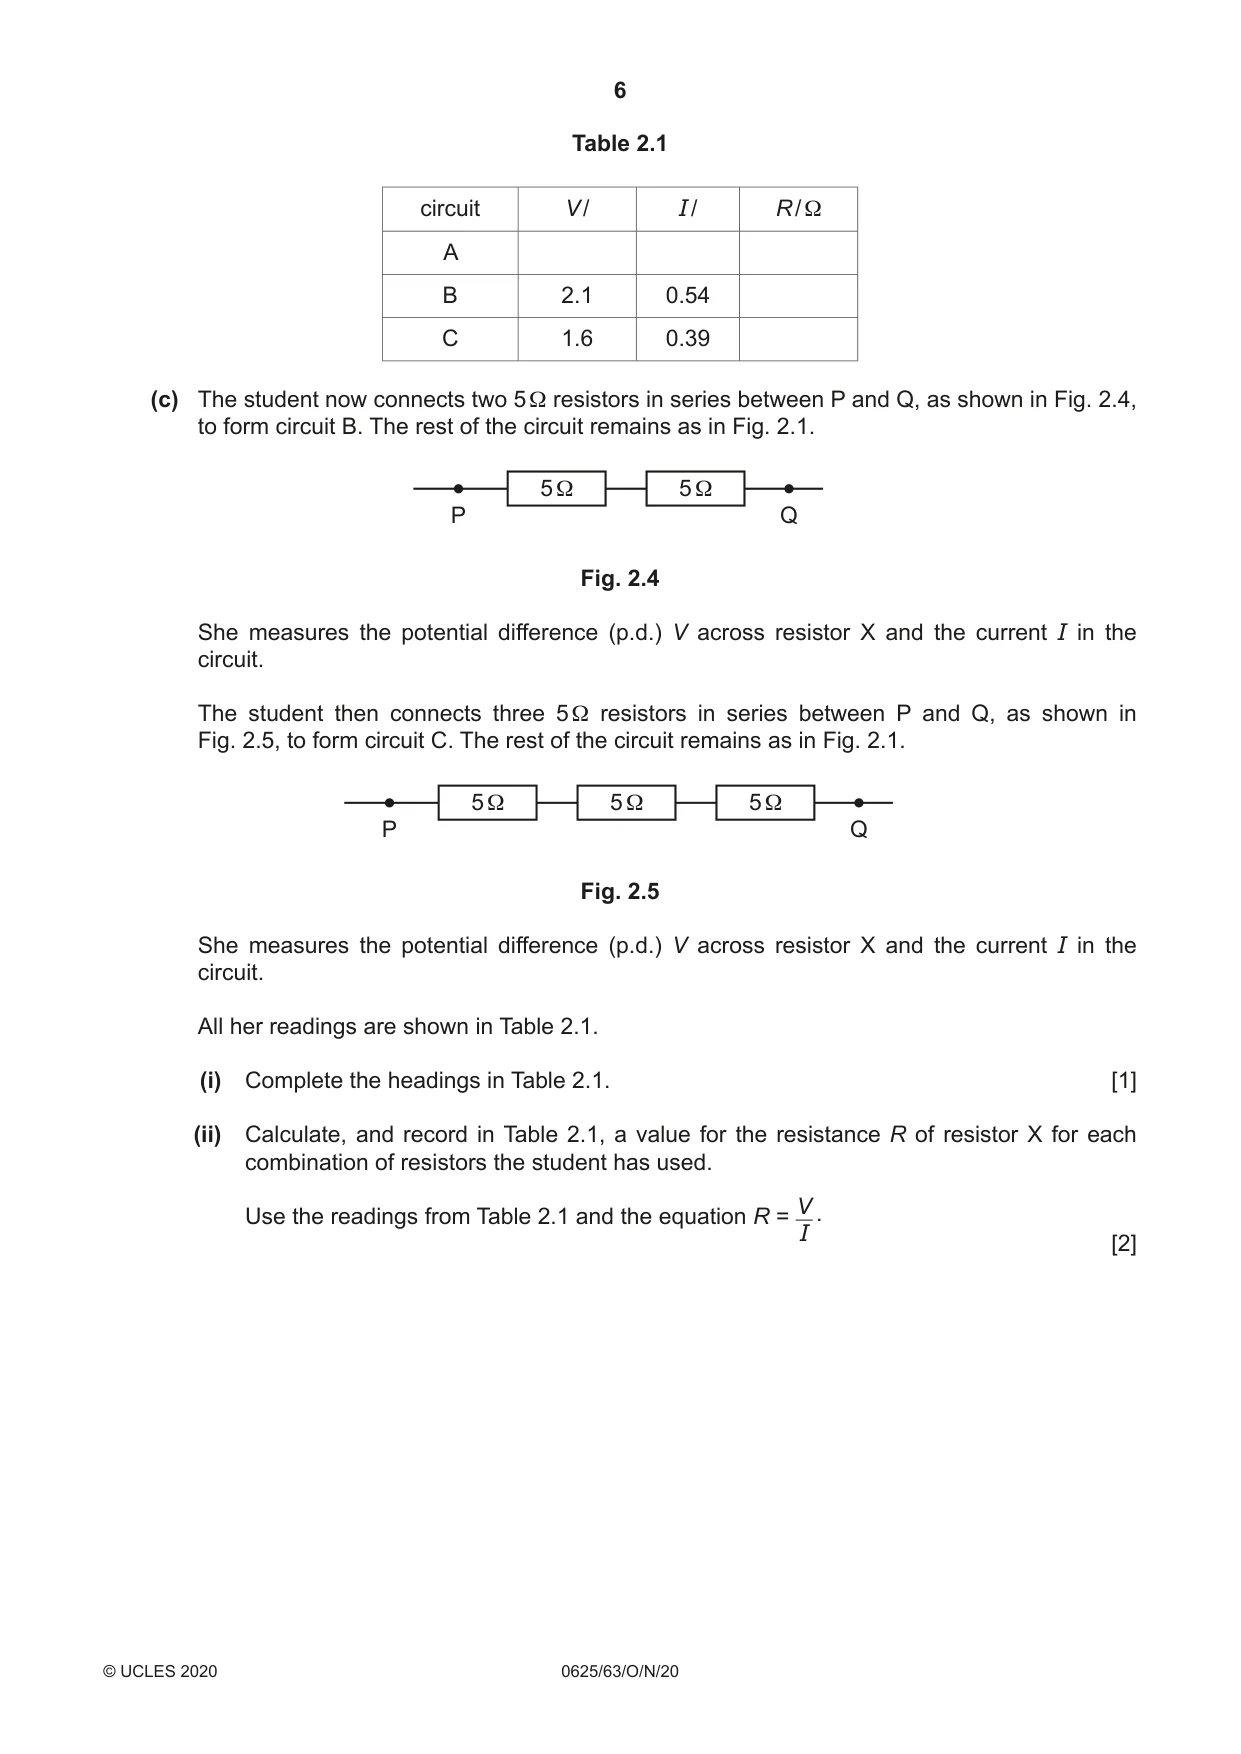
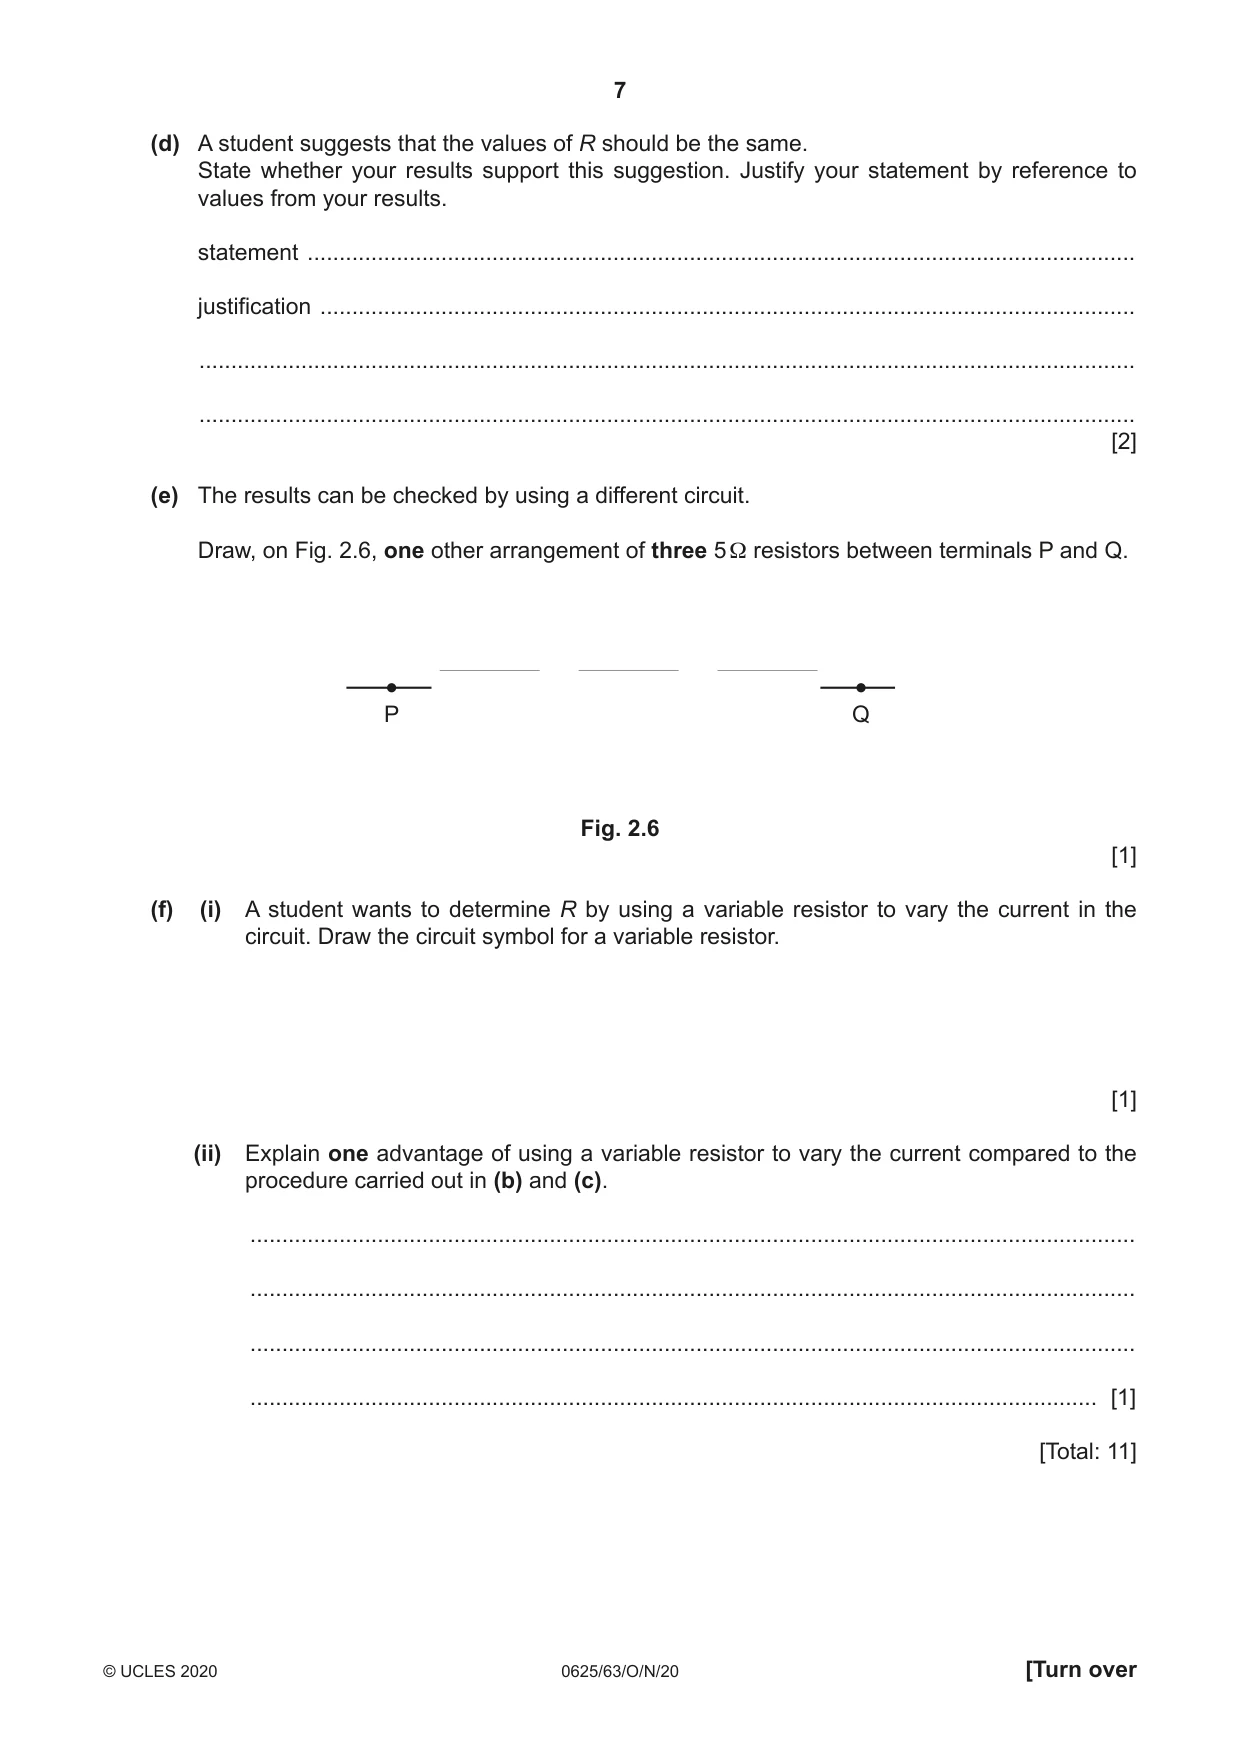
2 Some students investigate an electrical circuit containing different combinations of resistors. They use circuit A shown in Fig. 2.1. Circuit A is not shown complete. power supply X 5 Ω P Q circuit A Fig. 2.1 (a) On Fig. 2.1, complete circuit A to show a voltmeter connected to measure the potential difference (p.d.) across resistor X and an ammeter connected to measure the current in the circuit. [2] (b) A student measures the potential difference V across resistor X and the current I in the circuit. The voltmeter reading is shown in Fig. 2.2. The ammeter reading is shown in Fig. 2.3. 2 3 0.4 0.6 1 4 0.2 0.8 0 5 0 1.0 V A Fig. 2.2 Fig. 2.3 Record, in the first line of Table 2.1, the values of V and I shown on the meters in Fig. 2.2 and Fig. 2.3. [1] Table 2.1 circuit V / I / R / Ω A B 2.1 0.54 C 1.6 0.39 (c) The student now connects two 5 Ω resistors in series between P and Q, as shown in Fig. 2.4, to form circuit B. The rest of the circuit remains as in Fig. 2.1. 5 Ω 5 Ω P Q Fig. 2.4 She measures the potential difference (p.d.) V across resistor X and the current I in the circuit. The student then connects three 5 Ω resistors in series between P and Q, as shown in Fig. 2.5, to form circuit C. The rest of the circuit remains as in Fig. 2.1. 5 Ω 5 Ω 5 Ω P Q Fig. 2.5 She measures the potential difference (p.d.) V across resistor X and the current I in the circuit. All her readings are shown in Table 2.1. (i) Complete the headings in Table 2.1. [1] (ii) Calculate, and record in Table 2.1, a value for the resistance R of resistor X for each combination of resistors the student has used. V Use the readings from Table 2.1 and the equation R = . I [2] (d) A student suggests that the values of R should be the same. State whether your results support this suggestion. Justify your statement by reference to values from your results. statement .................................................................................................................................. justification ................................................................................................................................ ................................................................................................................................................... ................................................................................................................................................... [2] (e) The results can be checked by using a different circuit. Draw, on Fig. 2.6, one other arrangement of three 5 Ω resistors between terminals P and Q. 5 Ω 5 Ω 5 Ω P Q Fig. 2.6 [1] (f) (i) A student wants to determine R by using a variable resistor to vary the current in the circuit. Draw the circuit symbol for a variable resistor. [1] (ii) Explain one advantage of using a variable resistor to vary the current compared to the procedure carried out in (b) and (c). ........................................................................................................................................... ........................................................................................................................................... ........................................................................................................................................... ..................................................................................................................................... [1] [Total: 11]
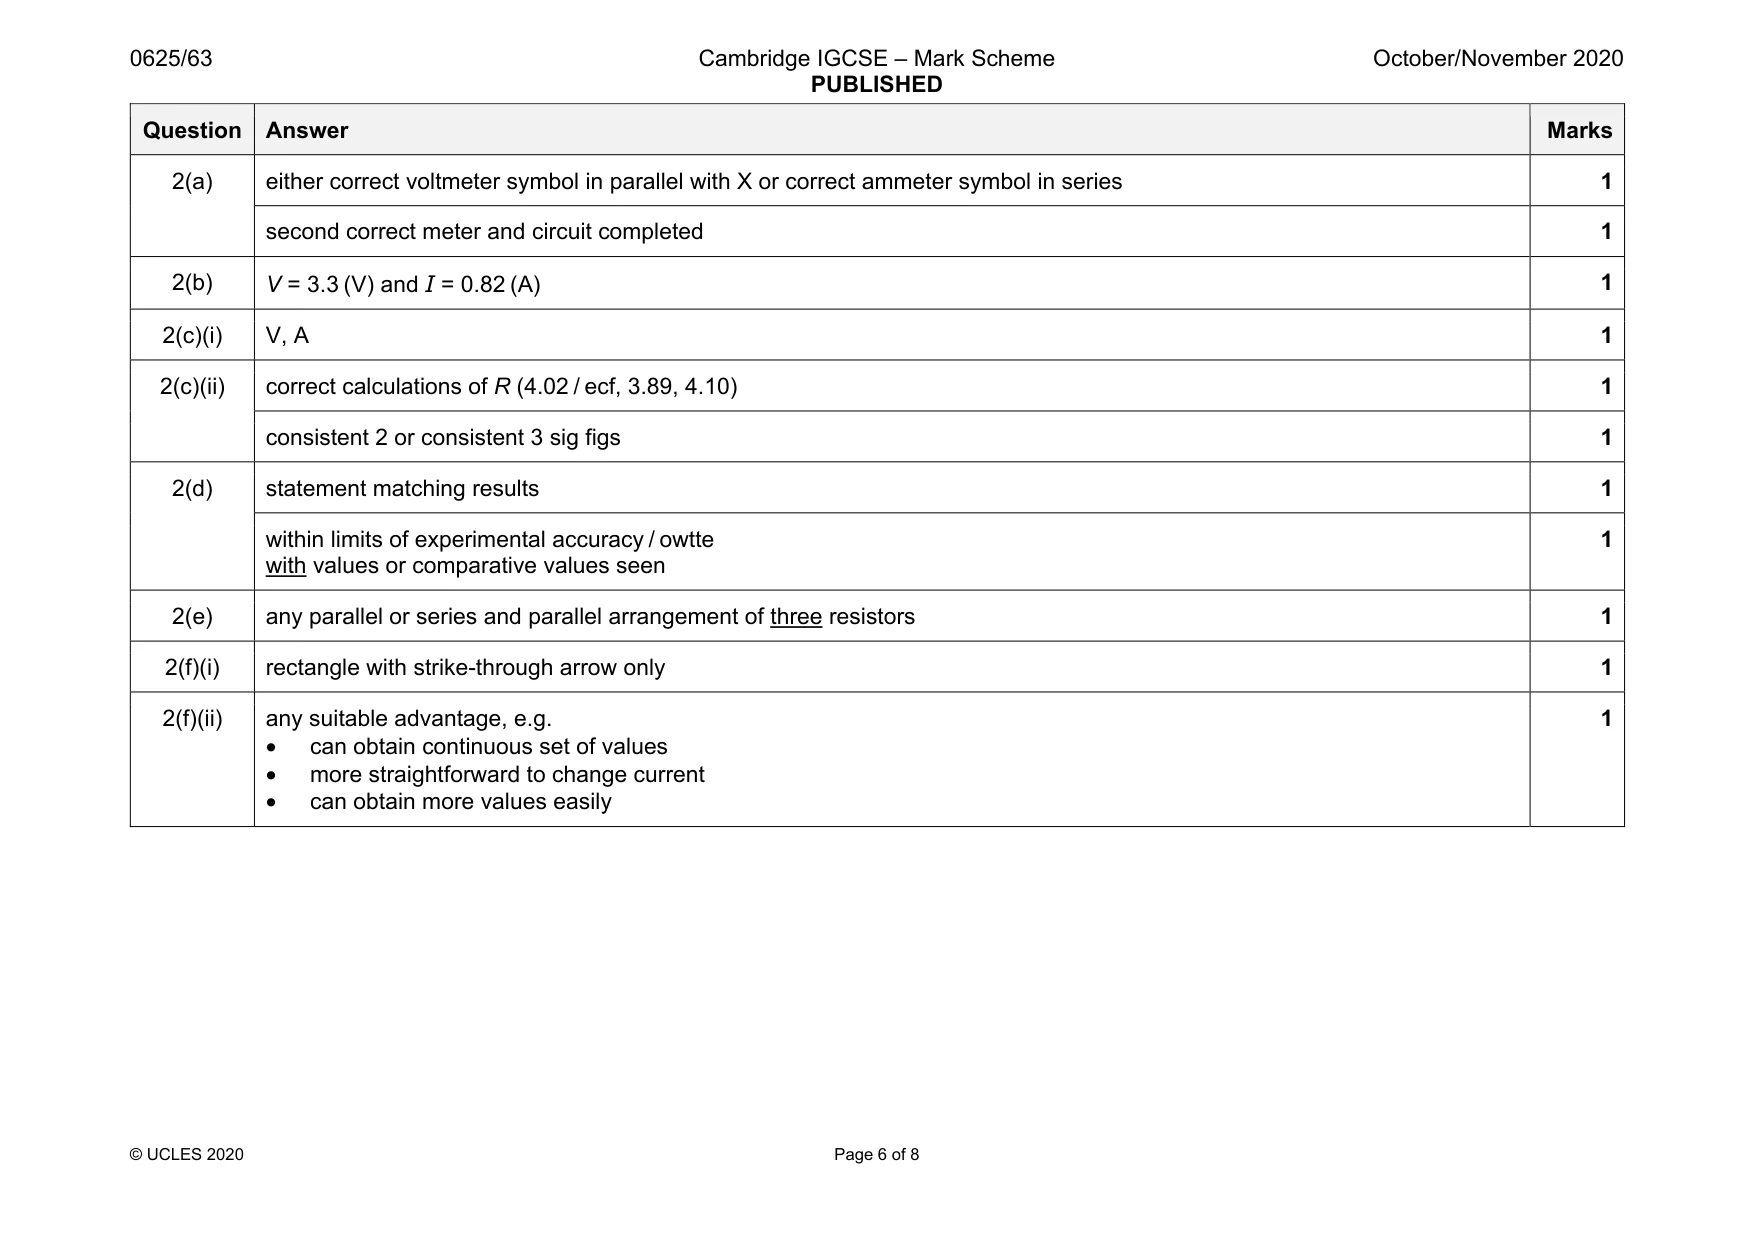
Mark scheme: 2(a) either correct voltmeter symbol in parallel with X or correct ammeter symbol in series 1 second correct meter and circuit completed 1 2(b) V = 3.3 (V) and I = 0.82 (A) 1 2(c)(i) V, A 1 2(c)(ii) correct calculations of R (4.02 / ecf, 3.89, 4.10) 1 consistent 2 or consistent 3 sig figs 1 2(d) statement matching results 1 within limits of experimental accuracy / owtte with values or comparative values seen 1 2(e) any parallel or series and parallel arrangement of three resistors 1 2(f)(i) rectangle with strike-through arrow only 1 2(f)(ii) any suitable advantage, e.g. • can obtain continuous set of values • more straightforward to change current • can obtain more values easily 1 Question Answer Marks
Q3 · A student investigates the image produced by a converging lens
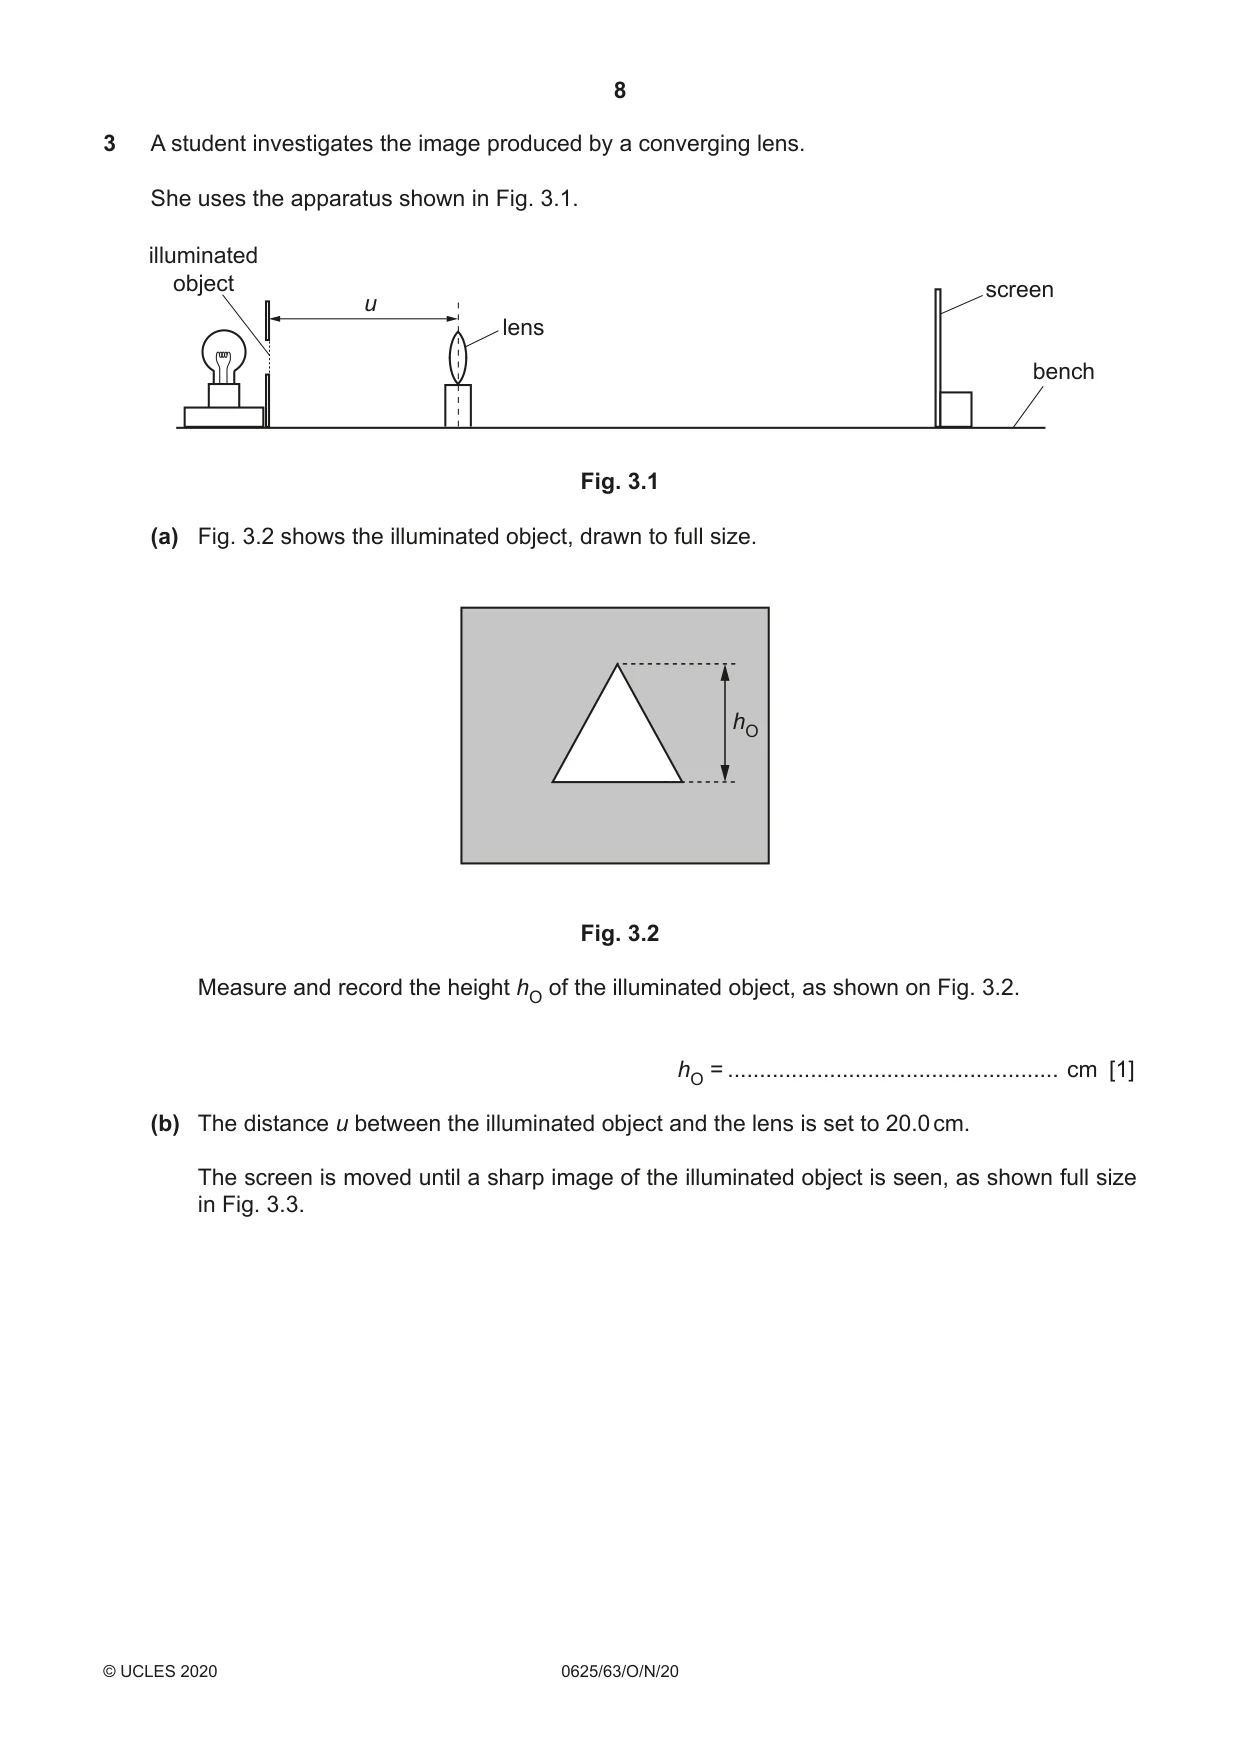
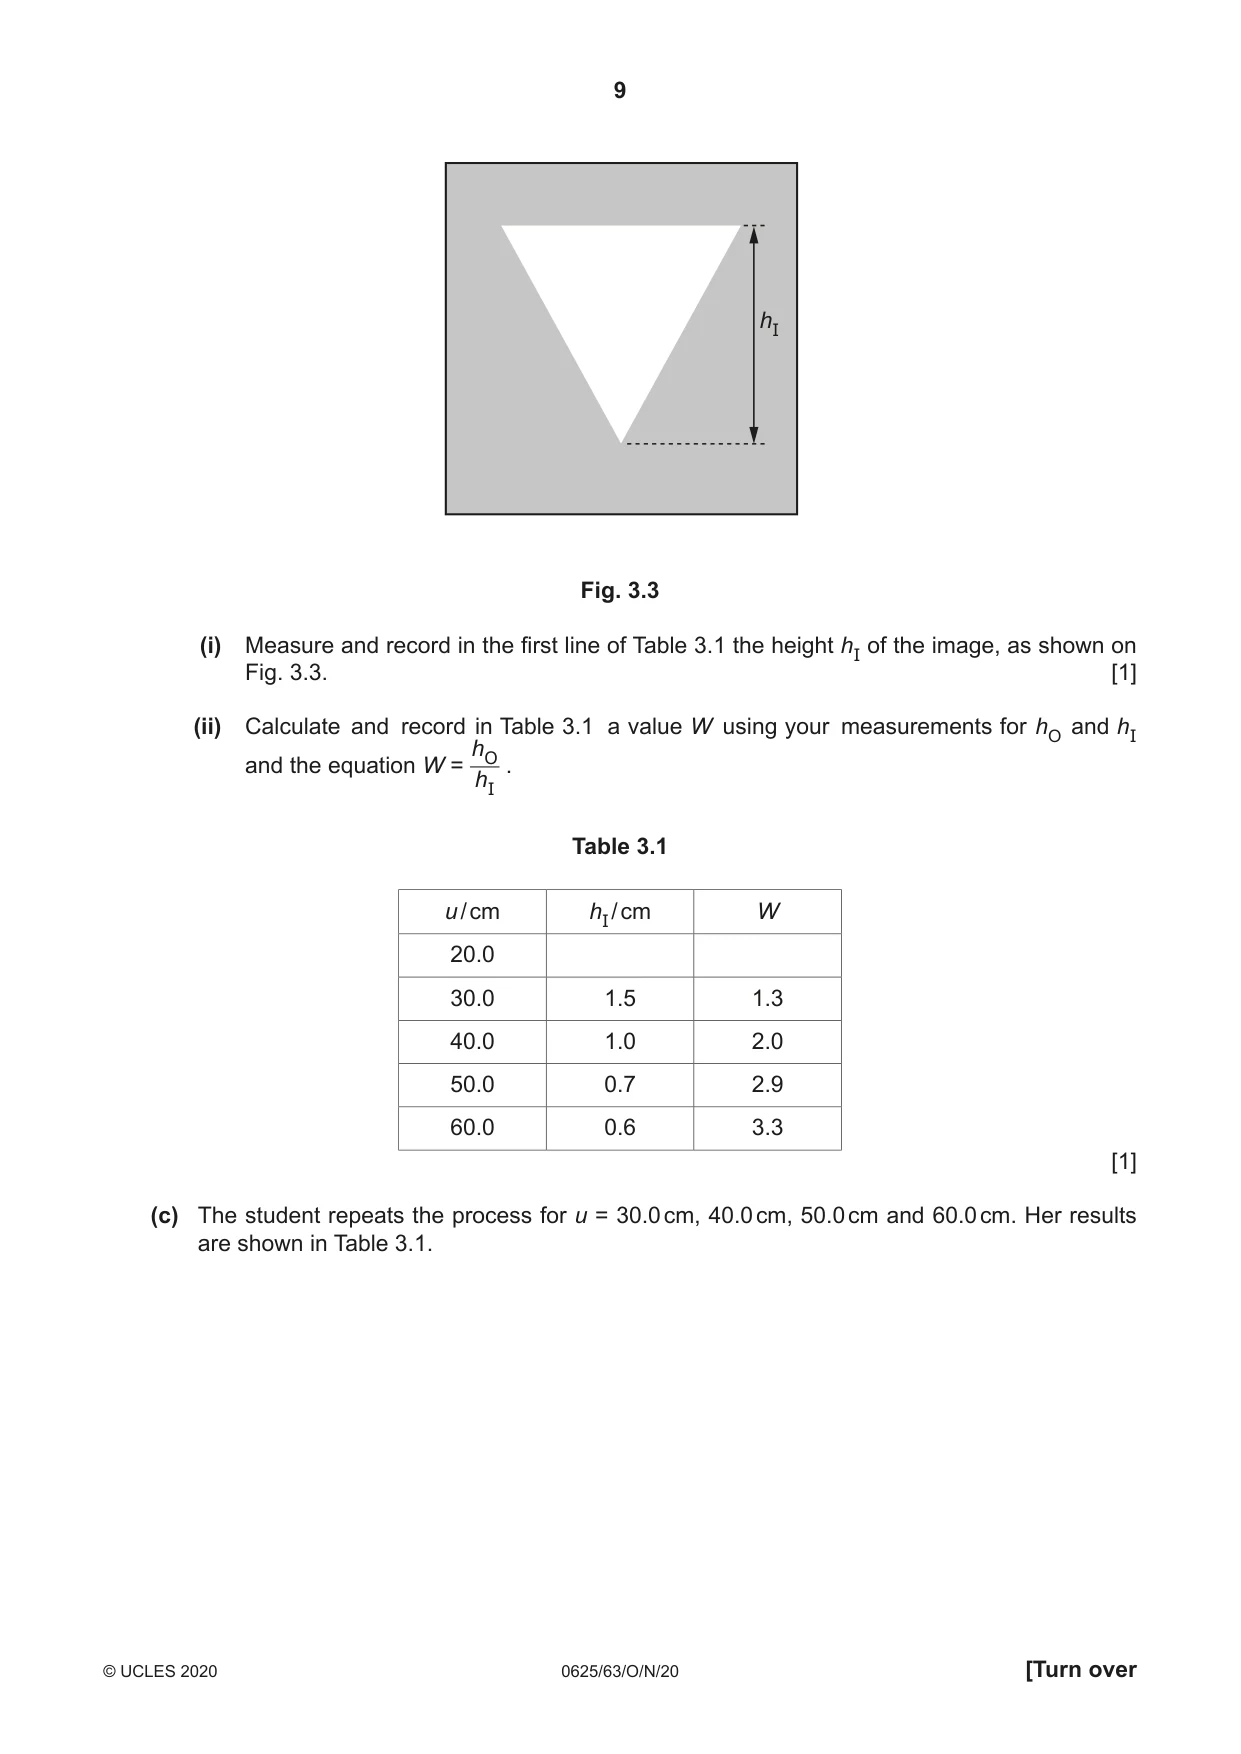
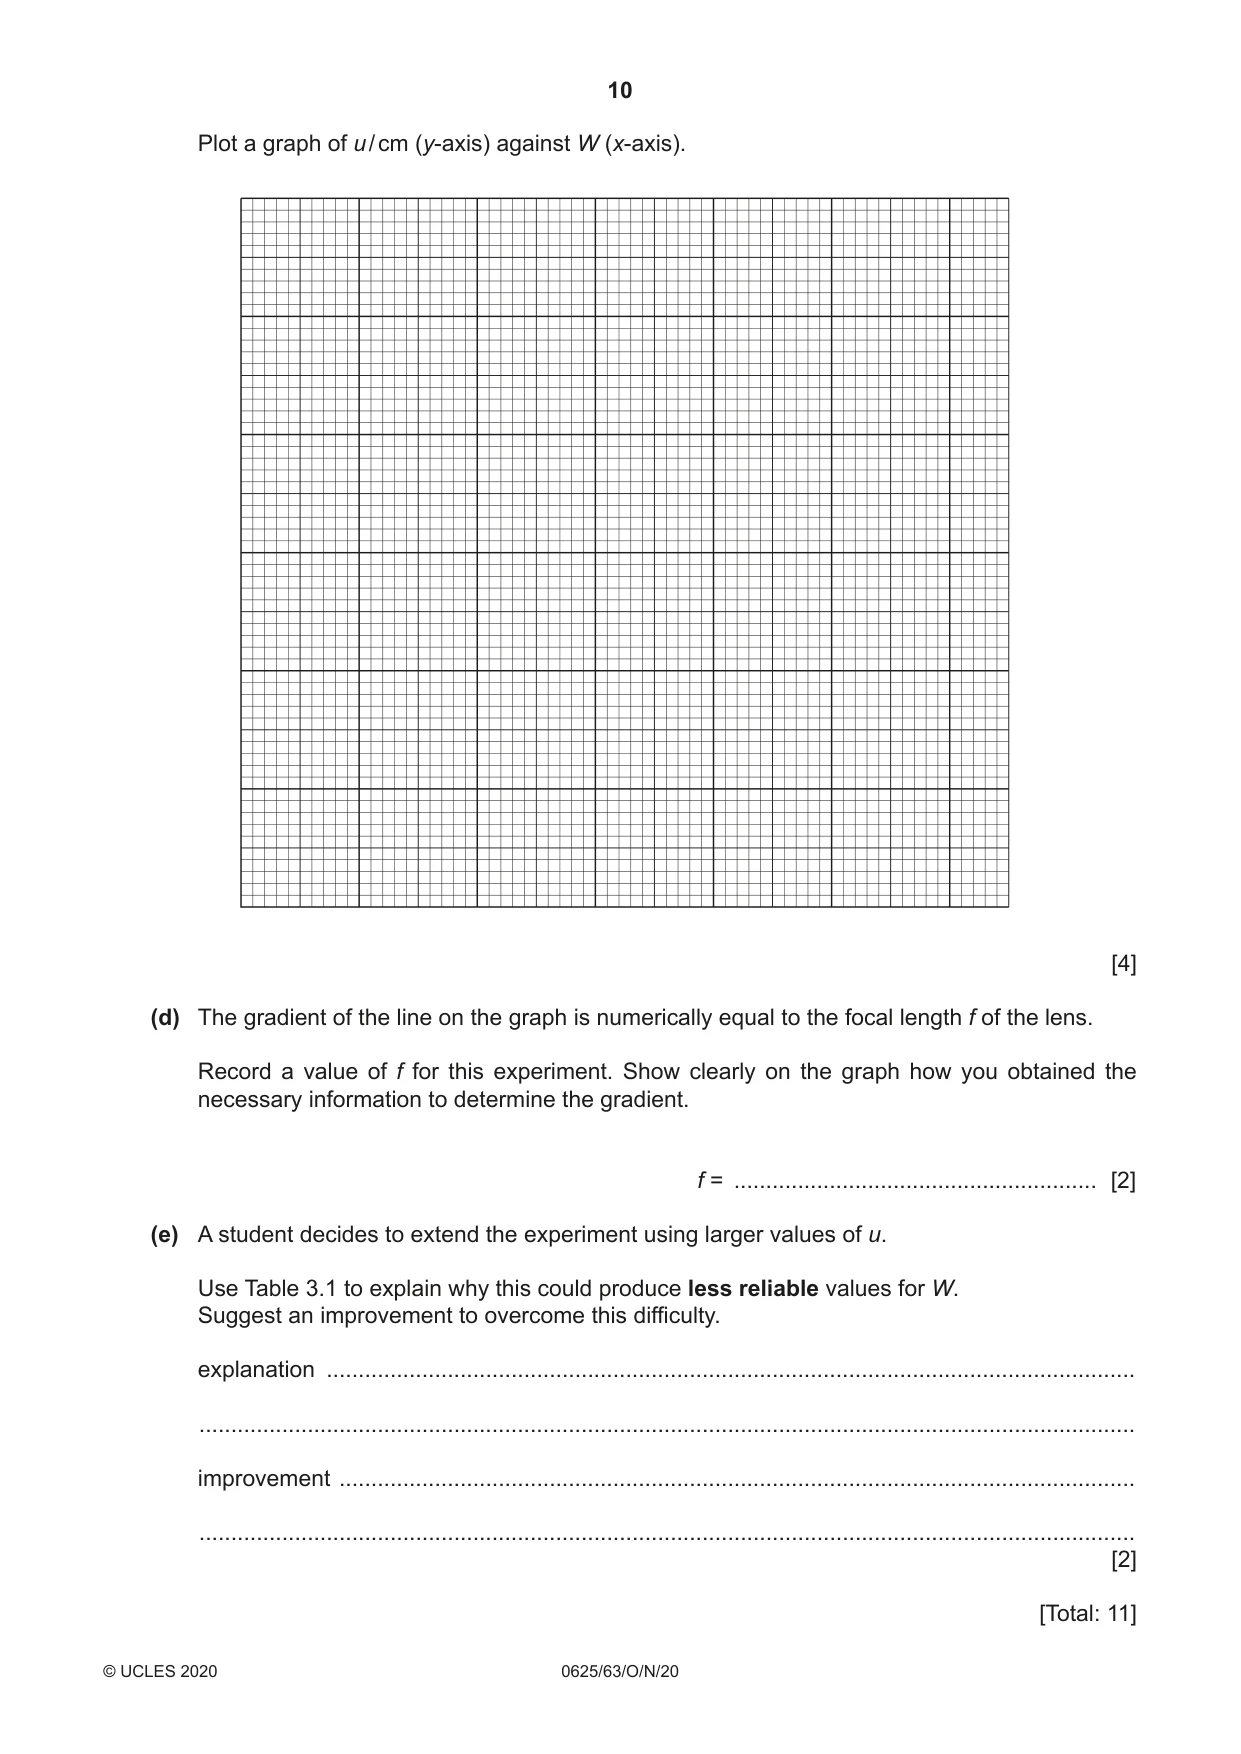
3 A student investigates the image produced by a converging lens. She uses the apparatus shown in Fig. 3.1. illuminated object screen u lens bench Fig. 3.1 (a) Fig. 3.2 shows the illuminated object, drawn to full size. hO Fig. 3.2 Measure and record the height hO of the illuminated object, as shown on Fig. 3.2. hO = .................................................... cm [1] (b) The distance u between the illuminated object and the lens is set to 20.0 cm. The screen is moved until a sharp image of the illuminated object is seen, as shown full size in Fig. 3.3. hI Fig. 3.3 (i) Measure and record in the first line of Table 3.1 the height hI of the image, as shown on Fig. 3.3. [1] (ii) Calculate and record in Table 3.1 a value W using your measurements for hO and hI hO and the equation W = . hI Table 3.1 u / cm hI / cm W 20.0 30.0 1.5 1.3 40.0 1.0 2.0 50.0 0.7 2.9 60.0 0.6 3.3 [1] (c) The student repeats the process for u = 30.0 cm, 40.0 cm, 50.0 cm and 60.0 cm. Her results are shown in Table 3.1. Plot a graph of u / cm (y-axis) against W (x-axis). [4] (d) The gradient of the line on the graph is numerically equal to the focal length f of the lens. Record a value of f for this experiment. Show clearly on the graph how you obtained the necessary information to determine the gradient. f = ......................................................... [2] (e) A student decides to extend the experiment using larger values of u. Use Table 3.1 to explain why this could produce less reliable values for W. Suggest an improvement to overcome this difficulty. explanation ............................................................................................................................... ................................................................................................................................................... improvement ............................................................................................................................. ................................................................................................................................................... [2] [Total: 11]
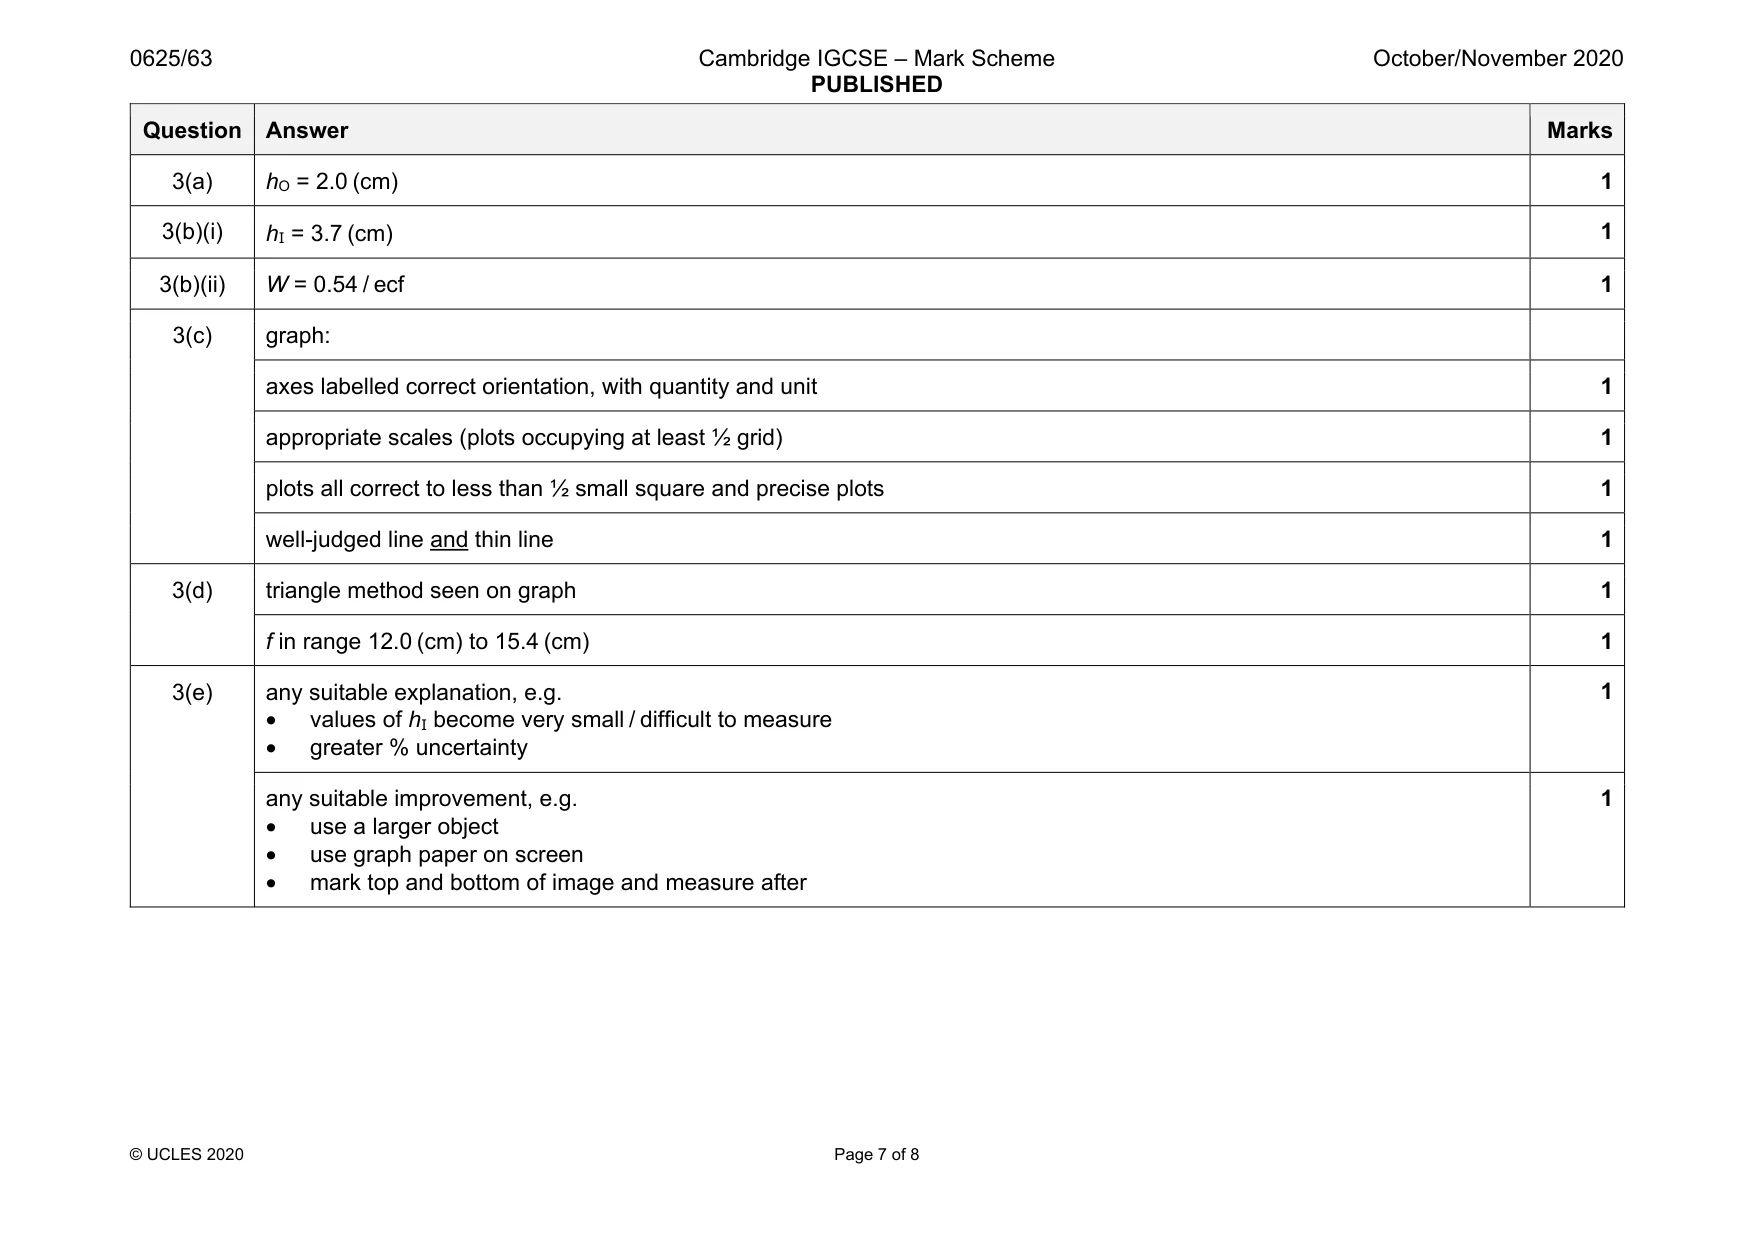
Mark scheme: 3(a) hO = 2.0 (cm) 1 3(b)(i) hI = 3.7 (cm) 1 3(b)(ii) W = 0.54 / ecf 1 3(c) graph: axes labelled correct orientation, with quantity and unit 1 appropriate scales (plots occupying at least ½ grid) 1 plots all correct to less than ½ small square and precise plots 1 well-judged line and thin line 1 3(d) triangle method seen on graph 1 f in range 12.0 (cm) to 15.4 (cm) 1 3(e) any suitable explanation, e.g. • values of hI become very small / difficult to measure • greater % uncertainty 1 any suitable improvement, e.g. • use a larger object • use graph paper on screen • mark top and bottom of image and measure after 1 Question Answer Marks
Q4 · A student investigates the factors that affect the average speed of a ball falling in…
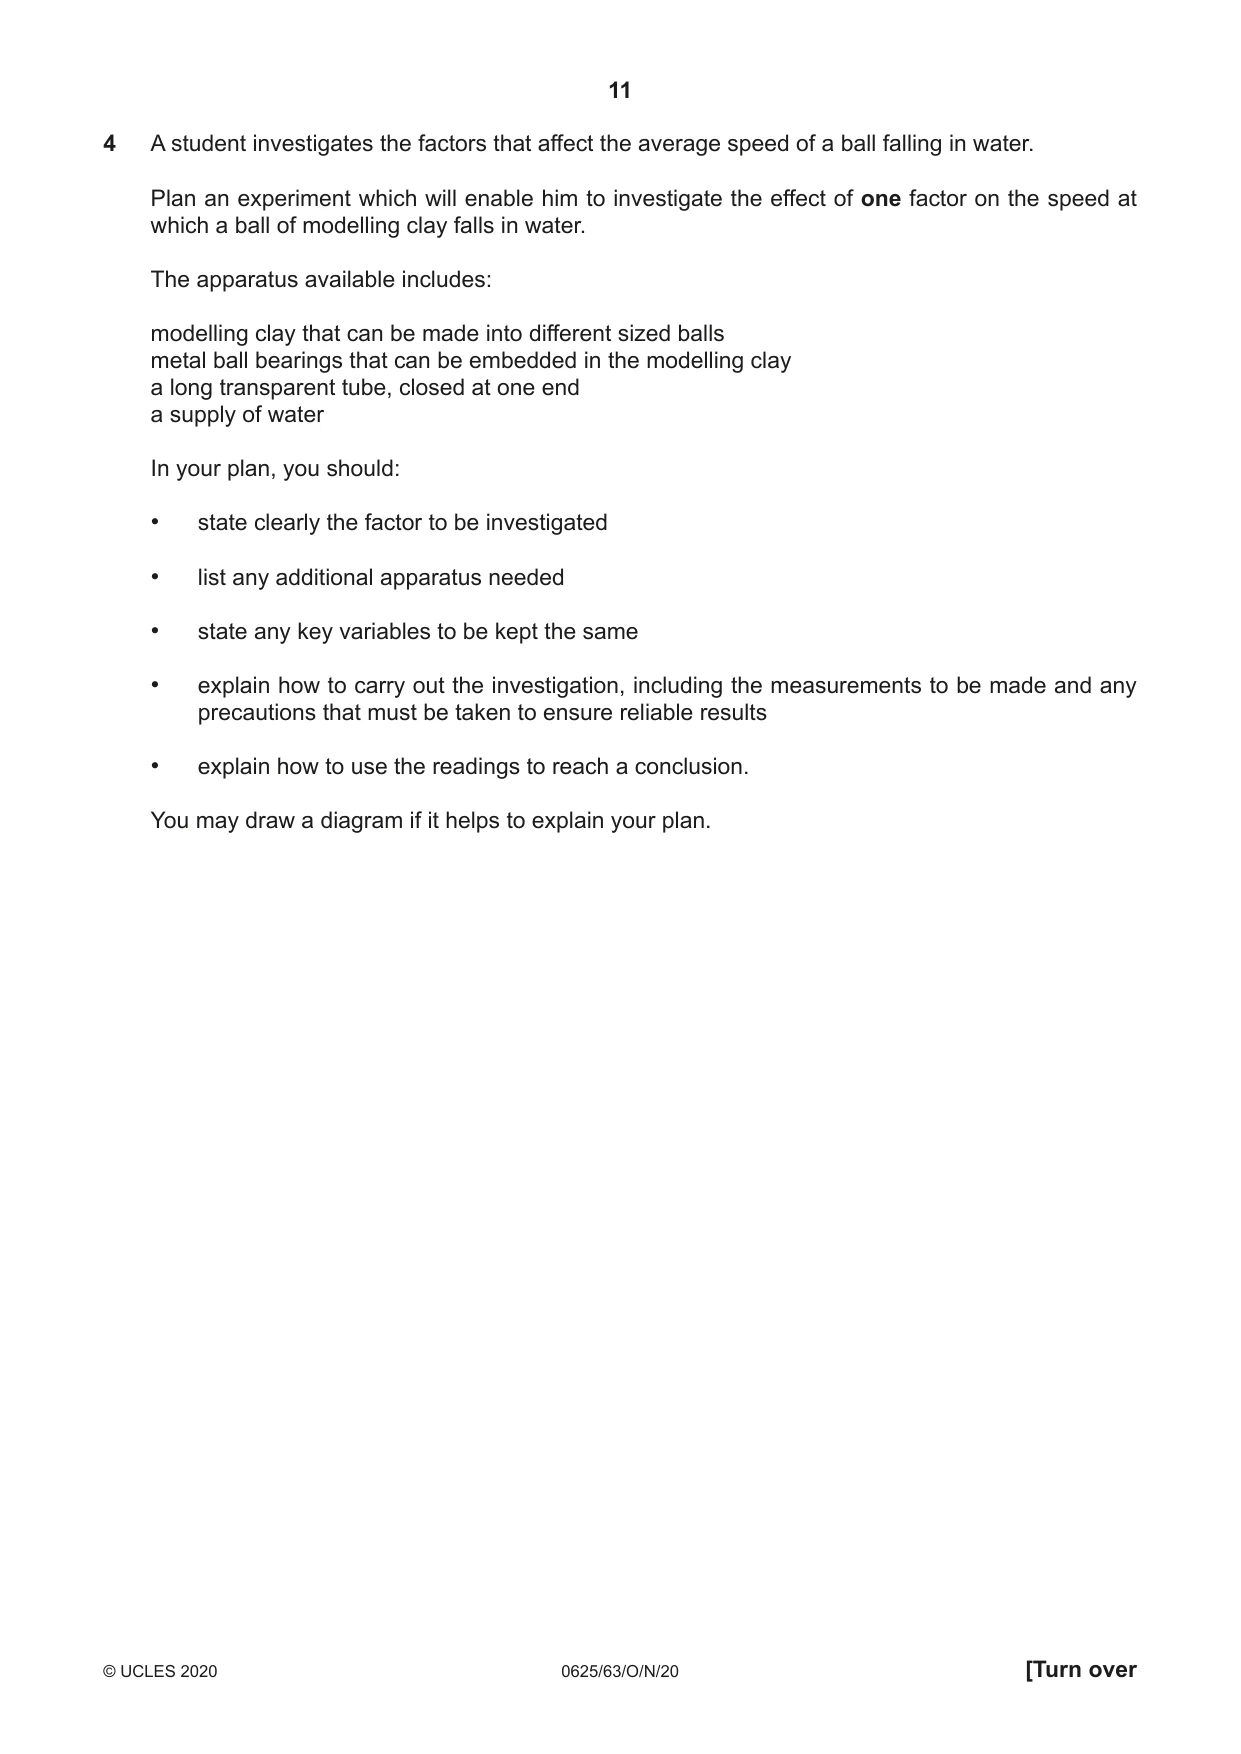
4 A student investigates the factors that affect the average speed of a ball falling in water. Plan an experiment which will enable him to investigate the effect of one factor on the speed at which a ball of modelling clay falls in water. The apparatus available includes: modelling clay that can be made into different sized balls metal ball bearings that can be embedded in the modelling clay a long transparent tube, closed at one end a supply of water In your plan, you should: • state clearly the factor to be investigated • list any additional apparatus needed • state any key variables to be kept the same • explain how to carry out the investigation, including the measurements to be made and any precautions that must be taken to ensure reliable results • explain how to use the readings to reach a conclusion. You may draw a diagram if it helps to explain your plan. .......................................................................................................................................................... .......................................................................................................................................................... .......................................................................................................................................................... .......................................................................................................................................................... .......................................................................................................................................................... .......................................................................................................................................................... .......................................................................................................................................................... .......................................................................................................................................................... .......................................................................................................................................................... .......................................................................................................................................................... .......................................................................................................................................................... .......................................................................................................................................................... .......................................................................................................................................................... .......................................................................................................................................................... .......................................................................................................................................................... .......................................................................................................................................................... .......................................................................................................................................................... .......................................................................................................................................................... .......................................................................................................................................................... .......................................................................................................................................................... .......................................................................................................................................................... .......................................................................................................................................................... .................................................................................................................................................... [7] [Total: 7]
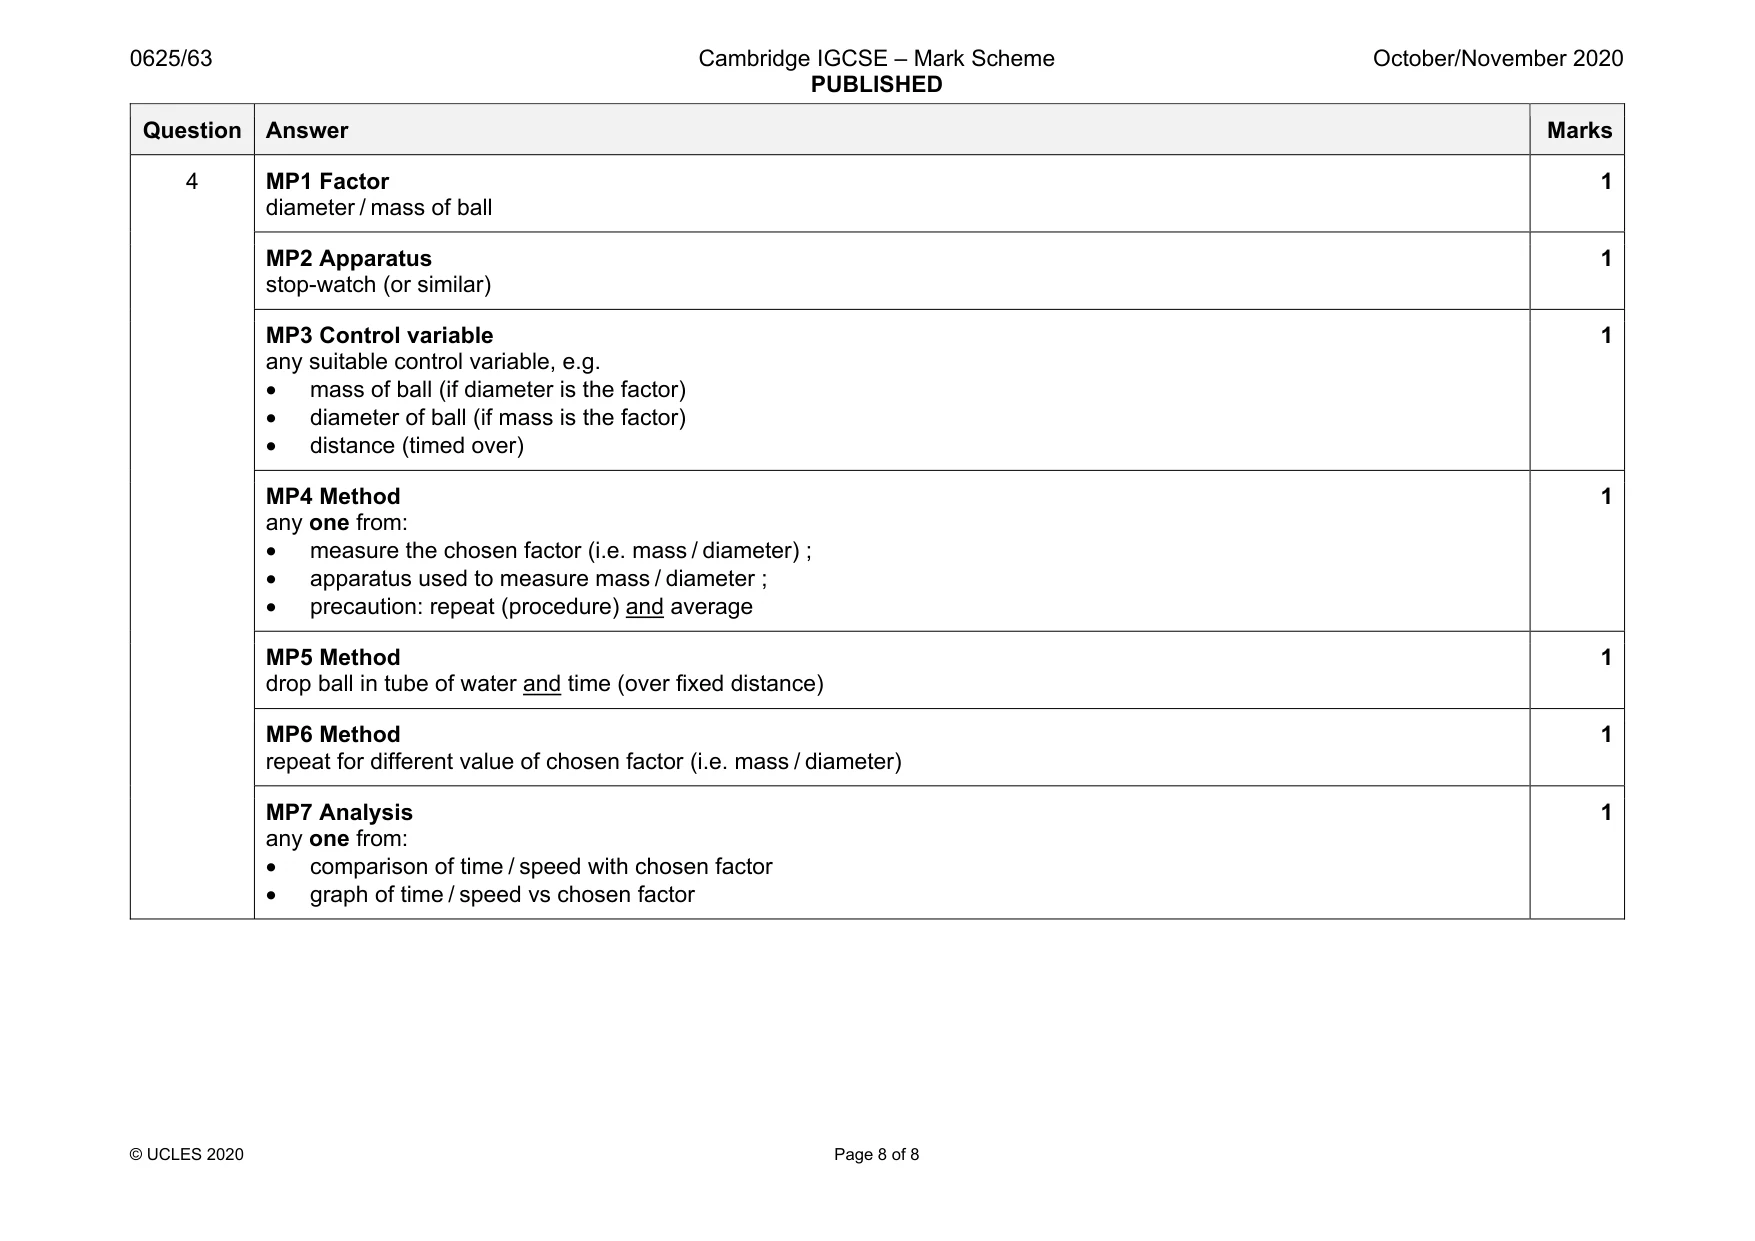
Mark scheme: 4 MP1 Factor diameter / mass of ball 1 MP2 Apparatus stop-watch (or similar) 1 MP3 Control variable any suitable control variable, e.g. • mass of ball (if diameter is the factor) • diameter of ball (if mass is the factor) • distance (timed over) 1 MP4 Method any one from: • measure the chosen factor (i.e. mass / diameter) ; • apparatus used to measure mass / diameter ; • precaution: repeat (procedure) and average 1 MP5 Method drop ball in tube of water and time (over fixed distance) 1 MP6 Method repeat for different value of chosen factor (i.e. mass / diameter) 1 MP7 Analysis any one from: • comparison of time / speed with chosen factor • graph of time / speed vs chosen factor 1
What was in this paper
The subtopics covered by these 4 questions, and how many questions each got. Open one in a new tab to see every Cambridge question on it.
What you needed in this session
Cambridge’s own grade thresholds for 2020 Oct/Nov, Paper 6 · Variant 3. A higher threshold means an easier paper — the bar moves with how the cohort did.