Cambridge IGCSE Physics 0625 — 2016 May/June Paper 5 · Variant 1
0625/51/M/J/16 · 4 questions · 40 marks · ≈45 min
The question paper and its mark scheme, free to read here and free to download. This is Cambridge’s own paper, exactly as it was sat.
Question paper12 pages


Mark scheme6 pages
Answers below. Sit the paper first if you are practising.
Questions as text
Q1 · In this experiment, you will determine the weight of a metre rule using a balancing method
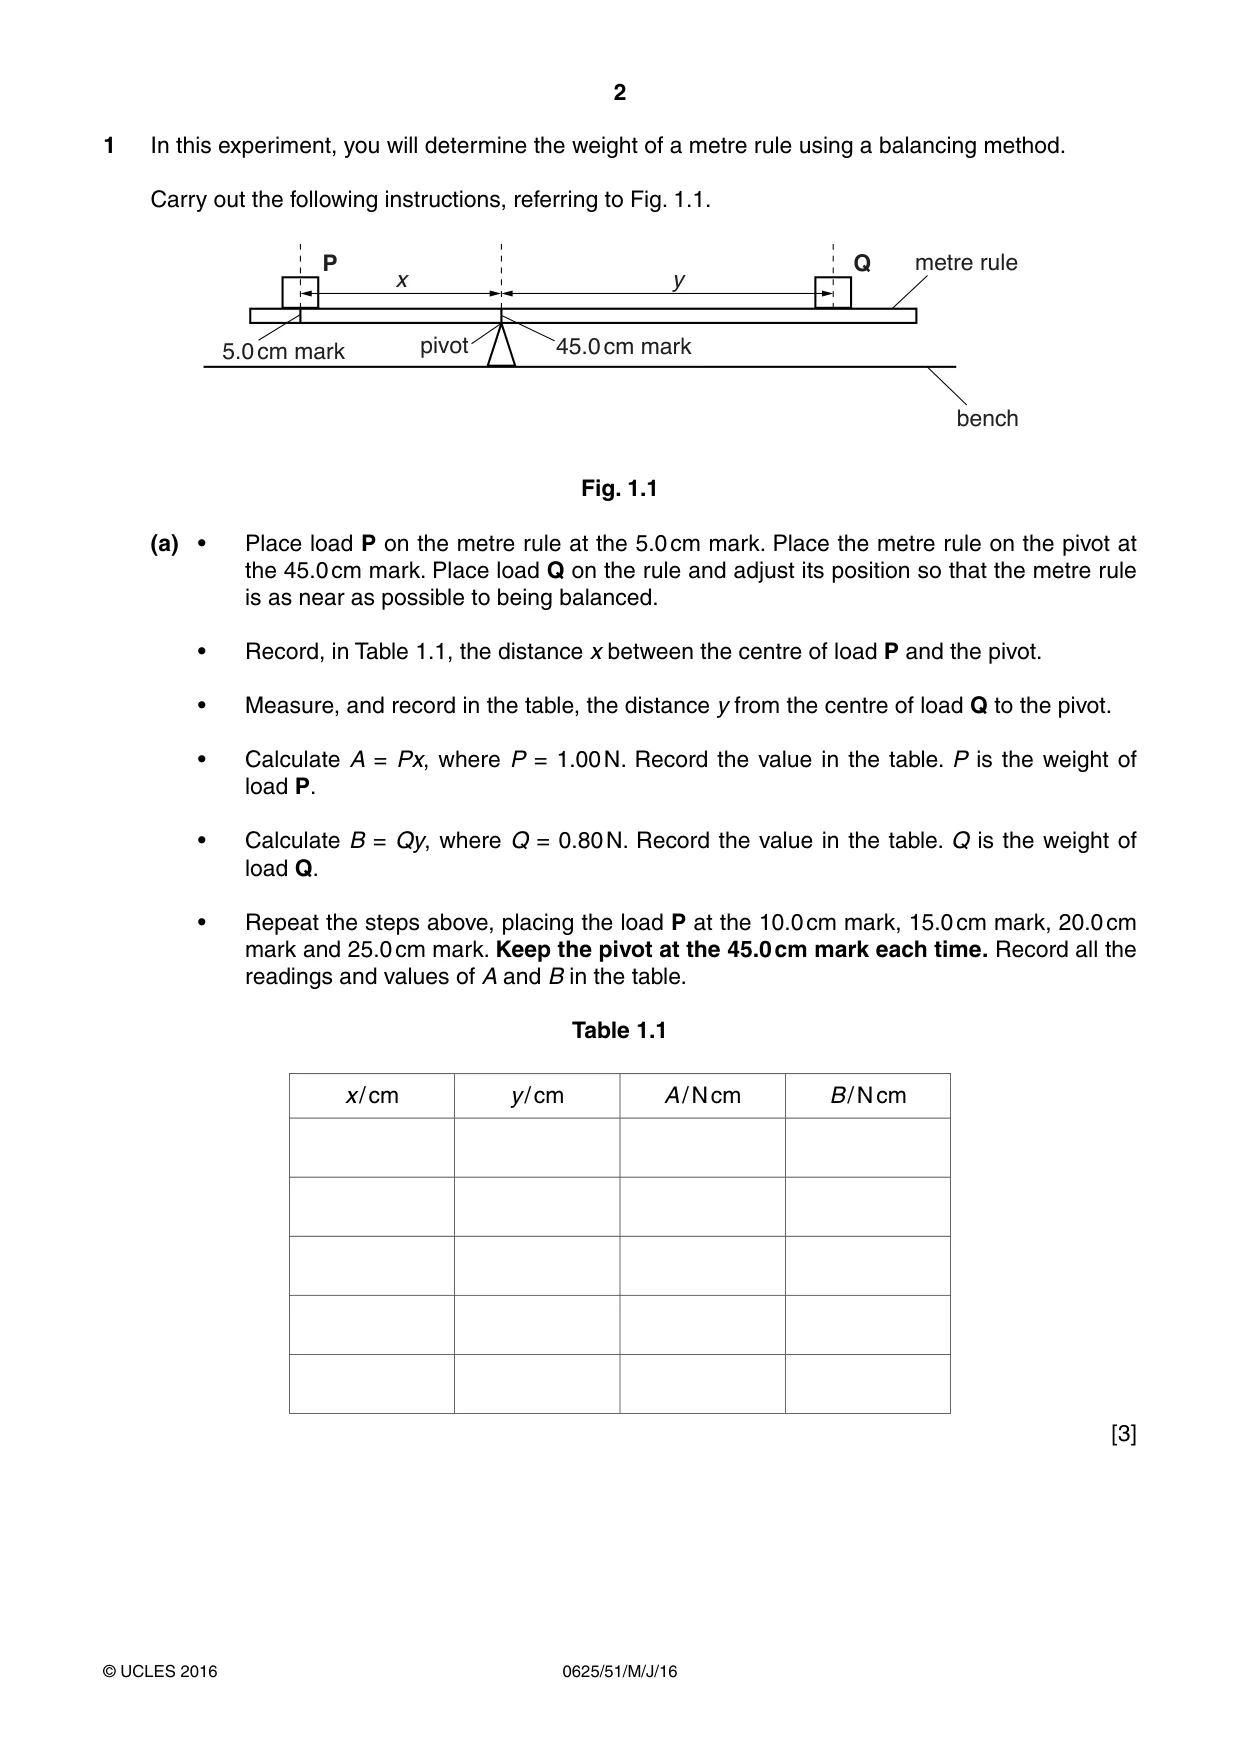
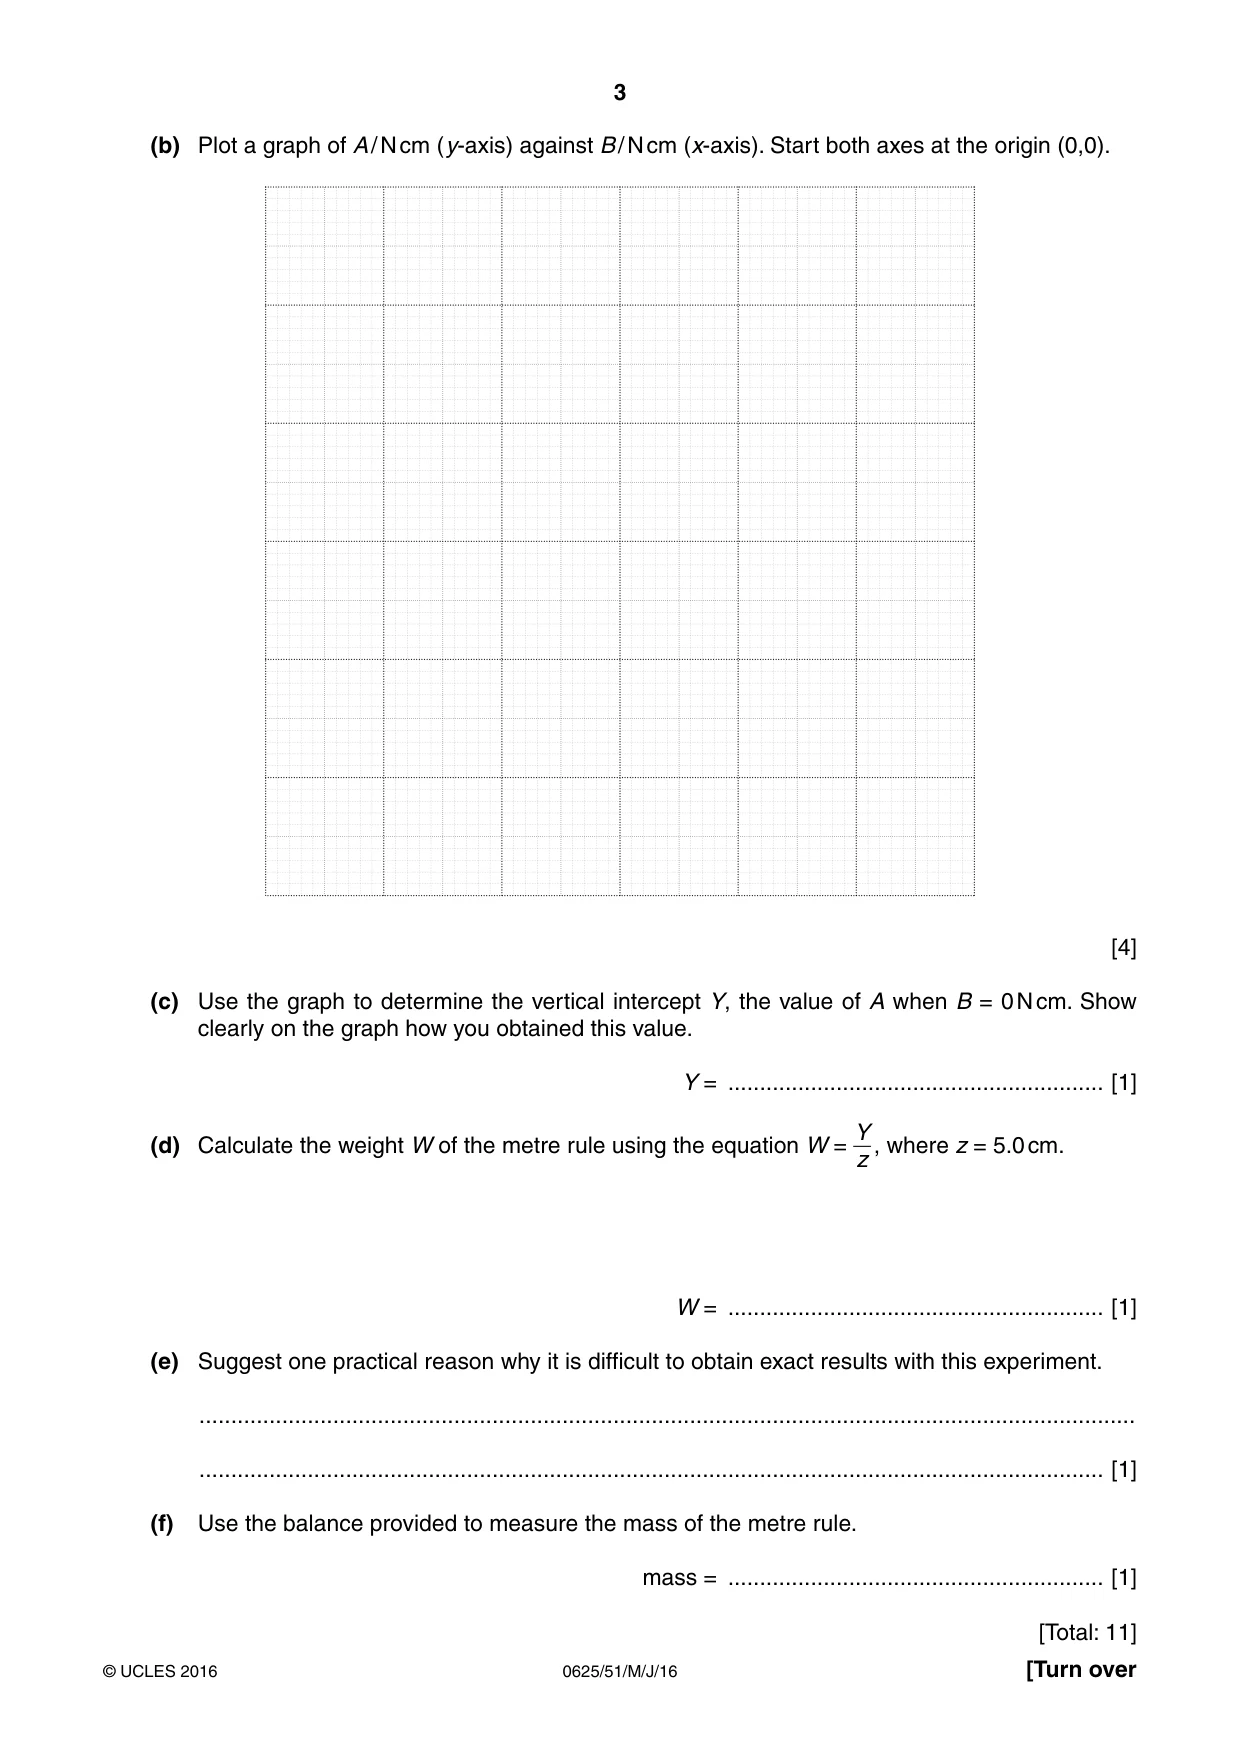
1 In this experiment, you will determine the weight of a metre rule using a balancing method. Carry out the following instructions, referring to Fig. 1.1. P Q metre rule x y 5.0 cm mark pivot 45.0 cm mark bench Fig. 1.1 (a) • Place load P on the metre rule at the 5.0 cm mark. Place the metre rule on the pivot at the 45.0 cm mark. Place load Q on the rule and adjust its position so that the metre rule is as near as possible to being balanced. • Record, in Table 1.1, the distance x between the centre of load P and the pivot. • Measure, and record in the table, the distance y from the centre of load Q to the pivot. • Calculate A = Px, where P = 1.00 N. Record the value in the table. P is the weight of load P. • Calculate B = Qy, where Q = 0.80 N. Record the value in the table. Q is the weight of load Q. • Repeat the steps above, placing the load P at the 10.0 cm mark, 15.0 cm mark, 20.0 cm mark and 25.0 cm mark. Keep the pivot at the 45.0 cm mark each time. Record all the readings and values of A and B in the table. Table 1.1 x / cm y / cm A / N cm B / N cm [3] (b) Plot a graph of A / N cm (y-axis) against B / N cm (x-axis). Start both axes at the origin (0,0). [4] (c) Use the graph to determine the vertical intercept Y, the value of A when B = 0 N cm. Show clearly on the graph how you obtained this value. Y = ........................................................... [1] Y (d) Calculate the weight W of the metre rule using the equation W = , where z = 5.0 cm. z W = ........................................................... [1] (e) Suggest one practical reason why it is difficult to obtain exact results with this experiment. ................................................................................................................................................... .............................................................................................................................................. [1] (f) Use the balance provided to measure the mass of the metre rule. mass = ........................................................... [1] [Total: 11]
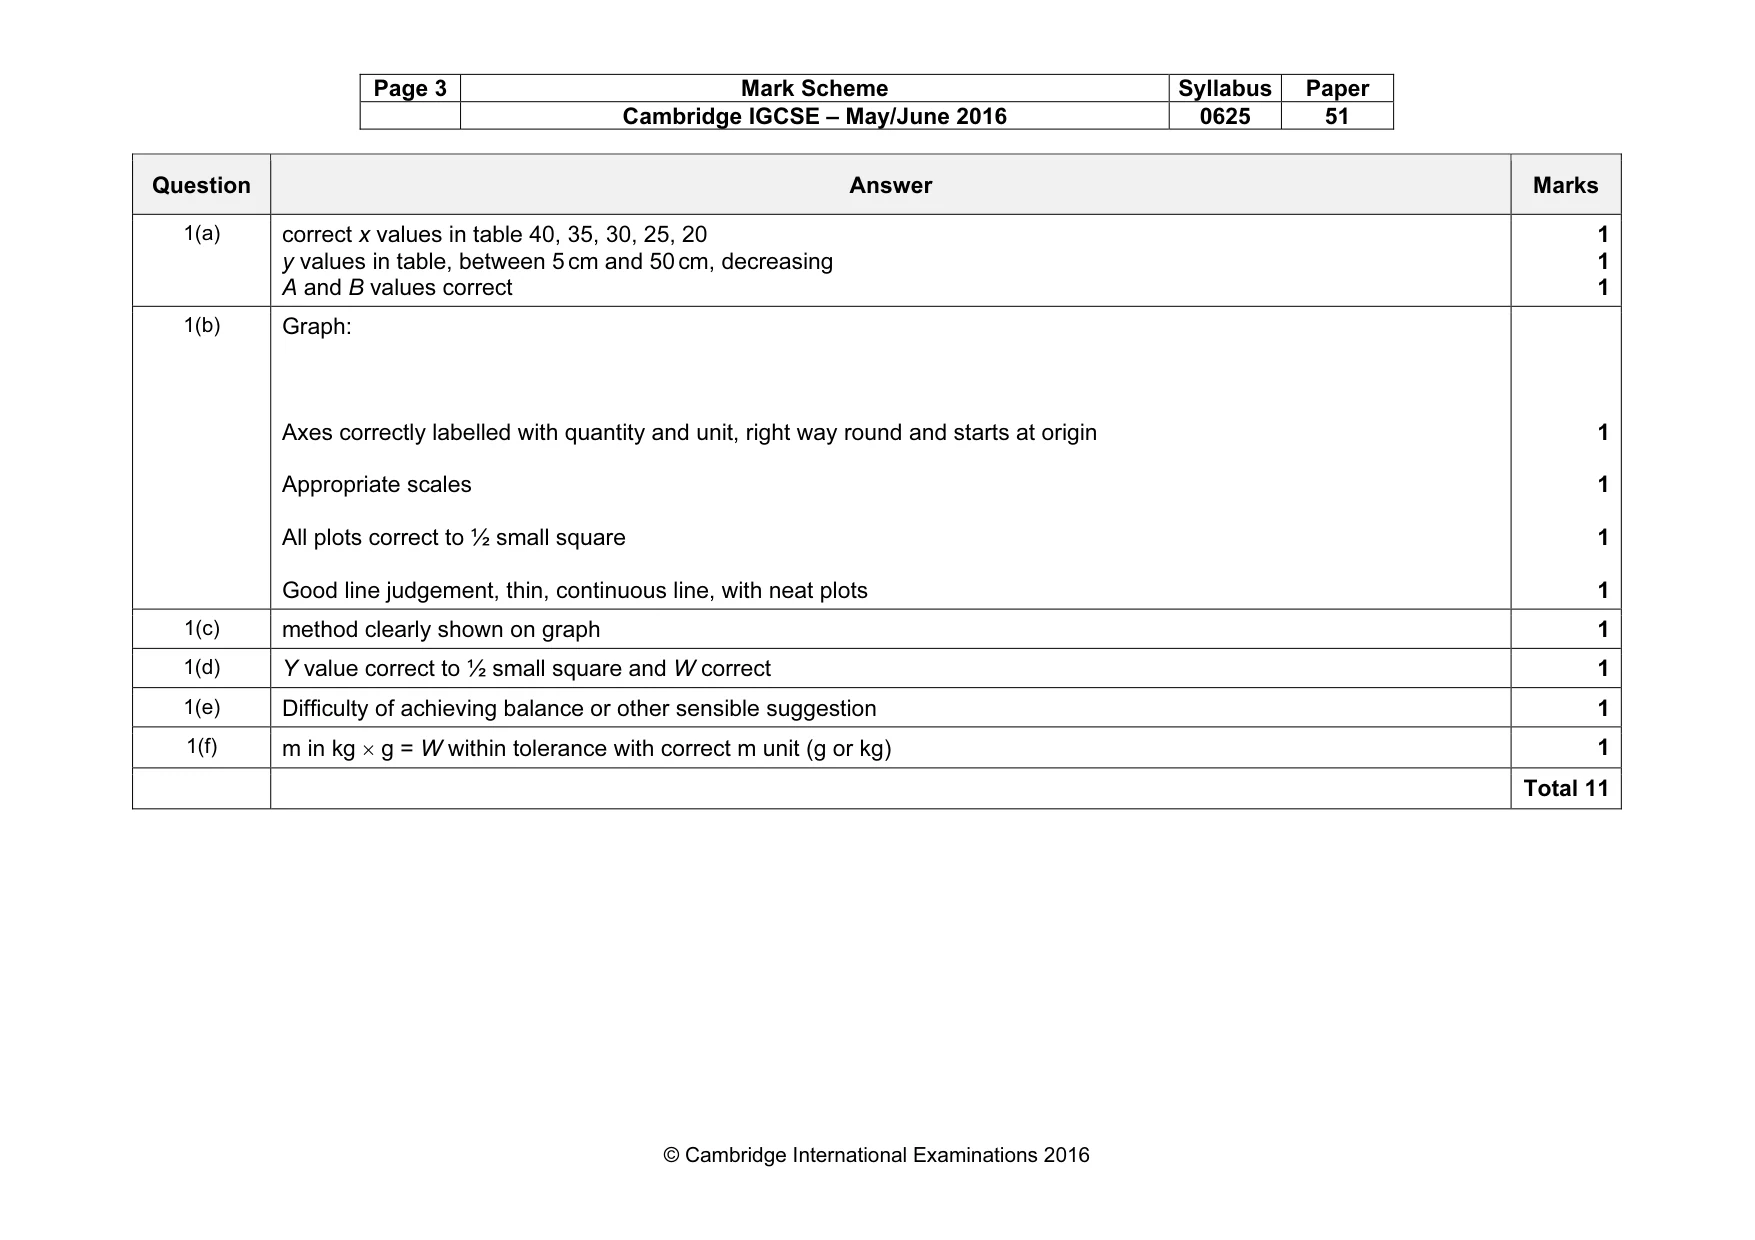
Mark scheme: 1(a) y values in table, between 5 cm and 50 cm, decreasing A and B values correct 1 1 1 1(b) Graph: Axes correctly labelled with quantity and unit, right way round and starts at origin Appropriate scales All plots correct to ½ small square Good line judgement, thin, continuous line, with neat plots 1 1 1 1 1(c) method clearly shown on graph 1 1(d) Y value correct to ½ small square and W correct 1 1(e) Difficulty of achieving balance or other sensible suggestion 1 1(f) m in kg × g = W within tolerance with correct m unit (g or kg) 1 Total 11
Q2 · In this experiment, you will investigate the resistance of a lamp filament
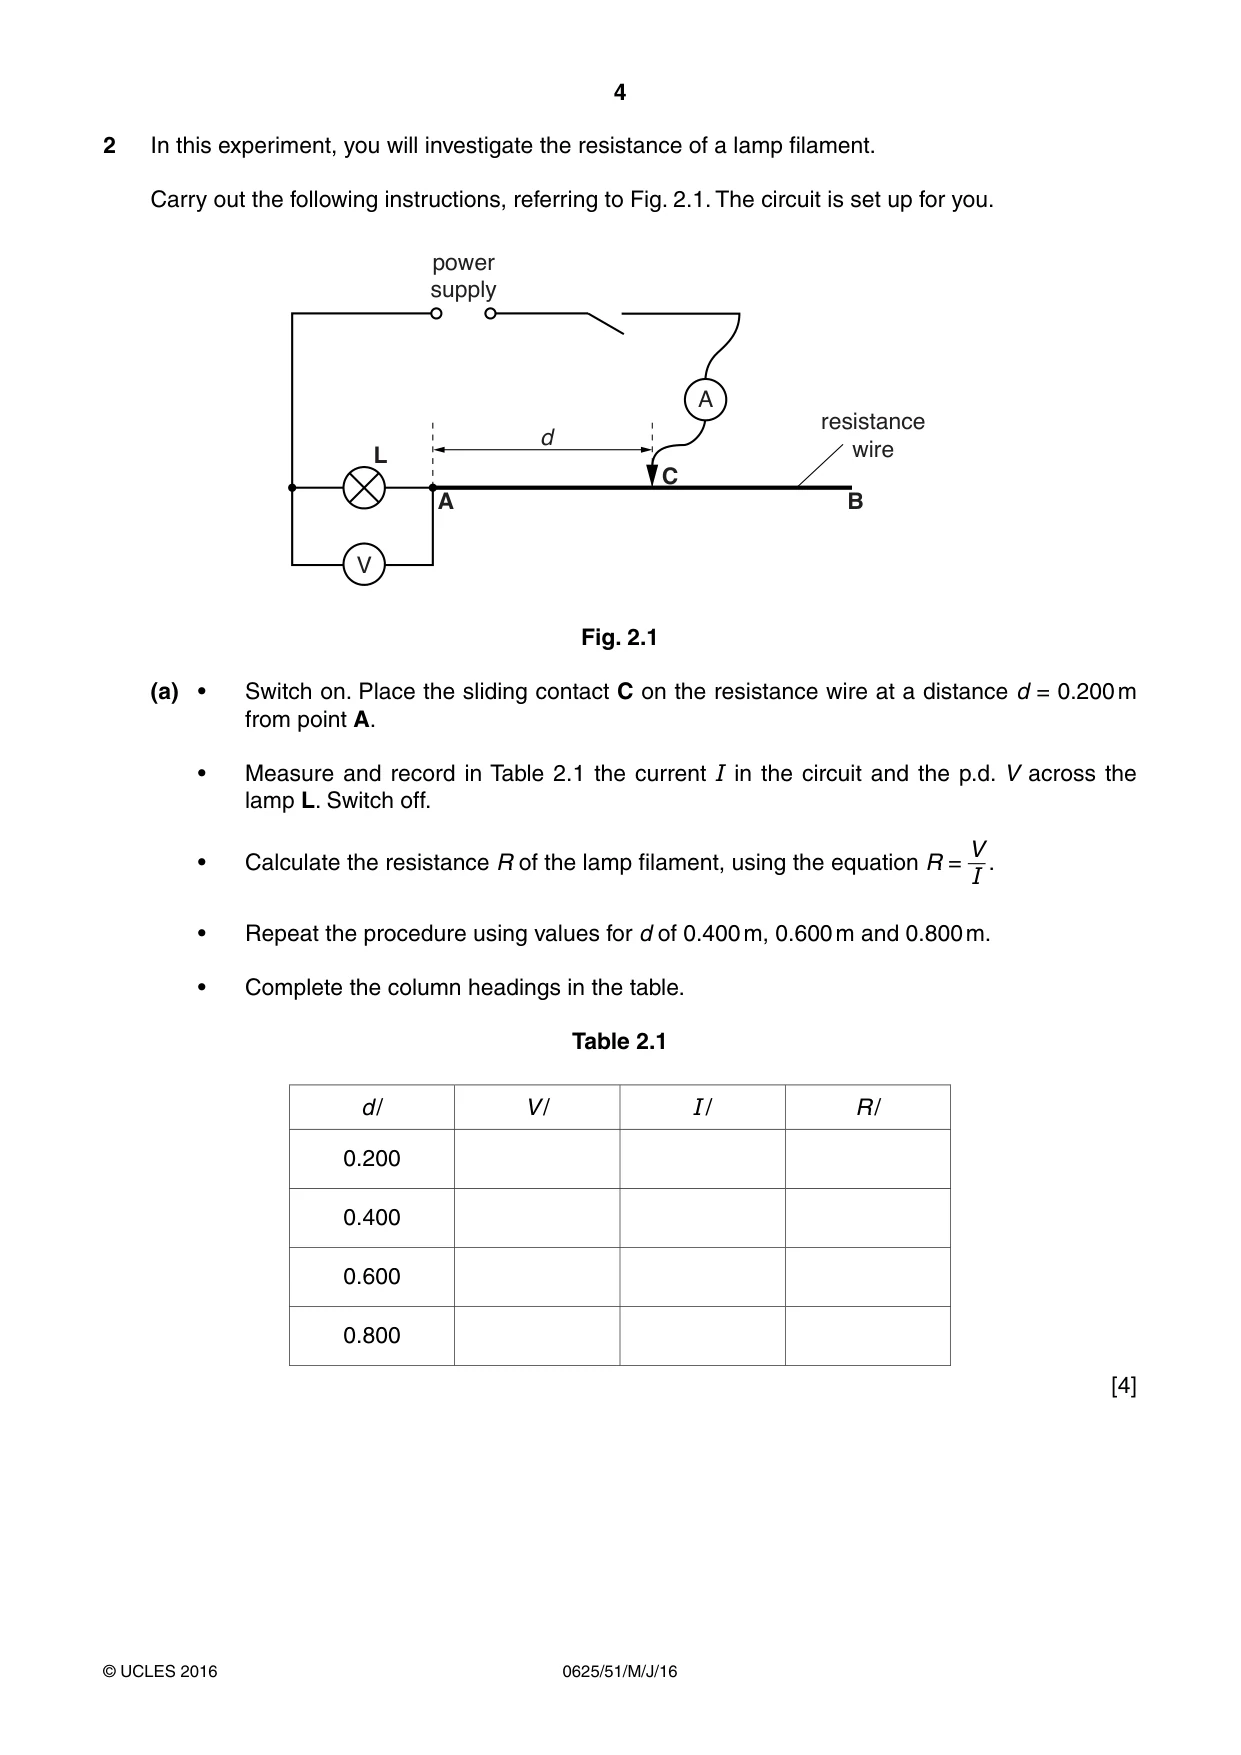
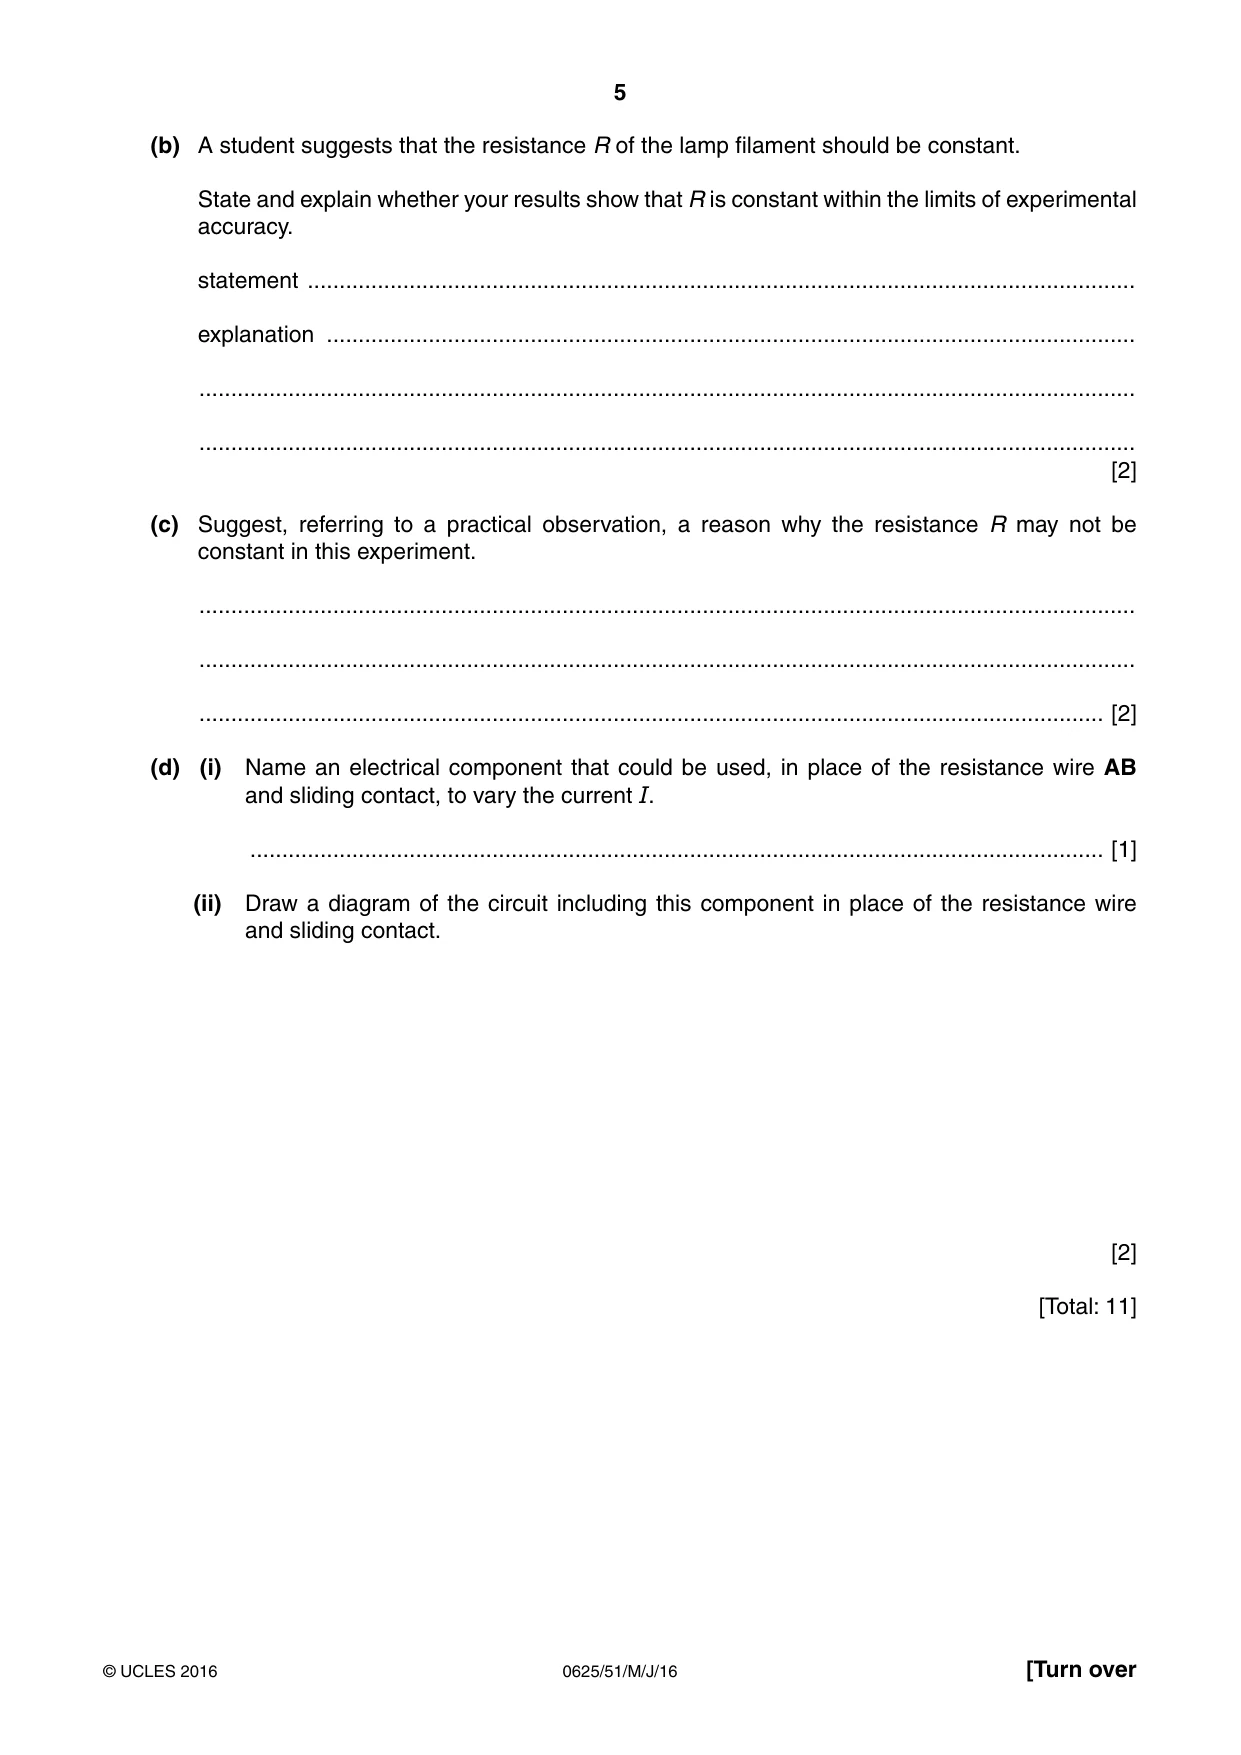
2 In this experiment, you will investigate the resistance of a lamp filament. Carry out the following instructions, referring to Fig. 2.1. The circuit is set up for you. power supply A resistance d wire L C A B V Fig. 2.1 (a) • Switch on. Place the sliding contact C on the resistance wire at a distance d = 0.200 m from point A. • Measure and record in Table 2.1 the current I in the circuit and the p.d. V across the lamp L. Switch off. V • Calculate the resistance R of the lamp filament, using the equation R = . I • Repeat the procedure using values for d of 0.400 m, 0.600 m and 0.800 m. • Complete the column headings in the table. Table 2.1 d / V / I / R / 0.200 0.400 0.600 0.800 [4] (b) A student suggests that the resistance R of the lamp filament should be constant. State and explain whether your results show that R is constant within the limits of experimental accuracy. statement .................................................................................................................................. explanation ............................................................................................................................... ................................................................................................................................................... ................................................................................................................................................... [2] (c) Suggest, referring to a practical observation, a reason why the resistance R may not be constant in this experiment. ................................................................................................................................................... ................................................................................................................................................... .............................................................................................................................................. [2] (d) (i) Name an electrical component that could be used, in place of the resistance wire AB and sliding contact, to vary the current I. ...................................................................................................................................... [1] (ii) Draw a diagram of the circuit including this component in place of the resistance wire and sliding contact. [2] [Total: 11]
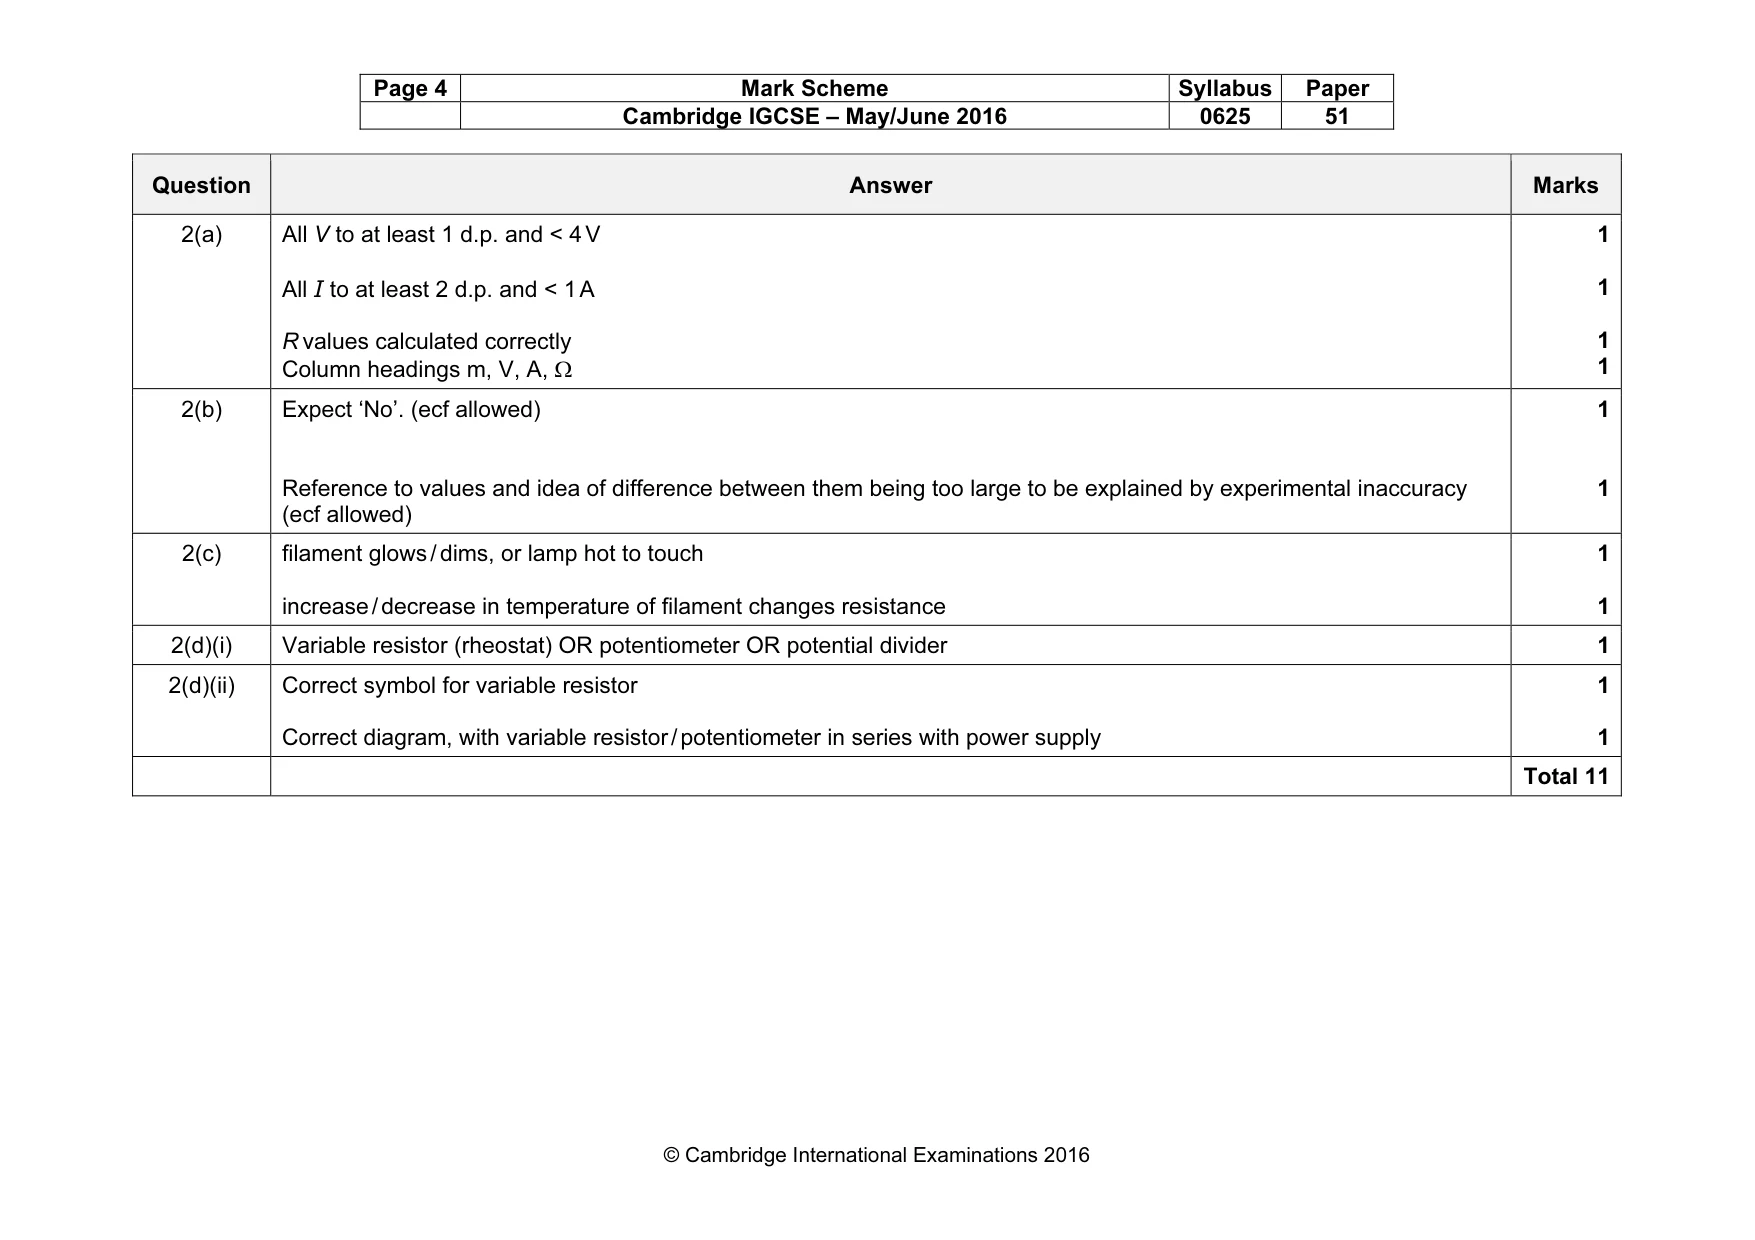
Mark scheme: 2(a) All I to at least 2 d.p. and < 1 A R values calculated correctly Column headings m, V, A, Ω 1 1 1 1 2(b) Expect ‘No’. (ecf allowed) Reference to values and idea of difference between them being too large to be explained by experimental inaccuracy (ecf allowed) 1 1 2(c) filament glows / dims, or lamp hot to touch increase / decrease in temperature of filament changes resistance 1 1 2(d)(i) Variable resistor (rheostat) OR potentiometer OR potential divider 1 2(d)(ii) Correct symbol for variable resistor Correct diagram, with variable resistor / potentiometer in series with power supply 1 1 Total 11
Q3 · In this experiment, you will determine the focal length of a lens by two different methods
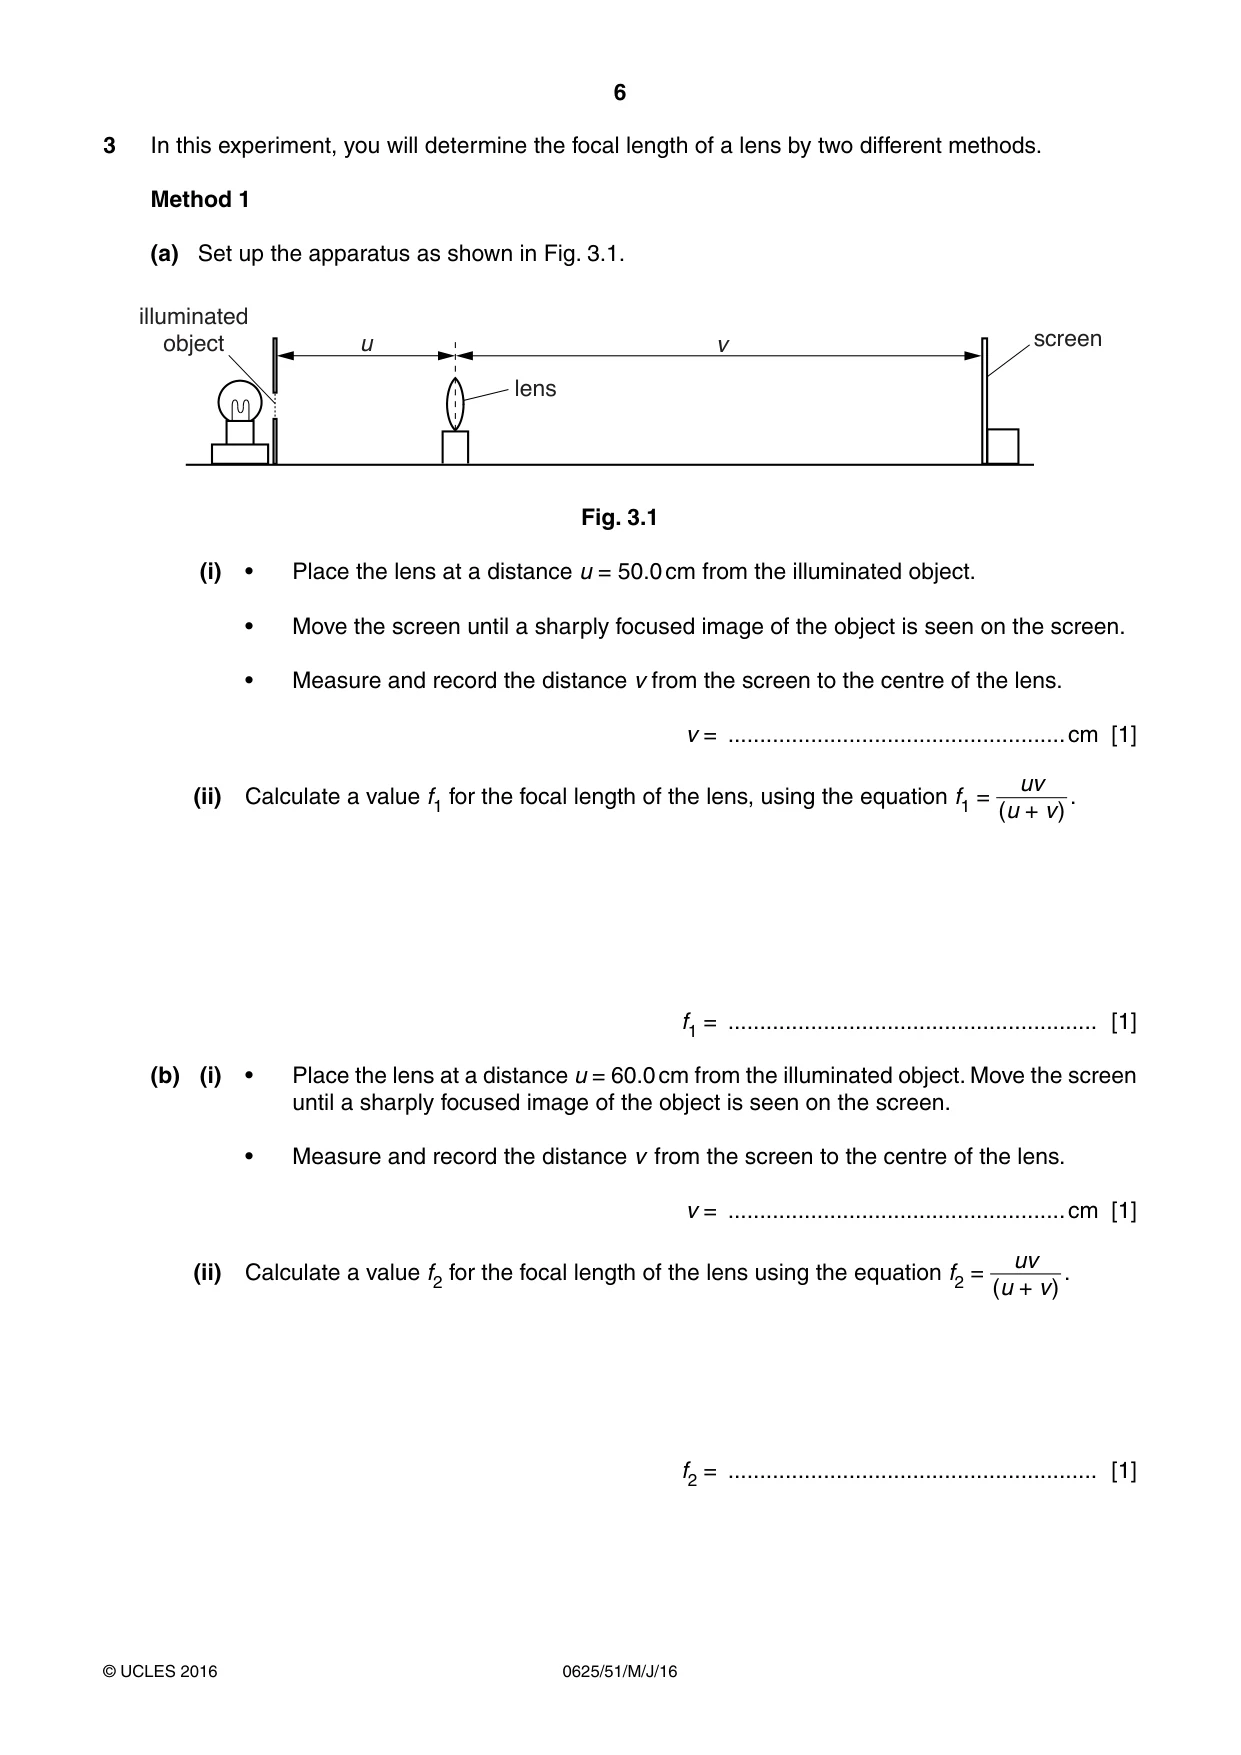
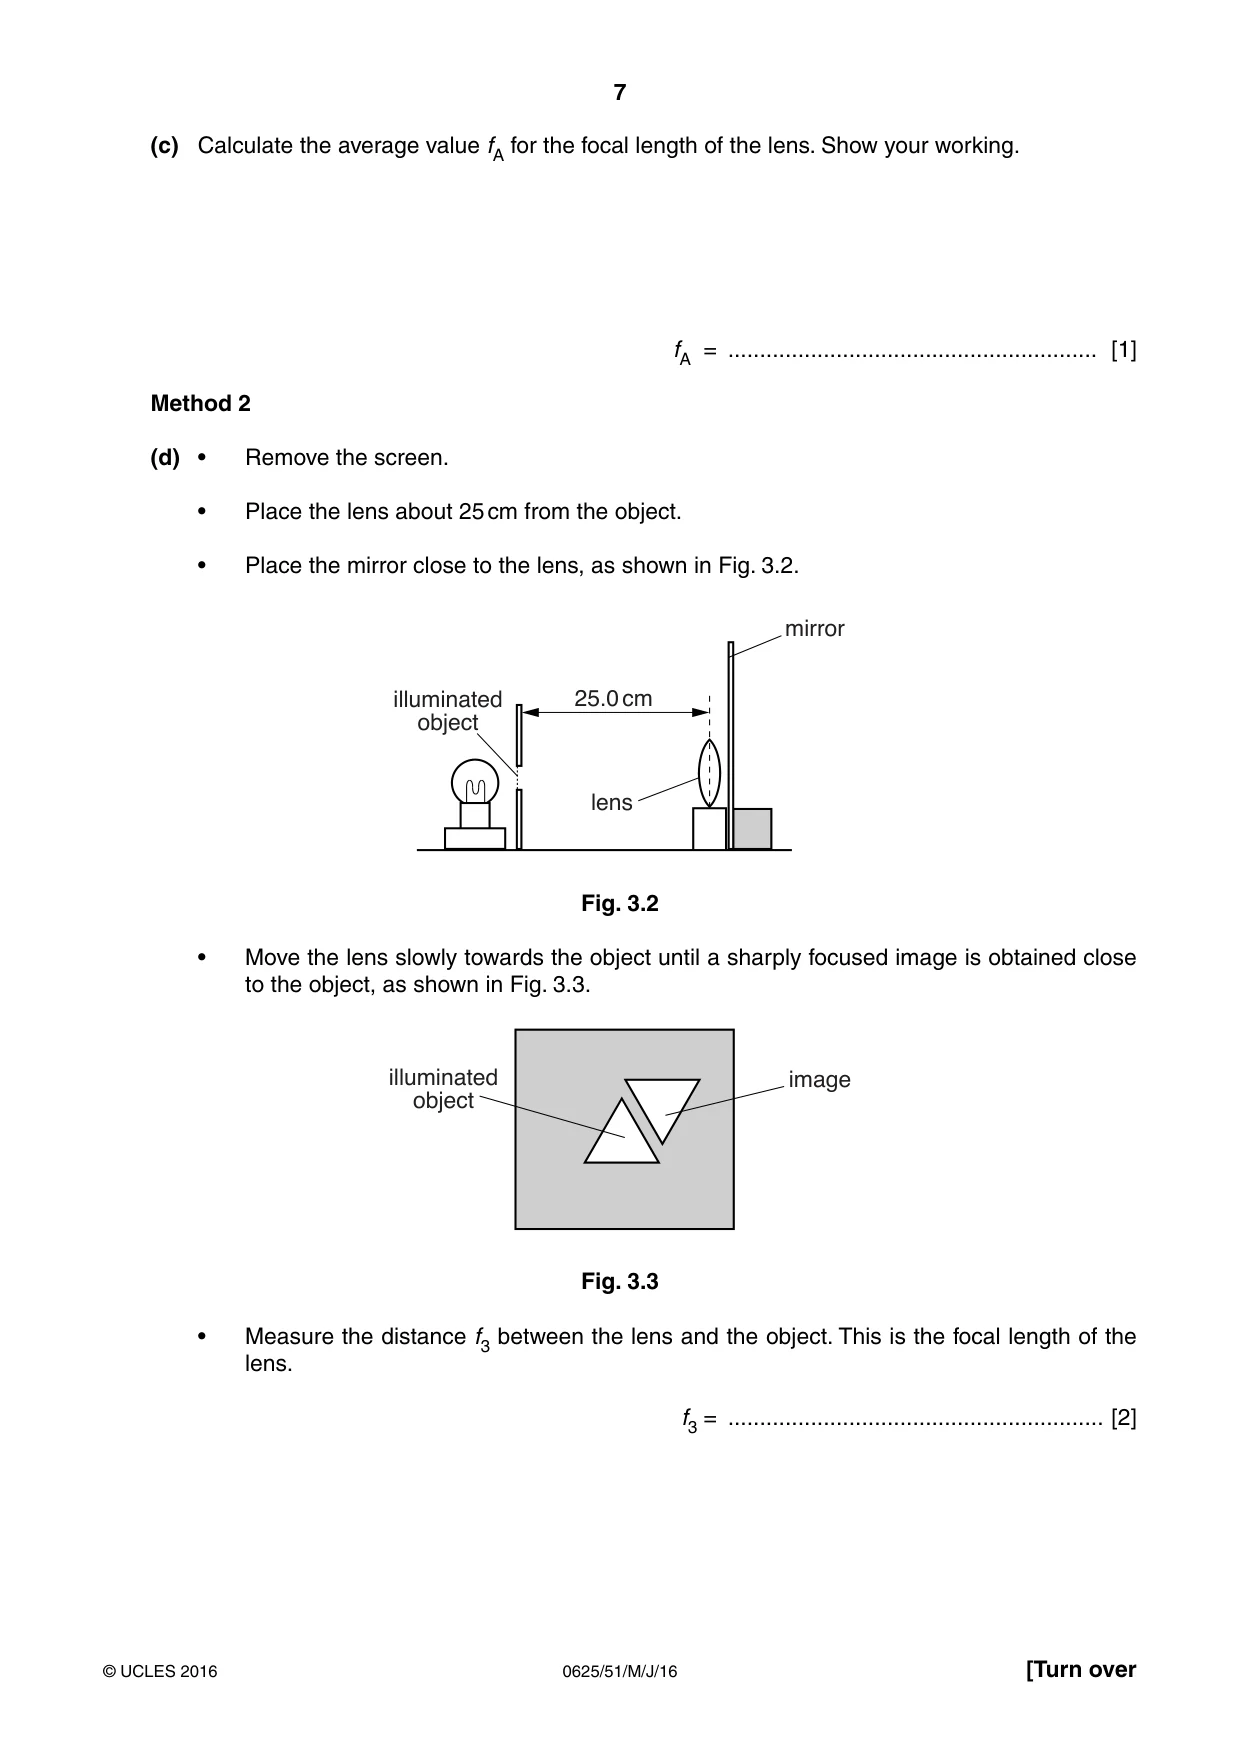
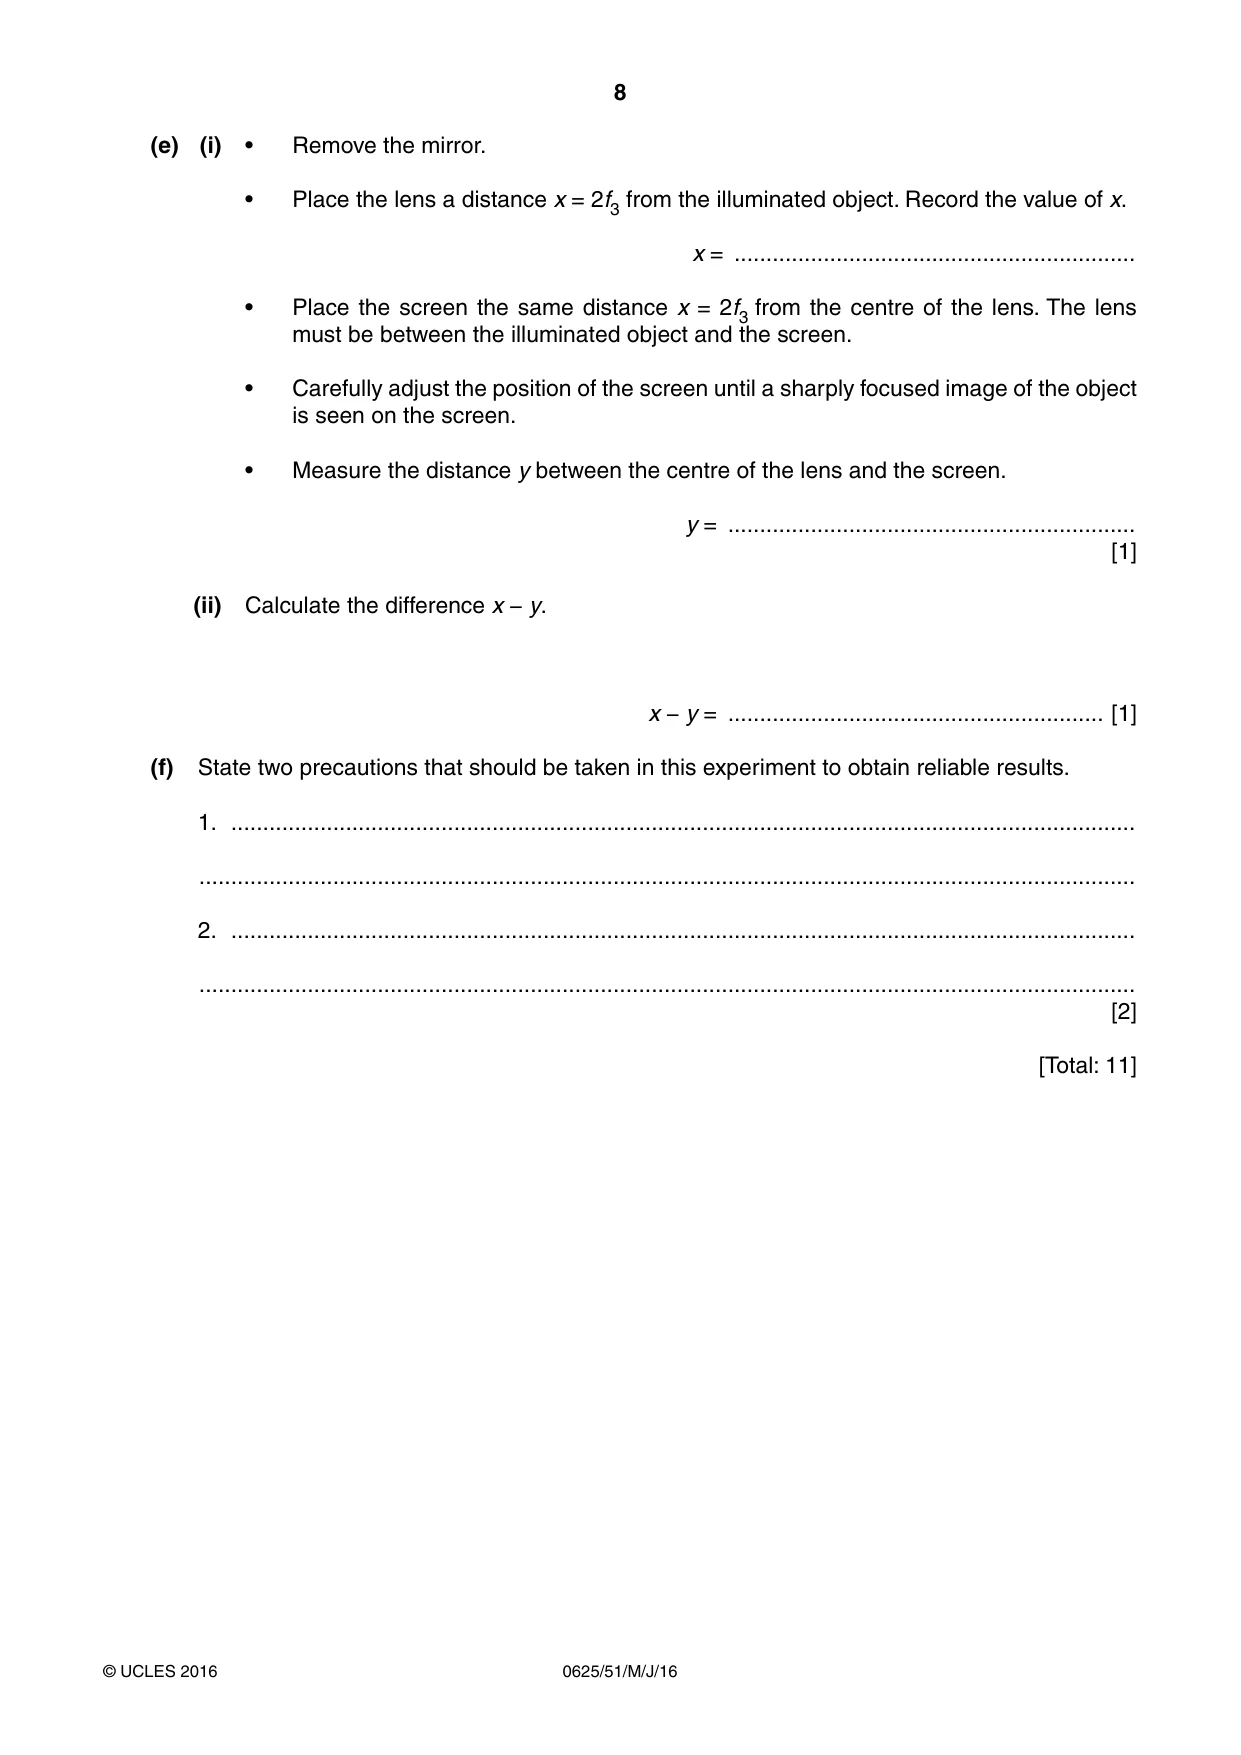
3 In this experiment, you will determine the focal length of a lens by two different methods. Method 1 (a) Set up the apparatus as shown in Fig. 3.1. illuminated object u v screen lens Fig. 3.1 (i) • Place the lens at a distance u = 50.0 cm from the illuminated object. • Move the screen until a sharply focused image of the object is seen on the screen. • Measure and record the distance v from the screen to the centre of the lens. v = ..................................................... cm [1] uv (ii) Calculate a value f1 for the focal length of the lens, using the equation f1 = . (u + v) f1 = .......................................................... [1] (b) (i) • Place the lens at a distance u = 60.0 cm from the illuminated object. Move the screen until a sharply focused image of the object is seen on the screen. • Measure and record the distance v from the screen to the centre of the lens. v = ..................................................... cm [1] uv (ii) Calculate a value f2 for the focal length of the lens using the equation f2 = . (u + v) f2 = .......................................................... [1] (c) Calculate the average value fA for the focal length of the lens. Show your working. fA = .......................................................... [1] Method 2 (d) • Remove the screen. • Place the lens about 25 cm from the object. • Place the mirror close to the lens, as shown in Fig. 3.2. mirror illuminated 25.0 cm object lens Fig. 3.2 • Move the lens slowly towards the object until a sharply focused image is obtained close to the object, as shown in Fig. 3.3. illuminated image object Fig. 3.3 • Measure the distance f3 between the lens and the object. This is the focal length of the lens. f3 = ........................................................... [2] (e) (i) • Remove the mirror. • Place the lens a distance x = 2f3 from the illuminated object. Record the value of x. x = ............................................................... • Place the screen the same distance x = 2f3 from the centre of the lens. The lens must be between the illuminated object and the screen. • Carefully adjust the position of the screen until a sharply focused image of the object is seen on the screen. • Measure the distance y between the centre of the lens and the screen. y = ................................................................ [1] (ii) Calculate the difference x − y. x − y = ........................................................... [1] (f) State two precautions that should be taken in this experiment to obtain reliable results. 1. .............................................................................................................................................. ................................................................................................................................................... 2. .............................................................................................................................................. ................................................................................................................................................... [2] [Total: 11]
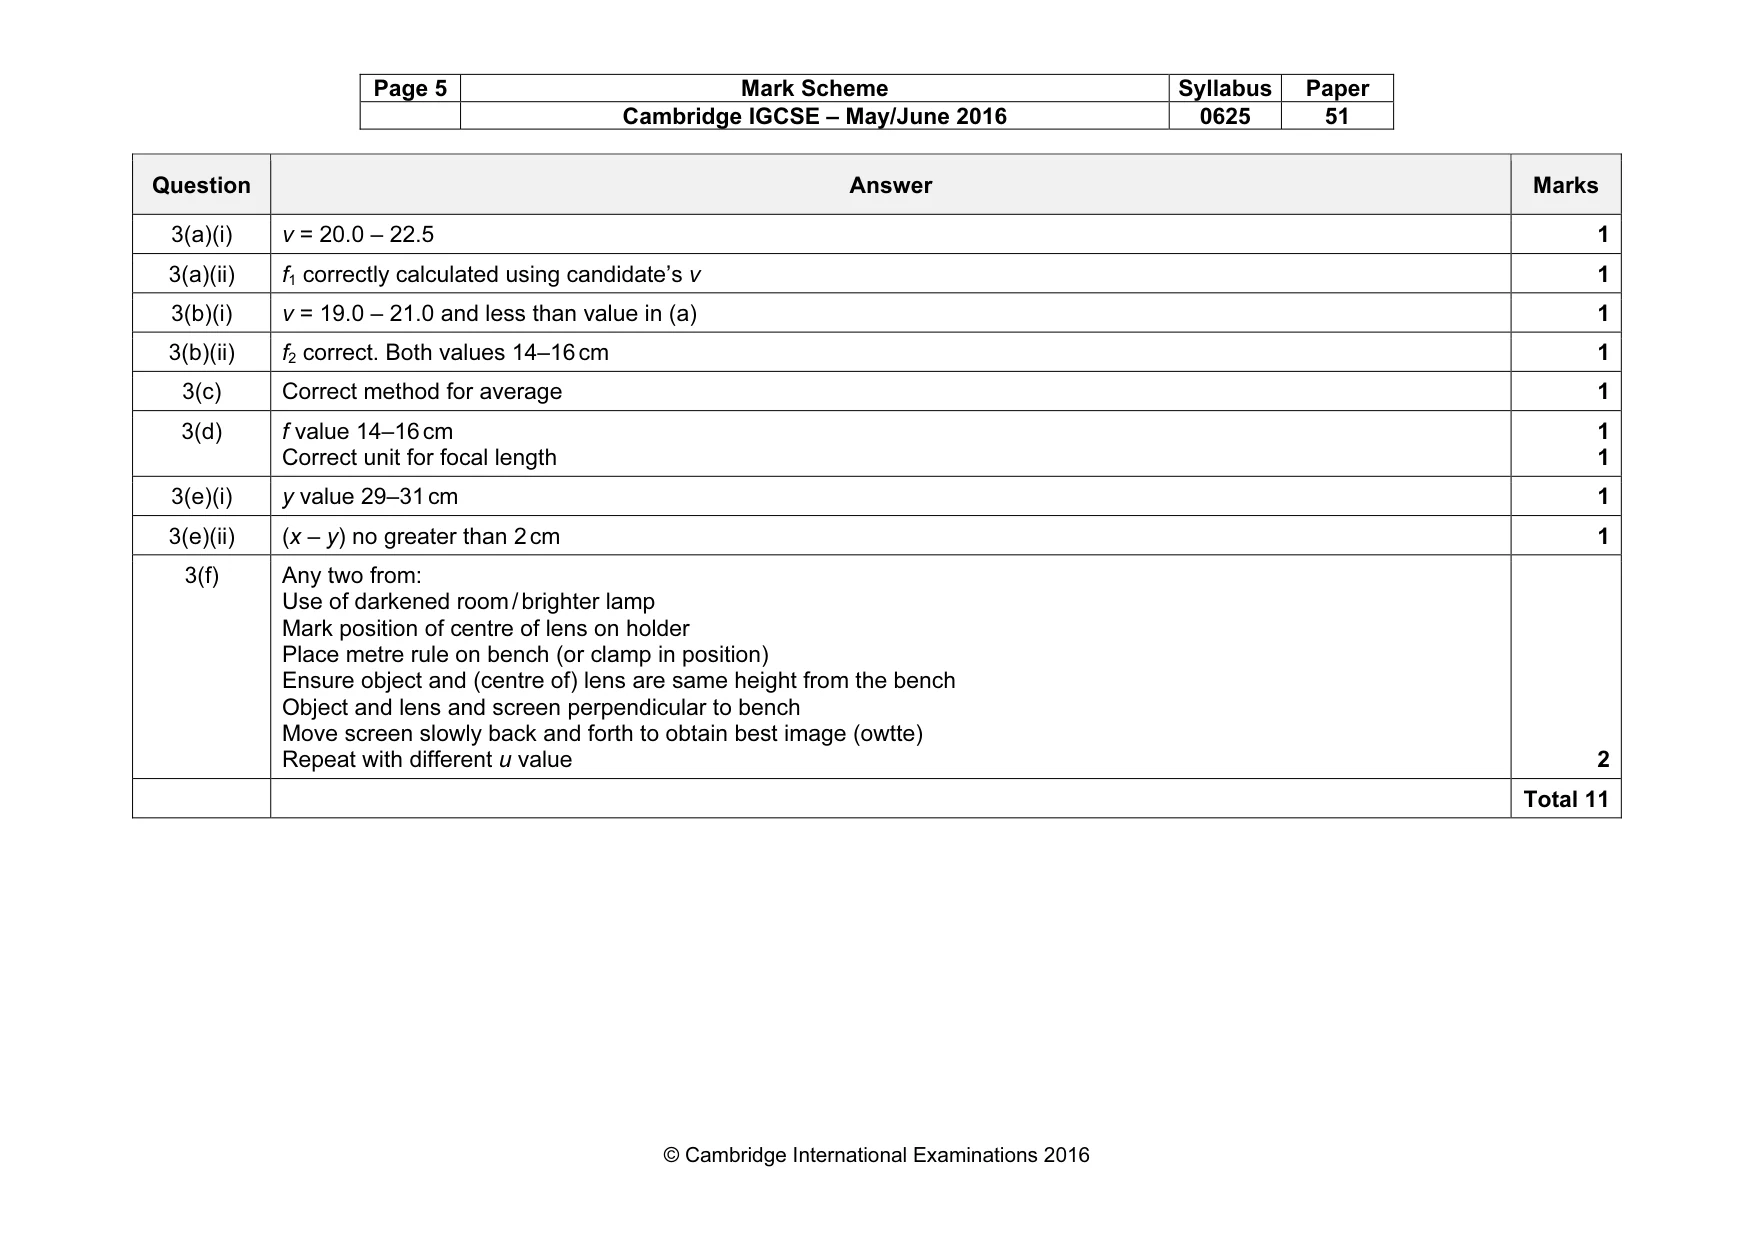
Mark scheme: 3(a)(i) 1 3(a)(ii) f1 correctly calculated using candidate’s v 1 3(b)(i) v = 19.0 – 21.0 and less than value in (a) 1 3(b)(ii) f2 correct. Both values 14–16 cm 1 3(c) Correct method for average 1 3(d) f value 14–16 cm Correct unit for focal length 1 1 3(e)(i) y value 29–31 cm 1 3(e)(ii) (x – y) no greater than 2 cm 1 3(f) Any two from: Use of darkened room / brighter lamp Mark position of centre of lens on holder Place metre rule on bench (or clamp in position) Ensure object and (centre of) lens are same height from the bench Object and lens and screen perpendicular to bench Move screen slowly back and forth to obtain best image (owtte) Repeat with different u value 2 Total 11
Q4 · A student is investigating the effect of insulation on the rate of cooling of hot water…
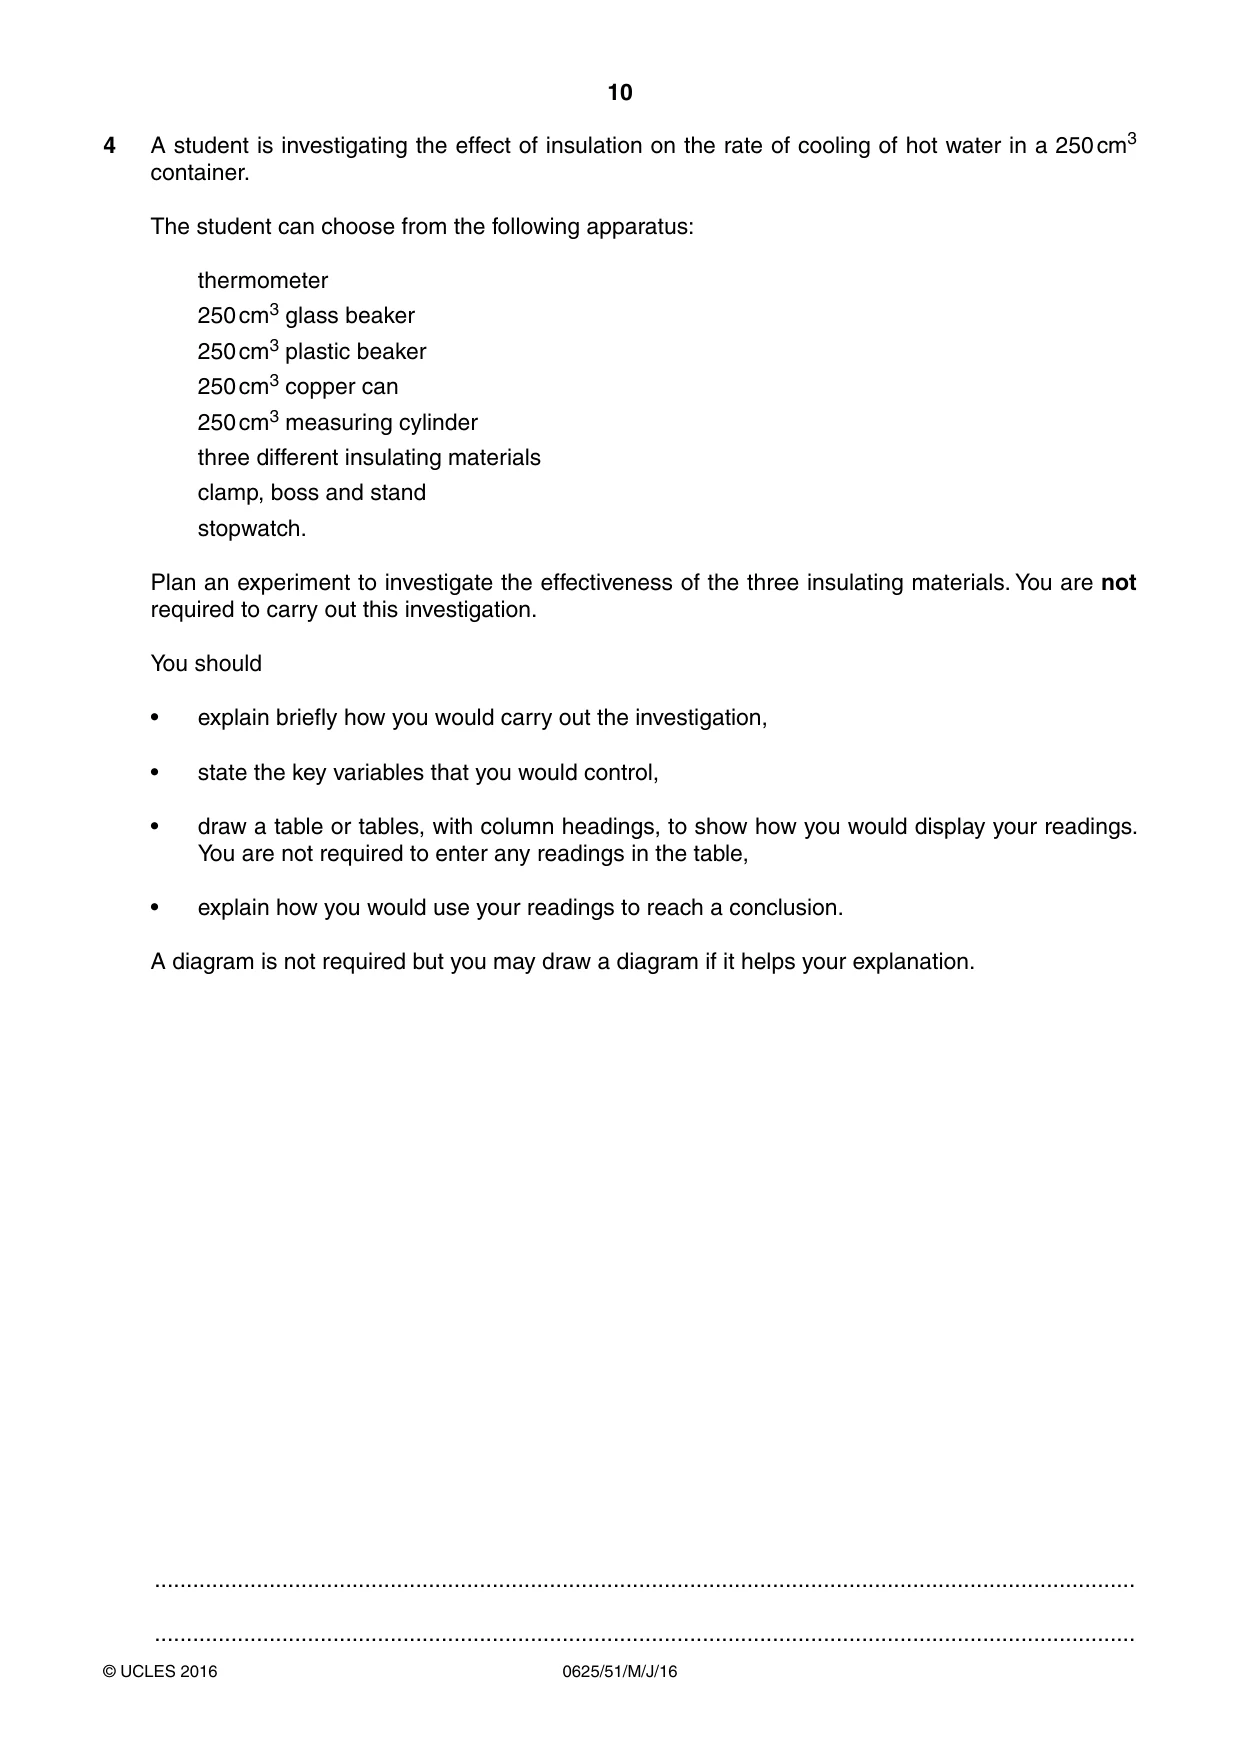
4 A student is investigating the effect of insulation on the rate of cooling of hot water in a 250 cm3 container. The student can choose from the following apparatus: thermometer 250 cm3 glass beaker 250 cm3 plastic beaker 250 cm3 copper can 250 cm3 measuring cylinder three different insulating materials clamp, boss and stand stopwatch. Plan an experiment to investigate the effectiveness of the three insulating materials. You are not required to carry out this investigation. You should • explain briefly how you would carry out the investigation, • state the key variables that you would control, • draw a table or tables, with column headings, to show how you would display your readings. You are not required to enter any readings in the table, • explain how you would use your readings to reach a conclusion. A diagram is not required but you may draw a diagram if it helps your explanation. .......................................................................................................................................................... .......................................................................................................................................................... .......................................................................................................................................................... .......................................................................................................................................................... .......................................................................................................................................................... .......................................................................................................................................................... .......................................................................................................................................................... .......................................................................................................................................................... .......................................................................................................................................................... .......................................................................................................................................................... .......................................................................................................................................................... .......................................................................................................................................................... .......................................................................................................................................................... .......................................................................................................................................................... .......................................................................................................................................................... .......................................................................................................................................................... .......................................................................................................................................................... .......................................................................................................................................................... .......................................................................................................................................................... .......................................................................................................................................................... .......................................................................................................................................................... .......................................................................................................................................................... .......................................................................................................................................................... .......................................................................................................................................................... .......................................................................................................................................................... .......................................................................................................................................................... .......................................................................................................................................................... .......................................................................................................................................................... ..................................................................................................................................................... [7]
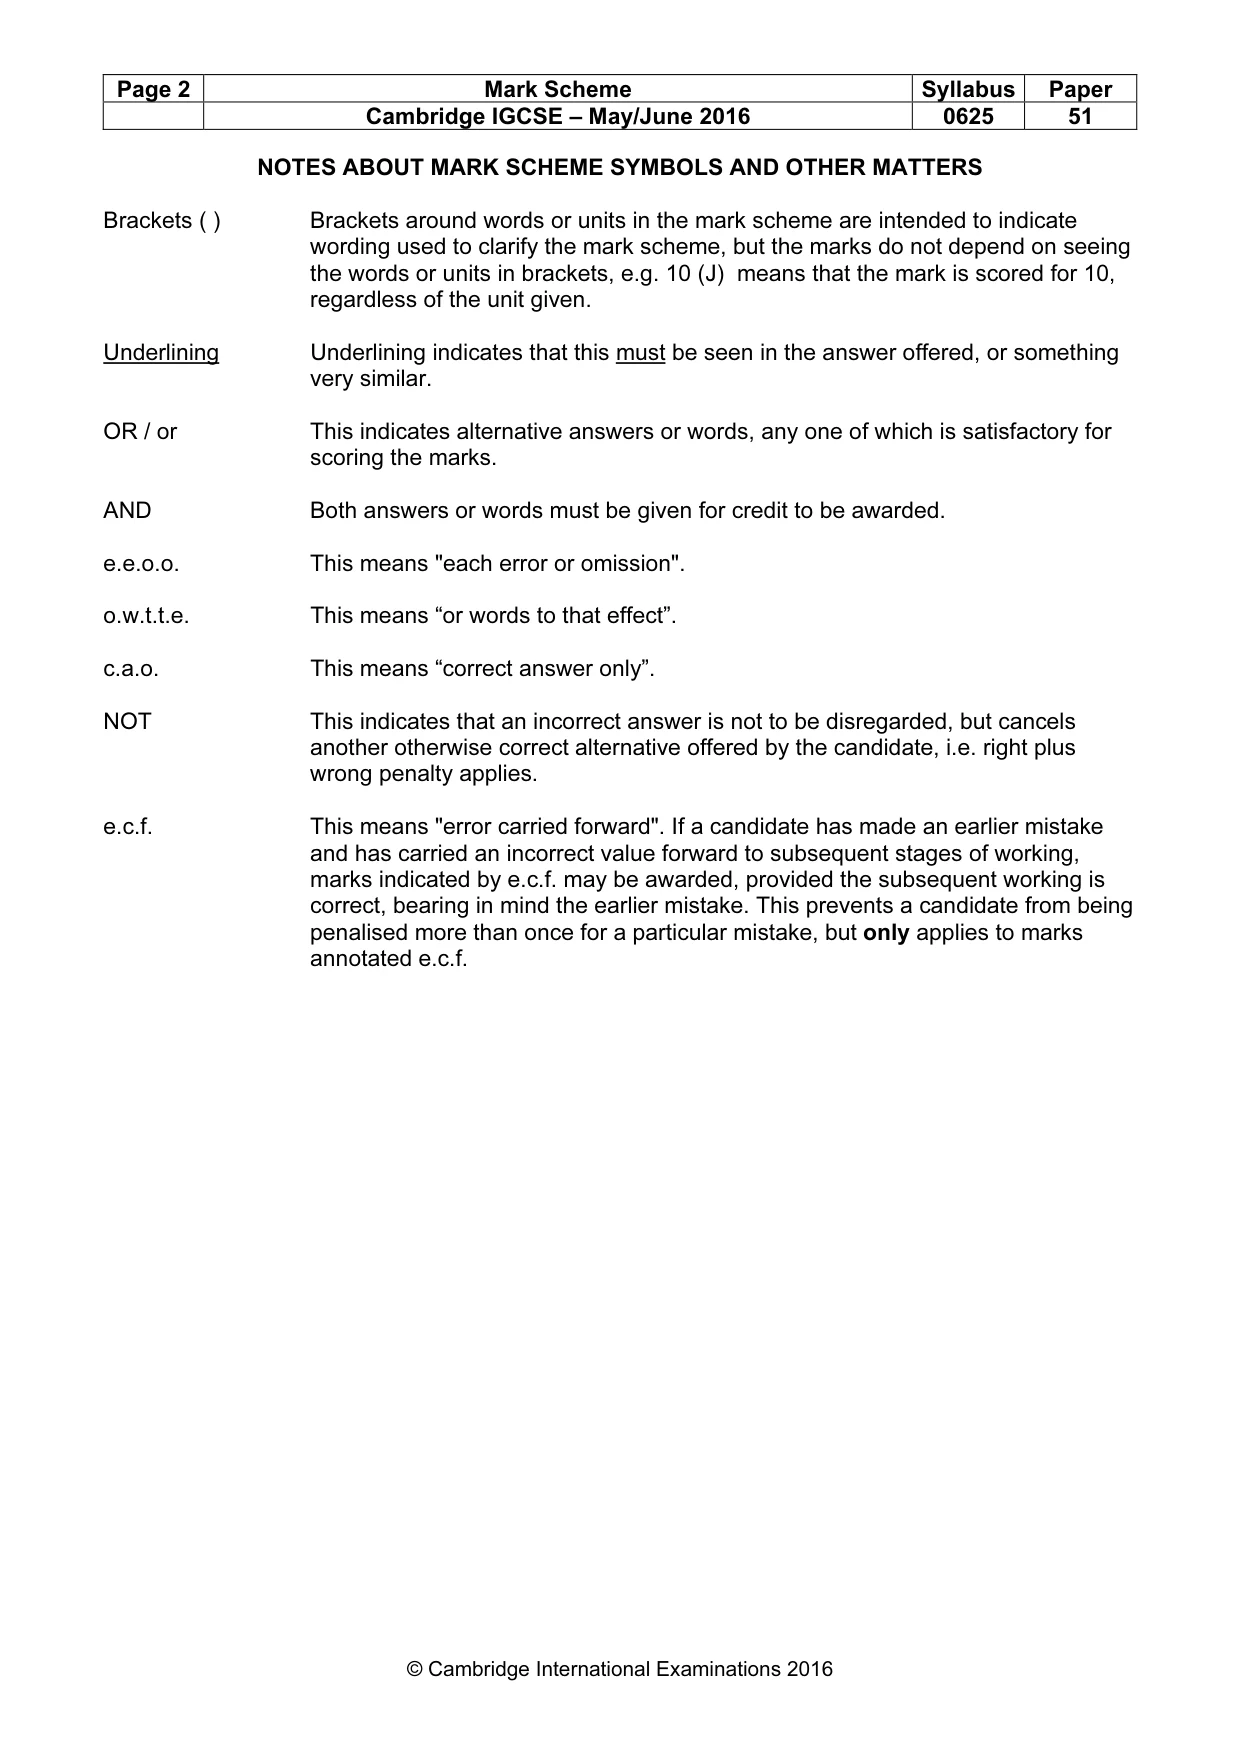
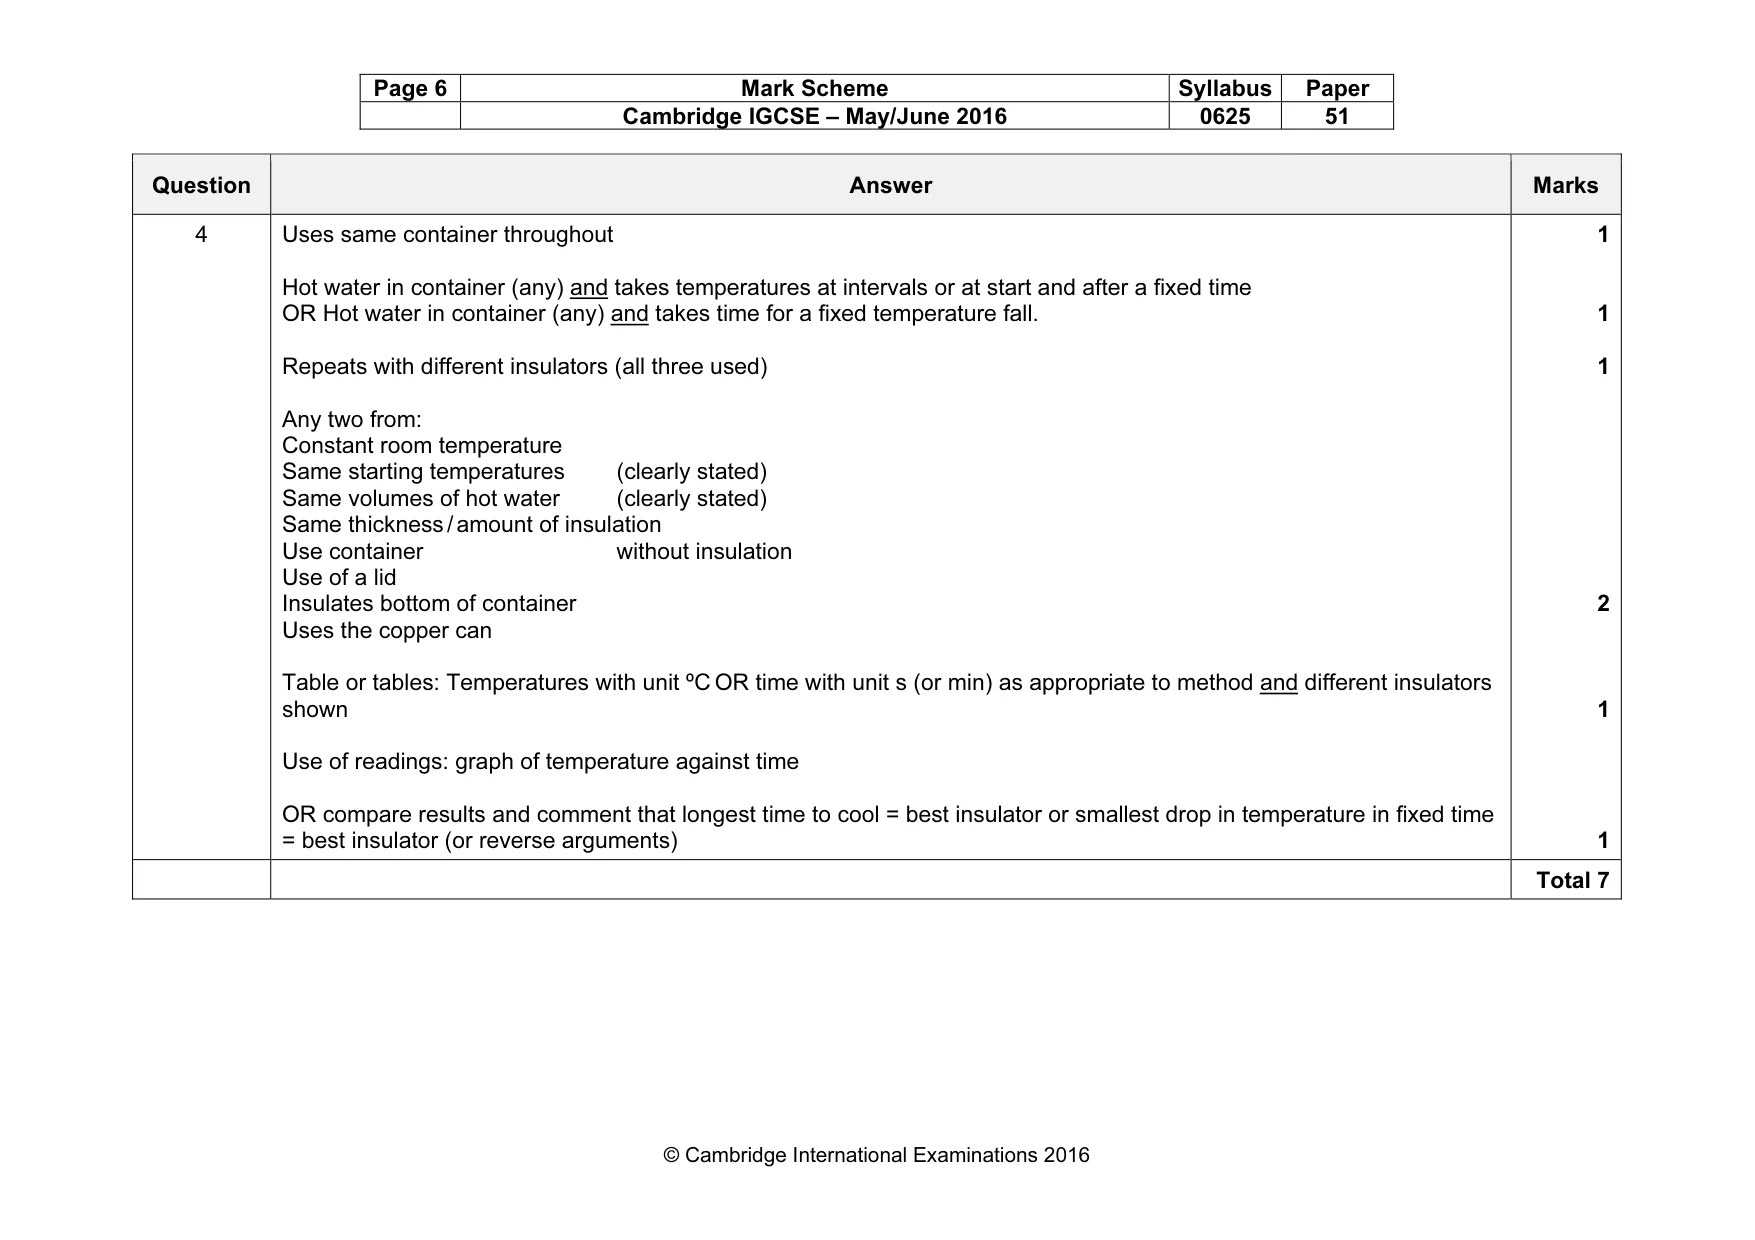
Mark scheme: 4 Uses same container throughout Hot water in container (any) and takes temperatures at intervals or at start and after a fixed time OR Hot water in container (any) and takes time for a fixed temperature fall. Repeats with different insulators (all three used) Any two from: Constant room temperature Same starting temperatures (clearly stated) Same volumes of hot water (clearly stated) Same thickness / amount of insulation Use container without insulation Use of a lid Insulates bottom of container Uses the copper can Table or tables: Temperatures with unit ºC OR time with unit s (or min) as appropriate to method and different insulators shown Use of readings: graph of temperature against time OR compare results and comment that longest time to cool = best insulator or smallest drop in temperature in fixed time = best insulator (or reverse arguments) 1 1 1 2 1 1 Total 7
What was in this paper
The subtopics covered by these 4 questions, and how many questions each got. Open one in a new tab to see every Cambridge question on it.
What you needed in this session
Cambridge’s own grade thresholds for 2016 May/June, Paper 5 · Variant 1. A higher threshold means an easier paper — the bar moves with how the cohort did.