Cambridge IGCSE Physics 0625 — 2015 Oct/Nov Paper 6 · Variant 3
0625/63/O/N/15 · 5 questions · 40 marks · ≈45 min
The question paper and its mark scheme, free to read here and free to download. This is Cambridge’s own paper, exactly as it was sat.
Question paper20 pages
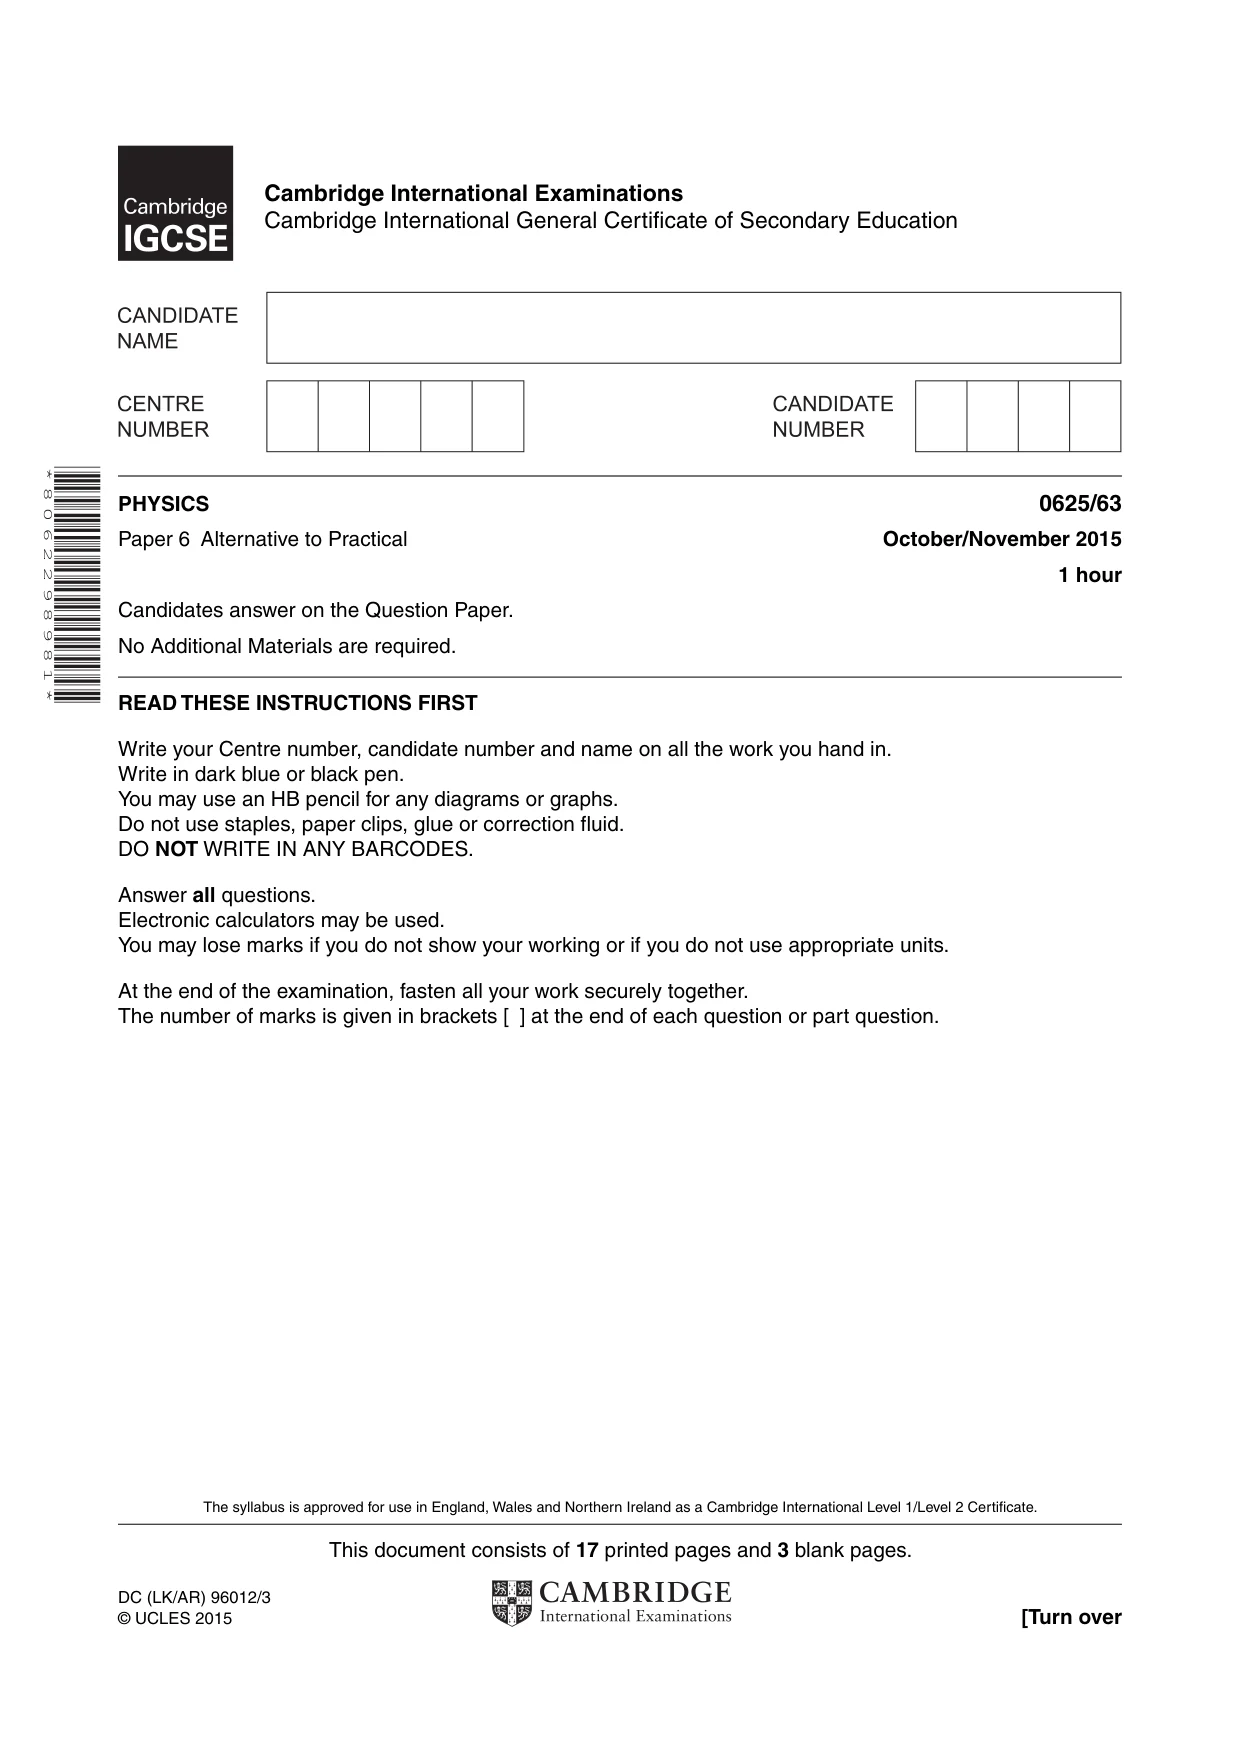




Mark scheme5 pages
Answers below. Sit the paper first if you are practising.
Questions as text
Q1 · A student is investigating the transfer of thermal energy
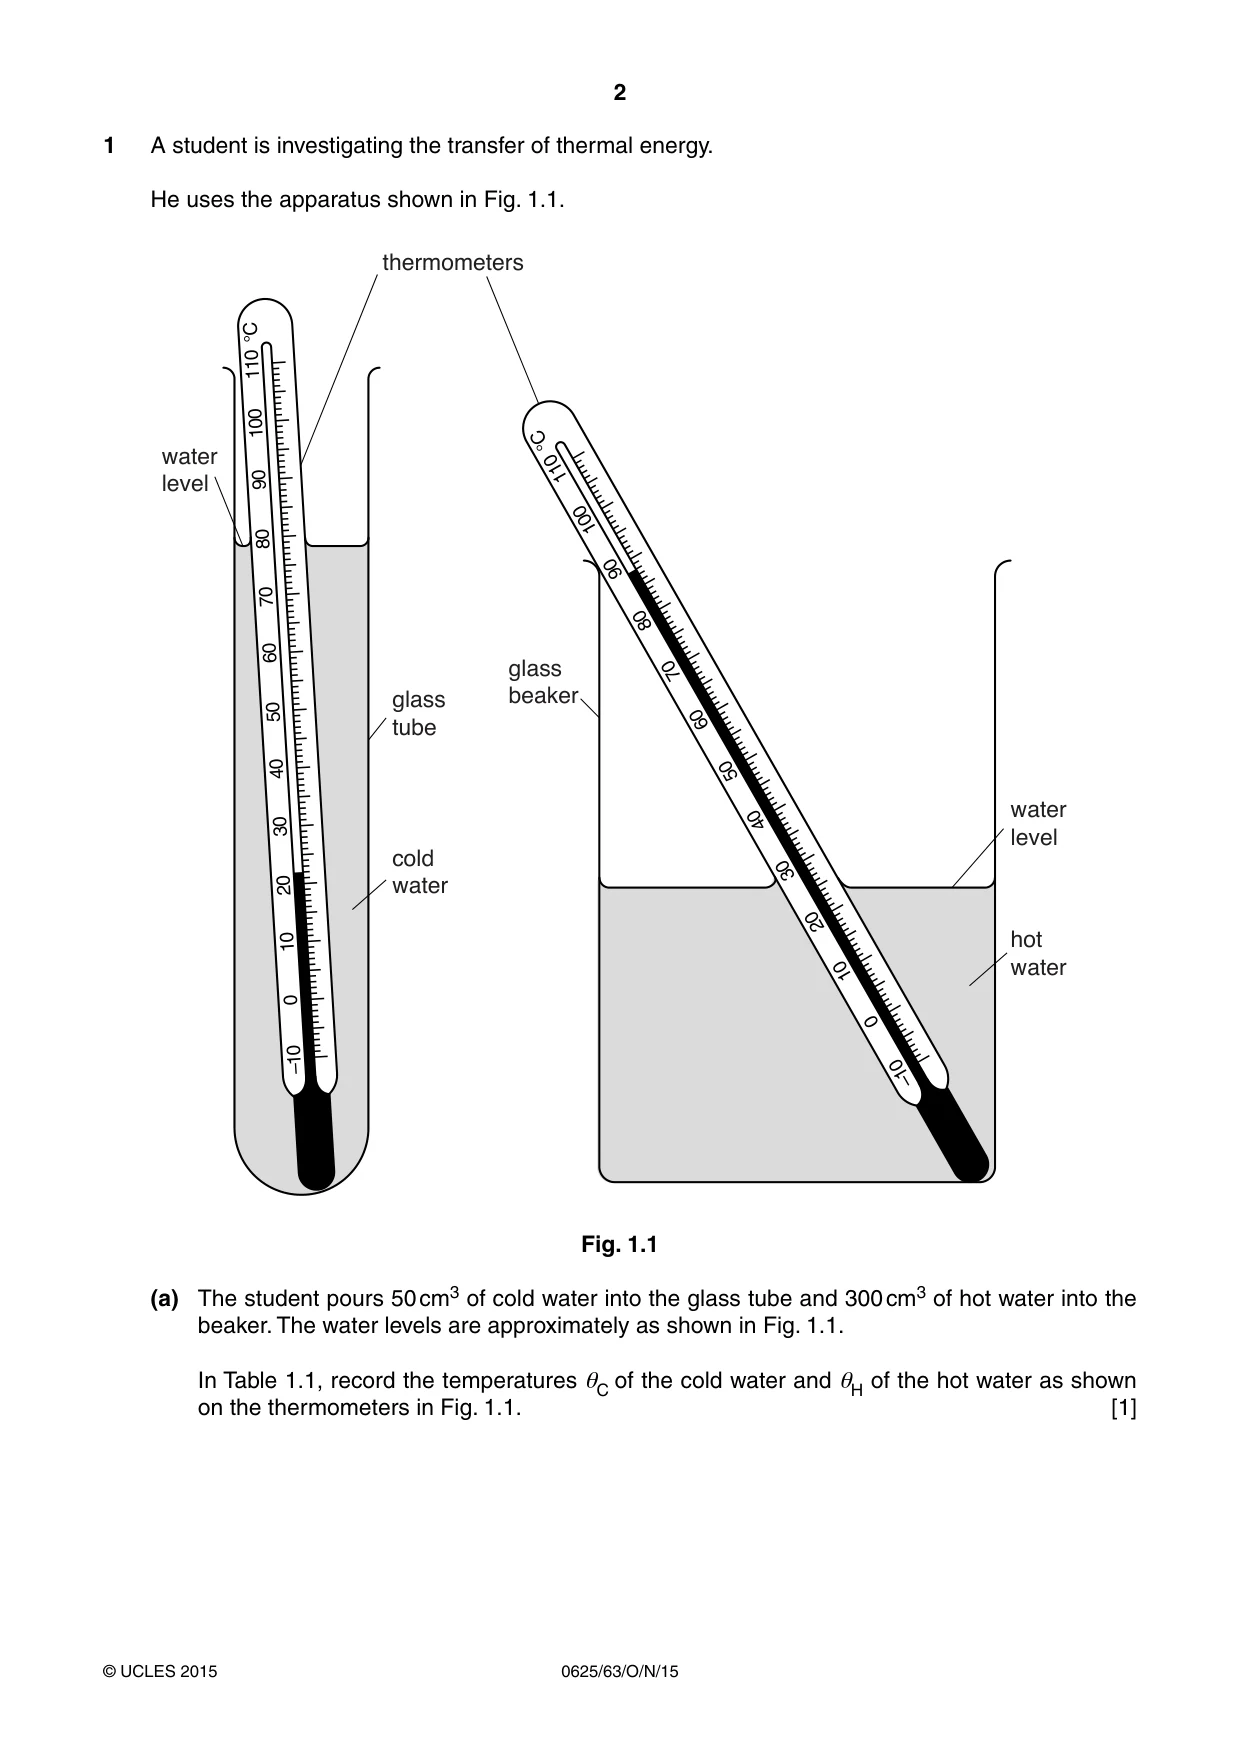
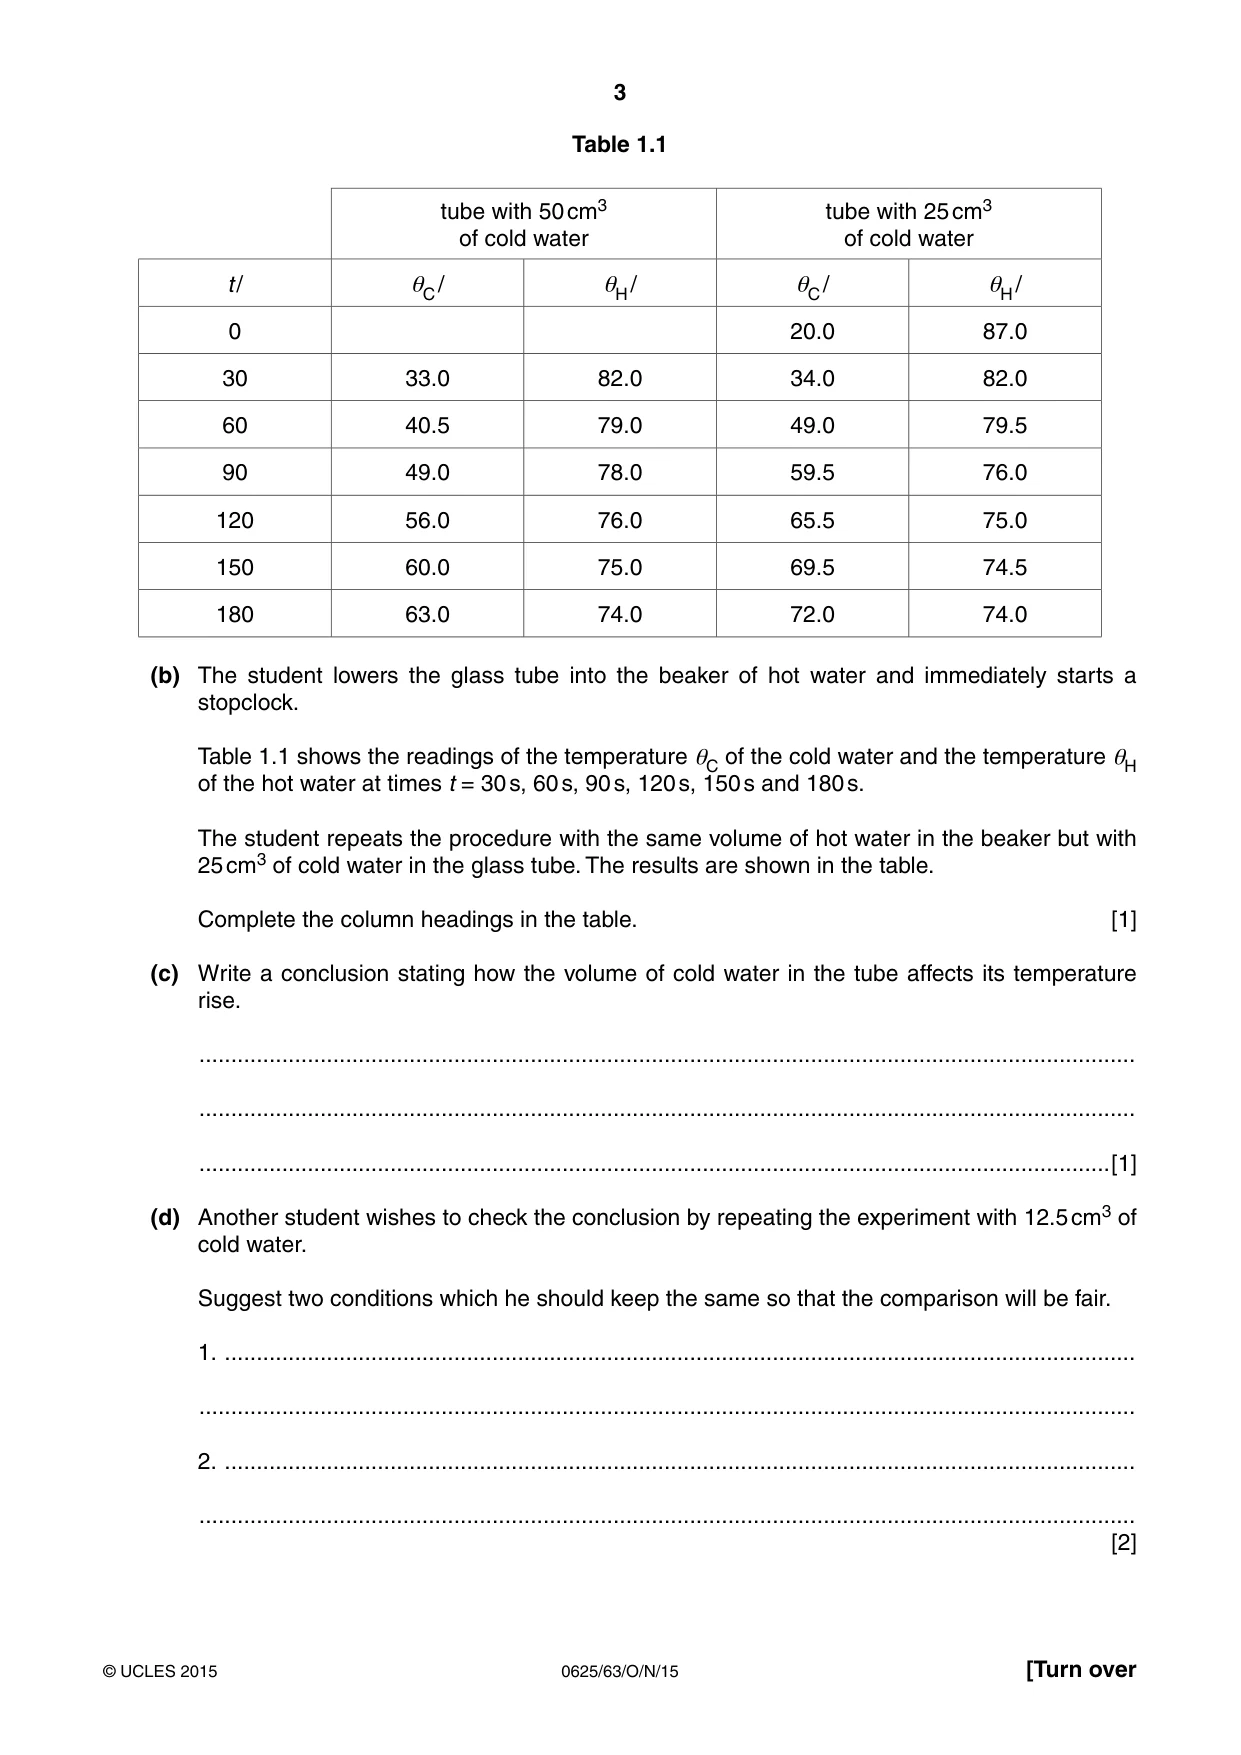
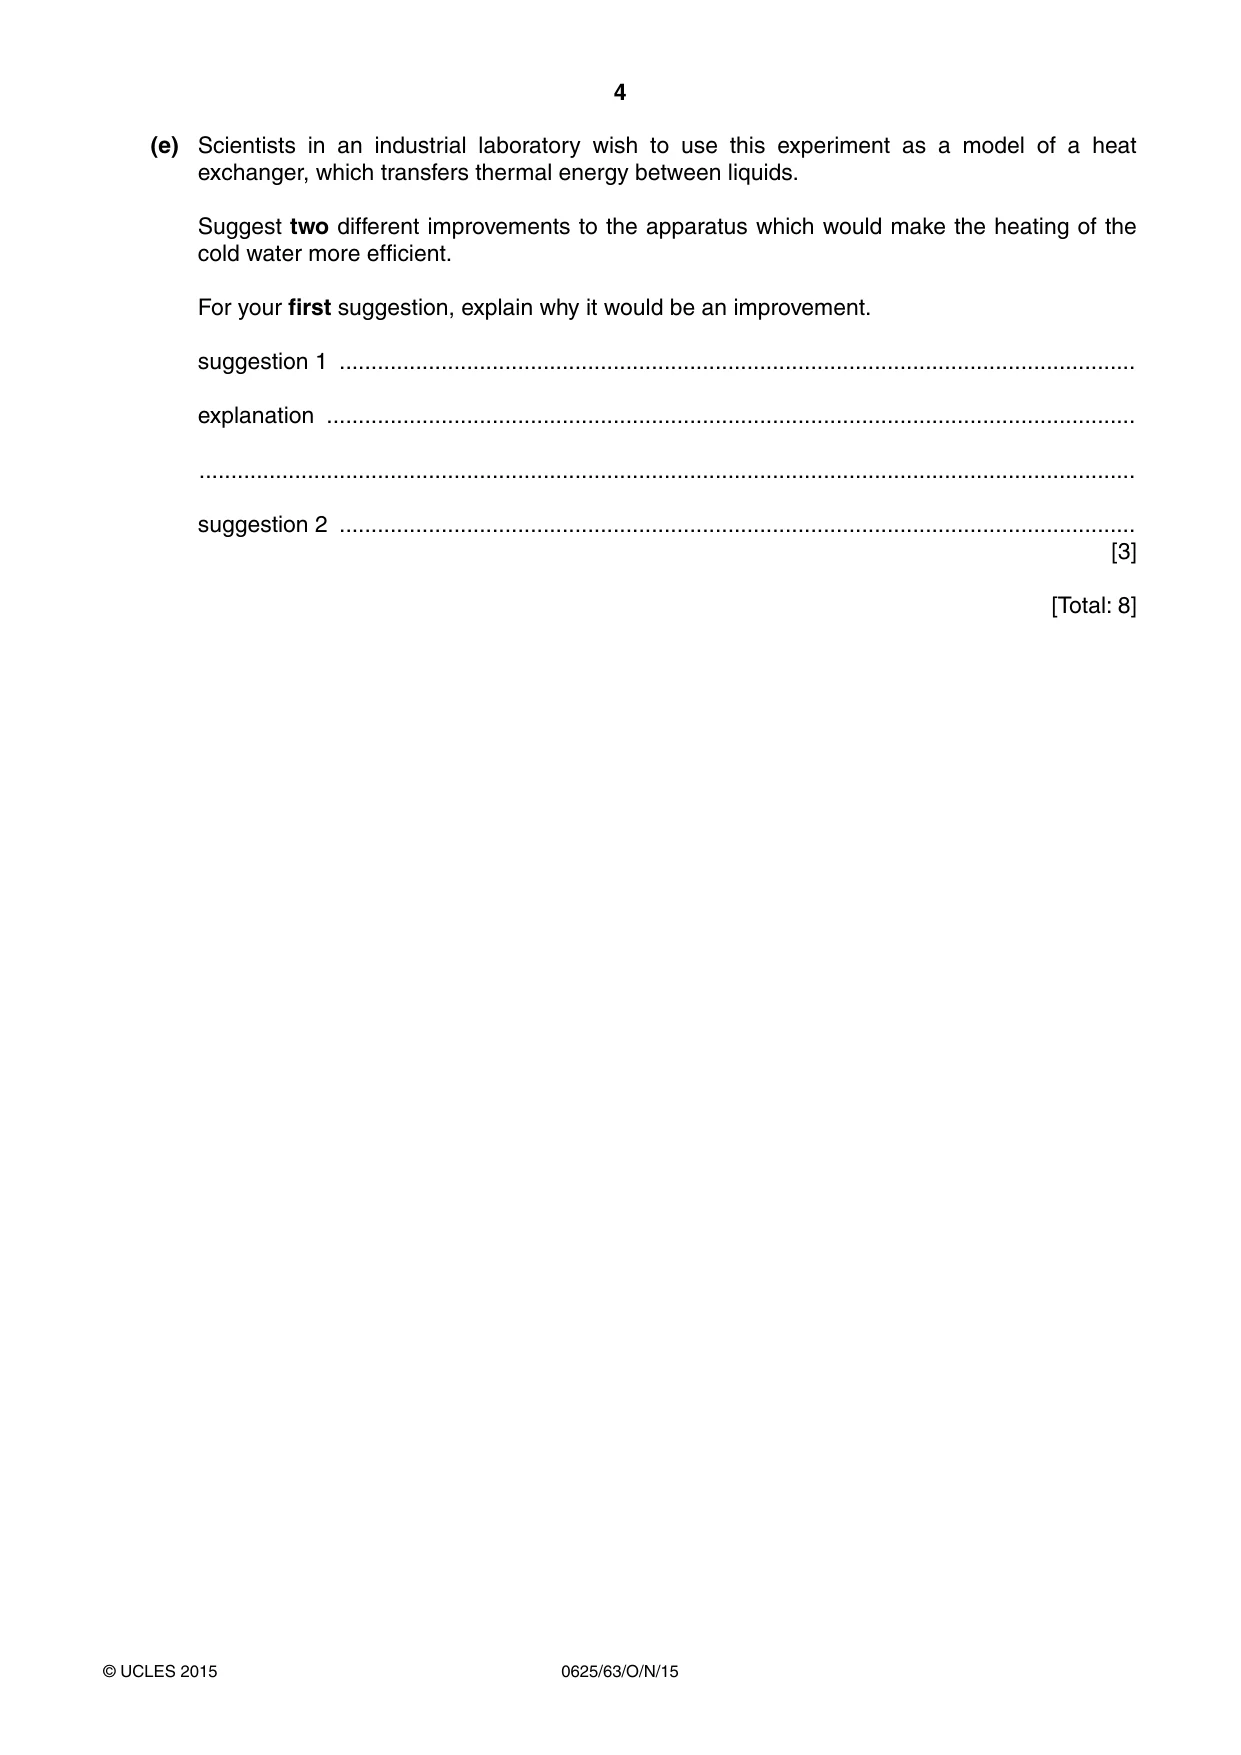
1 A student is investigating the transfer of thermal energy. He uses the apparatus shown in Fig. 1.1. thermometers water level glass glass beaker tube water level cold water hot water Fig. 1.1 (a) The student pours 50 cm3 of cold water into the glass tube and 300 cm3 of hot water into the beaker. The water levels are approximately as shown in Fig. 1.1. In Table 1.1, record the temperatures θC of the cold water and θH of the hot water as shown on the thermometers in Fig. 1.1. [1] Table 1.1 tube with 50 cm3 tube with 25 cm3 of cold water of cold water t / θC / θH / θC / θH / 0 20.0 87.0 30 33.0 82.0 34.0 82.0 60 40.5 79.0 49.0 79.5 90 49.0 78.0 59.5 76.0 120 56.0 76.0 65.5 75.0 150 60.0 75.0 69.5 74.5 180 63.0 74.0 72.0 74.0 (b) The student lowers the glass tube into the beaker of hot water and immediately starts a stopclock. Table 1.1 shows the readings of the temperature θC of the cold water and the temperature θH of the hot water at times t = 30 s, 60 s, 90 s, 120 s, 150 s and 180 s. The student repeats the procedure with the same volume of hot water in the beaker but with 25 cm3 of cold water in the glass tube. The results are shown in the table. Complete the column headings in the table. [1] (c) Write a conclusion stating how the volume of cold water in the tube affects its temperature rise. ................................................................................................................................................... ................................................................................................................................................... ...............................................................................................................................................[1] (d) Another student wishes to check the conclusion by repeating the experiment with 12.5 cm3 of cold water. Suggest two conditions which he should keep the same so that the comparison will be fair. 1. ............................................................................................................................................... ................................................................................................................................................... 2. ............................................................................................................................................... ................................................................................................................................................... [2] (e) Scientists in an industrial laboratory wish to use this experiment as a model of a heat exchanger, which transfers thermal energy between liquids. Suggest two different improvements to the apparatus which would make the heating of the cold water more efficient. For your first suggestion, explain why it would be an improvement. suggestion 1 ............................................................................................................................. explanation ............................................................................................................................... ................................................................................................................................................... suggestion 2 ............................................................................................................................. [3] [Total: 8]
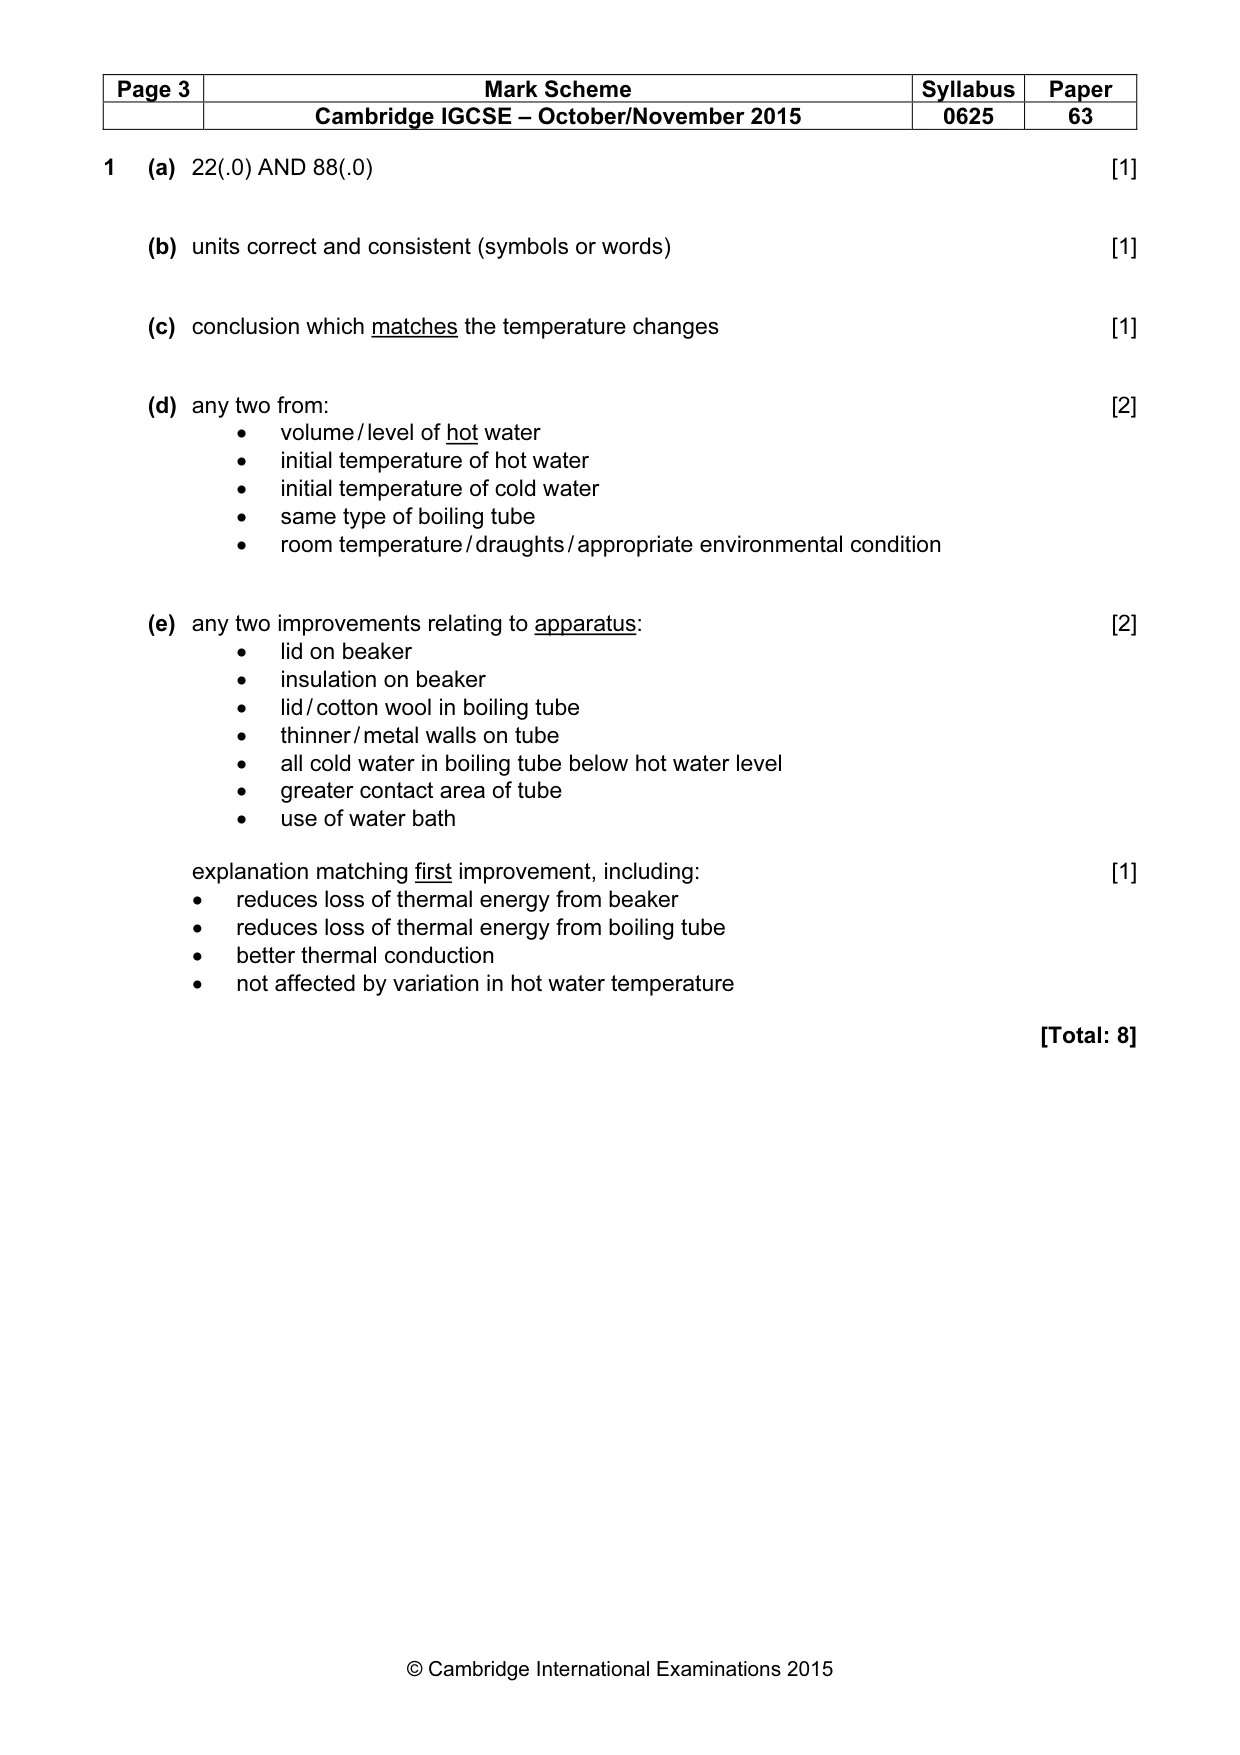
Mark scheme: 1 (a) 22(.0) AND 88(.0) [1] (b) units correct and consistent (symbols or words) [1] (c) conclusion which matches the temperature changes [1] (d) any two from: [2] • volume / level of hot water • initial temperature of hot water • initial temperature of cold water • same type of boiling tube • room temperature / draughts / appropriate environmental condition (e) any two improvements relating to apparatus: [2] • lid on beaker • insulation on beaker • lid / cotton wool in boiling tube • thinner / metal walls on tube • all cold water in boiling tube below hot water level • greater contact area of tube • use of water bath explanation matching first improvement, including: [1] • reduces loss of thermal energy from beaker • reduces loss of thermal energy from boiling tube • better thermal conduction • not affected by variation in hot water temperature [Total: 8]
Q2 · The class is investigating the behaviour of a spring, and then using the spring to…
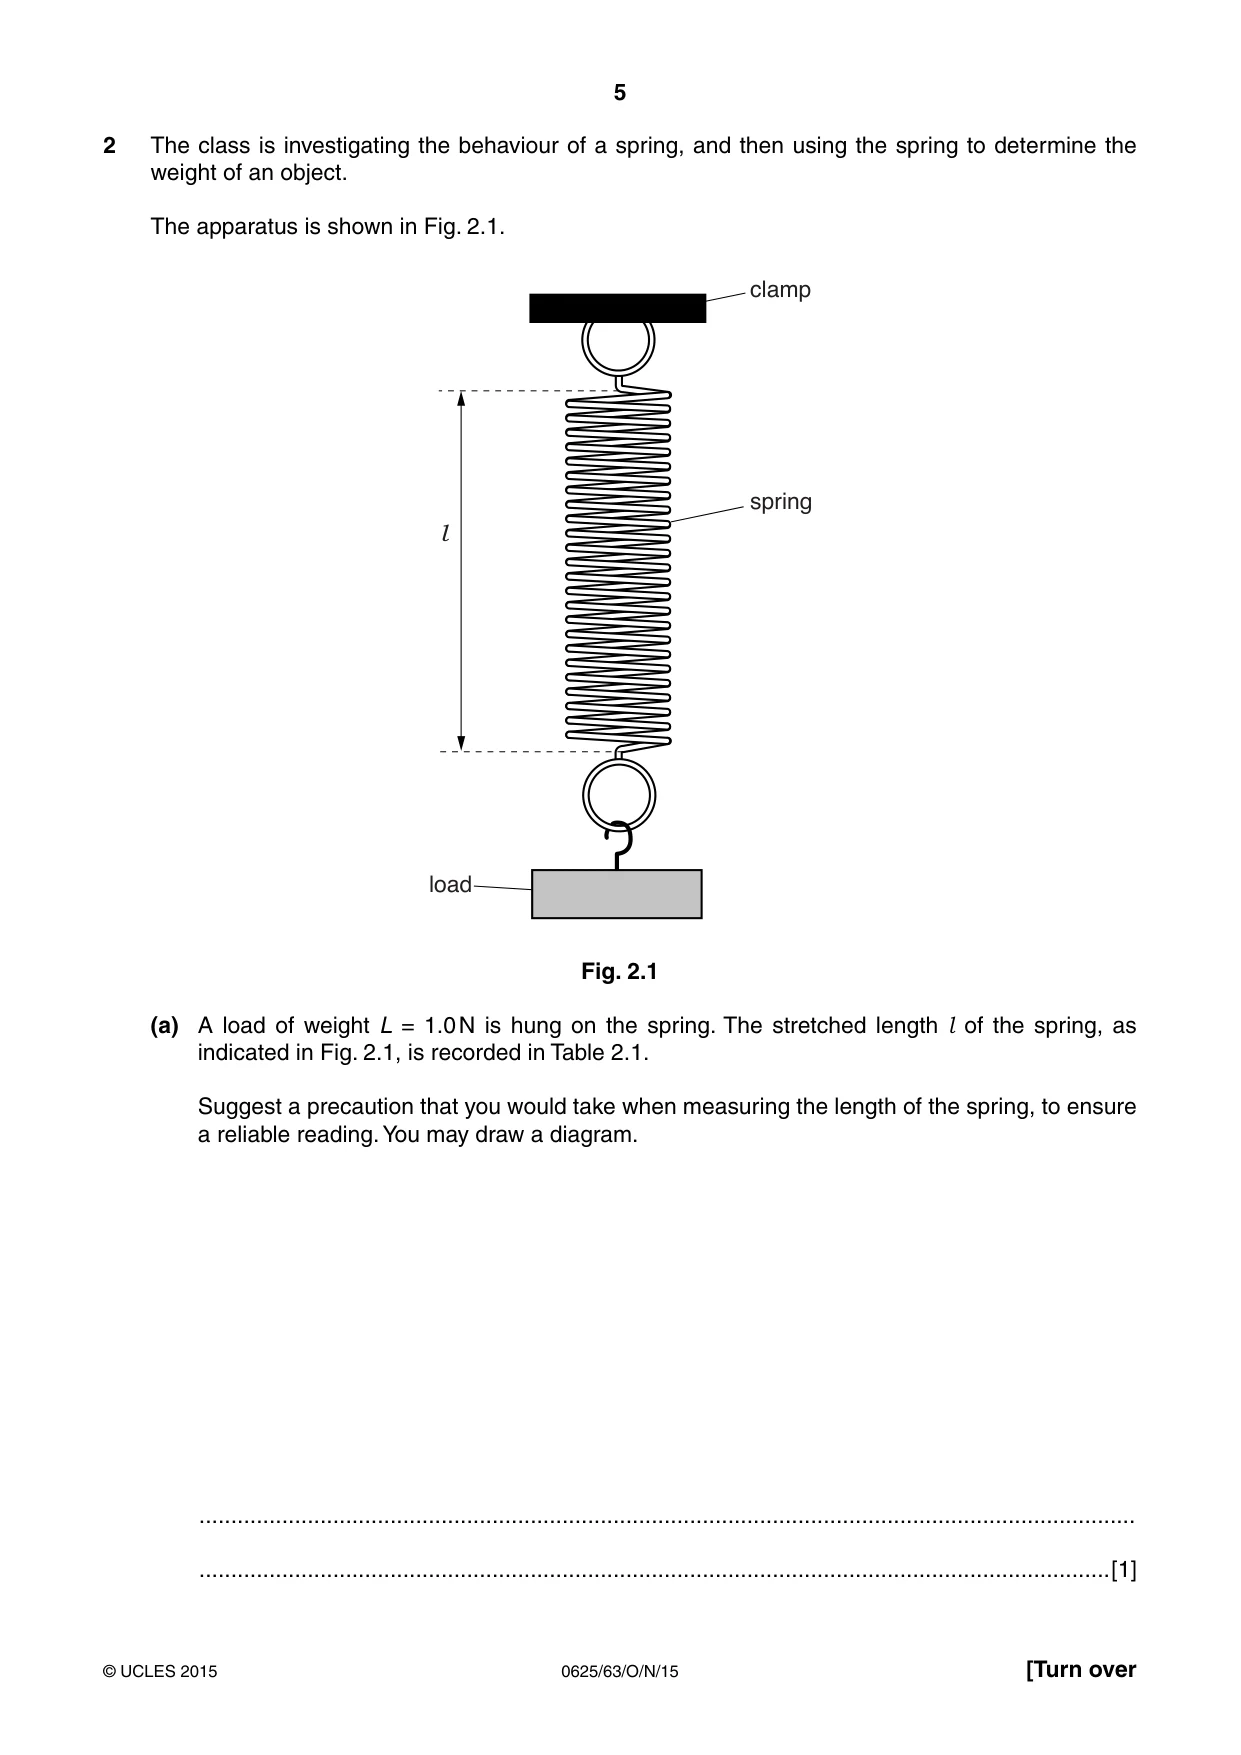
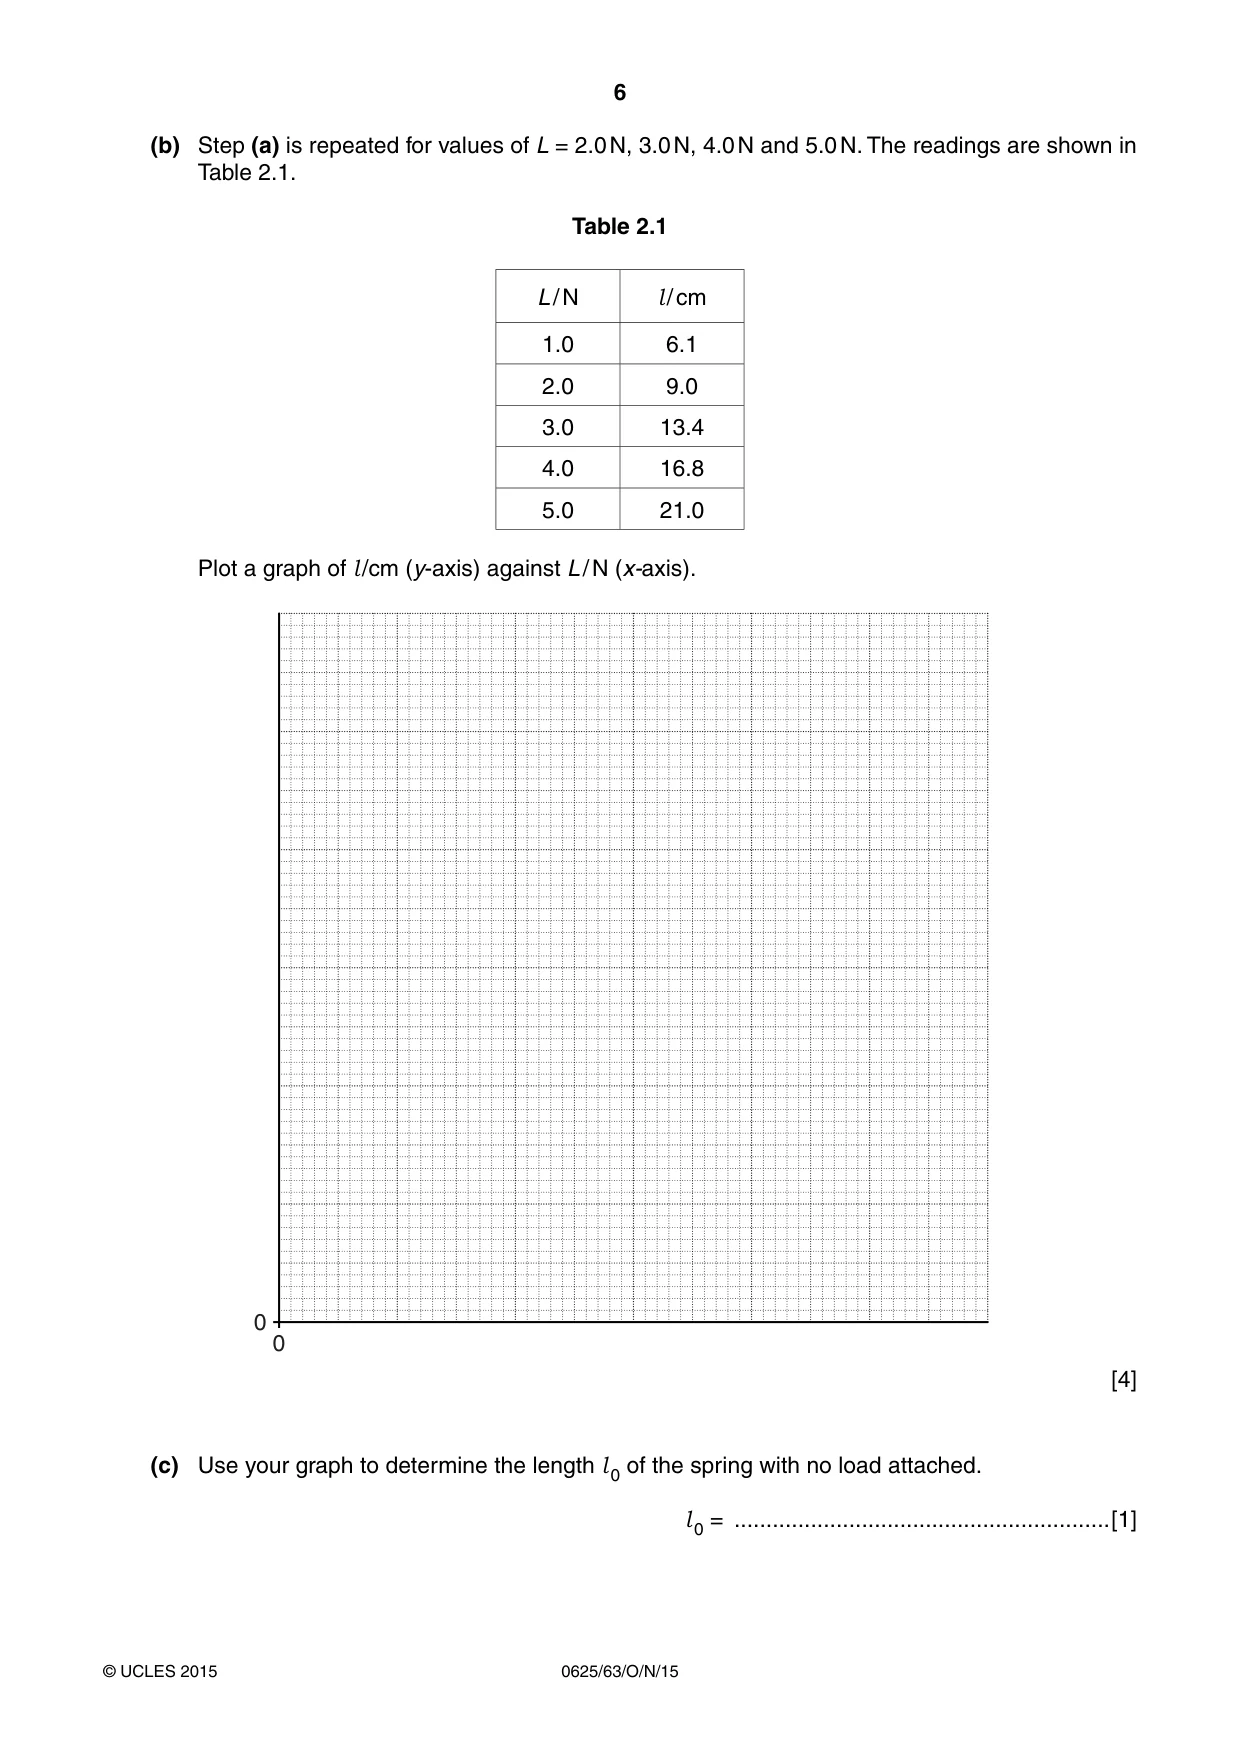
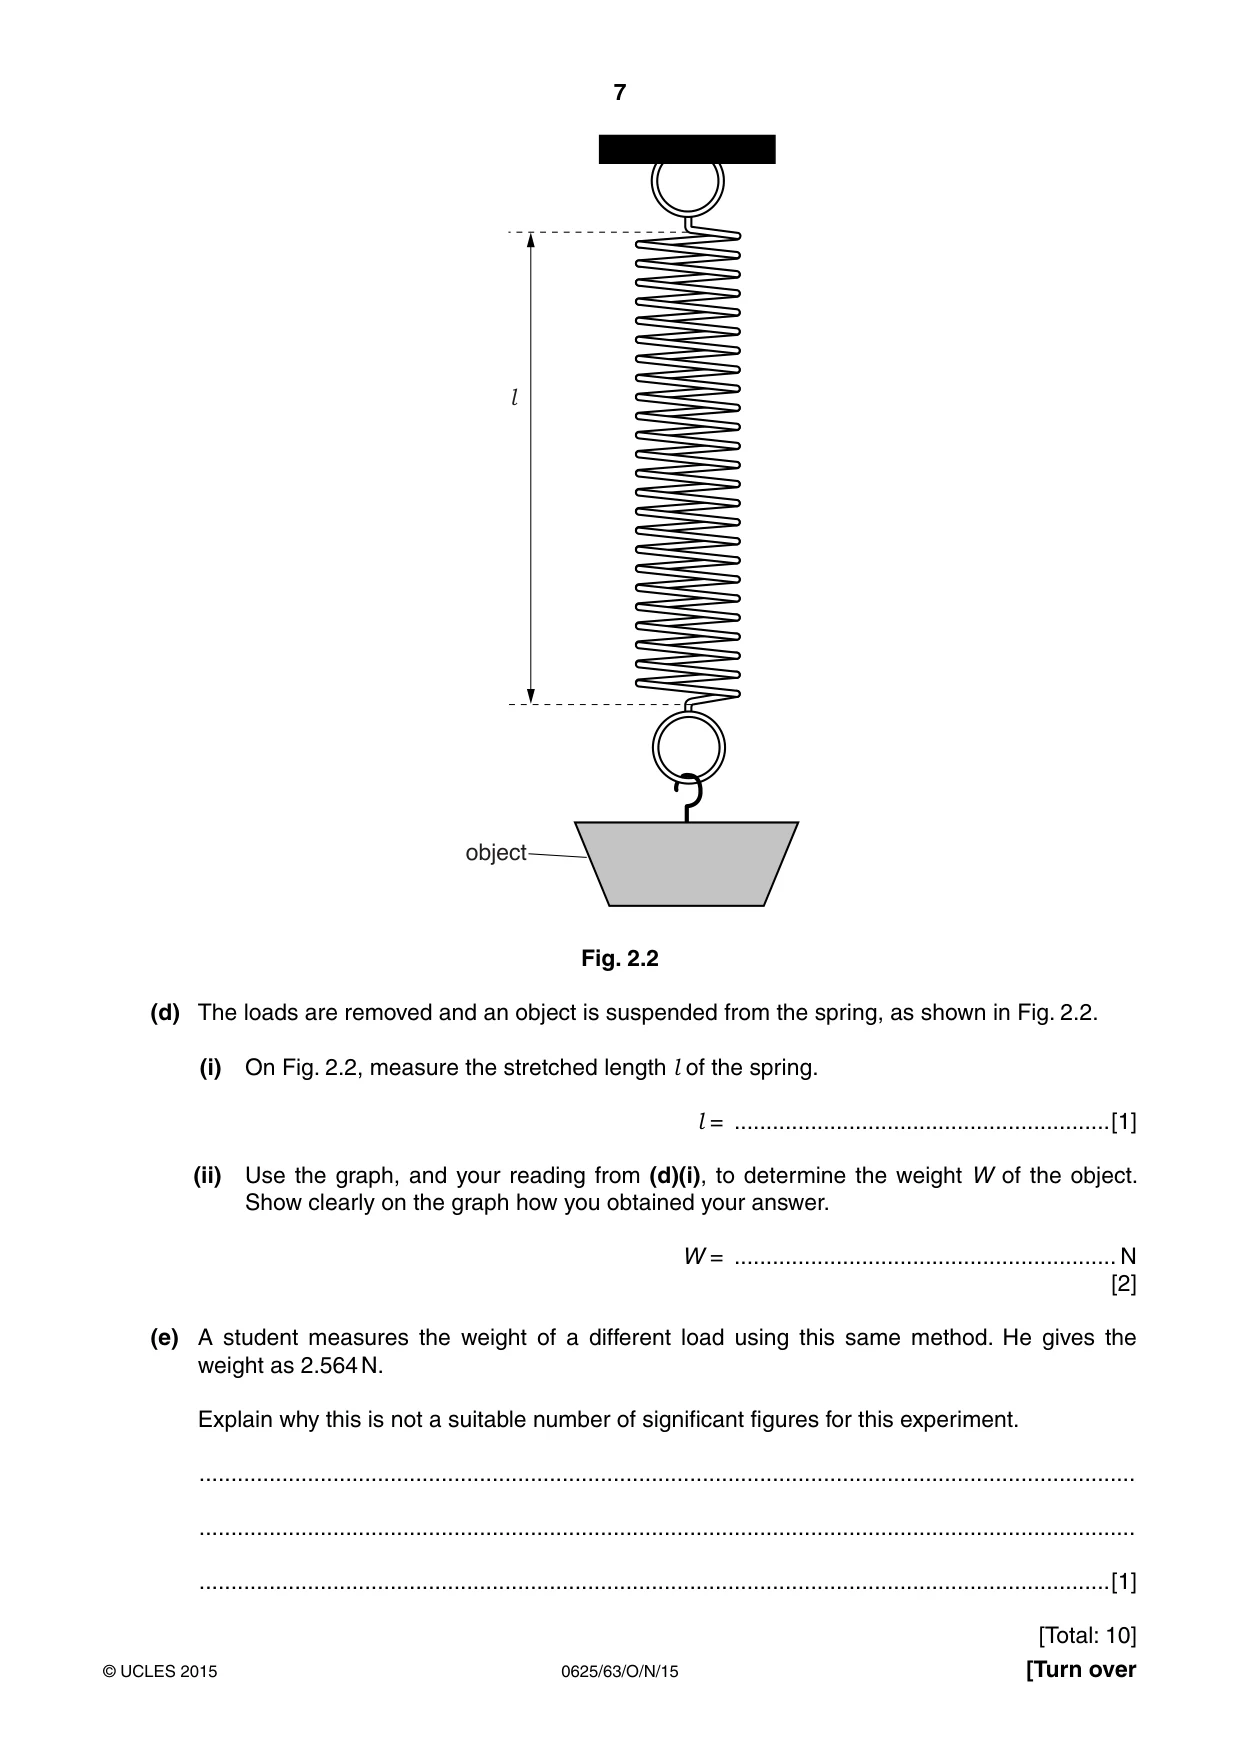
2 The class is investigating the behaviour of a spring, and then using the spring to determine the weight of an object. The apparatus is shown in Fig. 2.1. clamp spring l load Fig. 2.1 (a) A load of weight L = 1.0 N is hung on the spring. The stretched length l of the spring, as indicated in Fig. 2.1, is recorded in Table 2.1. Suggest a precaution that you would take when measuring the length of the spring, to ensure a reliable reading. You may draw a diagram. ................................................................................................................................................... ...............................................................................................................................................[1] (b) Step (a) is repeated for values of L = 2.0 N, 3.0 N, 4.0 N and 5.0 N. The readings are shown in Table 2.1. Table 2.1 L / N l / cm 1.0 6.1 2.0 9.0 3.0 13.4 4.0 16.8 5.0 21.0 Plot a graph of l /cm (y-axis) against L / N (x-axis). 0 0 [4] (c) Use your graph to determine the length l of the spring with no load attached. 0 l = ...........................................................[1] 0 l object Fig. 2.2 (d) The loads are removed and an object is suspended from the spring, as shown in Fig. 2.2. (i) On Fig. 2.2, measure the stretched length l of the spring. l = ...........................................................[1] (ii) Use the graph, and your reading from (d)(i), to determine the weight W of the object. Show clearly on the graph how you obtained your answer. W = ............................................................ N [2] (e) A student measures the weight of a different load using this same method. He gives the weight as 2.564 N. Explain why this is not a suitable number of significant figures for this experiment. ................................................................................................................................................... ................................................................................................................................................... ...............................................................................................................................................[1] [Total: 10]
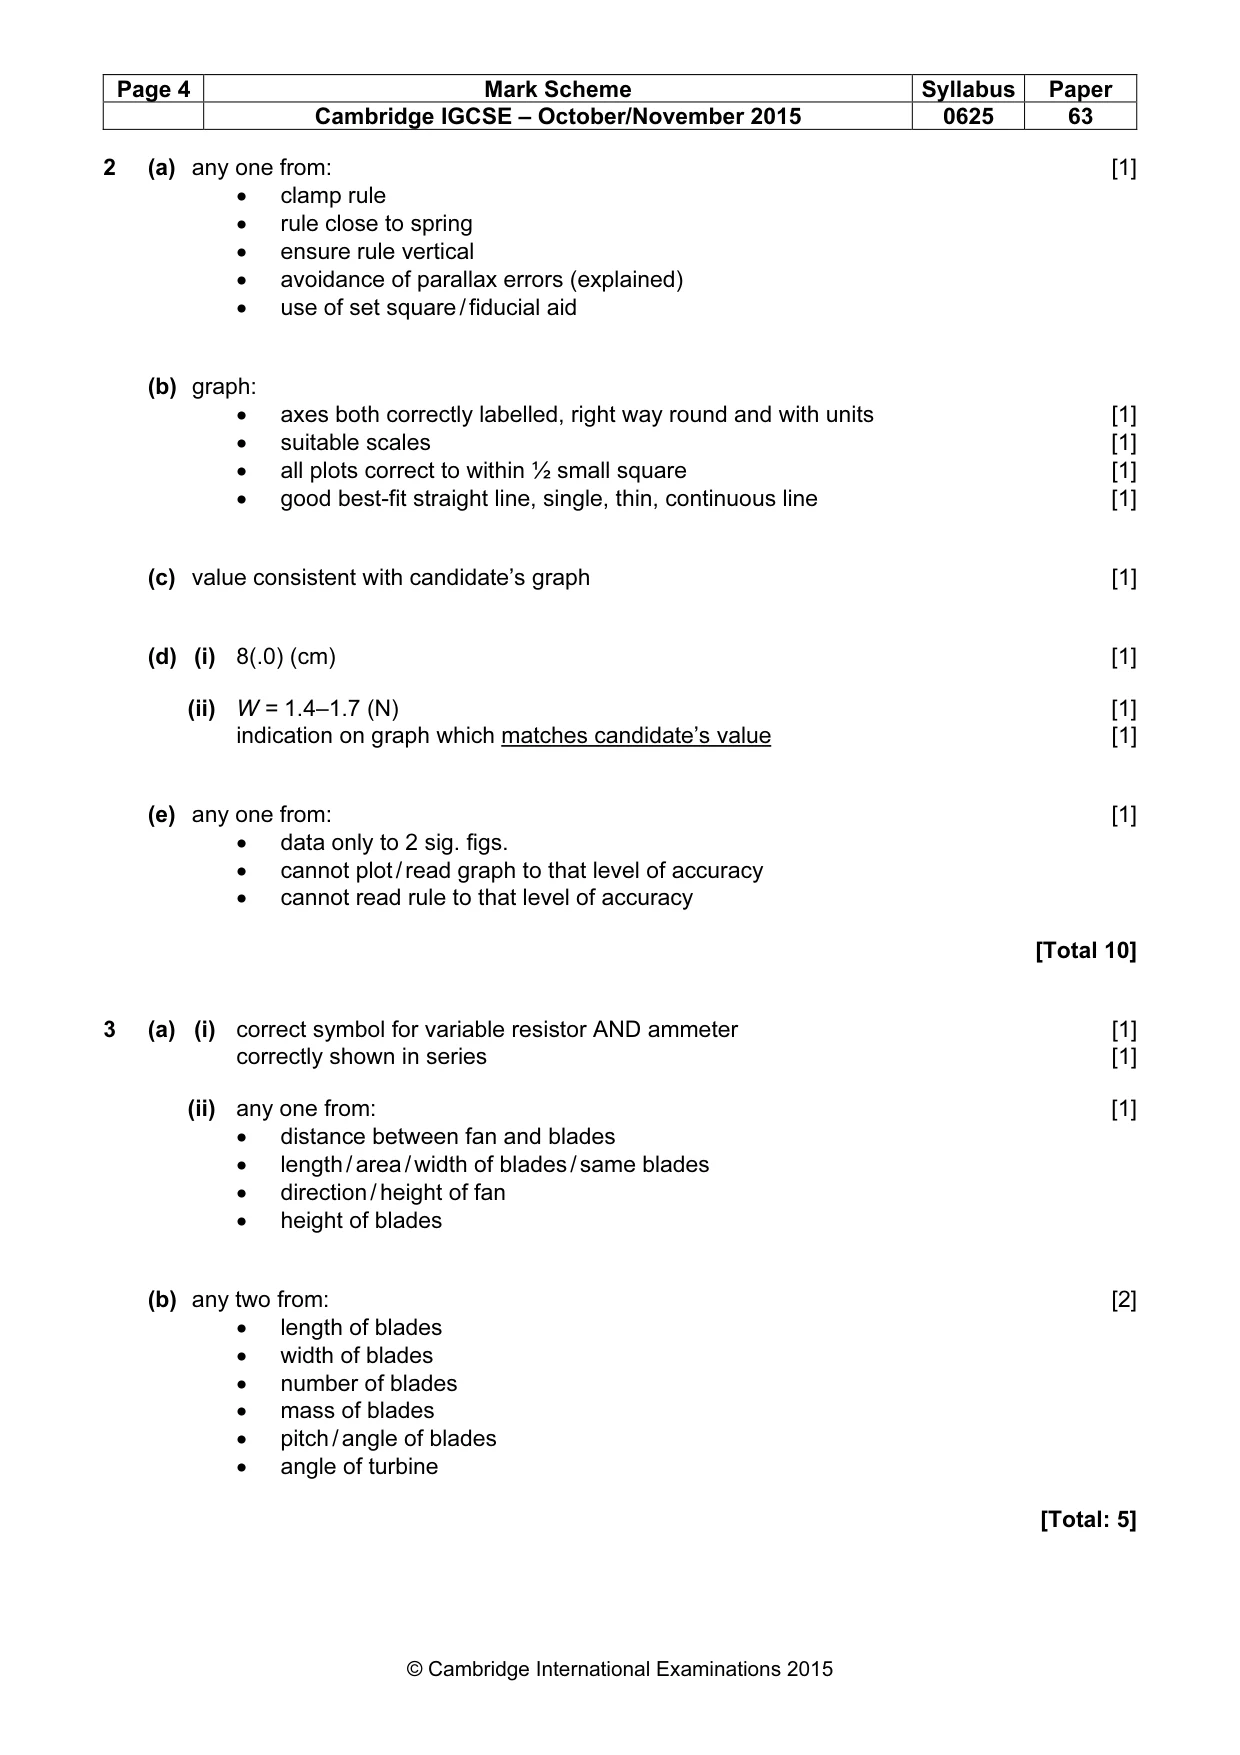
Mark scheme: 2 (a) any one from: [1] • clamp rule • rule close to spring • ensure rule vertical • avoidance of parallax errors (explained) • use of set square / fiducial aid (b) graph: • axes both correctly labelled, right way round and with units [1] • suitable scales [1] • all plots correct to within ½ small square [1] • good best-fit straight line, single, thin, continuous line [1] (c) value consistent with candidate’s graph [1] (d) (i) 8(.0) (cm) [1] (ii) W = 1.4–1.7 (N) [1] indication on graph which matches candidate’s value [1] (e) any one from: [1] • data only to 2 sig. figs. • cannot plot / read graph to that level of accuracy • cannot read rule to that level of accuracy [Total 10]
Q3 · Some students are carrying out experiments on a model wind turbine
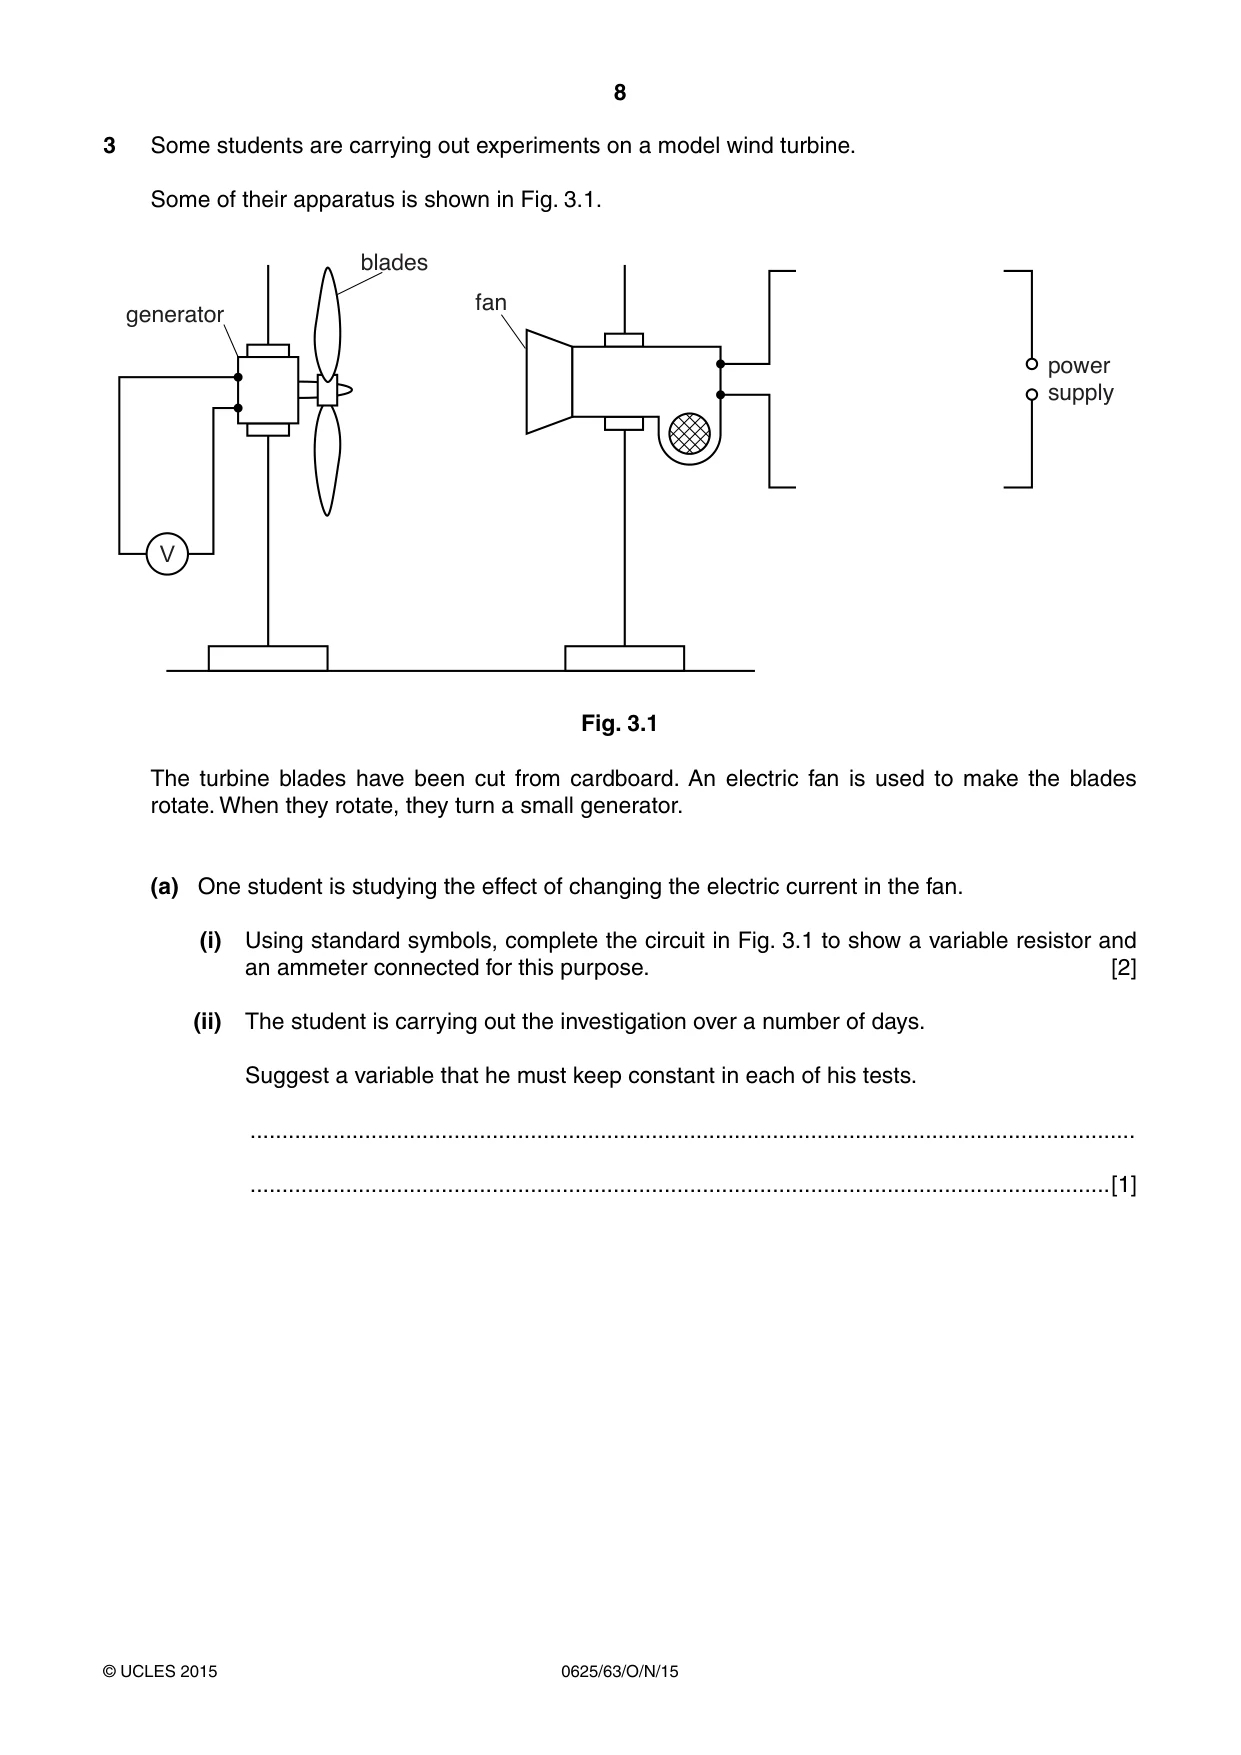
3 Some students are carrying out experiments on a model wind turbine. Some of their apparatus is shown in Fig. 3.1. EODGHV IDQ JHQHUDWRU SRZHU VXSSO\ V Fig. 3.1 The turbine blades have been cut from cardboard. An electric fan is used to make the blades rotate. When they rotate, they turn a small generator. (a) One student is studying the effect of changing the electric current in the fan. (i) Using standard symbols, complete the circuit in Fig. 3.1 to show a variable resistor and an ammeter connected for this purpose. [2] (ii) The student is carrying out the investigation over a number of days. Suggest a variable that he must keep constant in each of his tests. ........................................................................................................................................... .......................................................................................................................................[1] (b) Other students wish to test different aspects of the model wind turbine. Suggest two variables, other than that already mentioned in (a)(ii), which they could change and which would affect the output of the generator. 1. ............................................................................................................................................... ................................................................................................................................................... 2. ............................................................................................................................................... ................................................................................................................................................... [2] [Total: 5]
Mark scheme: 3 (a) (i) correct symbol for variable resistor AND ammeter [1] correctly shown in series [1] (ii) any one from: [1] • distance between fan and blades • length / area / width of blades / same blades • direction / height of fan • height of blades (b) any two from: [2] • length of blades • width of blades • number of blades • mass of blades • pitch / angle of blades • angle of turbine [Total: 5]
Q4 · The class is studying the resistance of identical wires connected in parallel
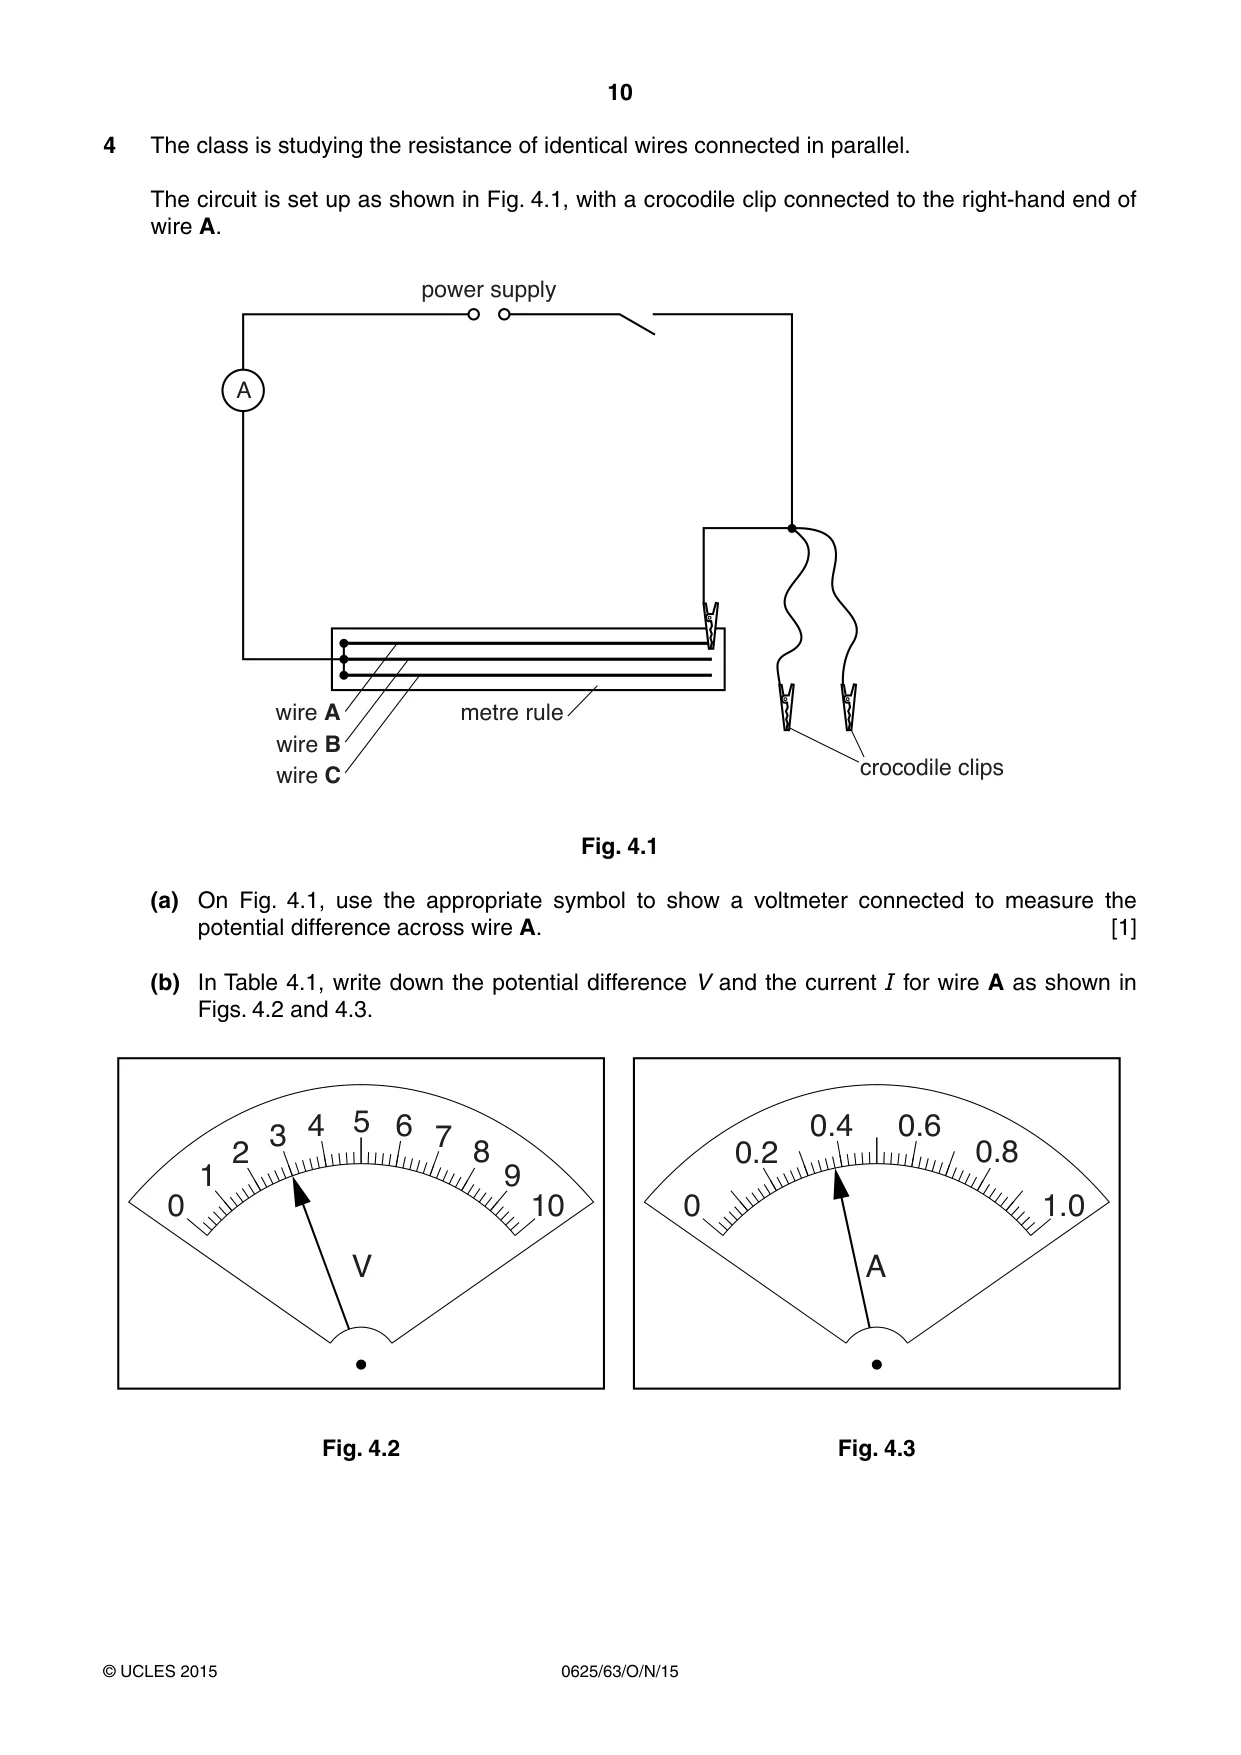
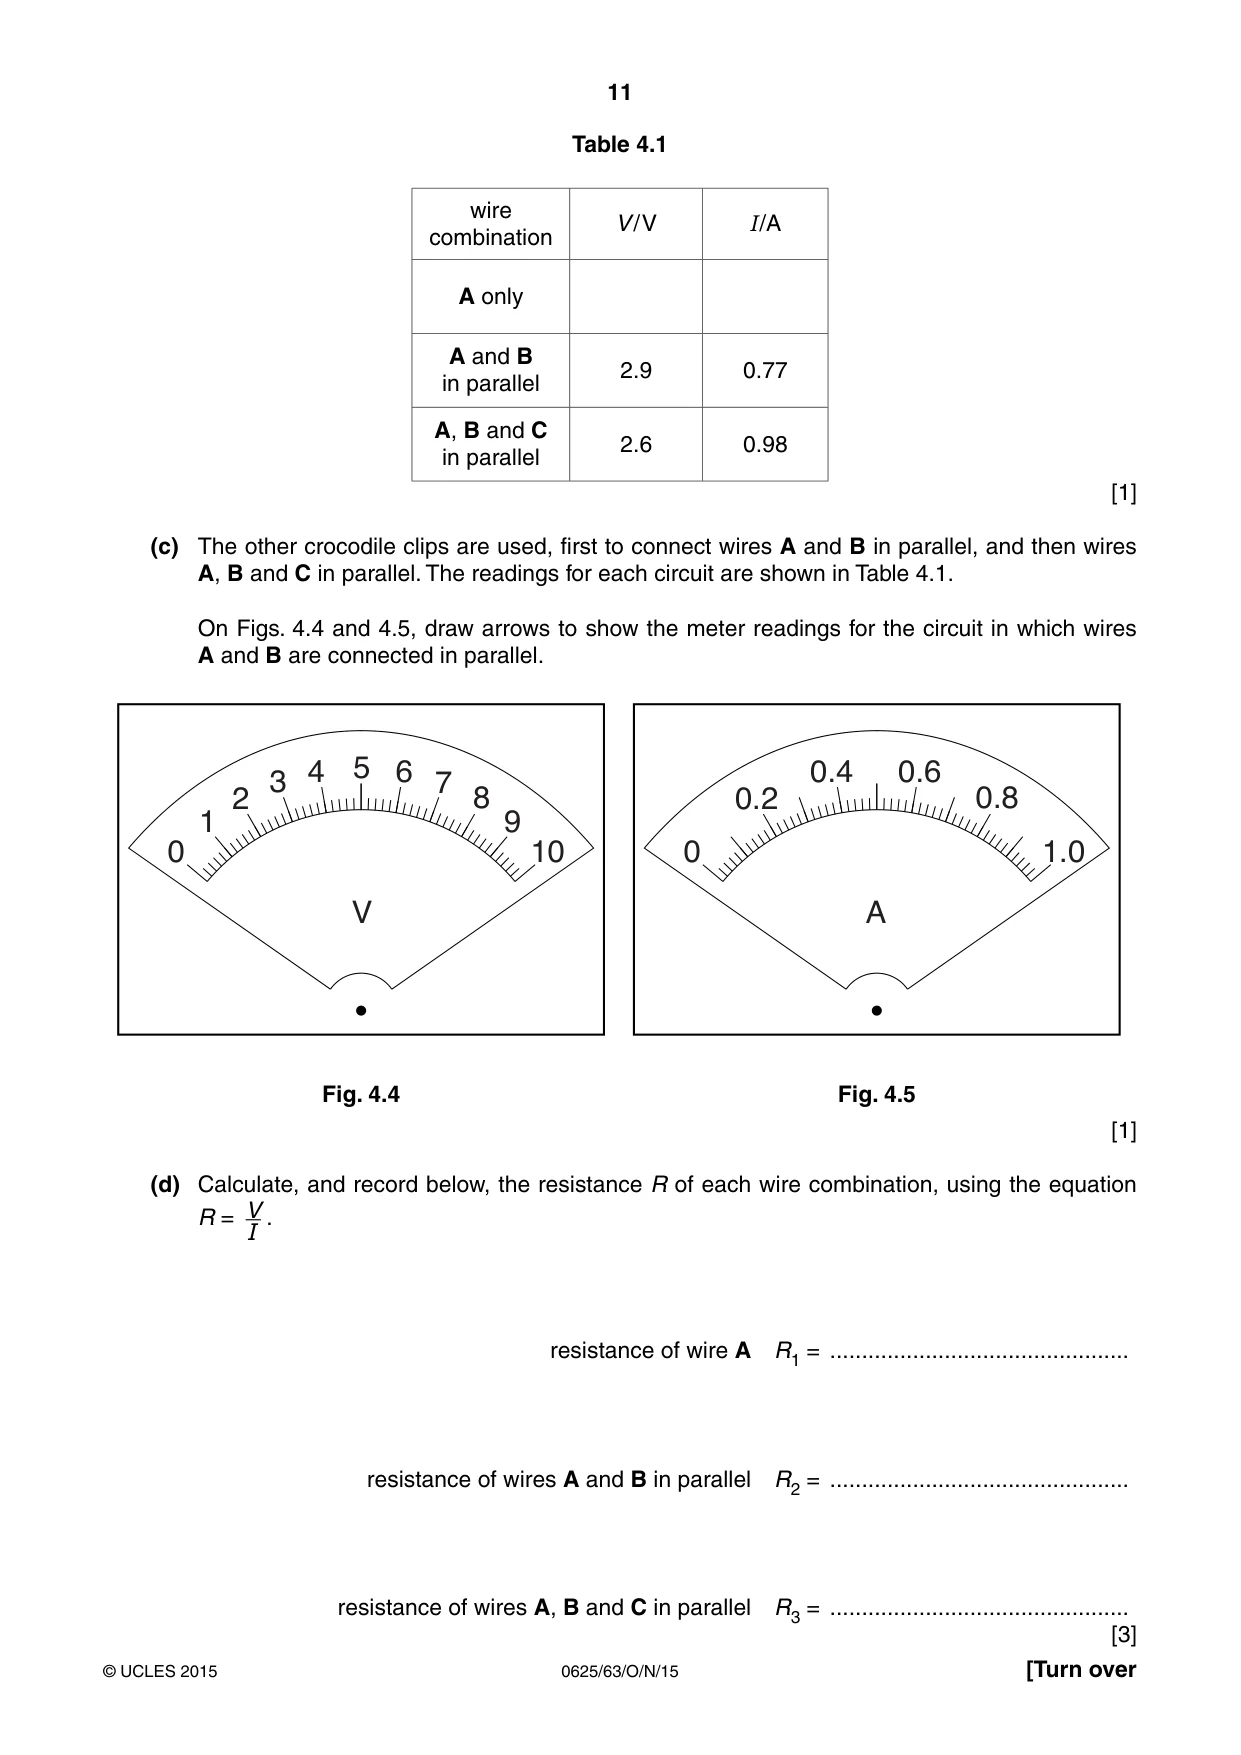
4 The class is studying the resistance of identical wires connected in parallel. The circuit is set up as shown in Fig. 4.1, with a crocodile clip connected to the right-hand end of wire A. SRZHU VXSSO\ $ ZLUH $ PHWUH UXOH ZLUH % FURFRGLOH FOLSV ZLUH & Fig. 4.1 (a) On Fig. 4.1, use the appropriate symbol to show a voltmeter connected to measure the potential difference across wire A. [1] (b) In Table 4.1, write down the potential difference V and the current I for wire A as shown in Figs. 4.2 and 4.3. 4 5 6 0.4 0.6 3 7 2 8 0.2 0.8 1 9 0 10 0 1.0 V A Fig. 4.2 Fig. 4.3 Table 4.1 wire V / V I /A combination A only A and B 2.9 0.77 in parallel A, B and C 2.6 0.98 in parallel [1] (c) The other crocodile clips are used, first to connect wires A and B in parallel, and then wires A, B and C in parallel. The readings for each circuit are shown in Table 4.1. On Figs. 4.4 and 4.5, draw arrows to show the meter readings for the circuit in which wires A and B are connected in parallel. 4 5 6 0.4 0.6 3 7 2 8 0.2 0.8 1 9 0 10 0 1.0 V A Fig. 4.4 Fig. 4.5 [1] (d) Calculate, and record below, the resistance R of each wire combination, using the equation V R = . I resistance of wire A R1 = ............................................... resistance of wires A and B in parallel R2 = ............................................... resistance of wires A, B and C in parallel R3 = ............................................... [3] (e) (i) A student suggests that when 2 identical wires are connected in parallel, their resistance should be equal to 1/2 of the resistance of a single wire. State whether your findings agree with this suggestion. Justify your answer by reference to your results, giving values to support your justification. statement .......................................................................................................................... ........................................................................................................................................... justification ........................................................................................................................ ........................................................................................................................................... [2] (ii) Use your results to suggest the relationship that should exist between R3 and R1. ........................................................................................................................................... .......................................................................................................................................[1] [Total: 9] Turn over for question 5.
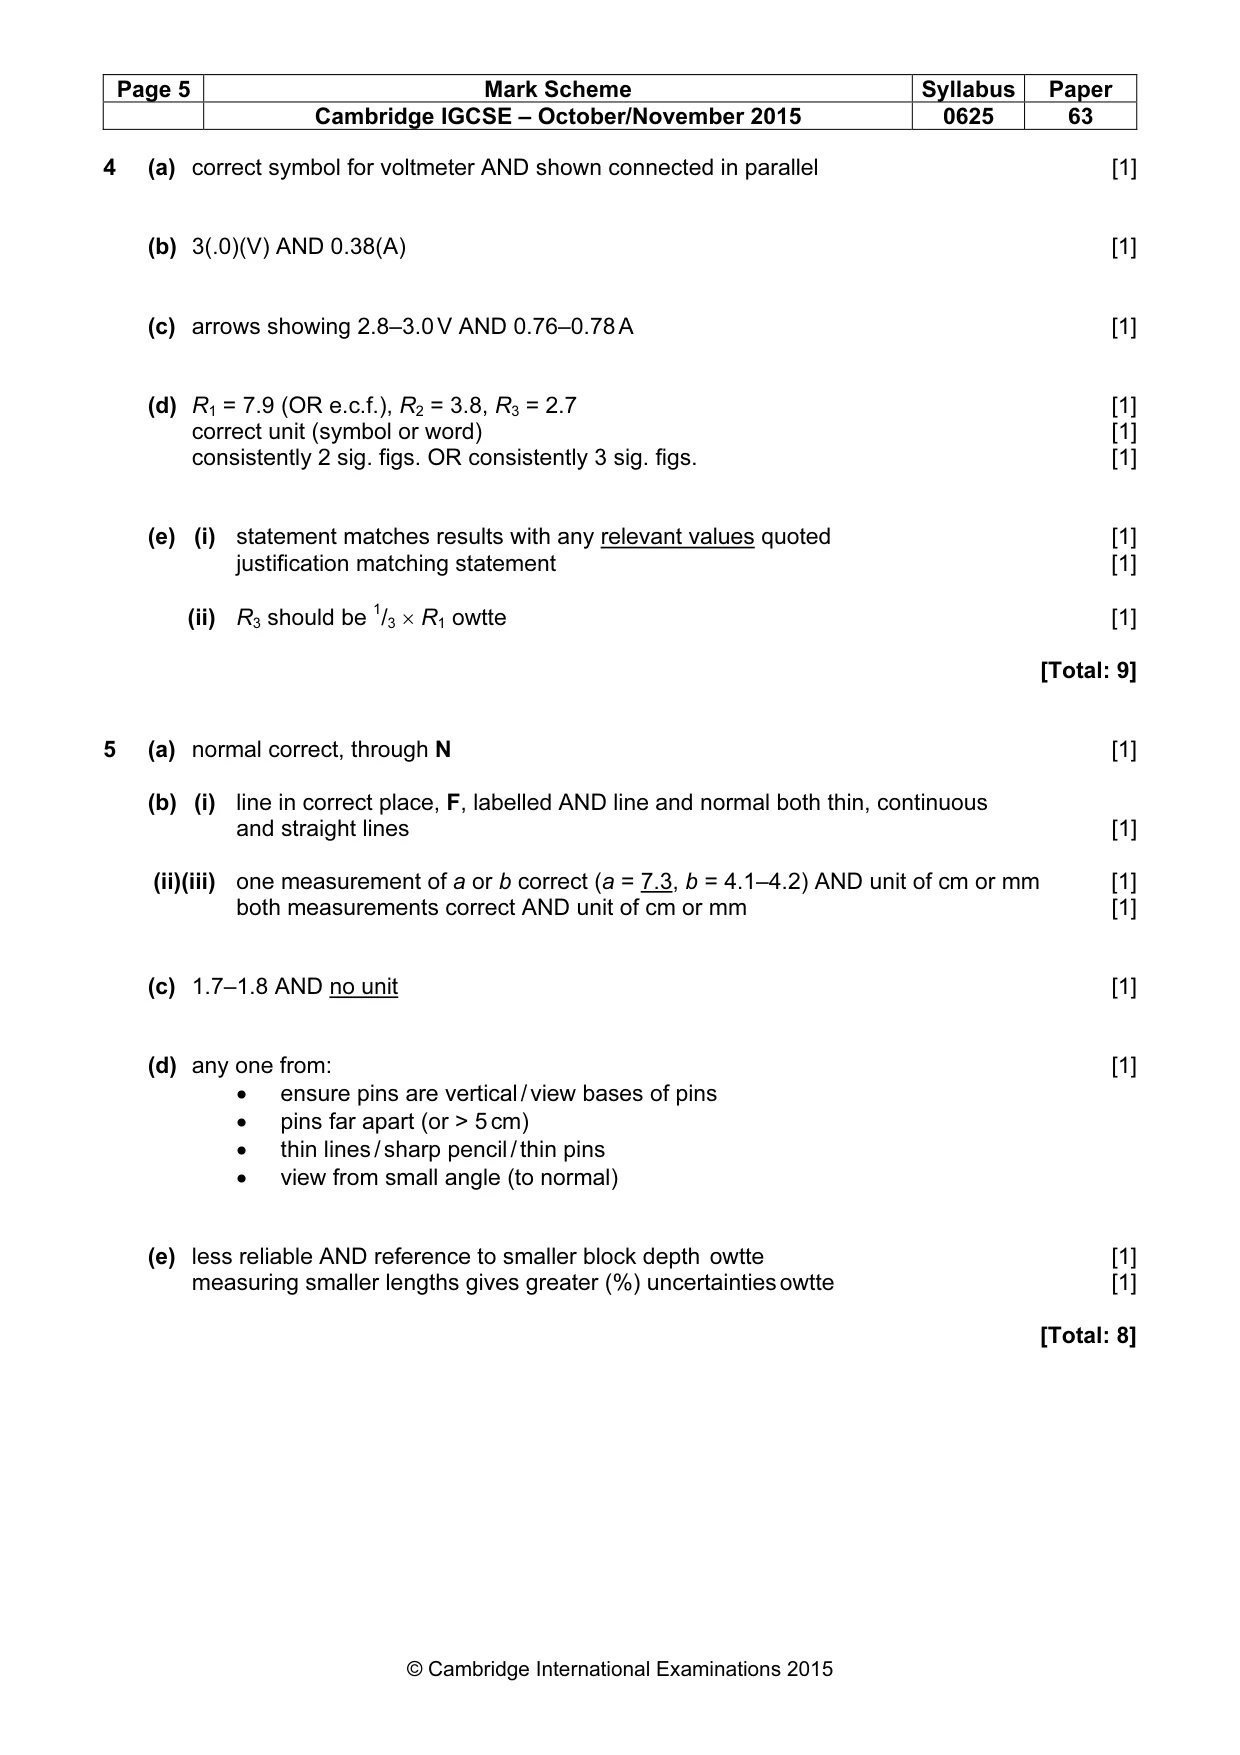
Mark scheme: 4 (a) correct symbol for voltmeter AND shown connected in parallel [1] (b) 3(.0)(V) AND 0.38(A) [1] (c) arrows showing 2.8–3.0 V AND 0.76–0.78 A [1] (d) R1 = 7.9 (OR e.c.f.), R2 = 3.8, R3 = 2.7 [1] correct unit (symbol or word) [1] consistently 2 sig. figs. OR consistently 3 sig. figs. [1] (e) (i) statement matches results with any relevant values quoted [1] justification matching statement [1] (ii) R3 should be 1/3 × R1 owtte [1] [Total: 9]
Q5 · A student is investigating the refraction of light in a transparent block
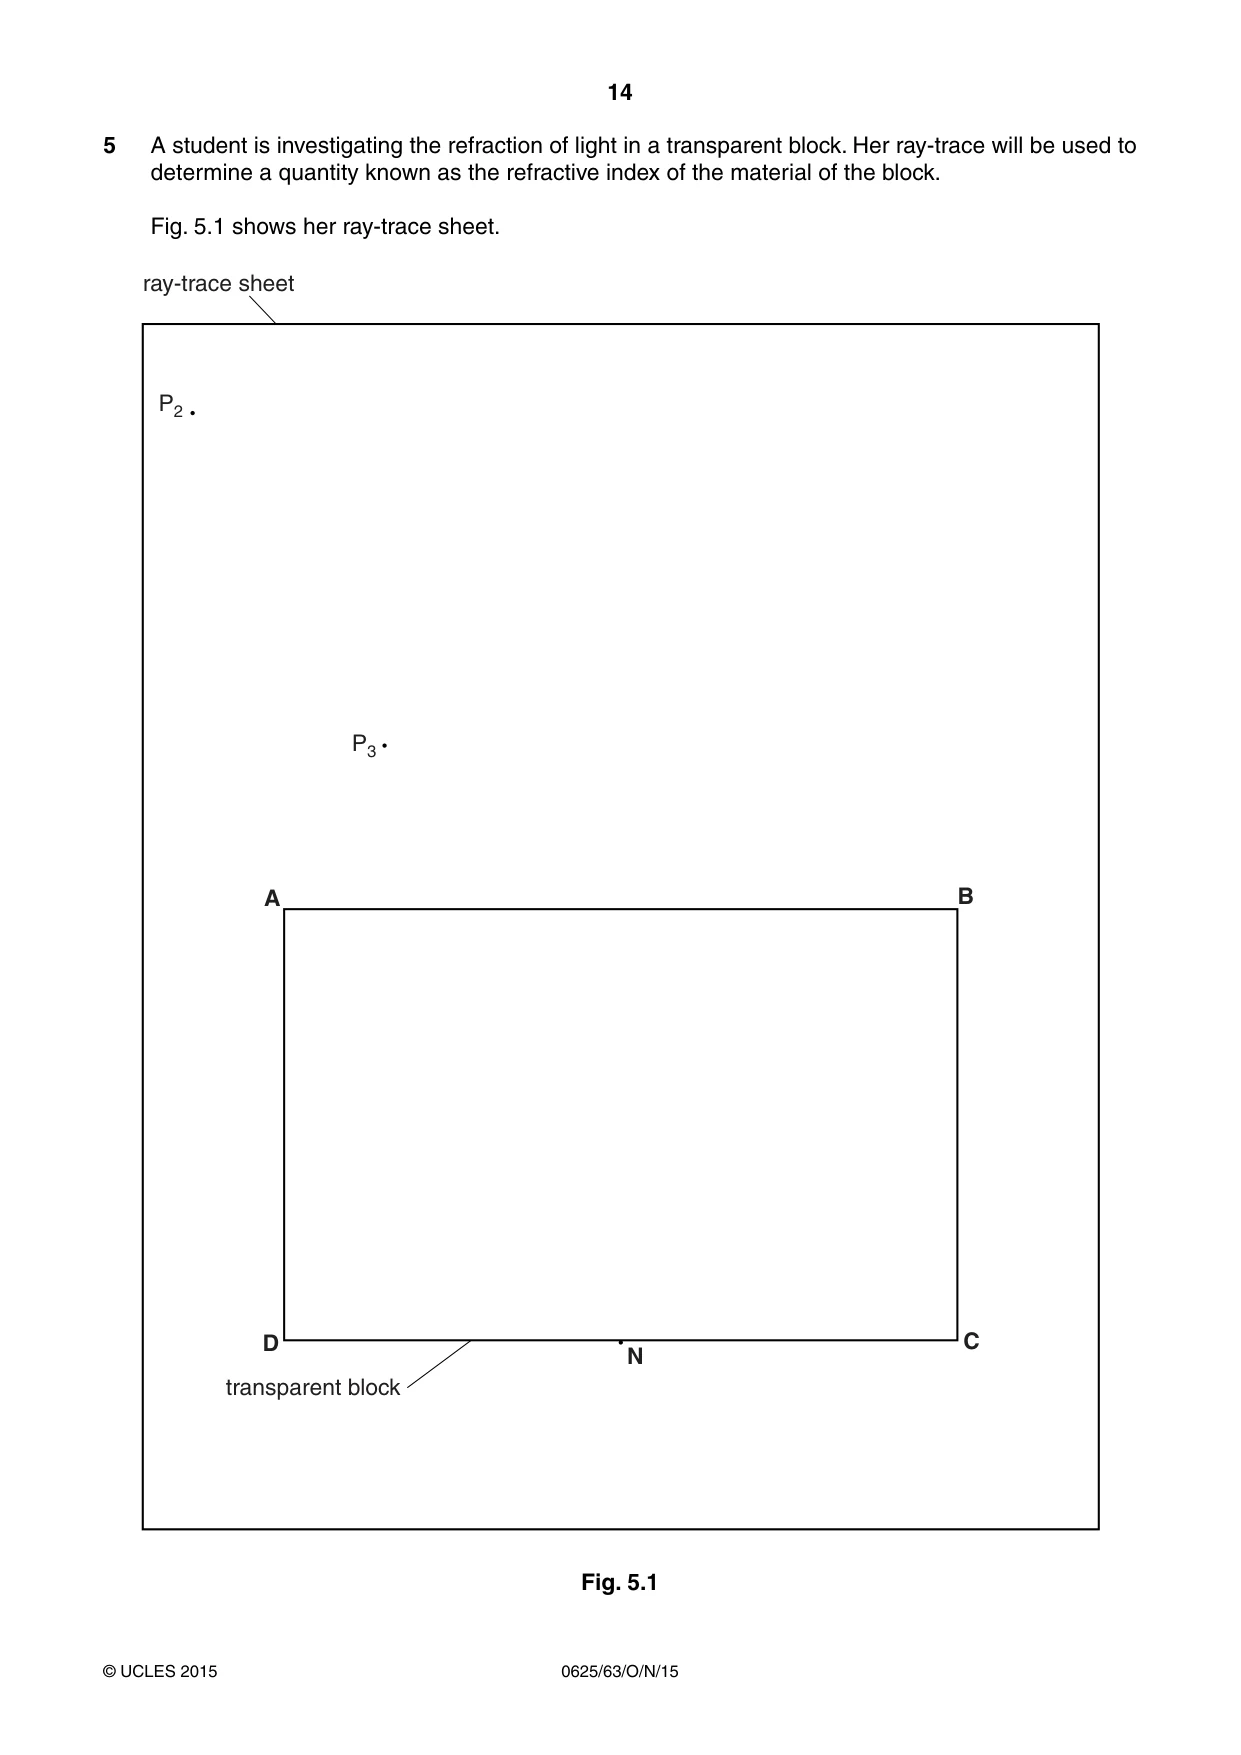
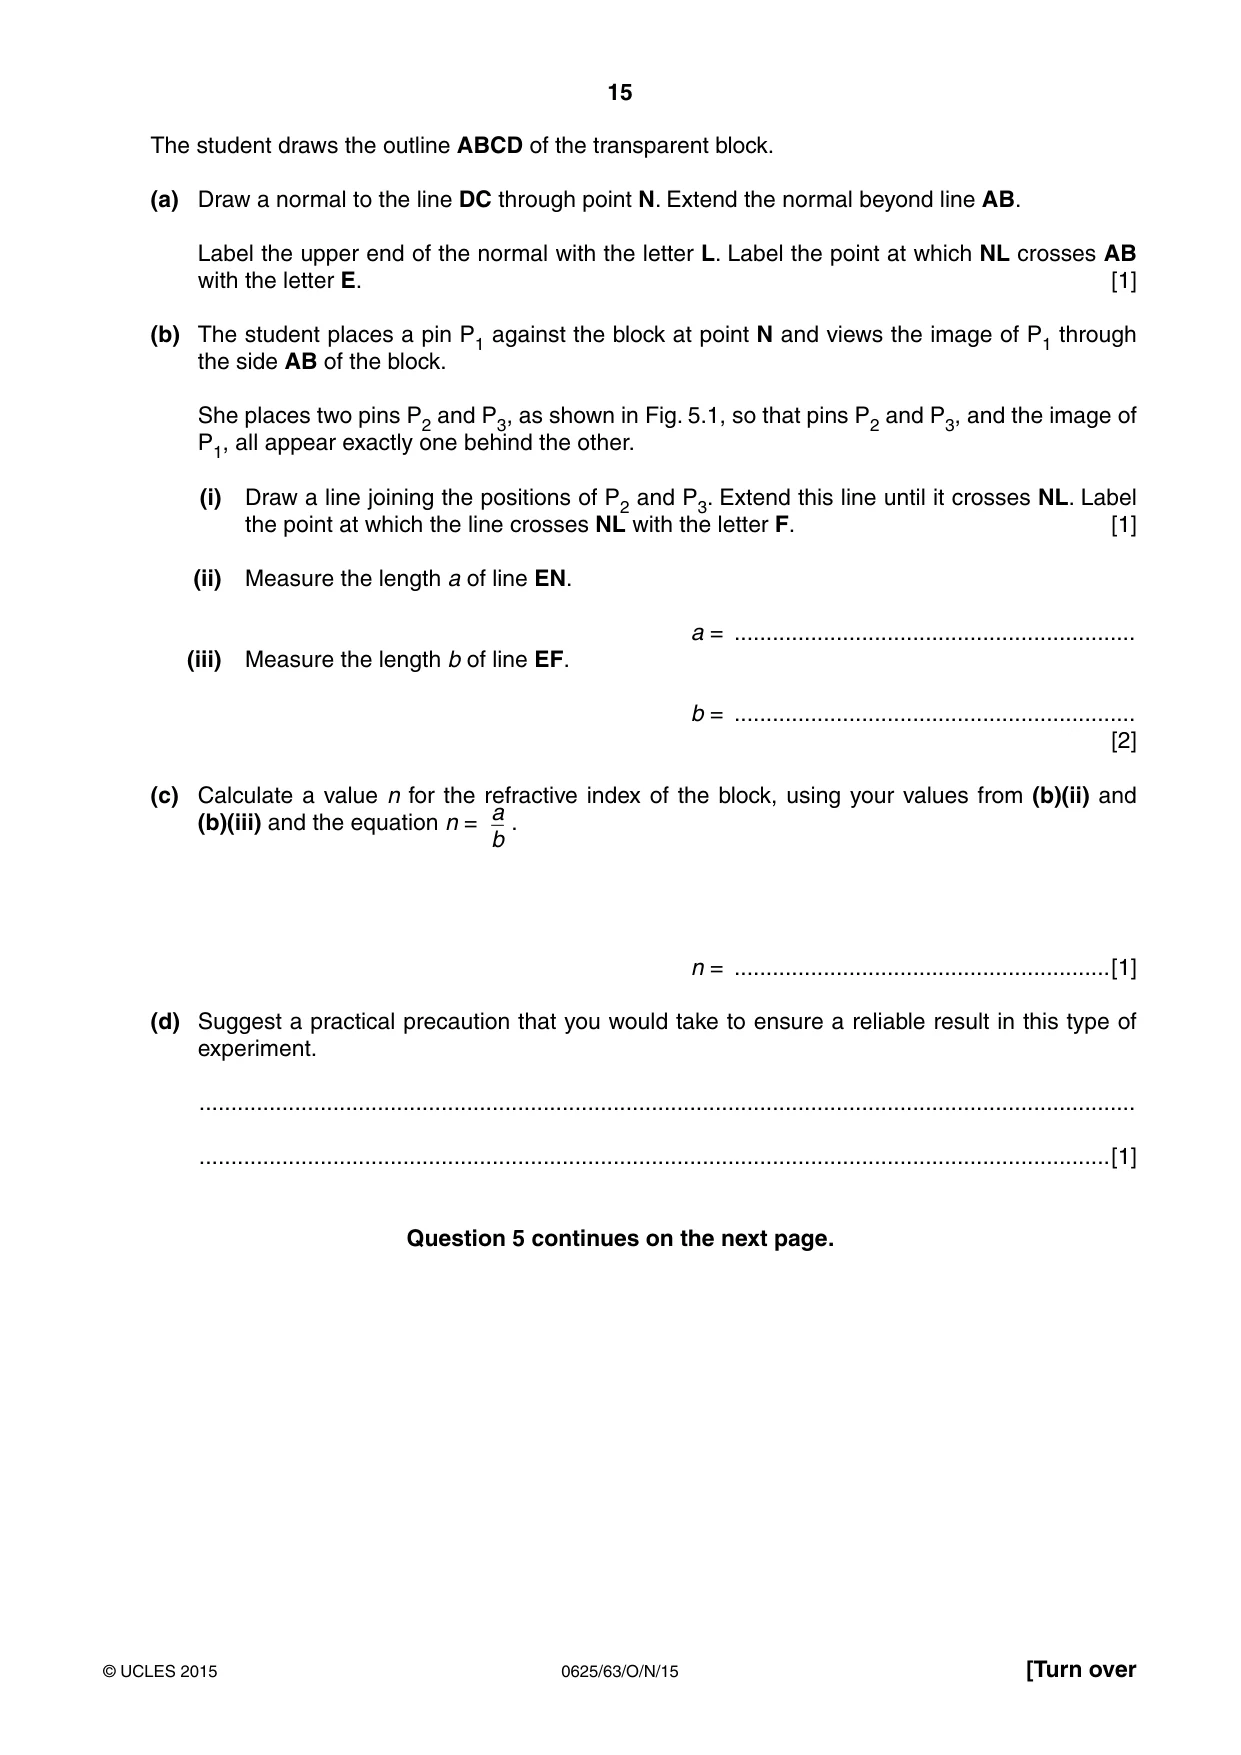
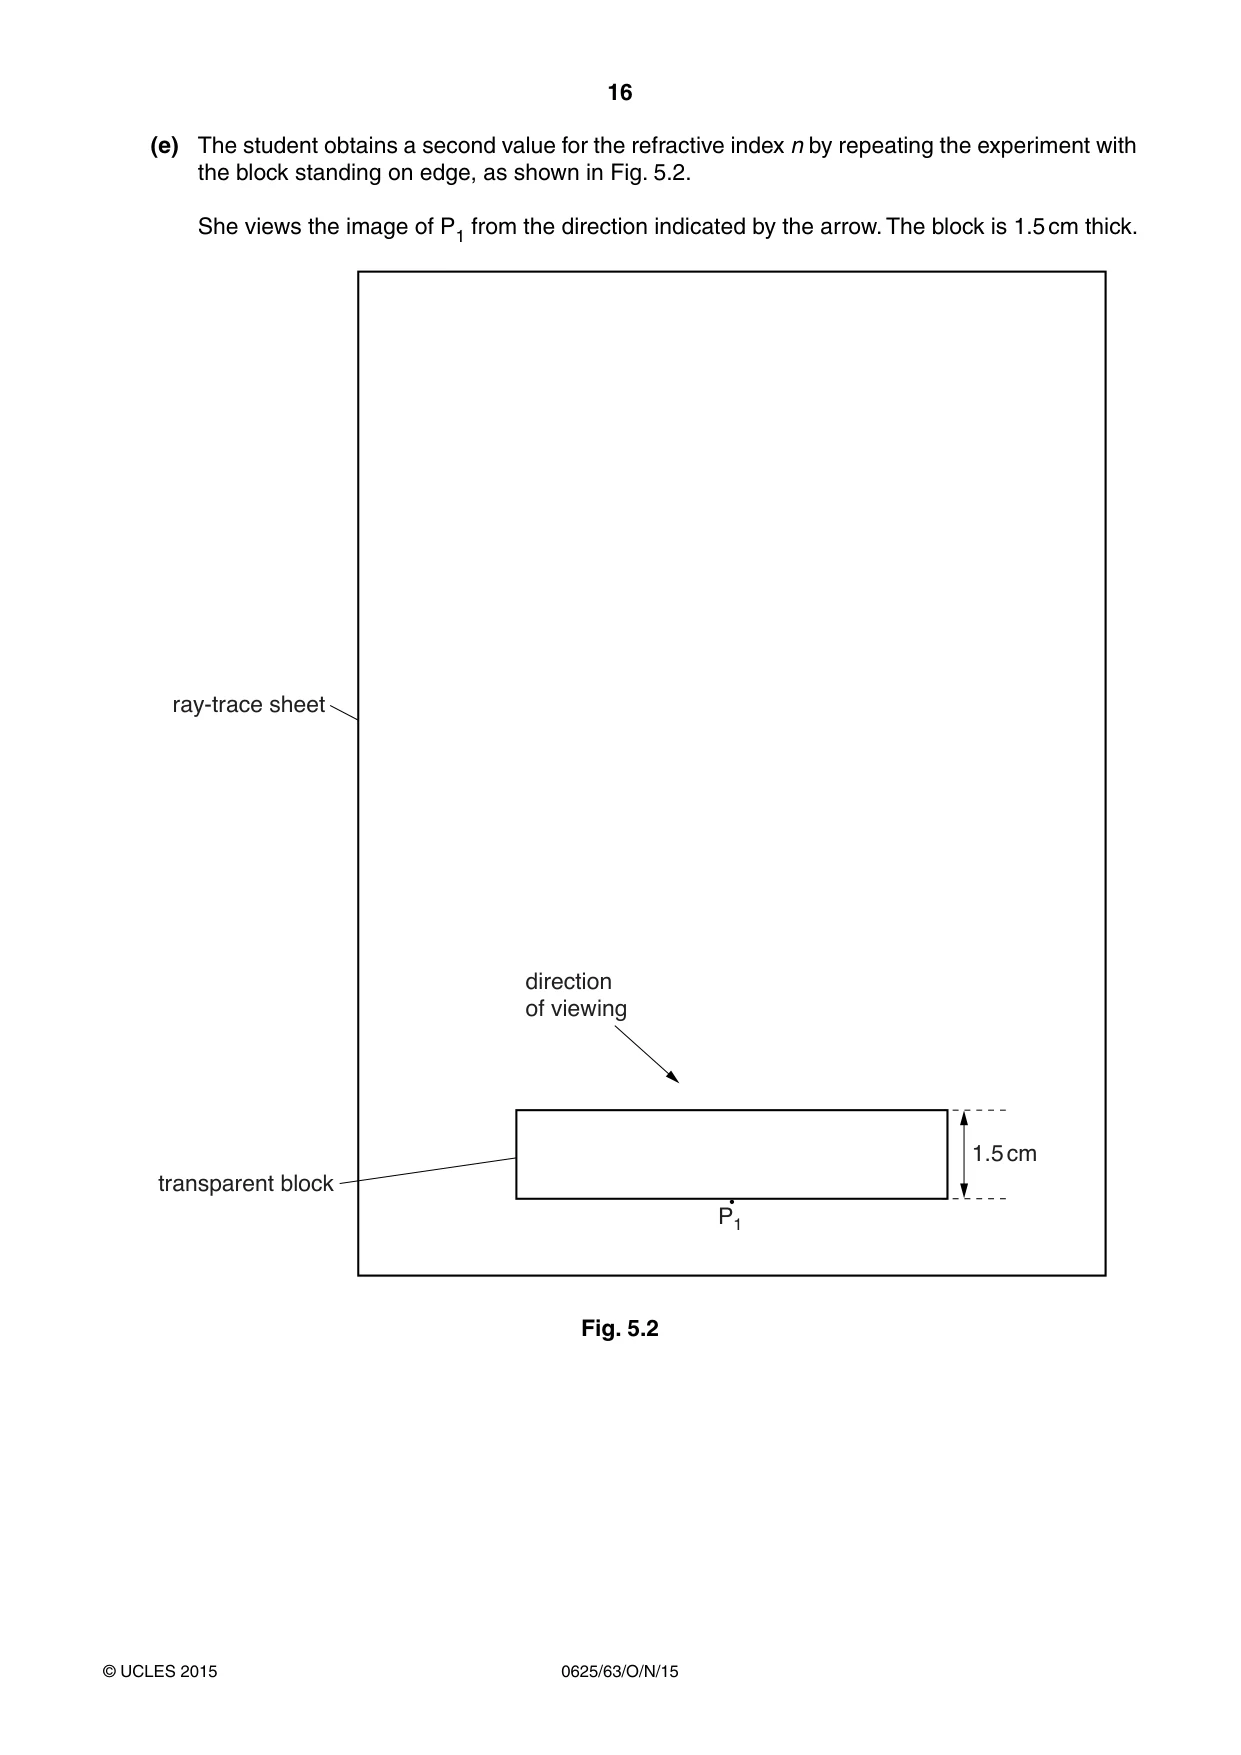
5 A student is investigating the refraction of light in a transparent block. Her ray-trace will be used to determine a quantity known as the refractive index of the material of the block. Fig. 5.1 shows her ray-trace sheet. ray-trace sheet P2 P3 A B D C N transparent block Fig. 5.1 The student draws the outline ABCD of the transparent block. (a) Draw a normal to the line DC through point N. Extend the normal beyond line AB. Label the upper end of the normal with the letter L. Label the point at which NL crosses AB with the letter E. [1] (b) The student places a pin P1 against the block at point N and views the image of P1 through the side AB of the block. She places two pins P2 and P3, as shown in Fig. 5.1, so that pins P2 and P3, and the image of P1, all appear exactly one behind the other. (i) Draw a line joining the positions of P2 and P3. Extend this line until it crosses NL. Label the point at which the line crosses NL with the letter F. [1] (ii) Measure the length a of line EN. a = ............................................................... (iii) Measure the length b of line EF. b = ............................................................... [2] (c) Calculate a value n for the refractive index of the block, using your values from (b)(ii) and a (b)(iii) and the equation n = . b n = ...........................................................[1] (d) Suggest a practical precaution that you would take to ensure a reliable result in this type of experiment. ................................................................................................................................................... ...............................................................................................................................................[1] Question 5 continues on the next page. (e) The student obtains a second value for the refractive index n by repeating the experiment with the block standing on edge, as shown in Fig. 5.2. She views the image of P1 from the direction indicated by the arrow. The block is 1.5 cm thick. UD\ WUDFH VKHHW GLUHFWLRQ RI YLHZLQJ WUDQVSDUHQW EORFN 3 Fig. 5.2
Mark scheme: 5 (a) normal correct, through N [1] (b) (i) line in correct place, F, labelled AND line and normal both thin, continuous and straight lines [1] (ii)(iii) one measurement of a or b correct (a = 7.3, b = 4.1–4.2) AND unit of cm or mm [1] both measurements correct AND unit of cm or mm [1] (c) 1.7–1.8 AND no unit [1] (d) any one from: [1] • ensure pins are vertical / view bases of pins • pins far apart (or > 5 cm) • thin lines / sharp pencil / thin pins • view from small angle (to normal) (e) less reliable AND reference to smaller block depth owtte [1] measuring smaller lengths gives greater (%) uncertainties owtte [1] [Total: 8]
What was in this paper
The subtopics covered by these 5 questions, and how many questions each got. Open one in a new tab to see every Cambridge question on it.
What you needed in this session
Cambridge’s own grade thresholds for 2015 Oct/Nov, Paper 6 · Variant 3. A higher threshold means an easier paper — the bar moves with how the cohort did.