Cambridge IGCSE Physics 0625 — 2015 Oct/Nov Paper 5 · Variant 1
0625/51/O/N/15 · 4 questions · 40 marks · ≈45 min
The question paper and its mark scheme, free to read here and free to download. This is Cambridge’s own paper, exactly as it was sat.
Question paper12 pages
Mark scheme4 pages
Answers below. Sit the paper first if you are practising.
Questions as text
Q1 · In this experiment, you will investigate two different types of pendulum
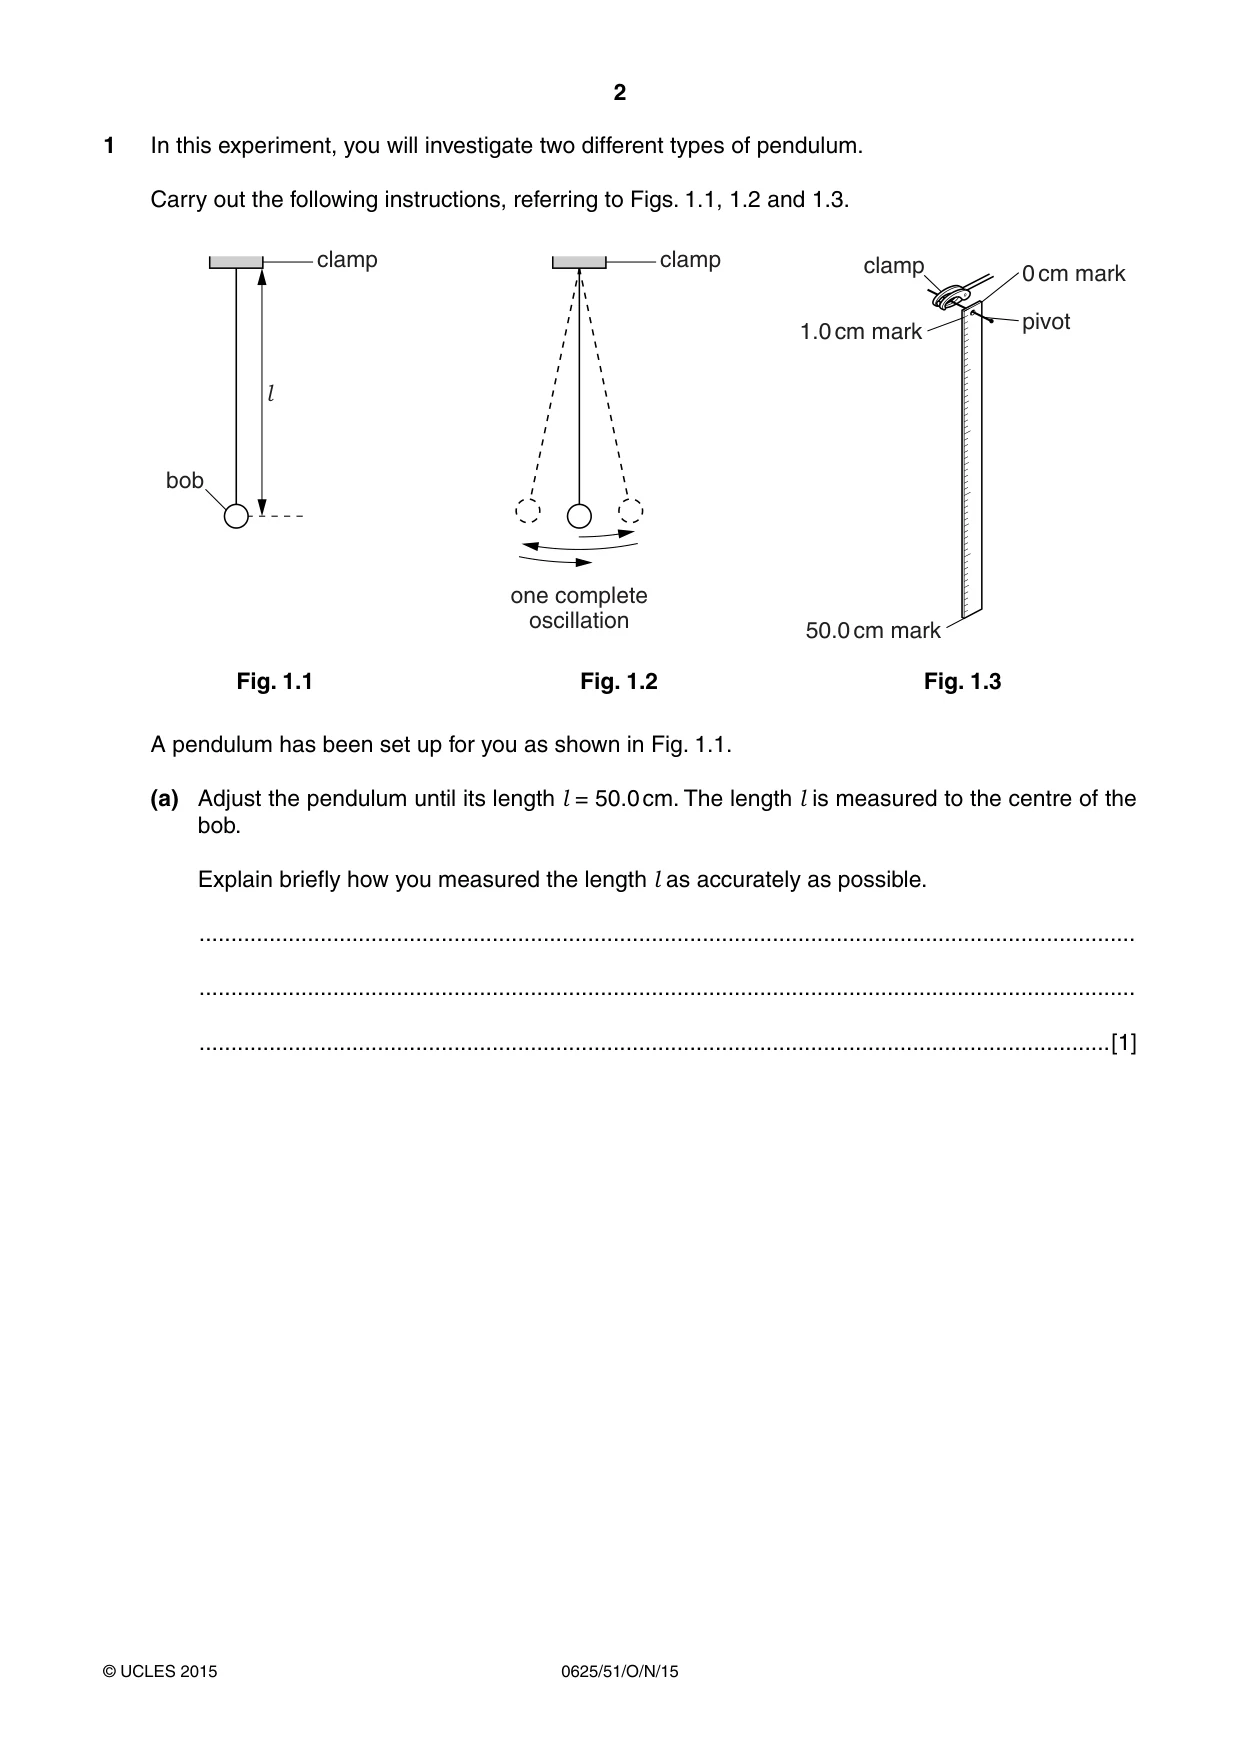
1 In this experiment, you will investigate two different types of pendulum. Carry out the following instructions, referring to Figs. 1.1, 1.2 and 1.3. clamp clamp clamp 0 cm mark pivot 1.0 cm mark l bob one complete oscillation 50.0 cm mark Fig. 1.1 Fig. 1.2 Fig. 1.3 A pendulum has been set up for you as shown in Fig. 1.1. (a) Adjust the pendulum until its length l = 50.0 cm. The length l is measured to the centre of the bob. Explain briefly how you measured the length l as accurately as possible. ................................................................................................................................................... ................................................................................................................................................... ...............................................................................................................................................[1] (b) (i) Displace the pendulum bob slightly and release it so that it swings. Measure the time tS for 20 complete oscillations of the pendulum (see Fig. 1.2). tS = ...........................................................[1] (ii) Calculate the period TS of the pendulum. The period is the time for one complete oscillation. TS = ...........................................................[2] (iii) Explain why measuring the time for 20 swings, rather than for 1 swing, gives a more accurate value for TS. ........................................................................................................................................... ........................................................................................................................................... .......................................................................................................................................[1] (c) The pendulum shown in Fig. 1.3 is a solid strip of length 50.0 cm. It has been set up for you. (i) Displace this pendulum slightly and release it so that it swings. Measure the time tC for 20 complete oscillations of the pendulum. tC = ............................................................... (ii) Calculate the period TC of the pendulum. The period is the time for one complete oscillation. TC = ............................................................... [2] (d) A student suggests that TC should be equal to TS. State whether your results support this suggestion. Justify your answer by reference to the results. statement .................................................................................................................................. justification ................................................................................................................................ ................................................................................................................................................... ................................................................................................................................................... [2] (e) Assume that the length l of the first pendulum has been measured accurately and that the length of the strip that forms the second pendulum is exactly 50.0 cm long. Suggest why it may not be fair to state that both pendulums have the same length l = 50.0 cm. ................................................................................................................................................... ...............................................................................................................................................[1] [Total: 10]
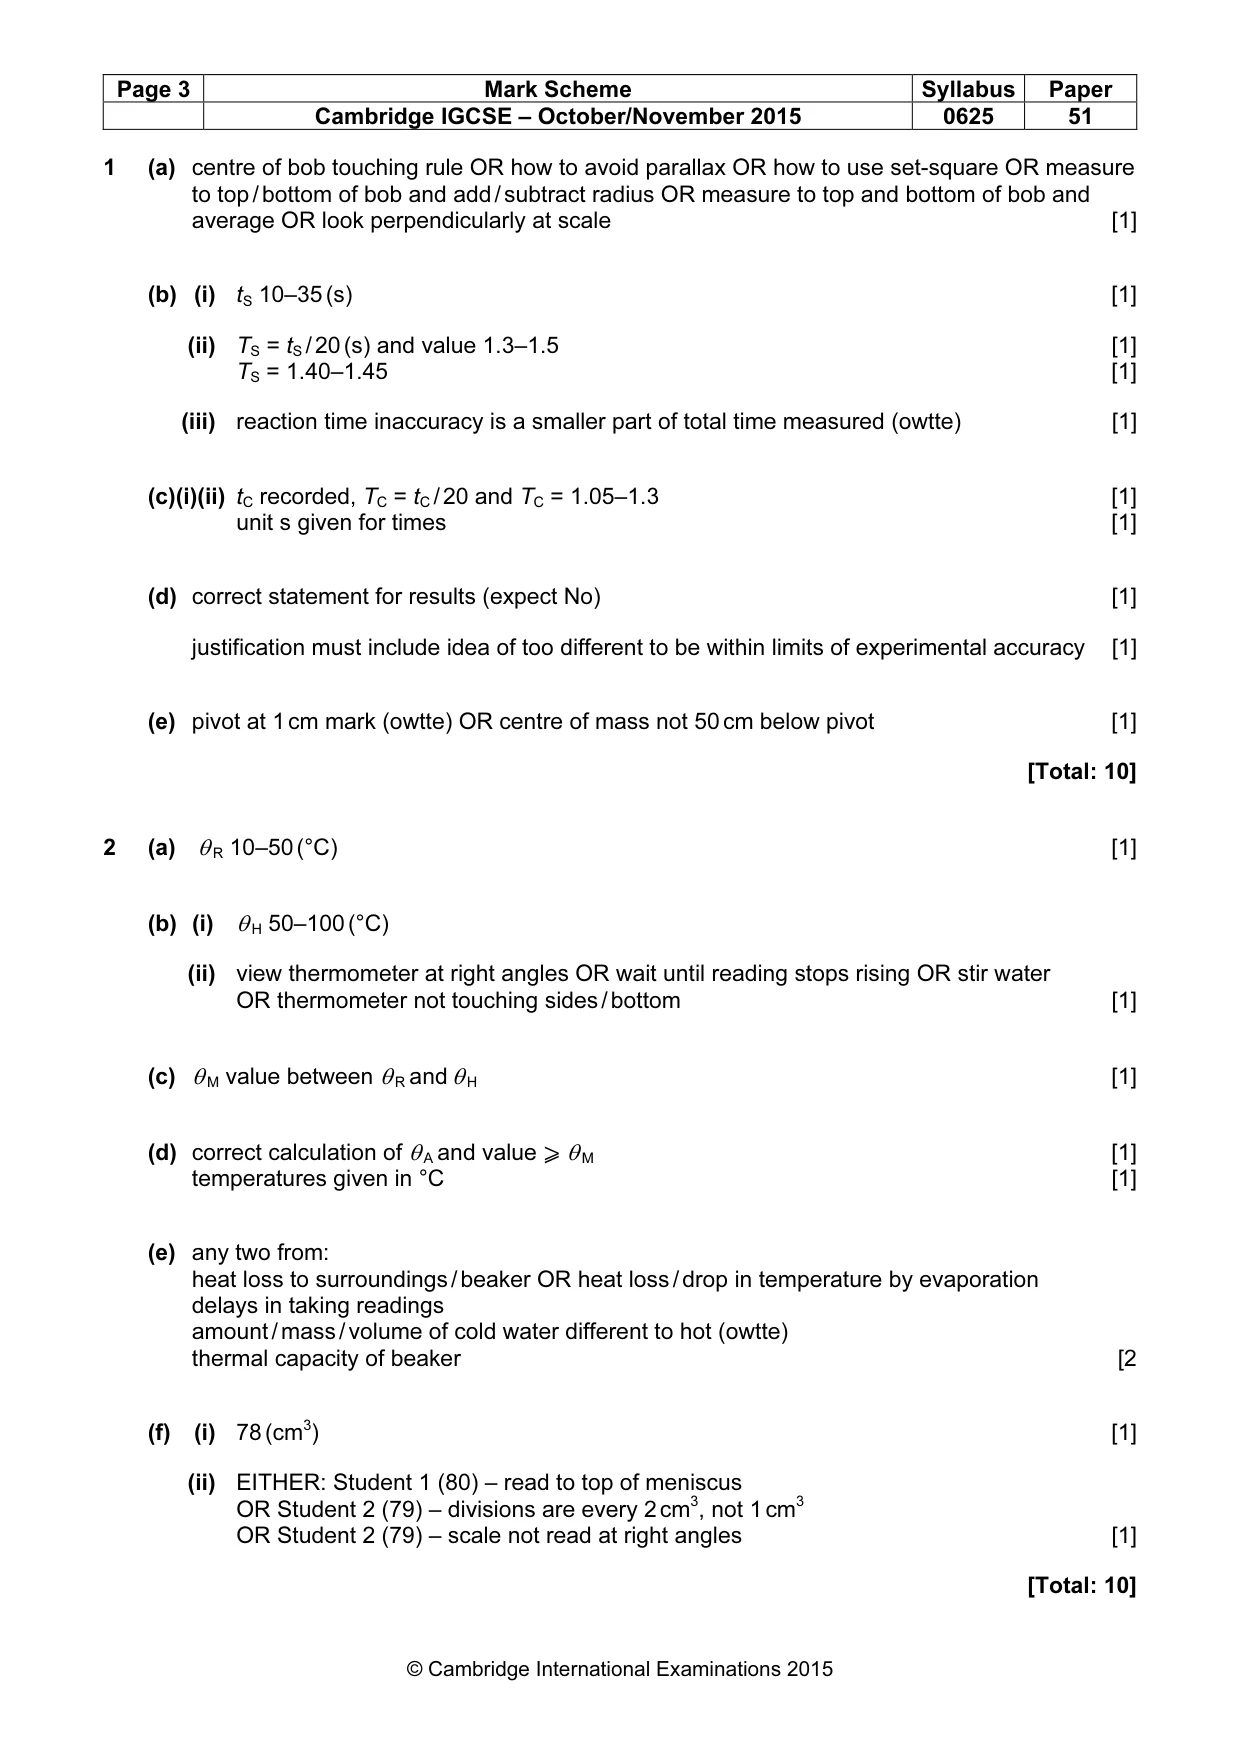
Mark scheme: 1 (a) centre of bob touching rule OR how to avoid parallax OR how to use set-square OR measure to top / bottom of bob and add / subtract radius OR measure to top and bottom of bob and average OR look perpendicularly at scale [1] (b) (i) tS 10–35 (s) [1] (ii) TS = tS / 20 (s) and value 1.3–1.5 [1] TS = 1.40–1.45 [1] (iii) reaction time inaccuracy is a smaller part of total time measured (owtte) [1] (c)(i)(ii) tC recorded, TC = tC / 20 and TC = 1.05–1.3 [1] unit s given for times [1] (d) correct statement for results (expect No) [1] justification must include idea of too different to be within limits of experimental accuracy [1] (e) pivot at 1 cm mark (owtte) OR centre of mass not 50 cm below pivot [1] [Total: 10]
More questions on Physical quantities and measurement techniques
Q2 · In this experiment, you will investigate the cooling of water
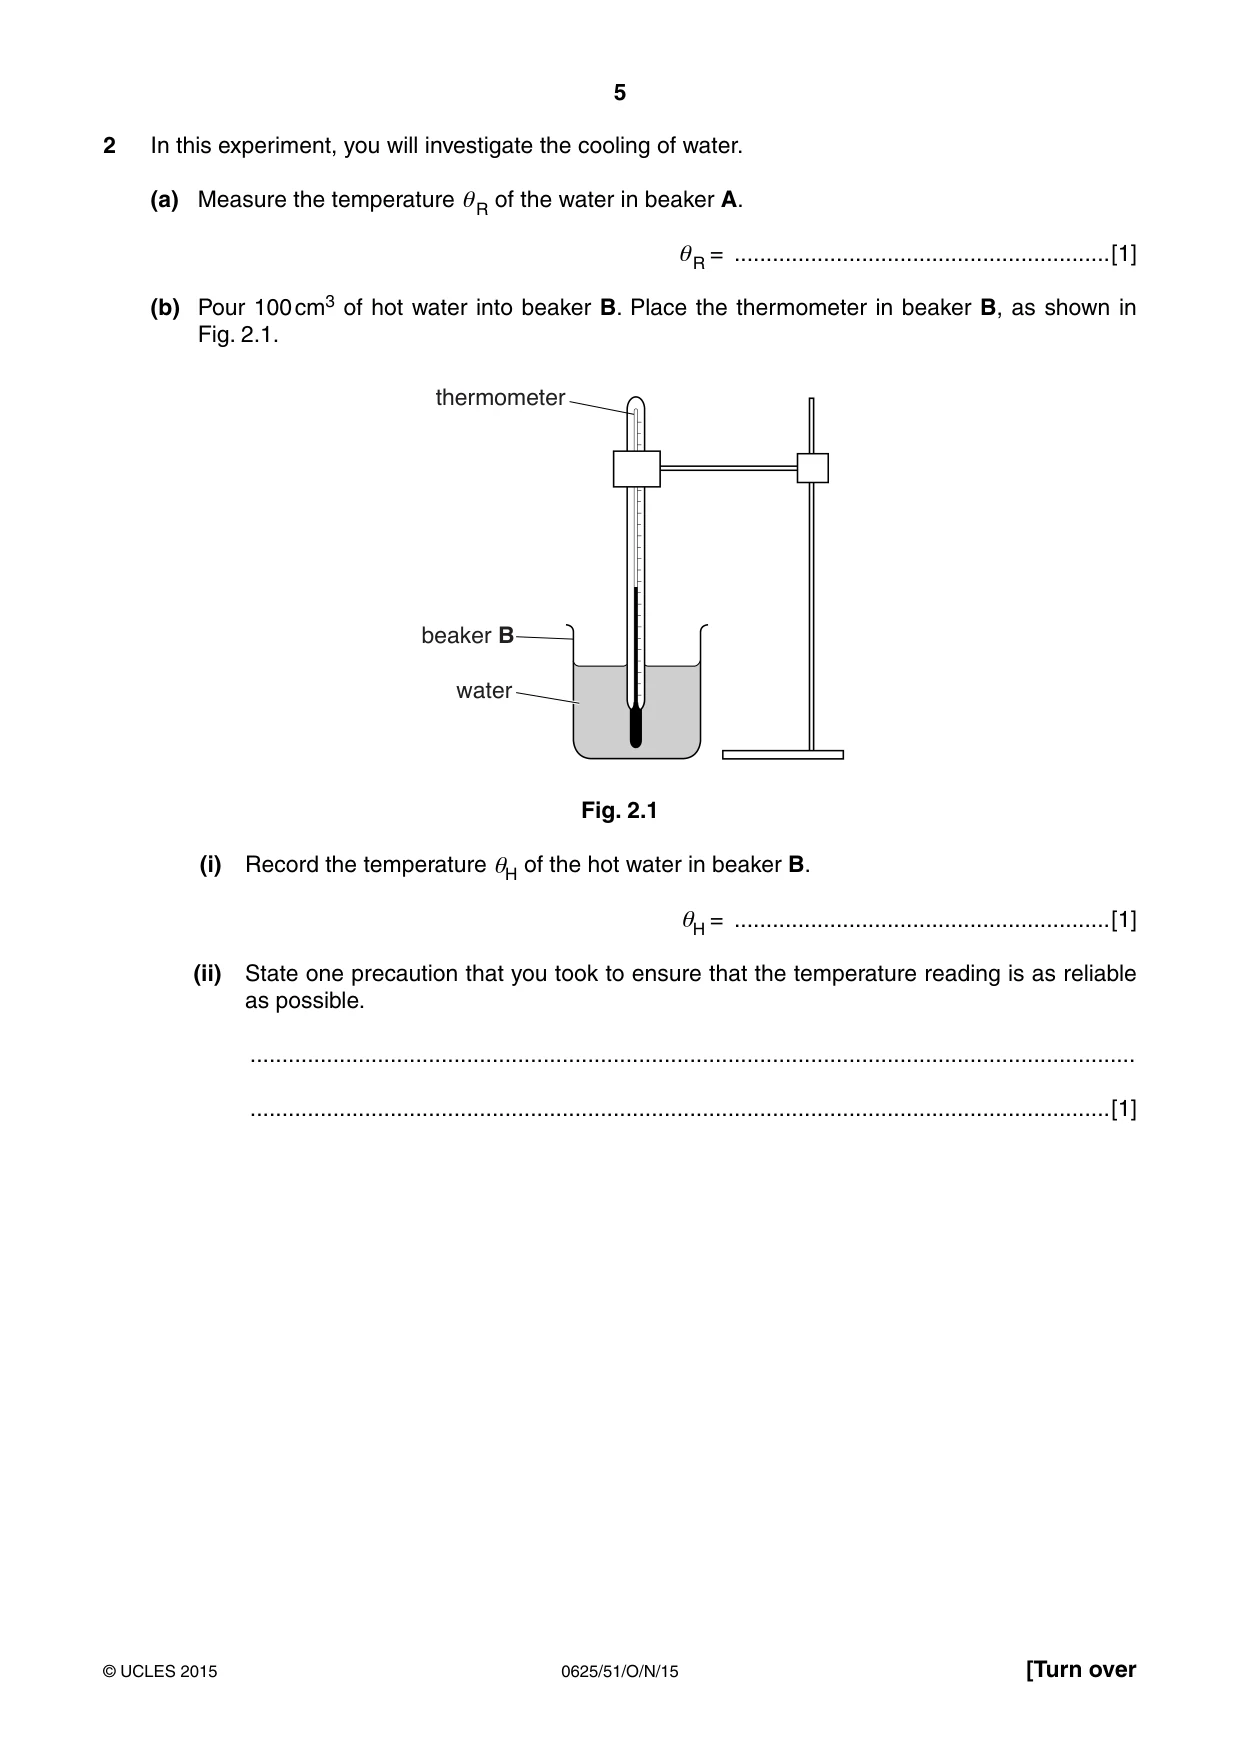
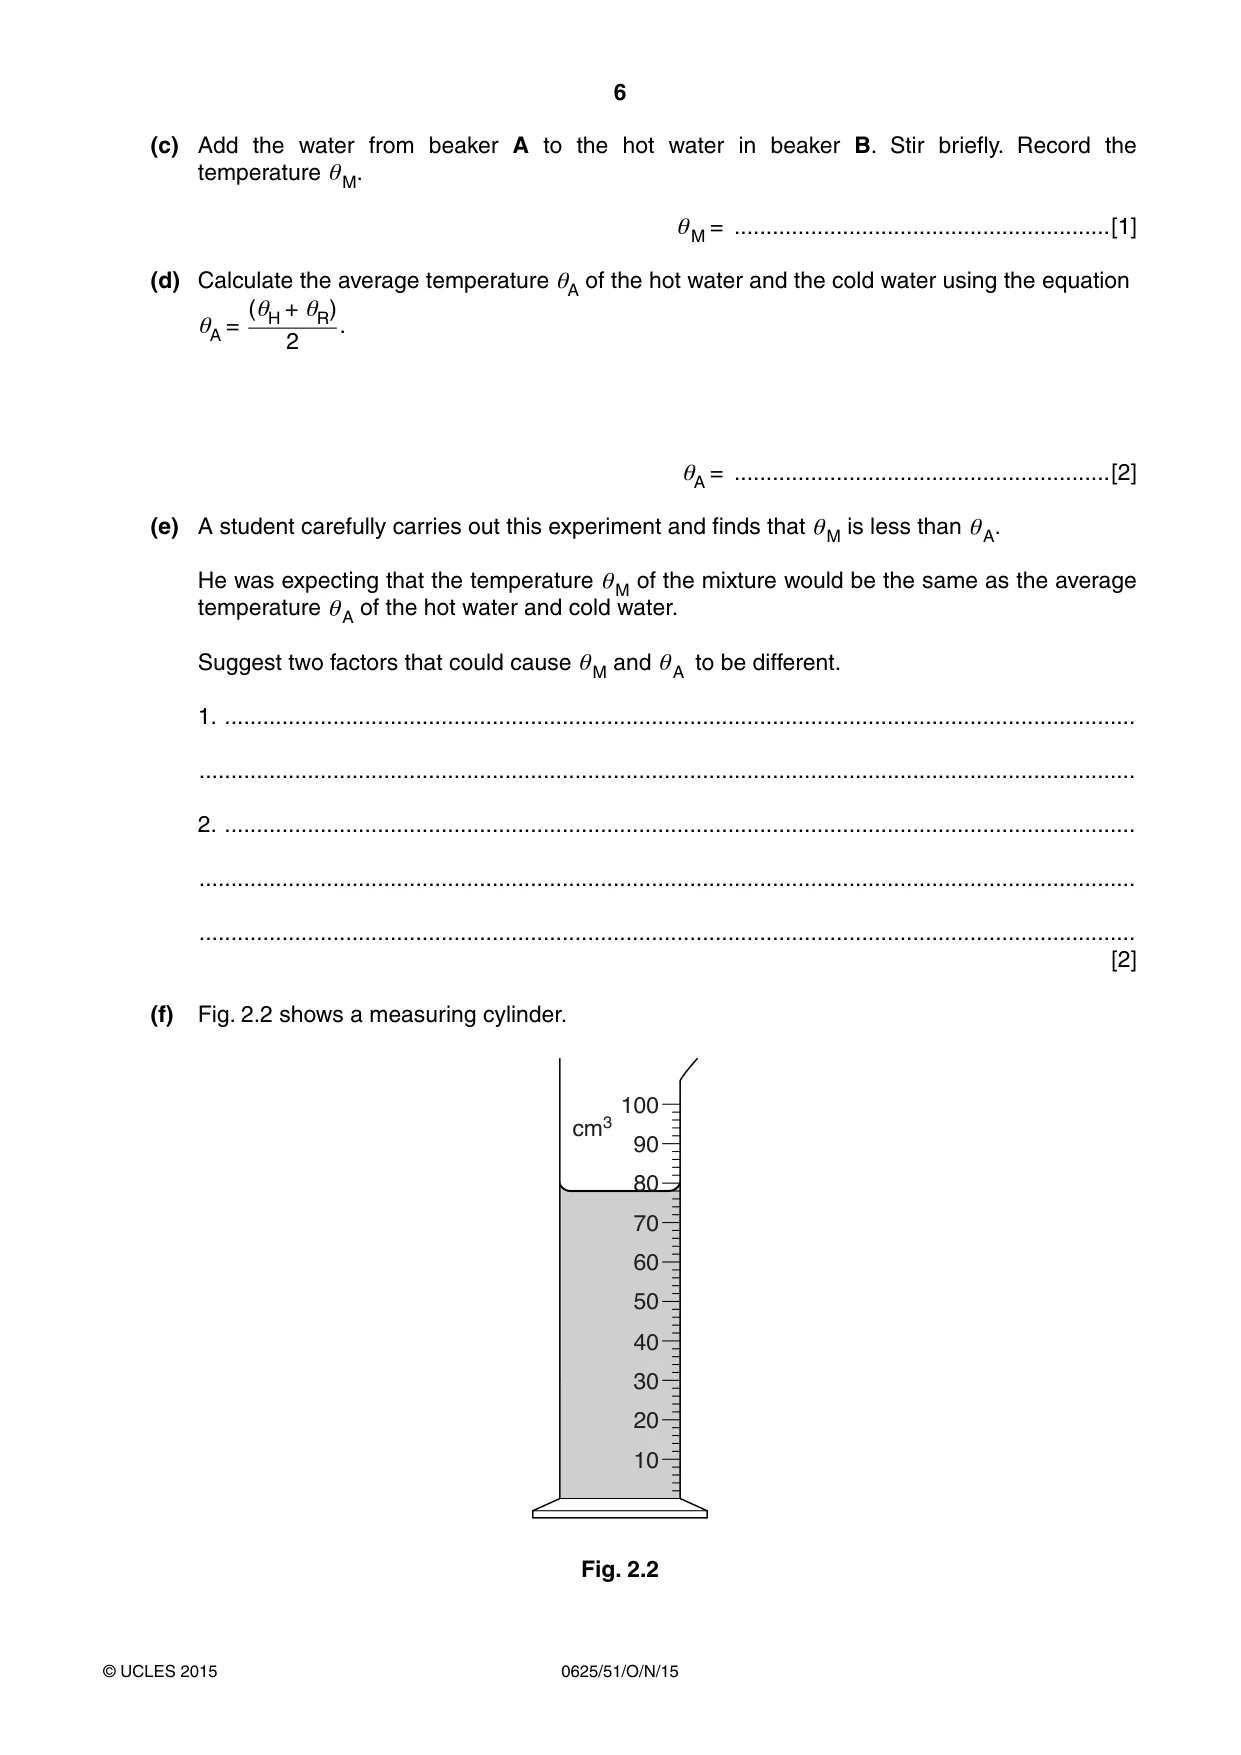
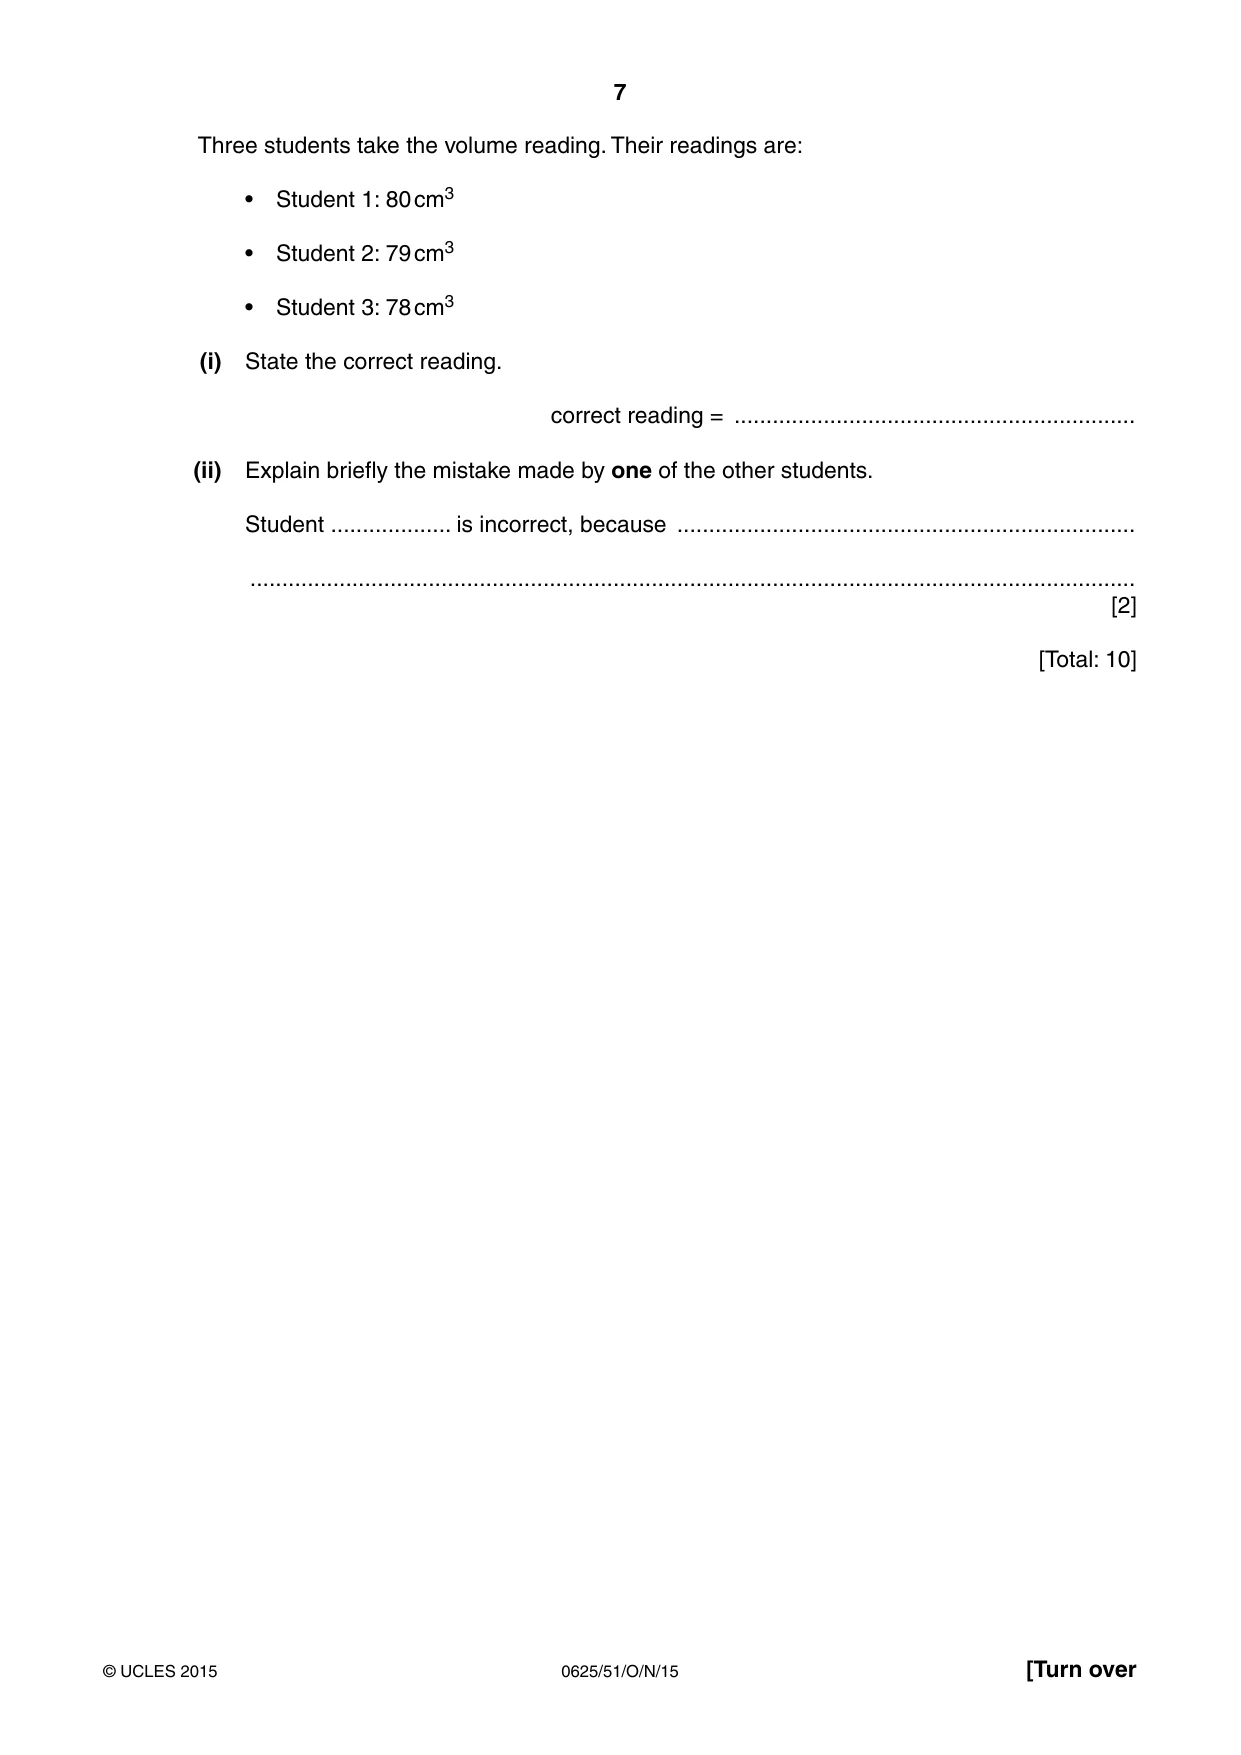
2 In this experiment, you will investigate the cooling of water. (a) Measure the temperature θR of the water in beaker A. θR = ...........................................................[1] (b) Pour 100 cm3 of hot water into beaker B. Place the thermometer in beaker B, as shown in Fig. 2.1. thermometer beaker B water Fig. 2.1 (i) Record the temperature θH of the hot water in beaker B. θH = ...........................................................[1] (ii) State one precaution that you took to ensure that the temperature reading is as reliable as possible. ........................................................................................................................................... .......................................................................................................................................[1] (c) Add the water from beaker A to the hot water in beaker B. Stir briefly. Record the temperature θM. θM = ...........................................................[1] (d) Calculate the average temperature θA of the hot water and the cold water using the equation (θH + θR) θA = . 2 θA = ...........................................................[2] (e) A student carefully carries out this experiment and finds that θM is less than θA. He was expecting that the temperature θM of the mixture would be the same as the average temperature θA of the hot water and cold water. Suggest two factors that could cause θM and θA to be different. 1. ............................................................................................................................................... ................................................................................................................................................... 2. ............................................................................................................................................... ................................................................................................................................................... ................................................................................................................................................... [2] (f) Fig. 2.2 shows a measuring cylinder. 100 cm3 90 80 70 60 50 40 30 20 10 Fig. 2.2 Three students take the volume reading. Their readings are: • Student 1: 80 cm3 • Student 2: 79 cm3 • Student 3: 78 cm3 (i) State the correct reading. correct reading = ............................................................... (ii) Explain briefly the mistake made by one of the other students. Student ................... is incorrect, because ........................................................................ ........................................................................................................................................... [2] [Total: 10]
Mark scheme: 2 (a) θ R 10–50 (°C) [1] (b) (i) θ H 50–100 (°C) (ii) view thermometer at right angles OR wait until reading stops rising OR stir water OR thermometer not touching sides / bottom [1] (c) θ M value between θ R and θ H [1] (d) correct calculation of θ A and value ⩾ θ M [1] temperatures given in °C [1] (e) any two from: heat loss to surroundings / beaker OR heat loss / drop in temperature by evaporation delays in taking readings amount / mass / volume of cold water different to hot (owtte) thermal capacity of beaker [2 (f) (i) 78 (cm3) [1] (ii) EITHER: Student 1 (80) – read to top of meniscus OR Student 2 (79) – divisions are every 2 cm3, not 1 cm3 OR Student 2 (79) – scale not read at right angles [1] [Total: 10]
Q3 · In this experiment, you will determine the resistance of a resistor
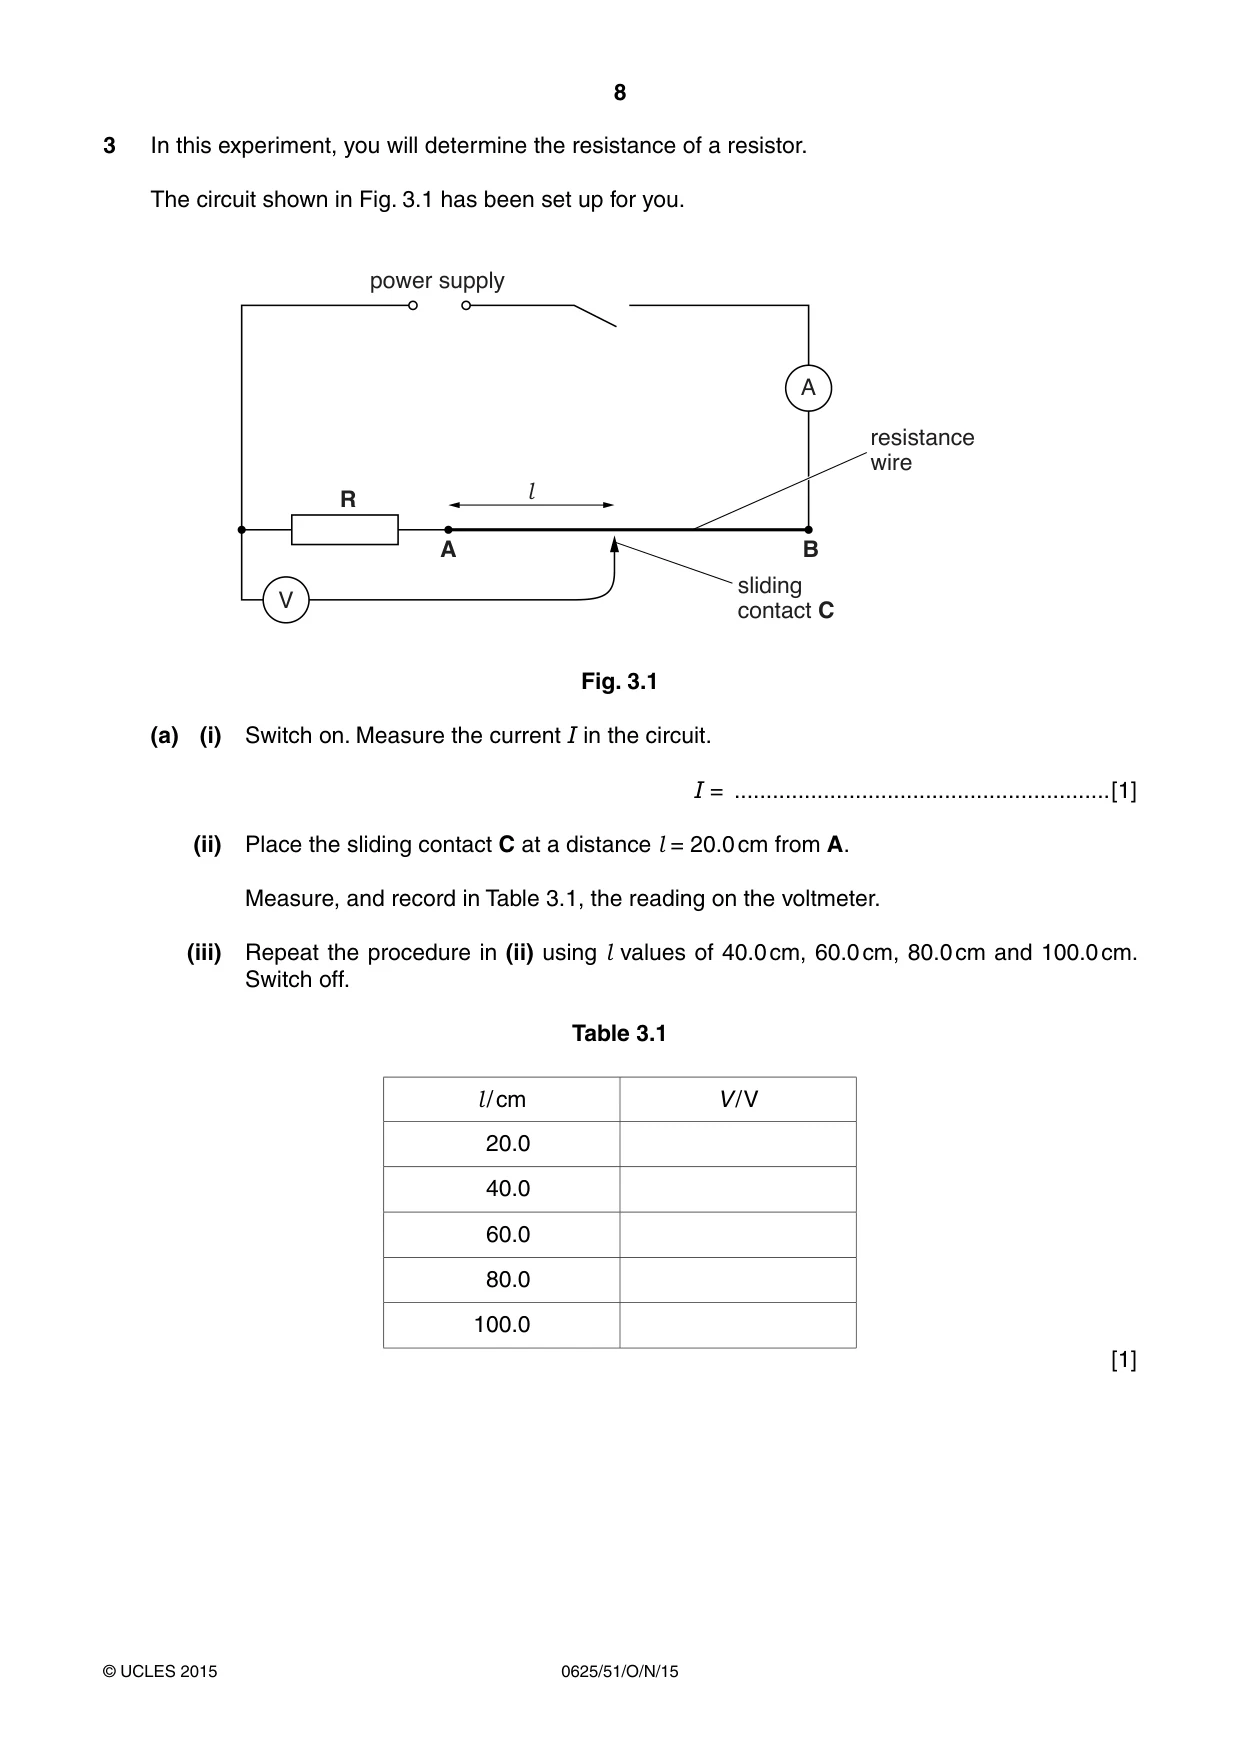
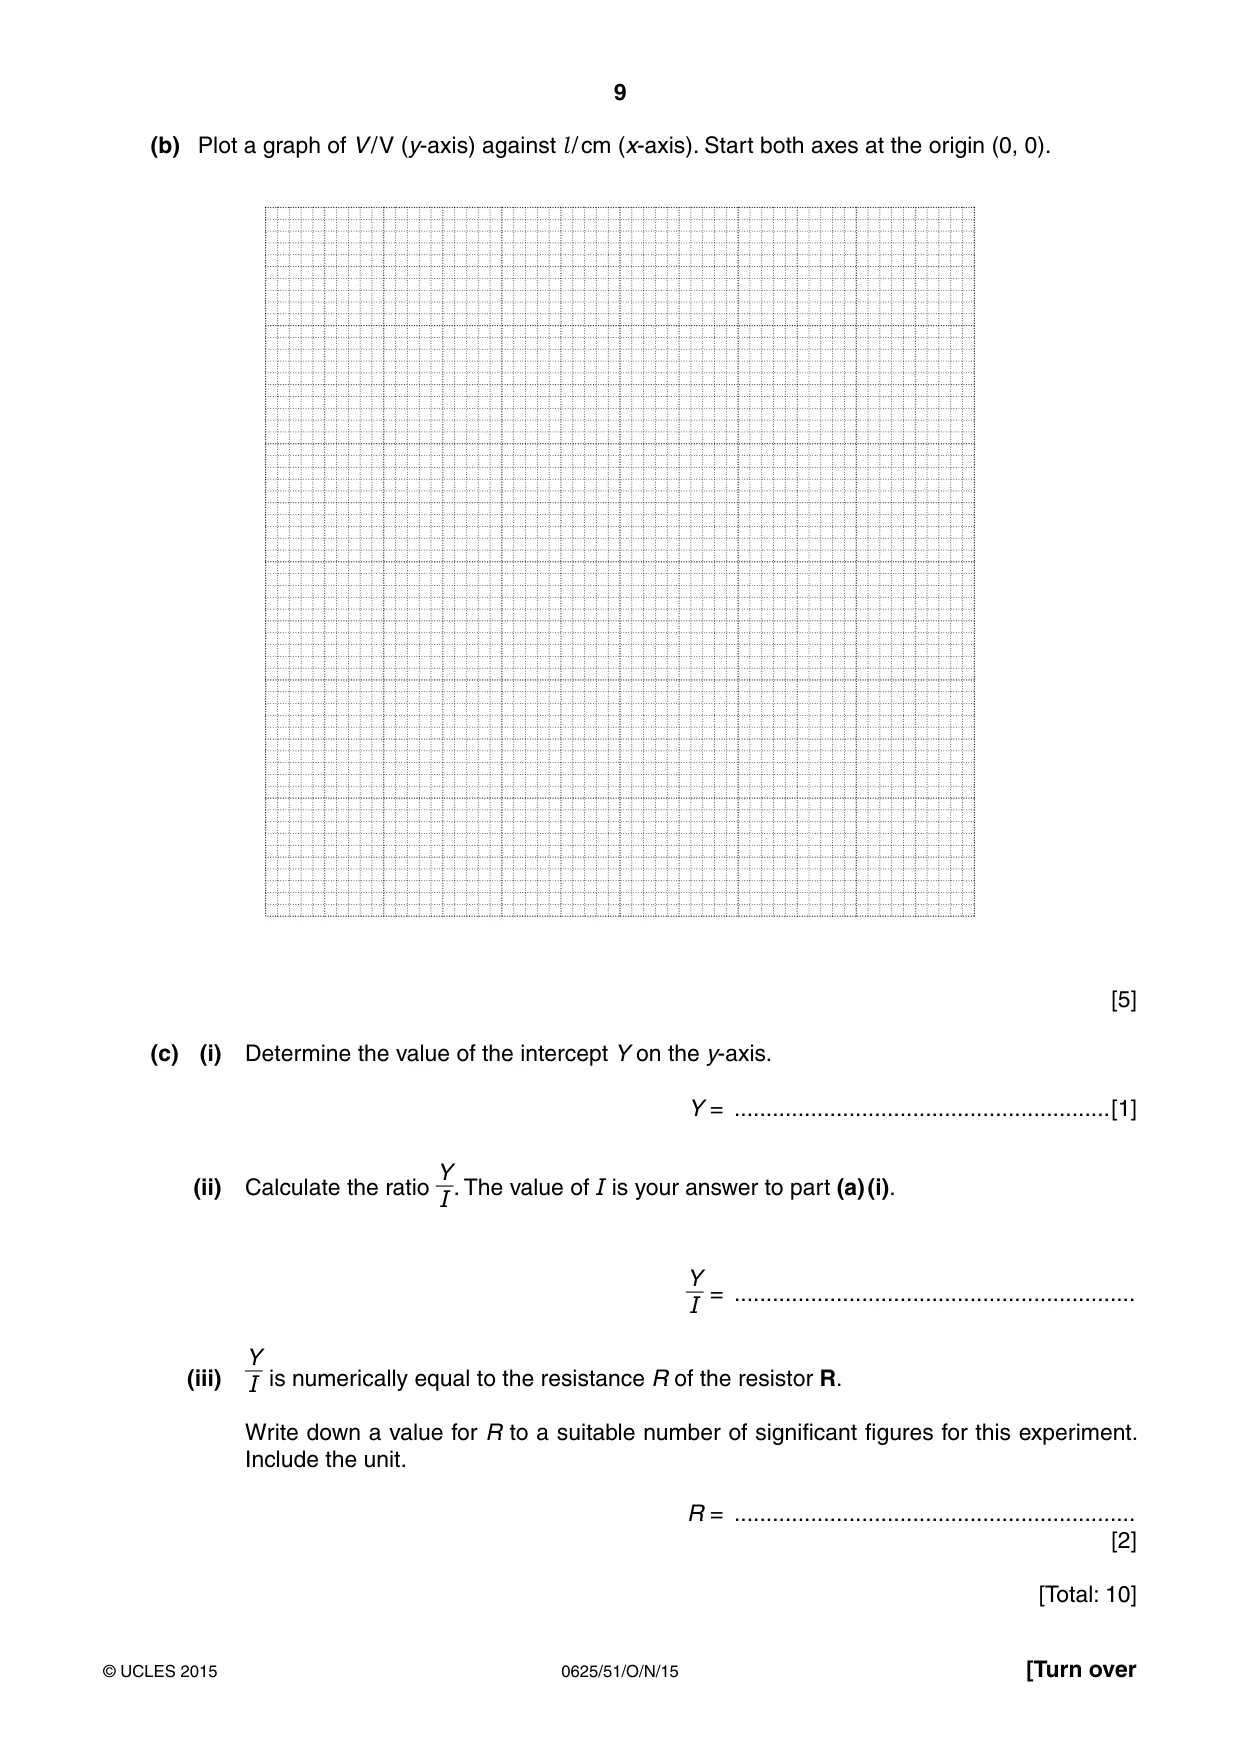
3 In this experiment, you will determine the resistance of a resistor. The circuit shown in Fig. 3.1 has been set up for you. power supply A resistance wire l R A B sliding V contact C Fig. 3.1 (a) (i) Switch on. Measure the current I in the circuit. I = ...........................................................[1] (ii) Place the sliding contact C at a distance l = 20.0 cm from A. Measure, and record in Table 3.1, the reading on the voltmeter. (iii) Repeat the procedure in (ii) using l values of 40.0 cm, 60.0 cm, 80.0 cm and 100.0 cm. Switch off. Table 3.1 l / cm V / V 20.0 40.0 60.0 80.0 100.0 [1] (b) Plot a graph of V / V (y-axis) against l / cm (x-axis). Start both axes at the origin (0, 0). [5] (c) (i) Determine the value of the intercept Y on the y-axis. Y = ...........................................................[1] Y (ii) Calculate the ratio . The value of I is your answer to part (a) (i). I Y = ............................................................... I Y (iii) I is numerically equal to the resistance R of the resistor R. Write down a value for R to a suitable number of significant figures for this experiment. Include the unit. R = ............................................................... [2] [Total: 10]
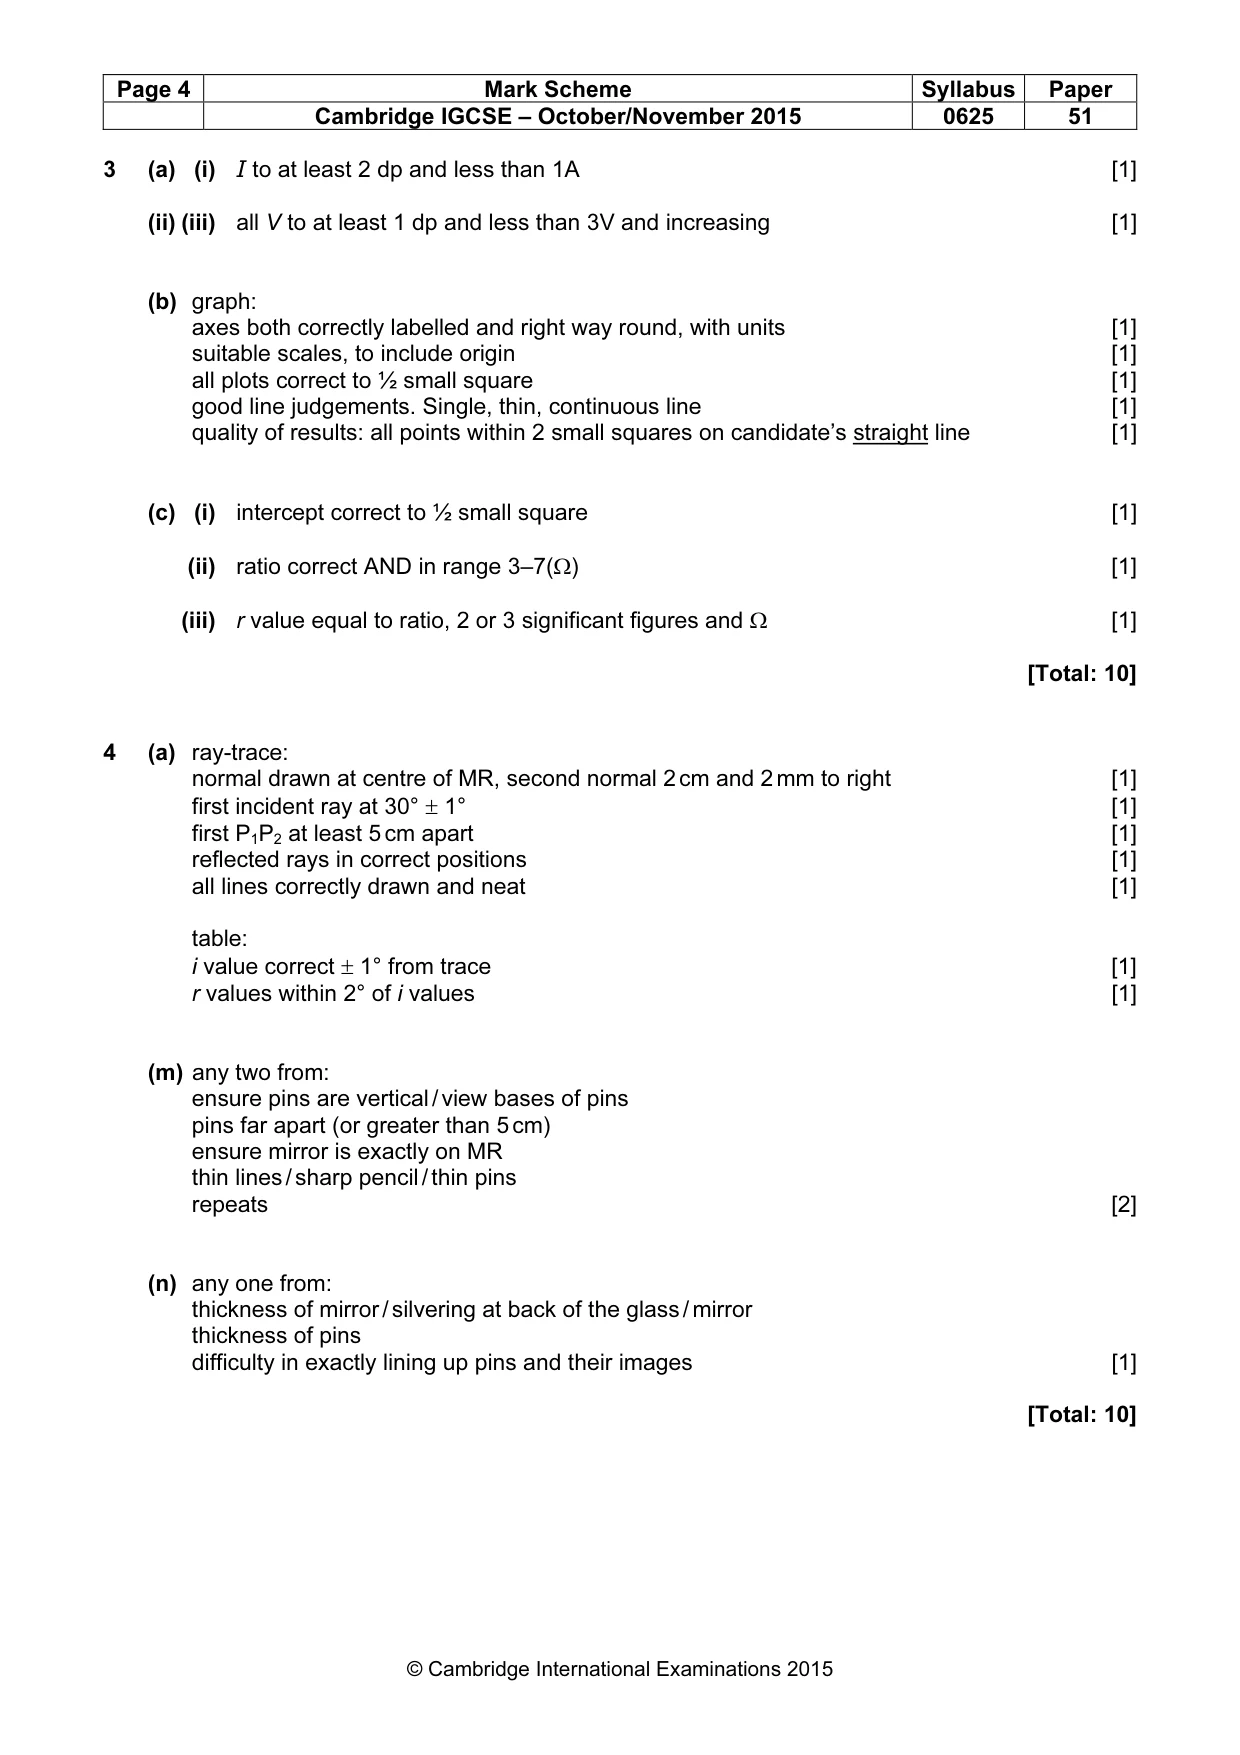
Mark scheme: 3 (a) (i) I to at least 2 dp and less than 1A [1] (ii) (iii) all V to at least 1 dp and less than 3V and increasing [1] (b) graph: axes both correctly labelled and right way round, with units [1] suitable scales, to include origin [1] all plots correct to ½ small square [1] good line judgements. Single, thin, continuous line [1] quality of results: all points within 2 small squares on candidate’s straight line [1] (c) (i) intercept correct to ½ small square [1] (ii) ratio correct AND in range 3–7(Ω) [1] (iii) r value equal to ratio, 2 or 3 significant figures and Ω [1] [Total: 10]
Q4 · In this experiment, you will investigate reflection using a plane mirror
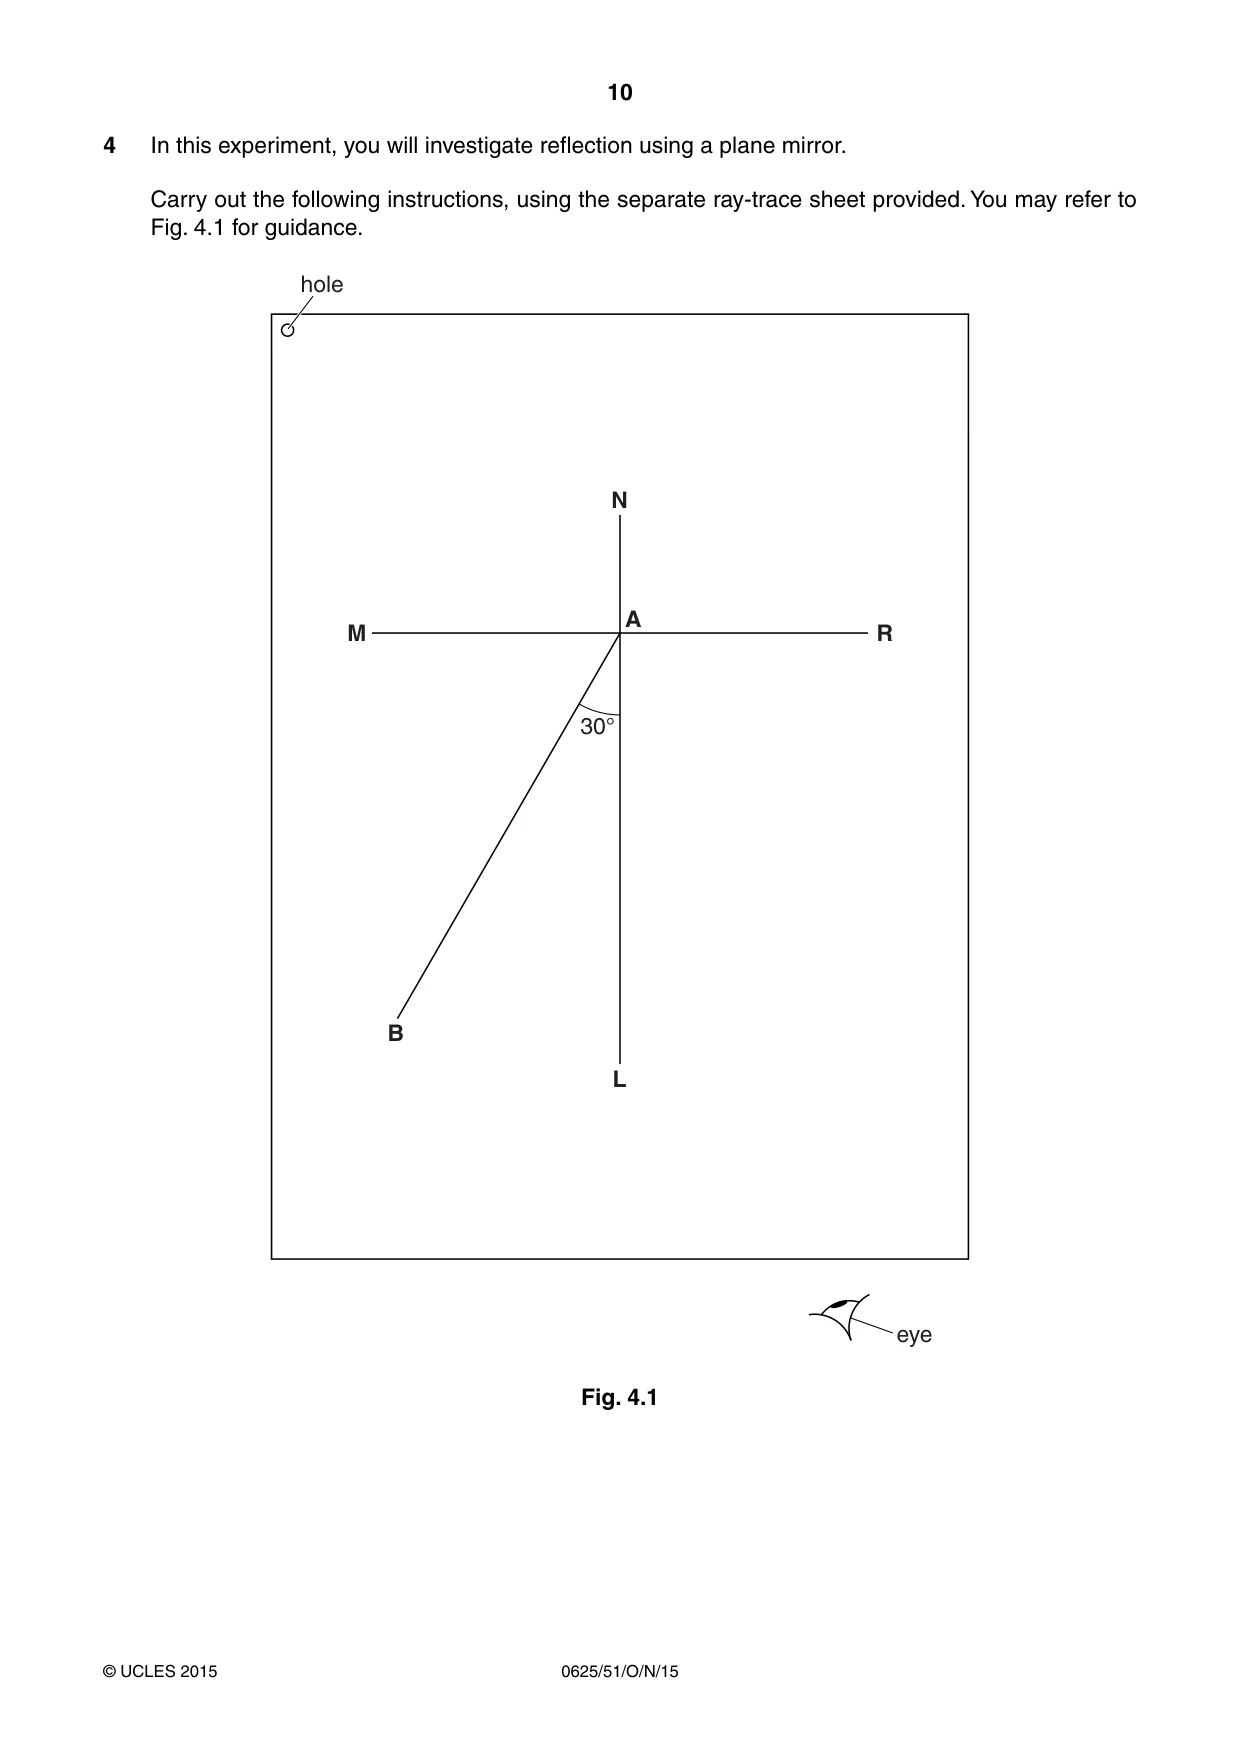
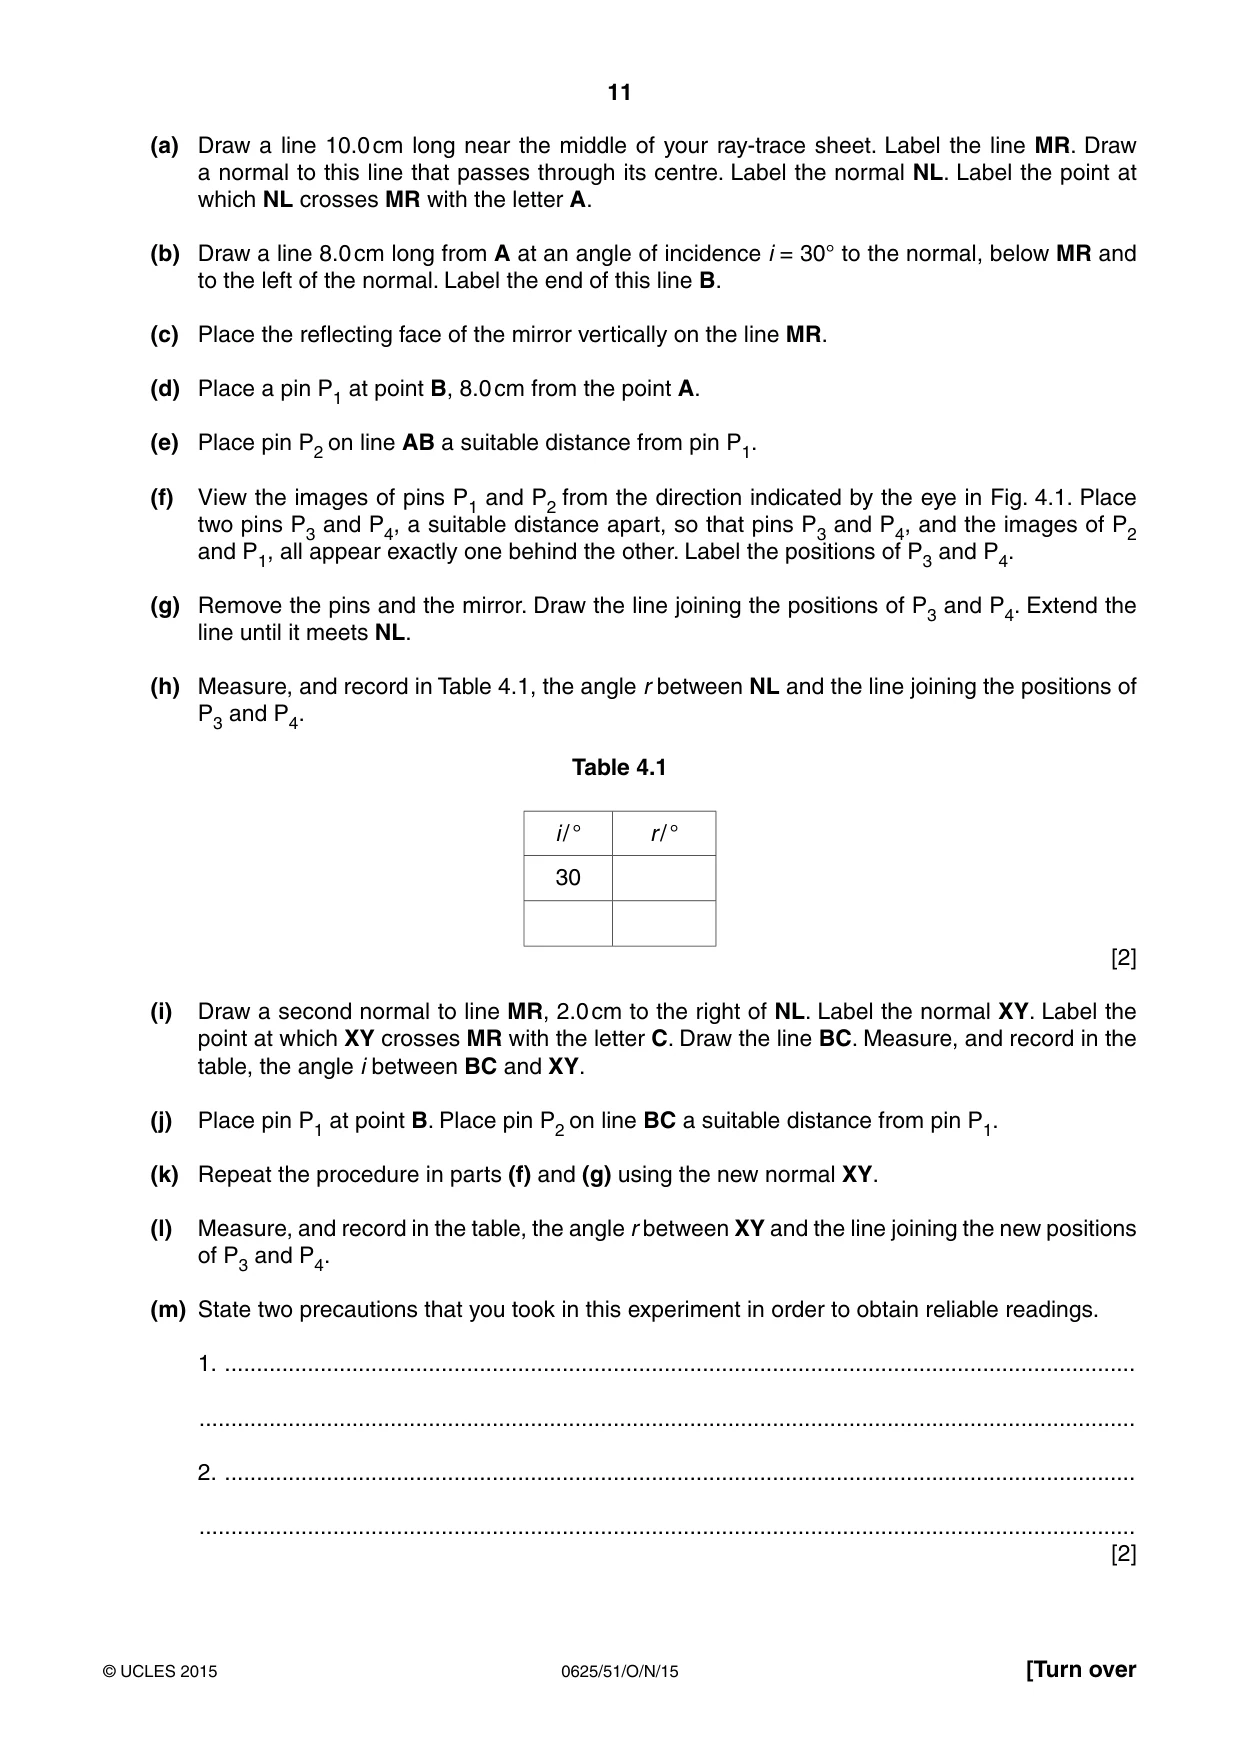
4 In this experiment, you will investigate reflection using a plane mirror. Carry out the following instructions, using the separate ray-trace sheet provided. You may refer to Fig. 4.1 for guidance. hole N A M R 30° B L eye Fig. 4.1 (a) Draw a line 10.0 cm long near the middle of your ray-trace sheet. Label the line MR. Draw a normal to this line that passes through its centre. Label the normal NL. Label the point at which NL crosses MR with the letter A. (b) Draw a line 8.0 cm long from A at an angle of incidence i = 30° to the normal, below MR and to the left of the normal. Label the end of this line B. (c) Place the reflecting face of the mirror vertically on the line MR. (d) Place a pin P1 at point B, 8.0 cm from the point A. (e) Place pin P2 on line AB a suitable distance from pin P1. (f) View the images of pins P1 and P2 from the direction indicated by the eye in Fig. 4.1. Place two pins P3 and P4, a suitable distance apart, so that pins P3 and P4, and the images of P2 and P1, all appear exactly one behind the other. Label the positions of P3 and P4. (g) Remove the pins and the mirror. Draw the line joining the positions of P3 and P4. Extend the line until it meets NL. (h) Measure, and record in Table 4.1, the angle r between NL and the line joining the positions of P3 and P4. Table 4.1 i / ° r / ° 30 [2] (i) Draw a second normal to line MR, 2.0 cm to the right of NL. Label the normal XY. Label the point at which XY crosses MR with the letter C. Draw the line BC. Measure, and record in the table, the angle i between BC and XY. (j) Place pin P1 at point B. Place pin P2 on line BC a suitable distance from pin P1. (k) Repeat the procedure in parts (f) and (g) using the new normal XY. (l) Measure, and record in the table, the angle r between XY and the line joining the new positions of P3 and P4. (m) State two precautions that you took in this experiment in order to obtain reliable readings. 1. ............................................................................................................................................... ................................................................................................................................................... 2. ............................................................................................................................................... ................................................................................................................................................... [2] (n) A student has done this experiment very carefully, taking these precautions. She is disappointed to find that her lines for the reflected rays are not exactly where she predicts from the theory. Suggest a practical reason for this. ...............................................................................................................................................[1] Tie your ray-trace sheet into this Booklet between pages 10 and 11. [5] [Total: 10]
Mark scheme: 4 (a) ray-trace: normal drawn at centre of MR, second normal 2 cm and 2 mm to right [1] first incident ray at 30° ± 1° [1] first P1P2 at least 5 cm apart [1] reflected rays in correct positions [1] all lines correctly drawn and neat [1] table: i value correct ± 1° from trace [1] r values within 2° of i values [1] (m) any two from: ensure pins are vertical / view bases of pins pins far apart (or greater than 5 cm) ensure mirror is exactly on MR thin lines / sharp pencil / thin pins repeats [2] (n) any one from: thickness of mirror / silvering at back of the glass / mirror thickness of pins difficulty in exactly lining up pins and their images [1] [Total: 10]
What was in this paper
The subtopics covered by these 4 questions, and how many questions each got. Open one in a new tab to see every Cambridge question on it.
What you needed in this session
Cambridge’s own grade thresholds for 2015 Oct/Nov, Paper 5 · Variant 1. A higher threshold means an easier paper — the bar moves with how the cohort did.