Cambridge IGCSE Physics 0625 — 2015 May/June Paper 6 · Variant 1
0625/61/M/J/15 · 5 questions · 40 marks · ≈45 min
The question paper and its mark scheme, free to read here and free to download. This is Cambridge’s own paper, exactly as it was sat.
Question paper16 pages


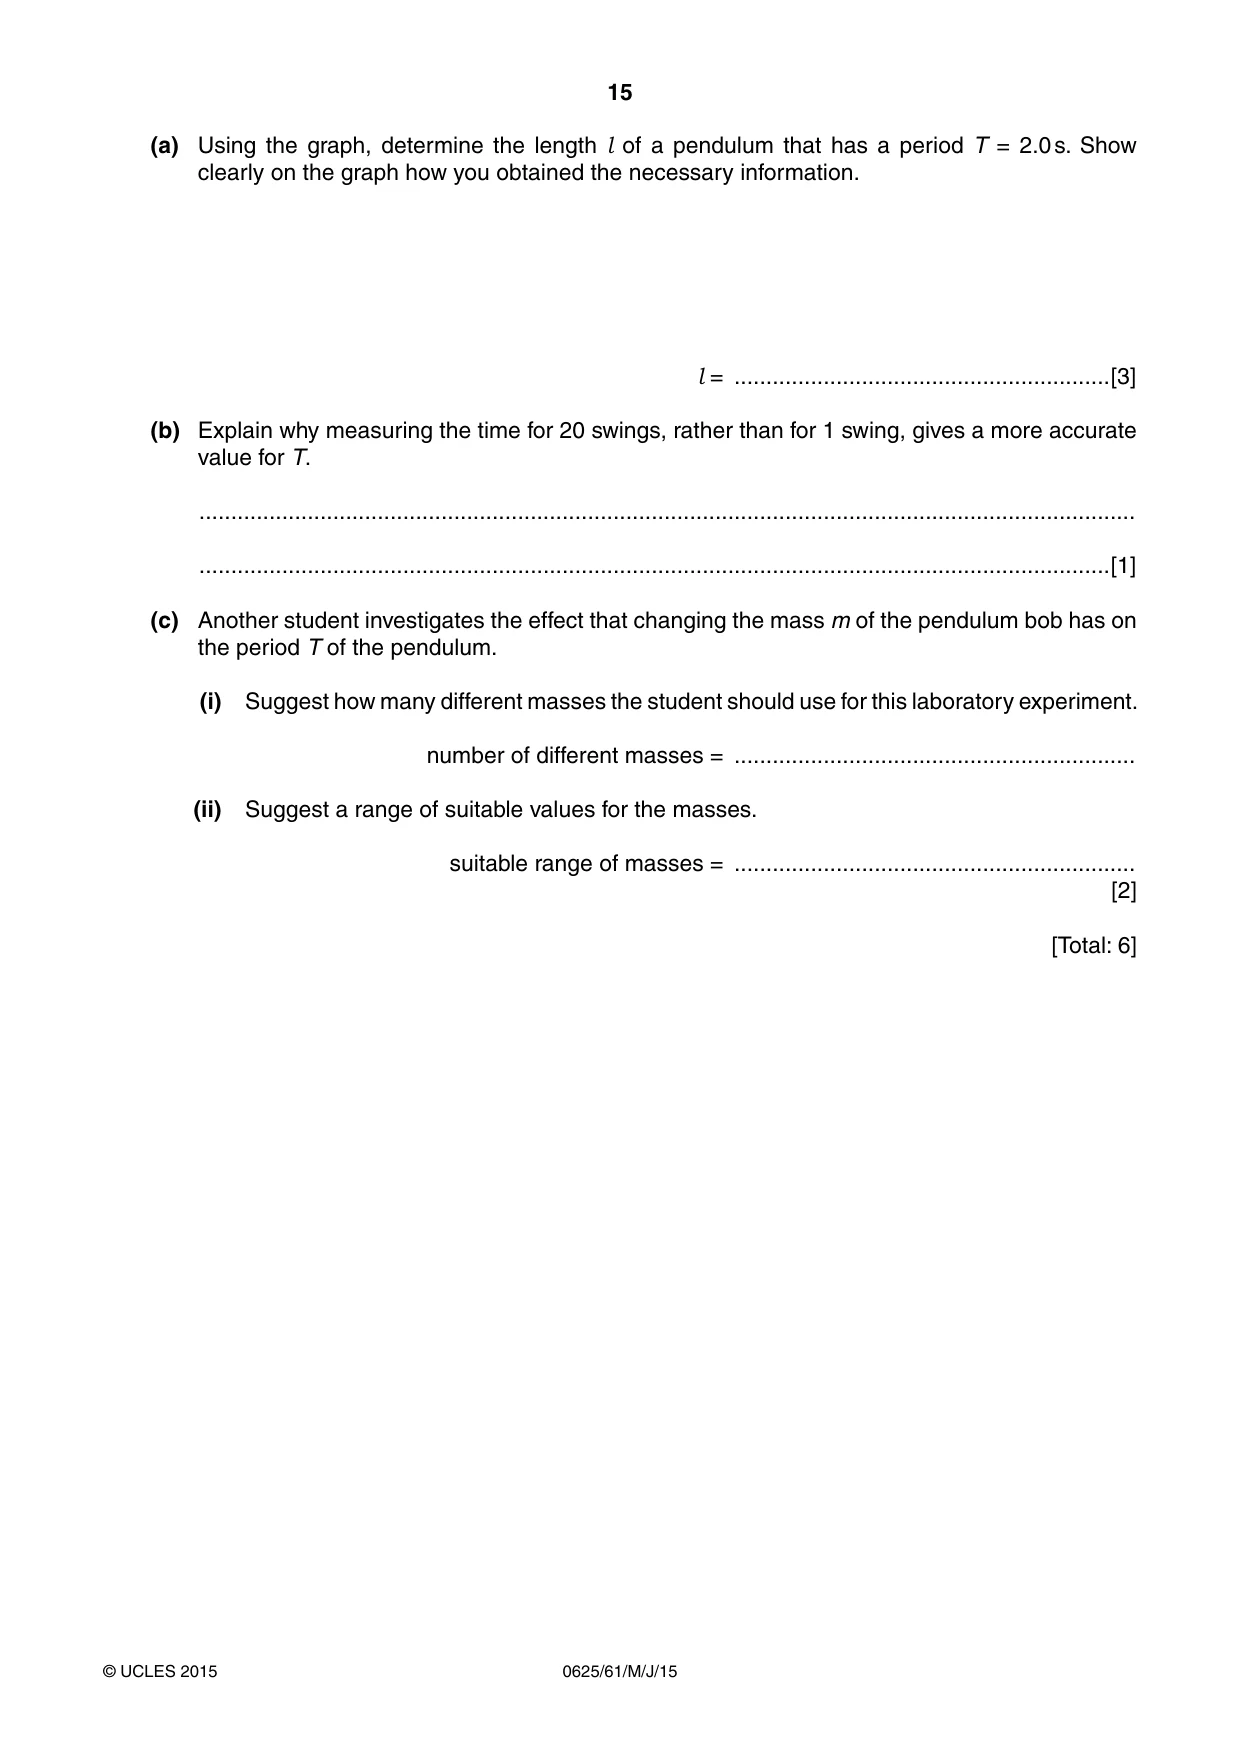
Mark scheme5 pages
Answers below. Sit the paper first if you are practising.
Questions as text
Q1 · The class is determining the weight of a metre rule using a balancing method
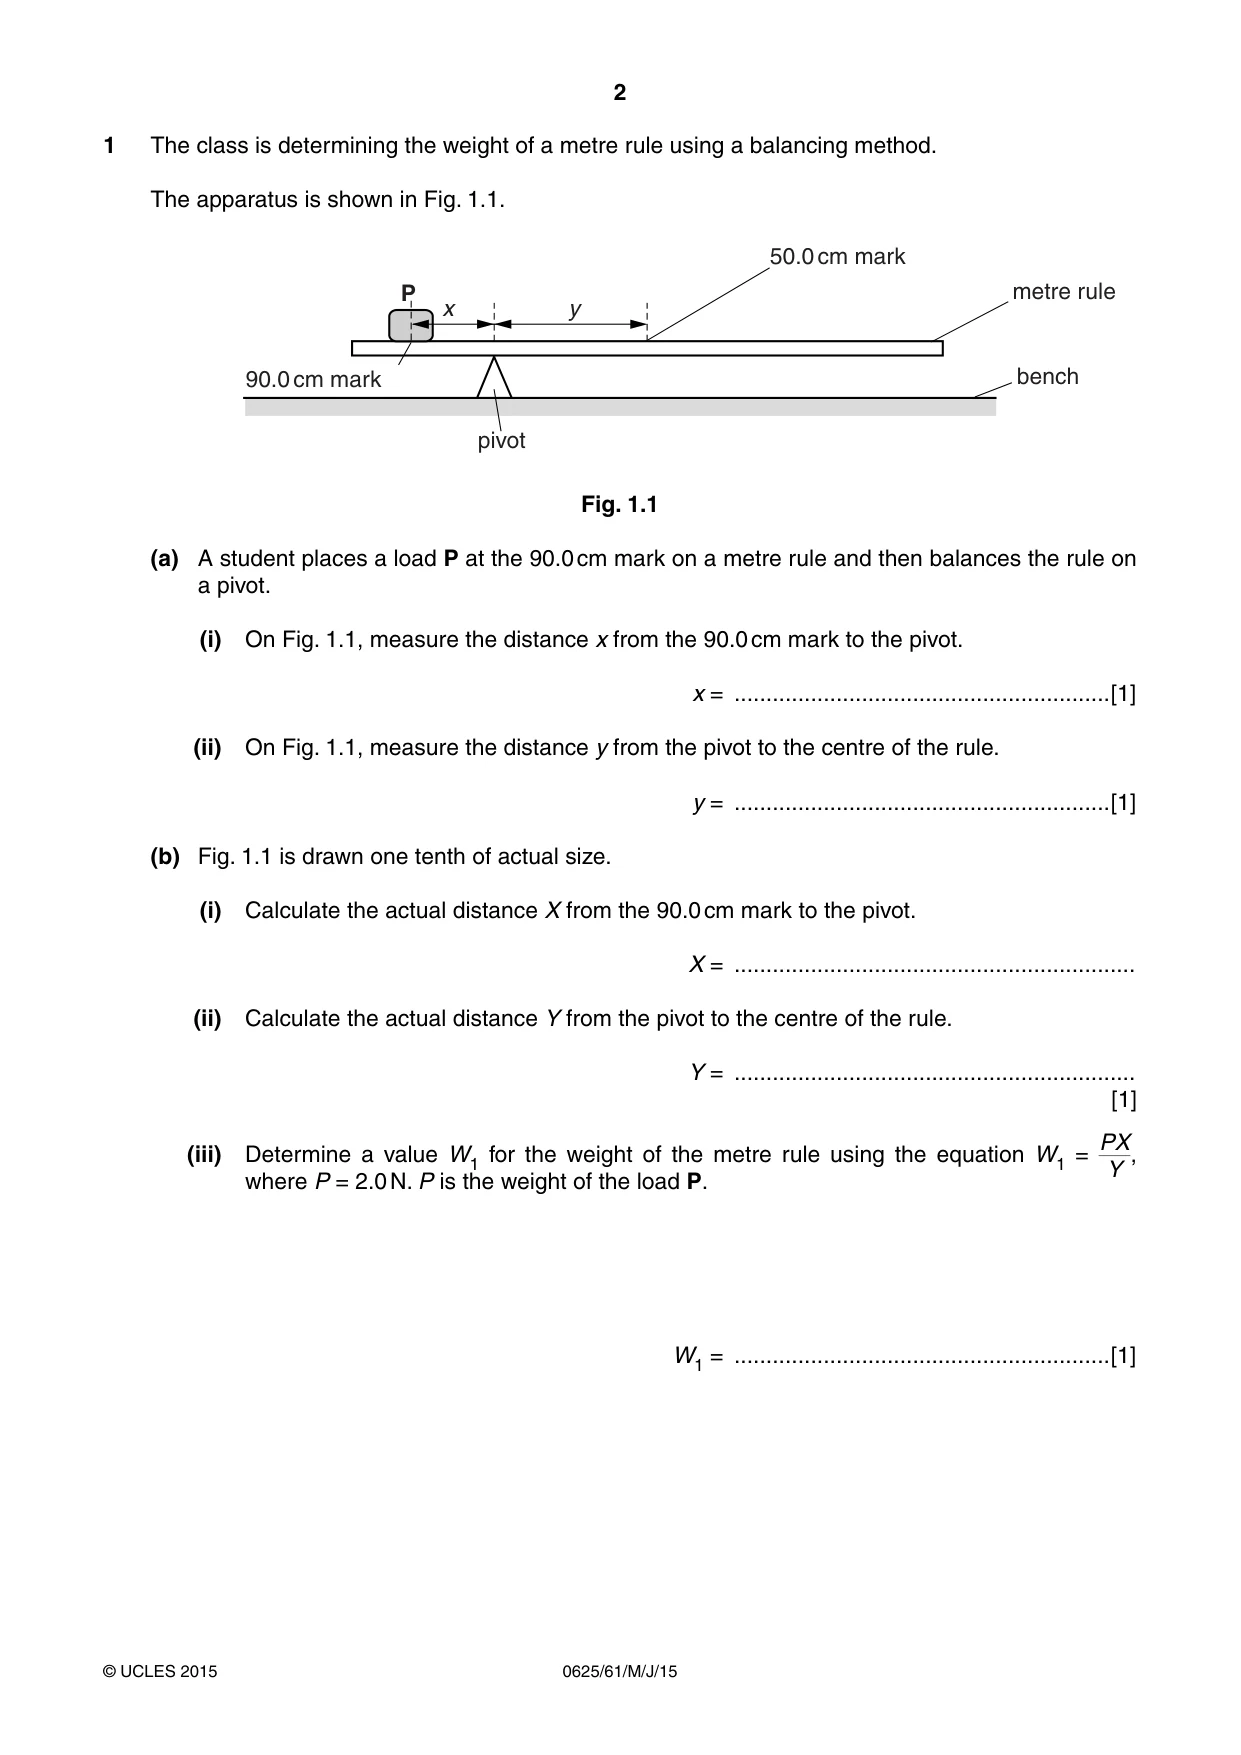
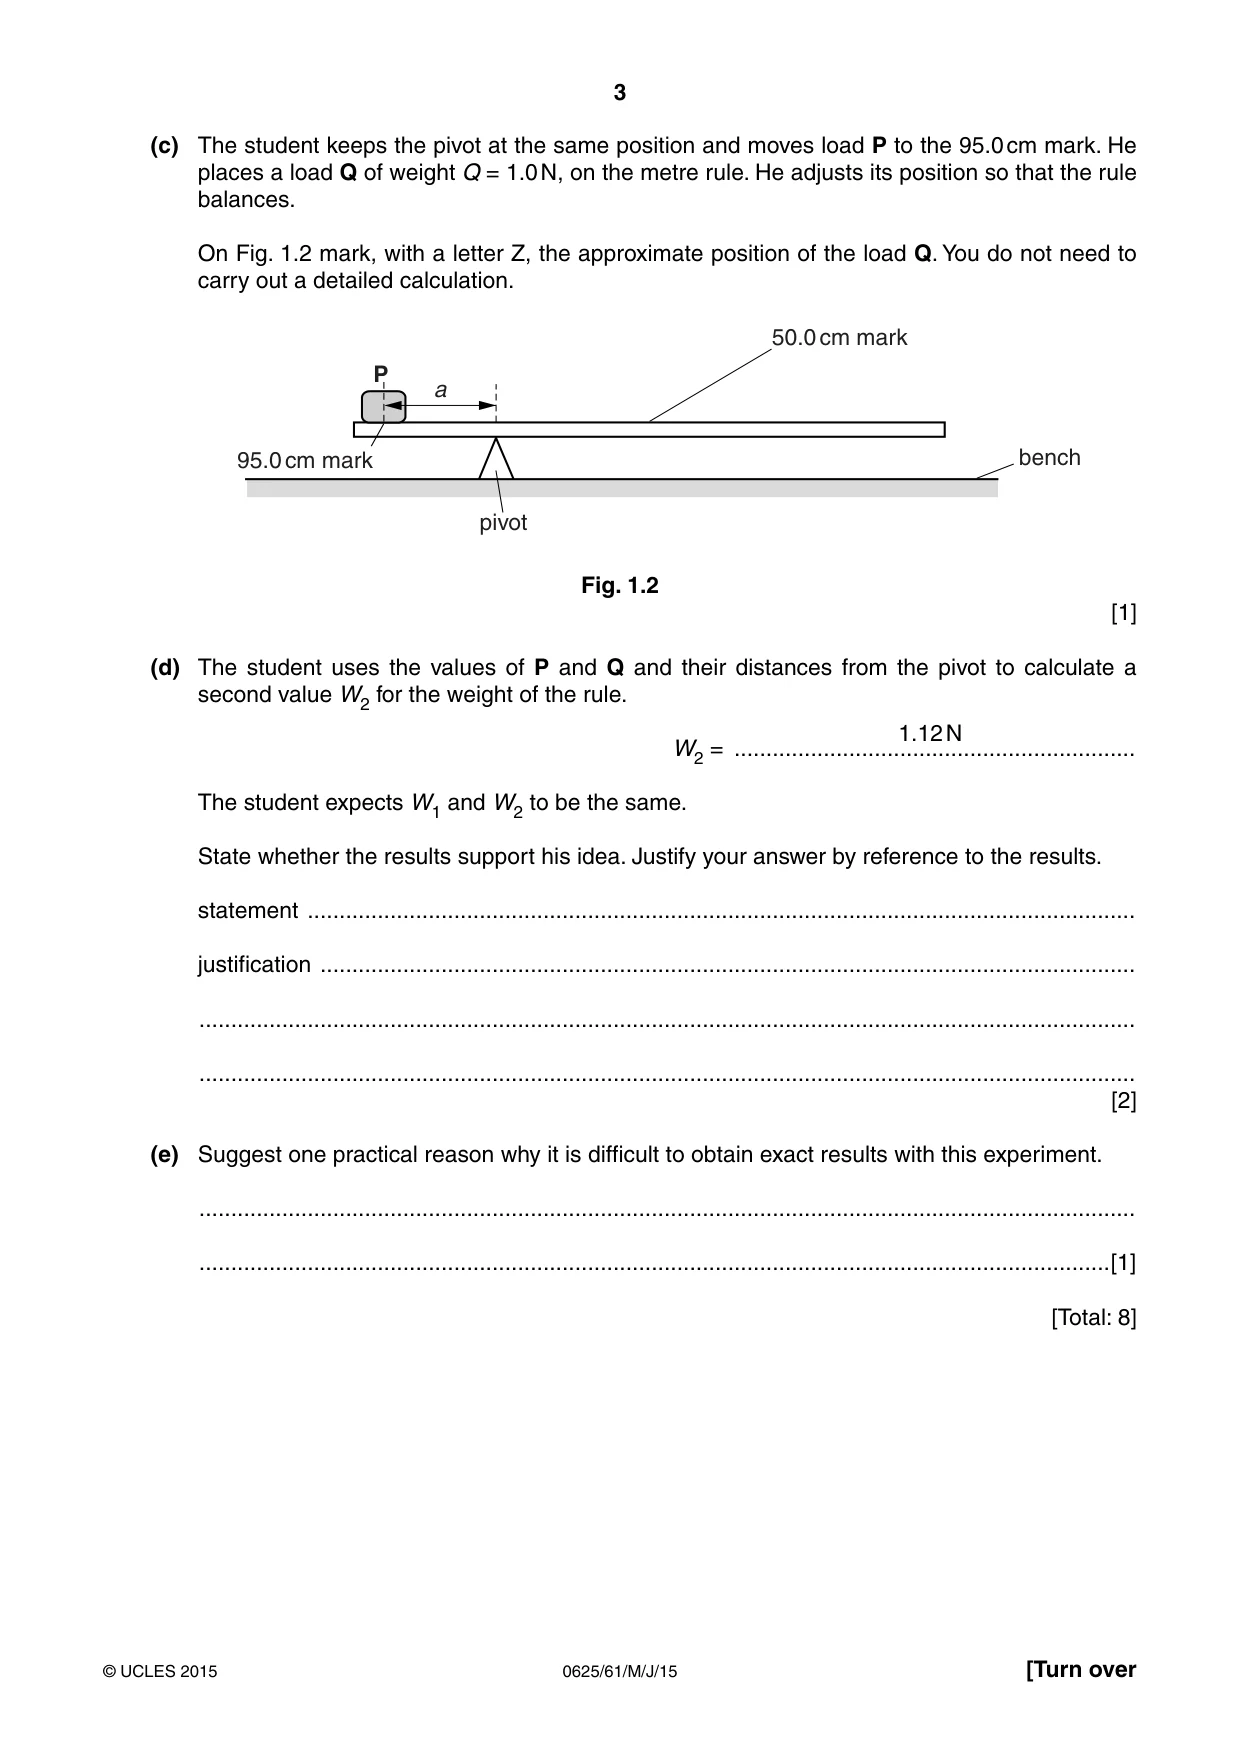
1 The class is determining the weight of a metre rule using a balancing method. The apparatus is shown in Fig. 1.1. 50.0 cm mark P metre rule x y 90.0 cm mark bench pivot Fig. 1.1 (a) A student places a load P at the 90.0 cm mark on a metre rule and then balances the rule on a pivot. (i) On Fig. 1.1, measure the distance x from the 90.0 cm mark to the pivot. x = ...........................................................[1] (ii) On Fig. 1.1, measure the distance y from the pivot to the centre of the rule. y = ...........................................................[1] (b) Fig. 1.1 is drawn one tenth of actual size. (i) Calculate the actual distance X from the 90.0 cm mark to the pivot. X = ............................................................... (ii) Calculate the actual distance Y from the pivot to the centre of the rule. Y = ............................................................... [1] PX (iii) Determine a value W1 for the weight of the metre rule using the equation W1 = , Y where P = 2.0 N. P is the weight of the load P. W1 = ...........................................................[1] (c) The student keeps the pivot at the same position and moves load P to the 95.0 cm mark. He places a load Q of weight Q = 1.0 N, on the metre rule. He adjusts its position so that the rule balances. On Fig. 1.2 mark, with a letter Z, the approximate position of the load Q. You do not need to carry out a detailed calculation. 50.0 cm mark P a 95.0 cm mark bench pivot Fig. 1.2 [1] (d) The student uses the values of P and Q and their distances from the pivot to calculate a second value W2 for the weight of the rule. 1.12 N W2 = ............................................................... The student expects W1 and W2 to be the same. State whether the results support his idea. Justify your answer by reference to the results. statement .................................................................................................................................. justification ................................................................................................................................ ................................................................................................................................................... ................................................................................................................................................... [2] (e) Suggest one practical reason why it is difficult to obtain exact results with this experiment. ................................................................................................................................................... ...............................................................................................................................................[1] [Total: 8]
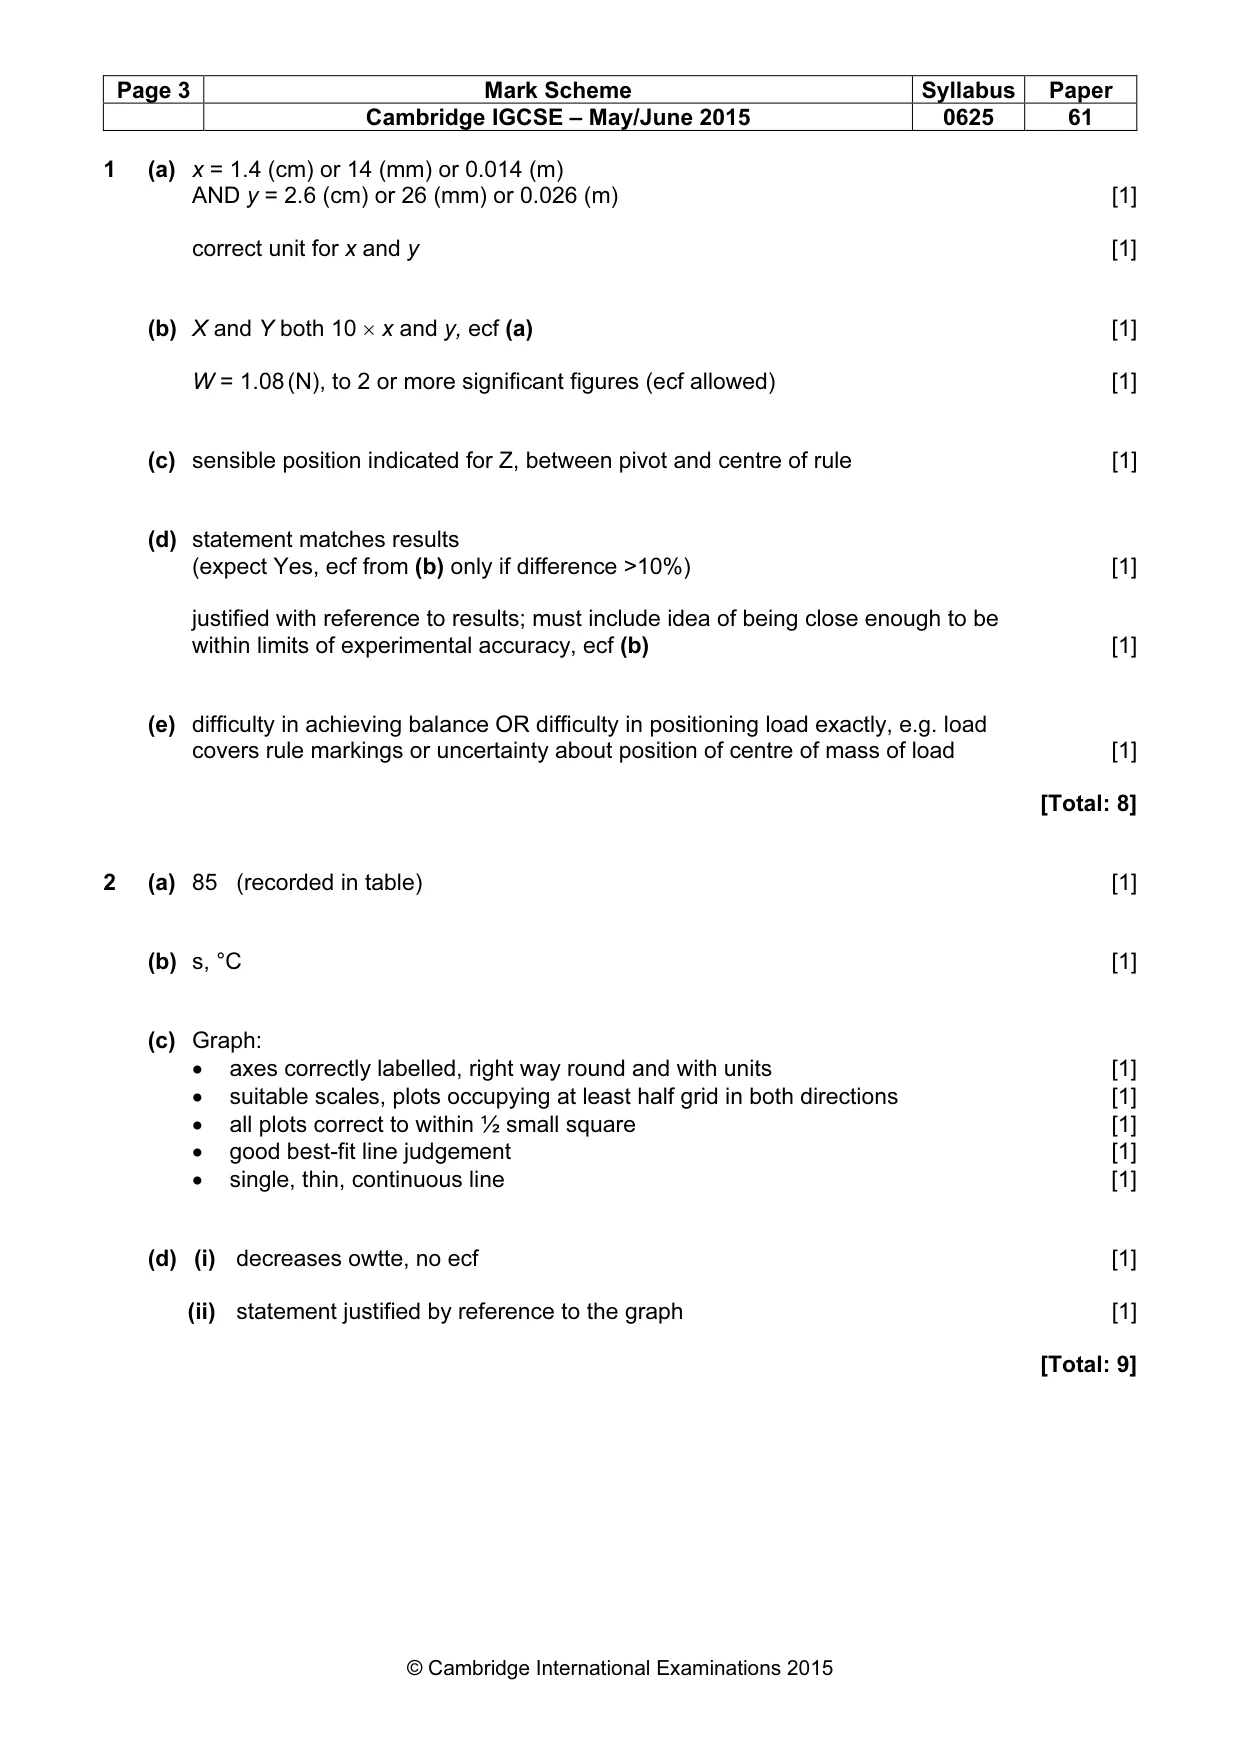
Mark scheme: 1 (a) x = 1.4 (cm) or 14 (mm) or 0.014 (m) AND y = 2.6 (cm) or 26 (mm) or 0.026 (m) [1] correct unit for x and y [1] (b) X and Y both 10 × x and y, ecf (a) [1] W = 1.08 (N), to 2 or more significant figures (ecf allowed) [1] (c) sensible position indicated for Z, between pivot and centre of rule [1] (d) statement matches results (expect Yes, ecf from (b) only if difference >10%) [1] justified with reference to results; must include idea of being close enough to be within limits of experimental accuracy, ecf (b) [1] (e) difficulty in achieving balance OR difficulty in positioning load exactly, e.g. load covers rule markings or uncertainty about position of centre of mass of load [1] [Total: 8]
More questions on Physical quantities and measurement techniques
Q2 · The class is investigating the cooling of water
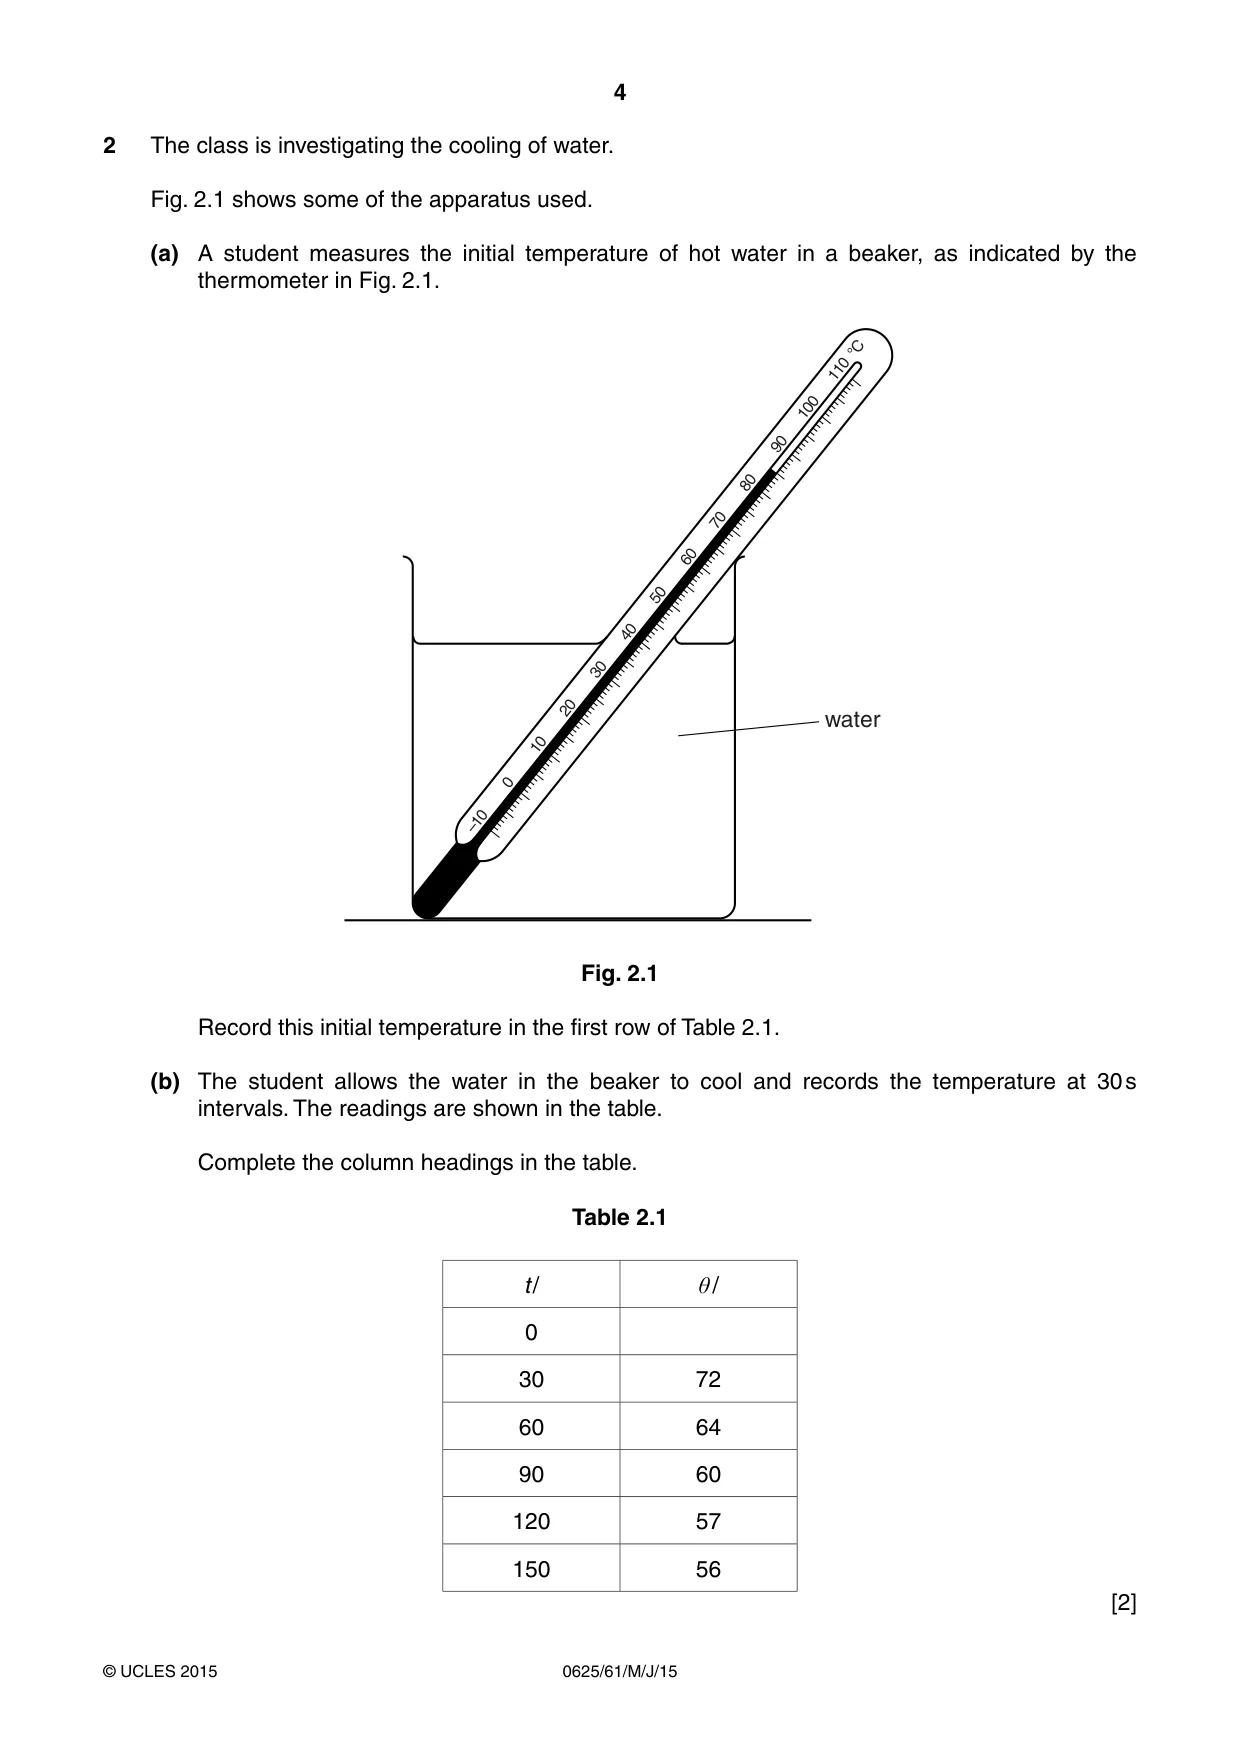
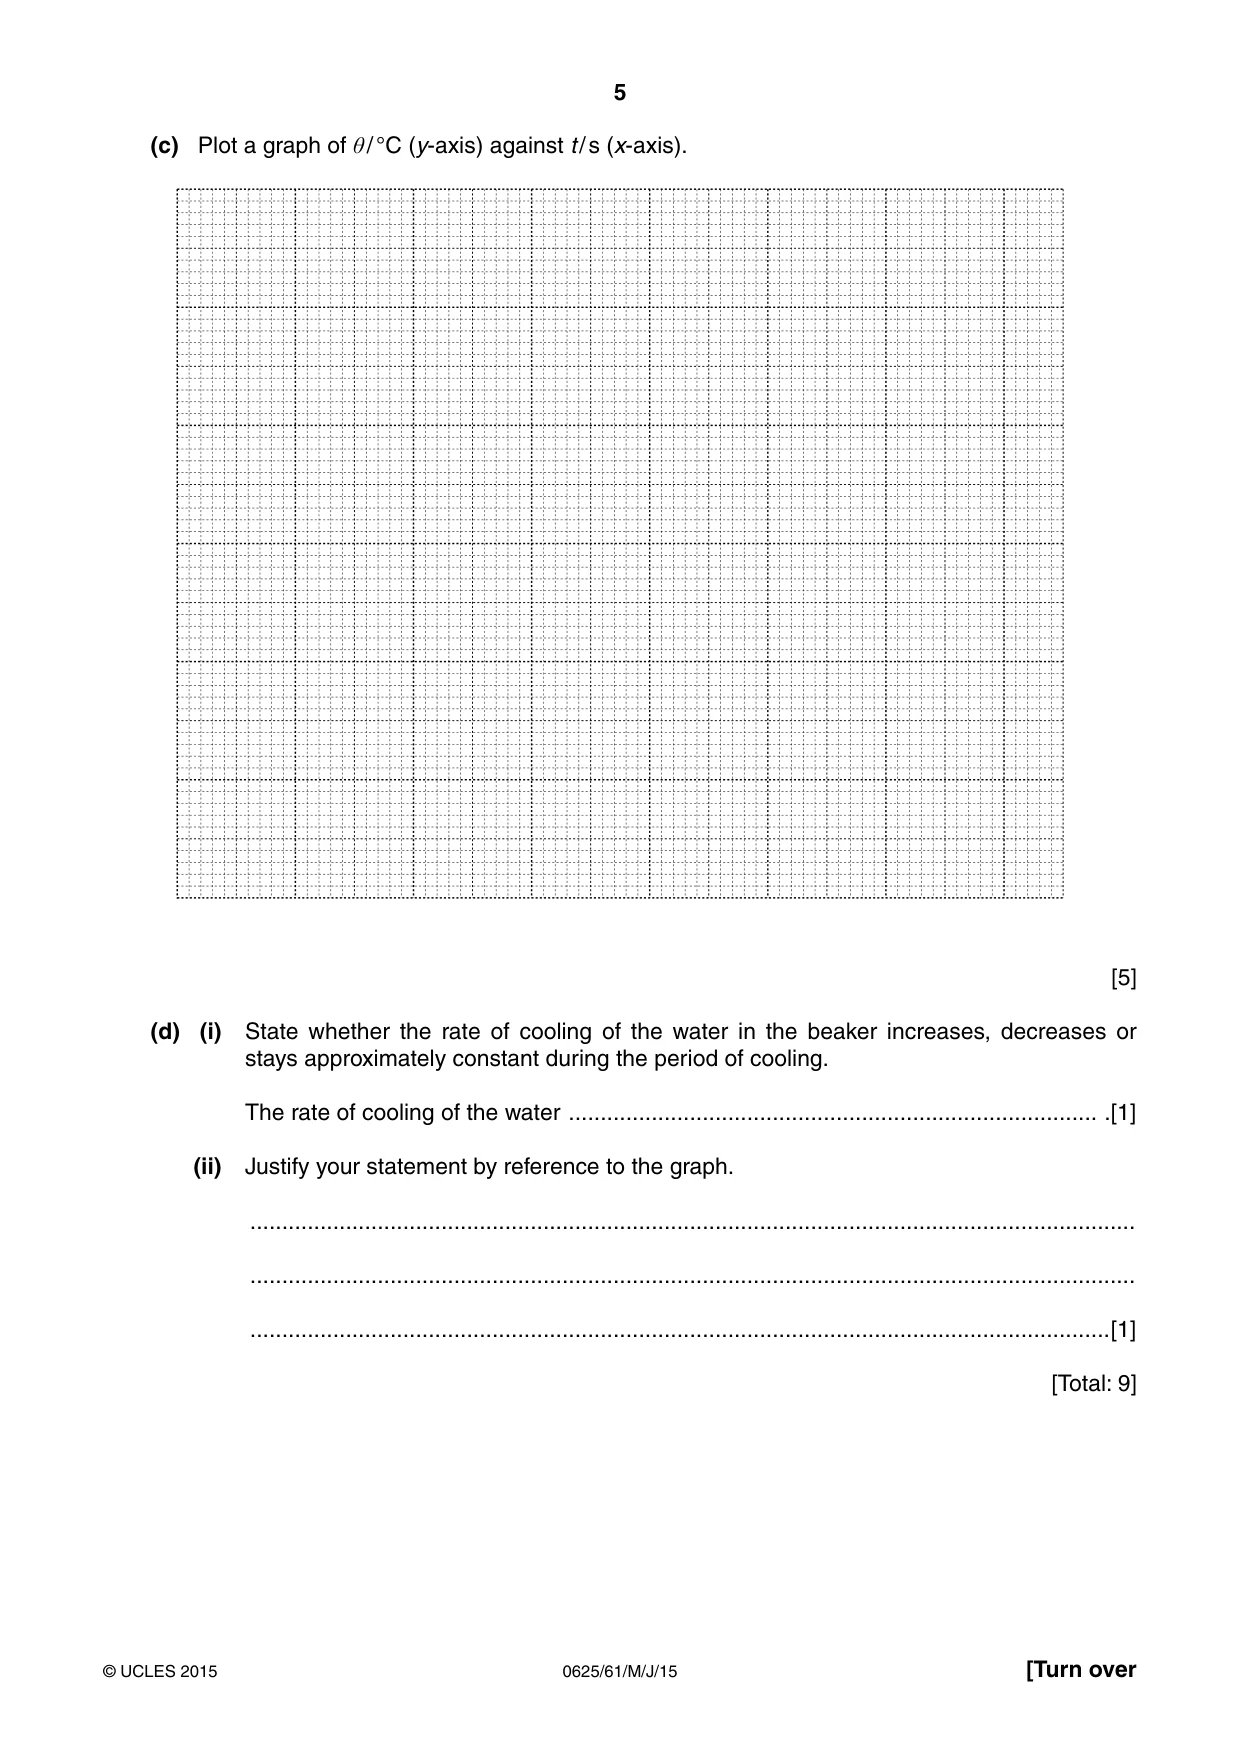
2 The class is investigating the cooling of water. Fig. 2.1 shows some of the apparatus used. (a) A student measures the initial temperature of hot water in a beaker, as indicated by the thermometer in Fig. 2.1. °C 110 100 90 80 70 60 50 40 30 20 water 10 0 –10 Fig. 2.1 Record this initial temperature in the first row of Table 2.1. (b) The student allows the water in the beaker to cool and records the temperature at 30 s intervals. The readings are shown in the table. Complete the column headings in the table. Table 2.1 t / θ / 0 30 72 60 64 90 60 120 57 150 56 [2] (c) Plot a graph of θ / °C (y-axis) against t / s (x-axis). [5] (d) (i) State whether the rate of cooling of the water in the beaker increases, decreases or stays approximately constant during the period of cooling. The rate of cooling of the water ................................................................................... .[1] (ii) Justify your statement by reference to the graph. ........................................................................................................................................... ........................................................................................................................................... .......................................................................................................................................[1] [Total: 9]
Mark scheme: 2 (a) 85 (recorded in table) [1] (b) s, °C [1] (c) Graph: • axes correctly labelled, right way round and with units [1] • suitable scales, plots occupying at least half grid in both directions [1] • all plots correct to within ½ small square [1] • good best-fit line judgement [1] • single, thin, continuous line [1] (d) (i) decreases owtte, no ecf [1] (ii) statement justified by reference to the graph [1] [Total: 9]
Q3 · The class is investigating the resistance of lamp filaments in series and parallel…
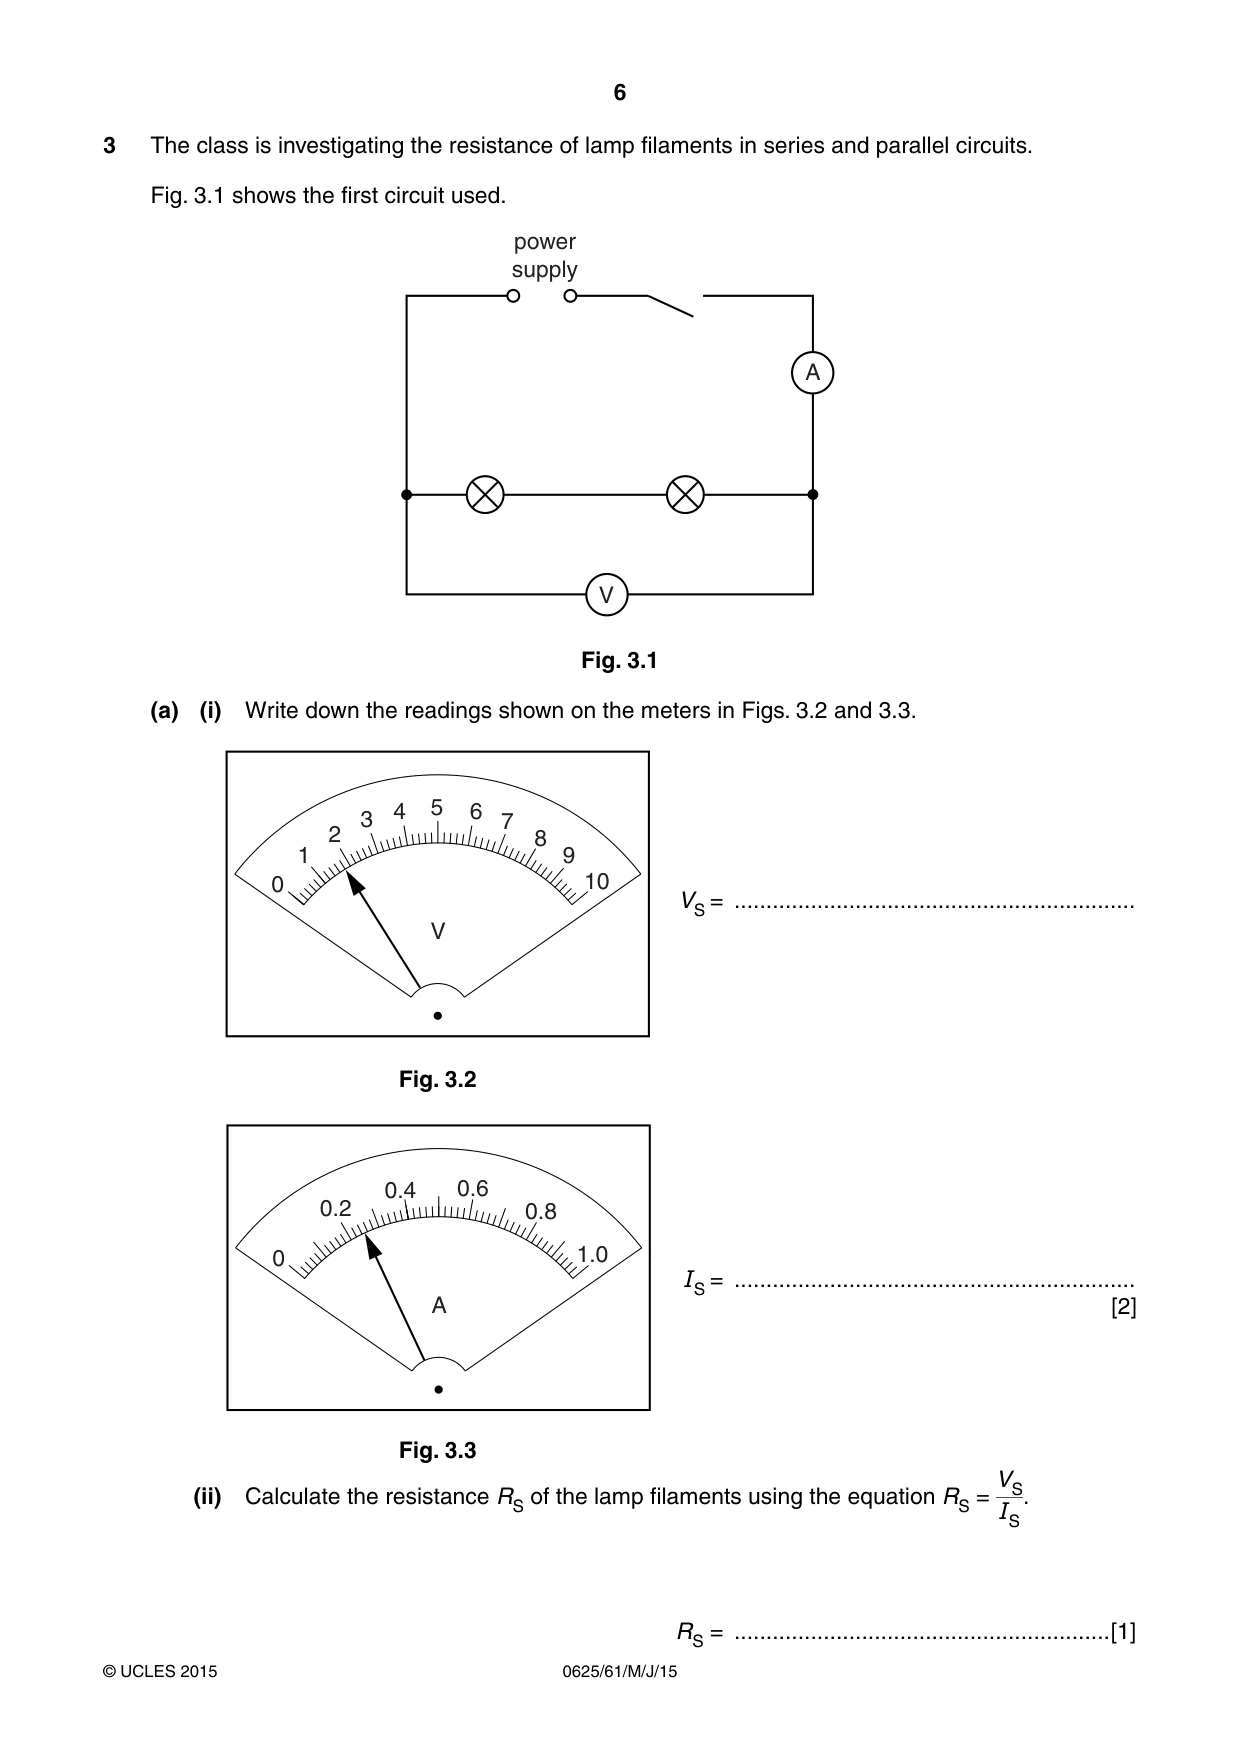
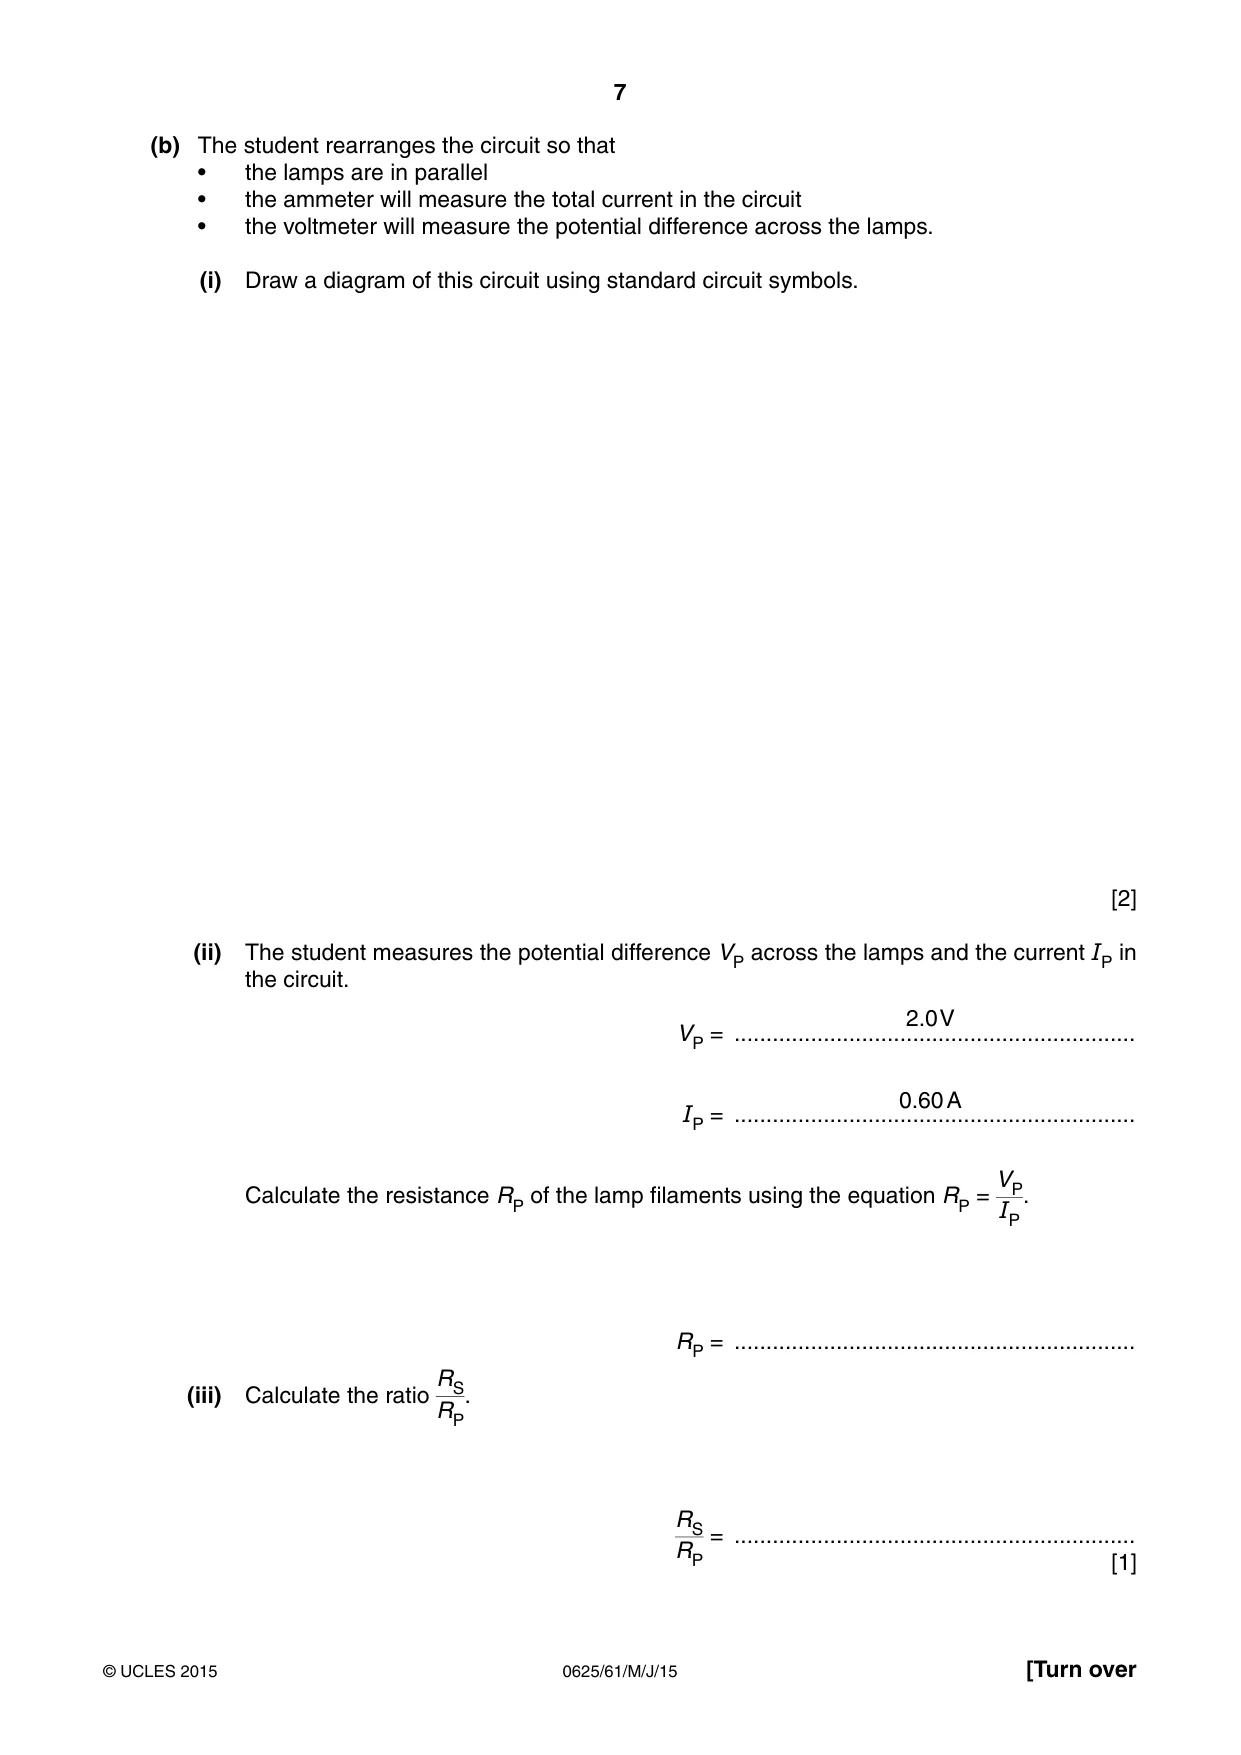
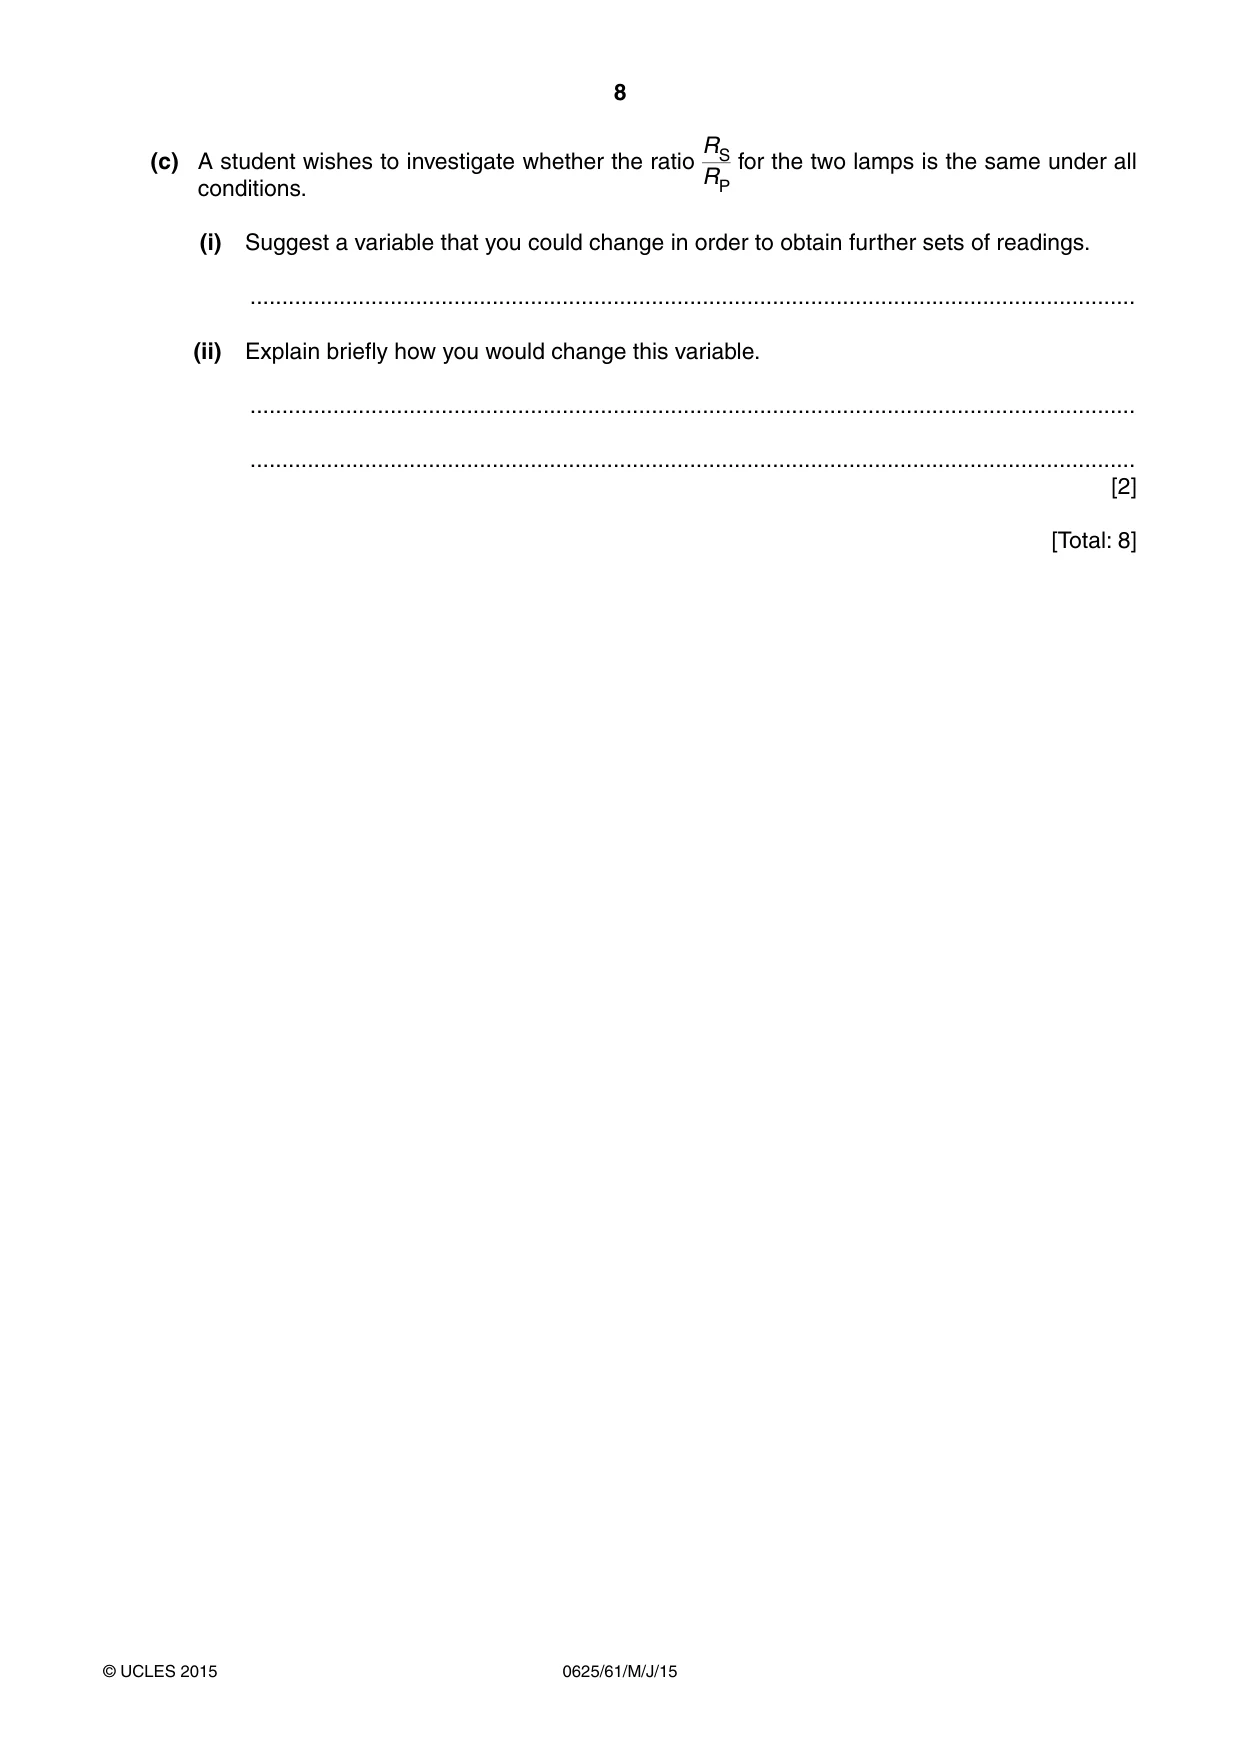
3 The class is investigating the resistance of lamp filaments in series and parallel circuits. Fig. 3.1 shows the first circuit used. power supply A V Fig. 3.1 (a) (i) Write down the readings shown on the meters in Figs. 3.2 and 3.3. 4 5 6 3 7 2 8 1 9 0 10 VS = ............................................................... V Fig. 3.2 0.4 0.6 0.2 0.8 0 1.0 IS = ............................................................... A [2] Fig. 3.3 VS (ii) Calculate the resistance RS of the lamp filaments using the equation RS = . IS RS = ...........................................................[1] (b) The student rearranges the circuit so that • the lamps are in parallel • the ammeter will measure the total current in the circuit • the voltmeter will measure the potential difference across the lamps. (i) Draw a diagram of this circuit using standard circuit symbols. [2] (ii) The student measures the potential difference VP across the lamps and the current IP in the circuit. 2.0 V VP = ............................................................... 0.60 A IP = ............................................................... VP Calculate the resistance RP of the lamp filaments using the equation RP = . IP RP = ............................................................... RS (iii) Calculate the ratio . RP RS = ............................................................... RP [1] RS(c) A student wishes to investigate whether the ratio for the two lamps is the same under all conditions. RP (i) Suggest a variable that you could change in order to obtain further sets of readings. ........................................................................................................................................... (ii) Explain briefly how you would change this variable. ........................................................................................................................................... ........................................................................................................................................... [2] [Total: 8]
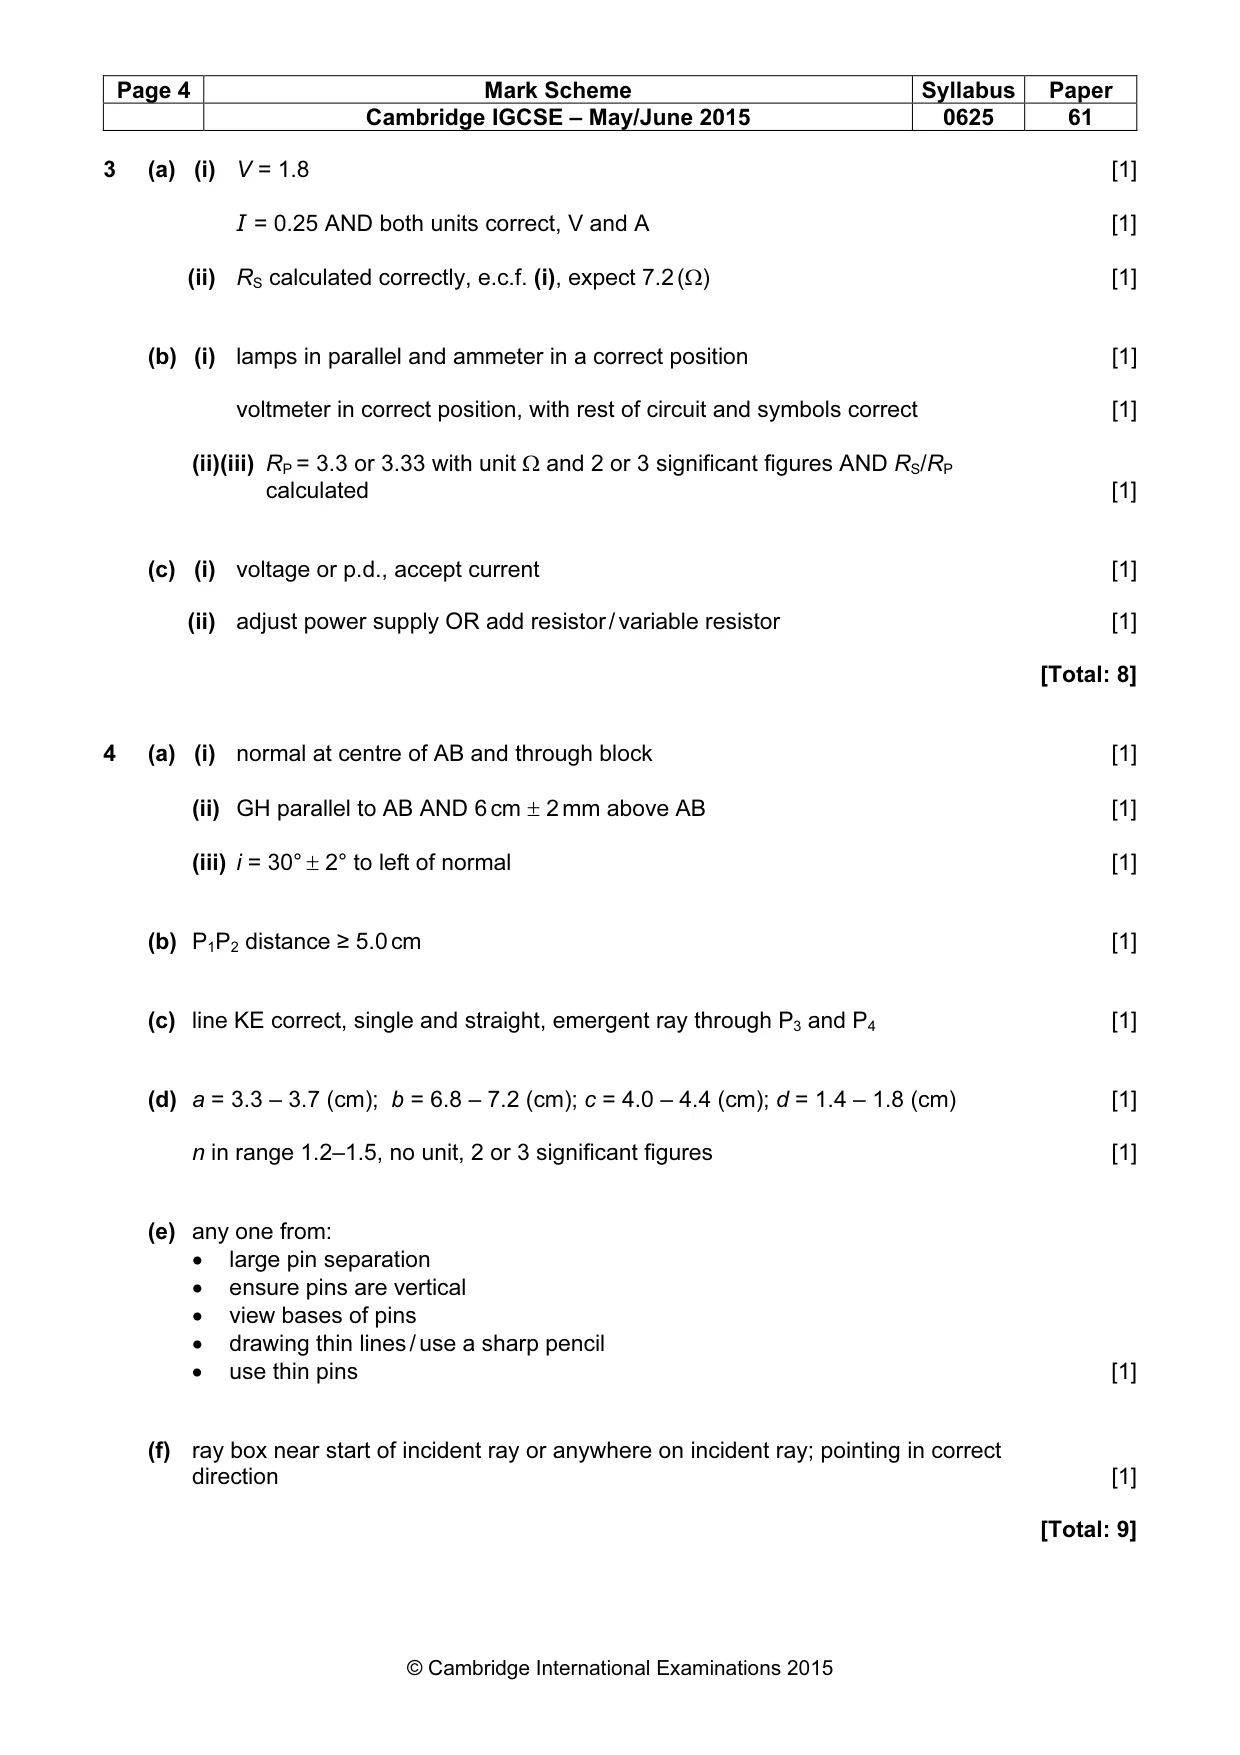
Mark scheme: 3 (a) (i) V = 1.8 [1] I = 0.25 AND both units correct, V and A [1] (ii) RS calculated correctly, e.c.f. (i), expect 7.2 (Ω) [1] (b) (i) lamps in parallel and ammeter in a correct position [1] voltmeter in correct position, with rest of circuit and symbols correct [1] (ii)(iii) RP = 3.3 or 3.33 with unit Ω and 2 or 3 significant figures AND RS/RP calculated [1] (c) (i) voltage or p.d., accept current [1] (ii) adjust power supply OR add resistor / variable resistor [1] [Total: 8]
Q4 · The class is investigating the refraction of light passing through a transparent block
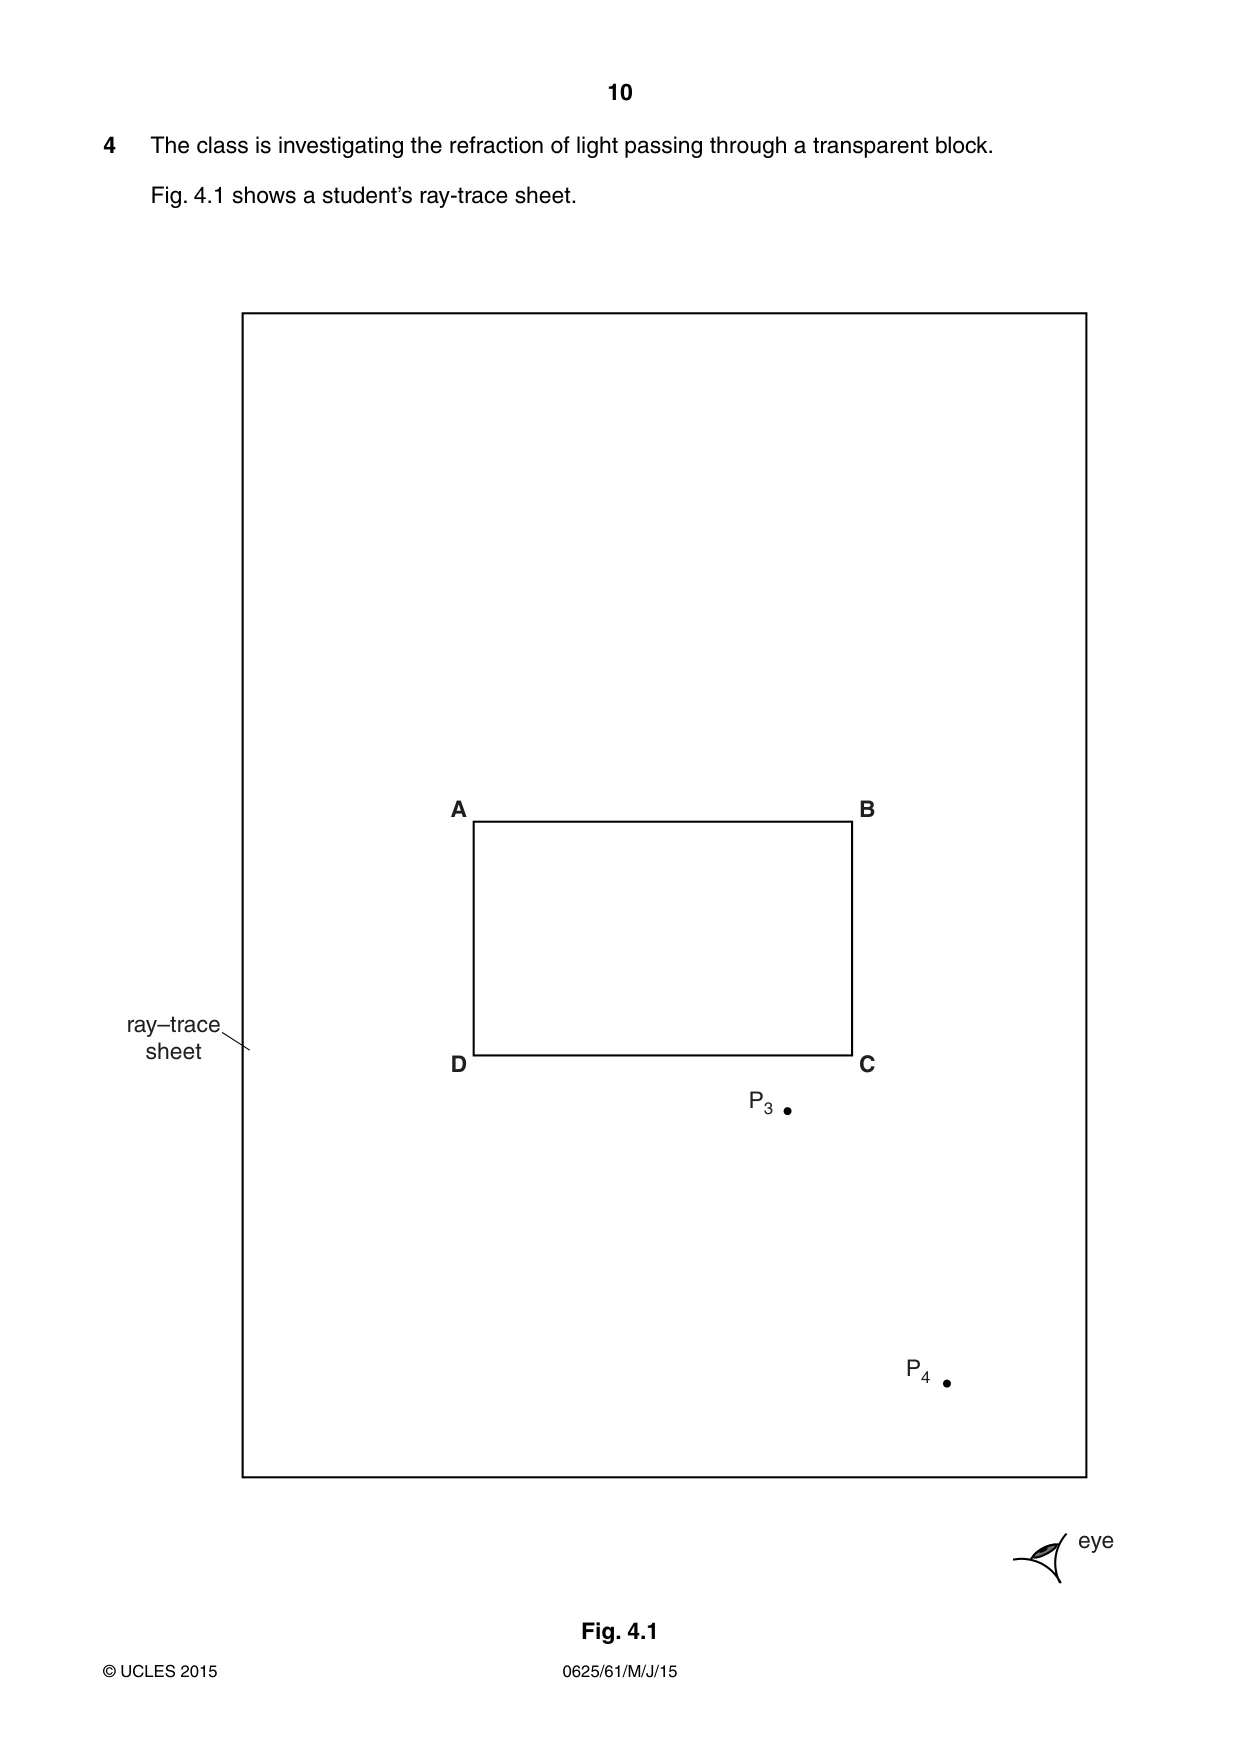
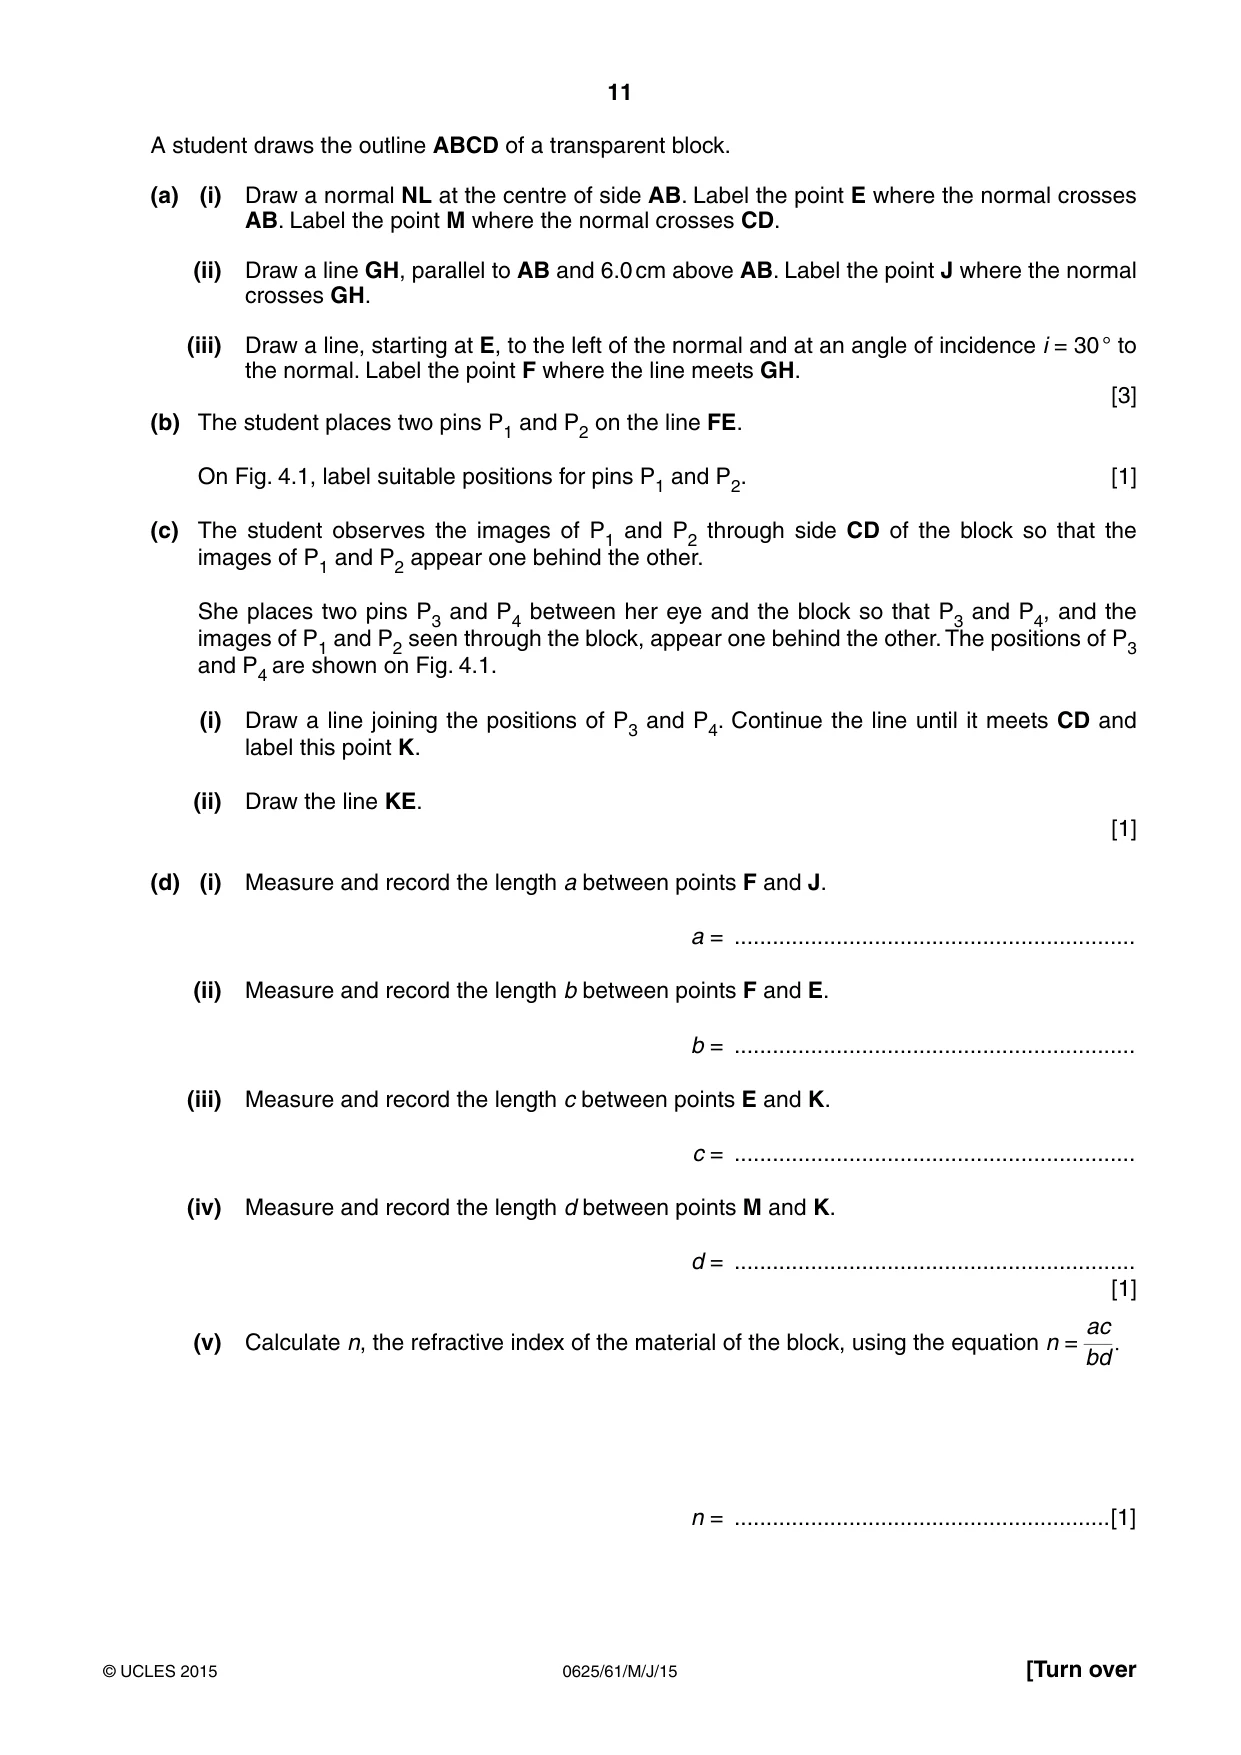
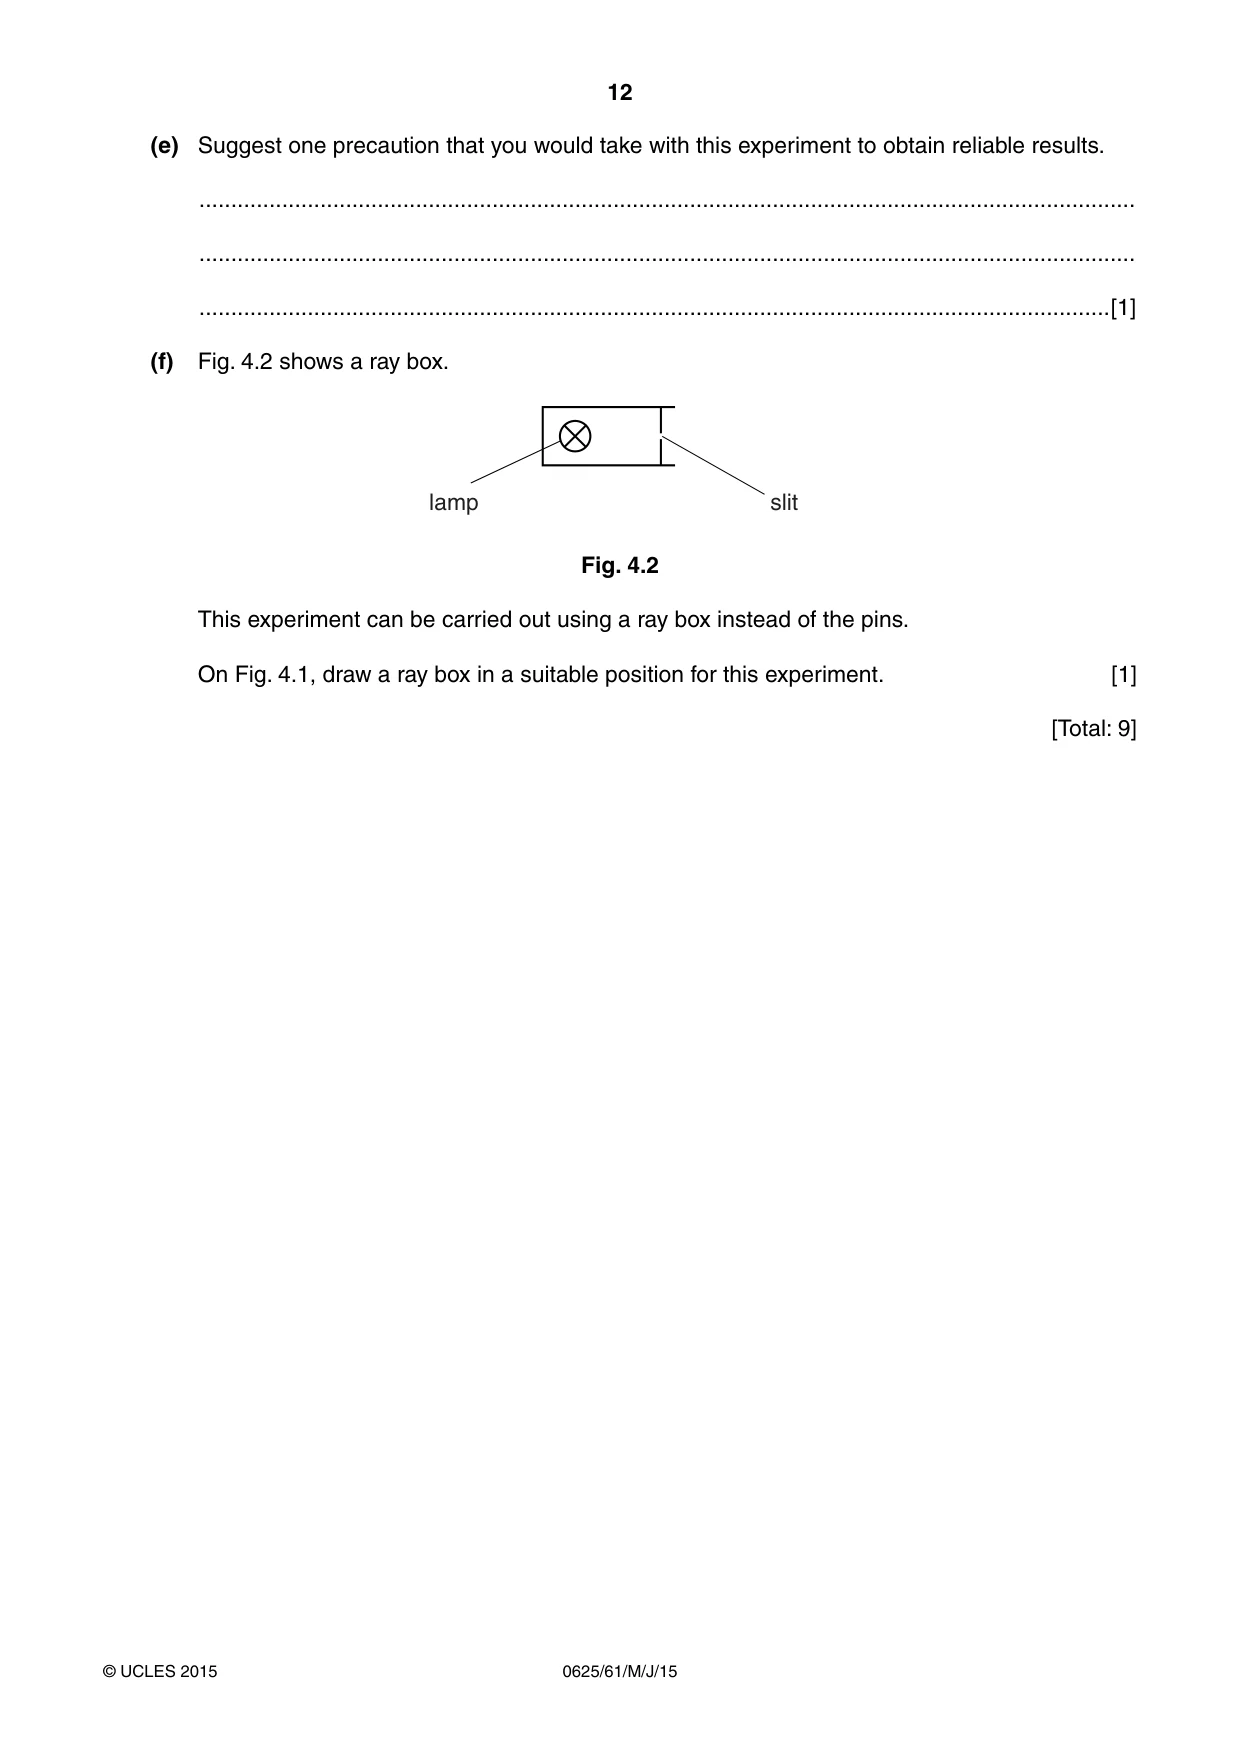
4 The class is investigating the refraction of light passing through a transparent block. Fig. 4.1 shows a student’s ray-trace sheet. A B ray–trace sheet D C P3 P4 eye Fig. 4.1 A student draws the outline ABCD of a transparent block. (a) (i) Draw a normal NL at the centre of side AB. Label the point E where the normal crosses AB. Label the point M where the normal crosses CD. (ii) Draw a line GH, parallel to AB and 6.0 cm above AB. Label the point J where the normal crosses GH. (iii) Draw a line, starting at E, to the left of the normal and at an angle of incidence i = 30 ° to the normal. Label the point F where the line meets GH. [3] (b) The student places two pins P1 and P2 on the line FE. On Fig. 4.1, label suitable positions for pins P1 and P2. [1] (c) The student observes the images of P1 and P2 through side CD of the block so that the images of P1 and P2 appear one behind the other. She places two pins P3 and P4 between her eye and the block so that P3 and P4, and the images of P1 and P2 seen through the block, appear one behind the other. The positions of P3 and P4 are shown on Fig. 4.1. (i) Draw a line joining the positions of P3 and P4. Continue the line until it meets CD and label this point K. (ii) Draw the line KE. [1] (d) (i) Measure and record the length a between points F and J. a = ............................................................... (ii) Measure and record the length b between points F and E. b = ............................................................... (iii) Measure and record the length c between points E and K. c = ............................................................... (iv) Measure and record the length d between points M and K. d = ............................................................... [1] ac (v) Calculate n, the refractive index of the material of the block, using the equation n = . bd n = ...........................................................[1] (e) Suggest one precaution that you would take with this experiment to obtain reliable results. ................................................................................................................................................... ................................................................................................................................................... ...............................................................................................................................................[1] (f) Fig. 4.2 shows a ray box. lamp slit Fig. 4.2 This experiment can be carried out using a ray box instead of the pins. On Fig. 4.1, draw a ray box in a suitable position for this experiment. [1] [Total: 9]
Mark scheme: 4 (a) (i) normal at centre of AB and through block [1] (ii) GH parallel to AB AND 6 cm ± 2 mm above AB [1] (iii) i = 30° ± 2° to left of normal [1] (b) P1P2 distance ≥ 5.0 cm [1] (c) line KE correct, single and straight, emergent ray through P3 and P4 [1] (d) a = 3.3 – 3.7 (cm); b = 6.8 – 7.2 (cm); c = 4.0 – 4.4 (cm); d = 1.4 – 1.8 (cm) [1] n in range 1.2–1.5, no unit, 2 or 3 significant figures [1] (e) any one from: • large pin separation • ensure pins are vertical • view bases of pins • drawing thin lines / use a sharp pencil • use thin pins [1] (f) ray box near start of incident ray or anywhere on incident ray; pointing in correct direction [1] [Total: 9] 2 2
Q5 · The class is investigating the oscillations of a pendulum
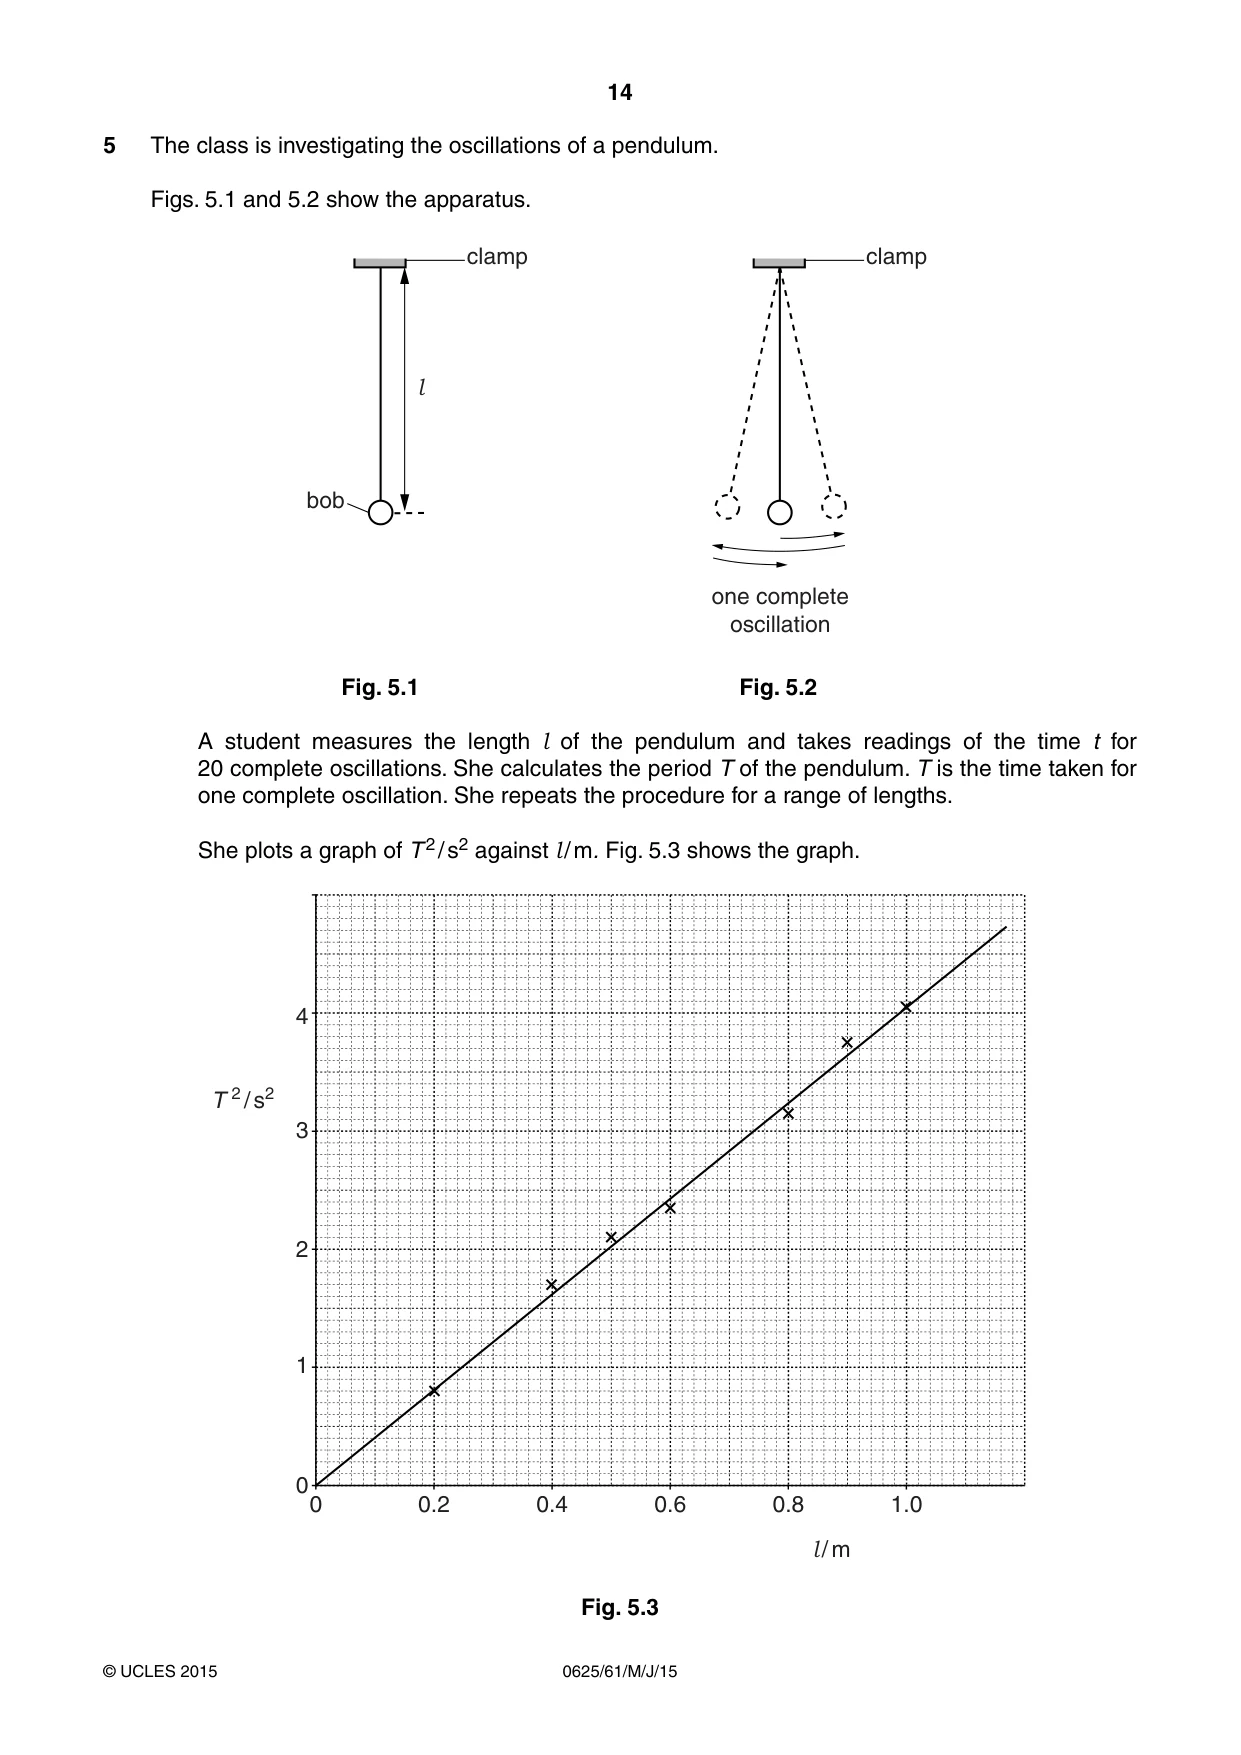
5 The class is investigating the oscillations of a pendulum. Figs. 5.1 and 5.2 show the apparatus. clamp clamp l bob one complete oscillation Fig. 5.1 Fig. 5.2 A student measures the length l of the pendulum and takes readings of the time t for 20 complete oscillations. She calculates the period T of the pendulum. T is the time taken for one complete oscillation. She repeats the procedure for a range of lengths. She plots a graph of T 2 / s2 against l / m. Fig. 5.3 shows the graph. 4 T 2 / s2 3 2 1 0 0 0.2 0.4 0.6 0.8 1.0 l / m Fig. 5.3 (a) Using the graph, determine the length l of a pendulum that has a period T = 2.0 s. Show clearly on the graph how you obtained the necessary information. l = ...........................................................[3] (b) Explain why measuring the time for 20 swings, rather than for 1 swing, gives a more accurate value for T. ................................................................................................................................................... ...............................................................................................................................................[1] (c) Another student investigates the effect that changing the mass m of the pendulum bob has on the period T of the pendulum. (i) Suggest how many different masses the student should use for this laboratory experiment. number of different masses = ............................................................... (ii) Suggest a range of suitable values for the masses. suitable range of masses = ............................................................... [2] [Total: 6]
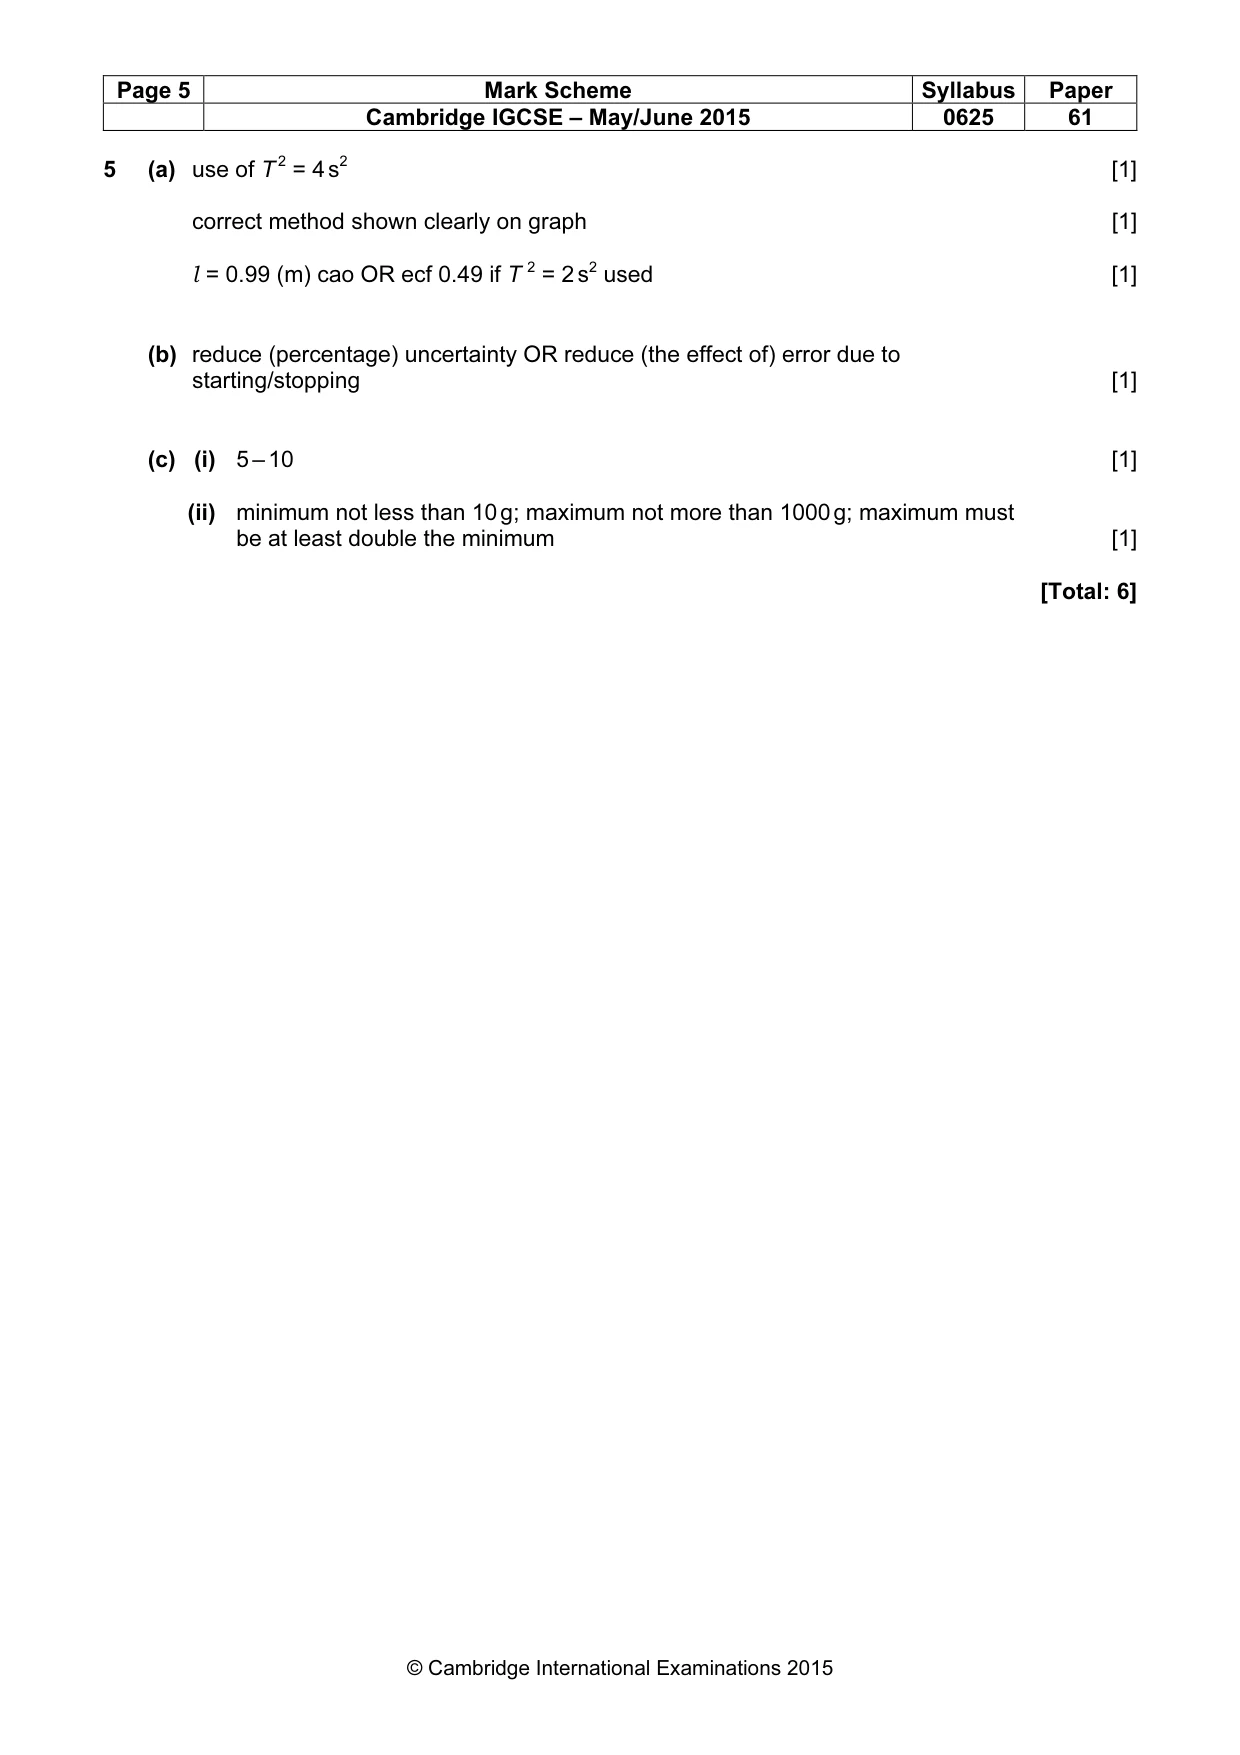
Mark scheme: 5 (a) use of T 2 = 4 s2 [1] correct method shown clearly on graph [1] l = 0.99 (m) cao OR ecf 0.49 if T 2 = 2 s2 used [1] (b) reduce (percentage) uncertainty OR reduce (the effect of) error due to starting/stopping [1] (c) (i) 5 – 10 [1] (ii) minimum not less than 10 g; maximum not more than 1000 g; maximum must be at least double the minimum [1] [Total: 6]
What was in this paper
The subtopics covered by these 5 questions, and how many questions each got. Open one in a new tab to see every Cambridge question on it.
What you needed in this session
Cambridge’s own grade thresholds for 2015 May/June, Paper 6 · Variant 1. A higher threshold means an easier paper — the bar moves with how the cohort did.