Cambridge IGCSE Physics 0625 — 2013 May/June Paper 6 · Variant 3
0625/63/M/J/13 · 5 questions · 40 marks · ≈45 min
The question paper and its mark scheme, free to read here and free to download. This is Cambridge’s own paper, exactly as it was sat.
Question paper16 pages
Mark scheme4 pages
Answers below. Sit the paper first if you are practising.
Questions as text
Q1 · Some IGCSE students are investigating the cooling of water
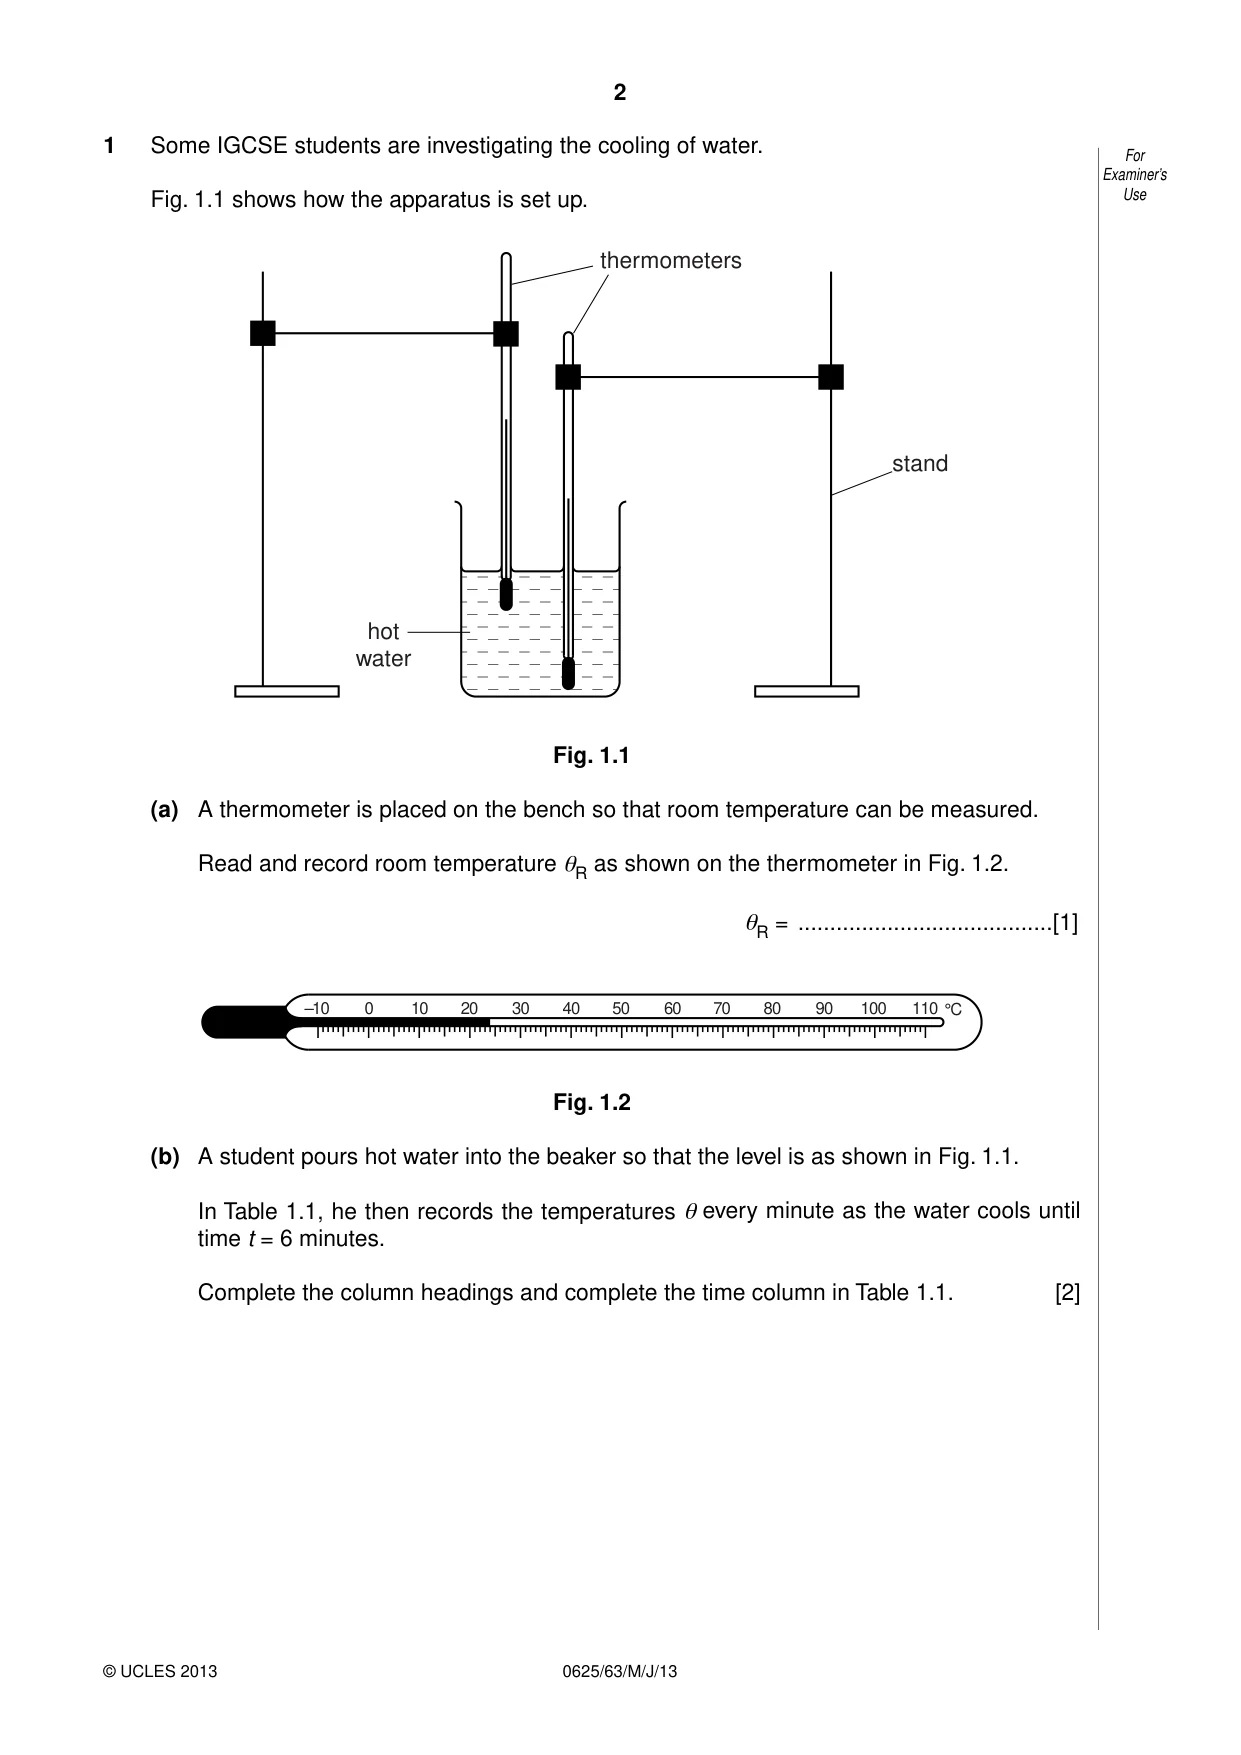
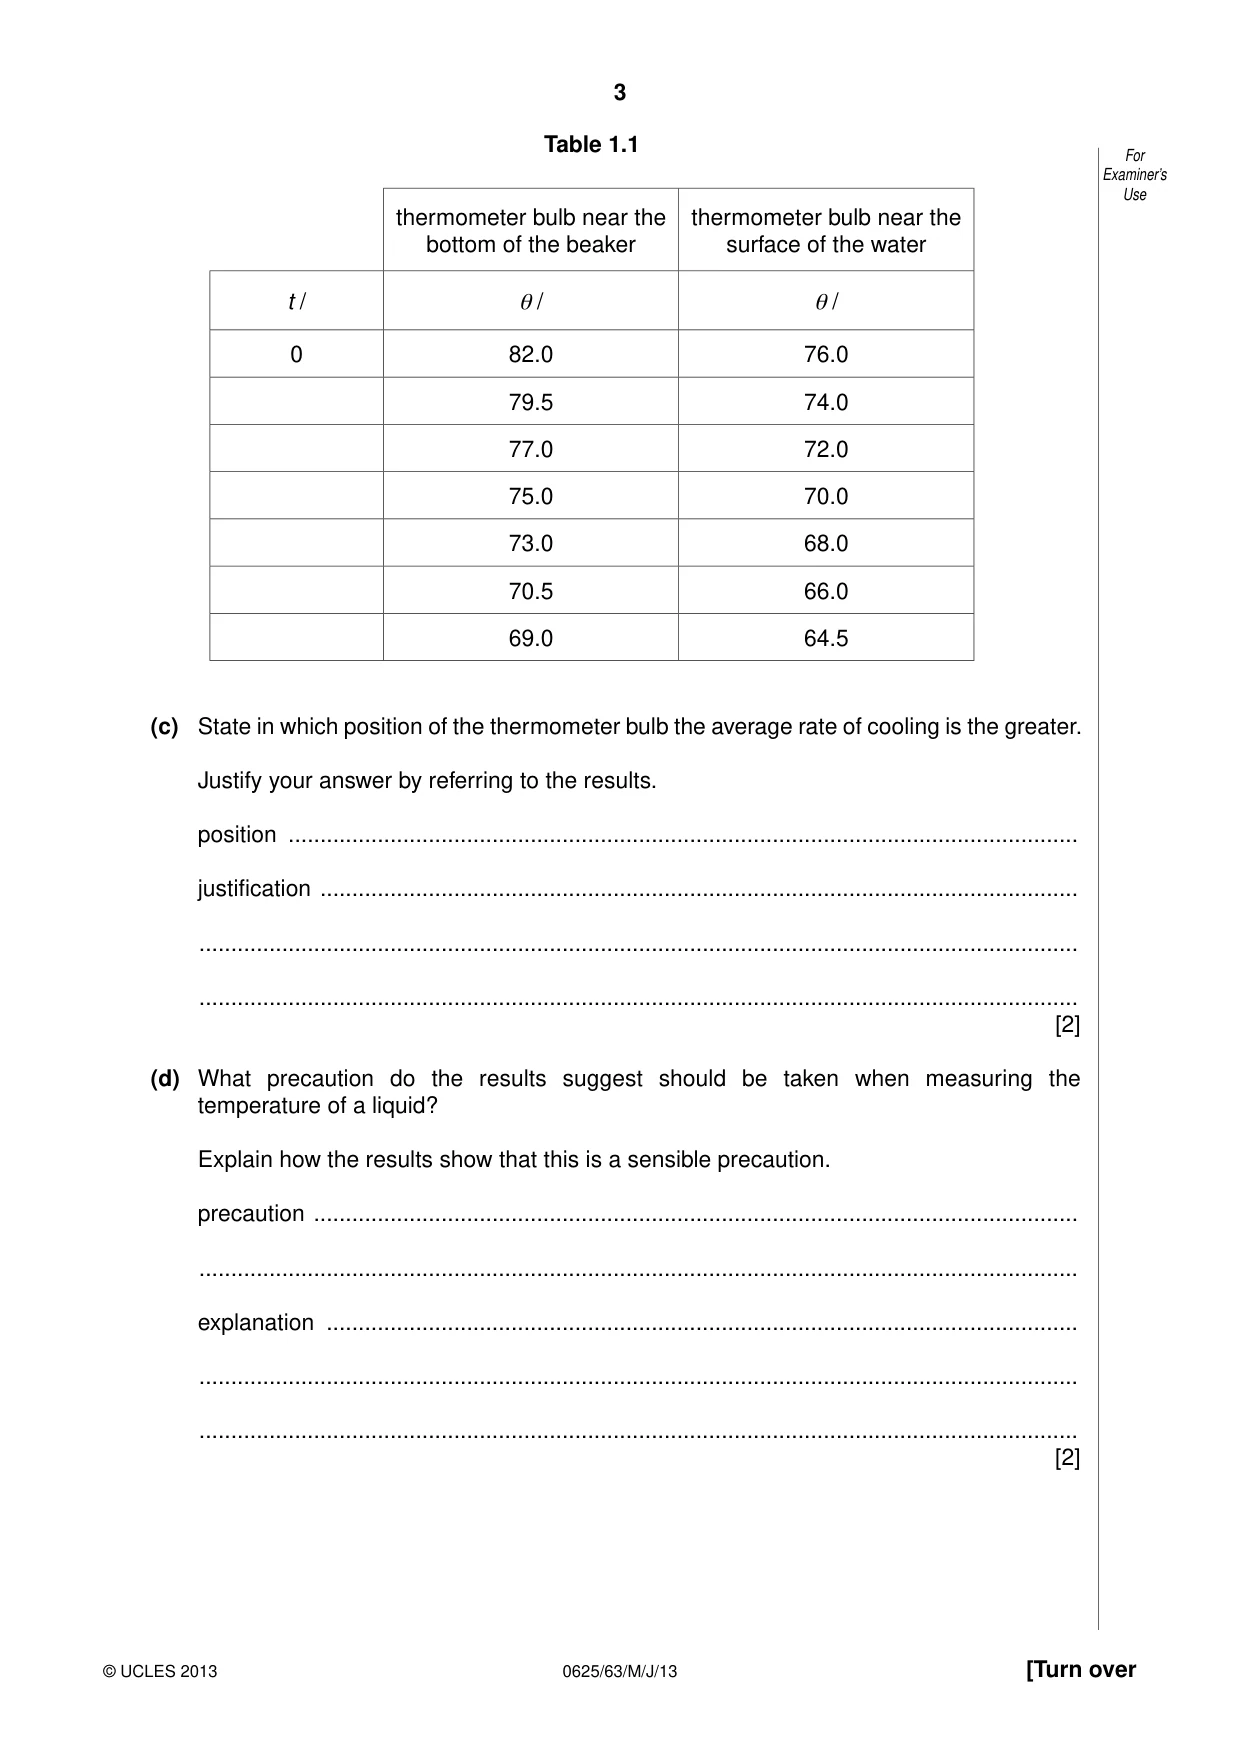
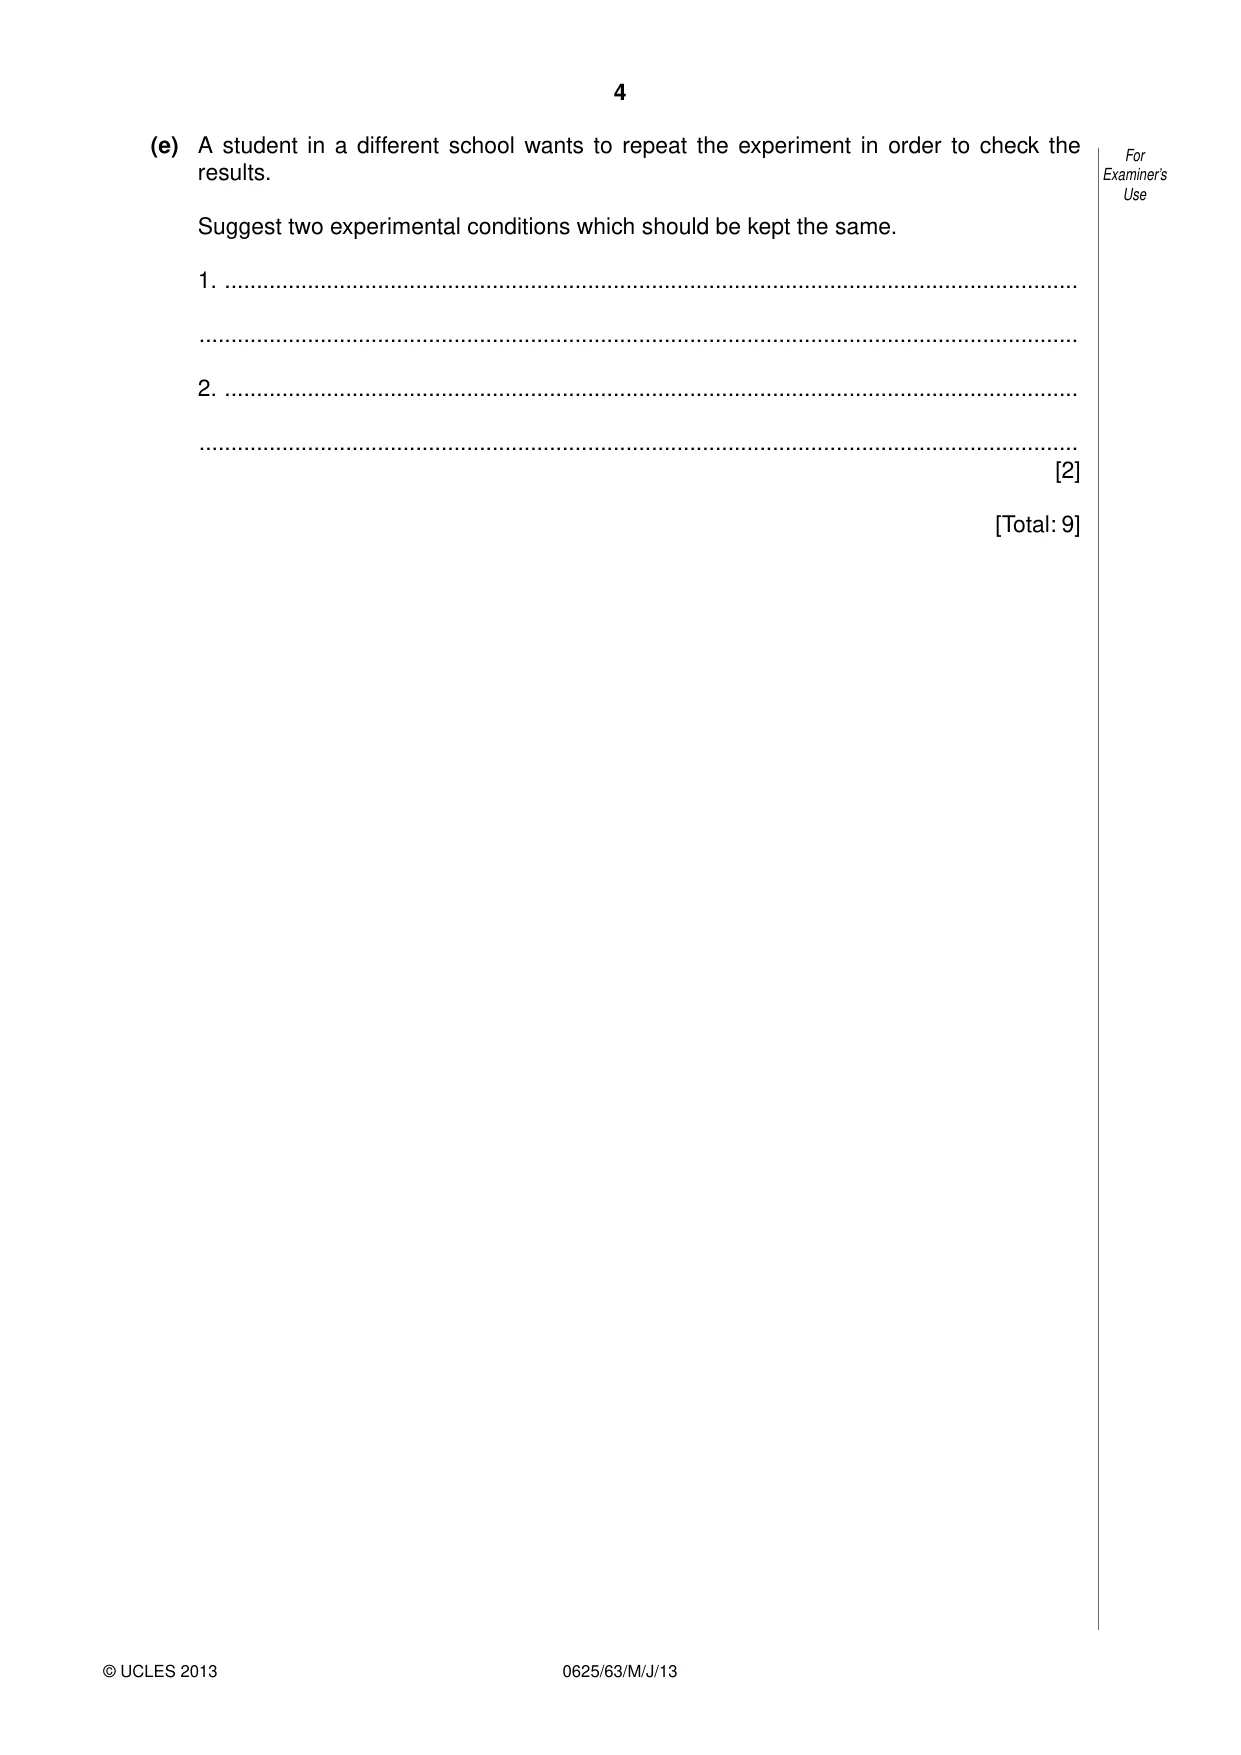
1 Some IGCSE students are investigating the cooling of water. For Examiner’s Fig. 1.1 shows how the apparatus is set up. Use thermometers stand hot water Fig. 1.1 (a) A thermometer is placed on the bench so that room temperature can be measured. Read and record room temperature θR as shown on the thermometer in Fig. 1.2. θR = ........................................[1] –10 0 10 20 30 40 50 60 70 80 90 100 110 °C Fig. 1.2 (b) A student pours hot water into the beaker so that the level is as shown in Fig. 1.1. In Table 1.1, he then records the temperatures θ every minute as the water cools until time t = 6 minutes. Complete the column headings and complete the time column in Table 1.1. [2] Table 1.1 For Examiner’s Use thermometer bulb near the thermometer bulb near the bottom of the beaker surface of the water t / θ / θ / 0 82.0 76.0 79.5 74.0 77.0 72.0 75.0 70.0 73.0 68.0 70.5 66.0 69.0 64.5 (c) State in which position of the thermometer bulb the average rate of cooling is the greater. Justify your answer by referring to the results. position ............................................................................................................................ justification ....................................................................................................................... .......................................................................................................................................... .......................................................................................................................................... [2] (d) What precaution do the results suggest should be taken when measuring the temperature of a liquid? Explain how the results show that this is a sensible precaution. precaution ........................................................................................................................ .......................................................................................................................................... explanation ...................................................................................................................... .......................................................................................................................................... .......................................................................................................................................... [2] (e) A student in a different school wants to repeat the experiment in order to check the For results. Examiner’s Use Suggest two experimental conditions which should be kept the same. 1. ...................................................................................................................................... .......................................................................................................................................... 2. ...................................................................................................................................... .......................................................................................................................................... [2] [Total: 9]
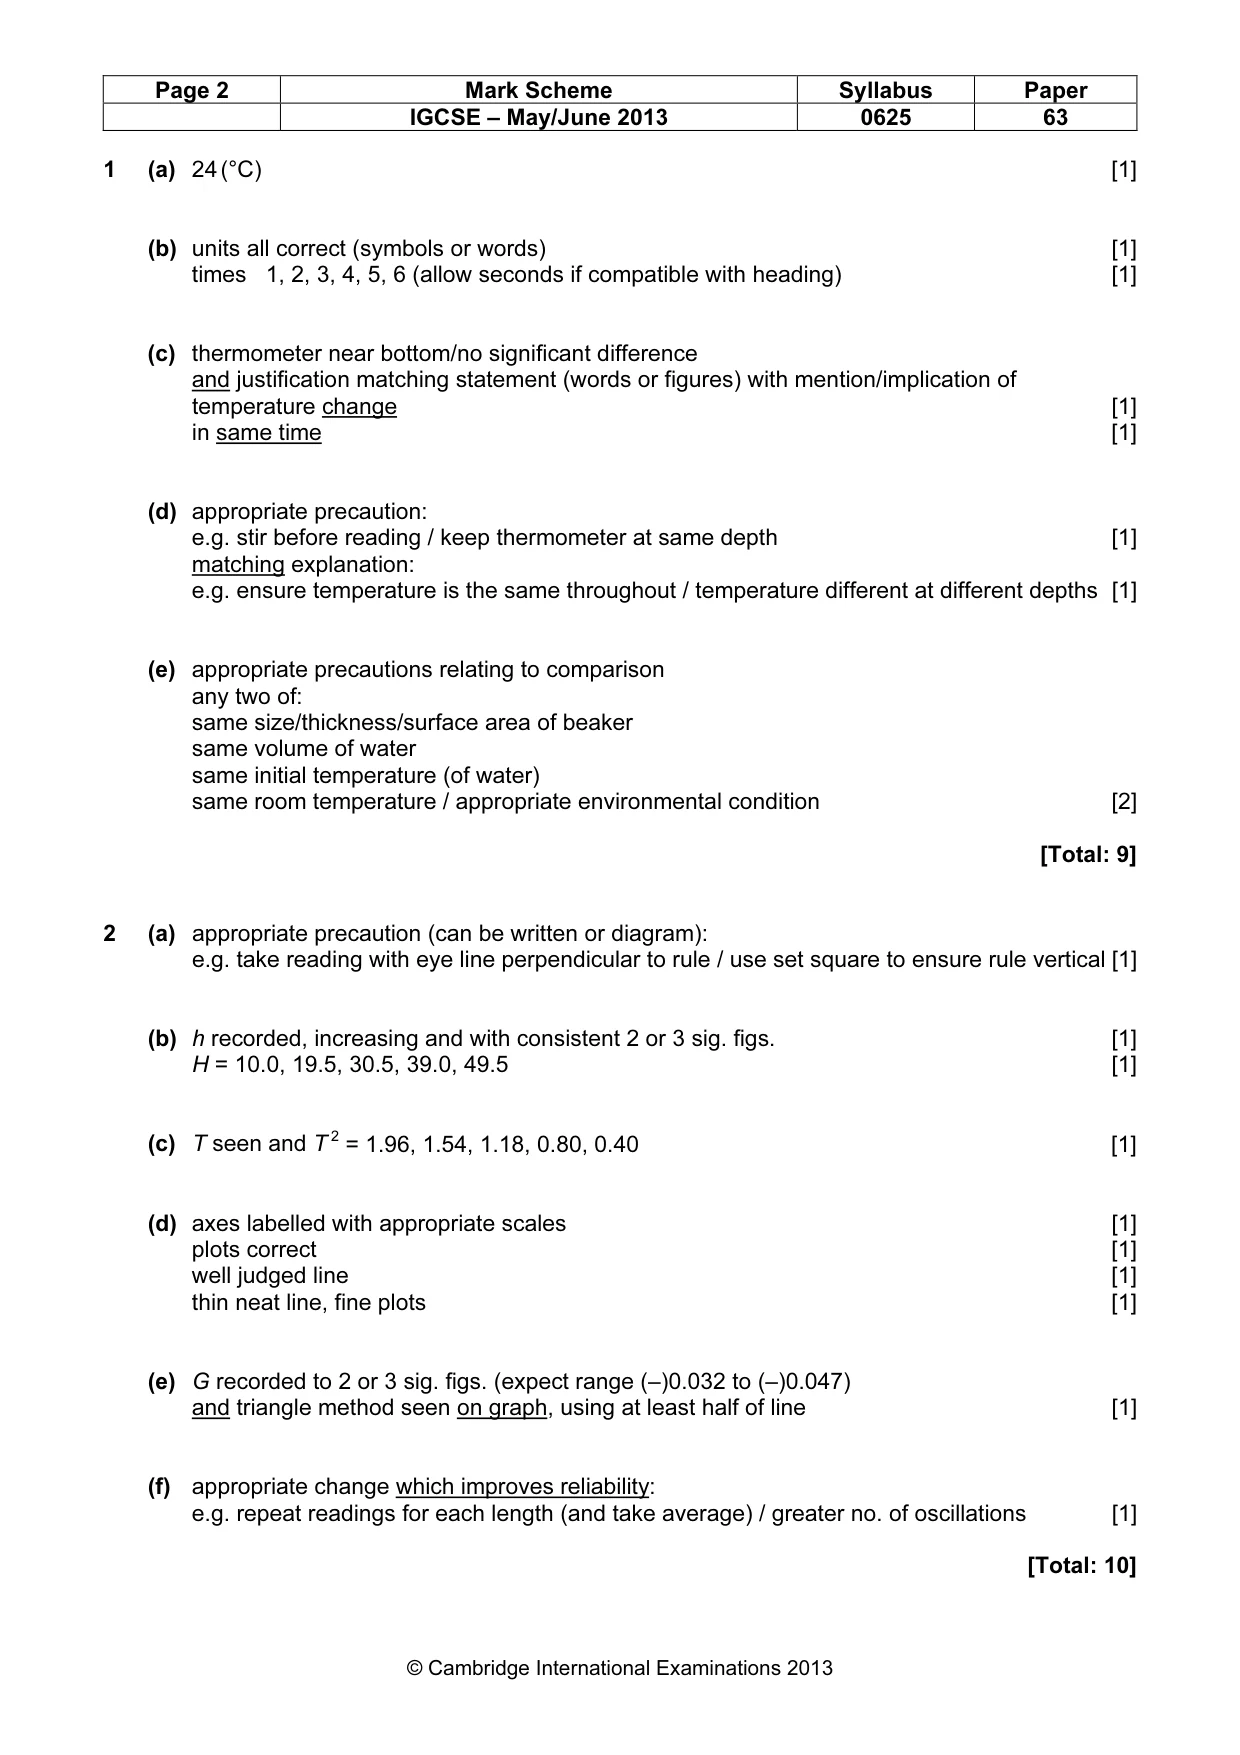
Mark scheme: 1 (a) 24 (°C) [1] (b) units all correct (symbols or words) [1] times 1, 2, 3, 4, 5, 6 (allow seconds if compatible with heading) [1] (c) thermometer near bottom/no significant difference and justification matching statement (words or figures) with mention/implication of temperature change [1] in same time [1] (d) appropriate precaution: e.g. stir before reading / keep thermometer at same depth [1] matching explanation: e.g. ensure temperature is the same throughout / temperature different at different depths [1] (e) appropriate precautions relating to comparison any two of: same size/thickness/surface area of beaker same volume of water same initial temperature (of water) same room temperature / appropriate environmental condition [2] [Total: 9]
Q2 · The IGCSE class is investigating the oscillation of a pendulum
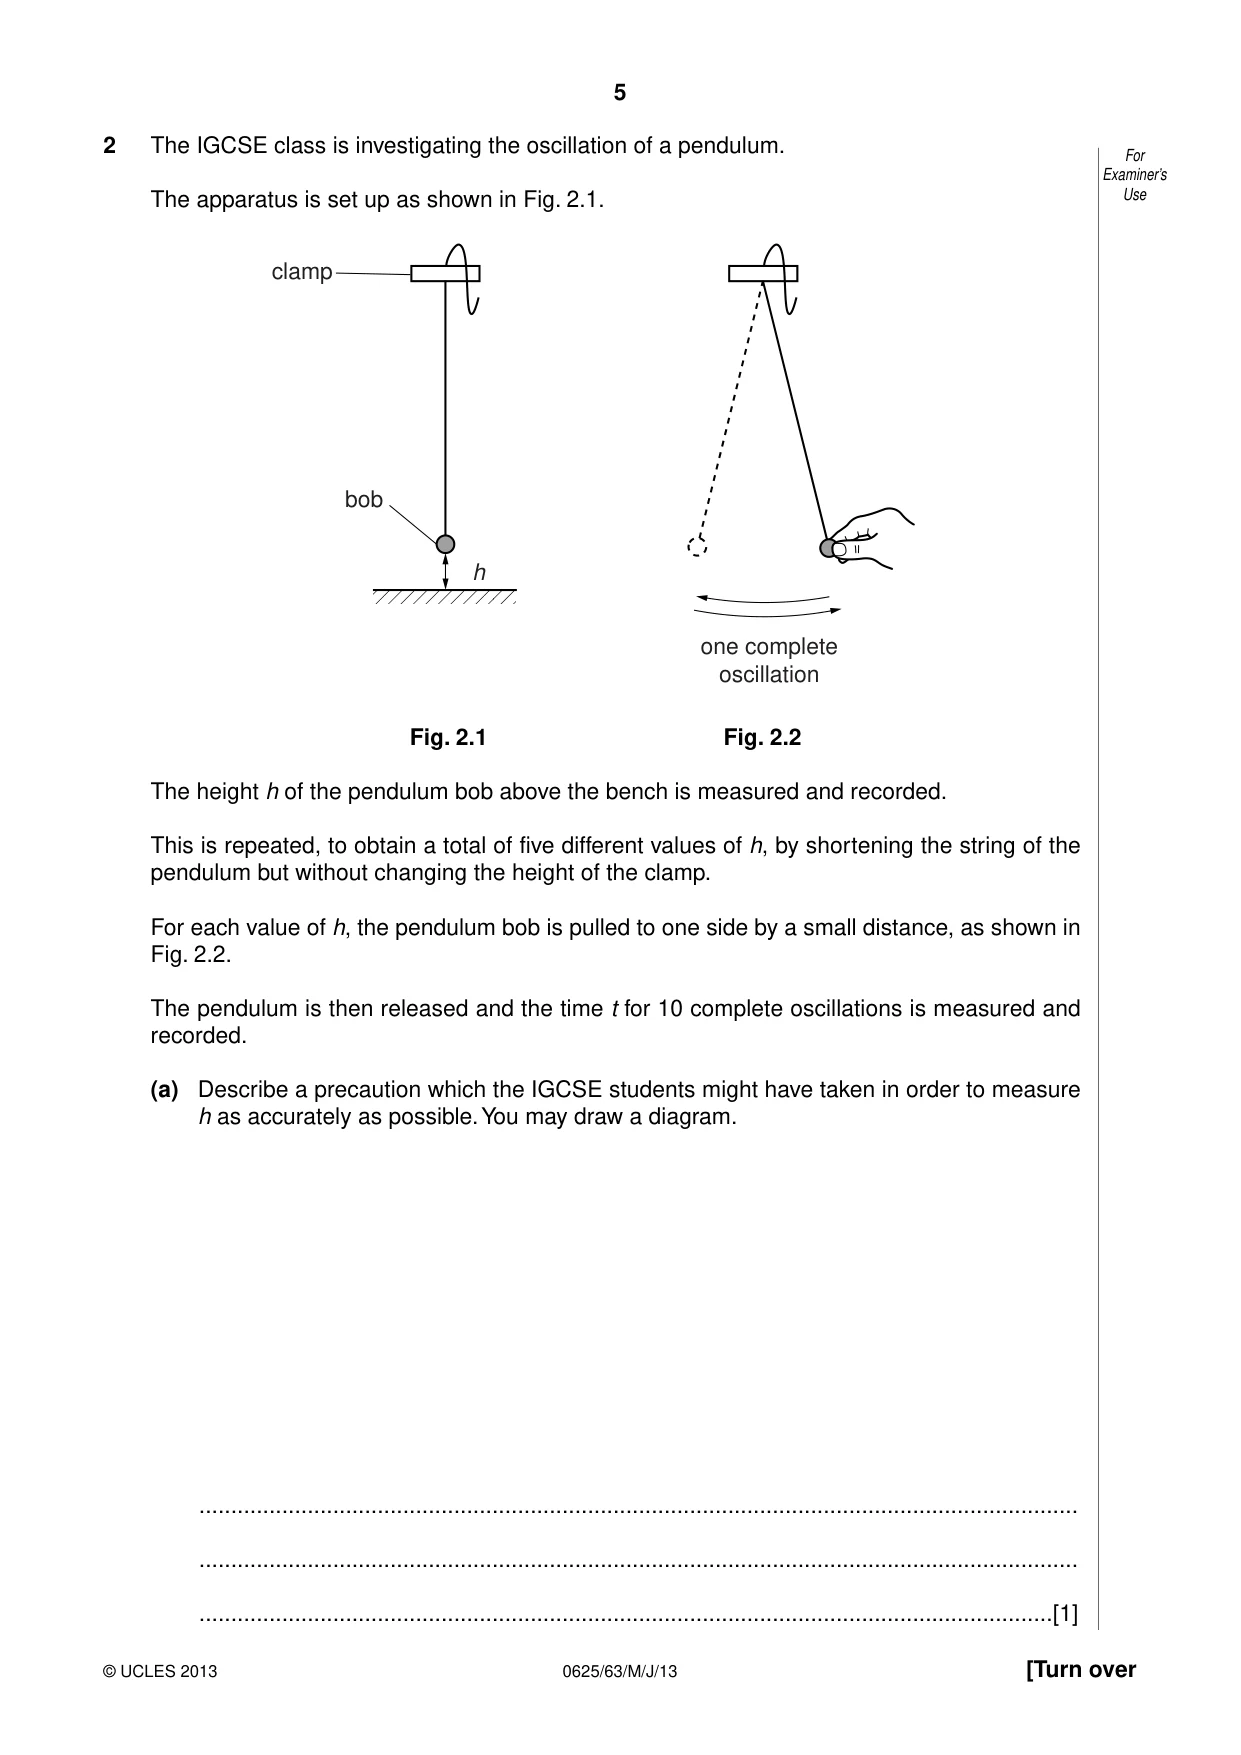
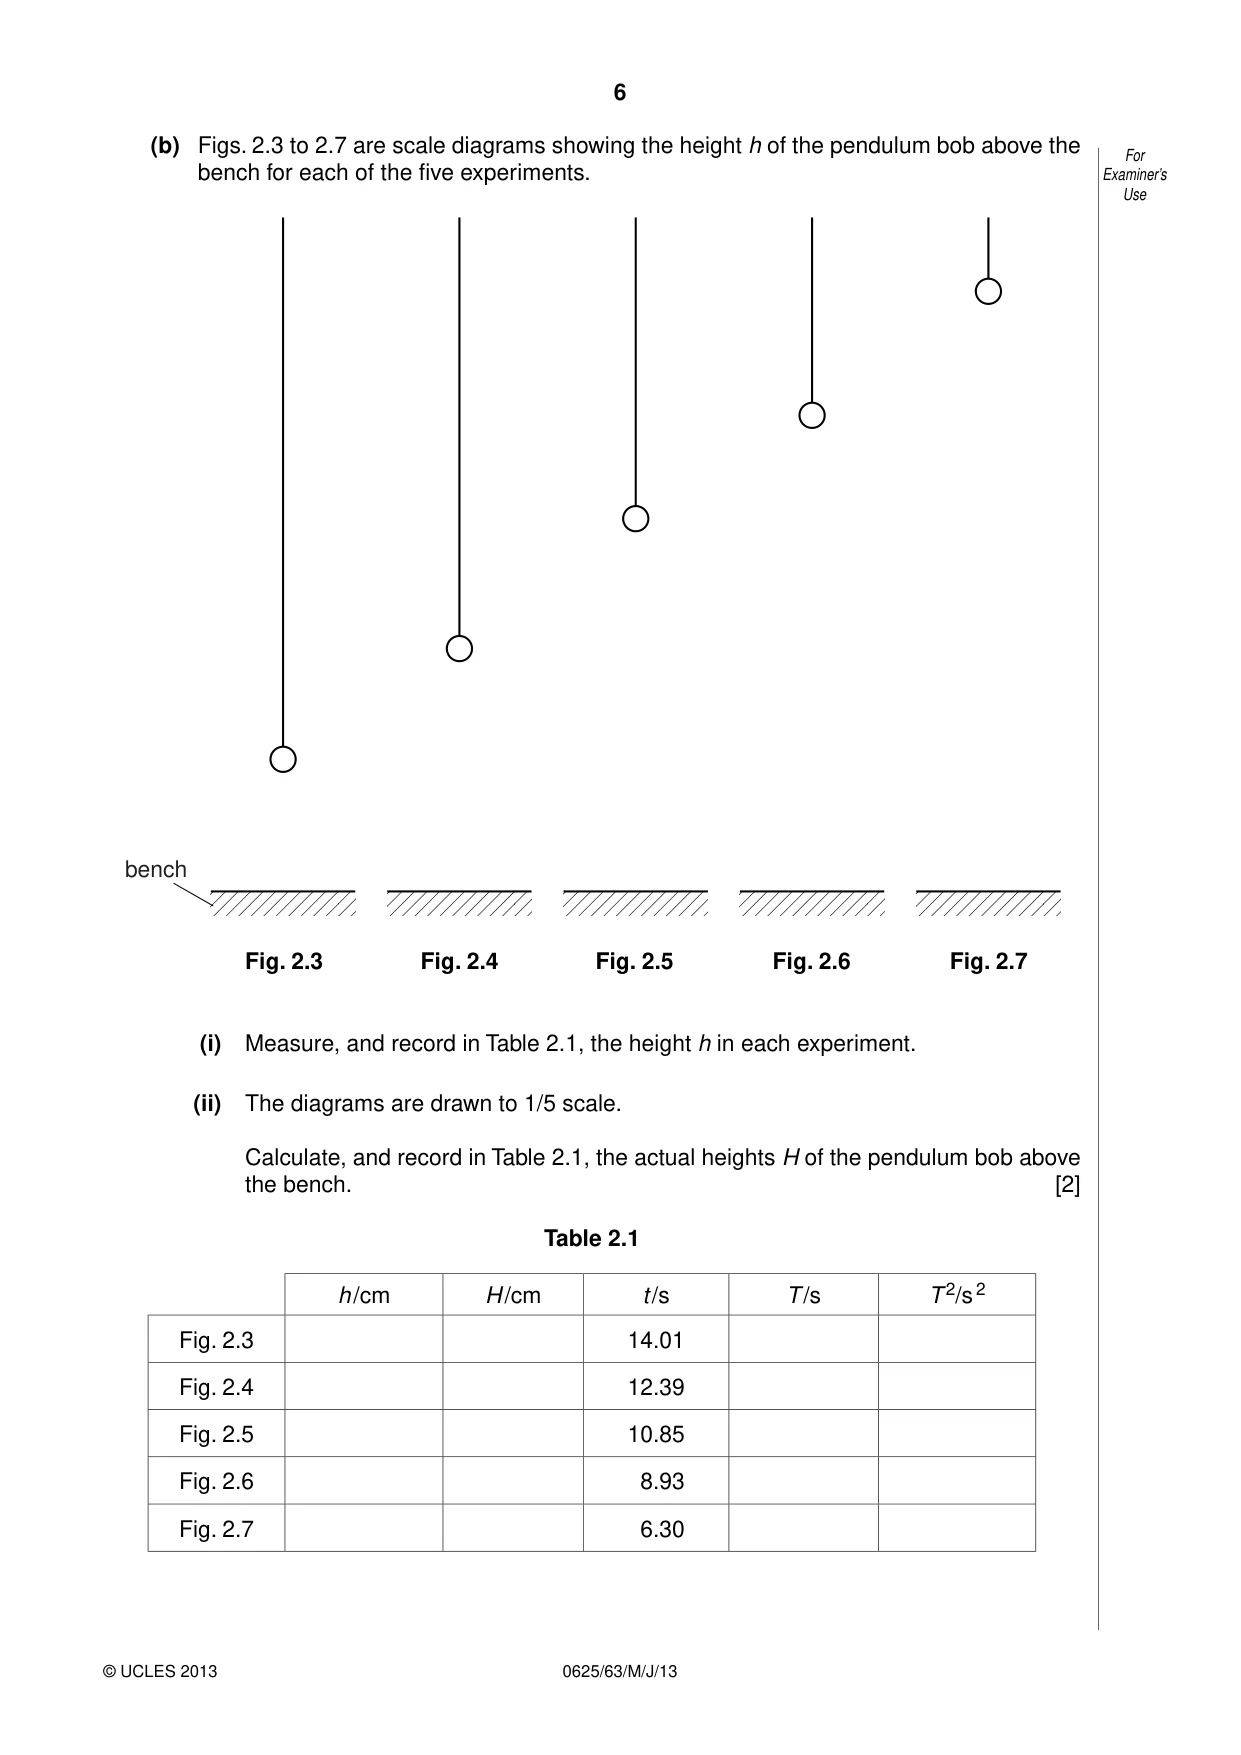
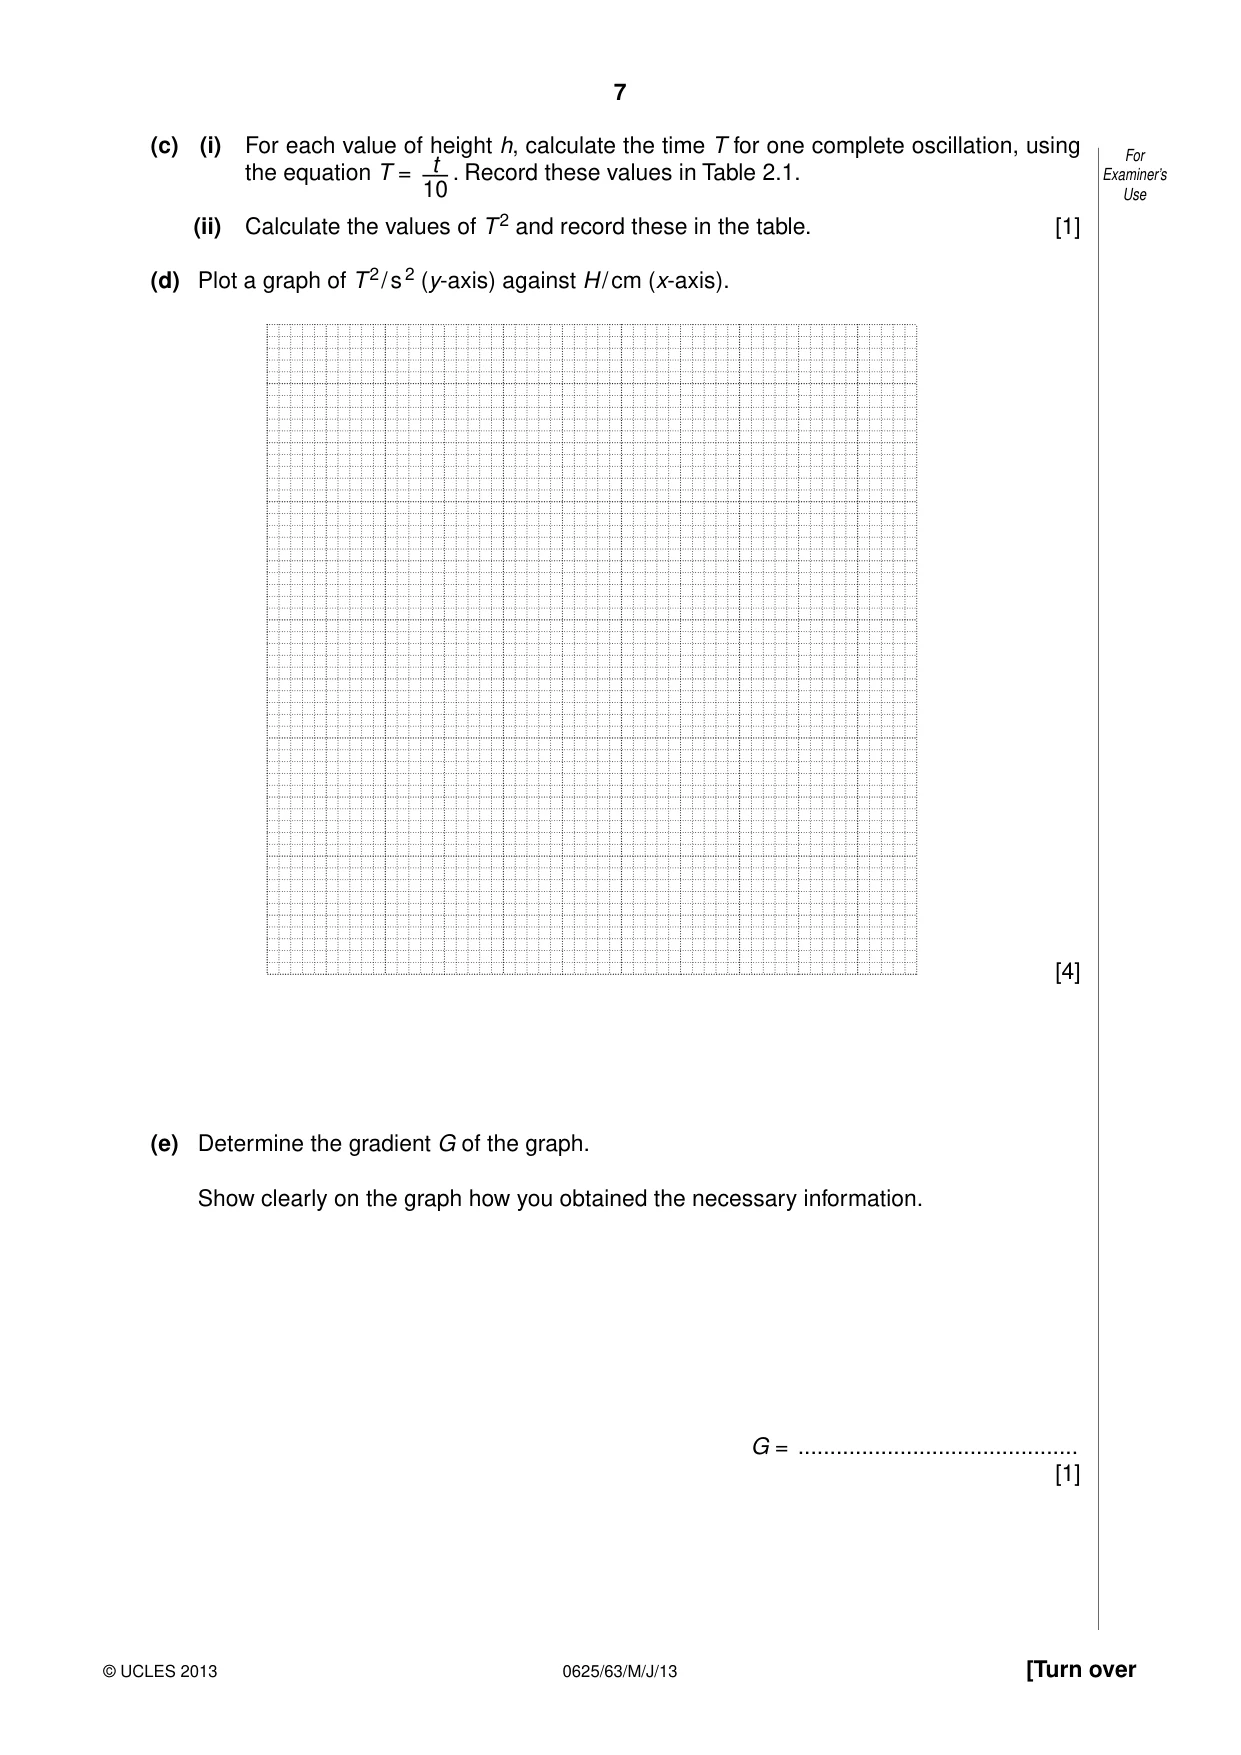
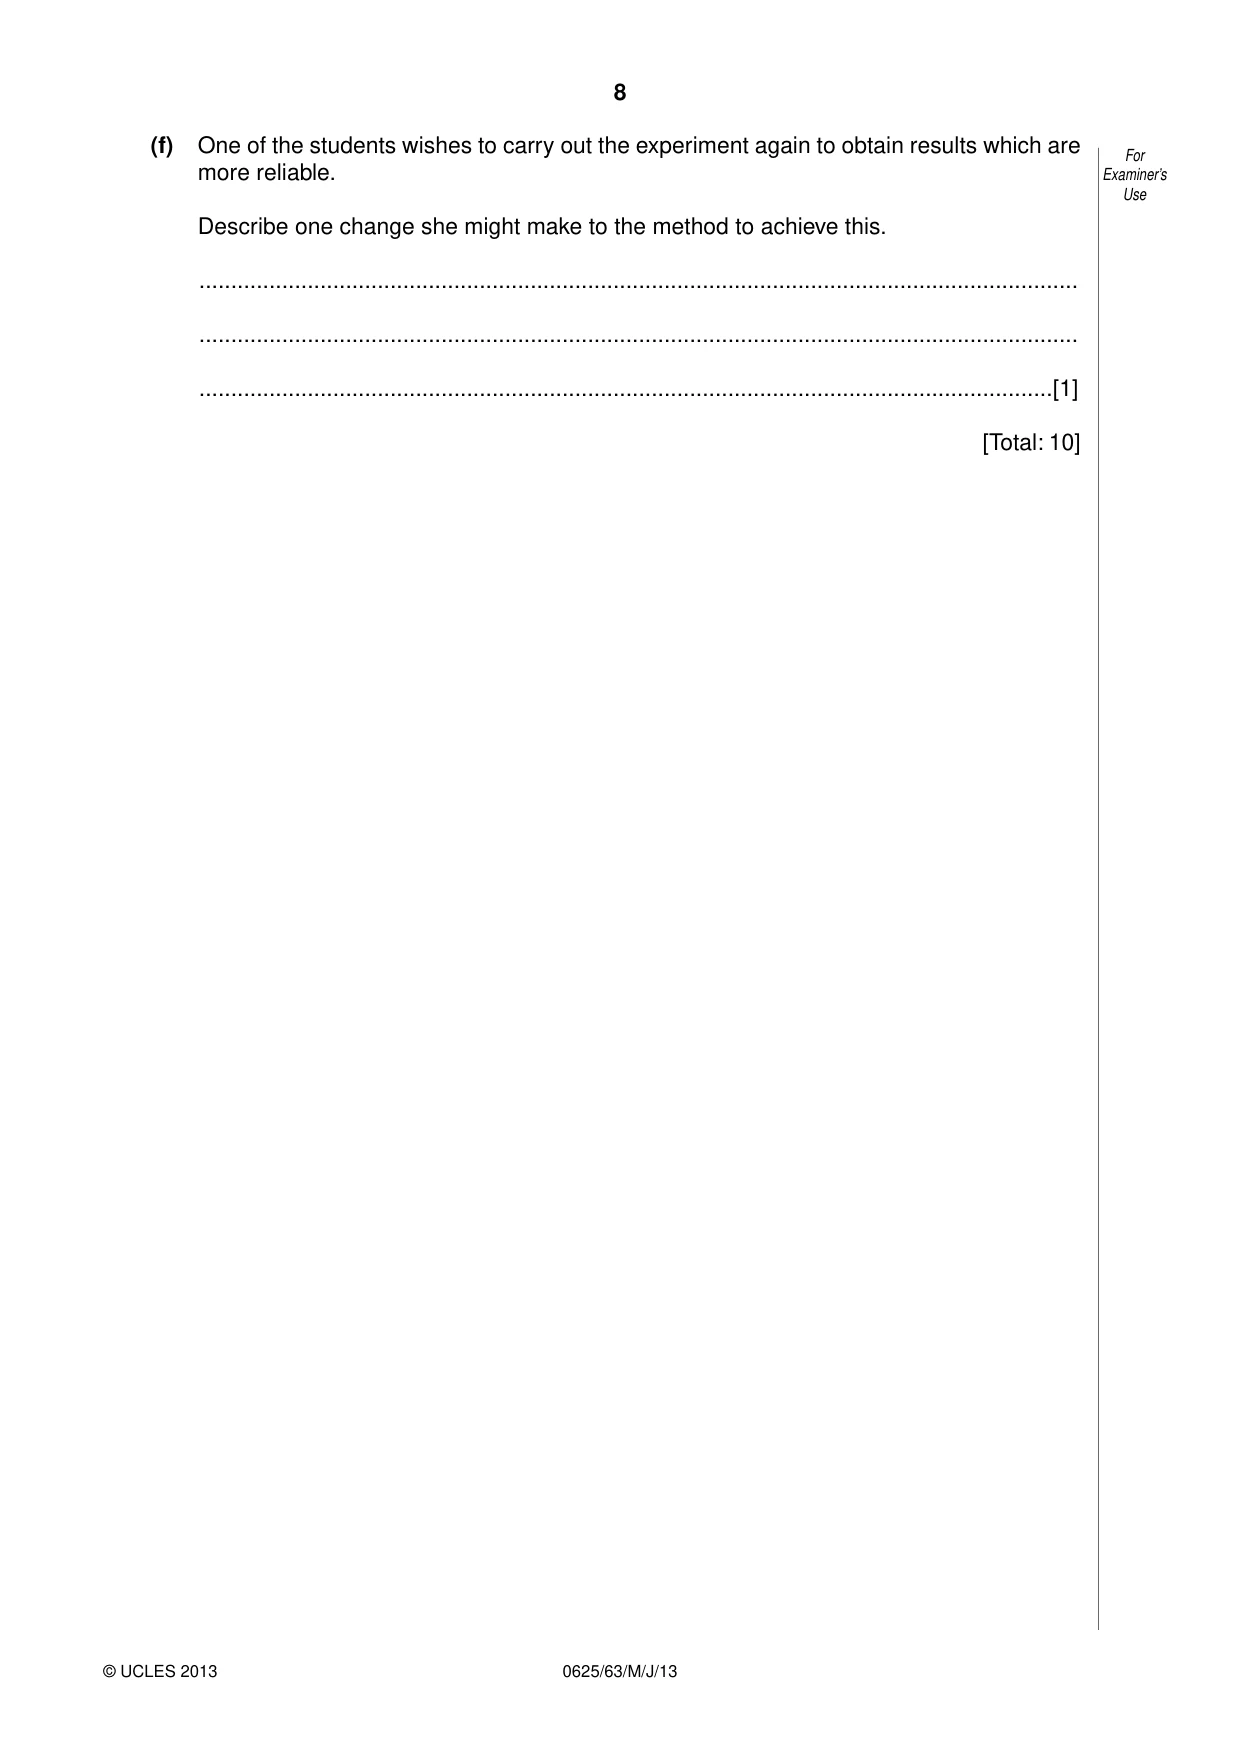
2 The IGCSE class is investigating the oscillation of a pendulum. For Examiner’s The apparatus is set up as shown in Fig. 2.1. Use clamp bob h one complete oscillation Fig. 2.1 Fig. 2.2 The height h of the pendulum bob above the bench is measured and recorded. This is repeated, to obtain a total of five different values of h, by shortening the string of the pendulum but without changing the height of the clamp. For each value of h, the pendulum bob is pulled to one side by a small distance, as shown in Fig. 2.2. The pendulum is then released and the time t for 10 complete oscillations is measured and recorded. (a) Describe a precaution which the IGCSE students might have taken in order to measure h as accurately as possible. You may draw a diagram. .......................................................................................................................................... .......................................................................................................................................... ......................................................................................................................................[1] (b) Figs. 2.3 to 2.7 are scale diagrams showing the height h of the pendulum bob above the For bench for each of the five experiments. Examiner’s Use bench Fig. 2.3 Fig. 2.4 Fig. 2.5 Fig. 2.6 Fig. 2.7 (i) Measure, and record in Table 2.1, the height h in each experiment. (ii) The diagrams are drawn to 1/5 scale. Calculate, and record in Table 2.1, the actual heights H of the pendulum bob above the bench. [2] Table 2.1 h /cm H /cm t /s T /s T 2/s 2 Fig. 2.3 14.01 Fig. 2.4 12.39 Fig. 2.5 10.85 Fig. 2.6 8.93 Fig. 2.7 6.30 (c) (i) For each value of height h, calculate the time T for one complete oscillation, using For the equation T = t–– . Record these values in Table 2.1. Examiner’s 10 Use (ii) Calculate the values of T 2 and record these in the table. [1] (d) Plot a graph of T 2 / s 2 (y-axis) against H / cm (x-axis). [4] (e) Determine the gradient G of the graph. Show clearly on the graph how you obtained the necessary information. G = ............................................ [1] (f) One of the students wishes to carry out the experiment again to obtain results which are For more reliable. Examiner’s Use Describe one change she might make to the method to achieve this. .......................................................................................................................................... .......................................................................................................................................... ......................................................................................................................................[1] [Total: 10]
Mark scheme: 2 (a) appropriate precaution (can be written or diagram): e.g. take reading with eye line perpendicular to rule / use set square to ensure rule vertical [1] (b) h recorded, increasing and with consistent 2 or 3 sig. figs. [1] H = 10.0, 19.5, 30.5, 39.0, 49.5 [1] (c) T seen and T 2 = 1.96, 1.54, 1.18, 0.80, 0.40 [1] (d) axes labelled with appropriate scales [1] plots correct [1] well judged line [1] thin neat line, fine plots [1] (e) G recorded to 2 or 3 sig. figs. (expect range (–)0.032 to (–)0.047) and triangle method seen on graph, using at least half of line [1] (f) appropriate change which improves reliability: e.g. repeat readings for each length (and take average) / greater no. of oscillations [1] [Total: 10] IGCSE – May/June 2013 0625 63
Q3 · Students in the IGCSE class are investigating the resistance of electric circuits with…
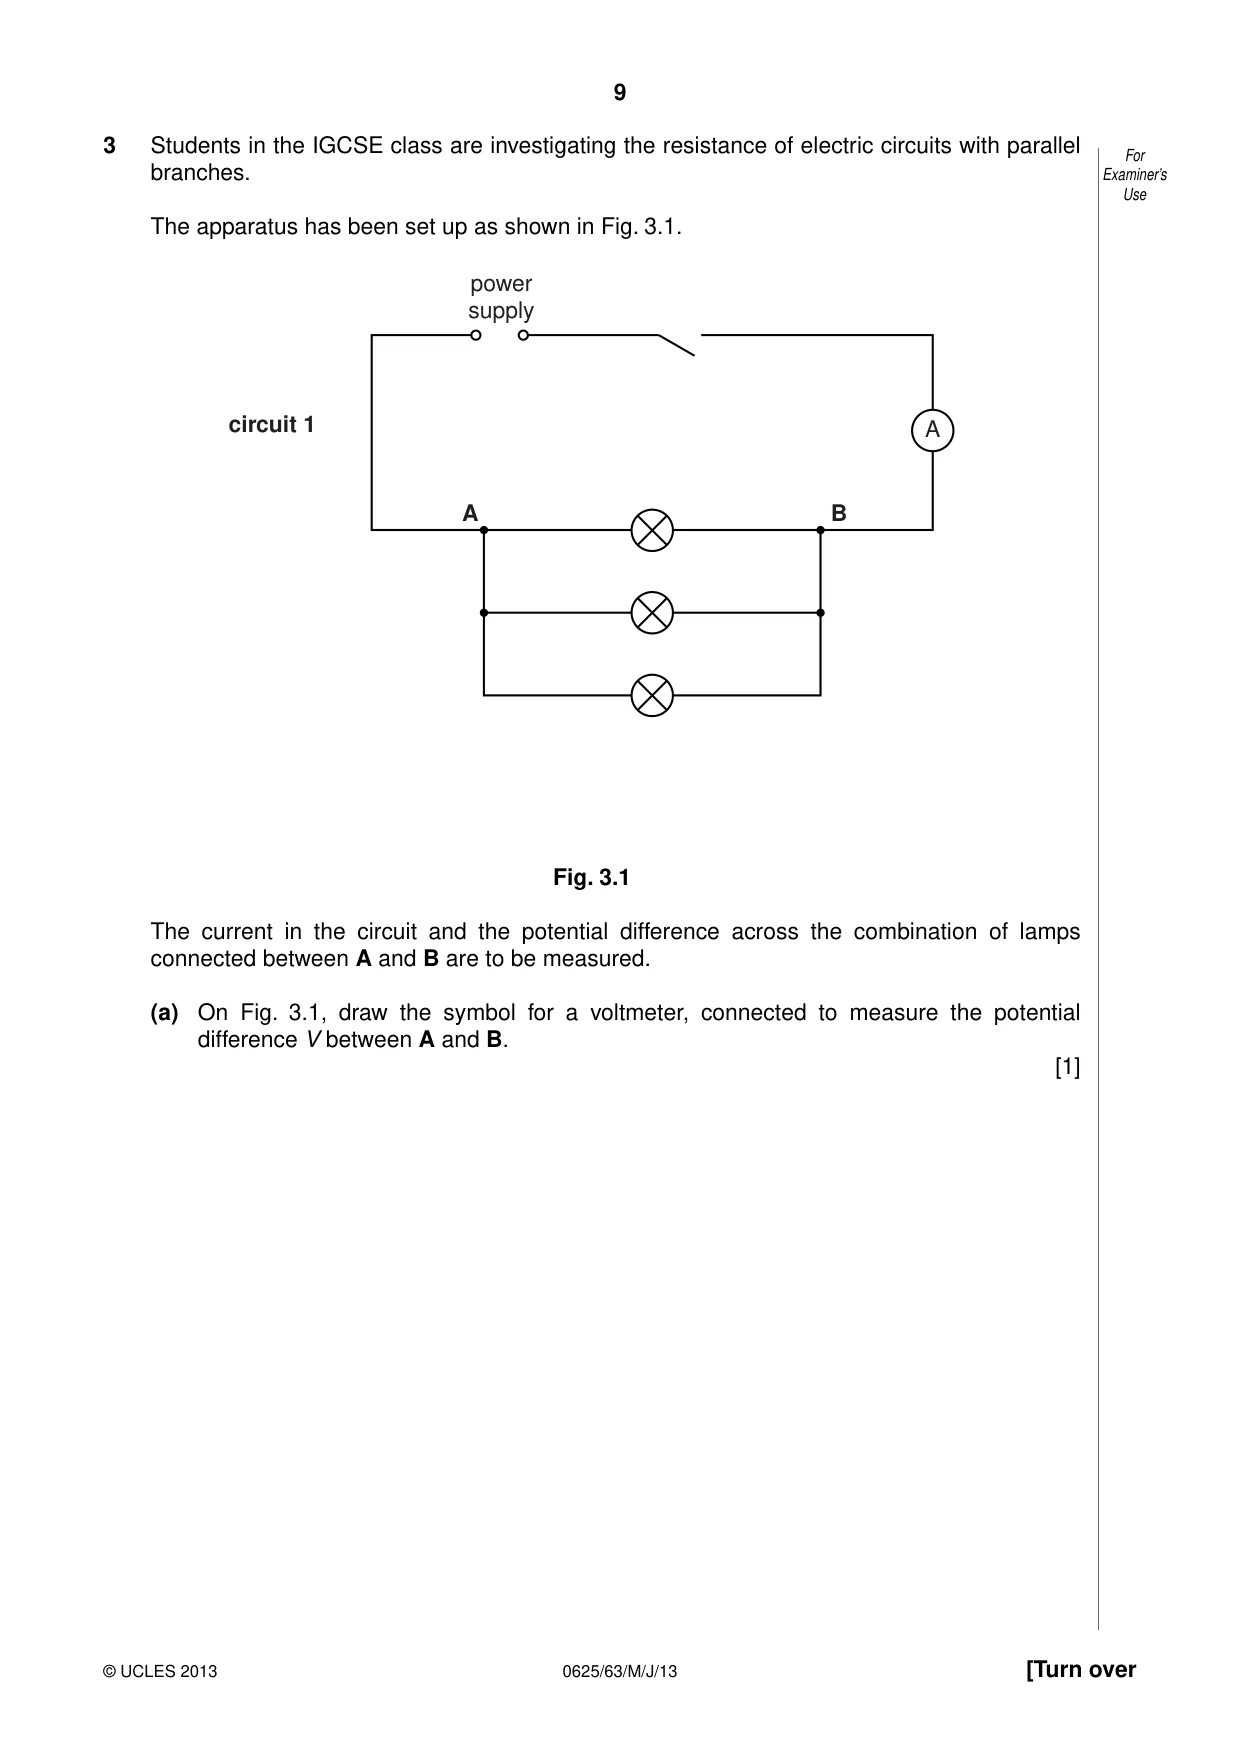
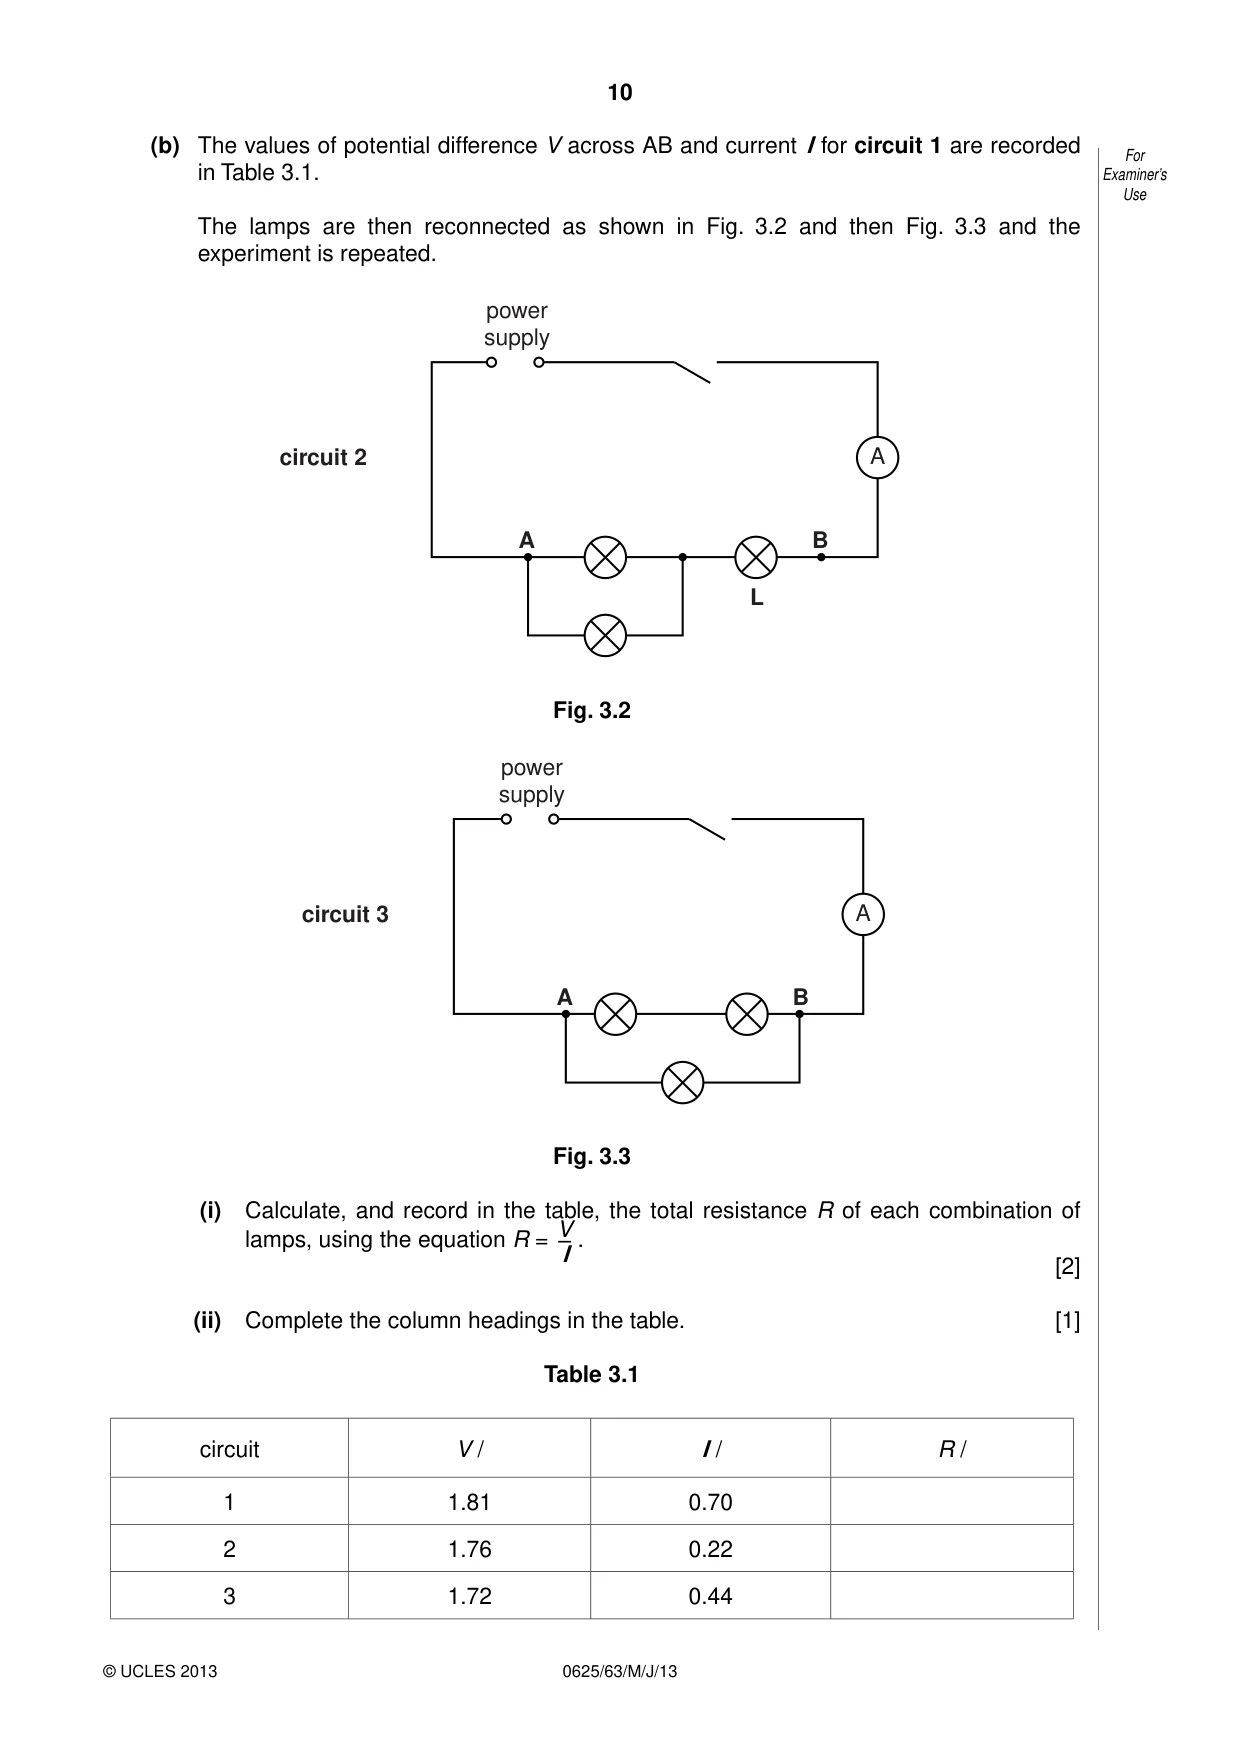
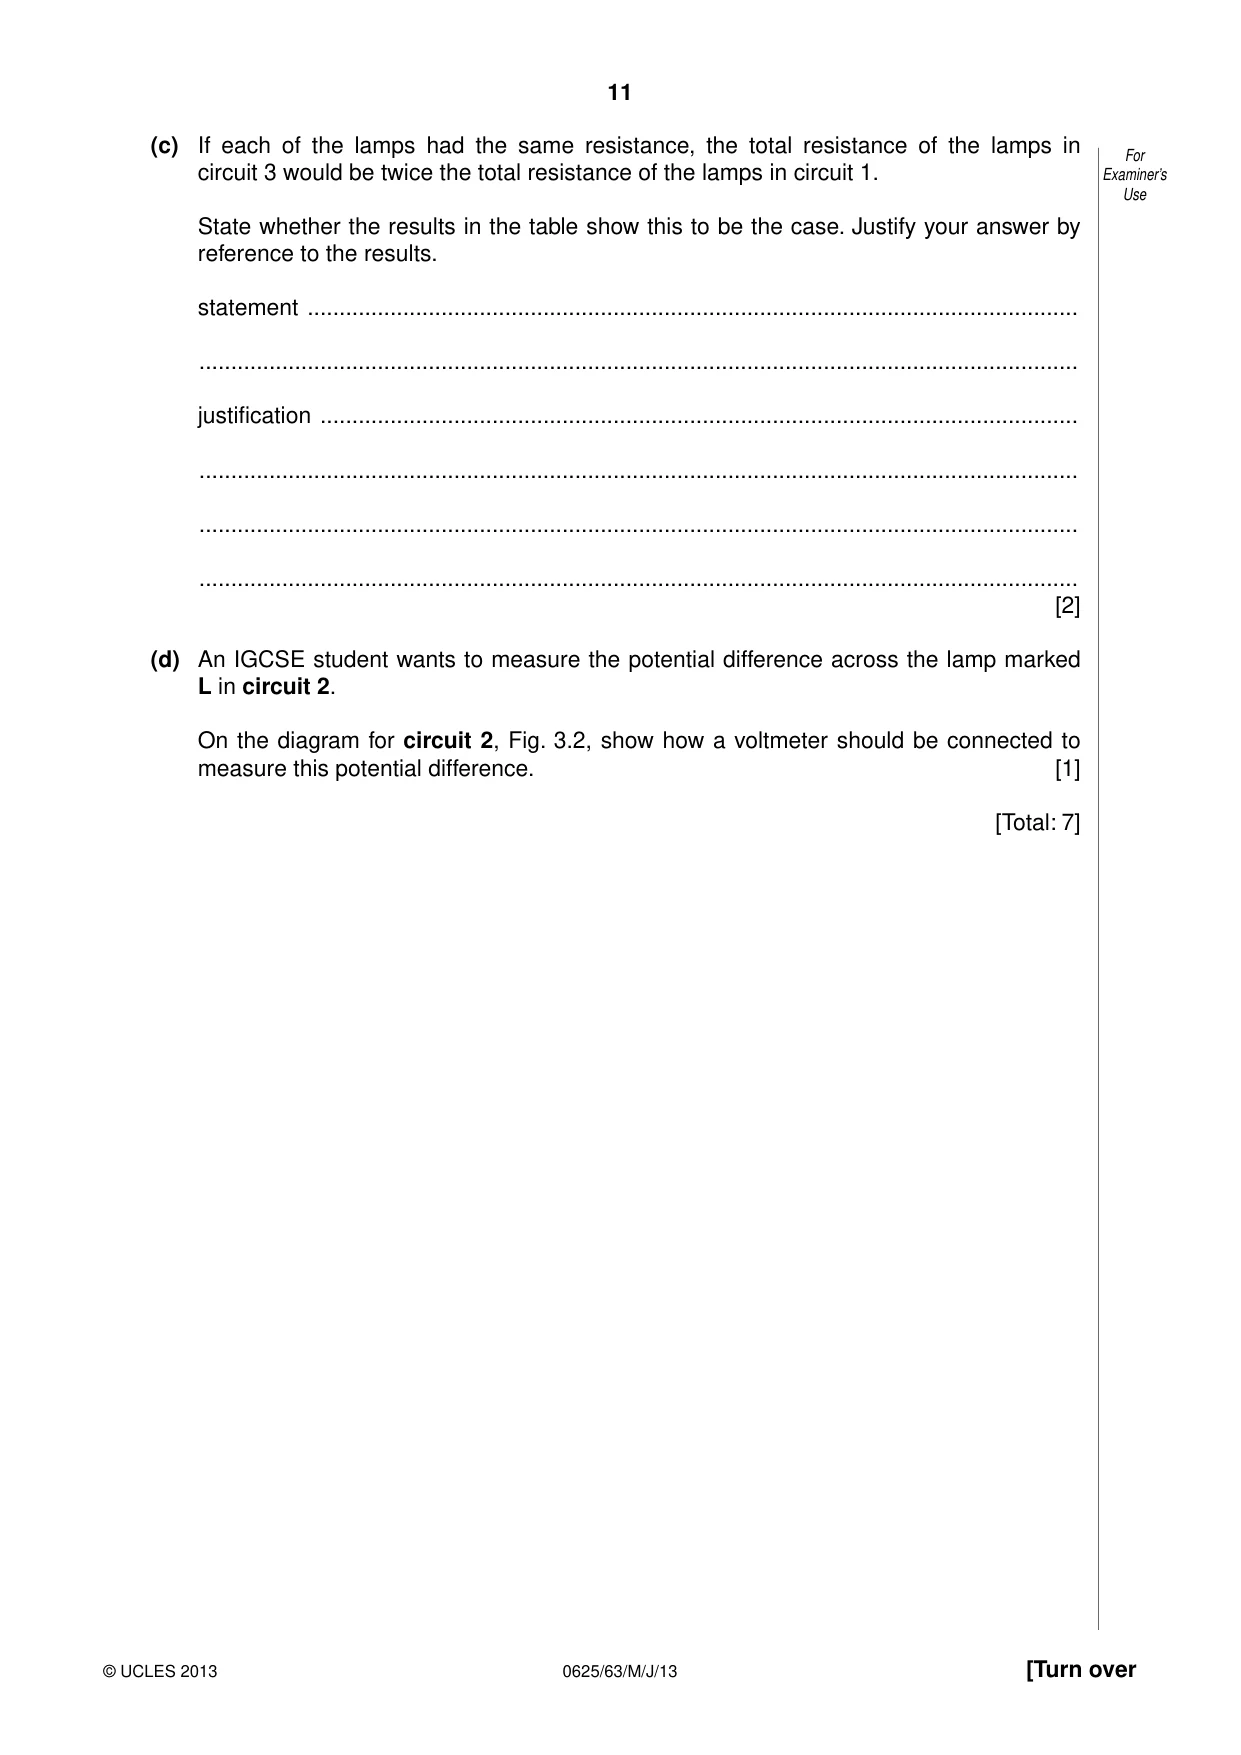
3 Students in the IGCSE class are investigating the resistance of electric circuits with parallel For branches. Examiner’s Use The apparatus has been set up as shown in Fig. 3.1. power supply circuit 1 A A B Fig. 3.1 The current in the circuit and the potential difference across the combination of lamps connected between A and B are to be measured. (a) On Fig. 3.1, draw the symbol for a voltmeter, connected to measure the potential difference V between A and B. [1] (b) The values of potential difference V across AB and current I for circuit 1 are recorded For in Table 3.1. Examiner’s Use The lamps are then reconnected as shown in Fig. 3.2 and then Fig. 3.3 and the experiment is repeated. power supply circuit 2 A A B L Fig. 3.2 power supply circuit 3 A A B Fig. 3.3 (i) Calculate, and record in the table, the total resistance R of each combination of lamps, using the equation R = . V–I [2] (ii) Complete the column headings in the table. [1] Table 3.1 circuit V / I / R / 1 1.81 0.70 2 1.76 0.22 3 1.72 0.44 (c) If each of the lamps had the same resistance, the total resistance of the lamps in For circuit 3 would be twice the total resistance of the lamps in circuit 1. Examiner’s Use State whether the results in the table show this to be the case. Justify your answer by reference to the results. statement ......................................................................................................................... .......................................................................................................................................... justification ....................................................................................................................... .......................................................................................................................................... .......................................................................................................................................... .......................................................................................................................................... [2] (d) An IGCSE student wants to measure the potential difference across the lamp marked L in circuit 2. On the diagram for circuit 2, Fig. 3.2, show how a voltmeter should be connected to measure this potential difference. [1] [Total: 7]
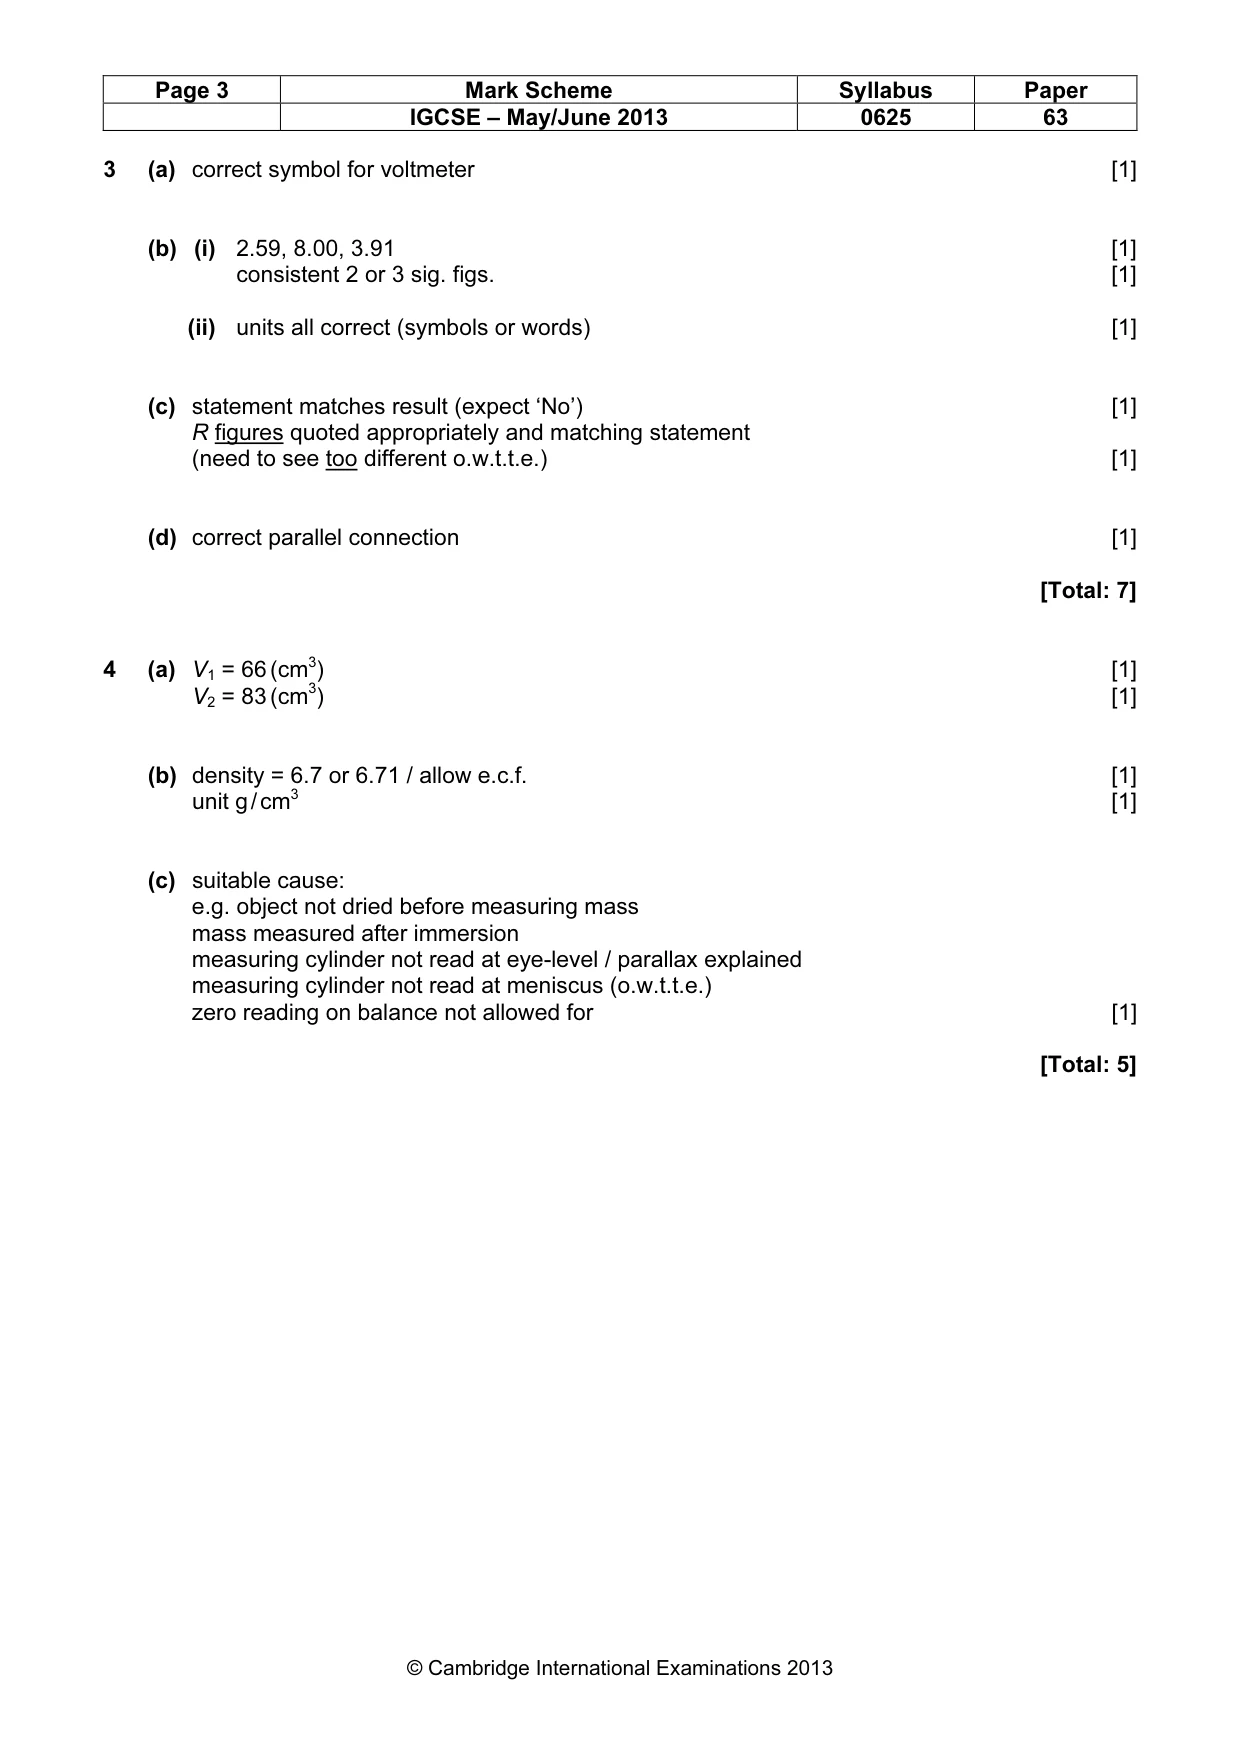
Mark scheme: 3 (a) correct symbol for voltmeter [1] (b) (i) 2.59, 8.00, 3.91 [1] consistent 2 or 3 sig. figs. [1] (ii) units all correct (symbols or words) [1] (c) statement matches result (expect ‘No’) [1] R figures quoted appropriately and matching statement (need to see too different o.w.t.t.e.) [1] (d) correct parallel connection [1] [Total: 7] 3
Q4 · The IGCSE class has been asked to determine the density of an object
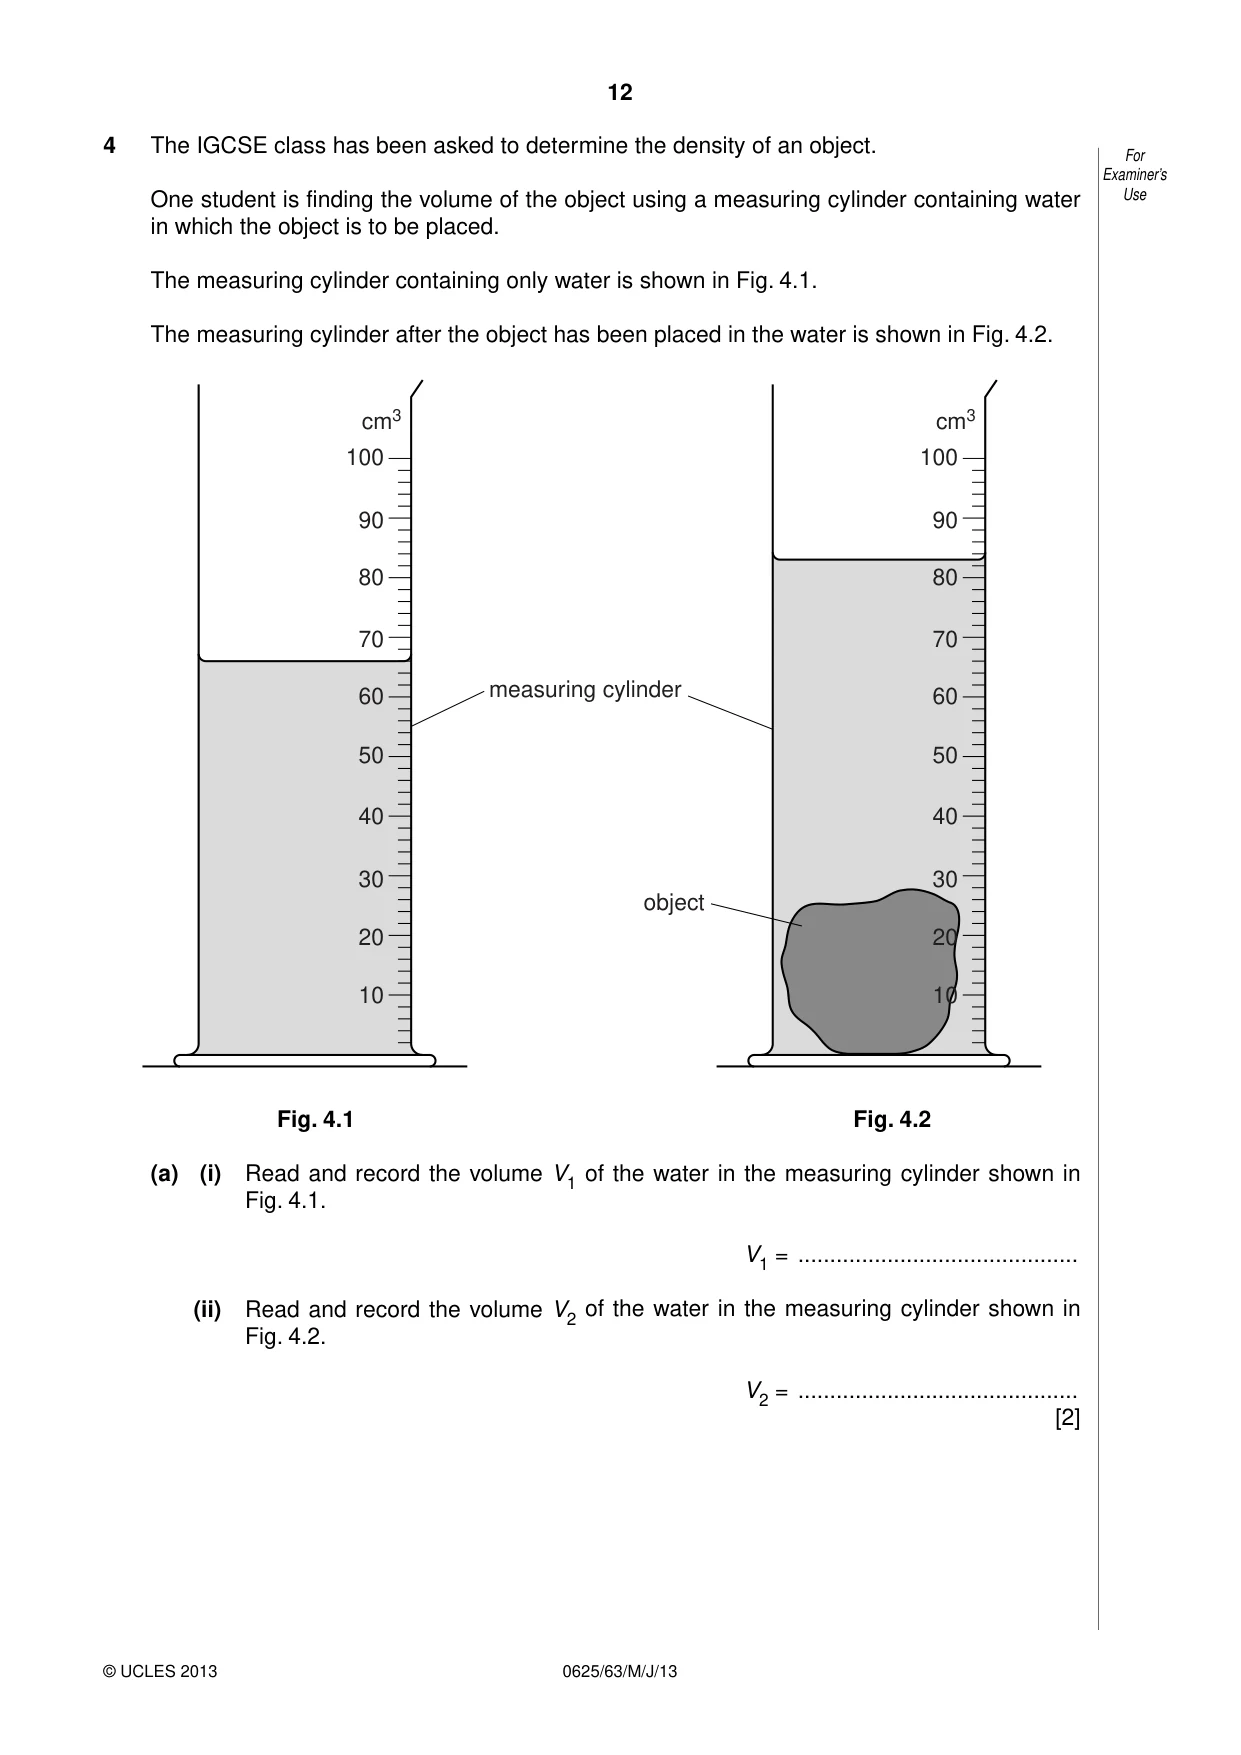
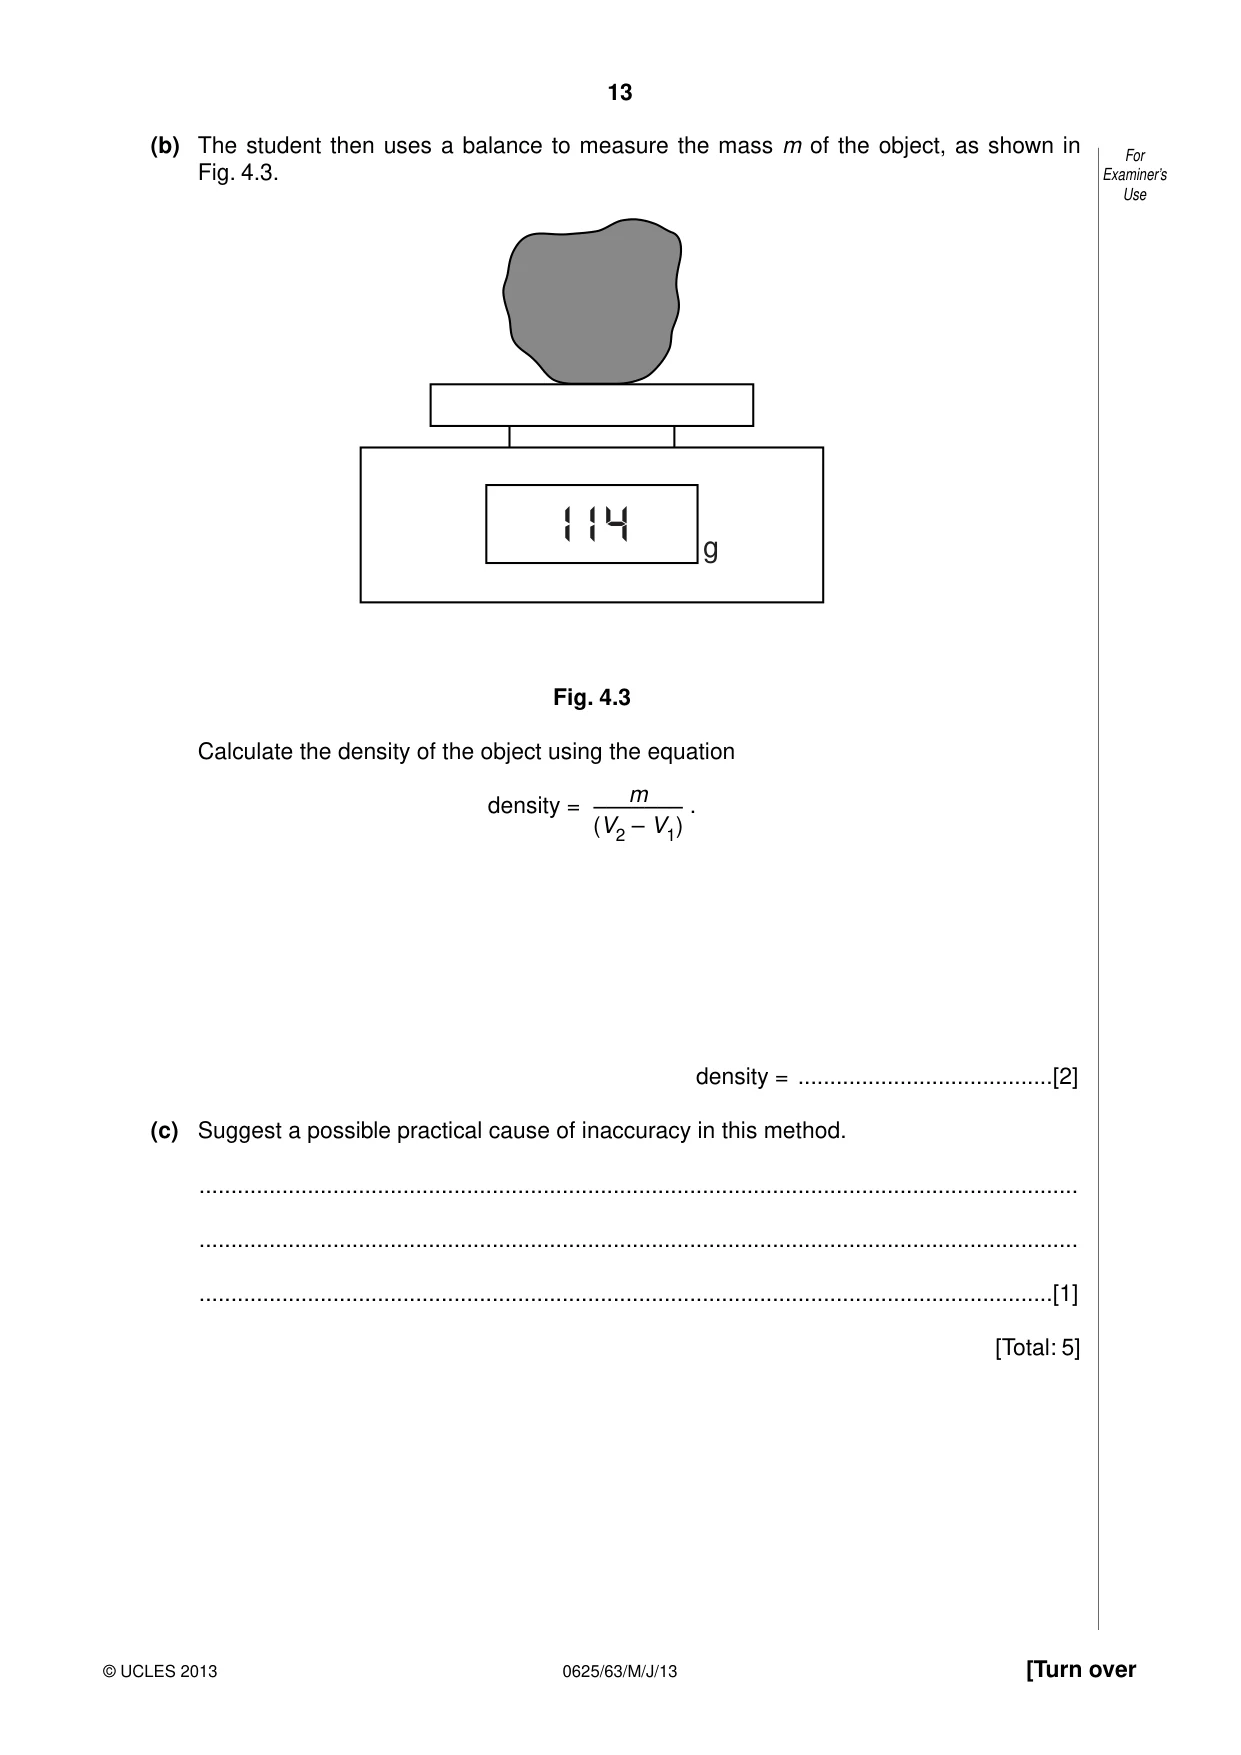
4 The IGCSE class has been asked to determine the density of an object. For Examiner’s One student is finding the volume of the object using a measuring cylinder containing water Use in which the object is to be placed. The measuring cylinder containing only water is shown in Fig. 4.1. The measuring cylinder after the object has been placed in the water is shown in Fig. 4.2. cm3 cm3 100 100 90 90 80 80 70 70 measuring cylinder 60 60 50 50 40 40 30 30 object 20 20 10 10 Fig. 4.1 Fig. 4.2 (a) (i) Read and record the volume V1 of the water in the measuring cylinder shown in Fig. 4.1. V1 = ............................................ (ii) Read and record the volume V2 of the water in the measuring cylinder shown in Fig. 4.2. V2 = ............................................ [2] (b) The student then uses a balance to measure the mass m of the object, as shown in For Fig. 4.3. Examiner’s Use 114 g Fig. 4.3 Calculate the density of the object using the equation m density = ––––––– . (V2 – V1) density = ........................................[2] (c) Suggest a possible practical cause of inaccuracy in this method. .......................................................................................................................................... .......................................................................................................................................... ......................................................................................................................................[1] [Total: 5]
Mark scheme: 4 (a) V1 = 66 (cm3) [1] V2 = 83 (cm3) [1] (b) density = 6.7 or 6.71 / allow e.c.f. [1] unit g / cm3 [1] (c) suitable cause: e.g. object not dried before measuring mass mass measured after immersion measuring cylinder not read at eye-level / parallax explained measuring cylinder not read at meniscus (o.w.t.t.e.) zero reading on balance not allowed for [1] [Total: 5] IGCSE – May/June 2013 0625 63
More questions on Physical quantities and measurement techniques
Q5 · IGCSE students are investigating the magnification produced by a converging lens
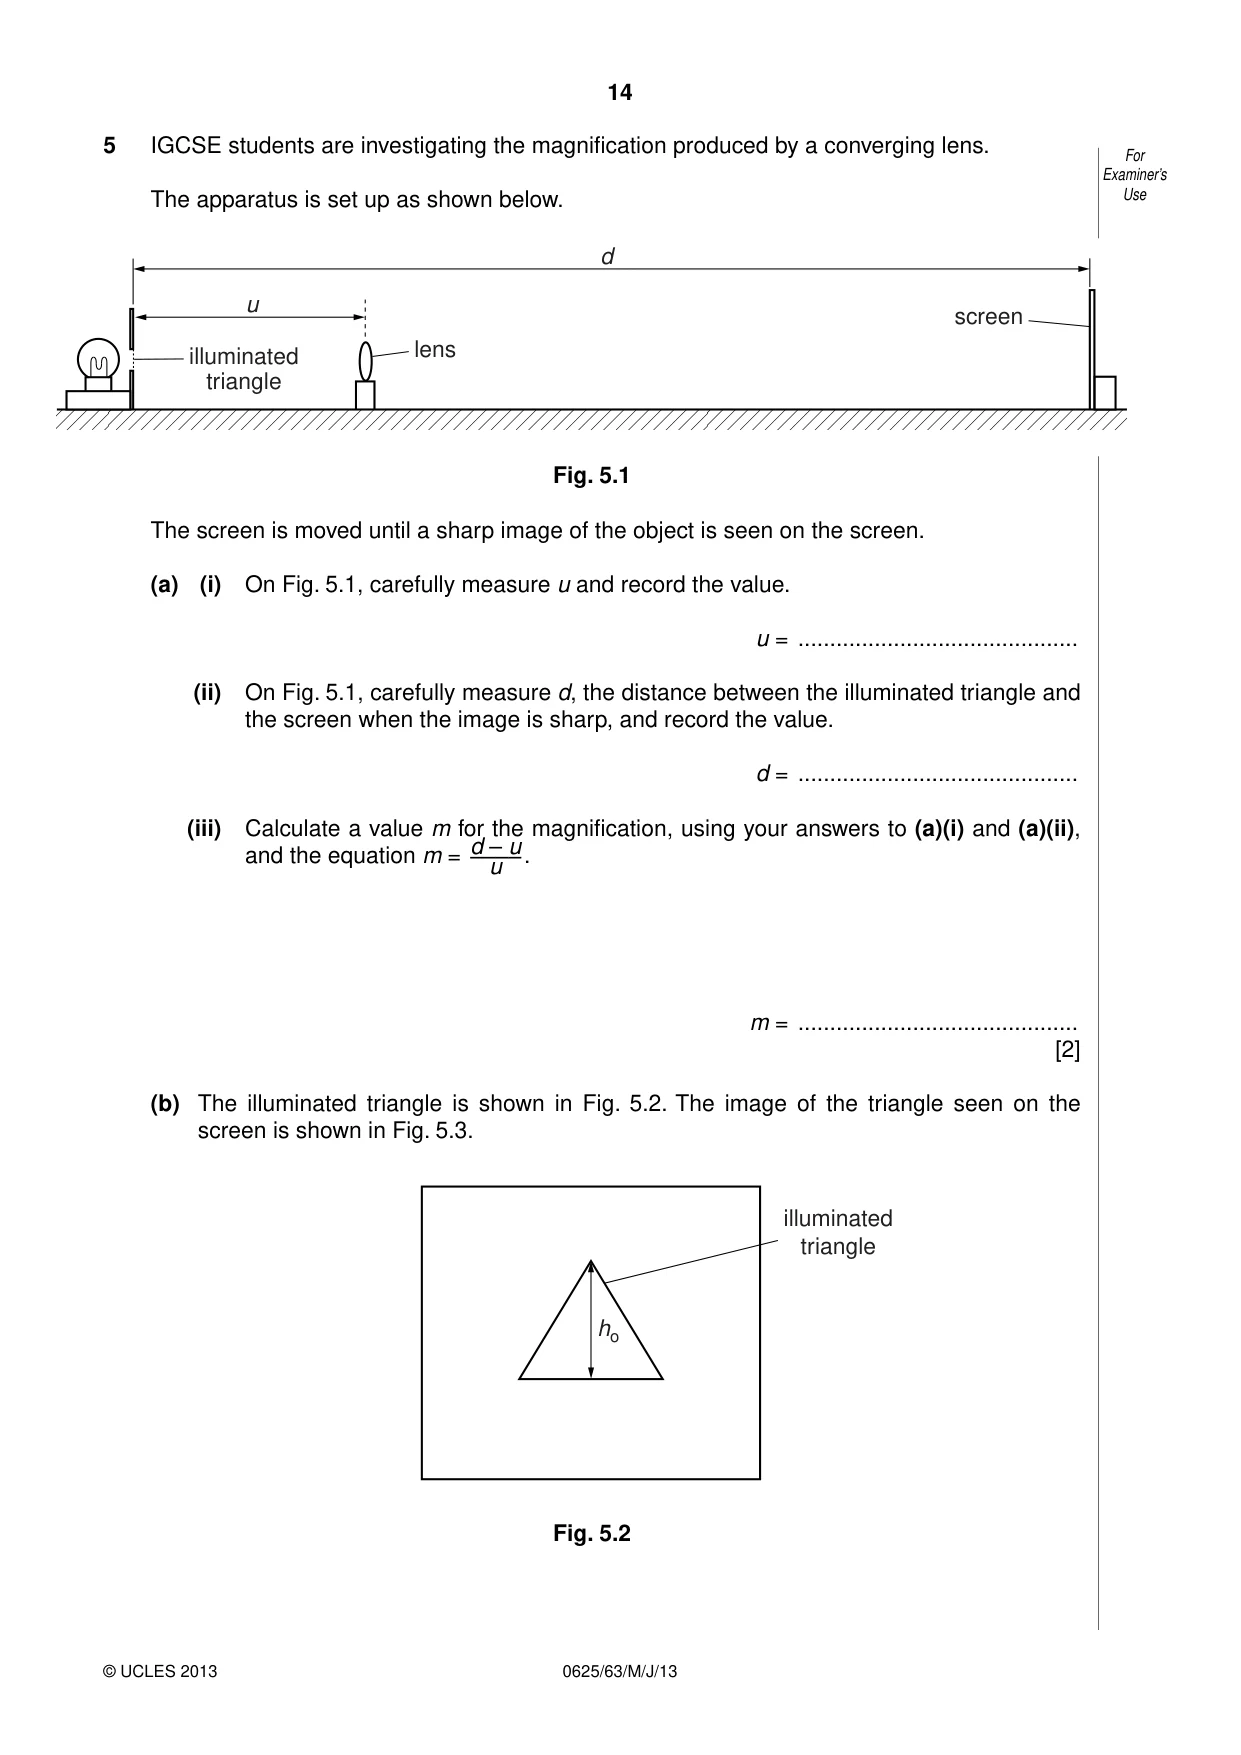
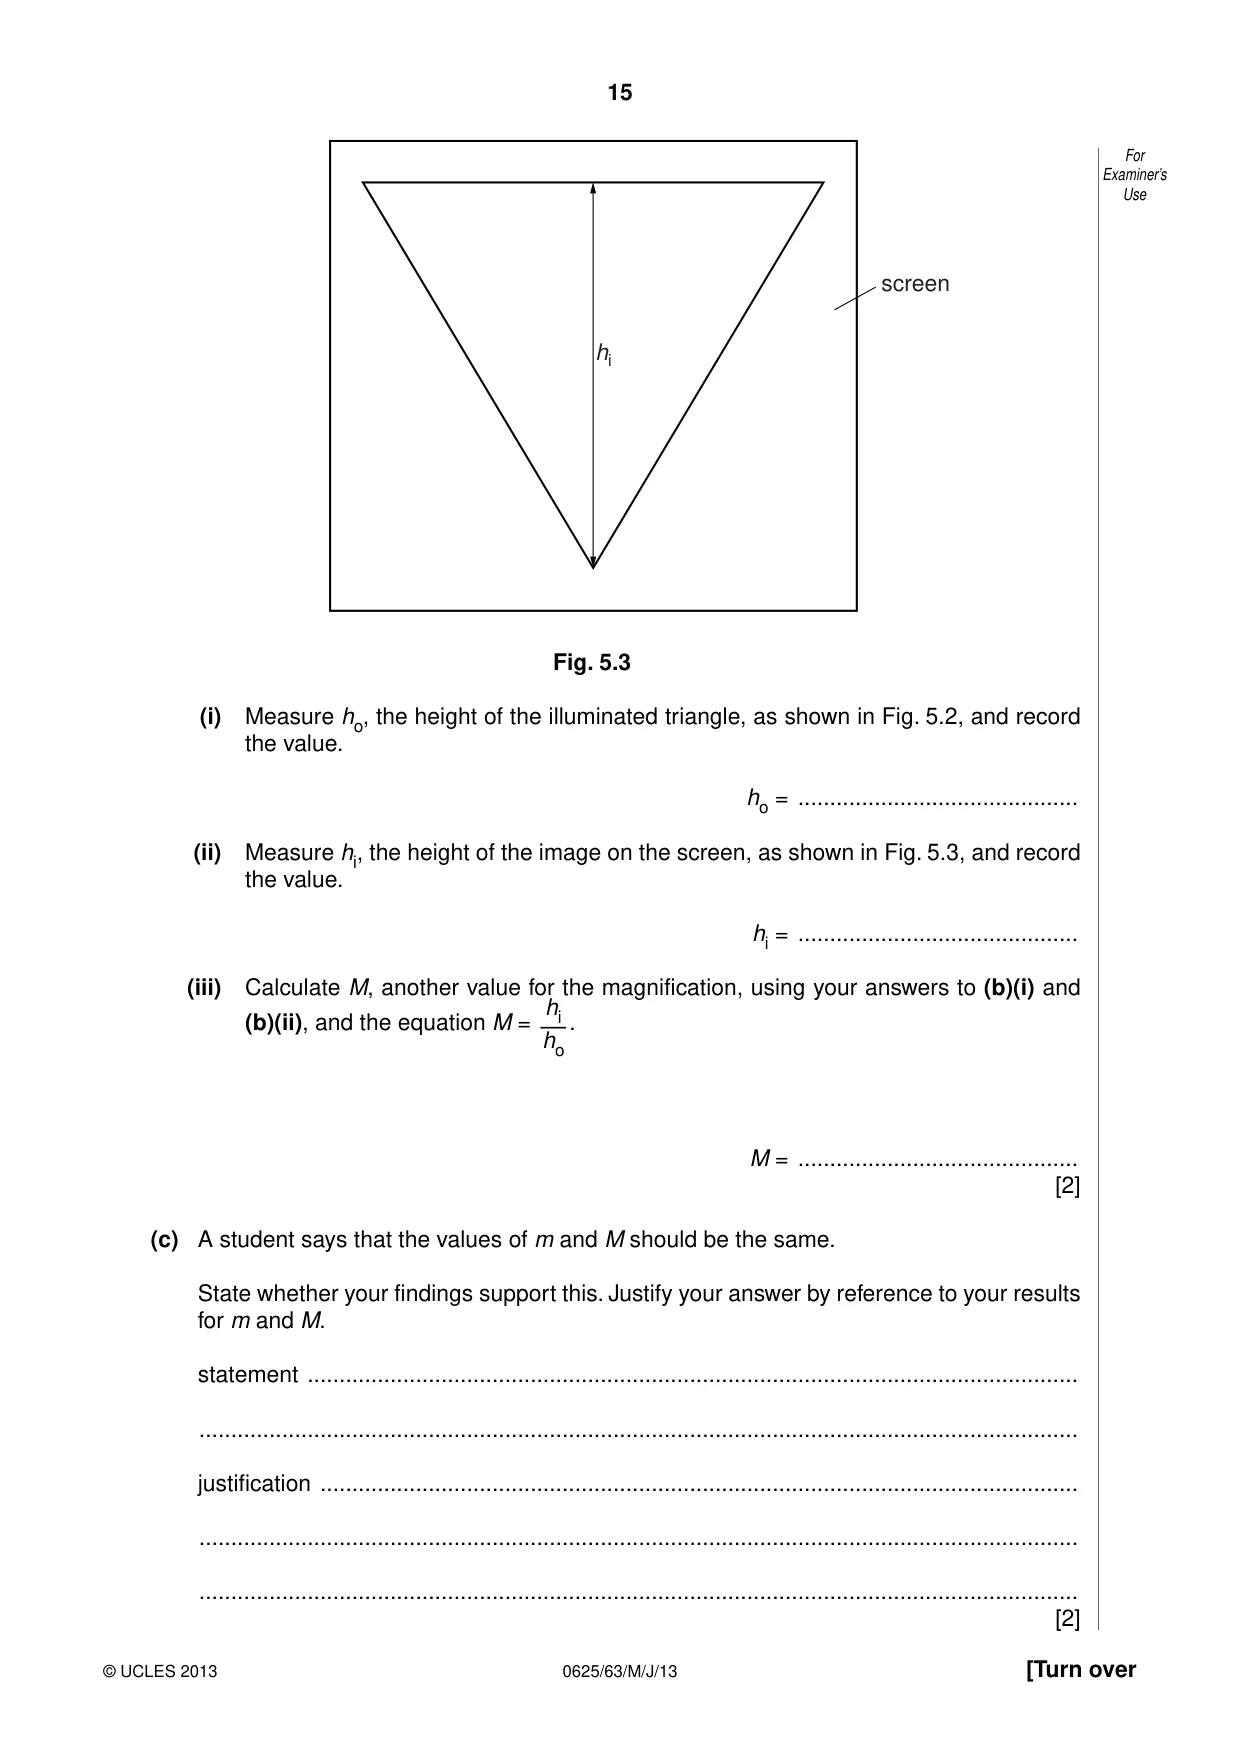
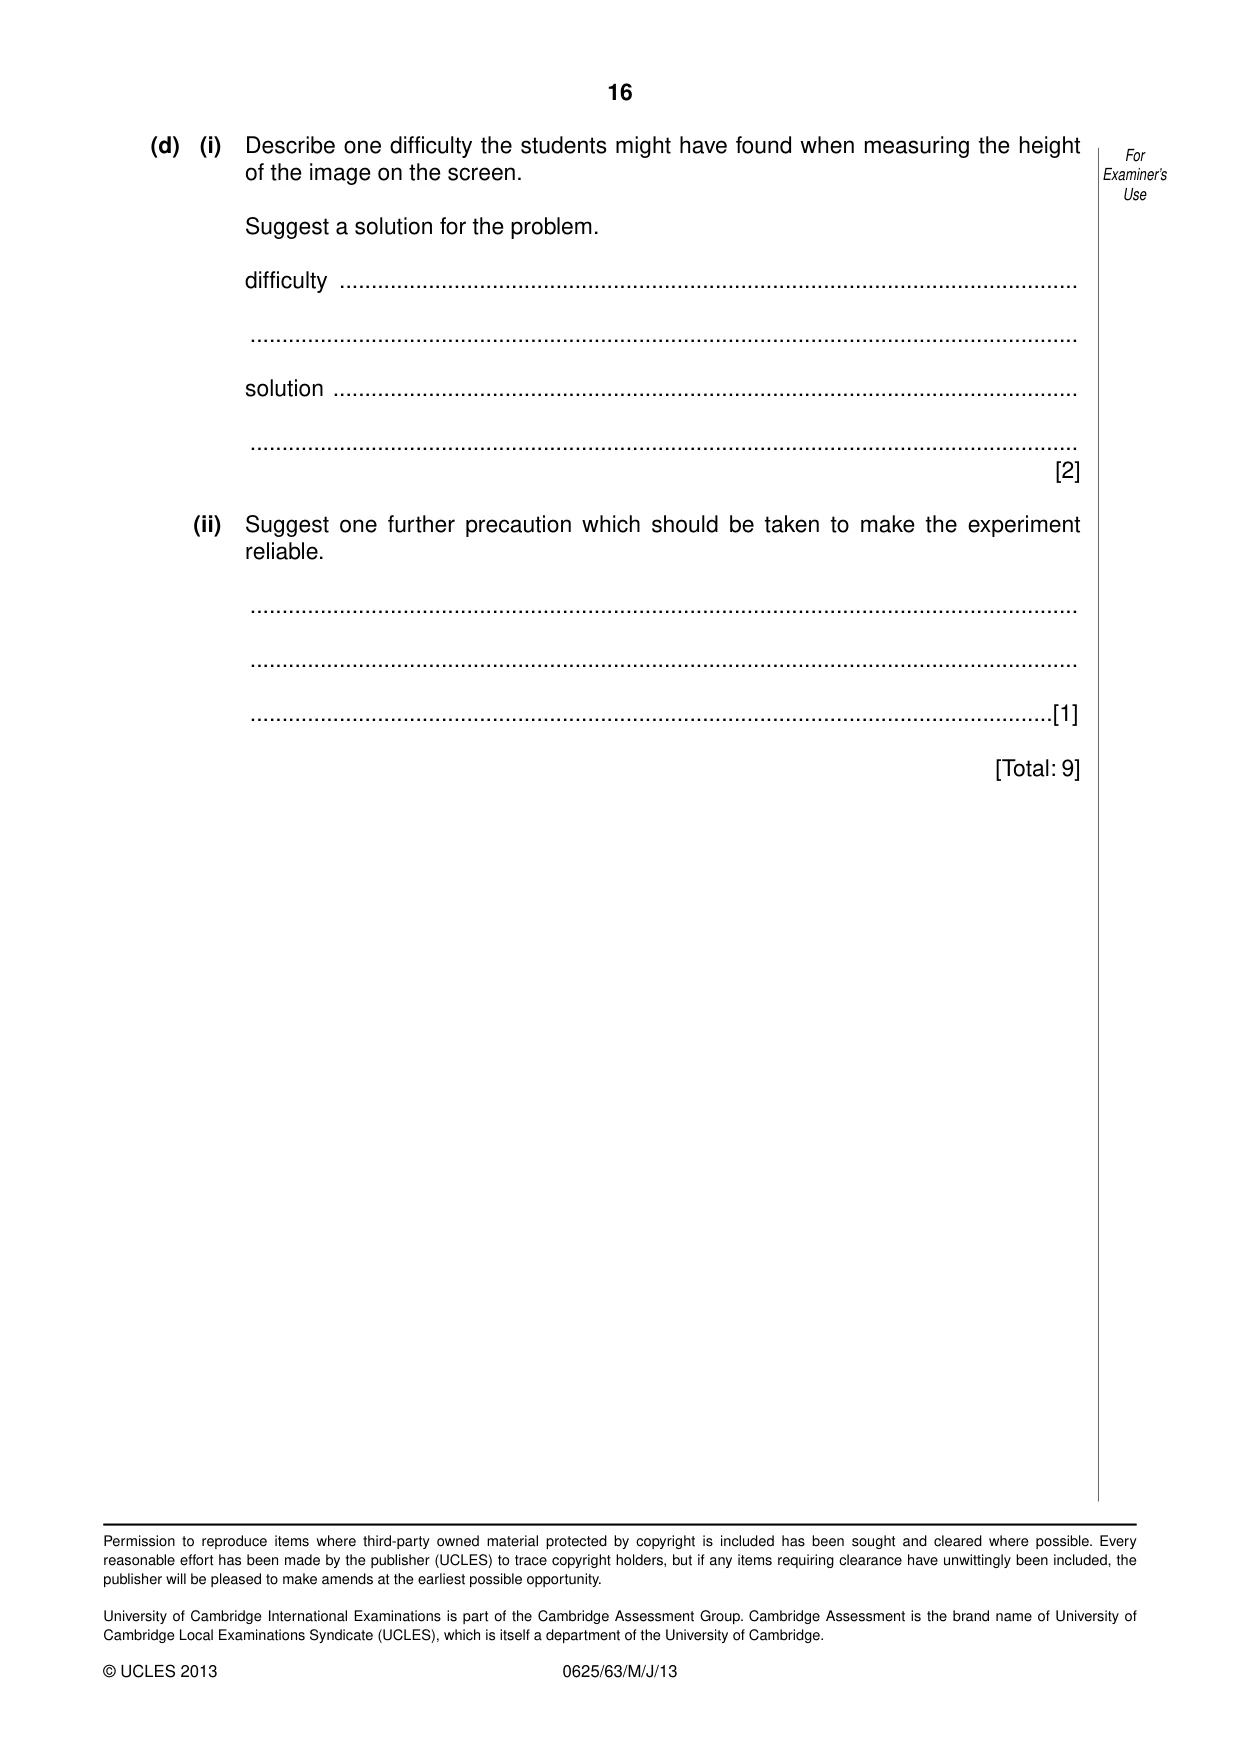
5 IGCSE students are investigating the magnification produced by a converging lens. For Examiner’s The apparatus is set up as shown below. Use d u screen lens illuminated triangle Fig. 5.1 The screen is moved until a sharp image of the object is seen on the screen. (a) (i) On Fig. 5.1, carefully measure u and record the value. u = ............................................ (ii) On Fig. 5.1, carefully measure d, the distance between the illuminated triangle and the screen when the image is sharp, and record the value. d = ............................................ (iii) Calculate a value m for the magnification, using your answers to (a)(i) and (a)(ii), d – u and the equation m = –––– . u m = ............................................ [2] (b) The illuminated triangle is shown in Fig. 5.2. The image of the triangle seen on the screen is shown in Fig. 5.3. illuminated triangle ho Fig. 5.2 For Examiner’s Use screen hi Fig. 5.3 (i) Measure ho, the height of the illuminated triangle, as shown in Fig. 5.2, and record the value. ho = ............................................ (ii) Measure hi, the height of the image on the screen, as shown in Fig. 5.3, and record the value. hi = ............................................ (iii) Calculate M, another value for the magnification, using your answers to (b)(i) and hi (b)(ii), and the equation M = –– . ho M = ............................................ [2] (c) A student says that the values of m and M should be the same. State whether your findings support this. Justify your answer by reference to your results for m and M. statement ......................................................................................................................... .......................................................................................................................................... justification ....................................................................................................................... .......................................................................................................................................... .......................................................................................................................................... [2] (d) (i) Describe one difficulty the students might have found when measuring the height For of the image on the screen. Examiner’s Use Suggest a solution for the problem. difficulty .................................................................................................................... .................................................................................................................................. solution ..................................................................................................................... .................................................................................................................................. [2] (ii) Suggest one further precaution which should be taken to make the experiment reliable. .................................................................................................................................. .................................................................................................................................. ..............................................................................................................................[1] [Total: 9]
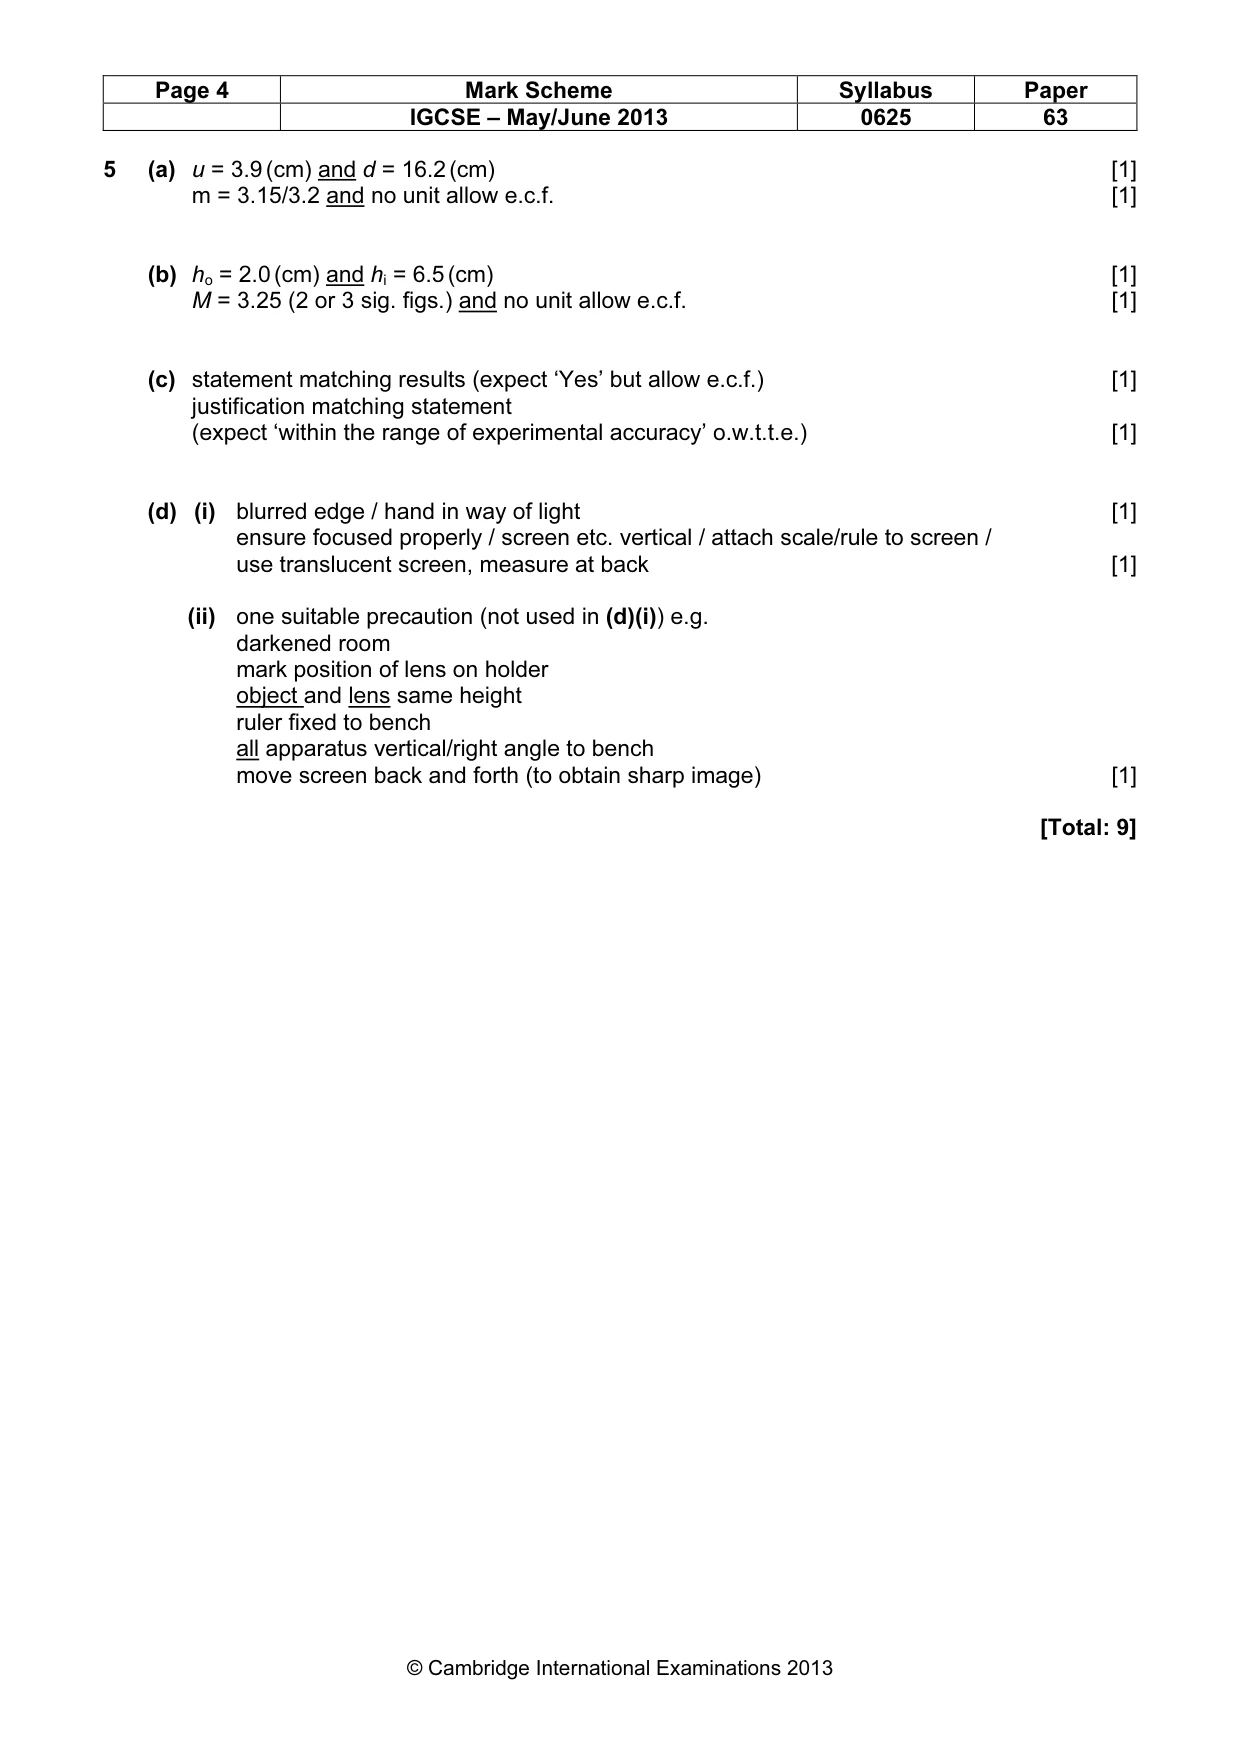
Mark scheme: 5 (a) u = 3.9 (cm) and d = 16.2 (cm) [1] m = 3.15/3.2 and no unit allow e.c.f. [1] (b) ho = 2.0 (cm) and hi = 6.5 (cm) [1] M = 3.25 (2 or 3 sig. figs.) and no unit allow e.c.f. [1] (c) statement matching results (expect ‘Yes’ but allow e.c.f.) [1] justification matching statement (expect ‘within the range of experimental accuracy’ o.w.t.t.e.) [1] (d) (i) blurred edge / hand in way of light [1] ensure focused properly / screen etc. vertical / attach scale/rule to screen / use translucent screen, measure at back [1] (ii) one suitable precaution (not used in (d)(i)) e.g. darkened room mark position of lens on holder object and lens same height ruler fixed to bench all apparatus vertical/right angle to bench move screen back and forth (to obtain sharp image) [1] [Total: 9]
More questions on Physical quantities and measurement techniques
What was in this paper
The subtopics covered by these 5 questions, and how many questions each got. Open one in a new tab to see every Cambridge question on it.
What you needed in this session
Cambridge’s own grade thresholds for 2013 May/June, Paper 6 · Variant 3. A higher threshold means an easier paper — the bar moves with how the cohort did.