Cambridge IGCSE Physics 0625 — 2010 May/June Paper 6 · Variant 1
0625/61/M/J/10 · 5 questions · 40 marks · ≈45 min
The question paper and its mark scheme, free to read here and free to download. This is Cambridge’s own paper, exactly as it was sat.
Question paper12 pages
Mark scheme4 pages
Answers below. Sit the paper first if you are practising.
Questions as text
Q1 · An IGCSE student is investigating the stretching of springs
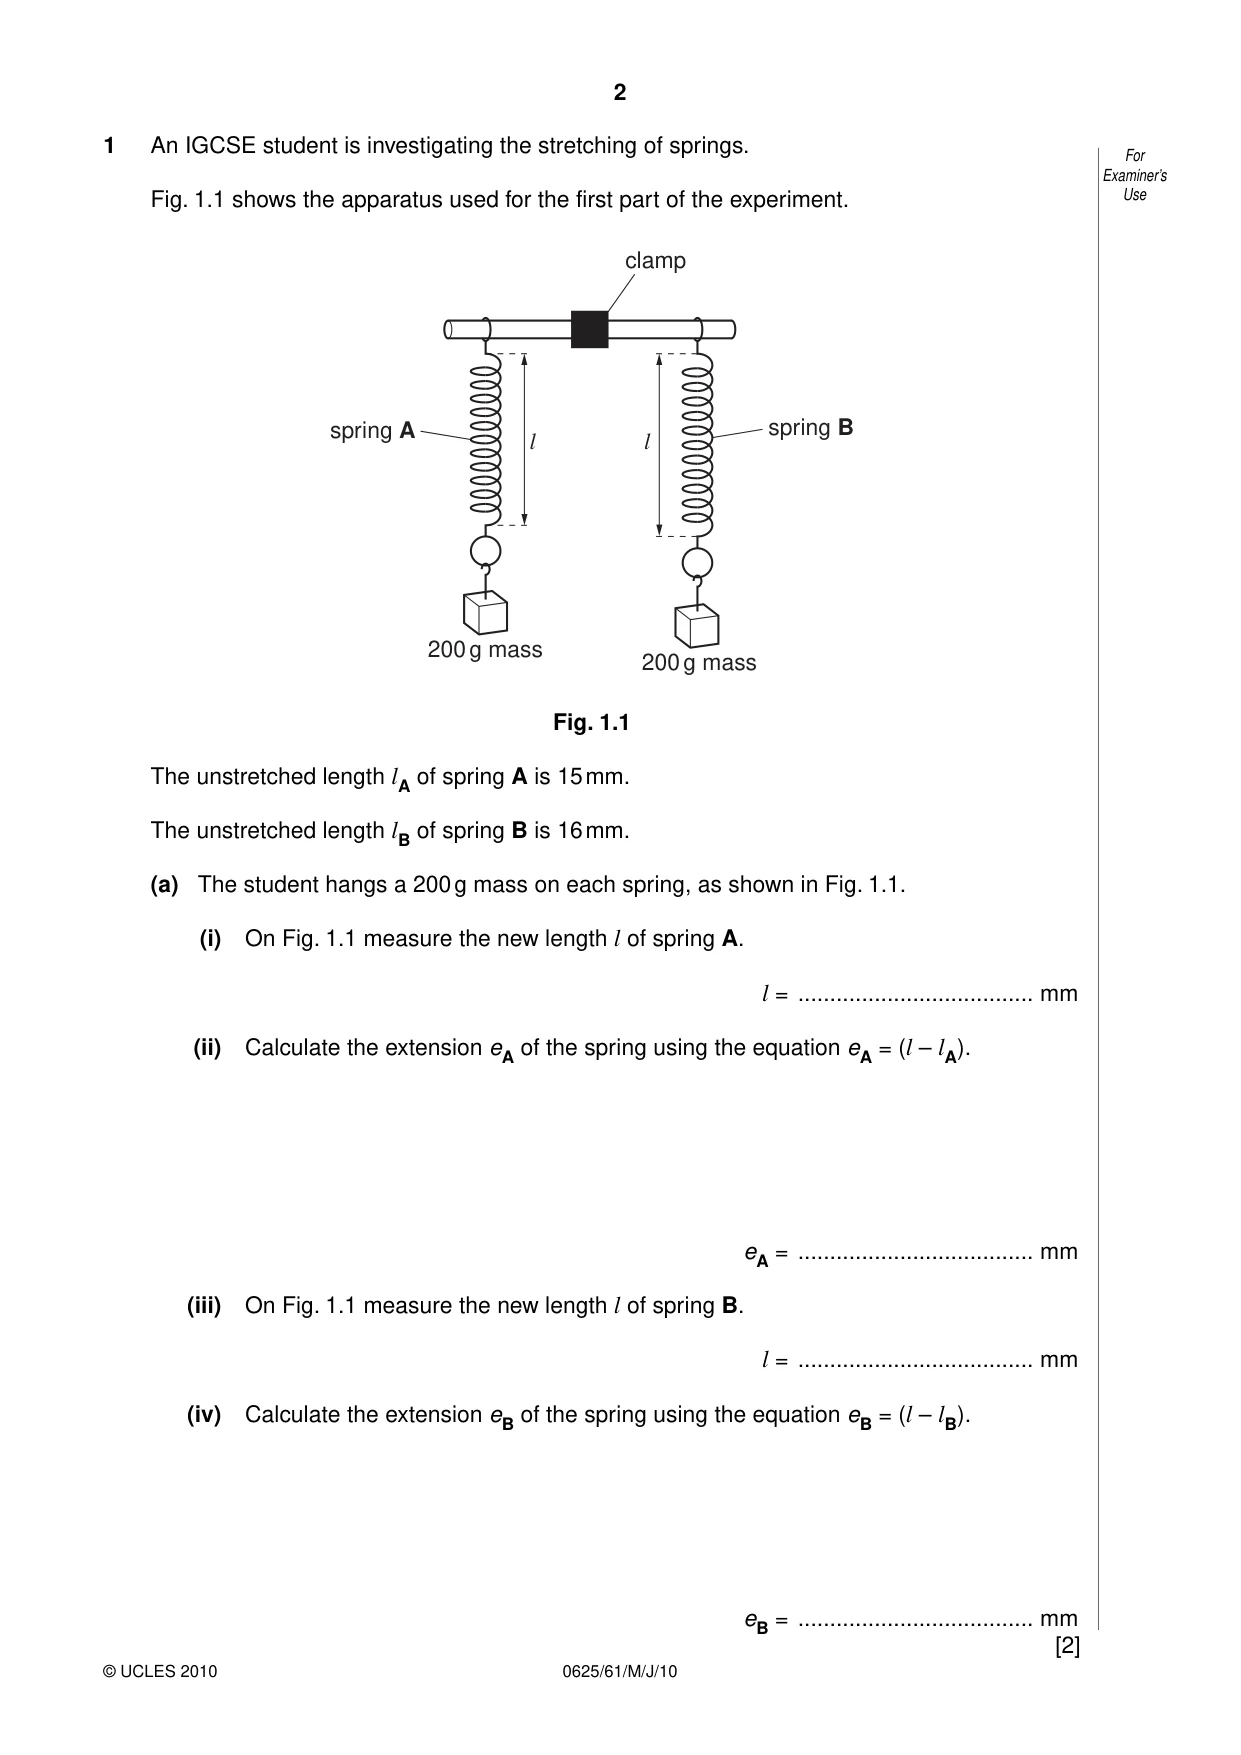
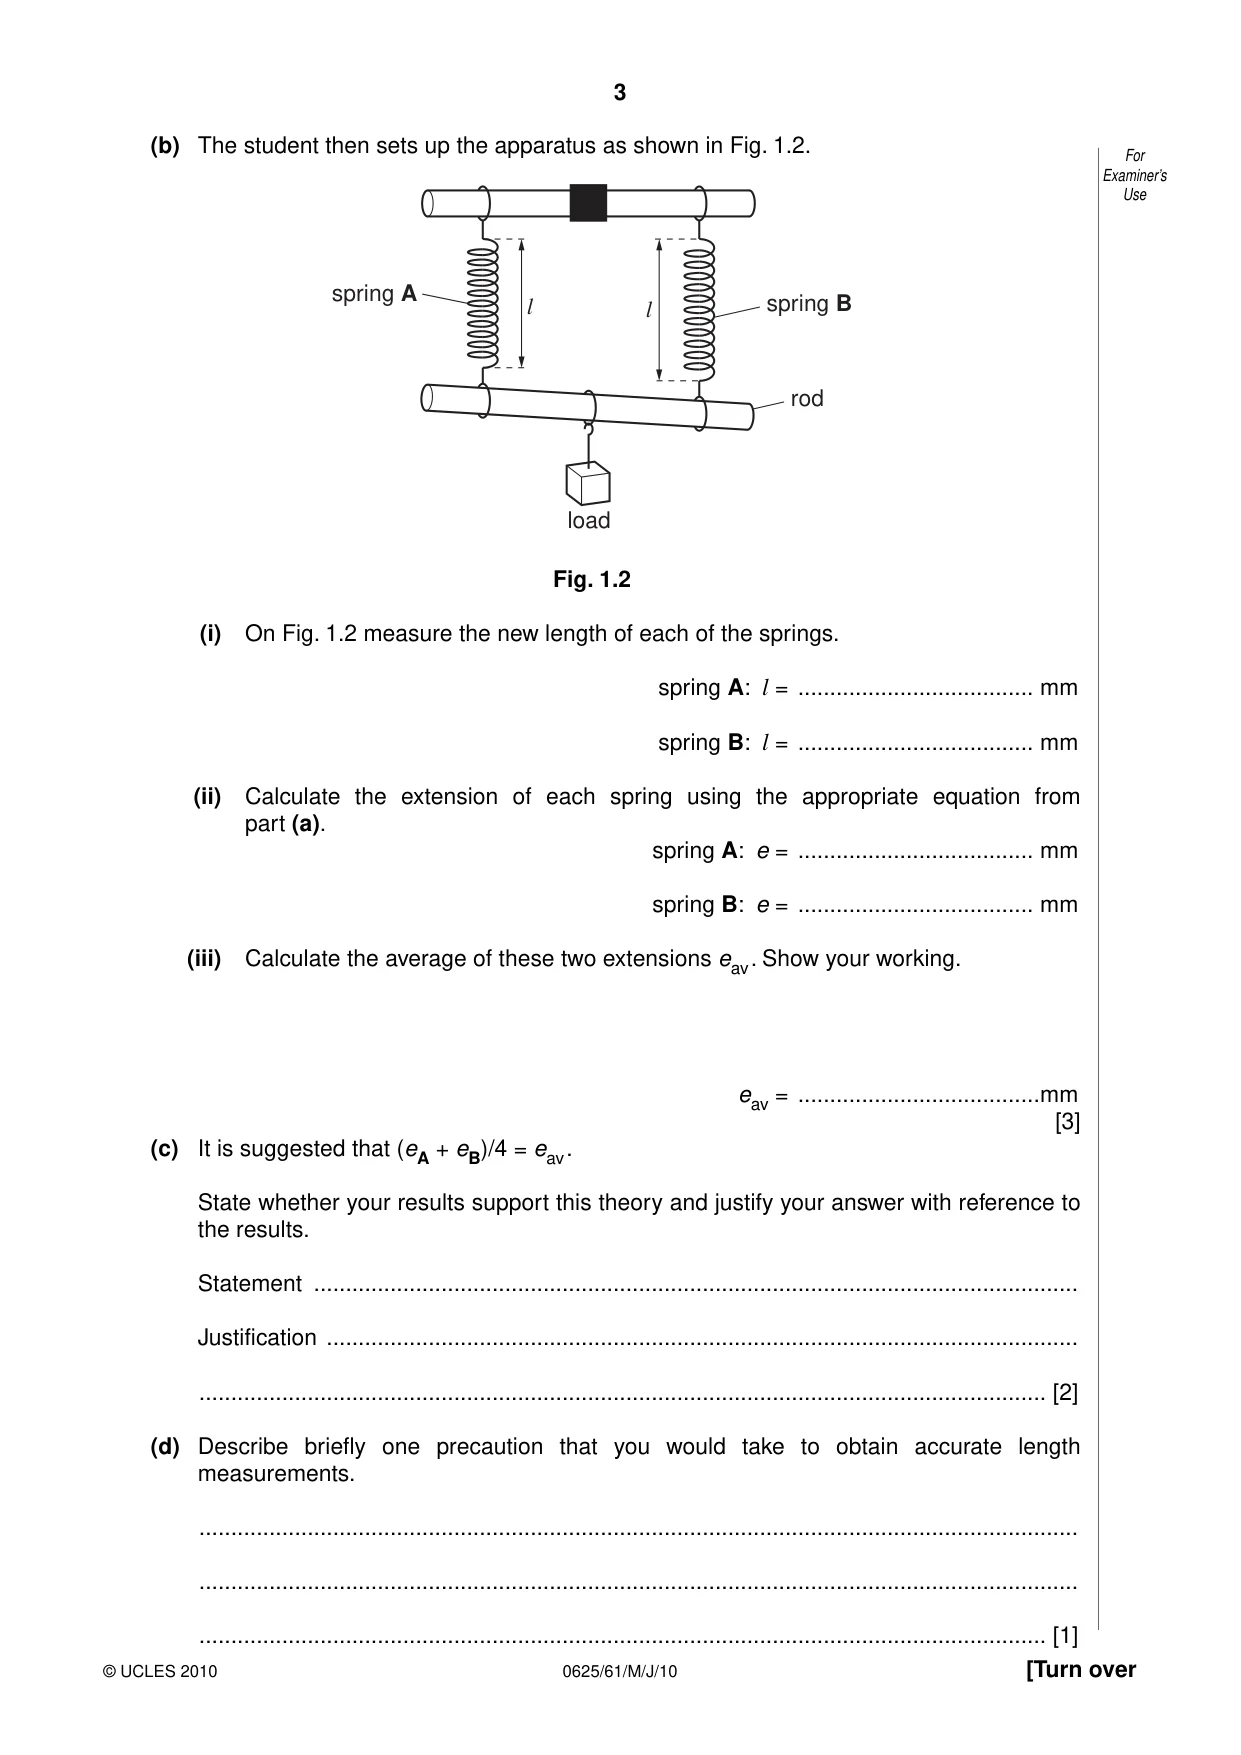
1 An IGCSE student is investigating the stretching of springs. For Examiner’s Fig. 1.1 shows the apparatus used for the first part of the experiment. Use clamp spring A spring B l l 200 g mass 200 g mass Fig. 1.1 The unstretched length lA of spring A is 15 mm. The unstretched length lB of spring B is 16 mm. (a) The student hangs a 200 g mass on each spring, as shown in Fig. 1.1. (i) On Fig. 1.1 measure the new length l of spring A. l = ..................................... mm (ii) Calculate the extension eA of the spring using the equation eA = (l – lA). eA = ..................................... mm (iii) On Fig. 1.1 measure the new length l of spring B. l = ..................................... mm (iv) Calculate the extension eB of the spring using the equation eB = (l – lB). eB = ..................................... mm [2] (b) The student then sets up the apparatus as shown in Fig. 1.2. For Examiner’s Use spring A l l spring B rod load Fig. 1.2 (i) On Fig. 1.2 measure the new length of each of the springs. spring A: l = ..................................... mm spring B: l = ..................................... mm (ii) Calculate the extension of each spring using the appropriate equation from part (a). spring A: e = ..................................... mm spring B: e = ..................................... mm (iii) Calculate the average of these two extensions eav . Show your working. eav = ......................................mm [3] (c) It is suggested that (eA + eB)/4 = eav . State whether your results support this theory and justify your answer with reference to the results. Statement ........................................................................................................................ Justification ...................................................................................................................... ..................................................................................................................................... [2] (d) Describe briefly one precaution that you would take to obtain accurate length measurements. .......................................................................................................................................... .......................................................................................................................................... ..................................................................................................................................... [1]
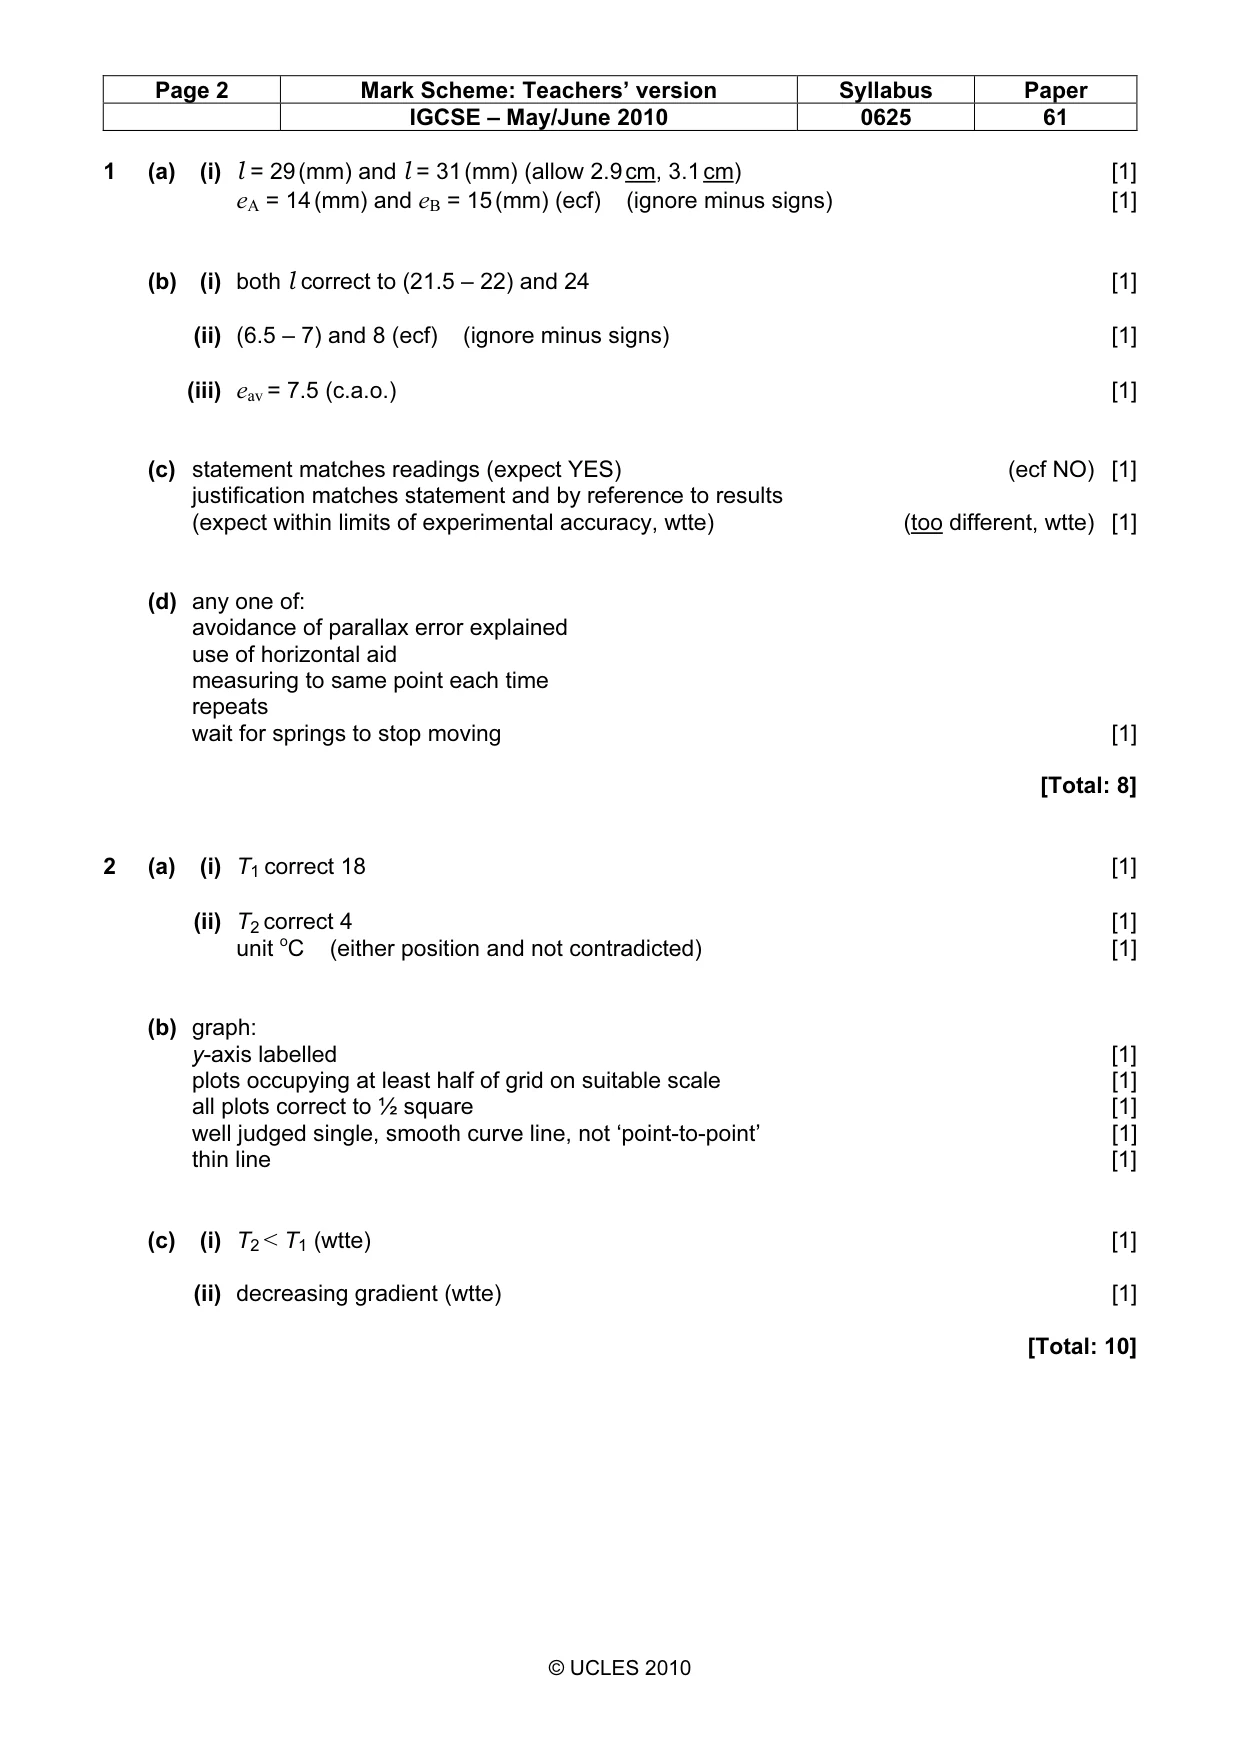
Mark scheme: 1 (a) (i) l = 29 (mm) and l = 31 (mm) (allow 2.9 cm, 3.1 cm) [1] eA = 14 (mm) and eB = 15 (mm) (ecf) (ignore minus signs) [1] (b) (i) both l correct to (21.5 – 22) and 24 [1] (ii) (6.5 – 7) and 8 (ecf) (ignore minus signs) [1] (iii) eav = 7.5 (c.a.o.) [1] (c) statement matches readings (expect YES) (ecf NO) [1] justification matches statement and by reference to results (expect within limits of experimental accuracy, wtte) (too different, wtte) [1] (d) any one of: avoidance of parallax error explained use of horizontal aid measuring to same point each time repeats wait for springs to stop moving [1] [Total: 8]
More questions on Physical quantities and measurement techniques
Q2 · The IGCSE class is investigating the cooling of water
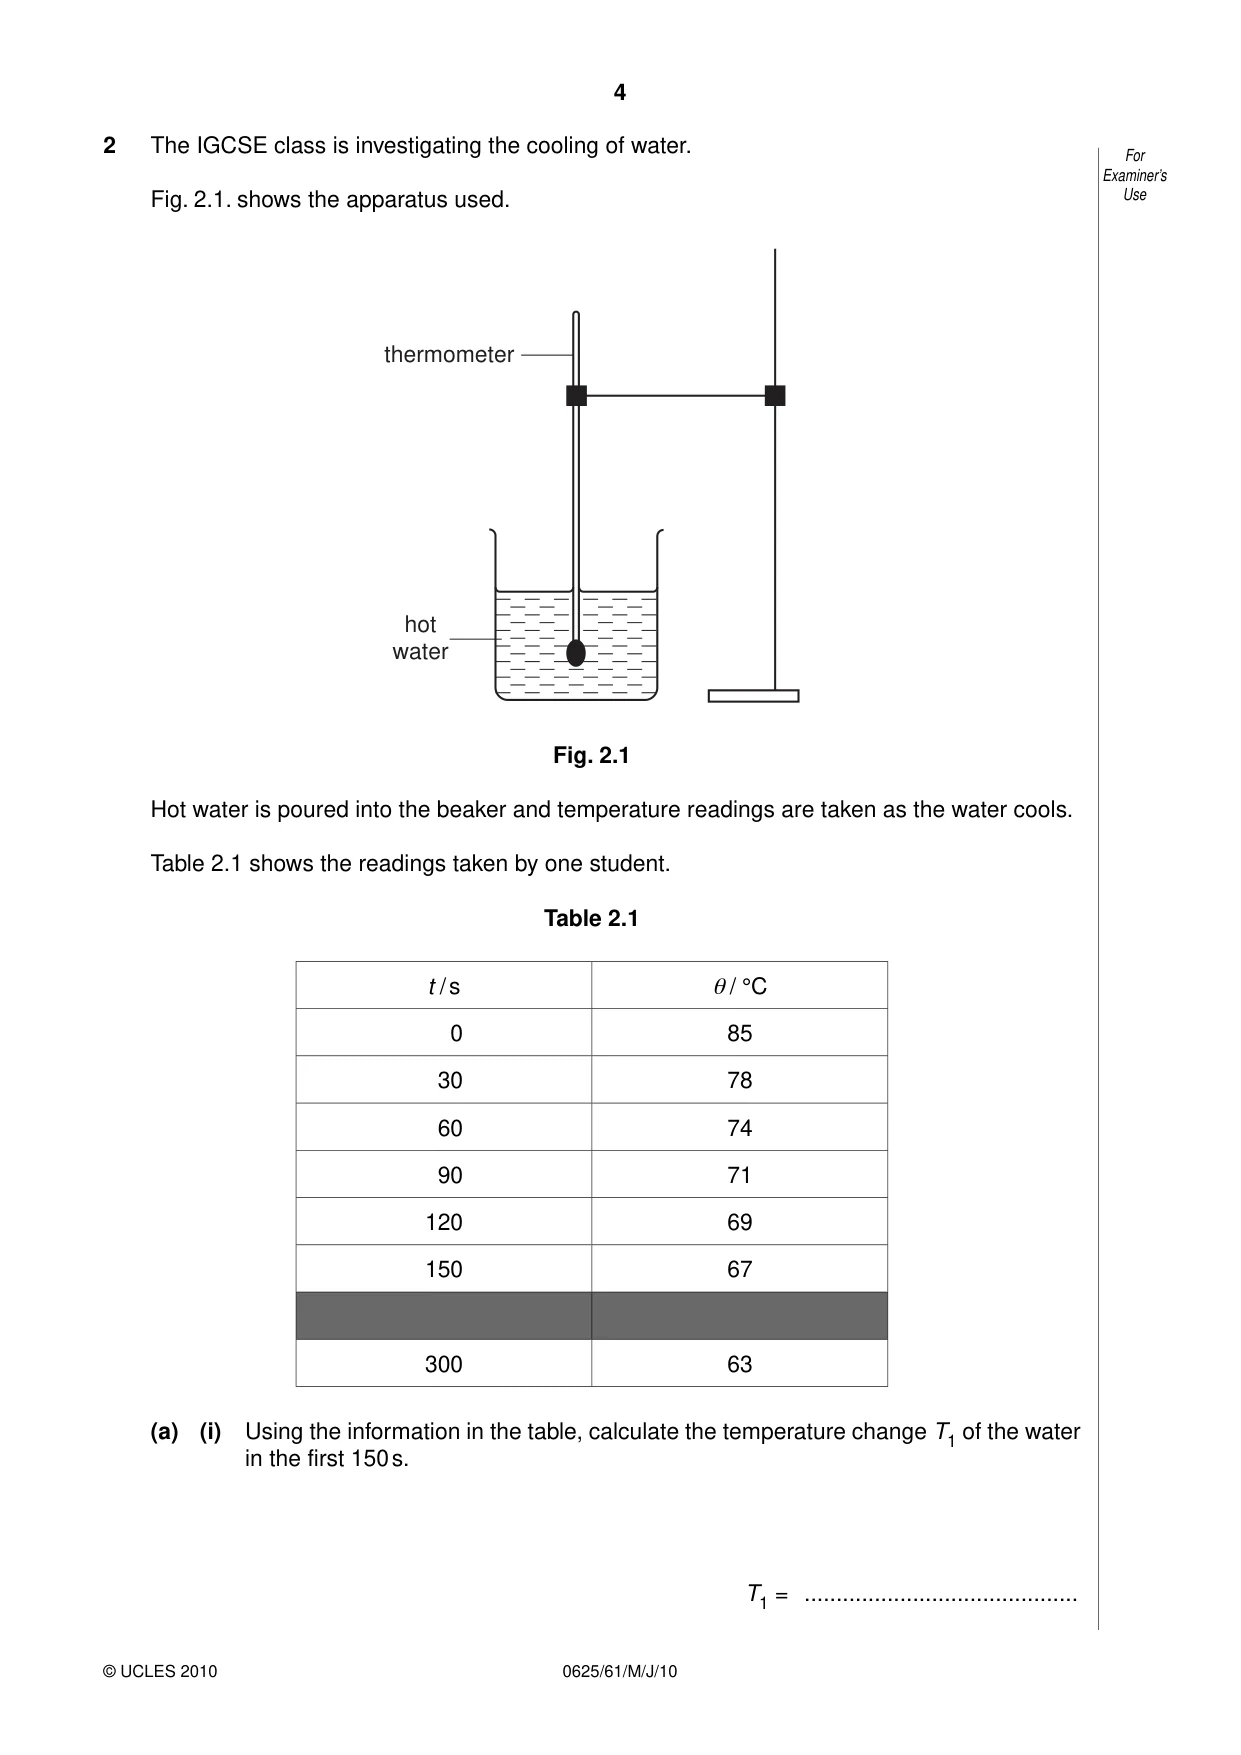
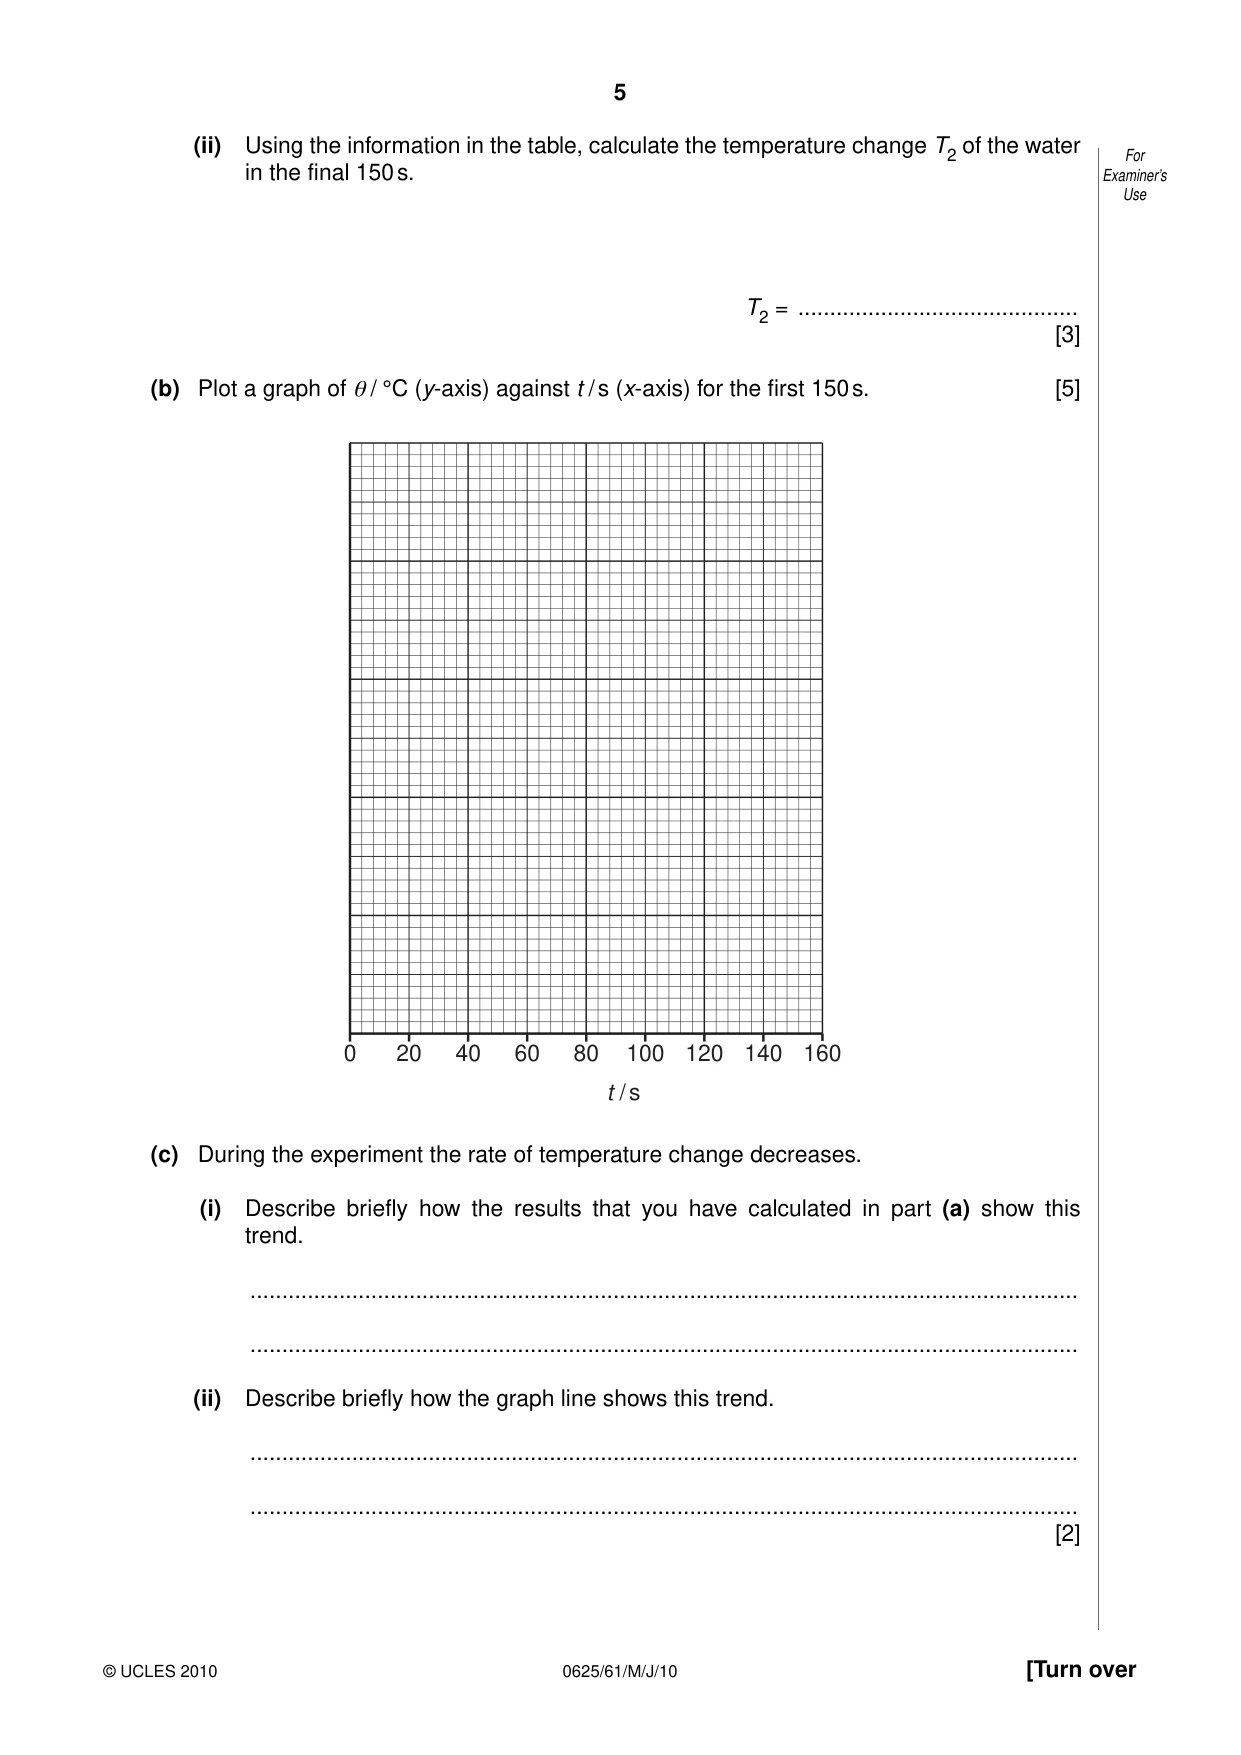
2 The IGCSE class is investigating the cooling of water. For Examiner’s Fig. 2.1. shows the apparatus used. Use thermometer hot water Fig. 2.1 Hot water is poured into the beaker and temperature readings are taken as the water cools. Table 2.1 shows the readings taken by one student. Table 2.1 t / s θ / °C 0 85 30 78 60 74 90 71 120 69 150 67 300 63 (a) (i) Using the information in the table, calculate the temperature change T1 of the water in the first 150 s. T1 = ........................................... (ii) Using the information in the table, calculate the temperature change T2 of the water For in the final 150 s. Examiner’s Use T2 = ............................................ [3] (b) Plot a graph of θ / °C (y-axis) against t / s (x-axis) for the first 150 s. [5] 0 20 40 60 80 100 120 140 160 t / s (c) During the experiment the rate of temperature change decreases. (i) Describe briefly how the results that you have calculated in part (a) show this trend. .................................................................................................................................. .................................................................................................................................. (ii) Describe briefly how the graph line shows this trend. .................................................................................................................................. .................................................................................................................................. [2]
Mark scheme: 2 (a) (i) T1 correct 18 [1] (ii) T2 correct 4 [1] unit oC (either position and not contradicted) [1] (b) graph: y-axis labelled [1] plots occupying at least half of grid on suitable scale [1] all plots correct to ½ square [1] well judged single, smooth curve line, not ‘point-to-point’ [1] thin line [1] (c) (i) T2 < T1 (wtte) [1] (ii) decreasing gradient (wtte) [1] [Total: 10] IGCSE – May/June 2010 0625 61
Q3 · The IGCSE class is investigating the effect of the length of resistance wire in a circuit…
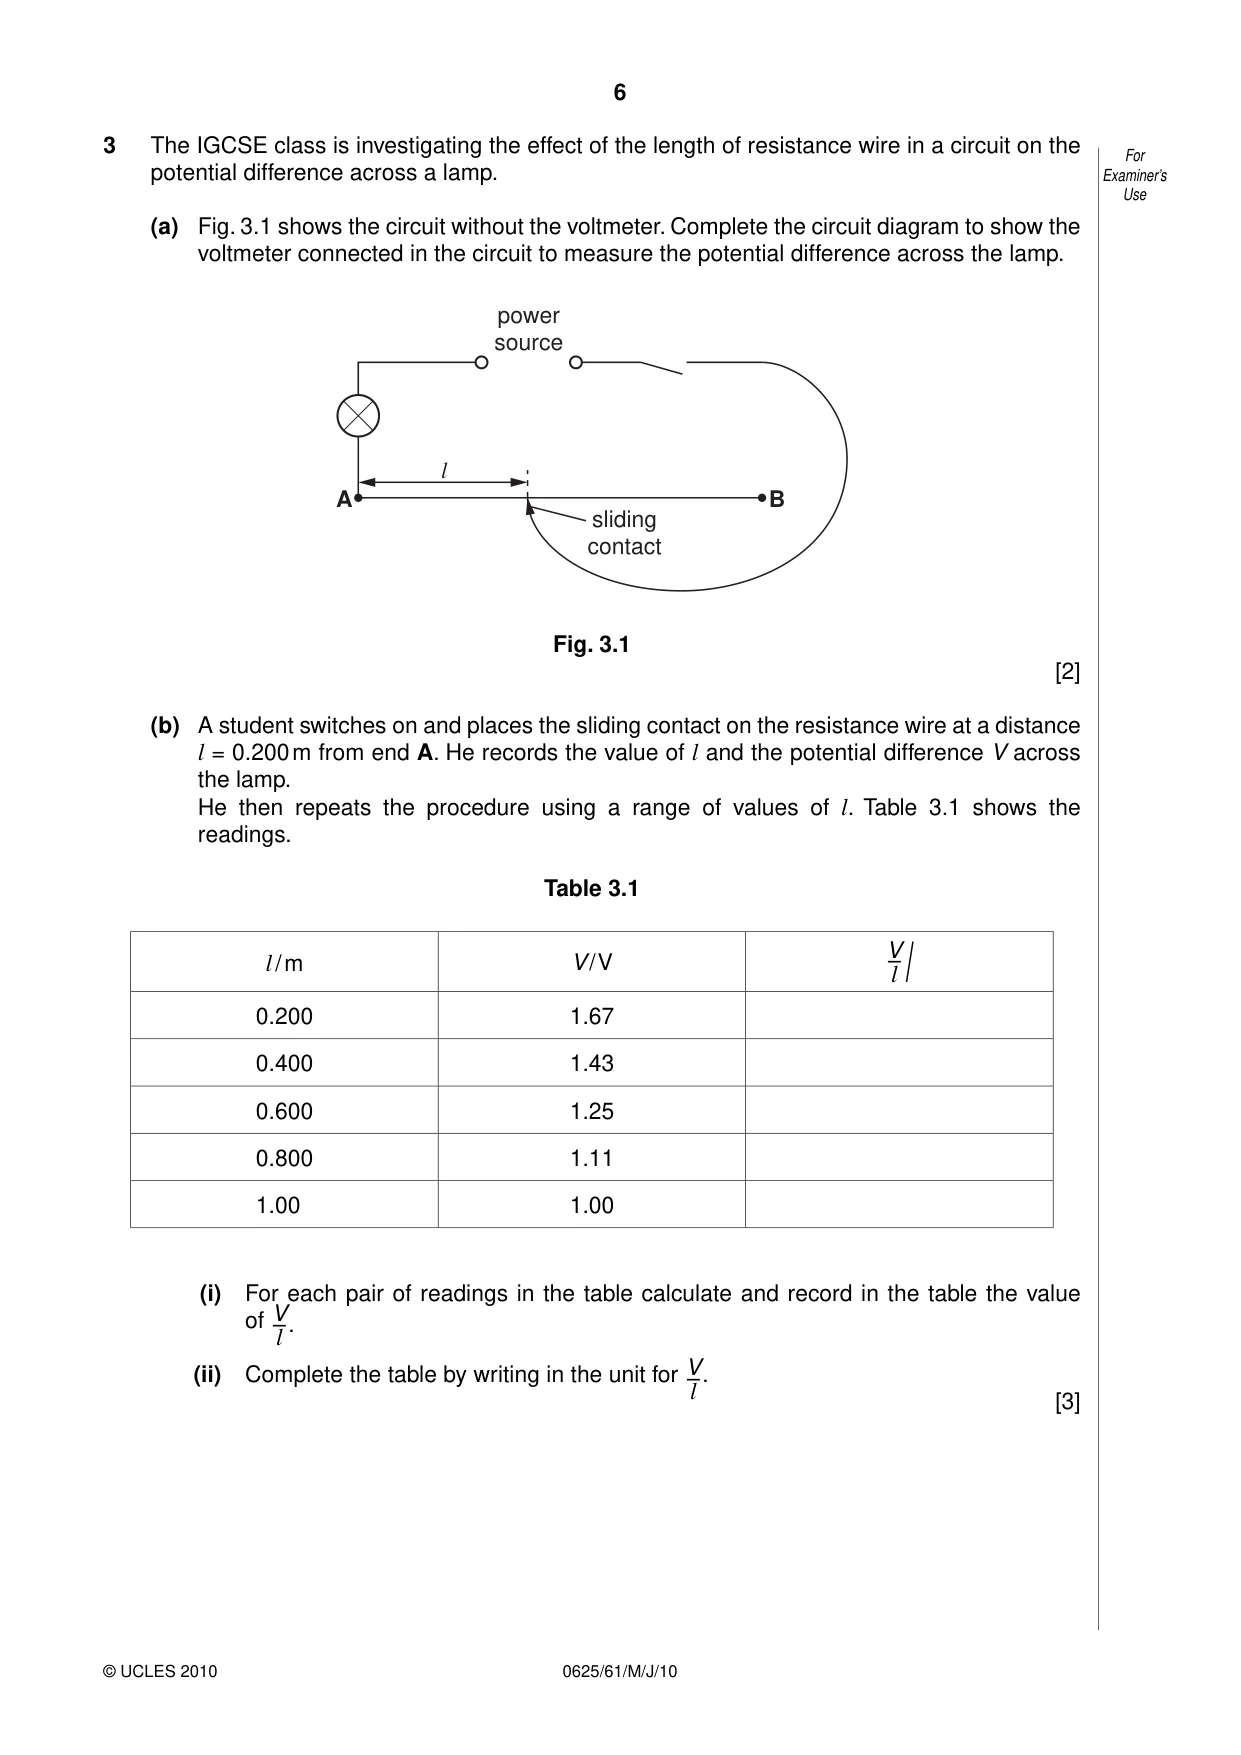
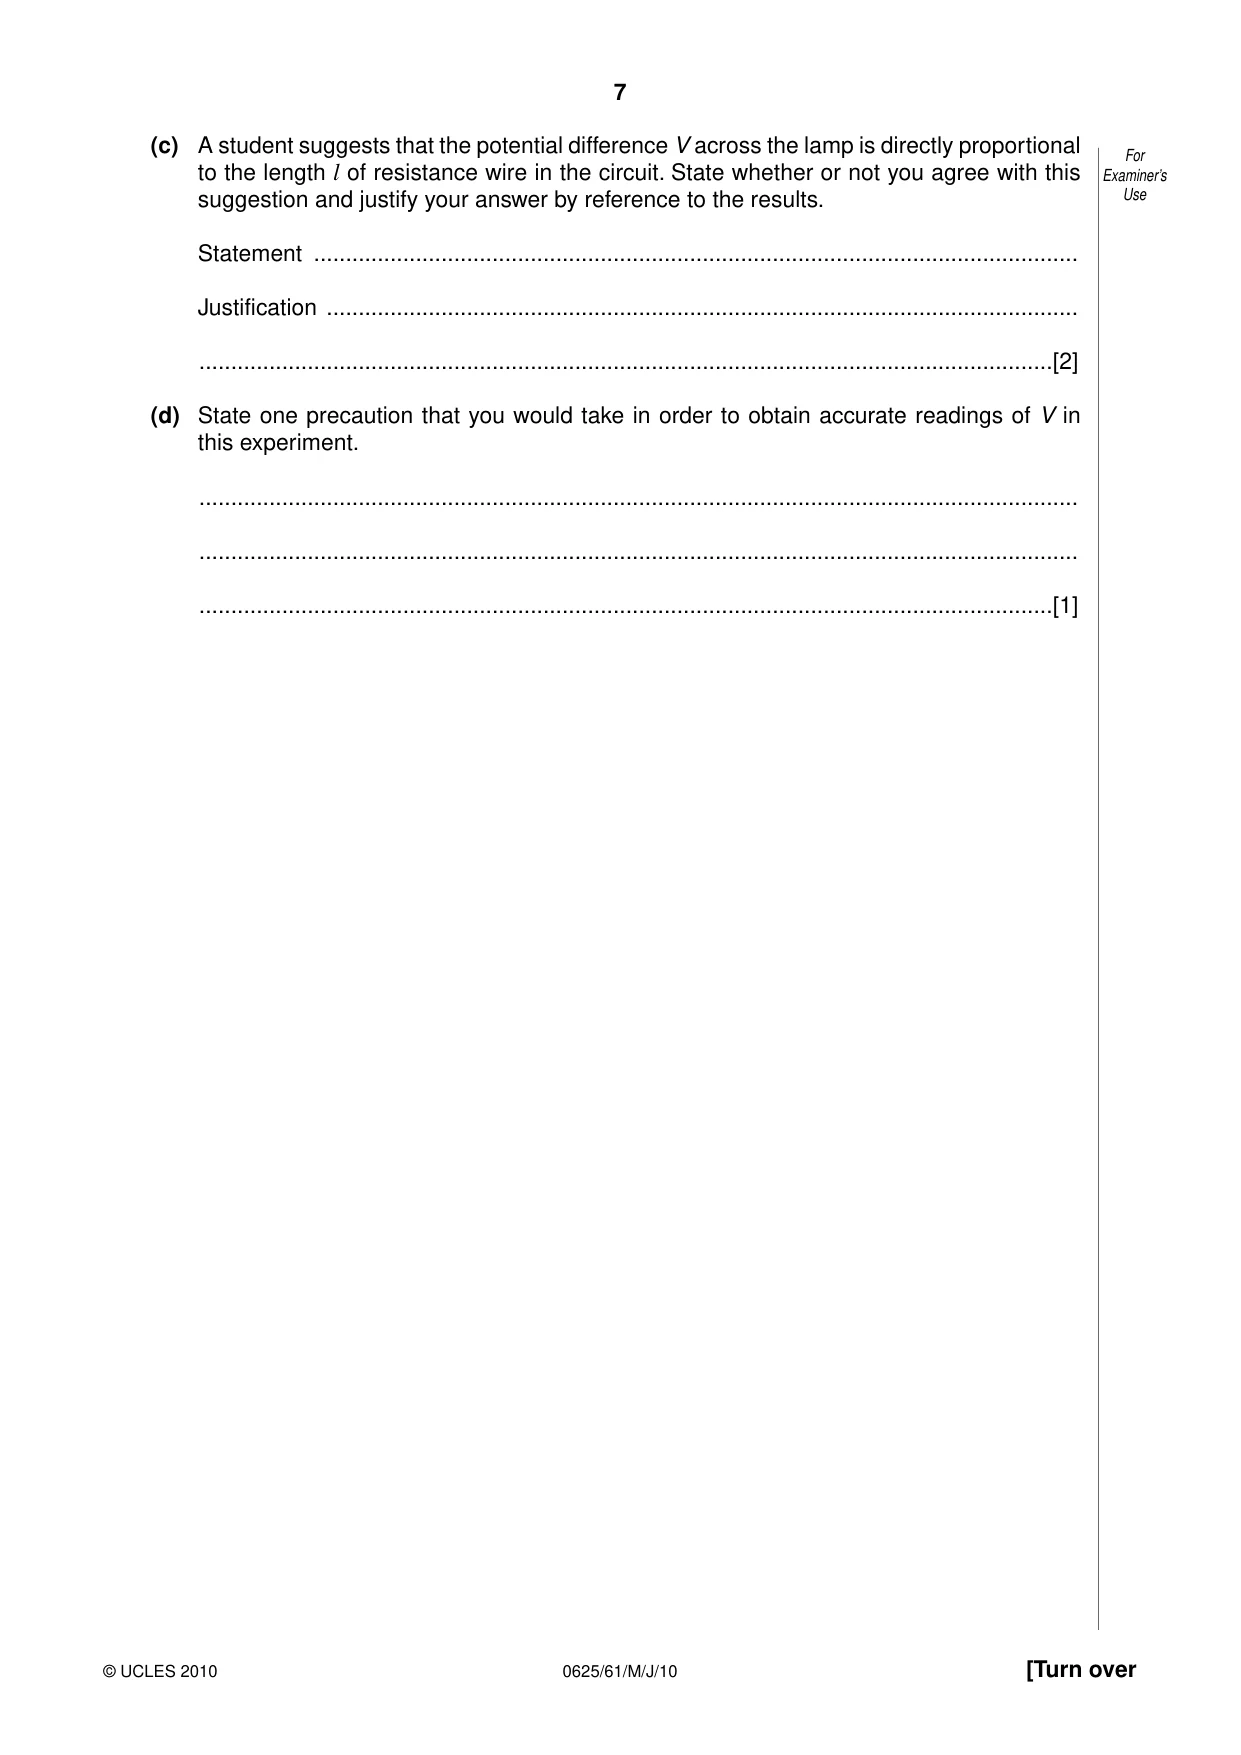
3 The IGCSE class is investigating the effect of the length of resistance wire in a circuit on the For potential difference across a lamp. Examiner’s Use (a) Fig. 3.1 shows the circuit without the voltmeter. Complete the circuit diagram to show the voltmeter connected in the circuit to measure the potential difference across the lamp. power source l A B sliding contact Fig. 3.1 [2] (b) A student switches on and places the sliding contact on the resistance wire at a distance l = 0.200 m from end A. He records the value of l and the potential difference V across the lamp. He then repeats the procedure using a range of values of l. Table 3.1 shows the readings. Table 3.1 V l / m V / V –l / 0.200 1.67 0.400 1.43 0.600 1.25 0.800 1.11 1.000 1.00 (i) For each pair of readings in the table calculate and record in the table the value of . V–l (ii) Complete the table by writing in the unit for . V–l [3] (c) A student suggests that the potential difference V across the lamp is directly proportional For to the length l of resistance wire in the circuit. State whether or not you agree with this Examiner’s suggestion and justify your answer by reference to the results. Use Statement ........................................................................................................................ Justification ...................................................................................................................... ......................................................................................................................................[2] (d) State one precaution that you would take in order to obtain accurate readings of V in this experiment. .......................................................................................................................................... .......................................................................................................................................... ......................................................................................................................................[1]
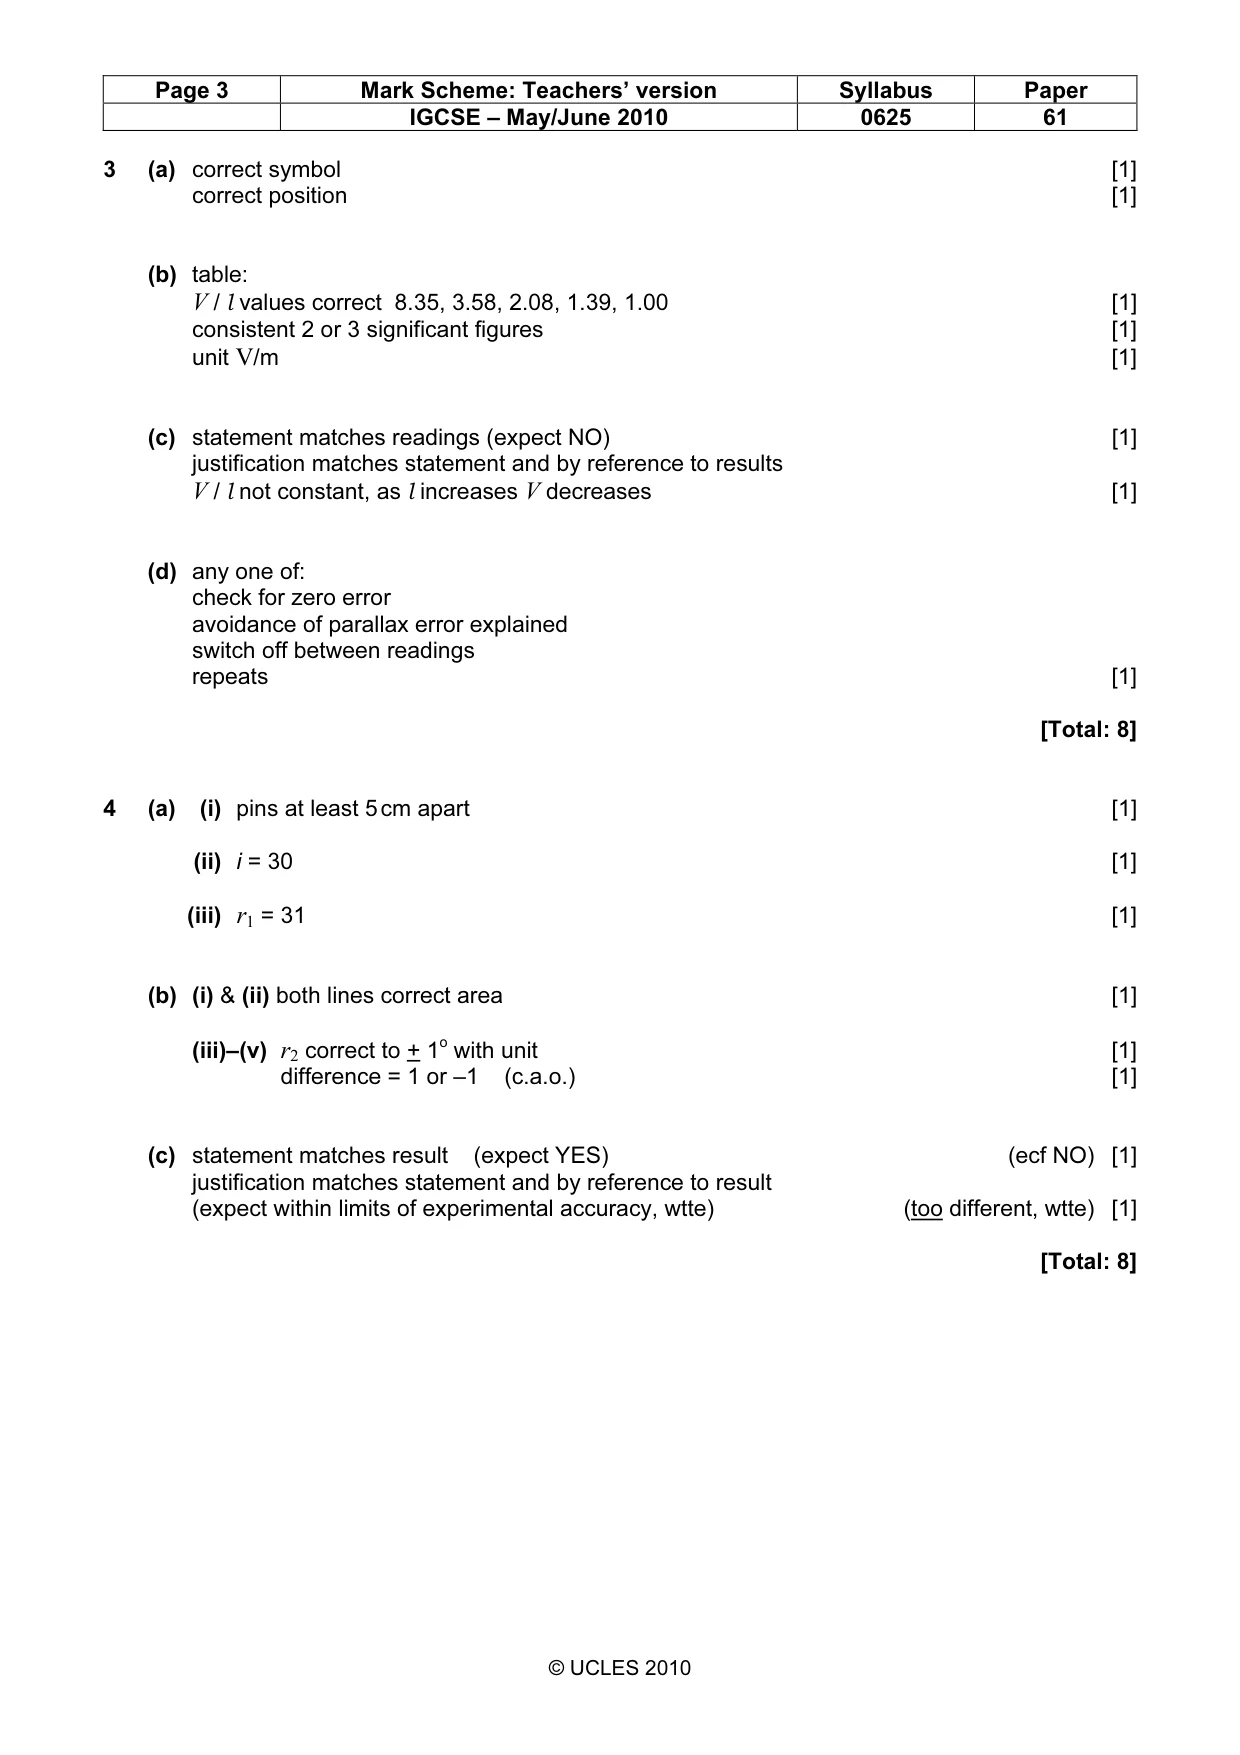
Mark scheme: 3 (a) correct symbol [1] correct position [1] (b) table: V / l values correct 8.35, 3.58, 2.08, 1.39, 1.00 [1] consistent 2 or 3 significant figures [1] unit V/m [1] (c) statement matches readings (expect NO) [1] justification matches statement and by reference to results V / l not constant, as l increases V decreases [1] (d) any one of: check for zero error avoidance of parallax error explained switch off between readings repeats [1] [Total: 8]
Q4 · An IGCSE student is investigating reflection from a plane mirror
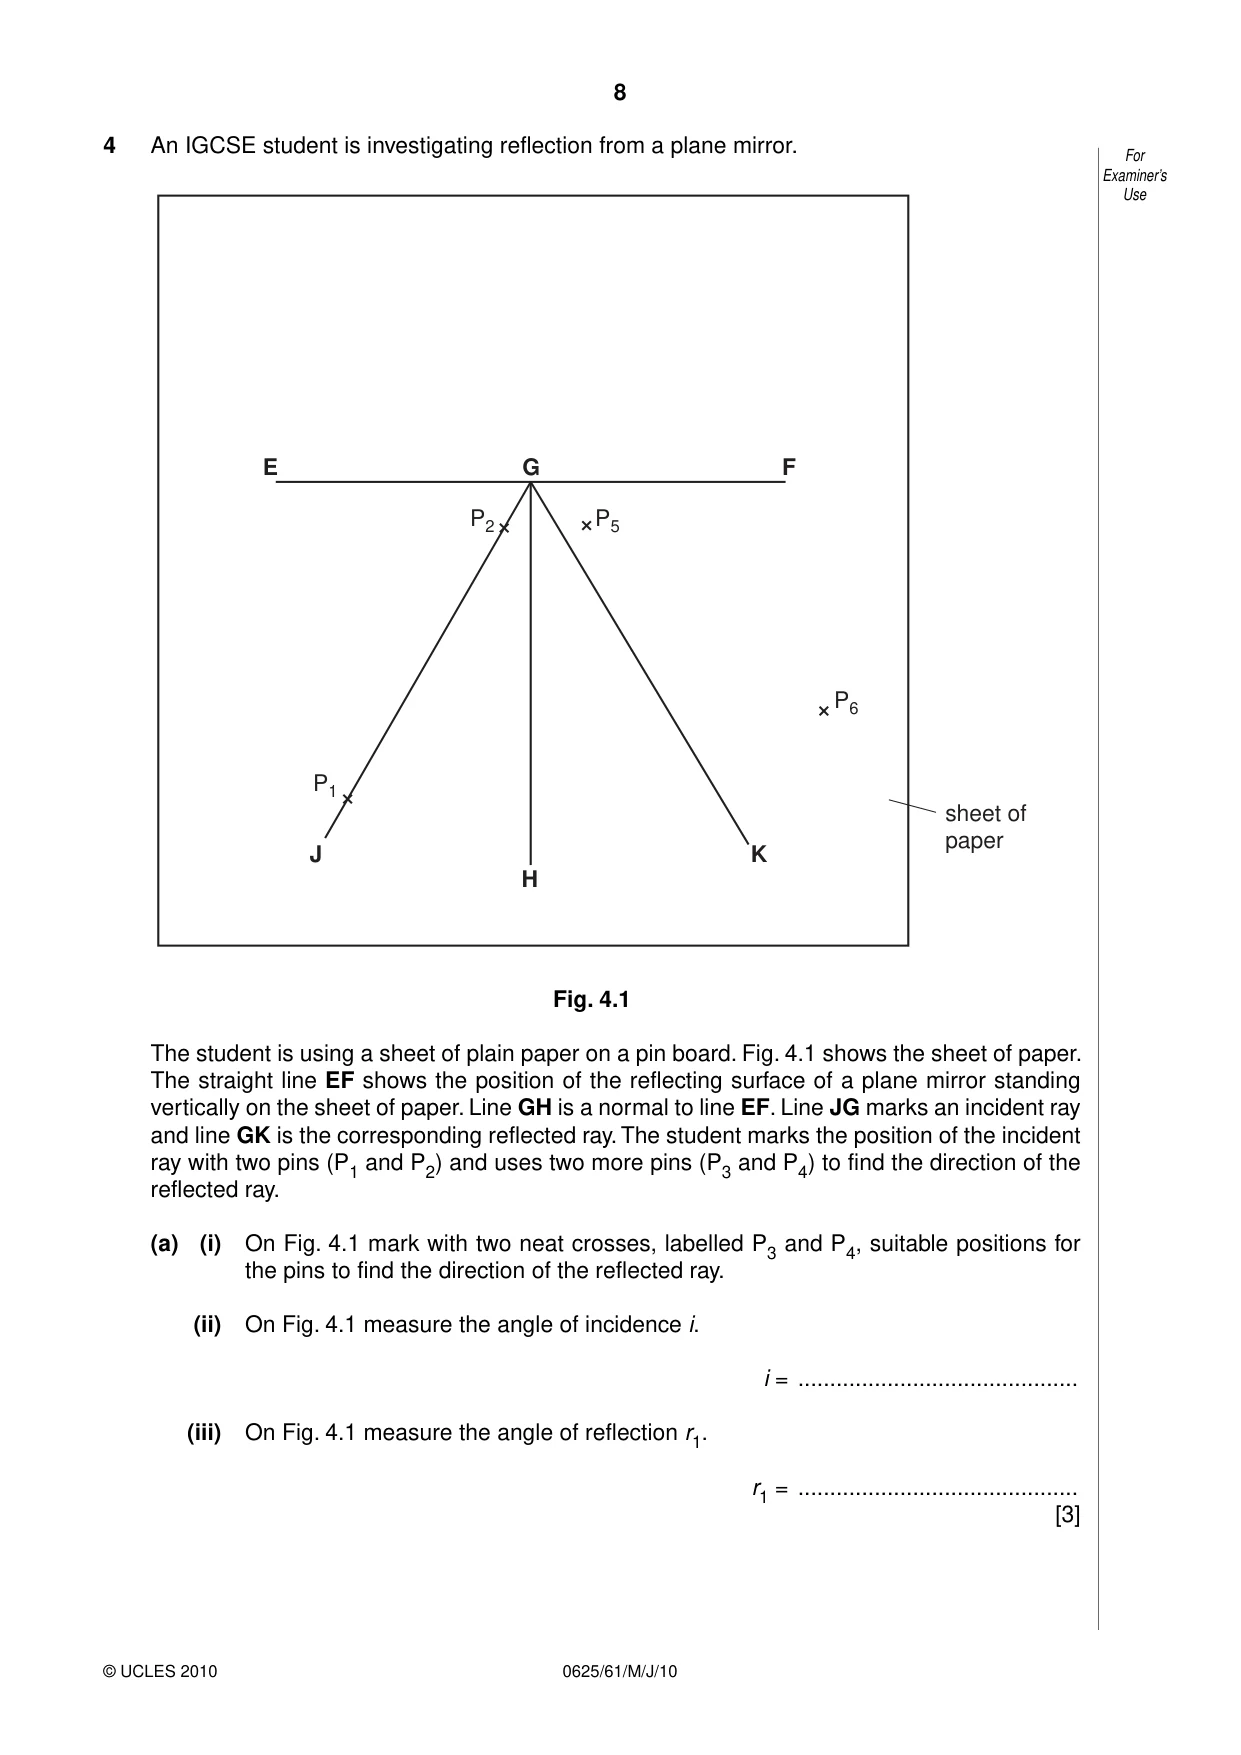
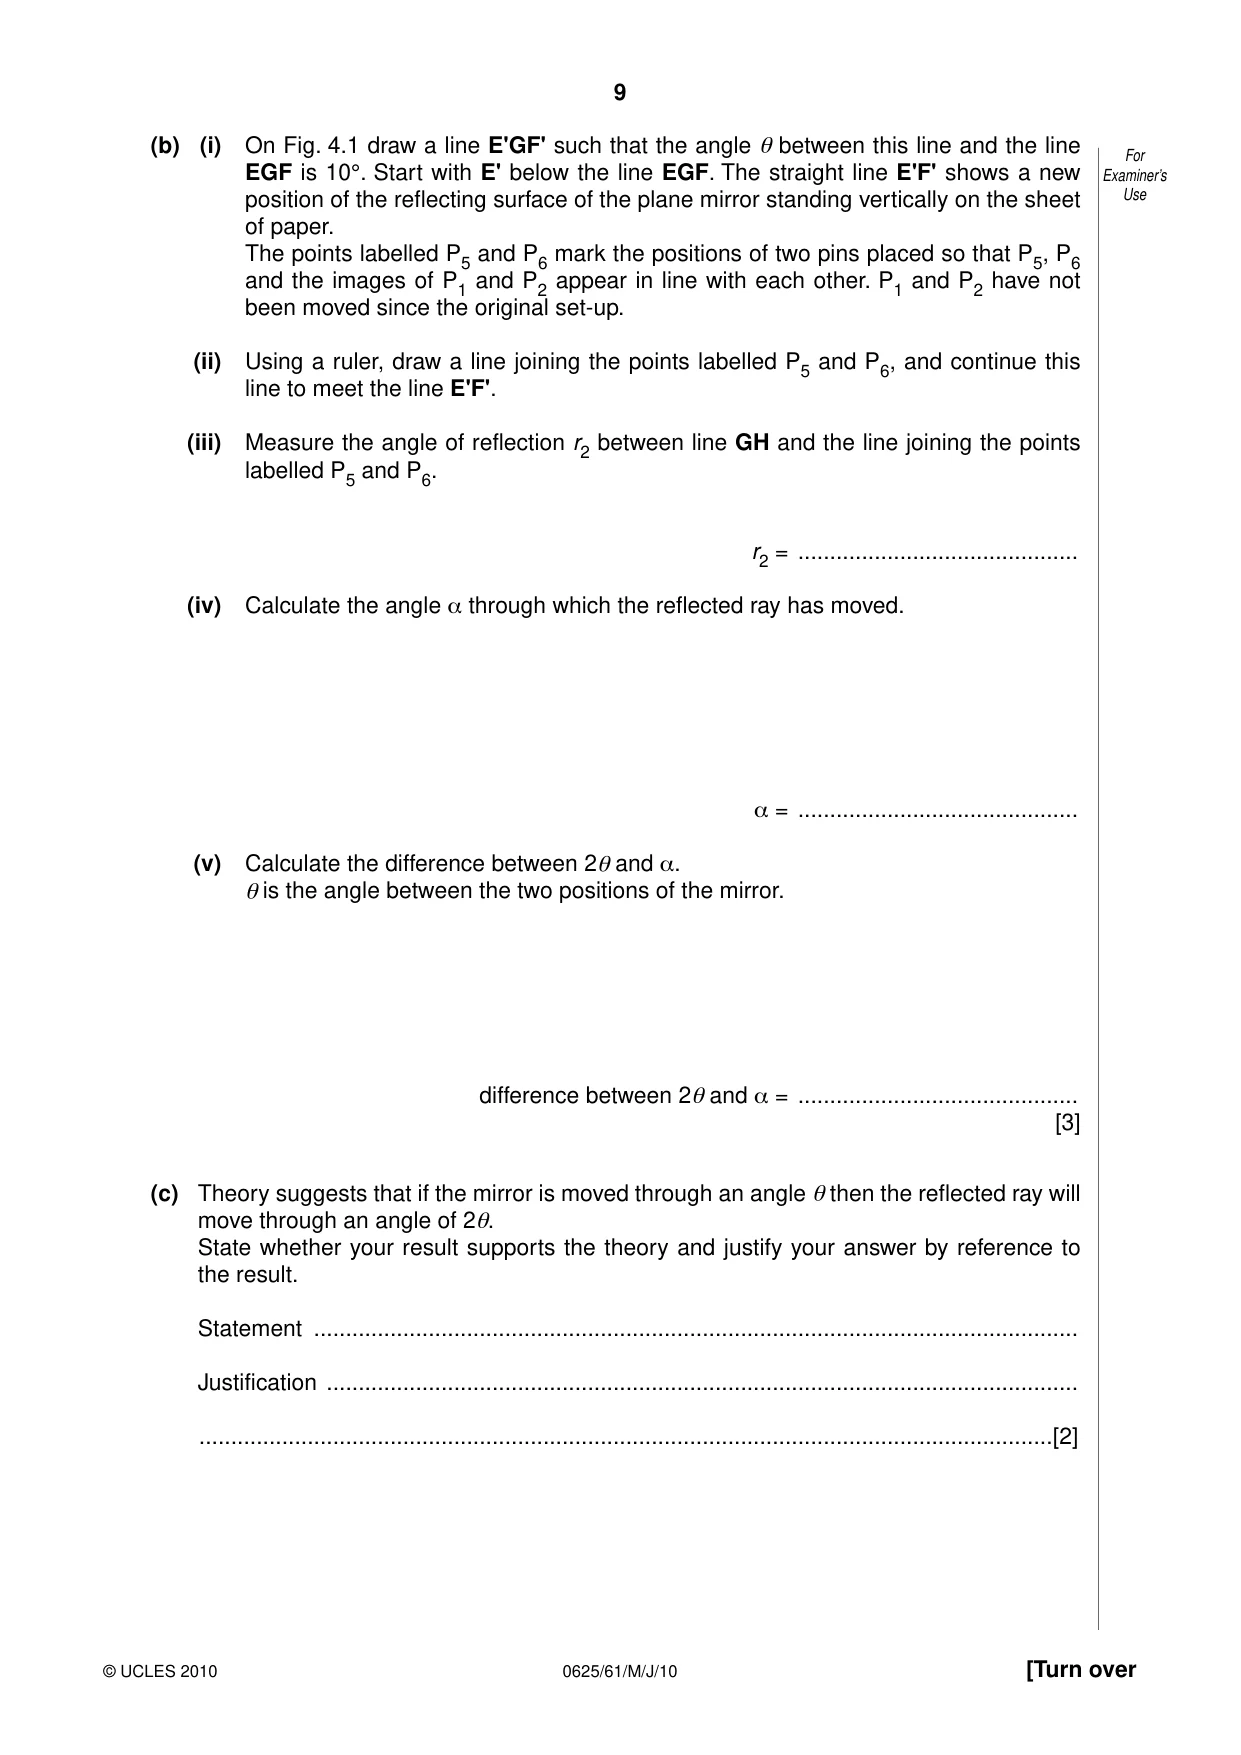
4 An IGCSE student is investigating reflection from a plane mirror. For Examiner’s Use E G F P2 P5 P6 P1 sheet of paper J K H Fig. 4.1 The student is using a sheet of plain paper on a pin board. Fig. 4.1 shows the sheet of paper. The straight line EF shows the position of the reflecting surface of a plane mirror standing vertically on the sheet of paper. Line GH is a normal to line EF. Line JG marks an incident ray and line GK is the corresponding reflected ray. The student marks the position of the incident ray with two pins (P1 and P2) and uses two more pins (P3 and P4) to find the direction of the reflected ray. (a) (i) On Fig. 4.1 mark with two neat crosses, labelled P3 and P4, suitable positions for the pins to find the direction of the reflected ray. (ii) On Fig. 4.1 measure the angle of incidence i. i = ............................................ (iii) On Fig. 4.1 measure the angle of reflection r1. r1 = ............................................ [3] (b) (i) On Fig. 4.1 draw a line E'GF' such that the angle θ between this line and the line For EGF is 10°. Start with E' below the line EGF. The straight line E'F' shows a new Examiner’s position of the reflecting surface of the plane mirror standing vertically on the sheet Use of paper. The points labelled P5 and P6 mark the positions of two pins placed so that P5, P6 and the images of P1 and P2 appear in line with each other. P1 and P2 have not been moved since the original set-up. (ii) Using a ruler, draw a line joining the points labelled P5 and P6, and continue this line to meet the line E'F'. (iii) Measure the angle of reflection r2 between line GH and the line joining the points labelled P5 and P6. r2 = ............................................ (iv) Calculate the angle α through which the reflected ray has moved. α = ............................................ (v) Calculate the difference between 2θ and α. θ is the angle between the two positions of the mirror. difference between 2θ and α = ............................................ [3] (c) Theory suggests that if the mirror is moved through an angle θ then the reflected ray will move through an angle of 2θ. State whether your result supports the theory and justify your answer by reference to the result. Statement ........................................................................................................................ Justification ...................................................................................................................... ......................................................................................................................................[2]
Mark scheme: 4 (a) (i) pins at least 5 cm apart [1] (ii) i = 30 [1] (iii) r1 = 31 [1] (b) (i) & (ii) both lines correct area [1] (iii)–(v) r2 correct to + 1o with unit [1] difference = 1 or –1 (c.a.o.) [1] (c) statement matches result (expect YES) (ecf NO) [1] justification matches statement and by reference to result (expect within limits of experimental accuracy, wtte) (too different, wtte) [1] [Total: 8] IGCSE – May/June 2010 0625 61
Q5 · The IGCSE class is investigating the swing of a loaded metre rule
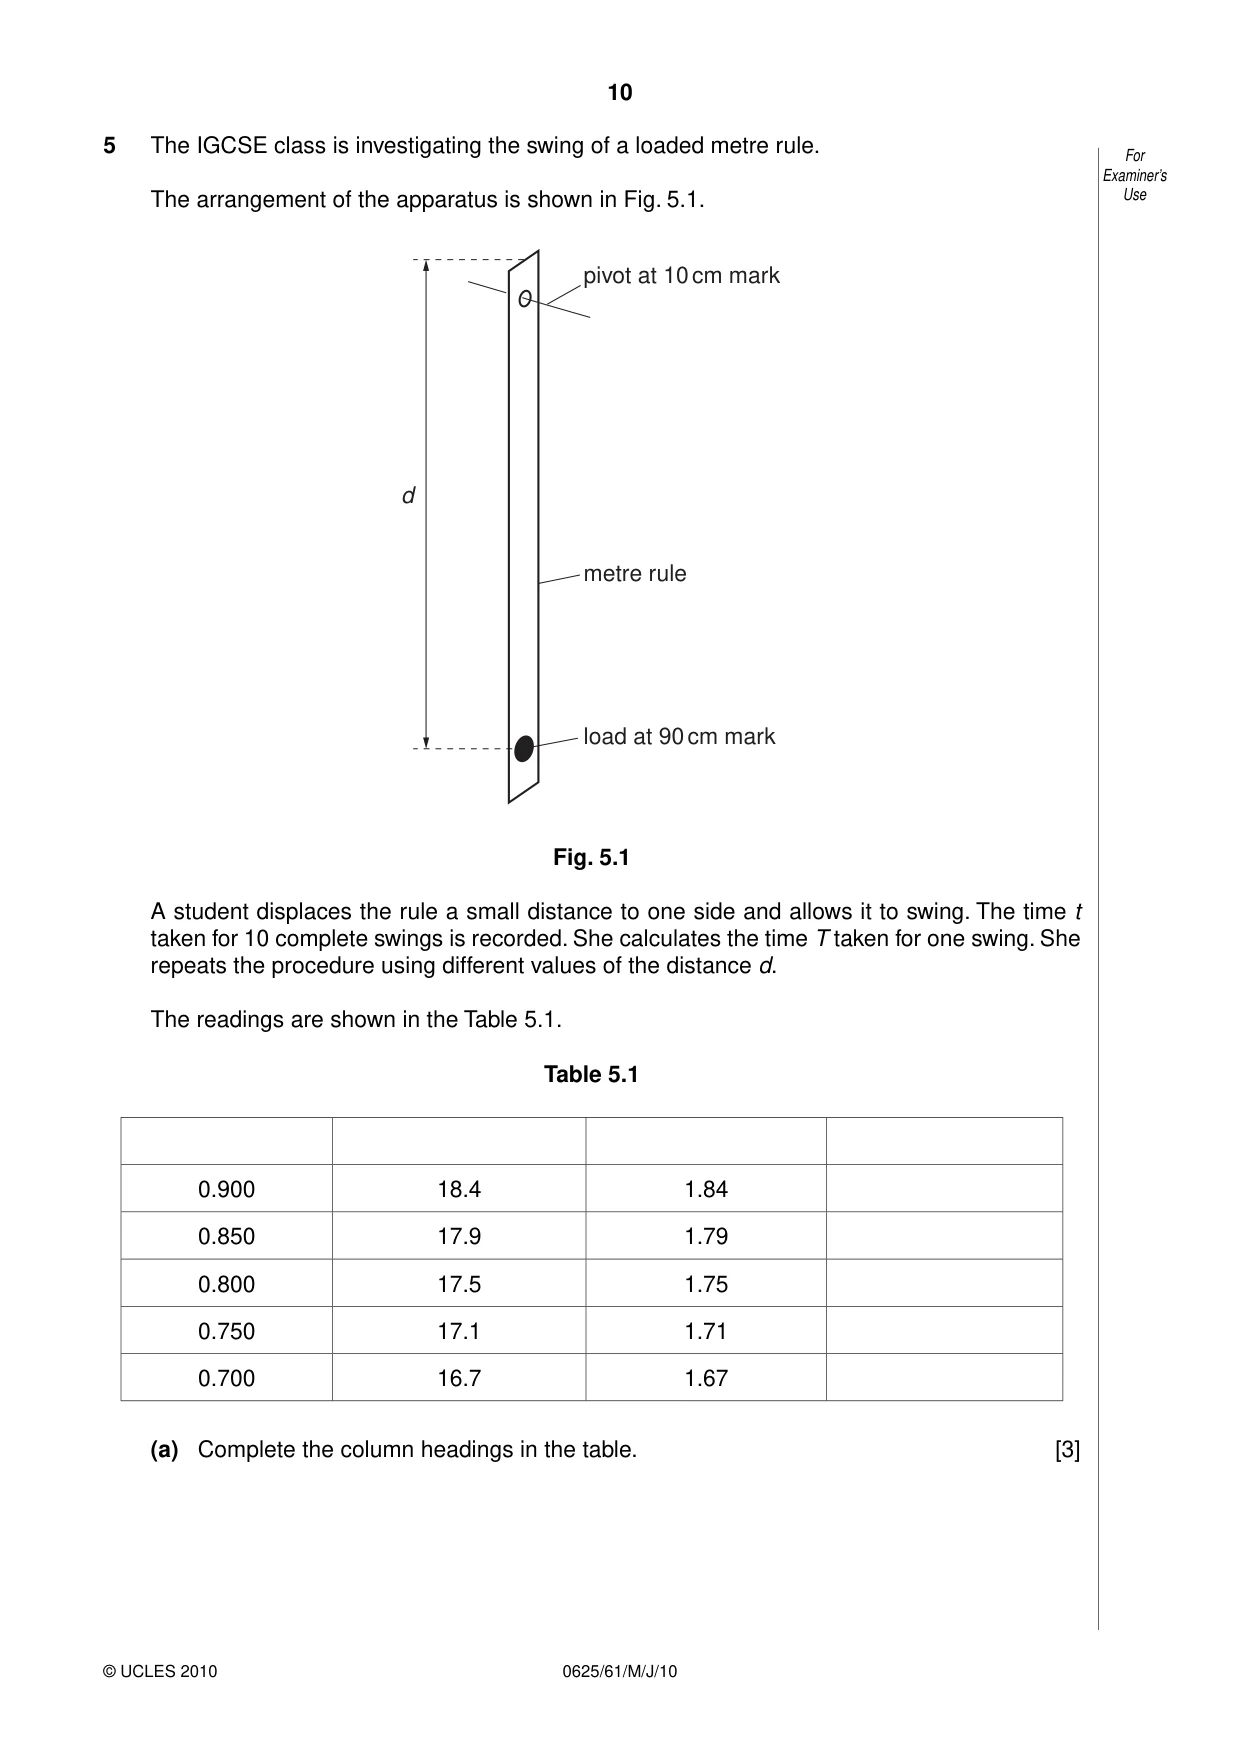
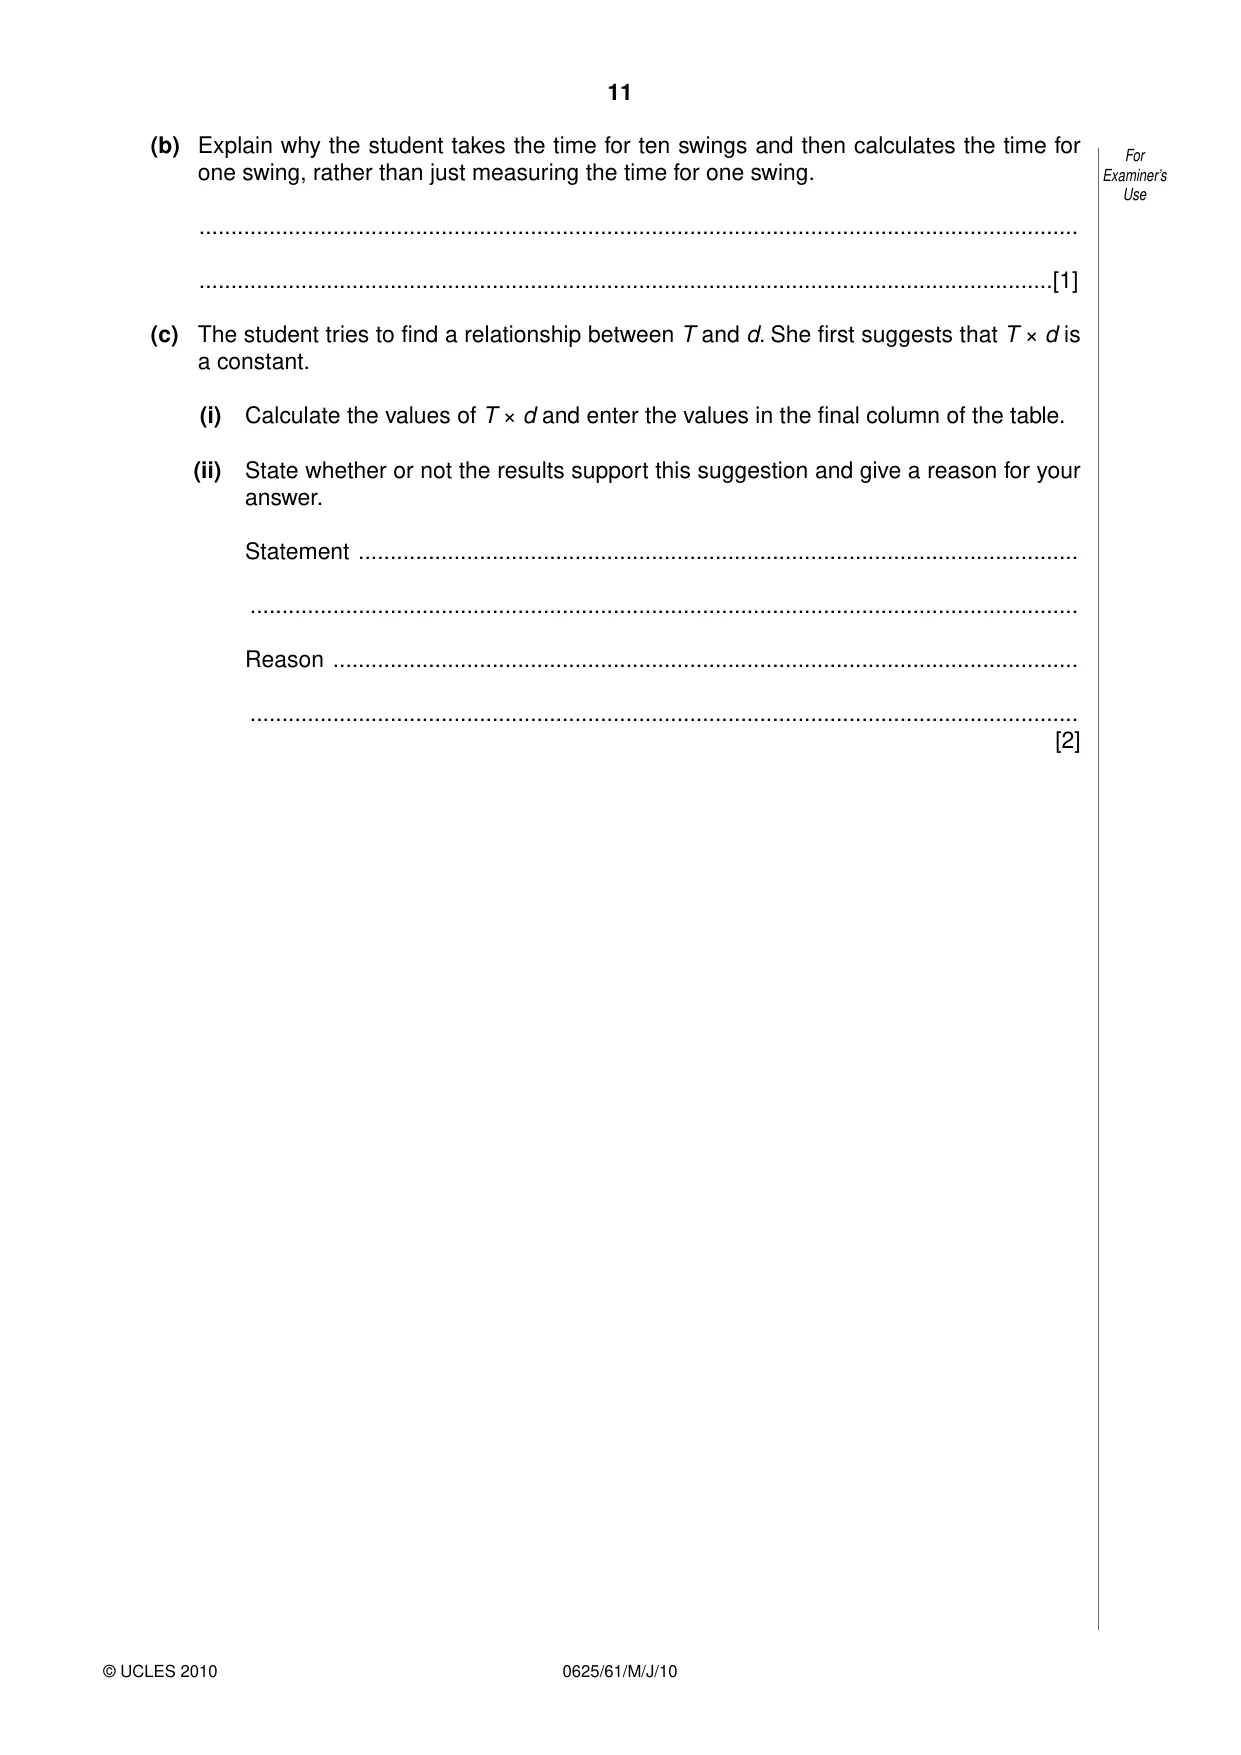
5 The IGCSE class is investigating the swing of a loaded metre rule. For Examiner’s The arrangement of the apparatus is shown in Fig. 5.1. Use pivot at 10 cm mark d metre rule load at 90 cm mark Fig. 5.1 A student displaces the rule a small distance to one side and allows it to swing. The time t taken for 10 complete swings is recorded. She calculates the time T taken for one swing. She repeats the procedure using different values of the distance d. The readings are shown in the Table 5.1. Table 5.1 0.900 18.4 1.84 0.850 17.9 1.79 0.800 17.5 1.75 0.750 17.1 1.71 0.700 16.7 1.67 (a) Complete the column headings in the table. [3] (b) Explain why the student takes the time for ten swings and then calculates the time for For one swing, rather than just measuring the time for one swing. Examiner’s Use .......................................................................................................................................... ......................................................................................................................................[1] (c) The student tries to find a relationship between T and d. She first suggests that T × d is a constant. (i) Calculate the values of T × d and enter the values in the final column of the table. (ii) State whether or not the results support this suggestion and give a reason for your answer. Statement ................................................................................................................. .................................................................................................................................. Reason ..................................................................................................................... .................................................................................................................................. [2]
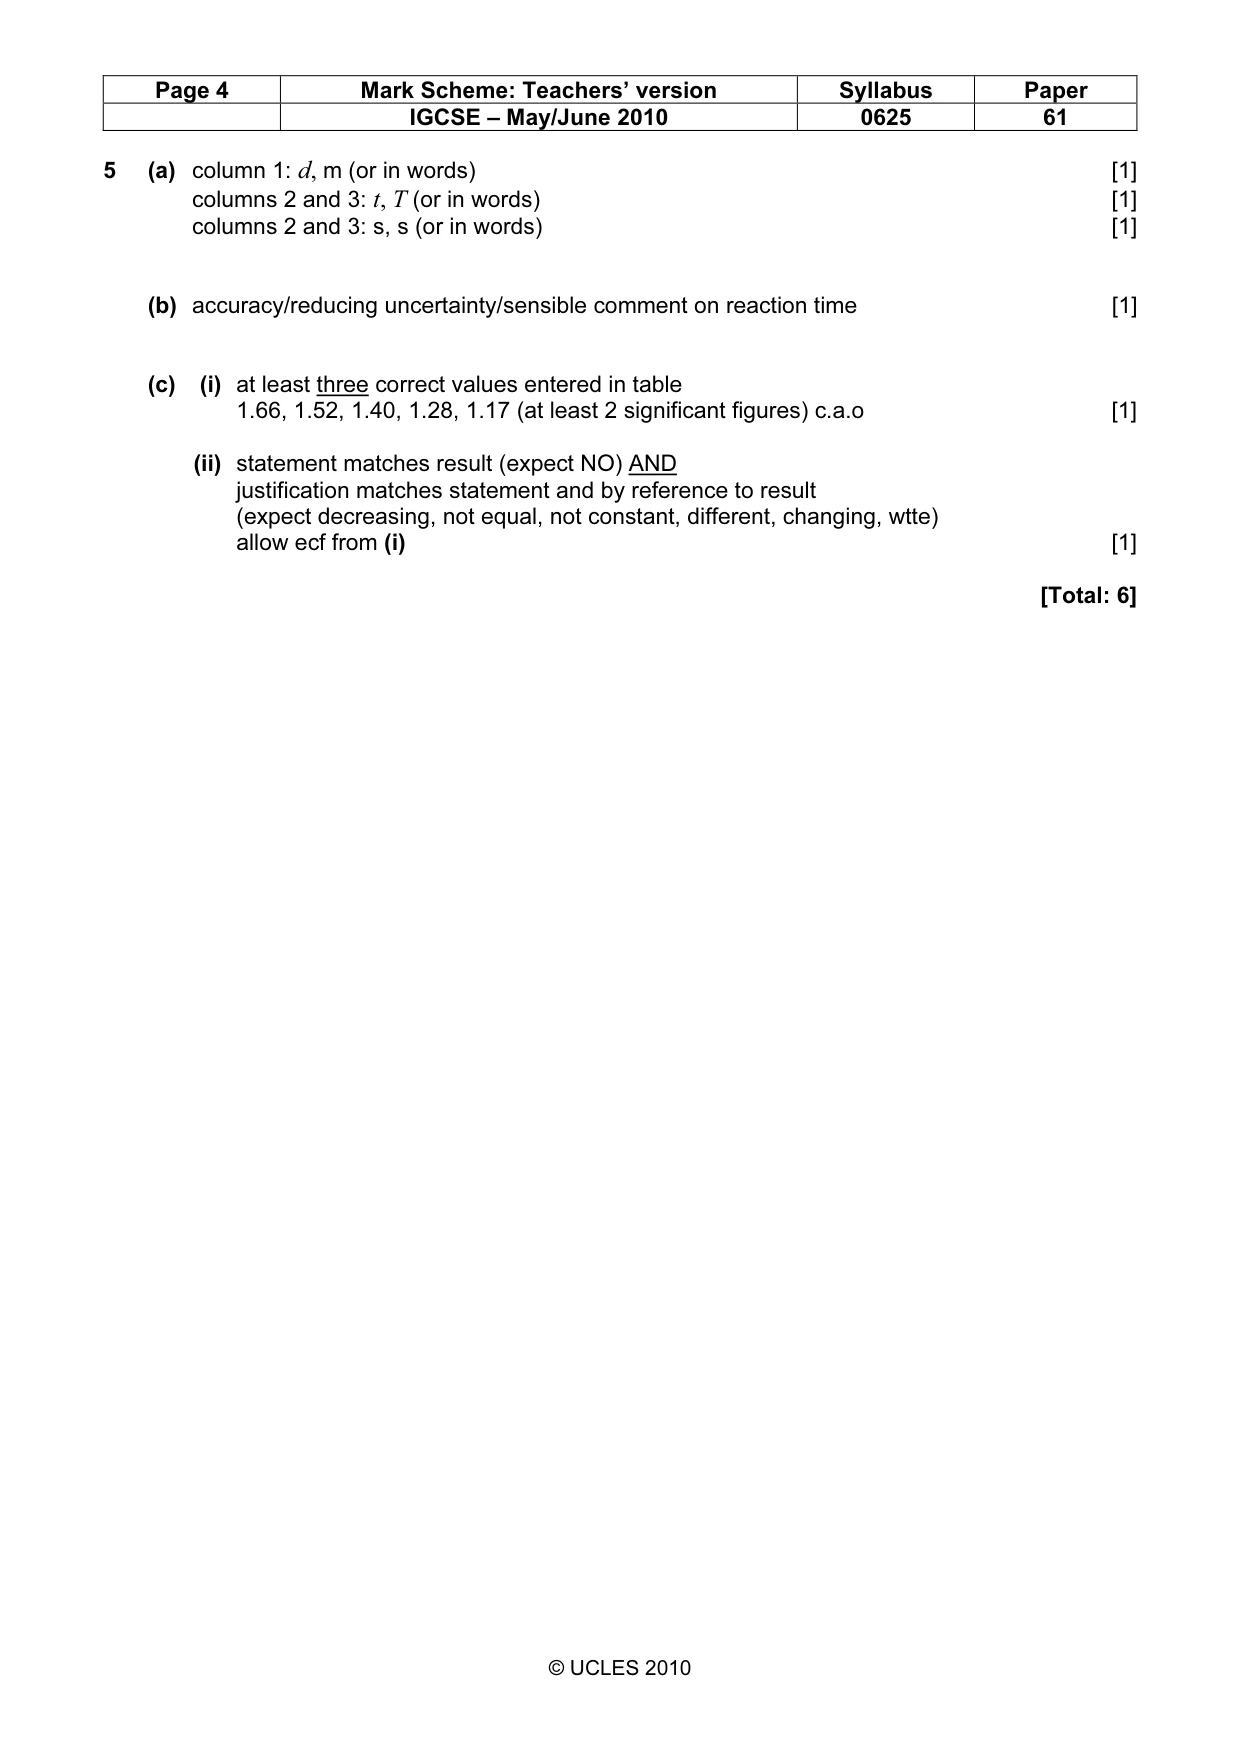
Mark scheme: 5 (a) column 1: d, m (or in words) [1] columns 2 and 3: t, T (or in words) [1] columns 2 and 3: s, s (or in words) [1] (b) accuracy/reducing uncertainty/sensible comment on reaction time [1] (c) (i) at least three correct values entered in table 1.66, 1.52, 1.40, 1.28, 1.17 (at least 2 significant figures) c.a.o [1] (ii) statement matches result (expect NO) AND justification matches statement and by reference to result (expect decreasing, not equal, not constant, different, changing, wtte) allow ecf from (i) [1] [Total: 6]
What was in this paper
The subtopics covered by these 5 questions, and how many questions each got. Open one in a new tab to see every Cambridge question on it.
What you needed in this session
Cambridge’s own grade thresholds for 2010 May/June, Paper 6 · Variant 1. A higher threshold means an easier paper — the bar moves with how the cohort did.