Cambridge IGCSE Physics 0625 — 2008 May/June Paper 6 · Variant 1
0625/61/M/J/08 · 5 questions · 40 marks · ≈45 min
The question paper and its mark scheme, free to read here and free to download. This is Cambridge’s own paper, exactly as it was sat.
Question paper16 pages

Mark scheme3 pages
Answers below. Sit the paper first if you are practising.
Questions as text
Q1 · An IGCSE student is determining the density of a solid metal cylinder using a balancing…
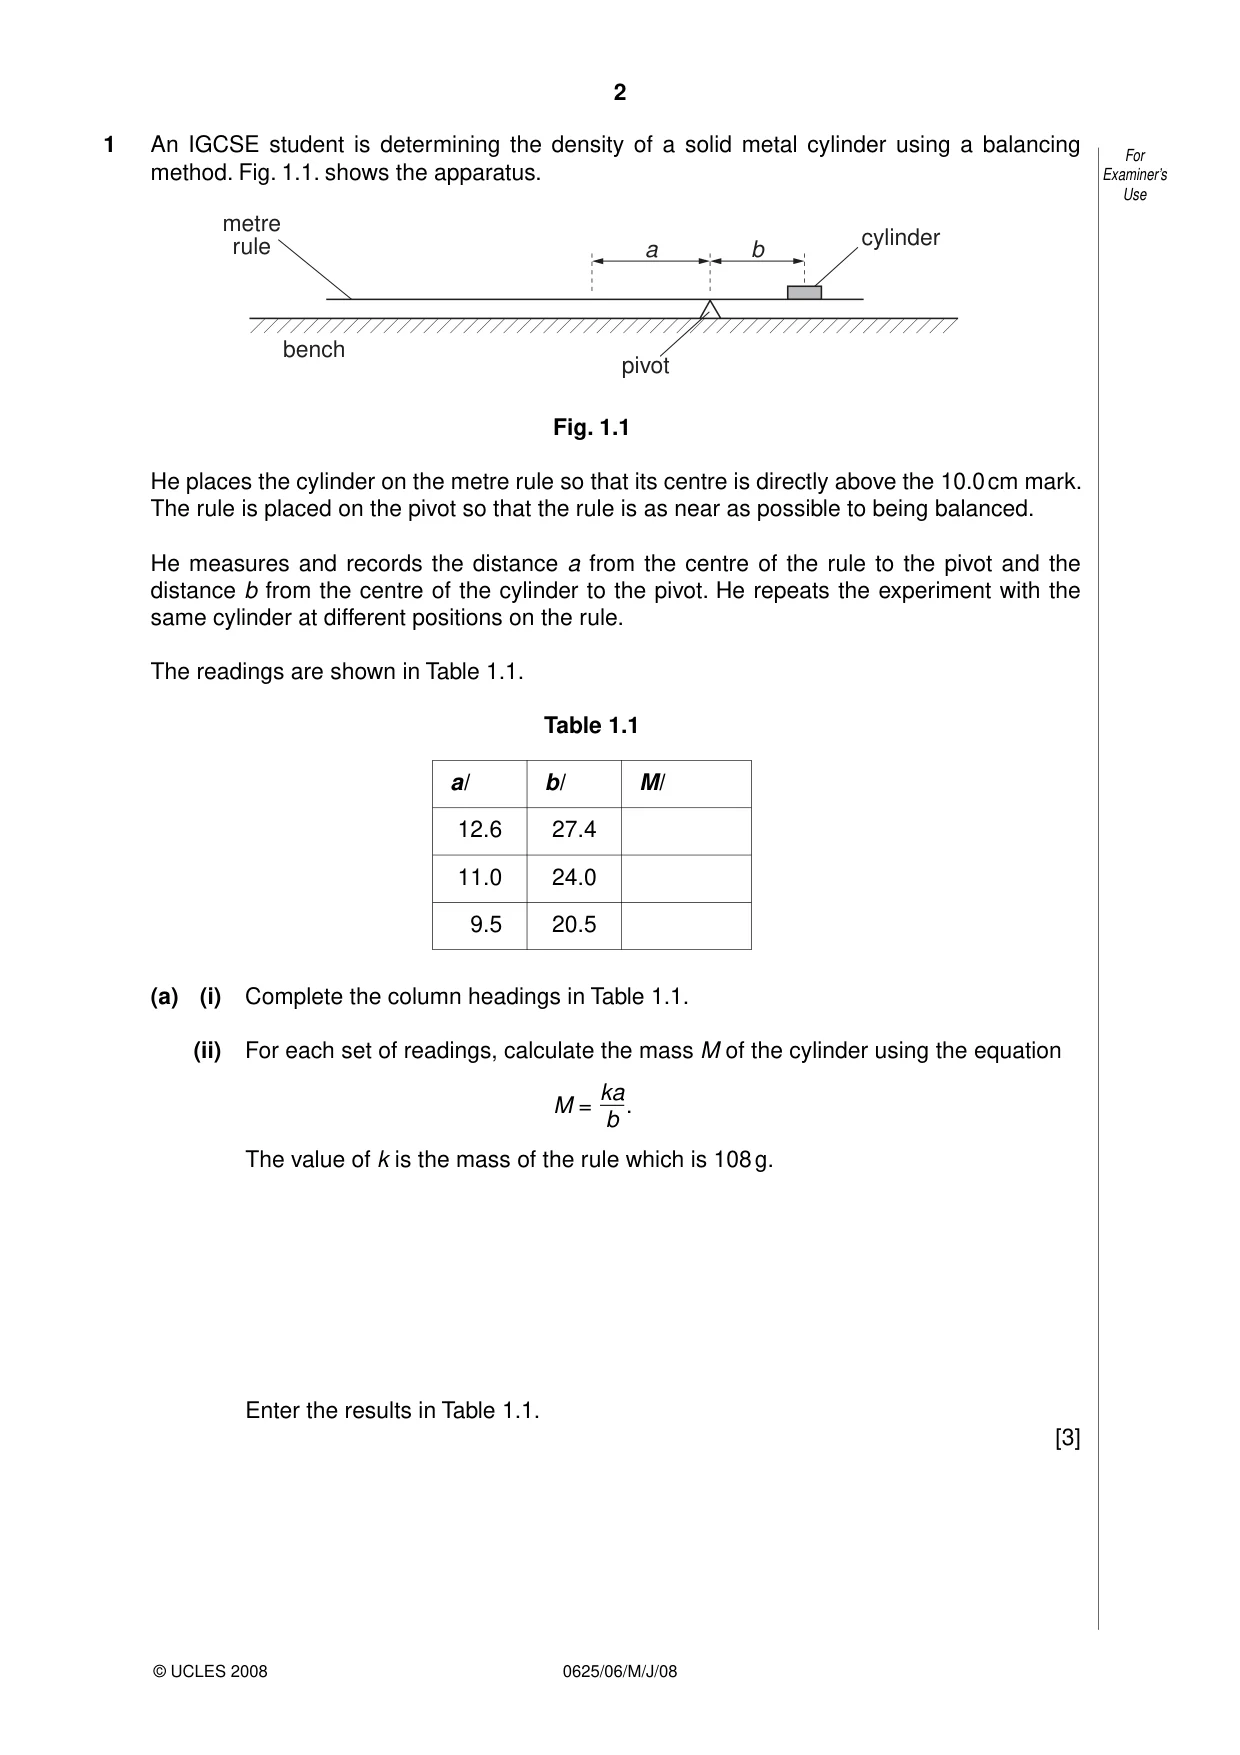
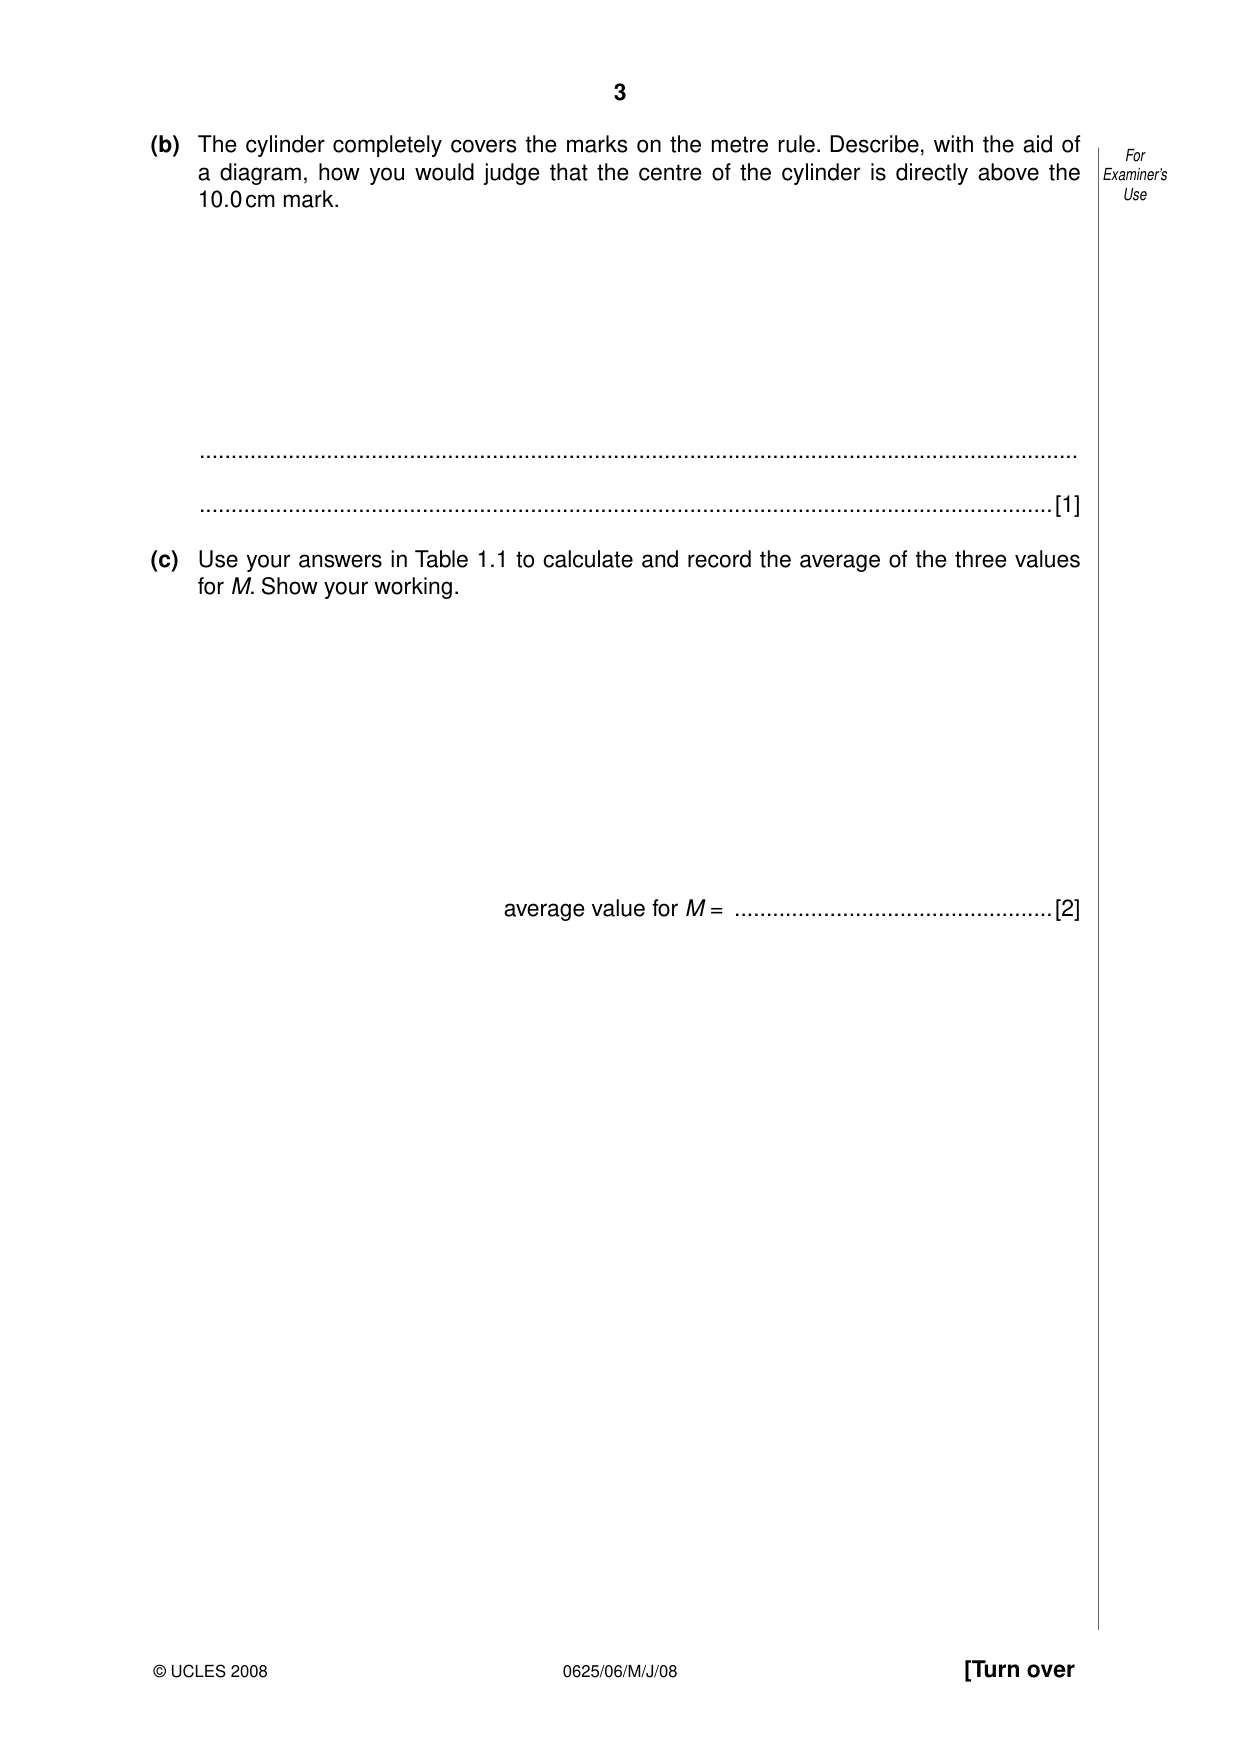
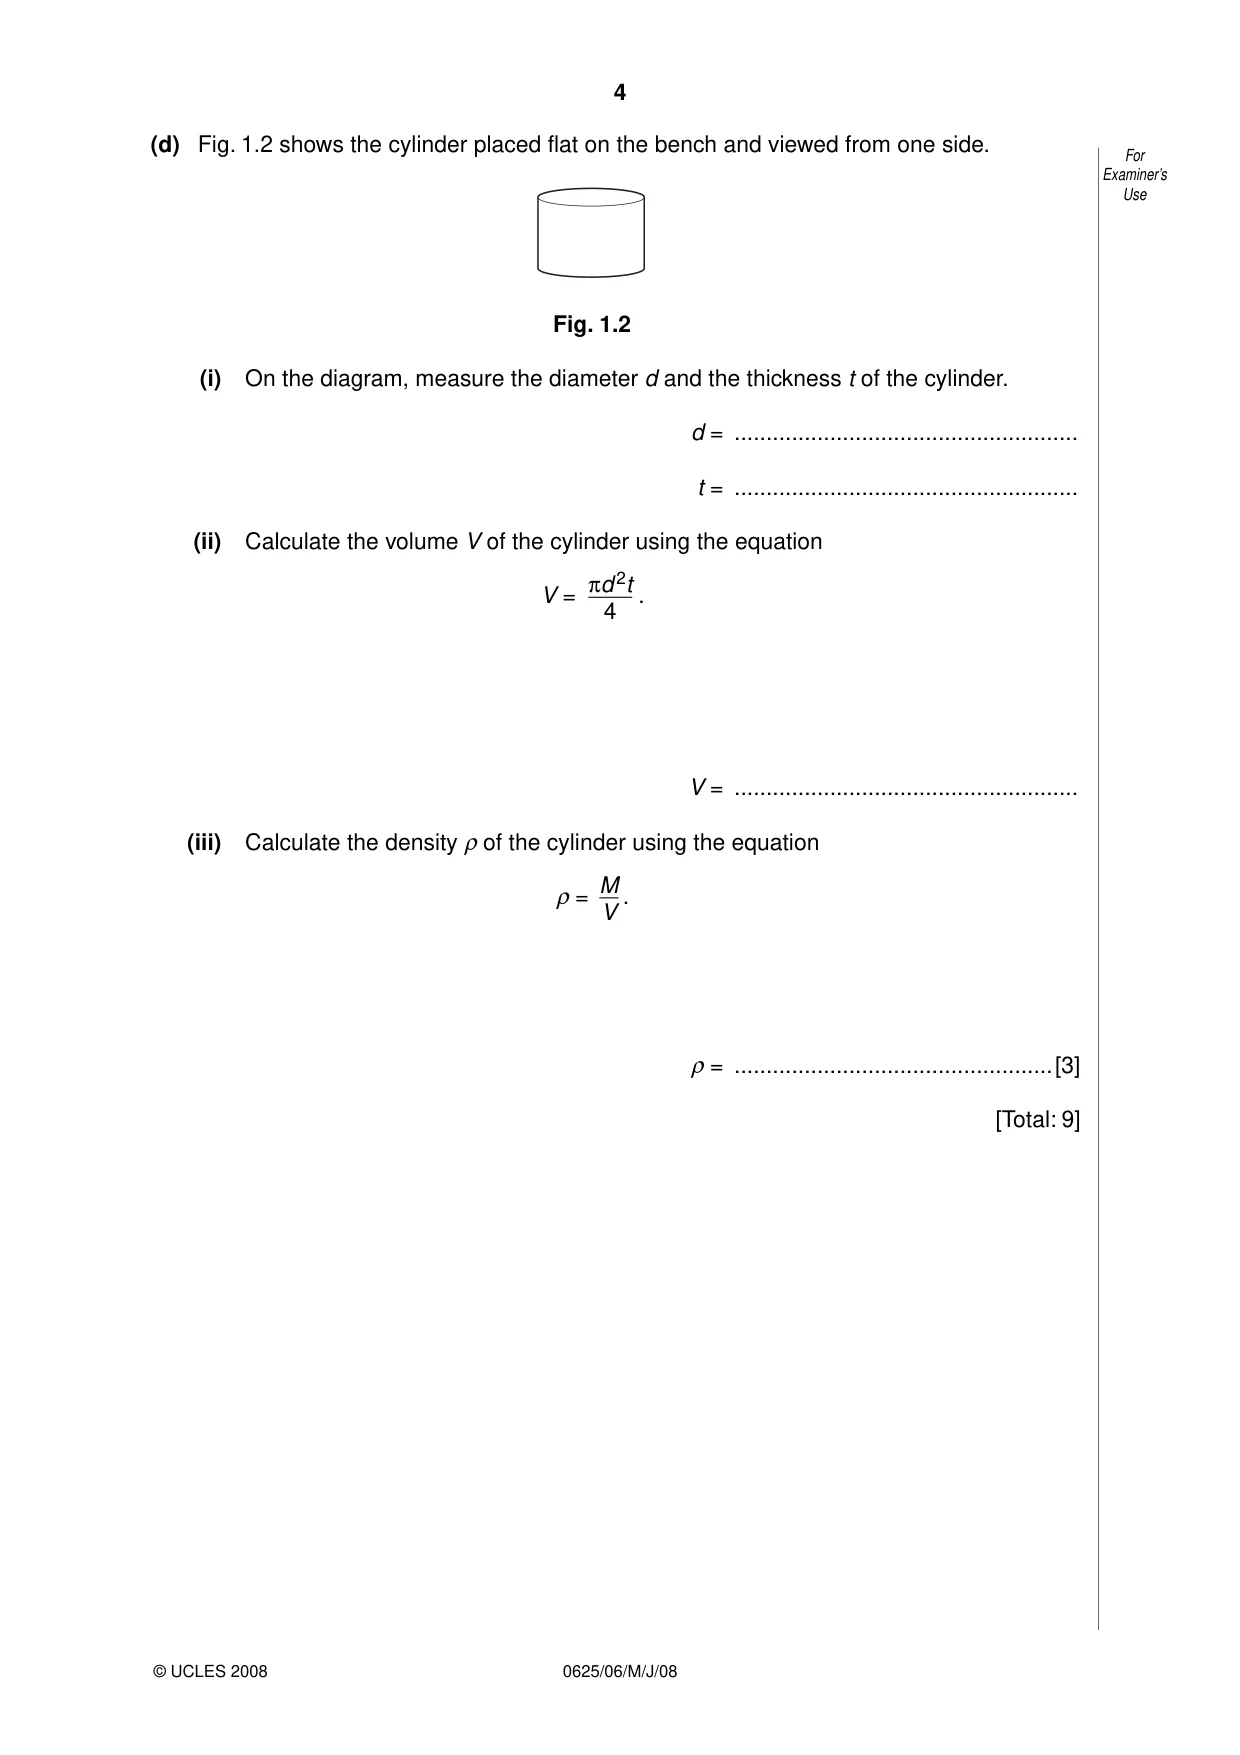
1 An IGCSE student is determining the density of a solid metal cylinder using a balancing For method. Fig. 1.1. shows the apparatus. Examiner’s Use metre cylinder rule a b bench pivot Fig. 1.1 He places the cylinder on the metre rule so that its centre is directly above the 10.0 cm mark. The rule is placed on the pivot so that the rule is as near as possible to being balanced. He measures and records the distance a from the centre of the rule to the pivot and the distance b from the centre of the cylinder to the pivot. He repeats the experiment with the same cylinder at different positions on the rule. The readings are shown in Table 1.1. Table 1.1 a / b / M / 12.6 27.4 11.0 24.0 9.5 20.5 (a) (i) Complete the column headings in Table 1.1. (ii) For each set of readings, calculate the mass M of the cylinder using the equation ka M = . b The value of k is the mass of the rule which is 108 g. Enter the results in Table 1.1. [3] (b) The cylinder completely covers the marks on the metre rule. Describe, with the aid of For a diagram, how you would judge that the centre of the cylinder is directly above the Examiner’s 10.0 cm mark. Use .......................................................................................................................................... ......................................................................................................................................[1] (c) Use your answers in Table 1.1 to calculate and record the average of the three values for M. Show your working. average value for M = ..................................................[2] (d) Fig. 1.2 shows the cylinder placed flat on the bench and viewed from one side. For Examiner’s Use Fig. 1.2 (i) On the diagram, measure the diameter d and the thickness t of the cylinder. d = ...................................................... t = ...................................................... (ii) Calculate the volume V of the cylinder using the equation πd 2t V = . 4 V = ...................................................... (iii) Calculate the density ρ of the cylinder using the equation ρ = M . V ρ = ..................................................[3] [Total: 9]
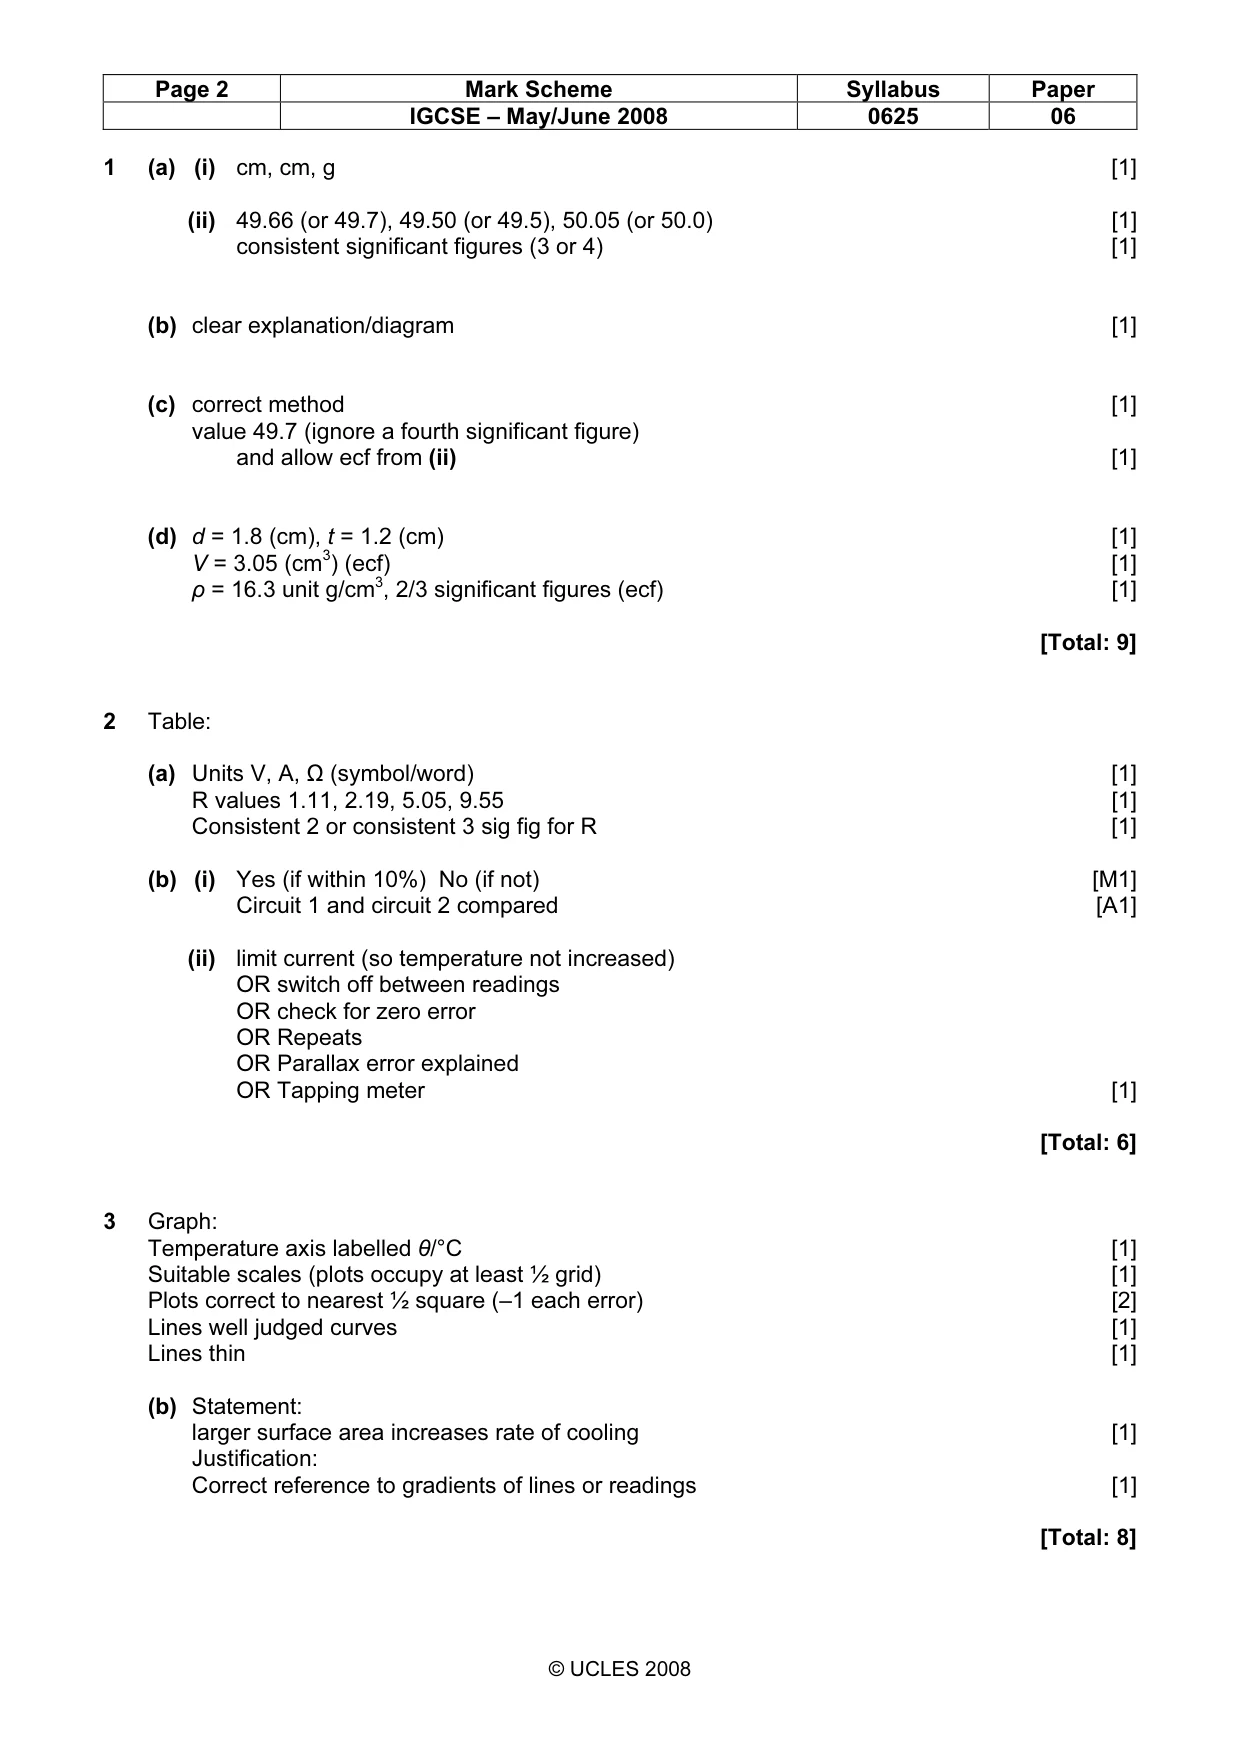
Mark scheme: 1 (a) (i) cm, cm, g [1] (ii) 49.66 (or 49.7), 49.50 (or 49.5), 50.05 (or 50.0) [1] consistent significant figures (3 or 4) [1] (b) clear explanation/diagram [1] (c) correct method [1] value 49.7 (ignore a fourth significant figure) and allow ecf from (ii) [1] (d) d = 1.8 (cm), t = 1.2 (cm) [1] V = 3.05 (cm3) (ecf) [1] ρ = 16.3 unit g/cm3, 2/3 significant figures (ecf) [1] [Total: 9]
More questions on Physical quantities and measurement techniques
Q2 · The IGCSE class is comparing the combined resistance of resistors in different circuit…
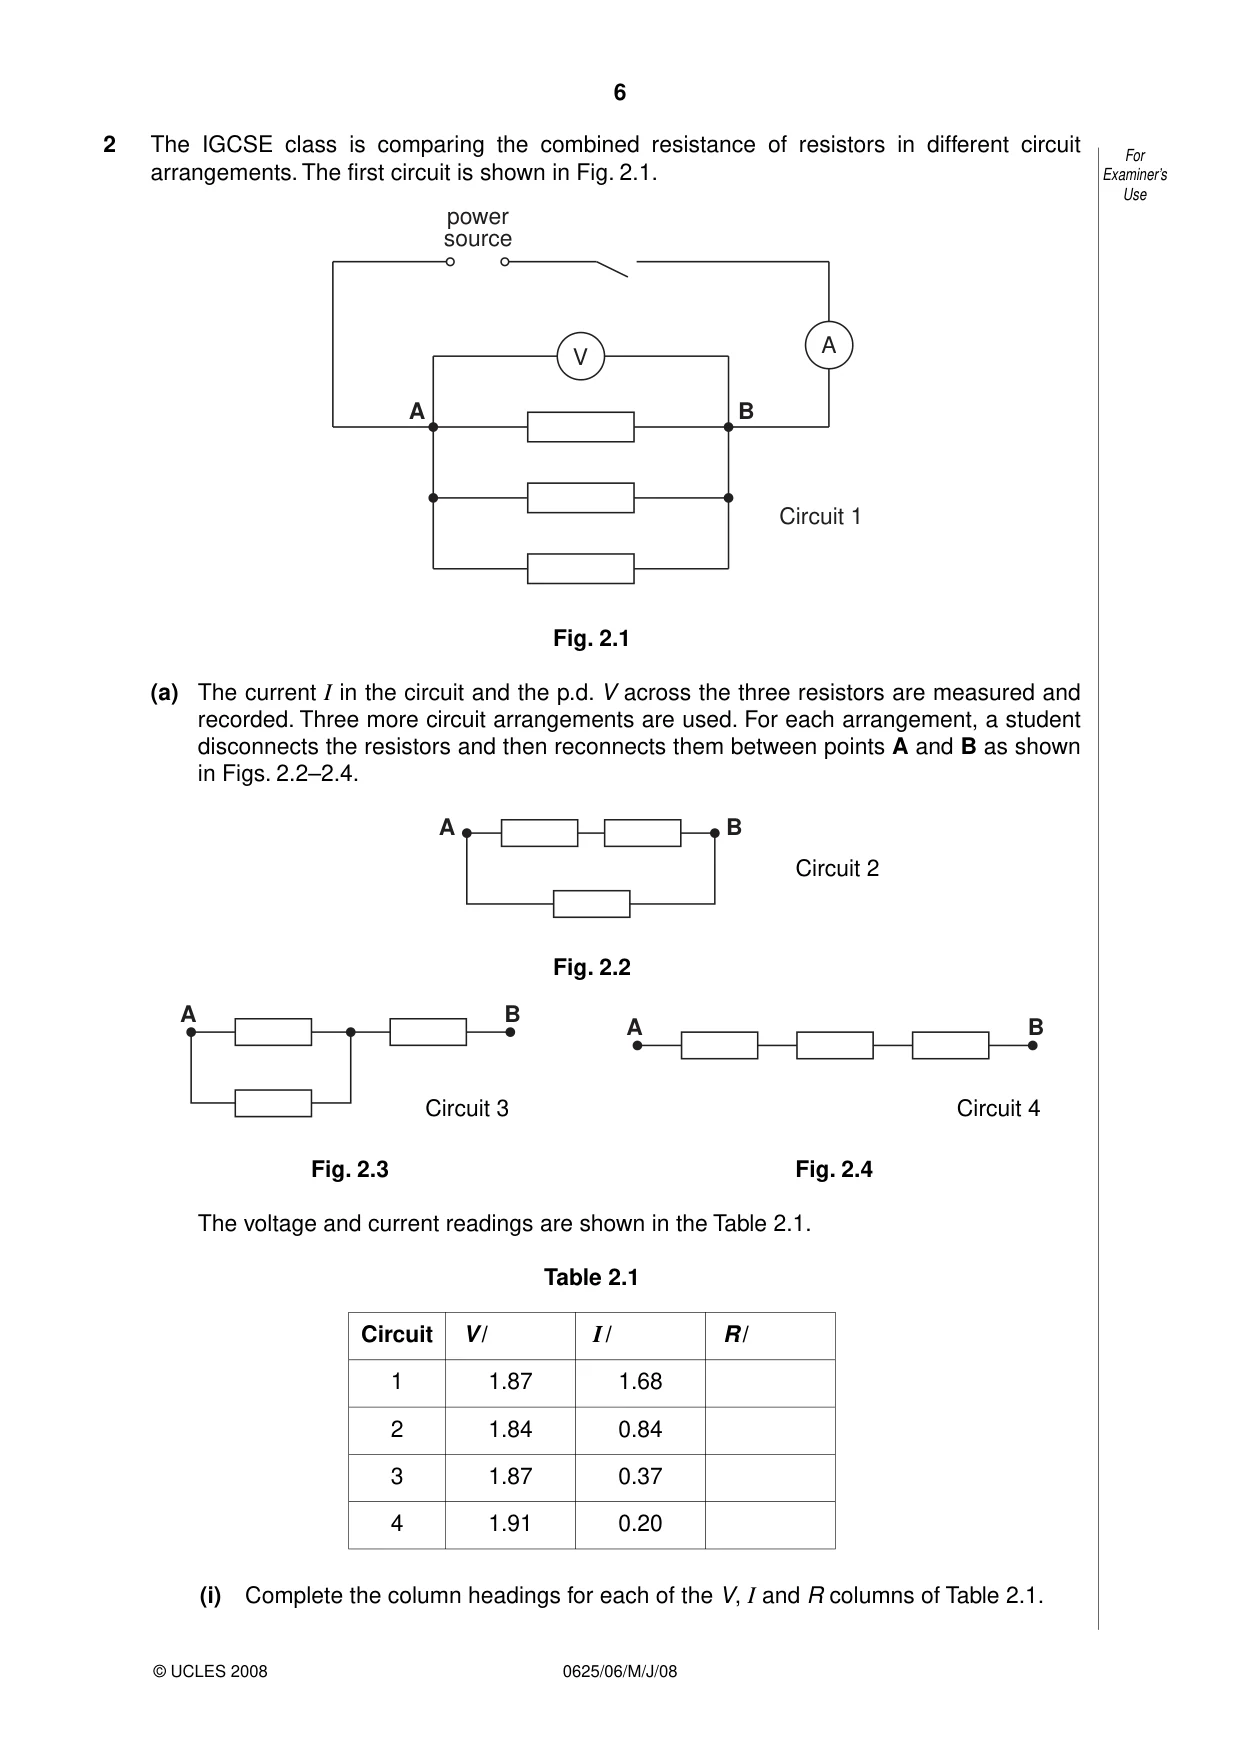
2 The IGCSE class is comparing the combined resistance of resistors in different circuit For arrangements. The first circuit is shown in Fig. 2.1. Examiner’s Use power source A V A B Circuit 1 Fig. 2.1 (a) The current I in the circuit and the p.d. V across the three resistors are measured and recorded. Three more circuit arrangements are used. For each arrangement, a student disconnects the resistors and then reconnects them between points A and B as shown in Figs. 2.2–2.4. A B Circuit 2 Fig. 2.2 A B A B Circuit 3 Circuit 4 Fig. 2.3 Fig. 2.4 The voltage and current readings are shown in the Table 2.1. Table 2.1 Circuit V / I / R / 1 1.87 1.68 2 1.84 0.84 3 1.87 0.37 4 1.91 0.20 (i) Complete the column headings for each of the V, I and R columns of Table 2.1. (ii) For each circuit, calculate the combined resistance R of the three resistors using For the equation Examiner’s Use V R = . I Record these values of R in Table 2.1. [3] (b) Theory suggests that, if all three resistors have the same resistance under all conditions, the combined resistance in circuit 1 will be one half of the combined resistance in circuit 2. (i) State whether, within the limits of experimental accuracy, your results support this theory. Justify your answer by reference to the results. statement ................................................................................................................. justification ................................................................................................................ .................................................................................................................................. (ii) Suggest one precaution you could take to ensure that the readings are as accurate as possible. .................................................................................................................................. ..............................................................................................................................[3] [Total: 6]
Mark scheme: 2 Table: (a) Units V, A, Ω (symbol/word) [1] R values 1.11, 2.19, 5.05, 9.55 [1] Consistent 2 or consistent 3 sig fig for R [1] (b) (i) Yes (if within 10%) No (if not) [M1] Circuit 1 and circuit 2 compared [A1] (ii) limit current (so temperature not increased) OR switch off between readings OR check for zero error OR Repeats OR Parallax error explained OR Tapping meter [1] [Total: 6]
Q3 · A student is investigating the effect of surface area exposed to the air on the rate of…
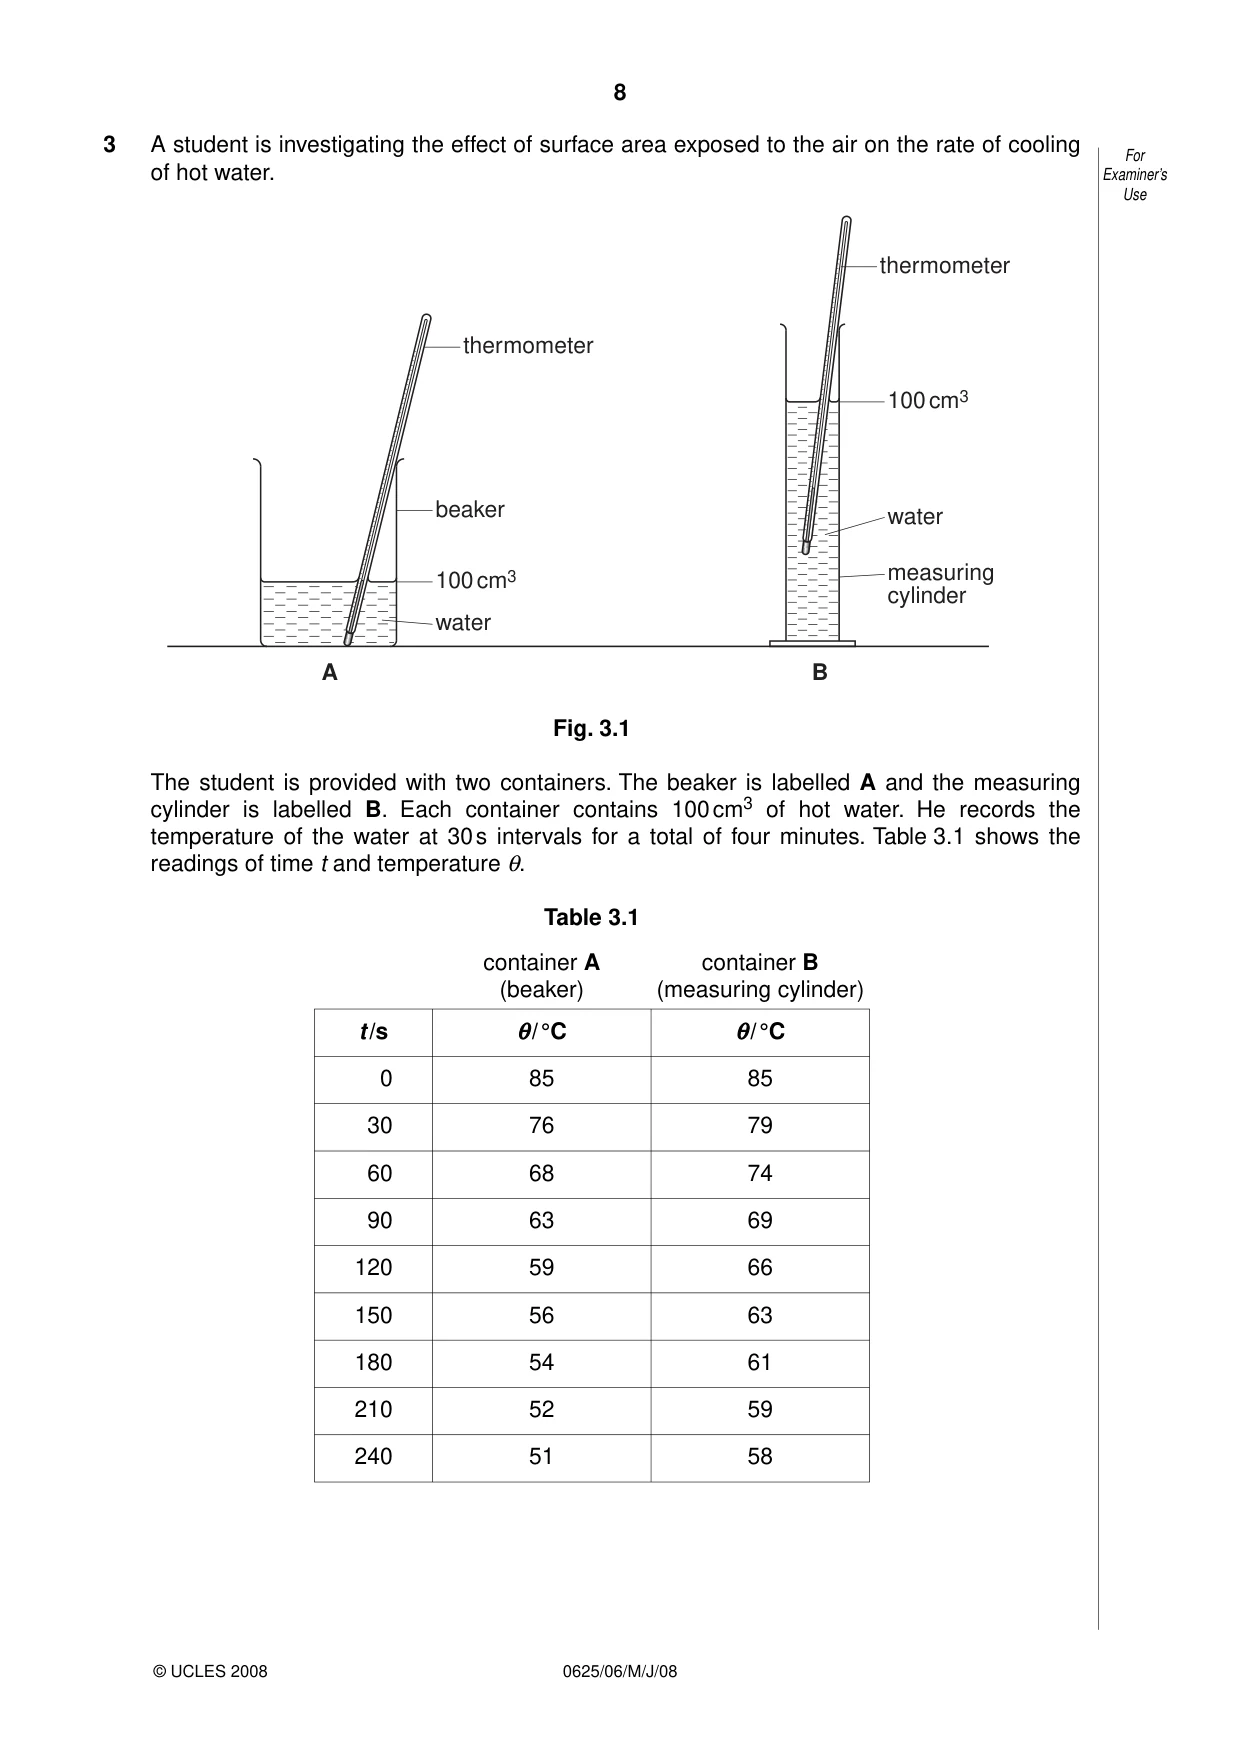
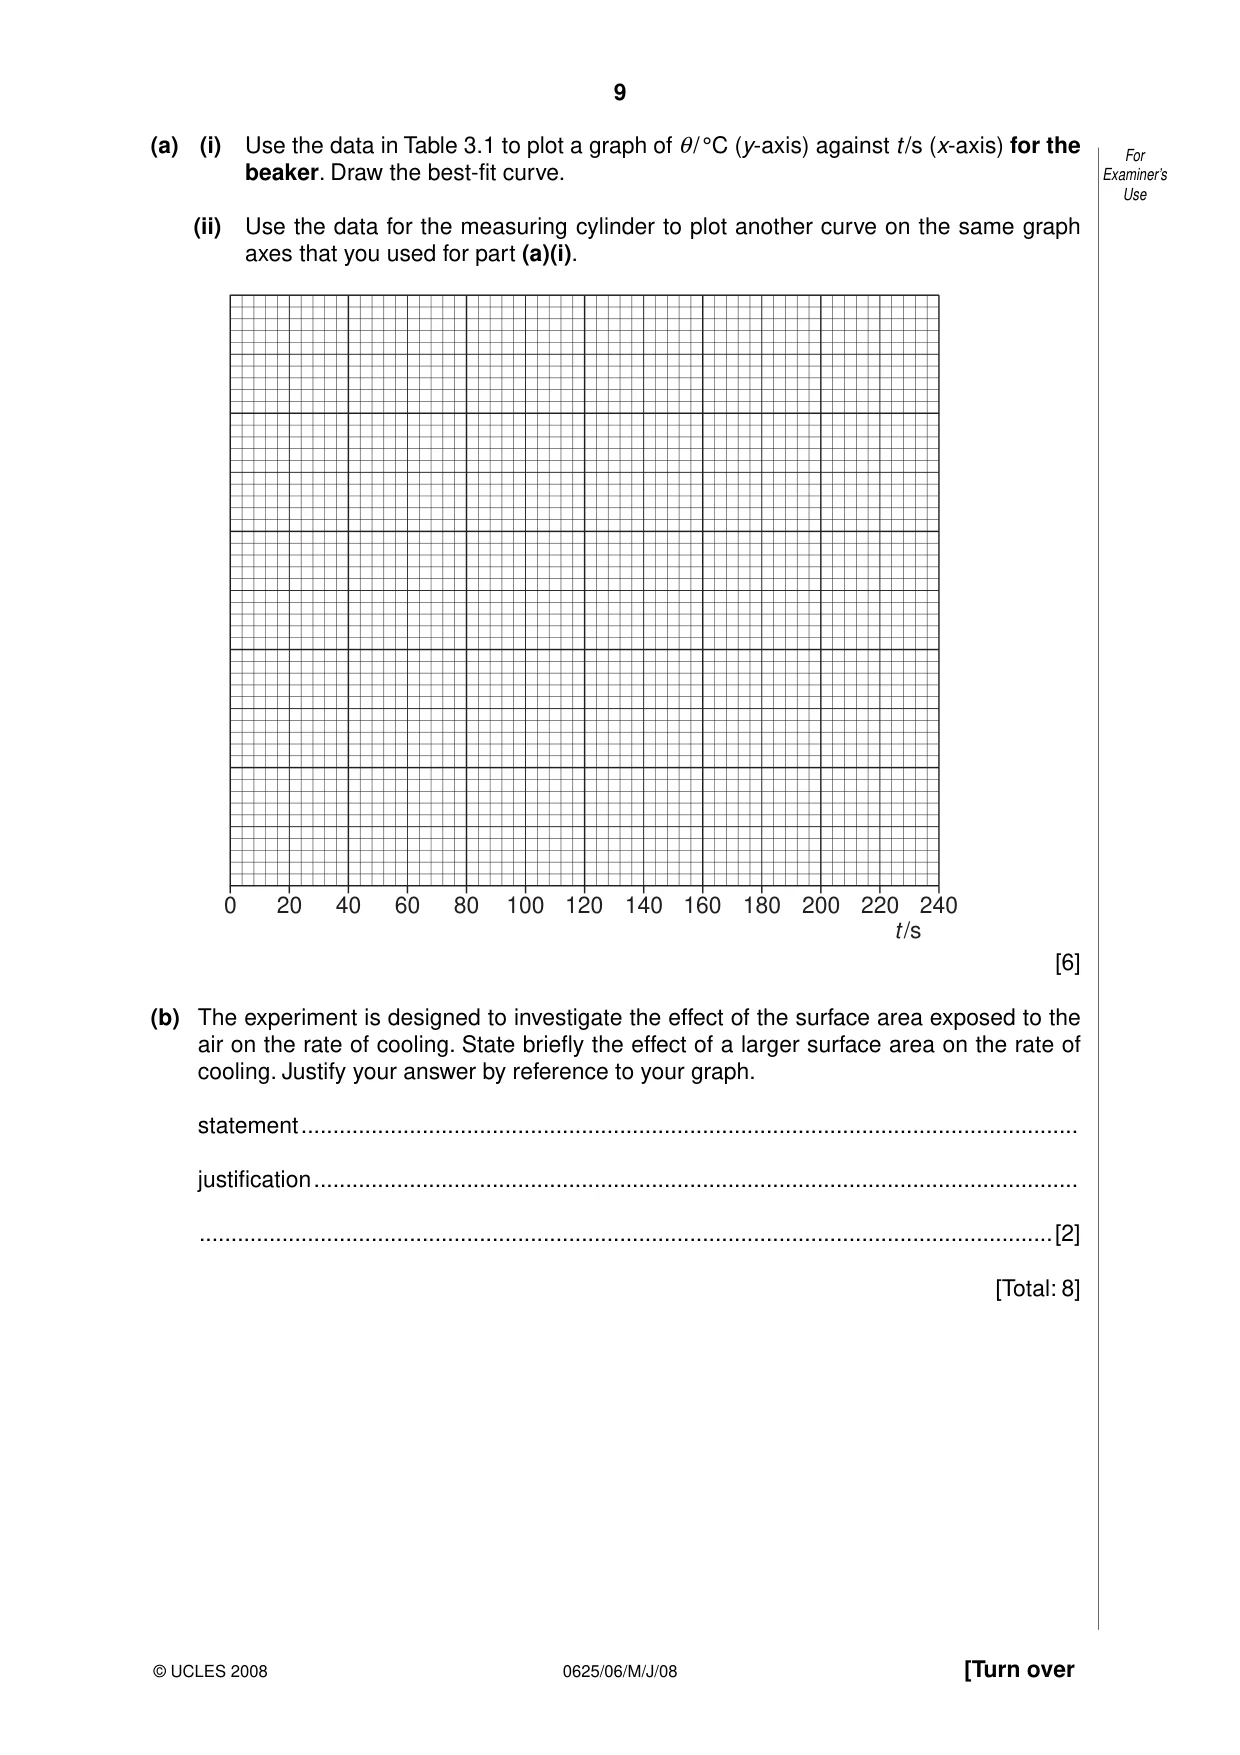
3 A student is investigating the effect of surface area exposed to the air on the rate of cooling For of hot water. Examiner’s Use thermometer thermometer 100 cm3 beaker water measuring 100 cm3 cylinder water A B Fig. 3.1 The student is provided with two containers. The beaker is labelled A and the measuring cylinder is labelled B. Each container contains 100 cm3 of hot water. He records the temperature of the water at 30 s intervals for a total of four minutes. Table 3.1 shows the readings of time t and temperature θ. Table 3.1 container A container B (beaker) (measuring cylinder) t /s θ/ °C θ/ °C 0 85 85 30 76 79 60 68 74 90 63 69 120 59 66 150 56 63 180 54 61 210 52 59 240 51 58 (a) (i) Use the data in Table 3.1 to plot a graph of θ/ °C (y-axis) against t /s (x-axis) for the For beaker. Draw the best-fit curve. Examiner’s Use (ii) Use the data for the measuring cylinder to plot another curve on the same graph axes that you used for part (a)(i). 0 20 40 60 80 100 120 140 160 180 200 220 240 t /s [6] (b) The experiment is designed to investigate the effect of the surface area exposed to the air on the rate of cooling. State briefly the effect of a larger surface area on the rate of cooling. Justify your answer by reference to your graph. statement .......................................................................................................................... justification ........................................................................................................................ ......................................................................................................................................[2] [Total: 8]
Mark scheme: 3 Graph: Temperature axis labelled θ/°C [1] Suitable scales (plots occupy at least ½ grid) [1] Plots correct to nearest ½ square (–1 each error) [2] Lines well judged curves [1] Lines thin [1] (b) Statement: larger surface area increases rate of cooling [1] Justification: Correct reference to gradients of lines or readings [1] [Total: 8] IGCSE – May/June 2008 0625 06
Q4 · A student is determining a quantity called the refractive index of the material of a…
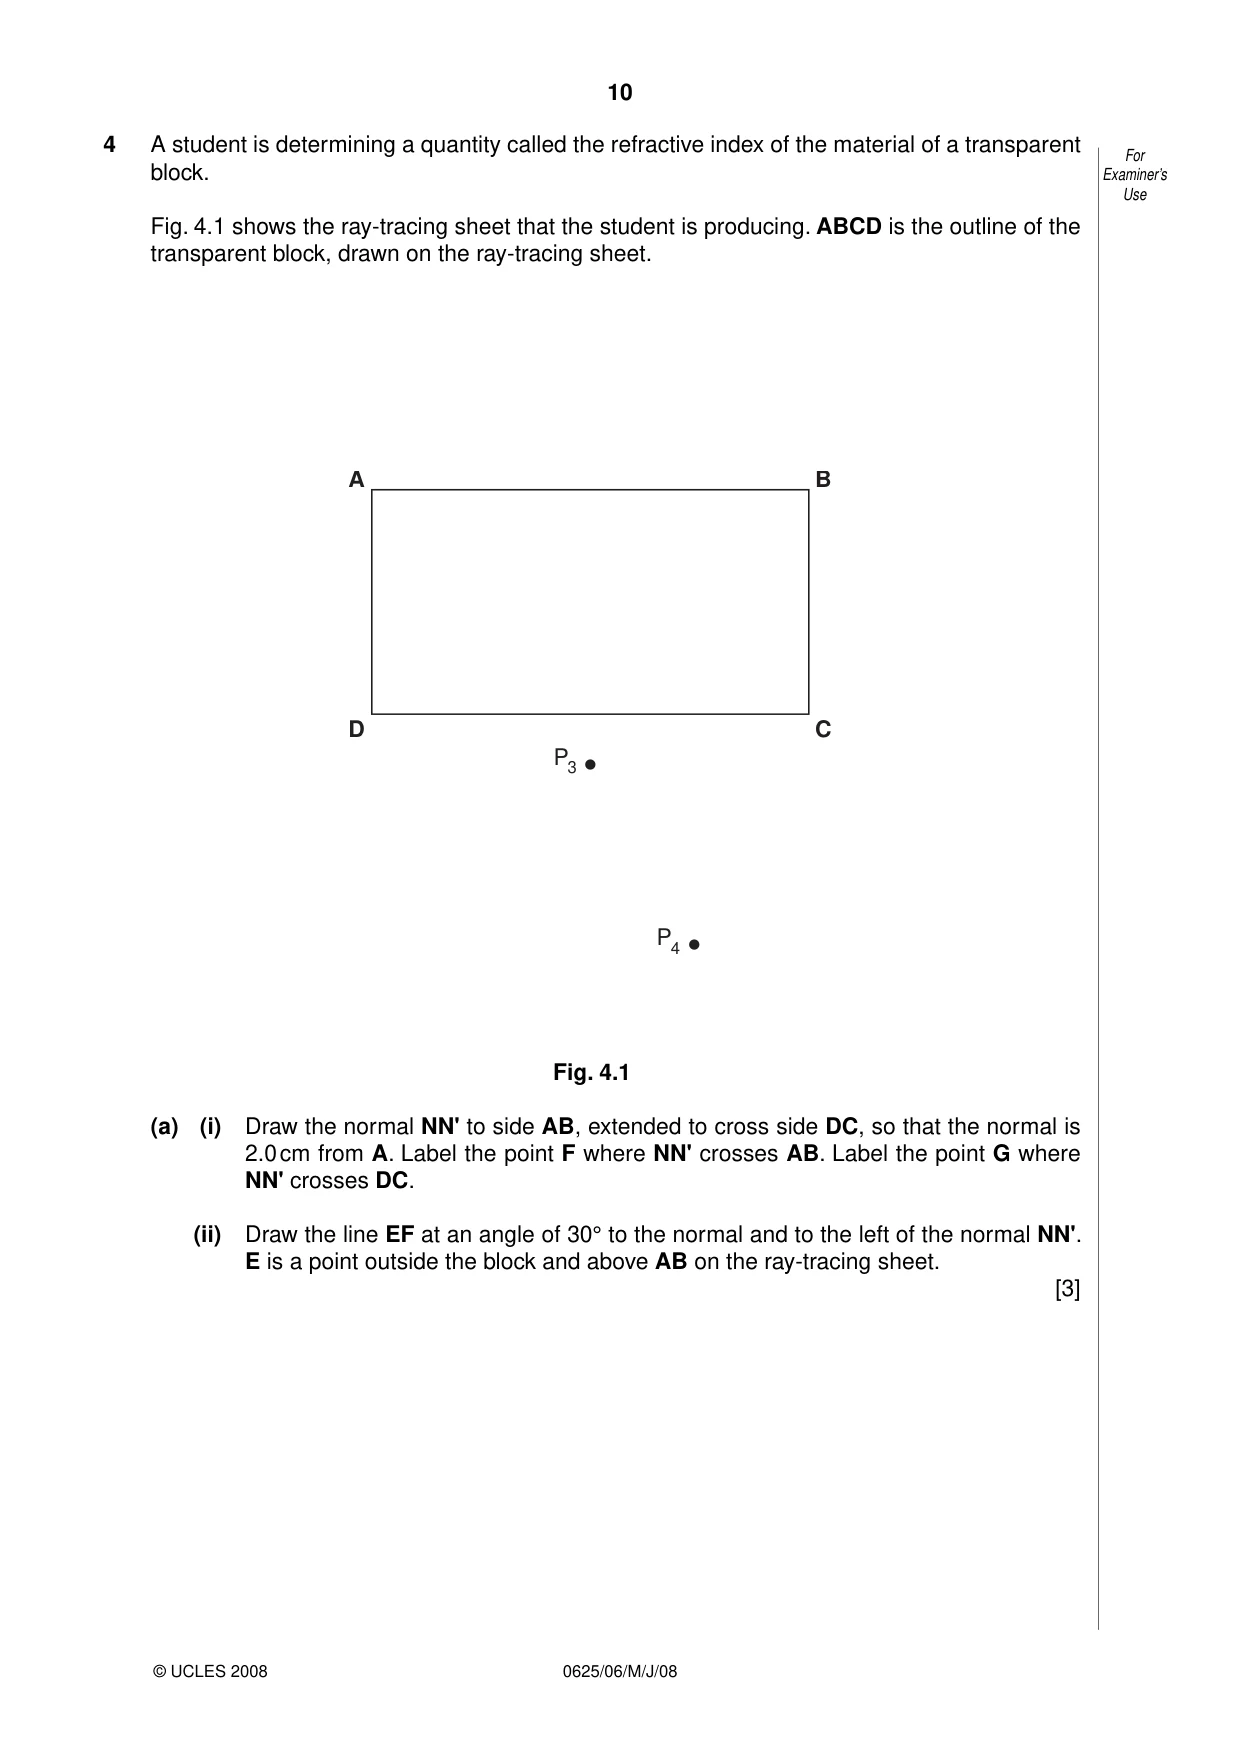
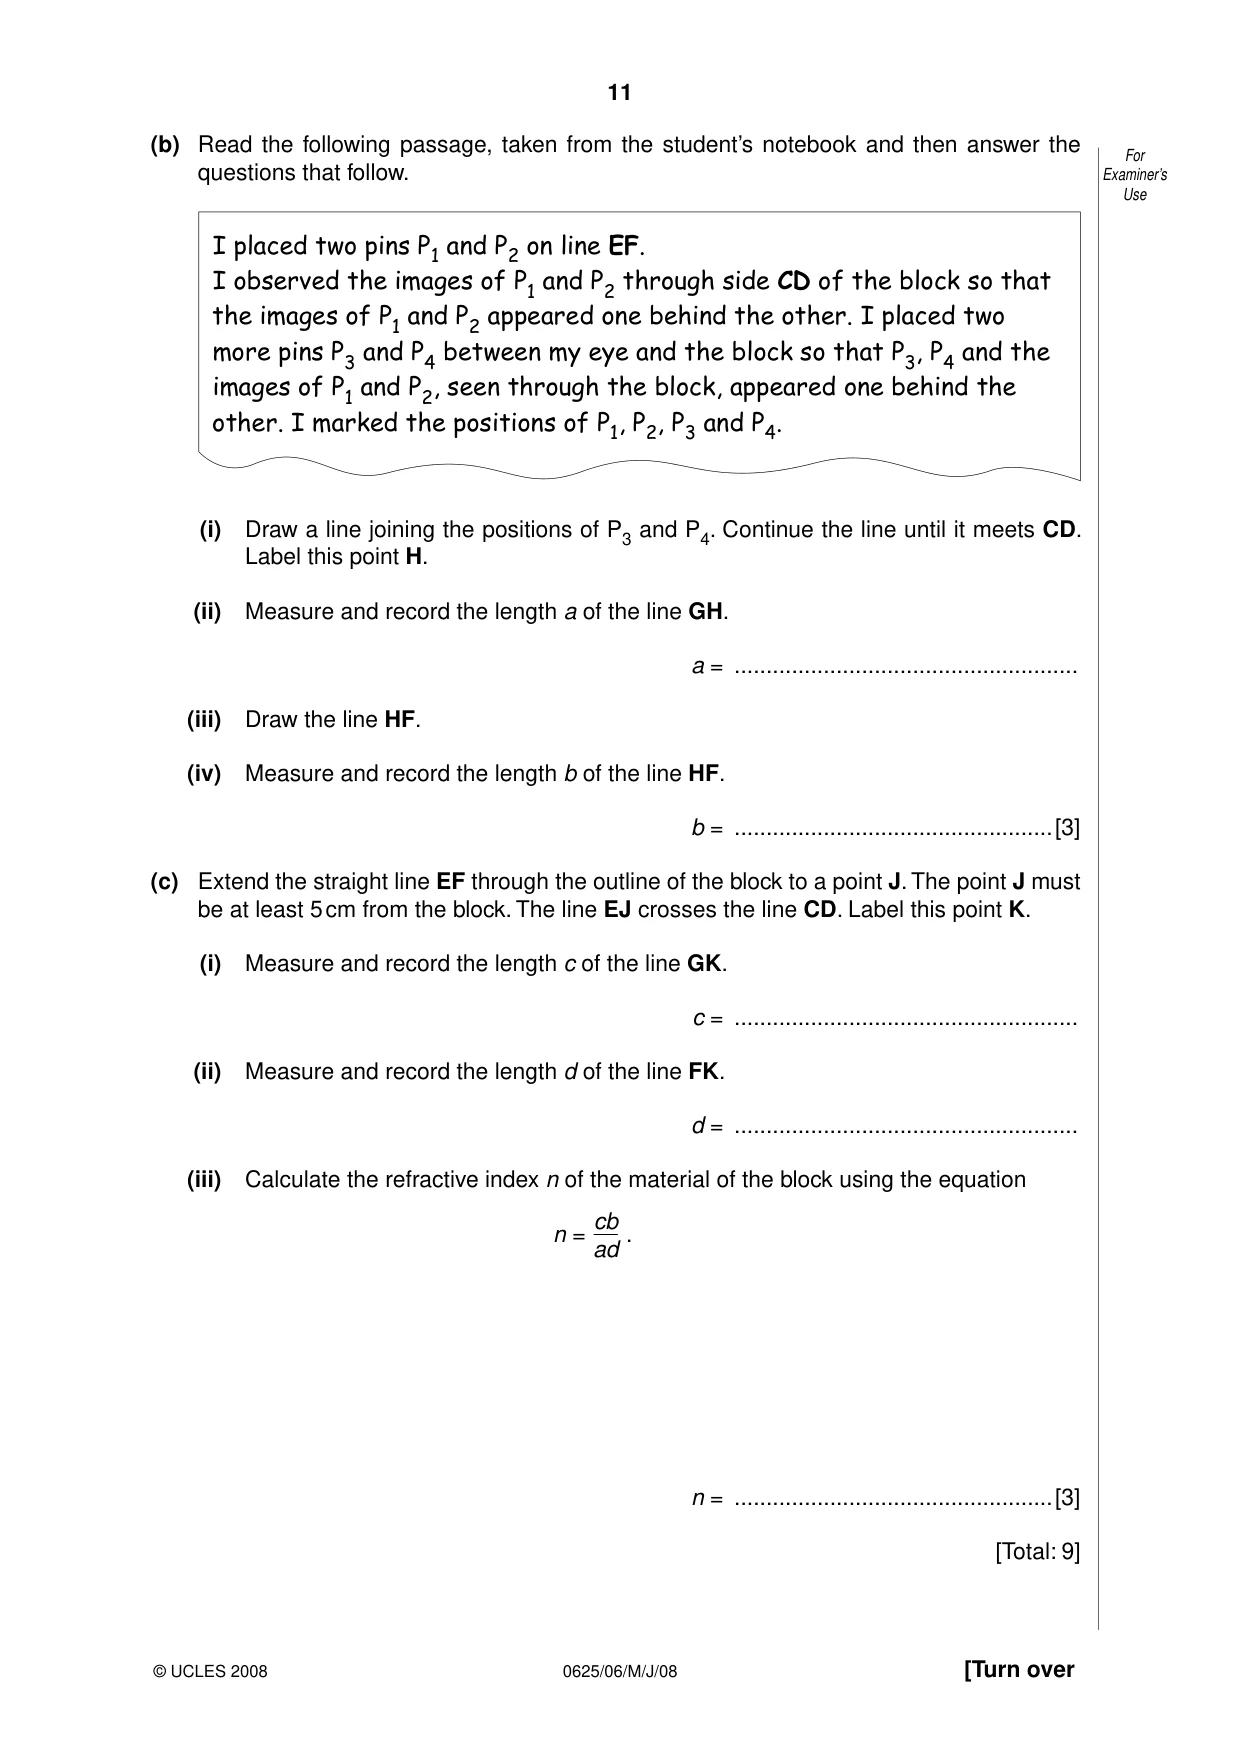
4 A student is determining a quantity called the refractive index of the material of a transparent For block. Examiner’s Use Fig. 4.1 shows the ray-tracing sheet that the student is producing. ABCD is the outline of the transparent block, drawn on the ray-tracing sheet. A B D C P3 P4 Fig. 4.1 (a) (i) Draw the normal NN' to side AB, extended to cross side DC, so that the normal is 2.0 cm from A. Label the point F where NN' crosses AB. Label the point G where NN' crosses DC. (ii) Draw the line EF at an angle of 30° to the normal and to the left of the normal NN'. E is a point outside the block and above AB on the ray-tracing sheet. [3] (b) Read the following passage, taken from the student’s notebook and then answer the For questions that follow. Examiner’s Use I placed two pins P1 and P2 on line EF. I observed the images of P1 and P2 through side CD of the block so that the images of P1 and P2 appeared one behind the other. I placed two more pins P3 and P4 between my eye and the block so that P3, P4 and the images of P1 and P2, seen through the block, appeared one behind the other. I marked the positions of P1, P2, P3 and P4. (i) Draw a line joining the positions of P3 and P4. Continue the line until it meets CD. Label this point H. (ii) Measure and record the length a of the line GH. a = ...................................................... (iii) Draw the line HF. (iv) Measure and record the length b of the line HF. b = ..................................................[3] (c) Extend the straight line EF through the outline of the block to a point J. The point J must be at least 5 cm from the block. The line EJ crosses the line CD. Label this point K. (i) Measure and record the length c of the line GK. c = ...................................................... (ii) Measure and record the length d of the line FK. d = ...................................................... (iii) Calculate the refractive index n of the material of the block using the equation cb n = . ad n = ..................................................[3] [Total: 9]
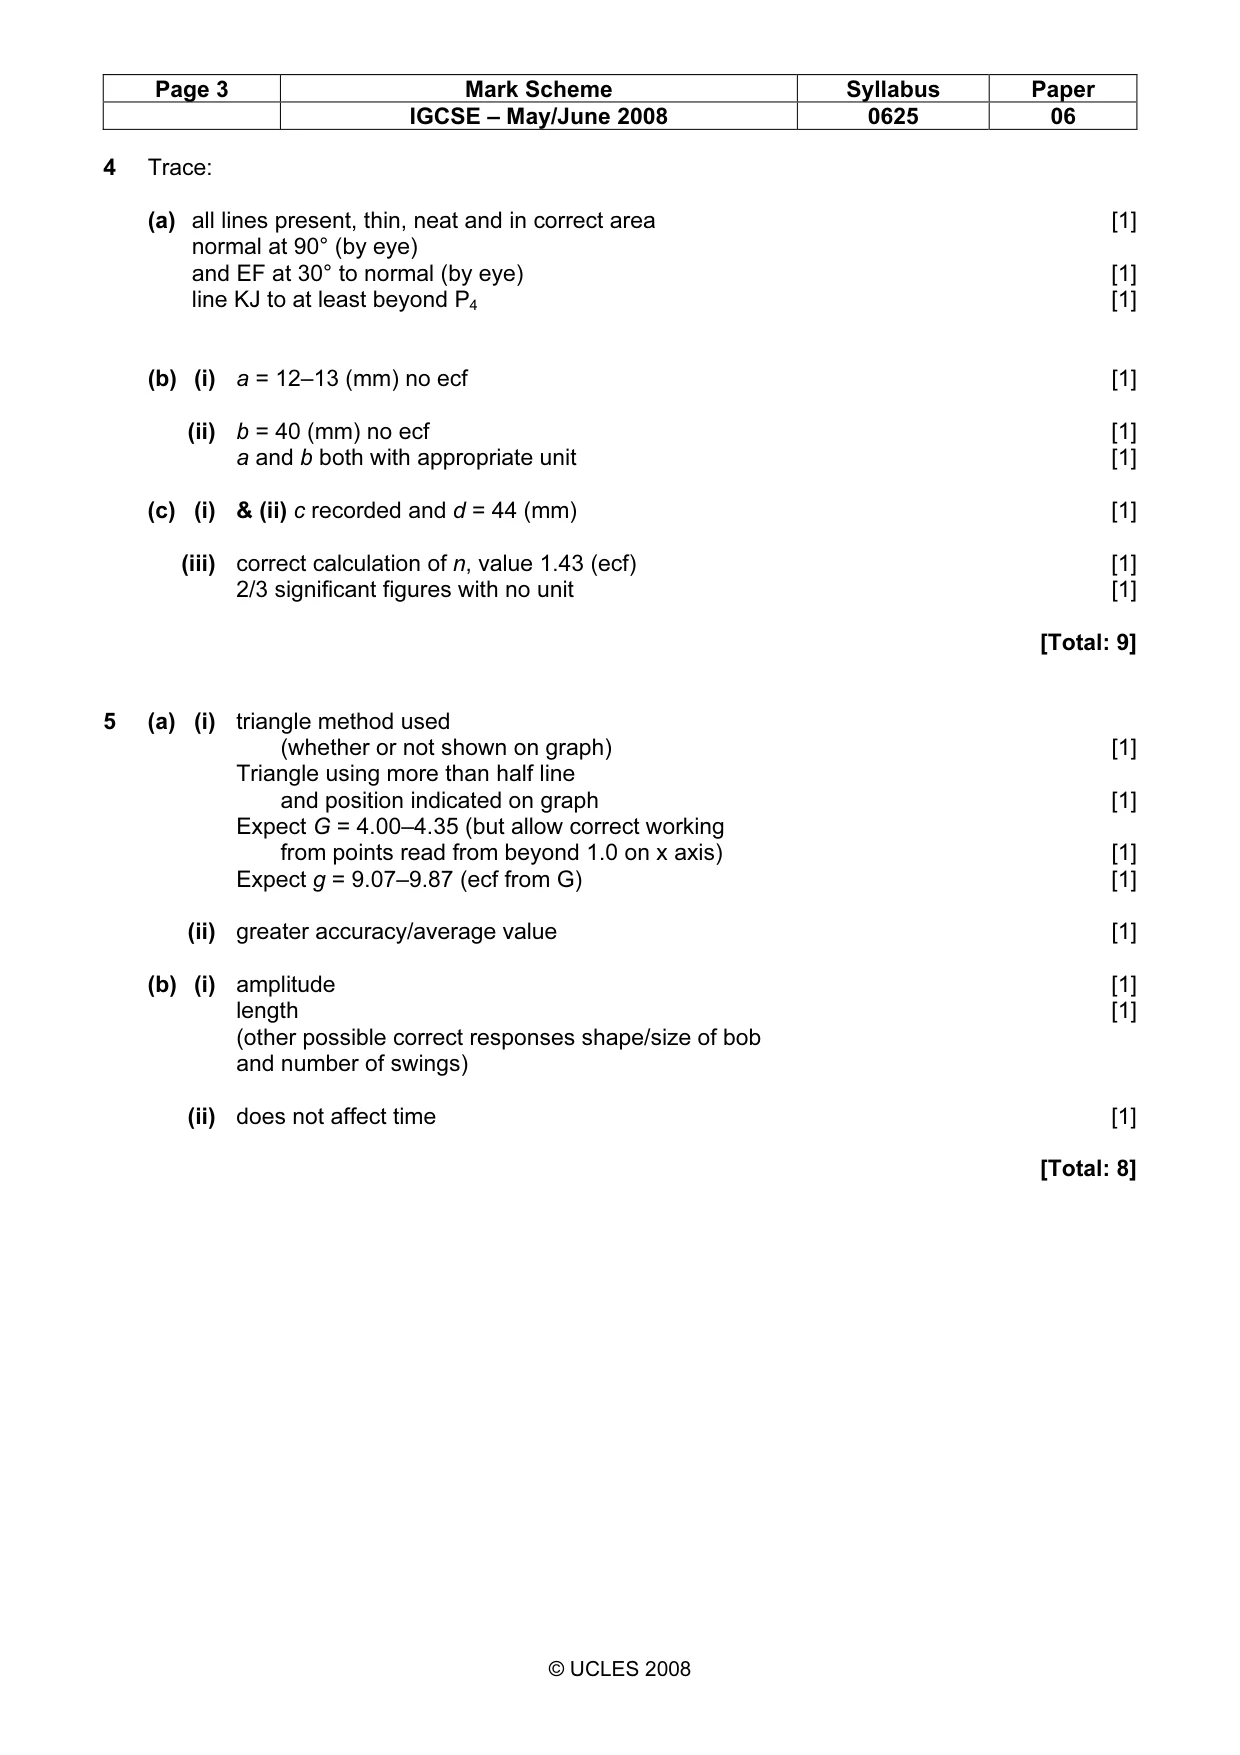
Mark scheme: 4 Trace: (a) all lines present, thin, neat and in correct area [1] normal at 90° (by eye) and EF at 30° to normal (by eye) [1] line KJ to at least beyond P4 [1] (b) (i) a = 12–13 (mm) no ecf [1] (ii) b = 40 (mm) no ecf [1] a and b both with appropriate unit [1] (c) (i) & (ii) c recorded and d = 44 (mm) [1] (iii) correct calculation of n, value 1.43 (ecf) [1] 2/3 significant figures with no unit [1] [Total: 9]
Q5 · An IGCSE student has carried out a timing experiment using a simple pendulum
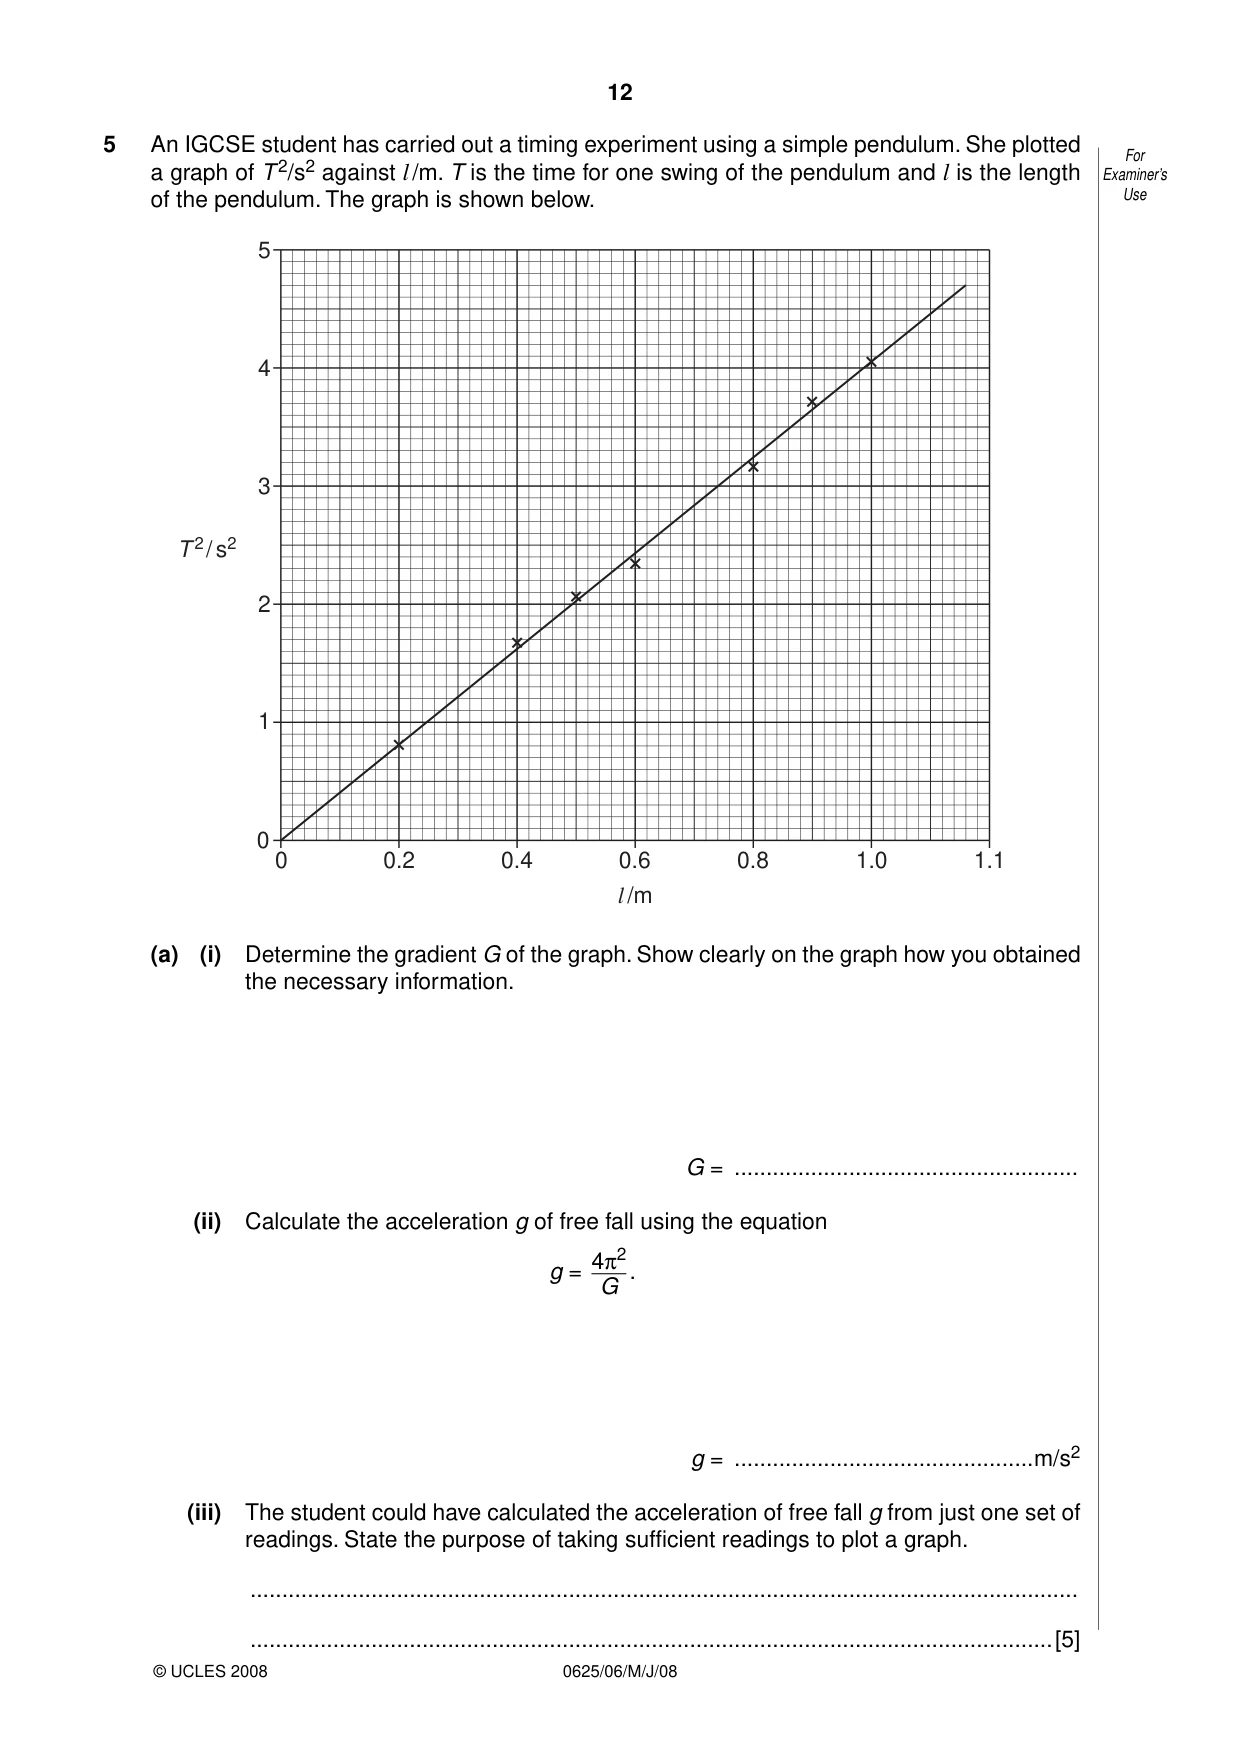
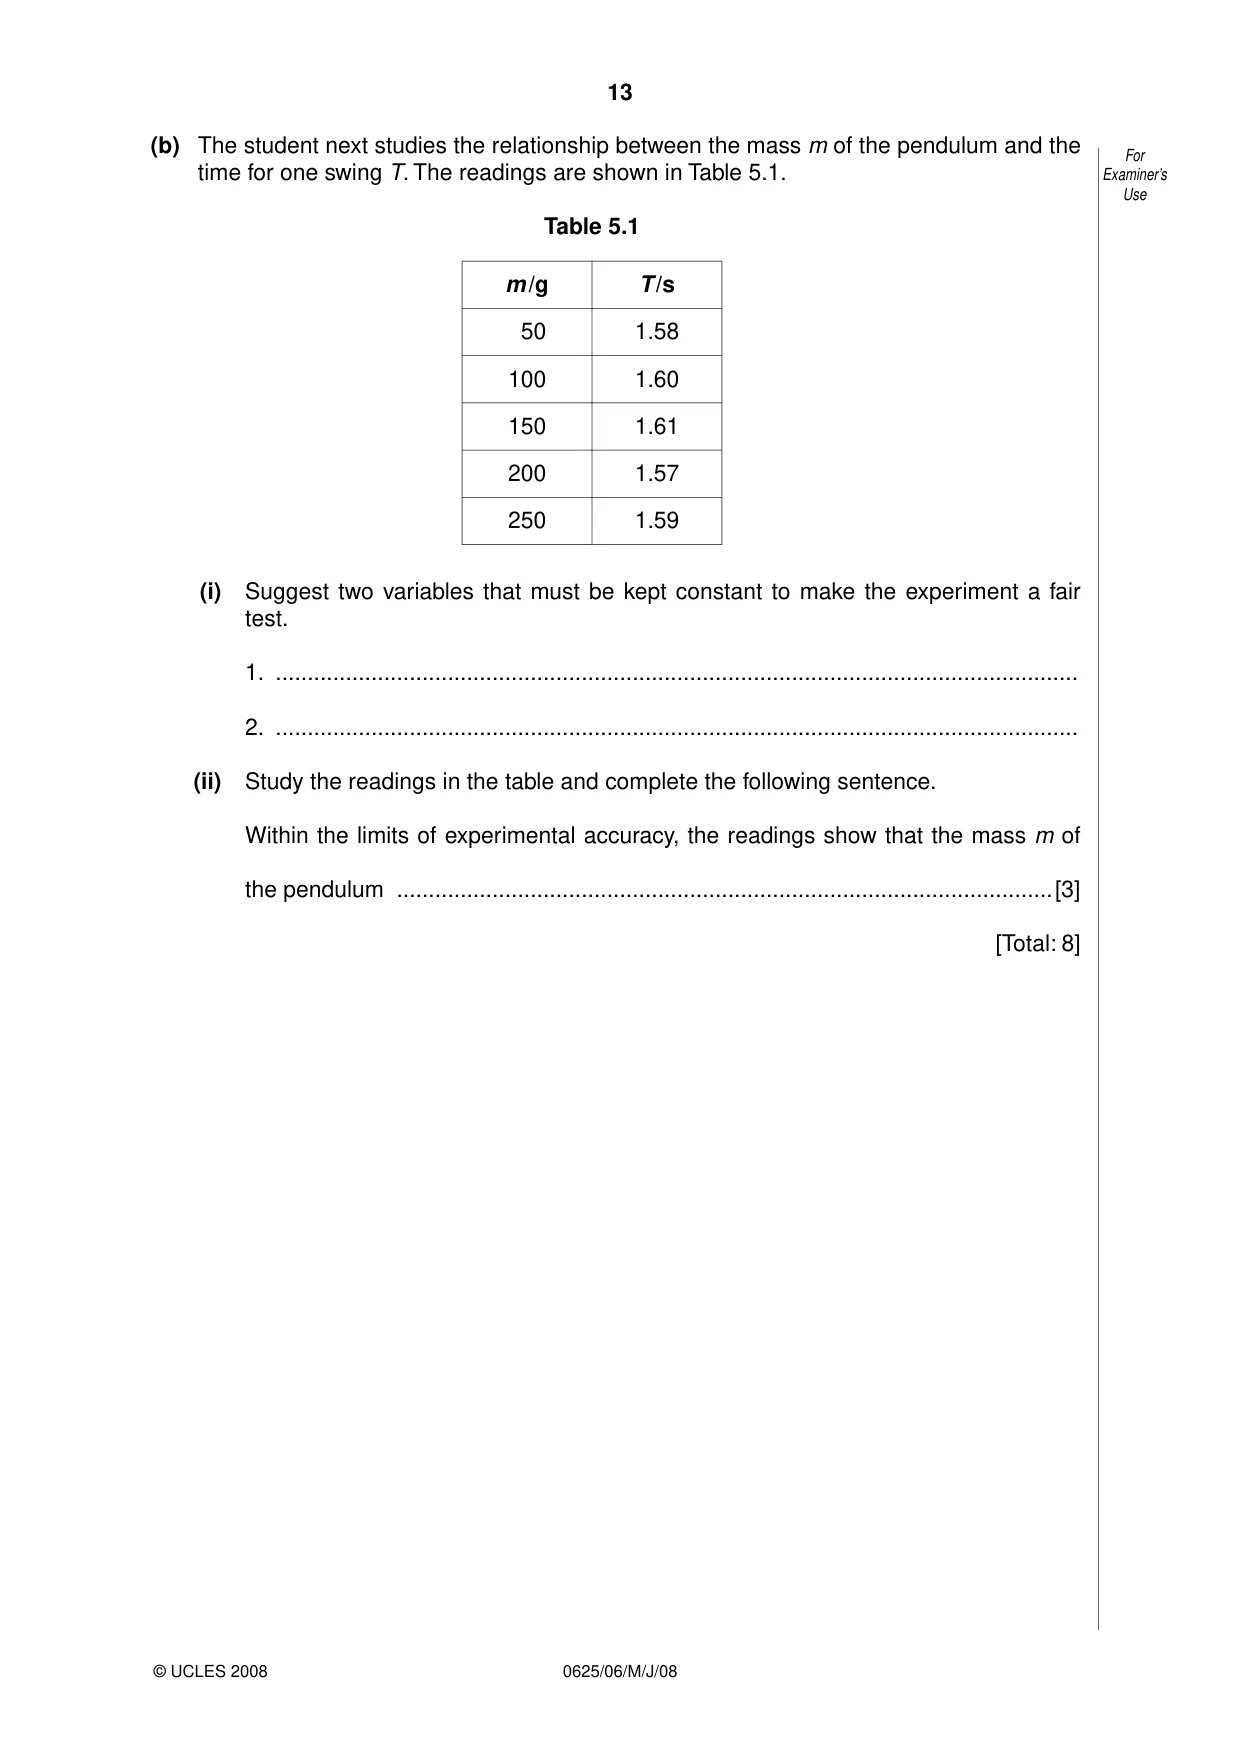
5 An IGCSE student has carried out a timing experiment using a simple pendulum. She plotted For a graph of T 2/s2 against l /m. T is the time for one swing of the pendulum and l is the length Examiner’s of the pendulum. The graph is shown below. Use 5 4 3 T 2 / s2 2 1 0 0 0.2 0.4 0.6 0.8 1.0 1.1 l /m (a) (i) Determine the gradient G of the graph. Show clearly on the graph how you obtained the necessary information. G = ...................................................... (ii) Calculate the acceleration g of free fall using the equation 4π2 g = . G g = ...............................................m/s2 (iii) The student could have calculated the acceleration of free fall g from just one set of readings. State the purpose of taking sufficient readings to plot a graph. .................................................................................................................................. ..............................................................................................................................[5] (b) The student next studies the relationship between the mass m of the pendulum and the For time for one swing T. The readings are shown in Table 5.1. Examiner’s Use Table 5.1 m /g T /s 50 1.58 100 1.60 150 1.61 200 1.57 250 1.59 (i) Suggest two variables that must be kept constant to make the experiment a fair test. 1. .............................................................................................................................. 2. .............................................................................................................................. (ii) Study the readings in the table and complete the following sentence. Within the limits of experimental accuracy, the readings show that the mass m of the pendulum .......................................................................................................[3] [Total: 8]
Mark scheme: 5 (a) (i) triangle method used (whether or not shown on graph) [1] Triangle using more than half line and position indicated on graph [1] Expect G = 4.00–4.35 (but allow correct working from points read from beyond 1.0 on x axis) [1] Expect g = 9.07–9.87 (ecf from G) [1] (ii) greater accuracy/average value [1] (b) (i) amplitude [1] length [1] (other possible correct responses shape/size of bob and number of swings) (ii) does not affect time [1] [Total: 8]
What was in this paper
The subtopics covered by these 5 questions, and how many questions each got. Open one in a new tab to see every Cambridge question on it.
What you needed in this session
Cambridge’s own grade thresholds for 2008 May/June, Paper 6 · Variant 1. A higher threshold means an easier paper — the bar moves with how the cohort did.