Cambridge IGCSE Physics 0625 — 2007 May/June Paper 6 · Variant 1
0625/61/M/J/07 · 5 questions · 40 marks · ≈45 min
The question paper and its mark scheme, free to read here and free to download. This is Cambridge’s own paper, exactly as it was sat.
Question paper12 pages

Mark scheme4 pages
Answers below. Sit the paper first if you are practising.
Questions as text
Q1 · The IGCSE class is investigating the temperature changes that occur when hot and cold…
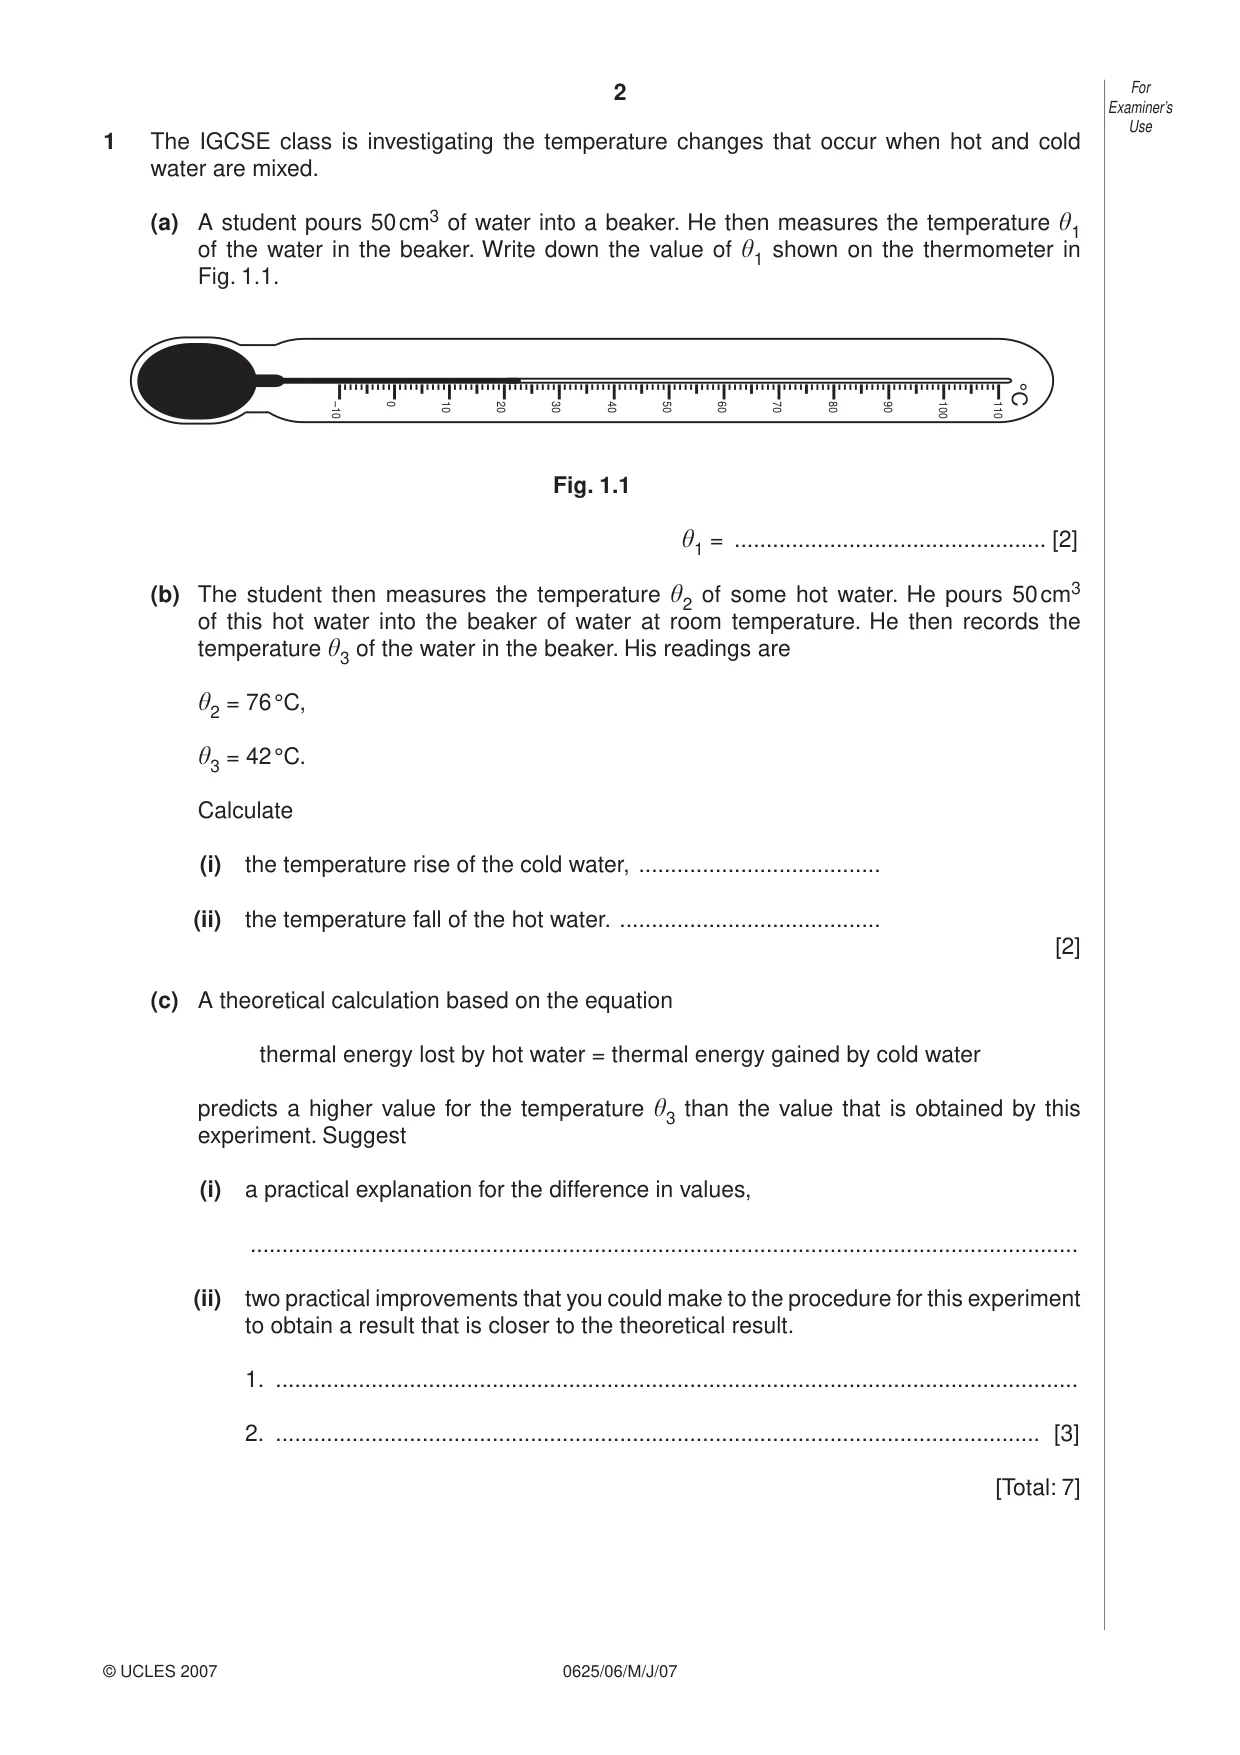
1 The IGCSE class is investigating the temperature changes that occur when hot and cold water are mixed. (a) A student pours 50 cm3 of water into a beaker. He then measures the temperature 1 of the water in the beaker. Write down the value of shown on the thermometer in 1 Fig. 1.1. °C –10 0 10 20 30 40 50 60 70 80 90 100 110 Fig. 1.1 = ................................................. [2] 1 (b) The student then measures the temperature of some hot water. He pours 50 cm3 2 of this hot water into the beaker of water at room temperature. He then records the temperature of the water in the beaker. His readings are 3 = 76 °C, 2 = 42 °C. 3 Calculate (i) the temperature rise of the cold water, ...................................... (ii) the temperature fall of the hot water. ......................................... [2] (c) A theoretical calculation based on the equation thermal energy lost by hot water = thermal energy gained by cold water predicts a higher value for the temperature than the value that is obtained by this 3 experiment. Suggest (i) a practical explanation for the difference in values, .................................................................................................................................. (ii) two practical improvements that you could make to the procedure for this experiment to obtain a result that is closer to the theoretical result. 1. .............................................................................................................................. 2. ........................................................................................................................ [3] [Total: 7]
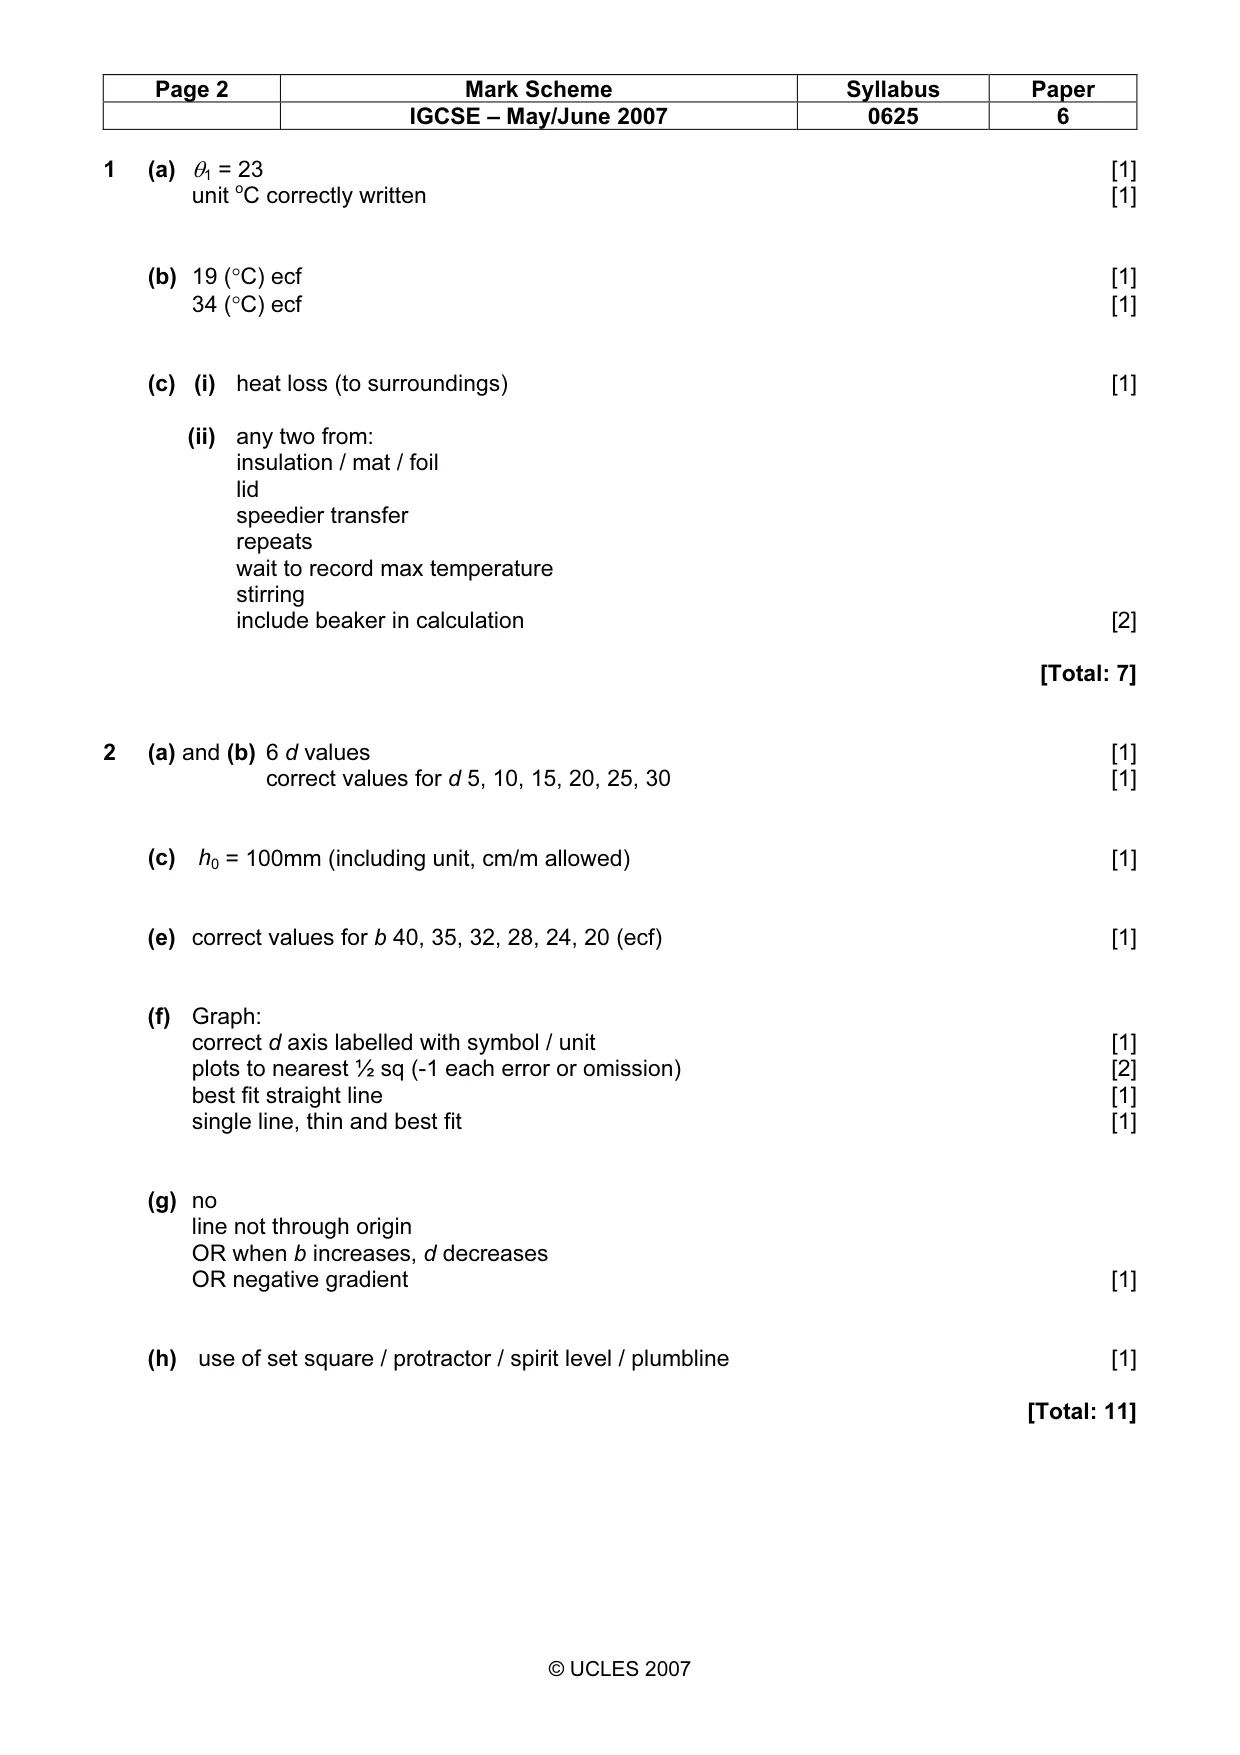
Mark scheme: 1 (a) θ1 = 23 [1] unit oC correctly written [1] (b) 19 (°C) ecf [1] 34 (°C) ecf [1] (c) (i) heat loss (to surroundings) [1] (ii) any two from: insulation / mat / foil lid speedier transfer repeats wait to record max temperature stirring include beaker in calculation [2] [Total: 7]
Q2 · A student is investigating the position of a sheet of card that is hanging from a pivot
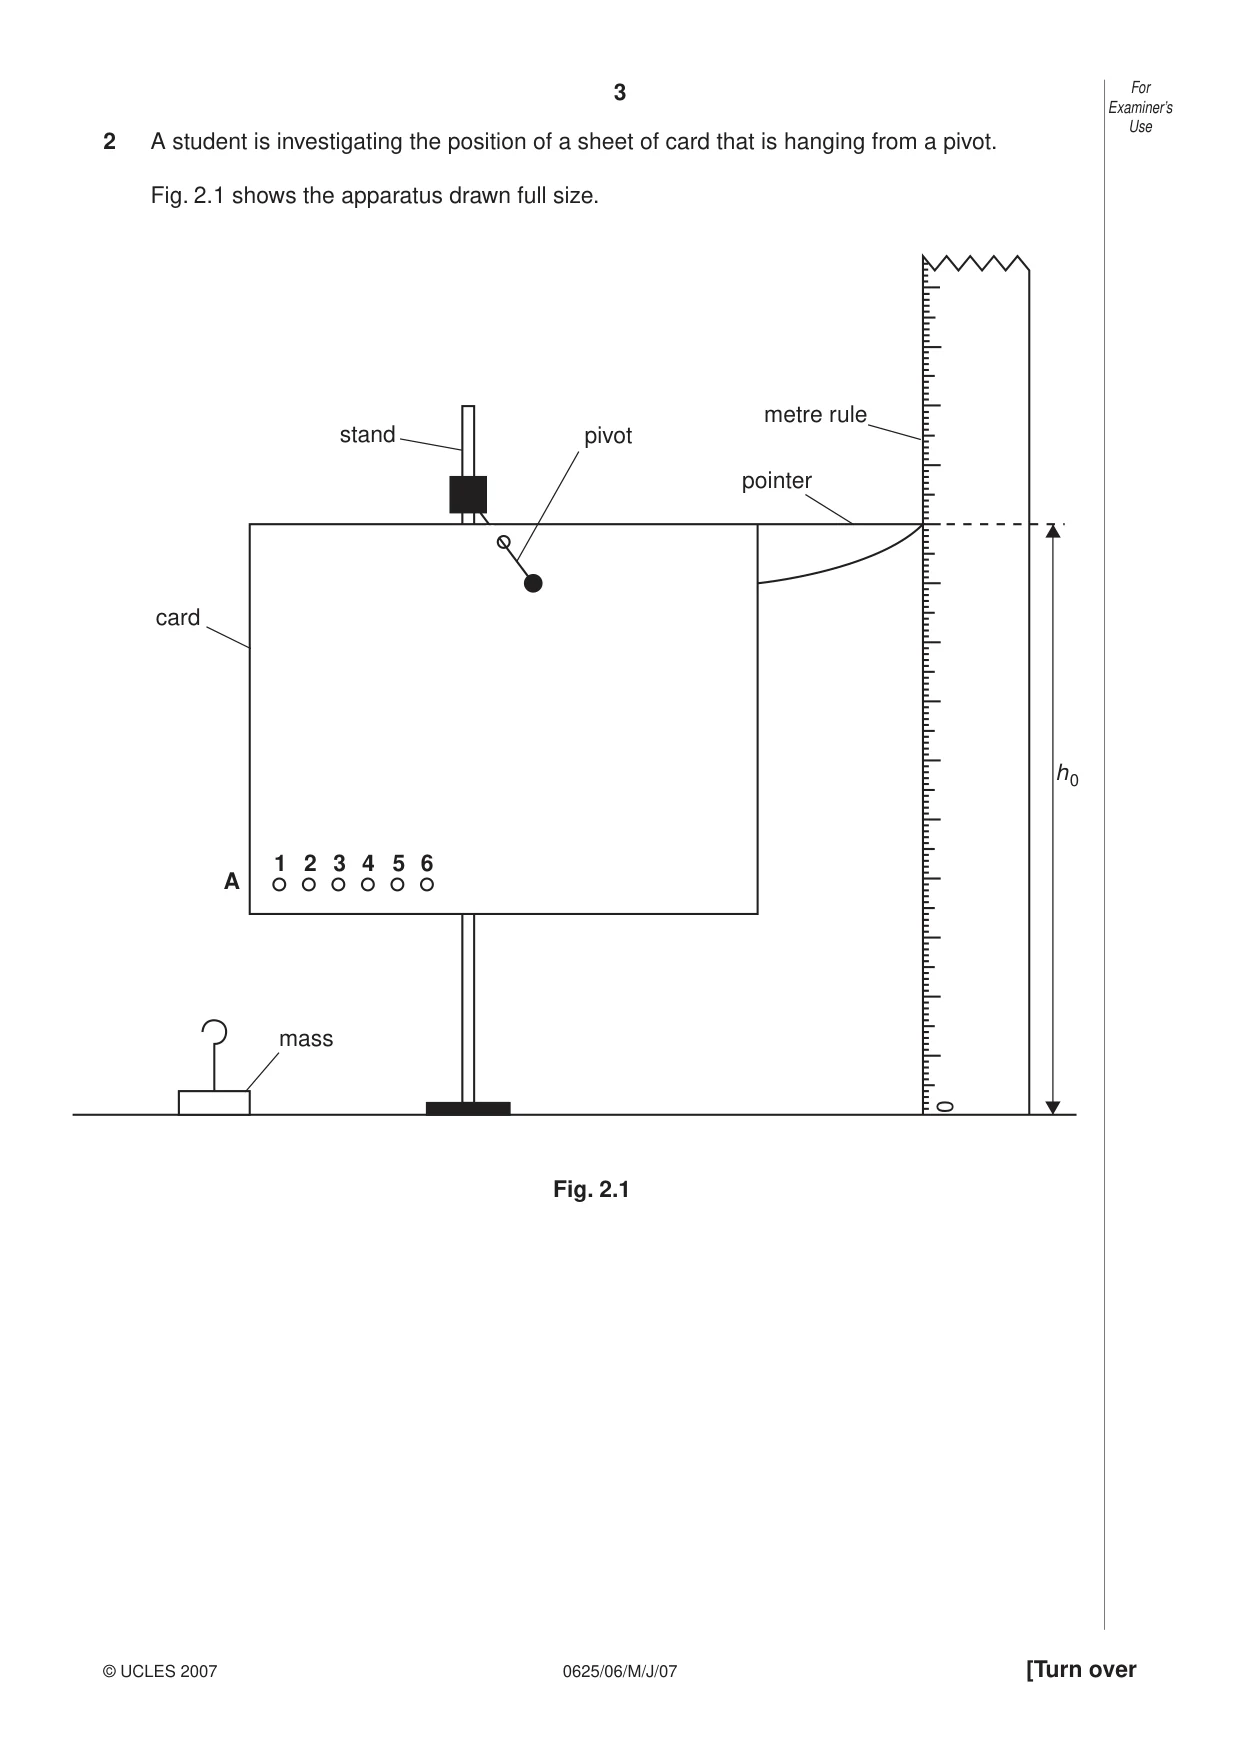
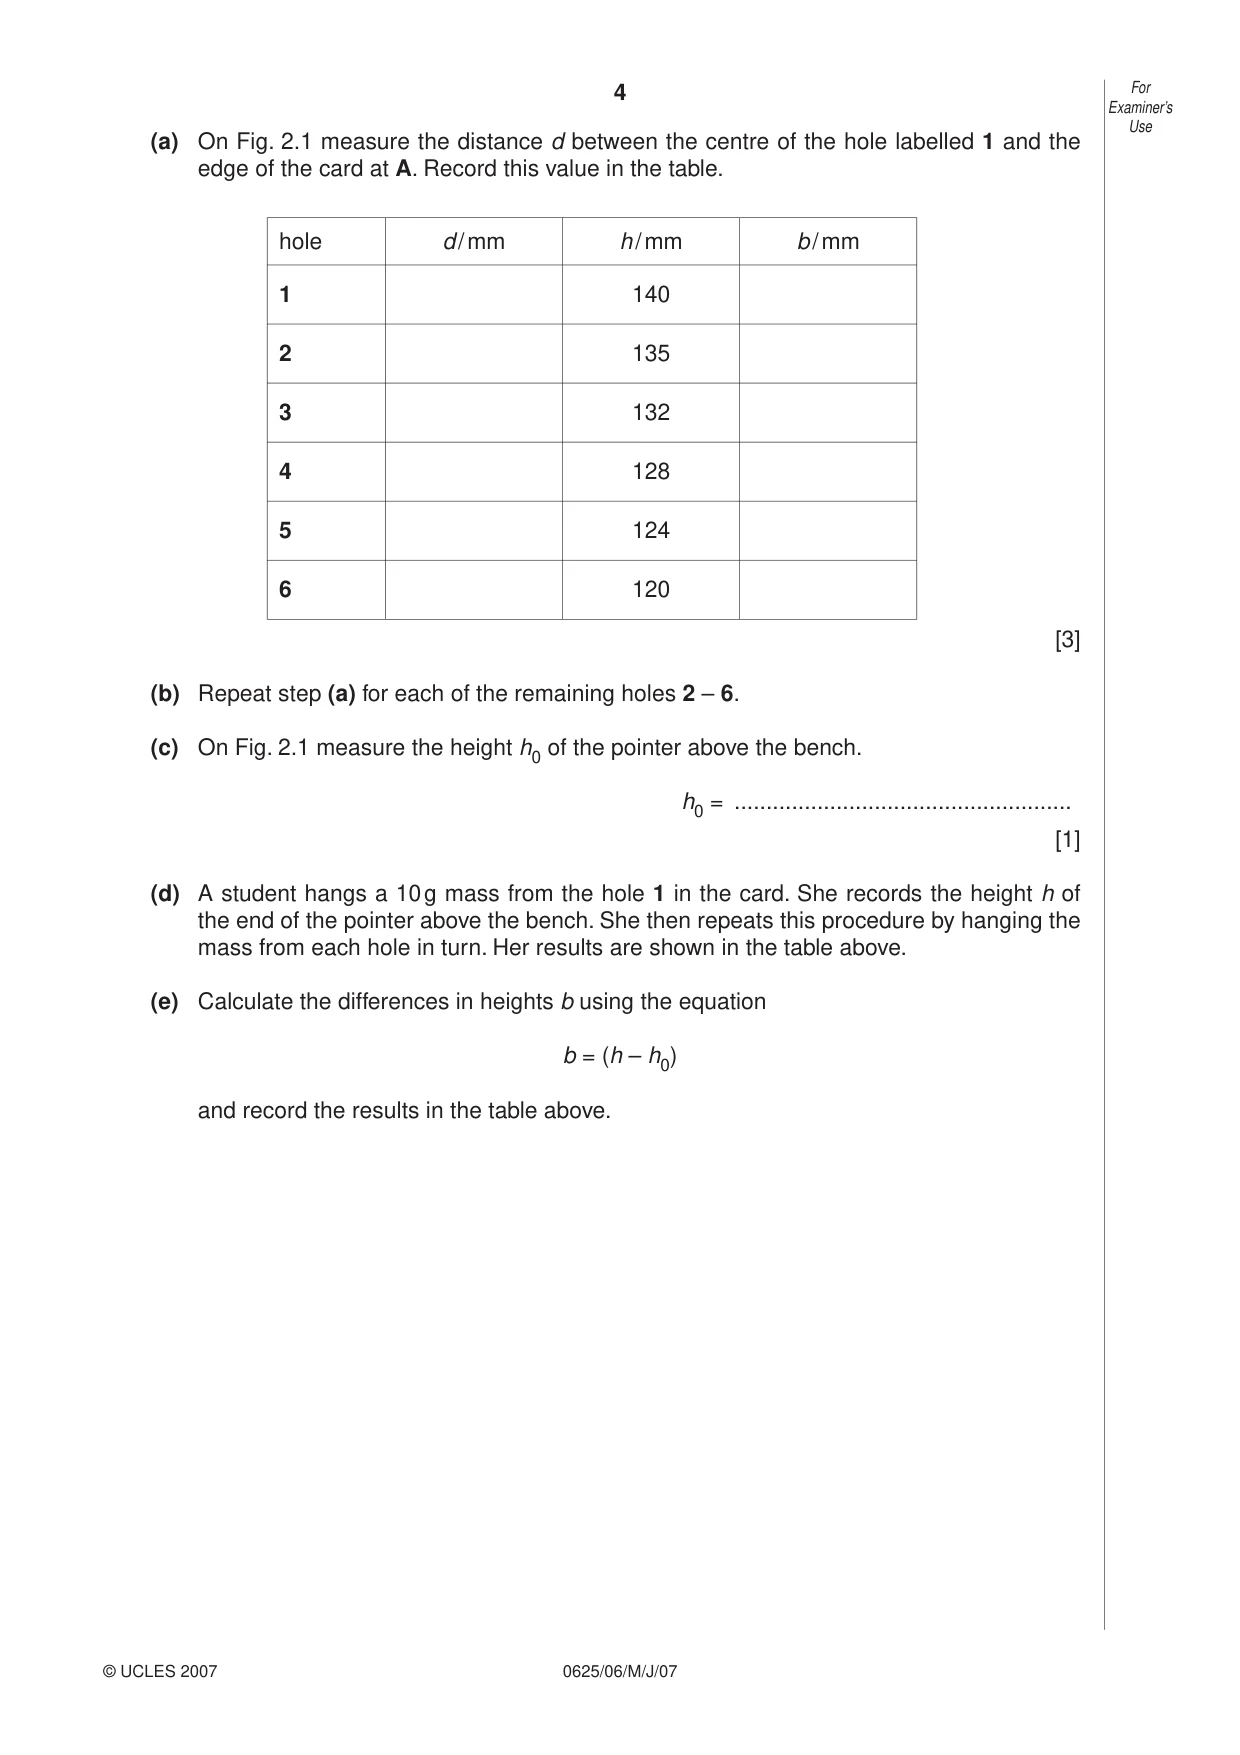
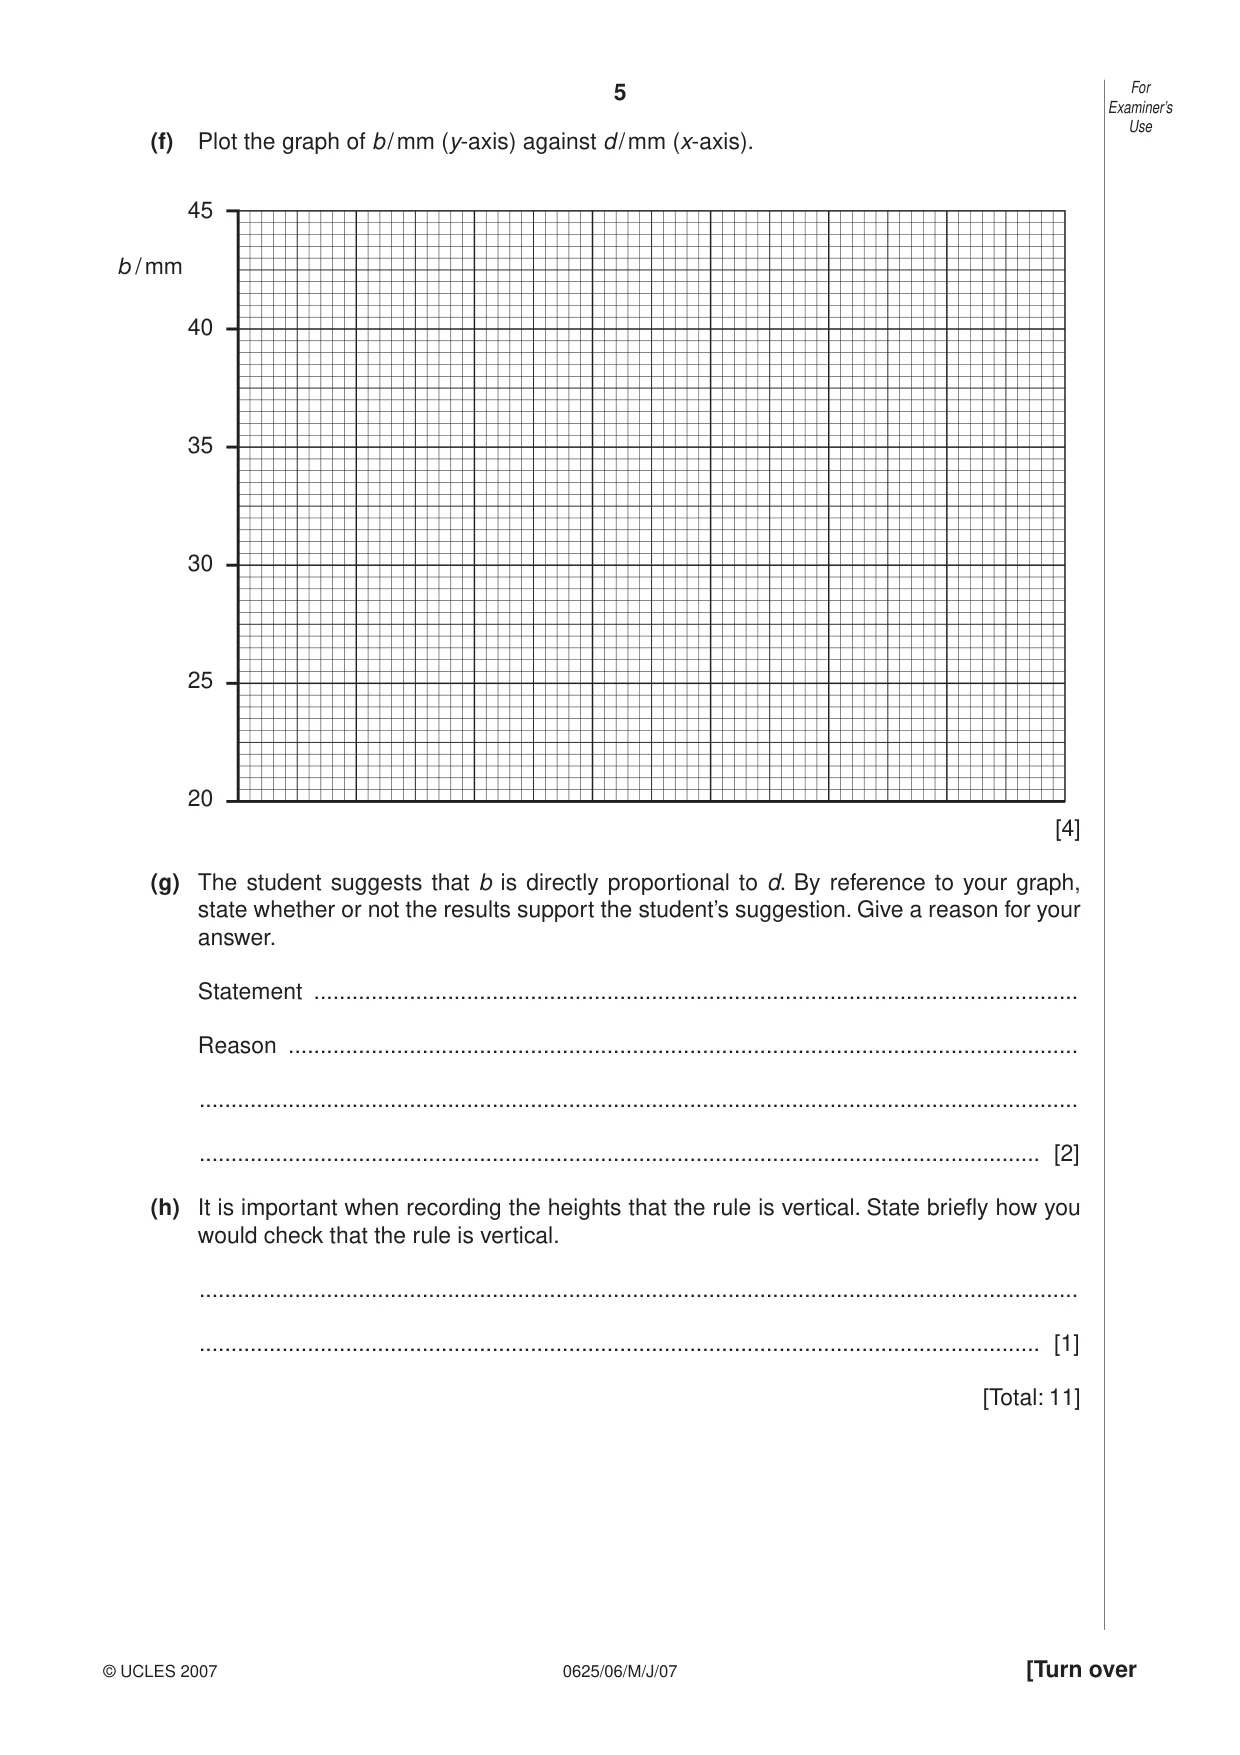
2 A student is investigating the position of a sheet of card that is hanging from a pivot. Fig. 2.1 shows the apparatus drawn full size. metre rule stand pivot pointer card h0 1 2 3 4 5 6 A mass 0 Fig. 2.1 Examiner’s Use (a) On Fig. 2.1 measure the distance d between the centre of the hole labelled 1 and the edge of the card at A. Record this value in the table. hole d / mm h / mm b / mm 1 140 2 135 3 132 4 128 5 124 6 120 [3] (b) Repeat step (a) for each of the remaining holes 2 – 6. (c) On Fig. 2.1 measure the height h0 of the pointer above the bench. h0 = ..................................................... [1] (d) A student hangs a 10 g mass from the hole 1 in the card. She records the height h of the end of the pointer above the bench. She then repeats this procedure by hanging the mass from each hole in turn. Her results are shown in the table above. (e) Calculate the differences in heights b using the equation b = (h – h0) and record the results in the table above. Examiner’s Use (f) Plot the graph of b / mm (y-axis) against d / mm (x-axis). 45 b / mm 40 35 30 25 20 [4] (g) The student suggests that b is directly proportional to d. By reference to your graph, state whether or not the results support the student’s suggestion. Give a reason for your answer. Statement ........................................................................................................................ Reason ............................................................................................................................ .......................................................................................................................................... .................................................................................................................................... [2] (h) It is important when recording the heights that the rule is vertical. State briefly how you would check that the rule is vertical. .......................................................................................................................................... .................................................................................................................................... [1] [Total: 11]
Mark scheme: 2 (a) and (b) 6 d values [1] correct values for d 5, 10, 15, 20, 25, 30 [1] (c) h0 = 100mm (including unit, cm/m allowed) [1] (e) correct values for b 40, 35, 32, 28, 24, 20 (ecf) [1] (f) Graph: correct d axis labelled with symbol / unit [1] plots to nearest ½ sq (-1 each error or omission) [2] best fit straight line [1] single line, thin and best fit [1] (g) no line not through origin OR when b increases, d decreases OR negative gradient [1] (h) use of set square / protractor / spirit level / plumbline [1] [Total: 11] IGCSE – May/June 2007 0625 6
Q3 · The IGCSE class is investigating the resistance of a wire
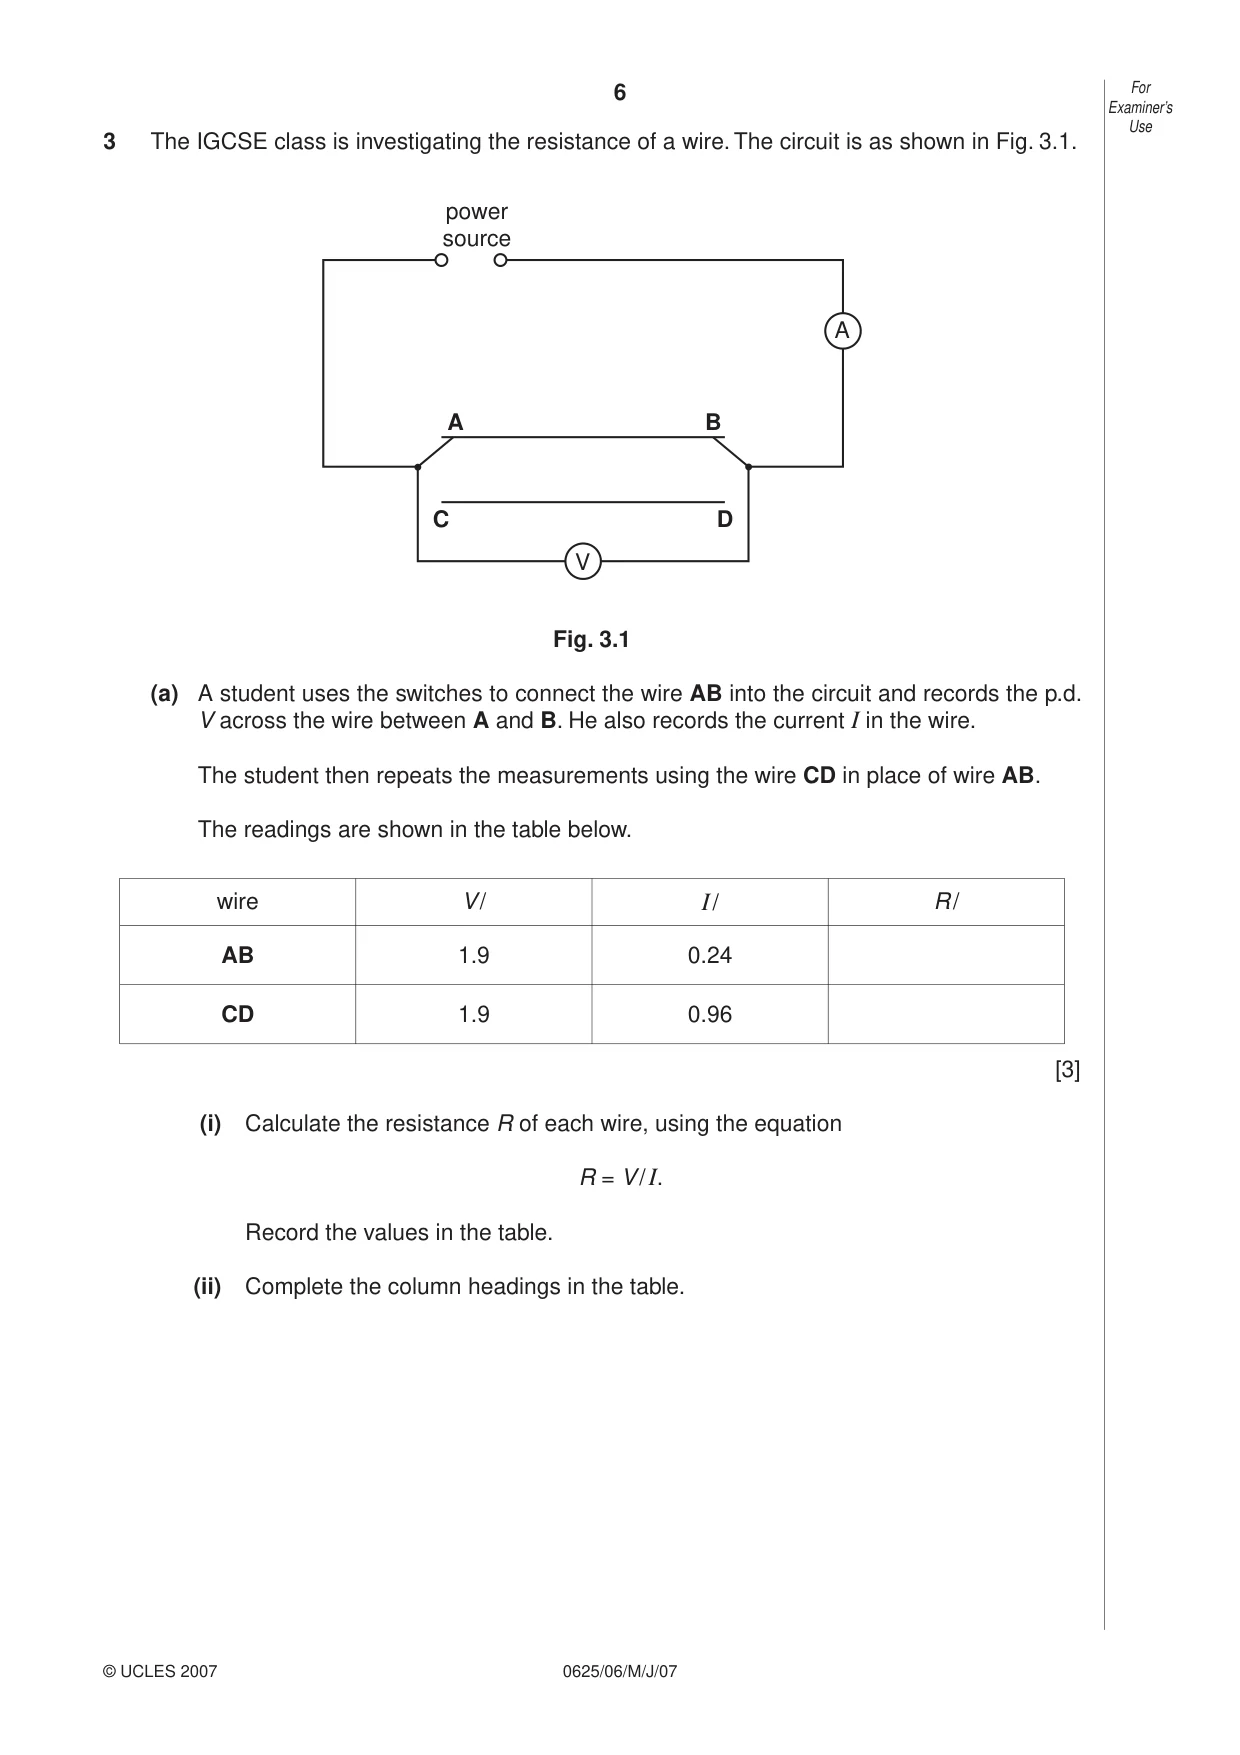
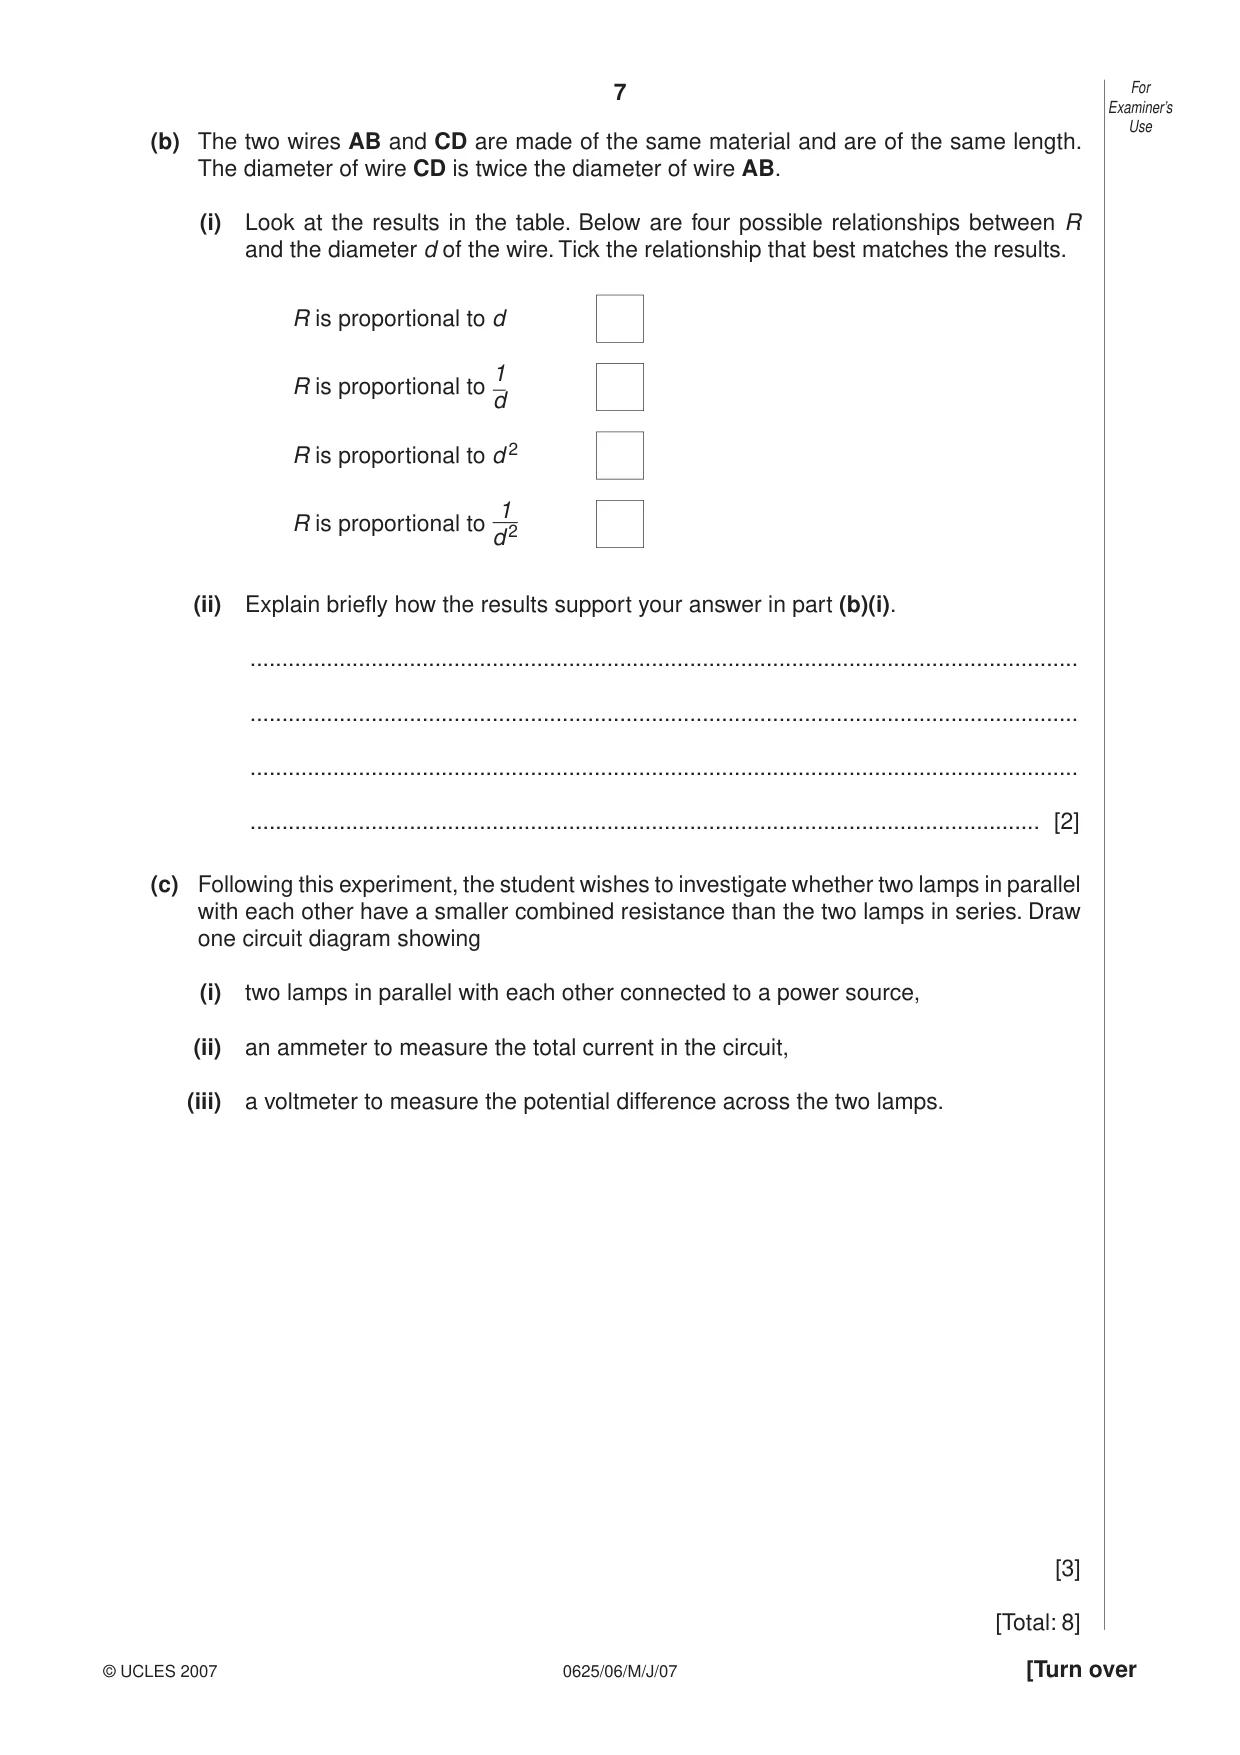
3 The IGCSE class is investigating the resistance of a wire. The circuit is as shown in Fig. 3.1. power source A A B C D V Fig. 3.1 (a) A student uses the switches to connect the wire AB into the circuit and records the p.d. V across the wire between A and B. He also records the current I in the wire. The student then repeats the measurements using the wire CD in place of wire AB. The readings are shown in the table below. wire V / I / R / AB 1.9 0.24 CD 1.9 0.96 [3] (i) Calculate the resistance R of each wire, using the equation R = V / I. Record the values in the table. (ii) Complete the column headings in the table. Examiner’s Use (b) The two wires AB and CD are made of the same material and are of the same length. The diameter of wire CD is twice the diameter of wire AB. (i) Look at the results in the table. Below are four possible relationships between R and the diameter d of the wire. Tick the relationship that best matches the results. R is proportional to d 1 R is proportional to d R is proportional to d 2 1 R is proportional to 2 d (ii) Explain briefly how the results support your answer in part (b)(i). .................................................................................................................................. .................................................................................................................................. .................................................................................................................................. ............................................................................................................................ [2] (c) Following this experiment, the student wishes to investigate whether two lamps in parallel with each other have a smaller combined resistance than the two lamps in series. Draw one circuit diagram showing (i) two lamps in parallel with each other connected to a power source, (ii) an ammeter to measure the total current in the circuit, (iii) a voltmeter to measure the potential difference across the two lamps. [3] [Total: 8]
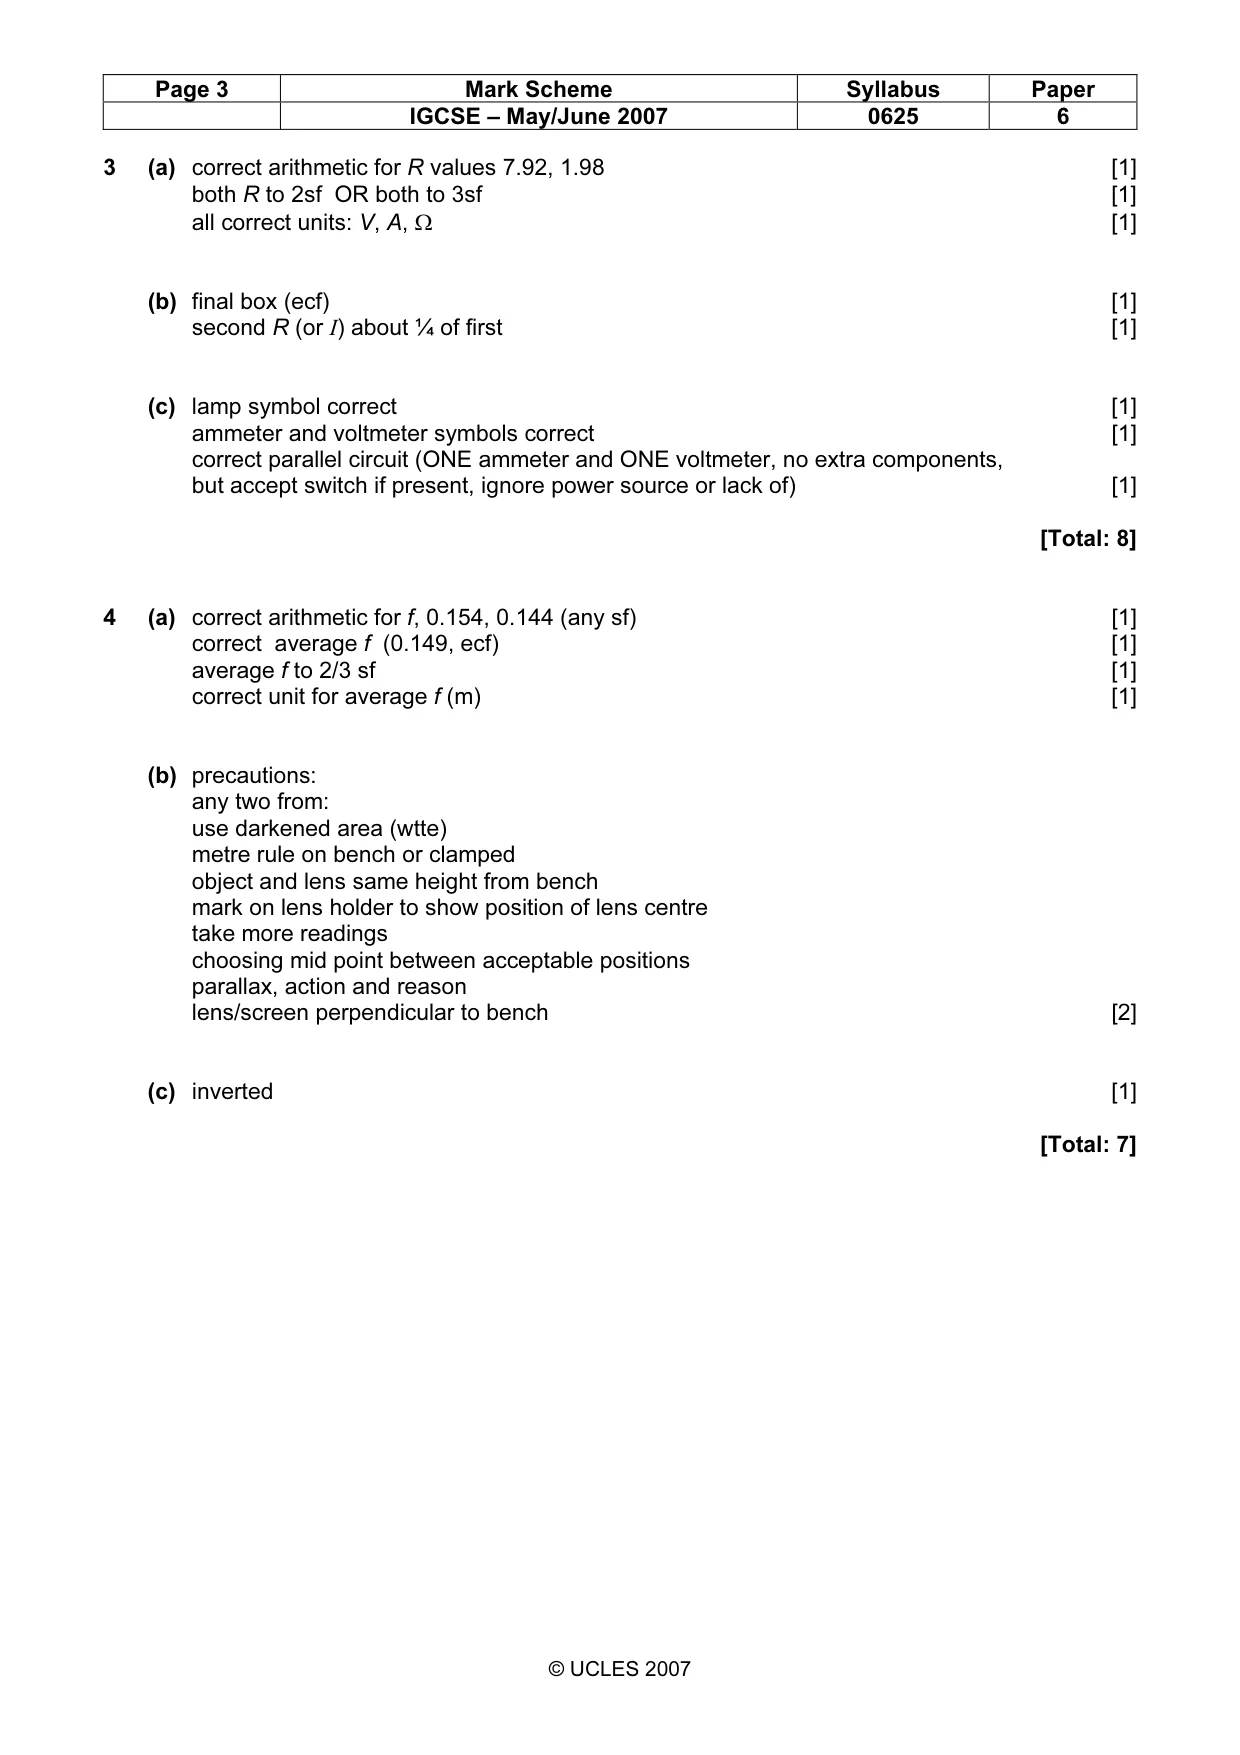
Mark scheme: 3 (a) correct arithmetic for R values 7.92, 1.98 [1] both R to 2sf OR both to 3sf [1] all correct units: V, A, Ω [1] (b) final box (ecf) [1] second R (or I) about ¼ of first [1] (c) lamp symbol correct [1] ammeter and voltmeter symbols correct [1] correct parallel circuit (ONE ammeter and ONE voltmeter, no extra components, but accept switch if present, ignore power source or lack of) [1] [Total: 8]
Q4 · The IGCSE class is investigating the formation of images by a lens
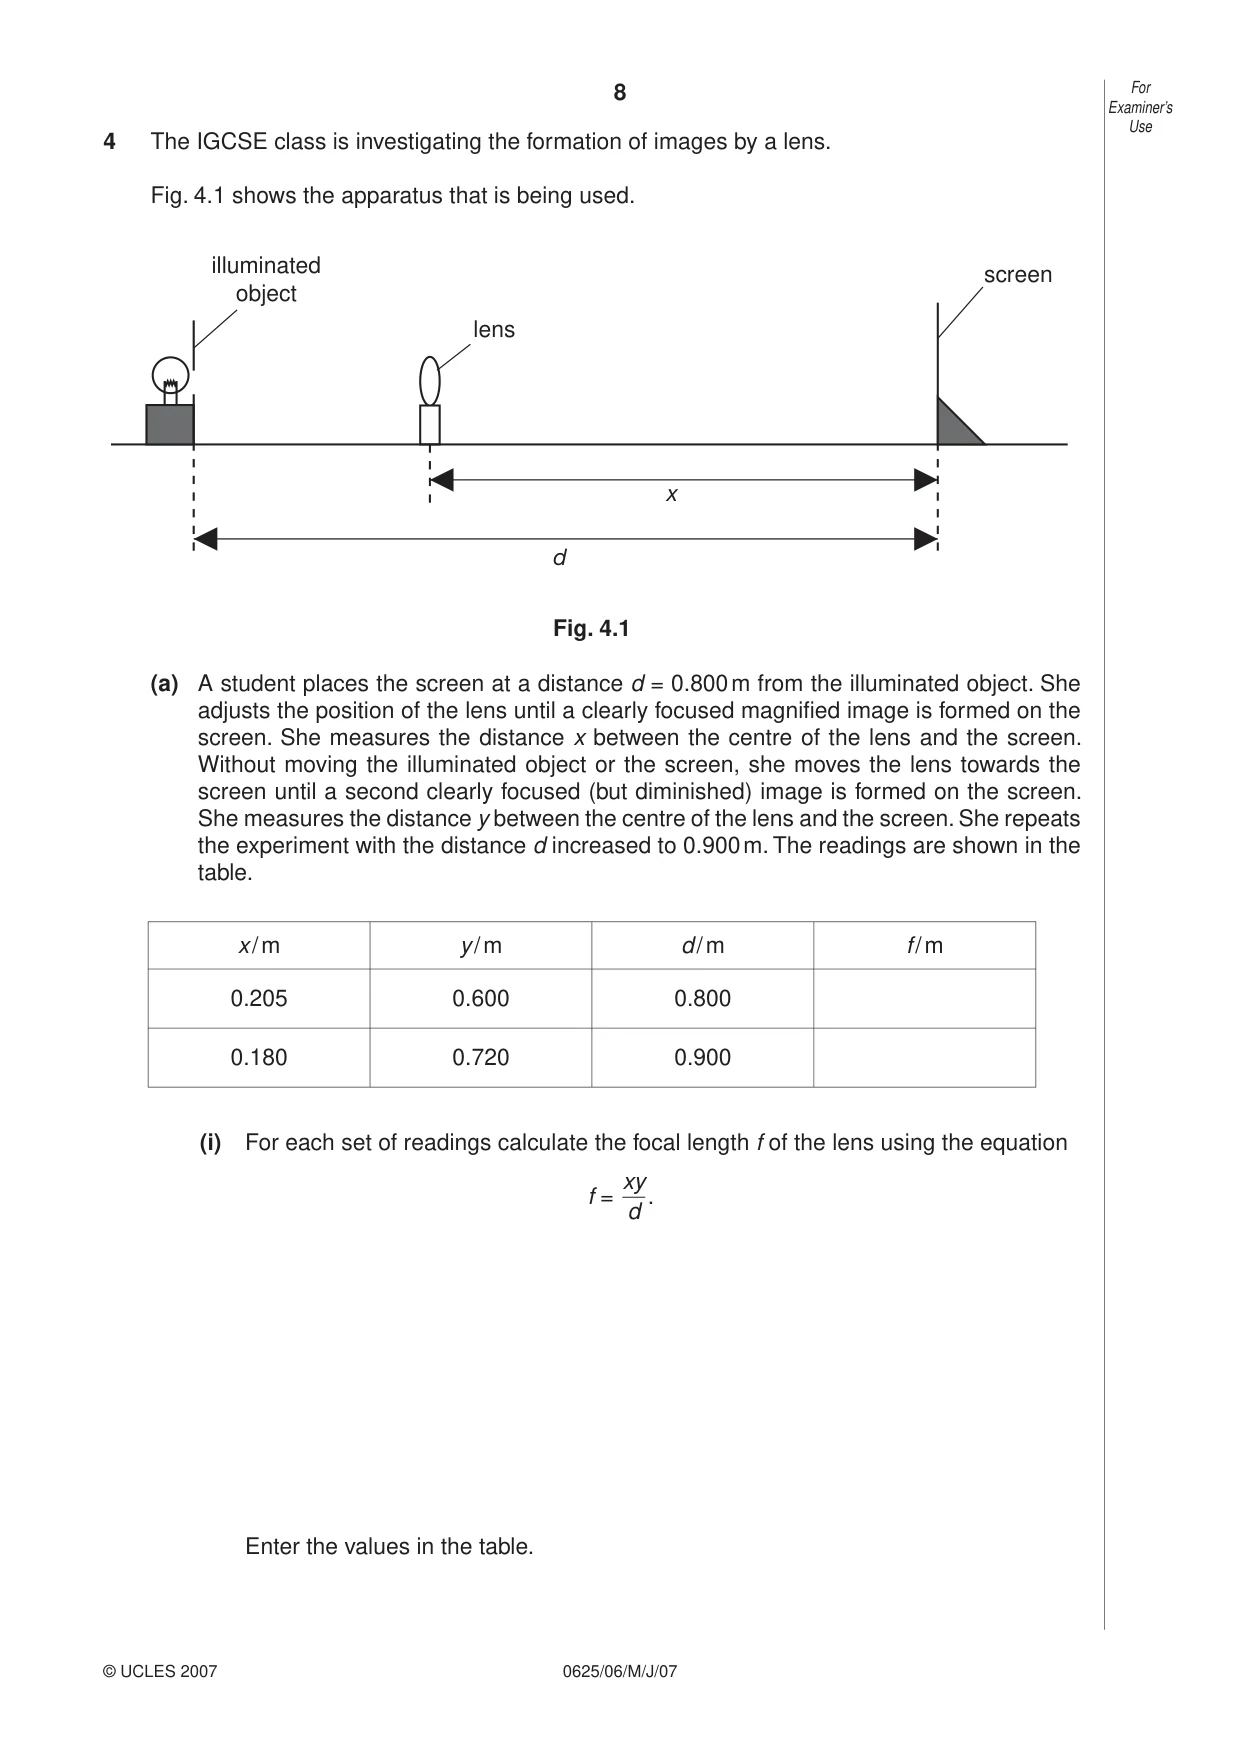
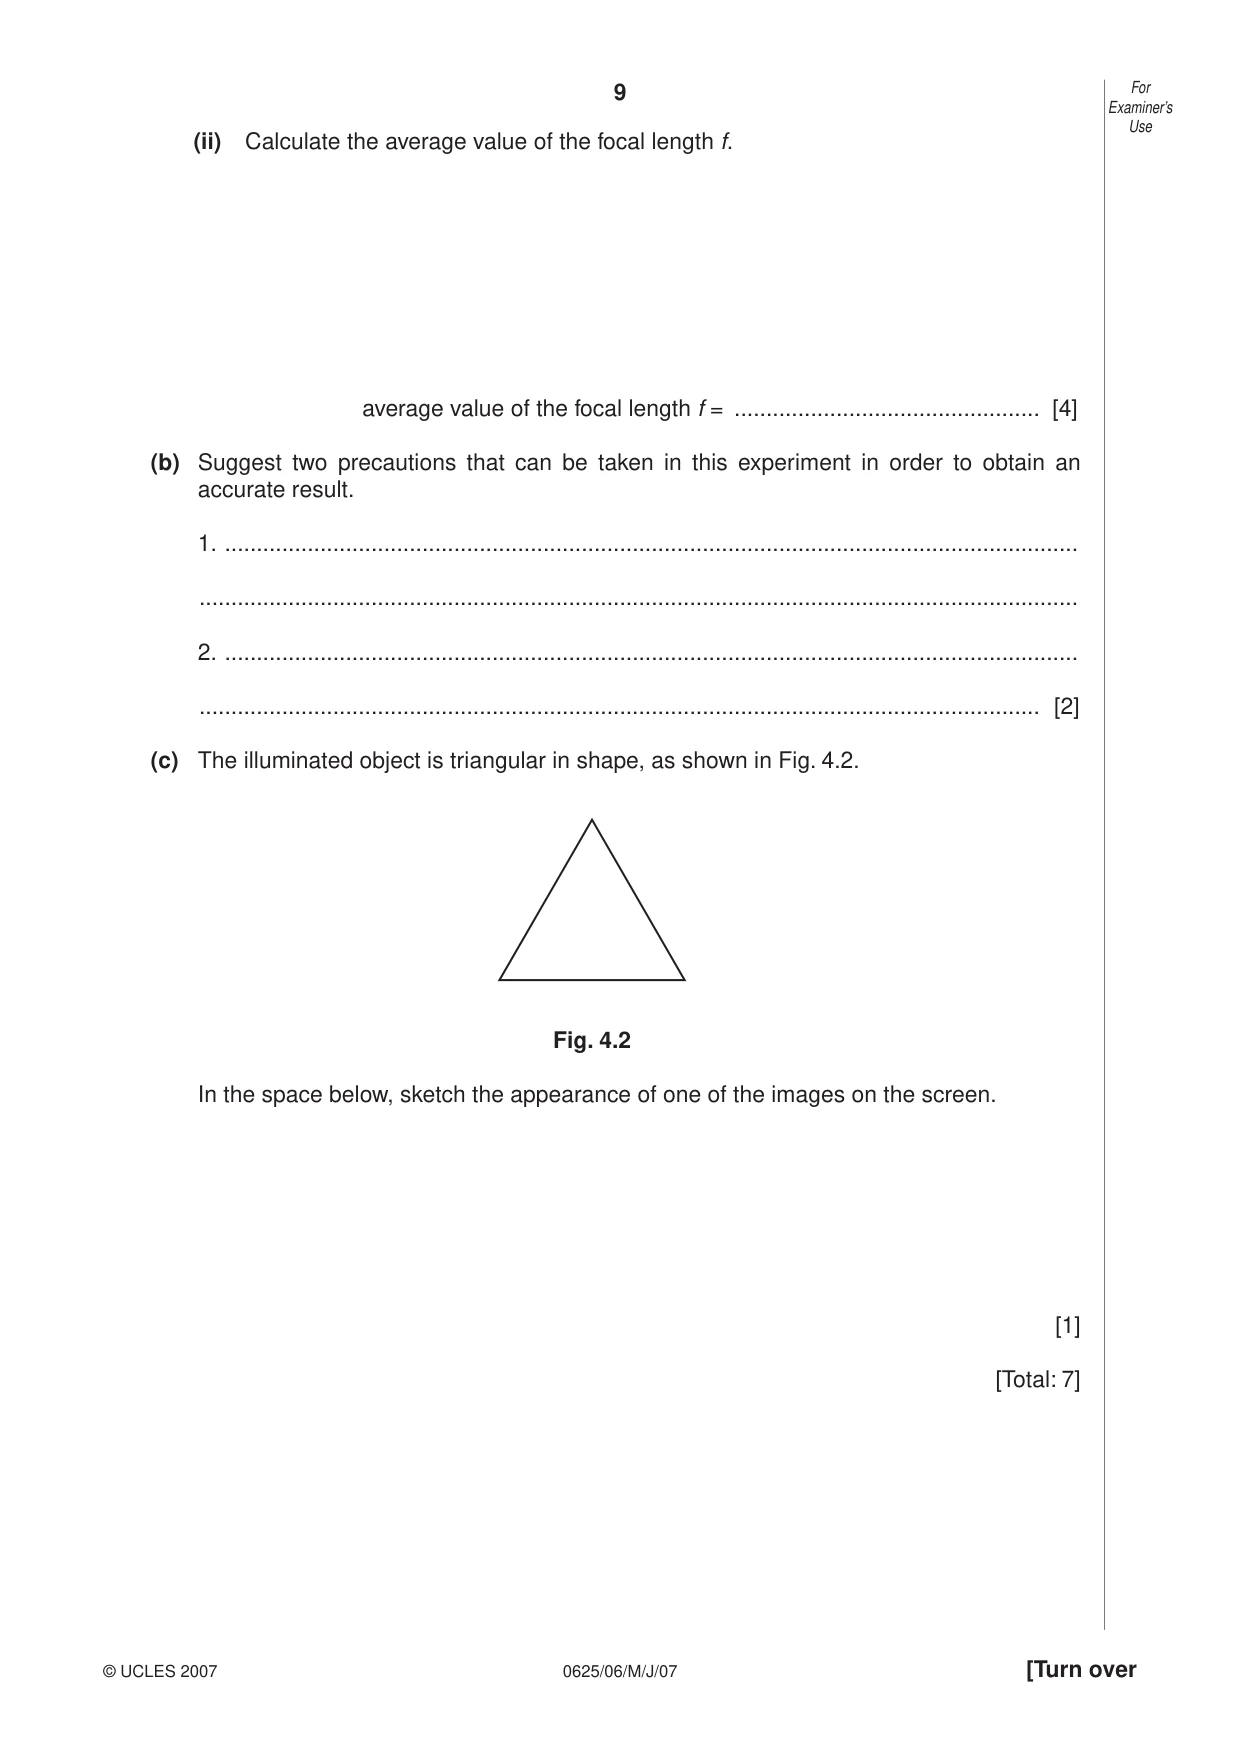
4 The IGCSE class is investigating the formation of images by a lens. Fig. 4.1 shows the apparatus that is being used. illuminated screen object lens x d Fig. 4.1 (a) A student places the screen at a distance d = 0.800 m from the illuminated object. She adjusts the position of the lens until a clearly focused magnified image is formed on the screen. She measures the distance x between the centre of the lens and the screen. Without moving the illuminated object or the screen, she moves the lens towards the screen until a second clearly focused (but diminished) image is formed on the screen. She measures the distance y between the centre of the lens and the screen. She repeats the experiment with the distance d increased to 0.900 m. The readings are shown in the table. x / m y / m d / m f / m 0.205 0.600 0.800 0.180 0.720 0.900 (i) For each set of readings calculate the focal length f of the lens using the equation xy f = . d Enter the values in the table. Examiner’s Use (ii) Calculate the average value of the focal length f. average value of the focal length f = ................................................ [4] (b) Suggest two precautions that can be taken in this experiment in order to obtain an accurate result. 1. ...................................................................................................................................... .......................................................................................................................................... 2. ...................................................................................................................................... .................................................................................................................................... [2] (c) The illuminated object is triangular in shape, as shown in Fig. 4.2. Fig. 4.2 In the space below, sketch the appearance of one of the images on the screen. [1] [Total: 7]
Mark scheme: 4 (a) correct arithmetic for f, 0.154, 0.144 (any sf) [1] correct average f (0.149, ecf) [1] average f to 2/3 sf [1] correct unit for average f (m) [1] (b) precautions: any two from: use darkened area (wtte) metre rule on bench or clamped object and lens same height from bench mark on lens holder to show position of lens centre take more readings choosing mid point between acceptable positions parallax, action and reason lens/screen perpendicular to bench [2] (c) inverted [1] [Total: 7] IGCSE – May/June 2007 0625 6
Q5 · An IGCSE student is investigating the relationship between the extension of a spring of…
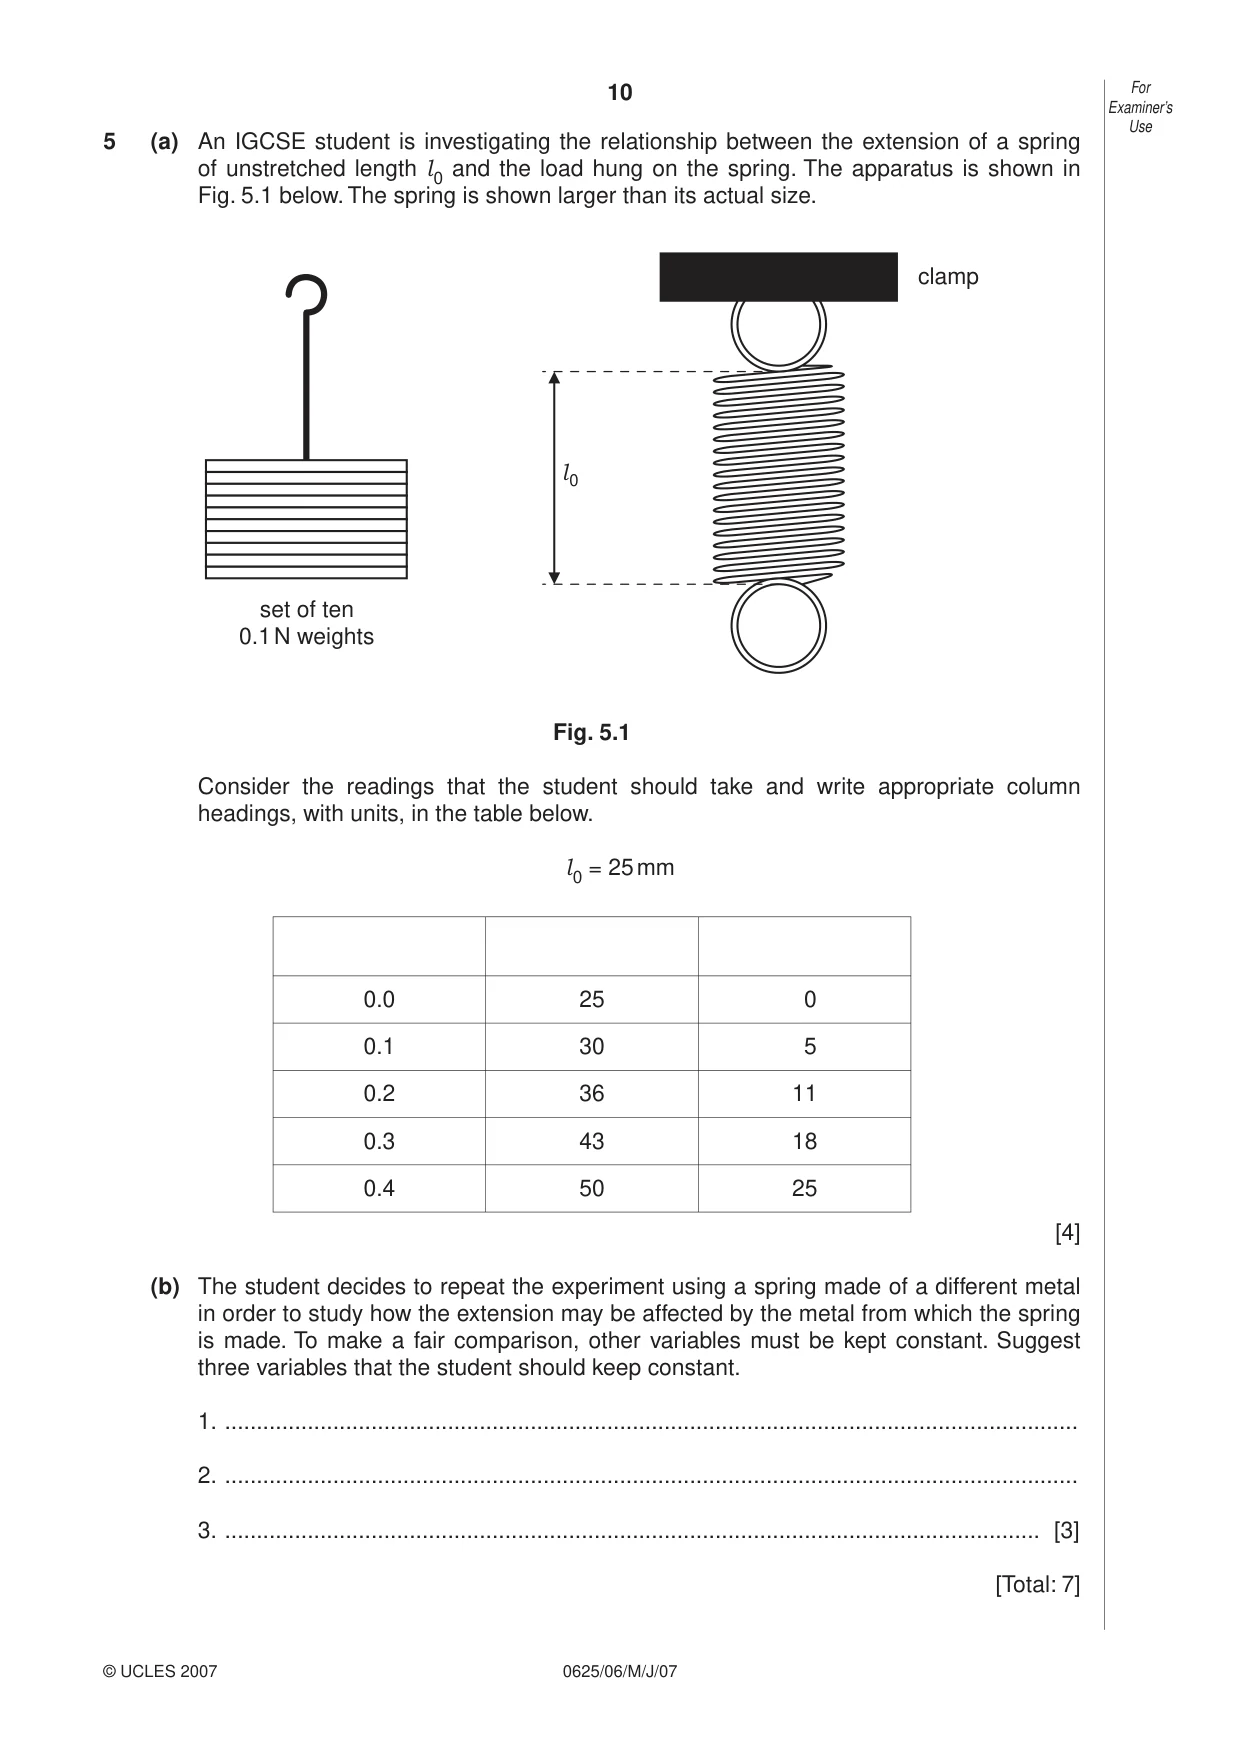
5 (a) An IGCSE student is investigating the relationship between the extension of a spring of unstretched length l and the load hung on the spring. The apparatus is shown in 0 Fig. 5.1 below. The spring is shown larger than its actual size. clamp l 0 set of ten 0.1 N weights Fig. 5.1 Consider the readings that the student should take and write appropriate column headings, with units, in the table below. l = 25 mm 0 0.0 25 0 0.1 30 5 0.2 36 11 0.3 43 18 0.4 50 25 [4] (b) The student decides to repeat the experiment using a spring made of a different metal in order to study how the extension may be affected by the metal from which the spring is made. To make a fair comparison, other variables must be kept constant. Suggest three variables that the student should keep constant. 1. ...................................................................................................................................... 2. ...................................................................................................................................... 3. ................................................................................................................................ [3] [Total: 7]
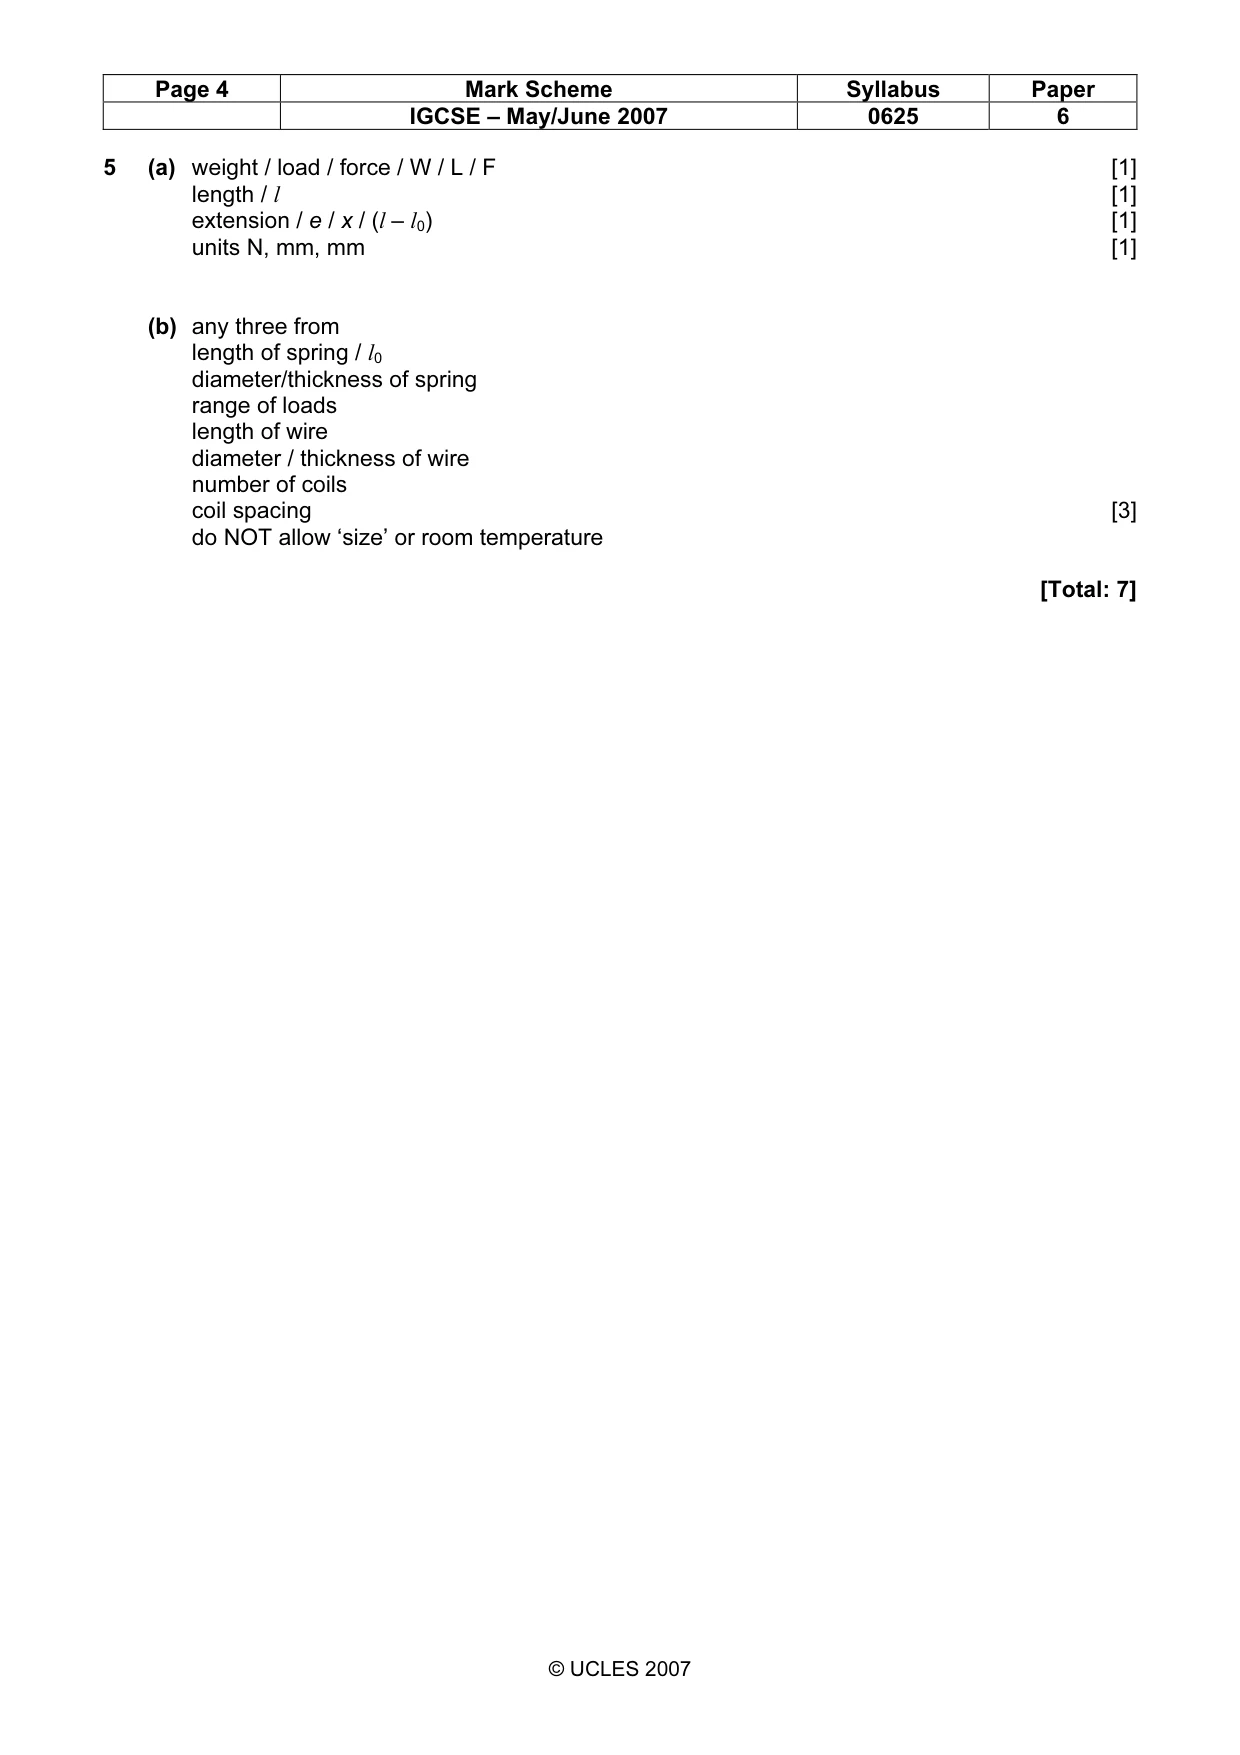
Mark scheme: 5 (a) weight / load / force / W / L / F [1] length / l [1] extension / e / x / (l – l0) [1] units N, mm, mm [1] (b) any three from length of spring / l0 diameter/thickness of spring range of loads length of wire diameter / thickness of wire number of coils coil spacing [3] do NOT allow ‘size’ or room temperature [Total: 7]
What was in this paper
The subtopics covered by these 5 questions, and how many questions each got. Open one in a new tab to see every Cambridge question on it.
What you needed in this session
Cambridge’s own grade thresholds for 2007 May/June, Paper 6 · Variant 1. A higher threshold means an easier paper — the bar moves with how the cohort did.