Cambridge IGCSE Physics 0625 — 2006 Oct/Nov Paper 6 · Variant 1
0625/61/O/N/06 · 5 questions · 40 marks · ≈45 min
The question paper and its mark scheme, free to read here and free to download. This is Cambridge’s own paper, exactly as it was sat.
Question paper12 pages
Mark scheme3 pages
Answers below. Sit the paper first if you are practising.
Questions as text
Q1 · The IGCSE class is determining the density of a type of wood
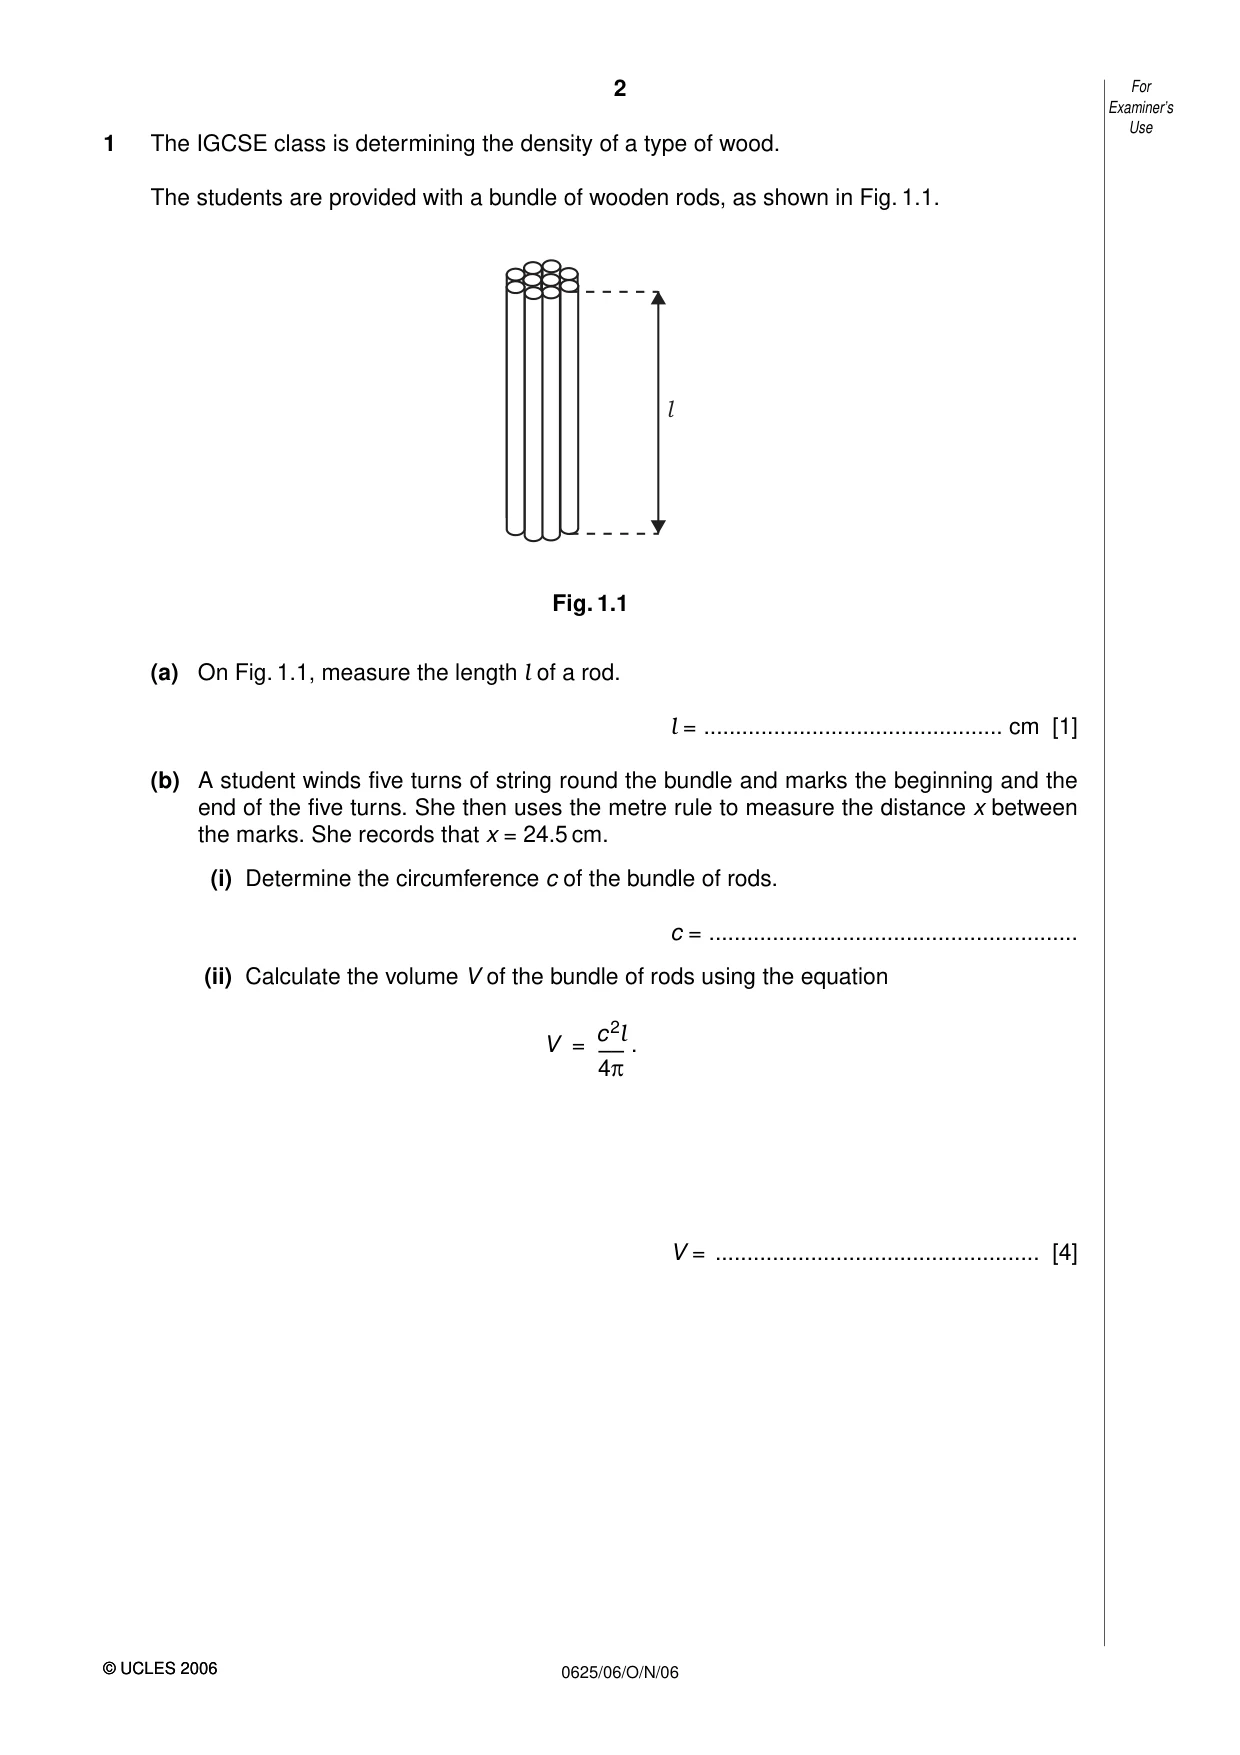
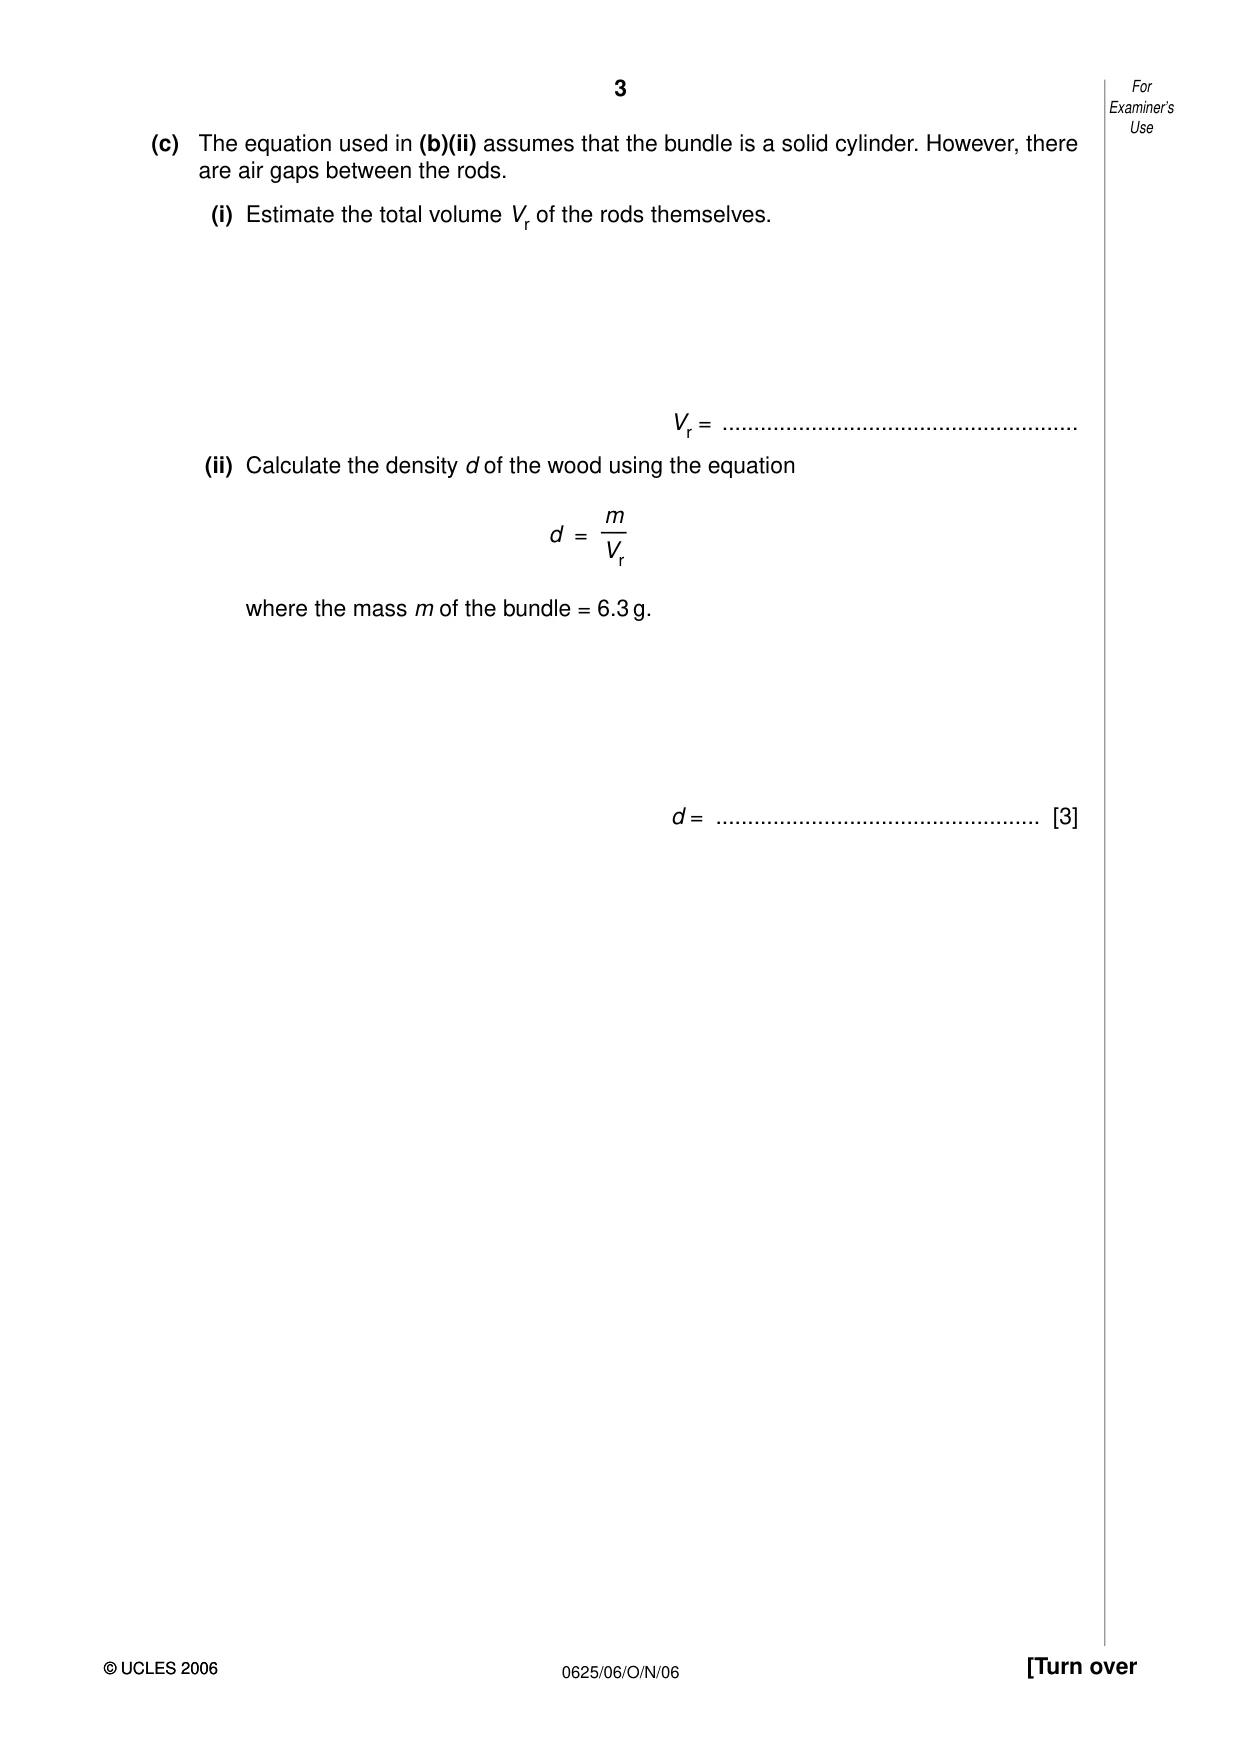
1 The IGCSE class is determining the density of a type of wood. The students are provided with a bundle of wooden rods, as shown in Fig. 1.1. l Fig. 1.1 (a) On Fig. 1.1, measure the length l of a rod. l = ............................................... cm [1] (b) A student winds five turns of string round the bundle and marks the beginning and the end of the five turns. She then uses the metre rule to measure the distance x between the marks. She records that x = 24.5 cm. (i) Determine the circumference c of the bundle of rods. c = .......................................................... (ii) Calculate the volume V of the bundle of rods using the equation c2l V = –– . 4 V = ................................................... [4] Examiner’s Use (c) The equation used in (b)(ii) assumes that the bundle is a solid cylinder. However, there are air gaps between the rods. (i) Estimate the total volume Vr of the rods themselves. Vr = ........................................................ (ii) Calculate the density d of the wood using the equation m d = –– Vr where the mass m of the bundle = 6.3 g. d = ................................................... [3]
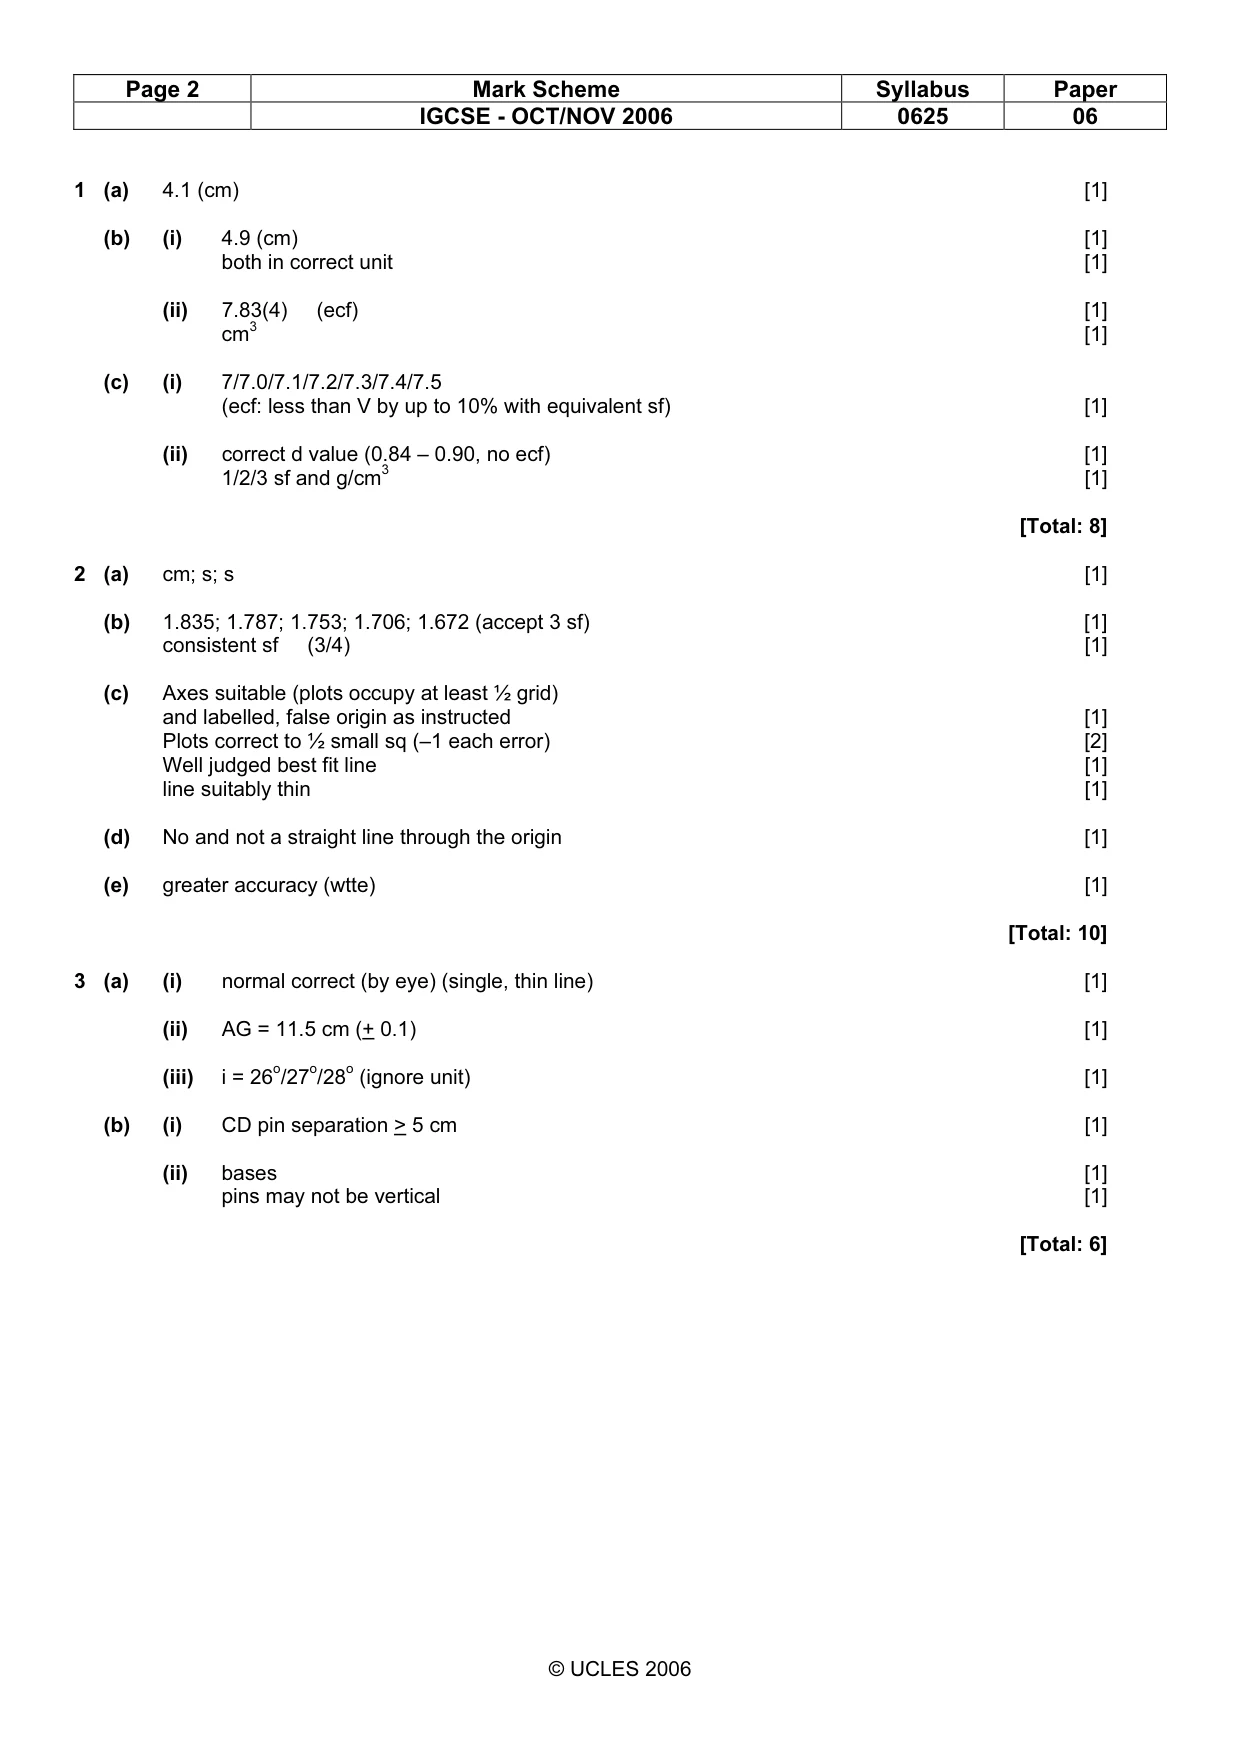
Mark scheme: 1 (a) 4.1 (cm) [1] (b) (i) 4.9 (cm) [1] both in correct unit [1] (ii) 7.83(4) (ecf) [1] cm3 [1] (c) (i) 7/7.0/7.1/7.2/7.3/7.4/7.5 (ecf: less than V by up to 10% with equivalent sf) [1] (ii) correct d value (0.84 – 0.90, no ecf) [1] 1/2/3 sf and g/cm3 [1] [Total: 8]
Q2 · The IGCSE class is investigating the swing of a loaded metre rule
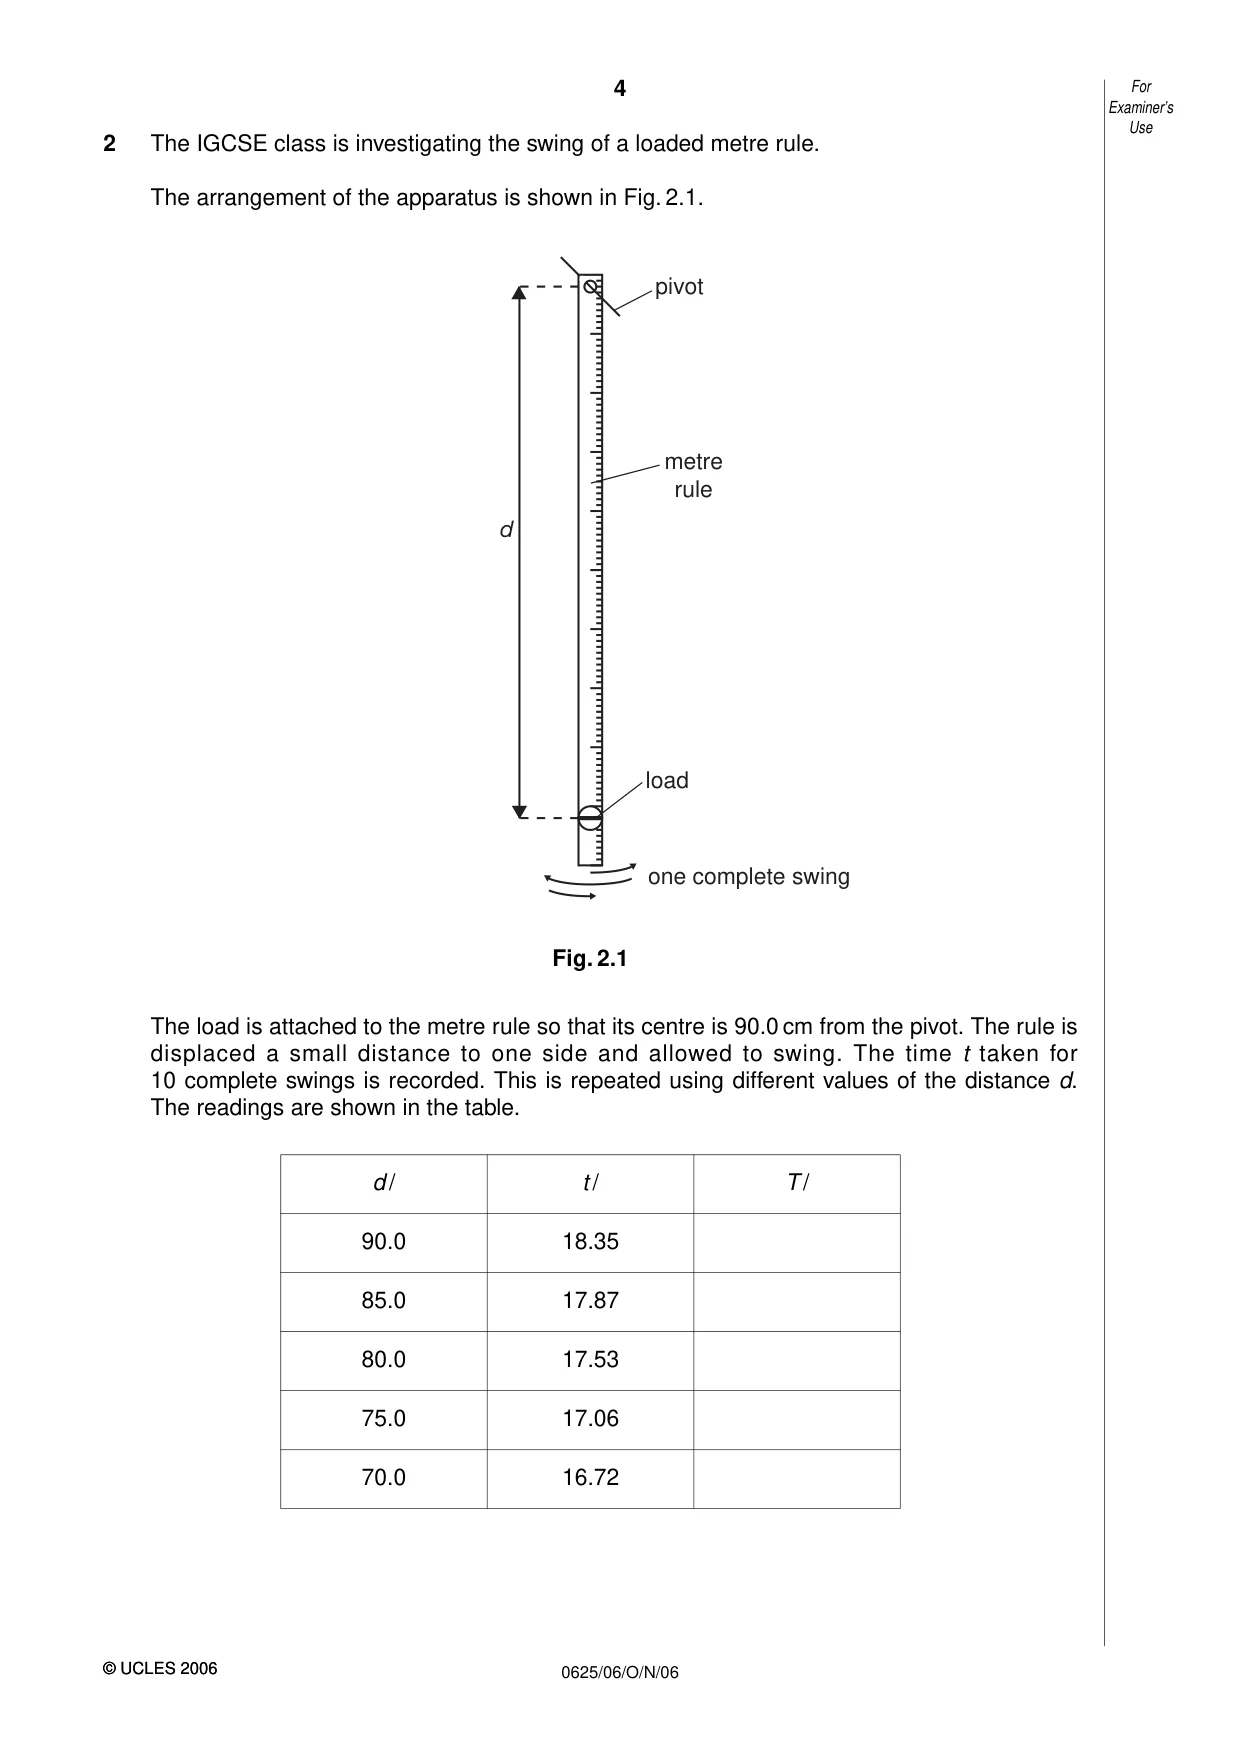
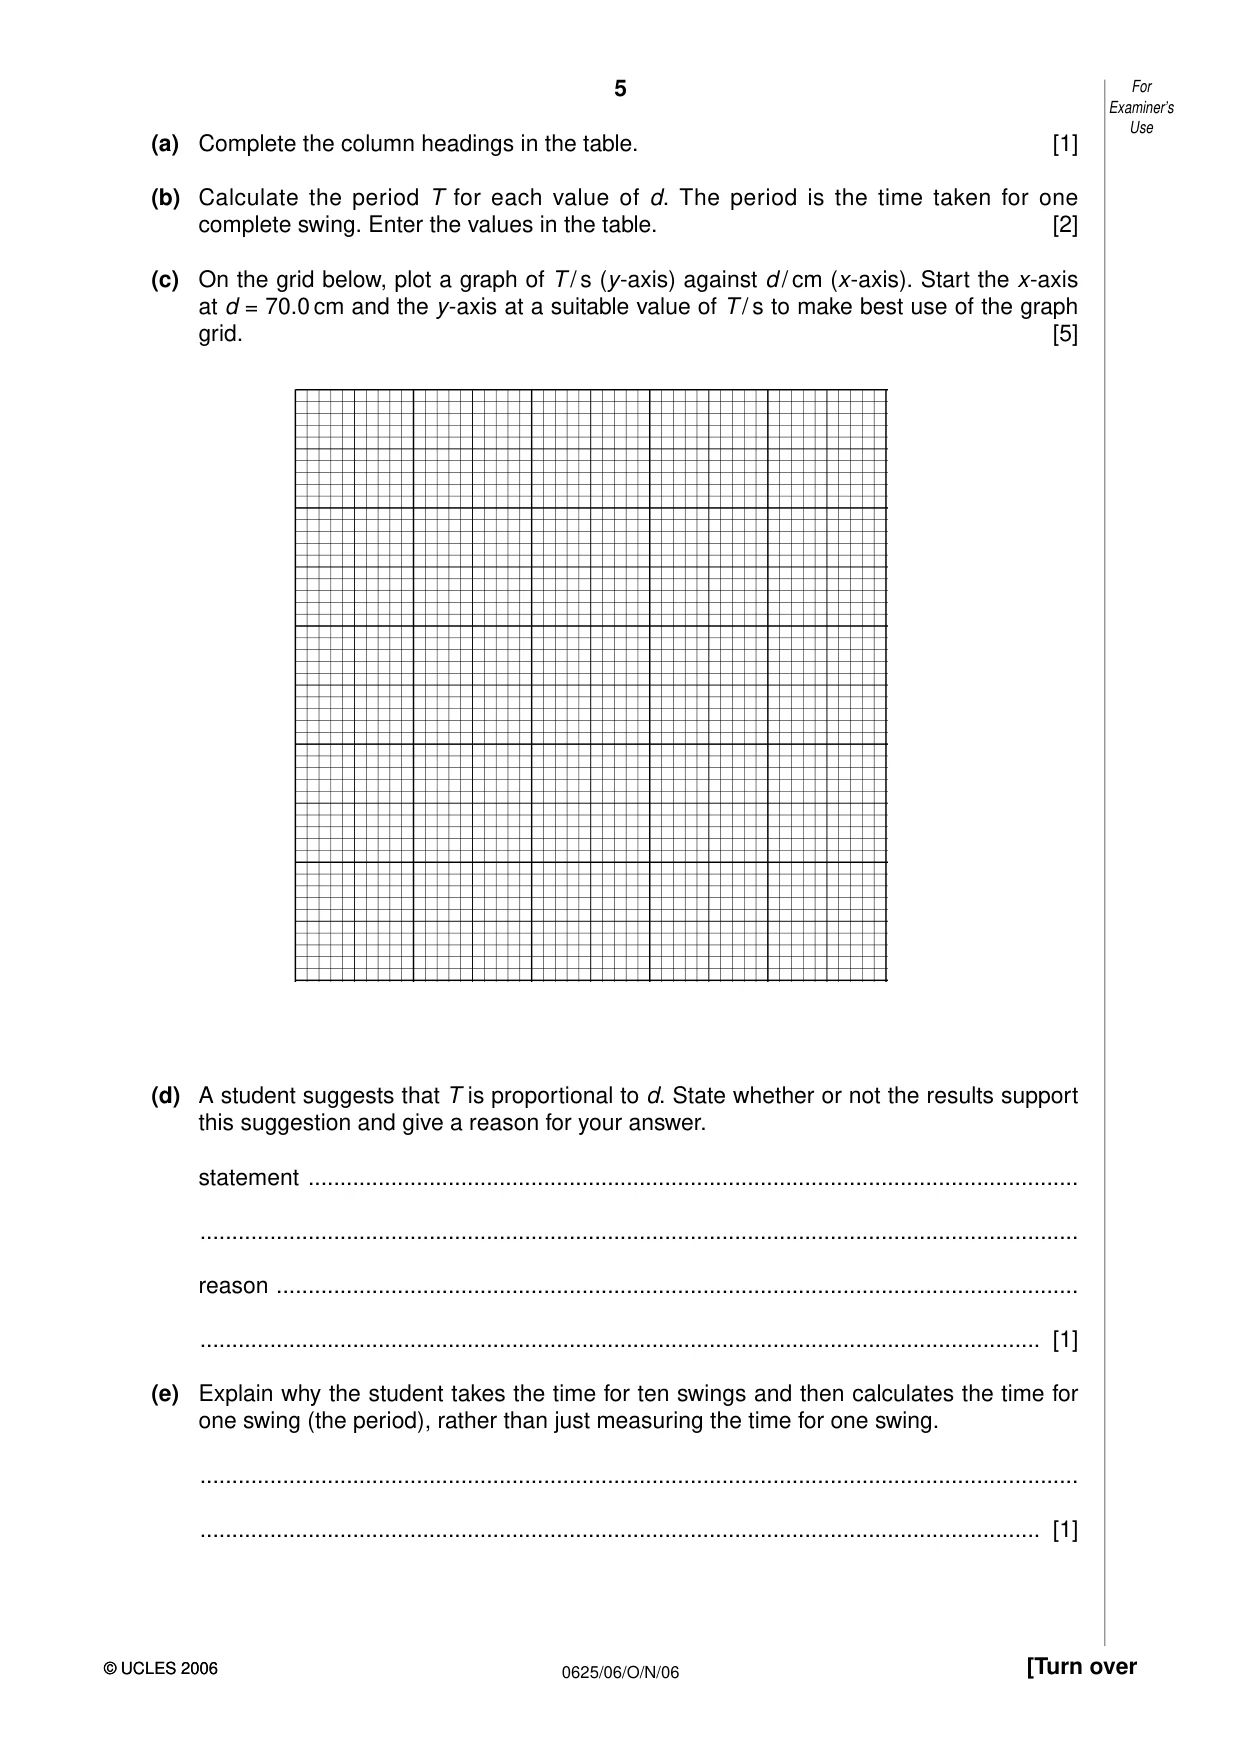
2 The IGCSE class is investigating the swing of a loaded metre rule. The arrangement of the apparatus is shown in Fig. 2.1. pivot metre rule d load one complete swing Fig. 2.1 The load is attached to the metre rule so that its centre is 90.0 cm from the pivot. The rule is displaced a small distance to one side and allowed to swing. The time t taken for 10 complete swings is recorded. This is repeated using different values of the distance d. The readings are shown in the table. d / t / T / 90.0 18.35 85.0 17.87 80.0 17.53 75.0 17.06 70.0 16.72 Examiner’s Use (a) Complete the column headings in the table. [1] (b) Calculate the period T for each value of d. The period is the time taken for one complete swing. Enter the values in the table. [2] (c) On the grid below, plot a graph of T / s (y-axis) against d / cm (x-axis). Start the x-axis at d = 70.0 cm and the y-axis at a suitable value of T / s to make best use of the graph grid. [5] (d) A student suggests that T is proportional to d. State whether or not the results support this suggestion and give a reason for your answer. statement ......................................................................................................................... .......................................................................................................................................... reason .............................................................................................................................. .................................................................................................................................... [1] (e) Explain why the student takes the time for ten swings and then calculates the time for one swing (the period), rather than just measuring the time for one swing. .......................................................................................................................................... .................................................................................................................................... [1]
Mark scheme: 2 (a) cm; s; s [1] (b) 1.835; 1.787; 1.753; 1.706; 1.672 (accept 3 sf) [1] consistent sf (3/4) [1] (c) Axes suitable (plots occupy at least ½ grid) and labelled, false origin as instructed [1] Plots correct to ½ small sq (–1 each error) [2] Well judged best fit line [1] line suitably thin [1] (d) No and not a straight line through the origin [1] (e) greater accuracy (wtte) [1] [Total: 10]
Q3 · The IGCSE class is investigating reflection in a plane mirror
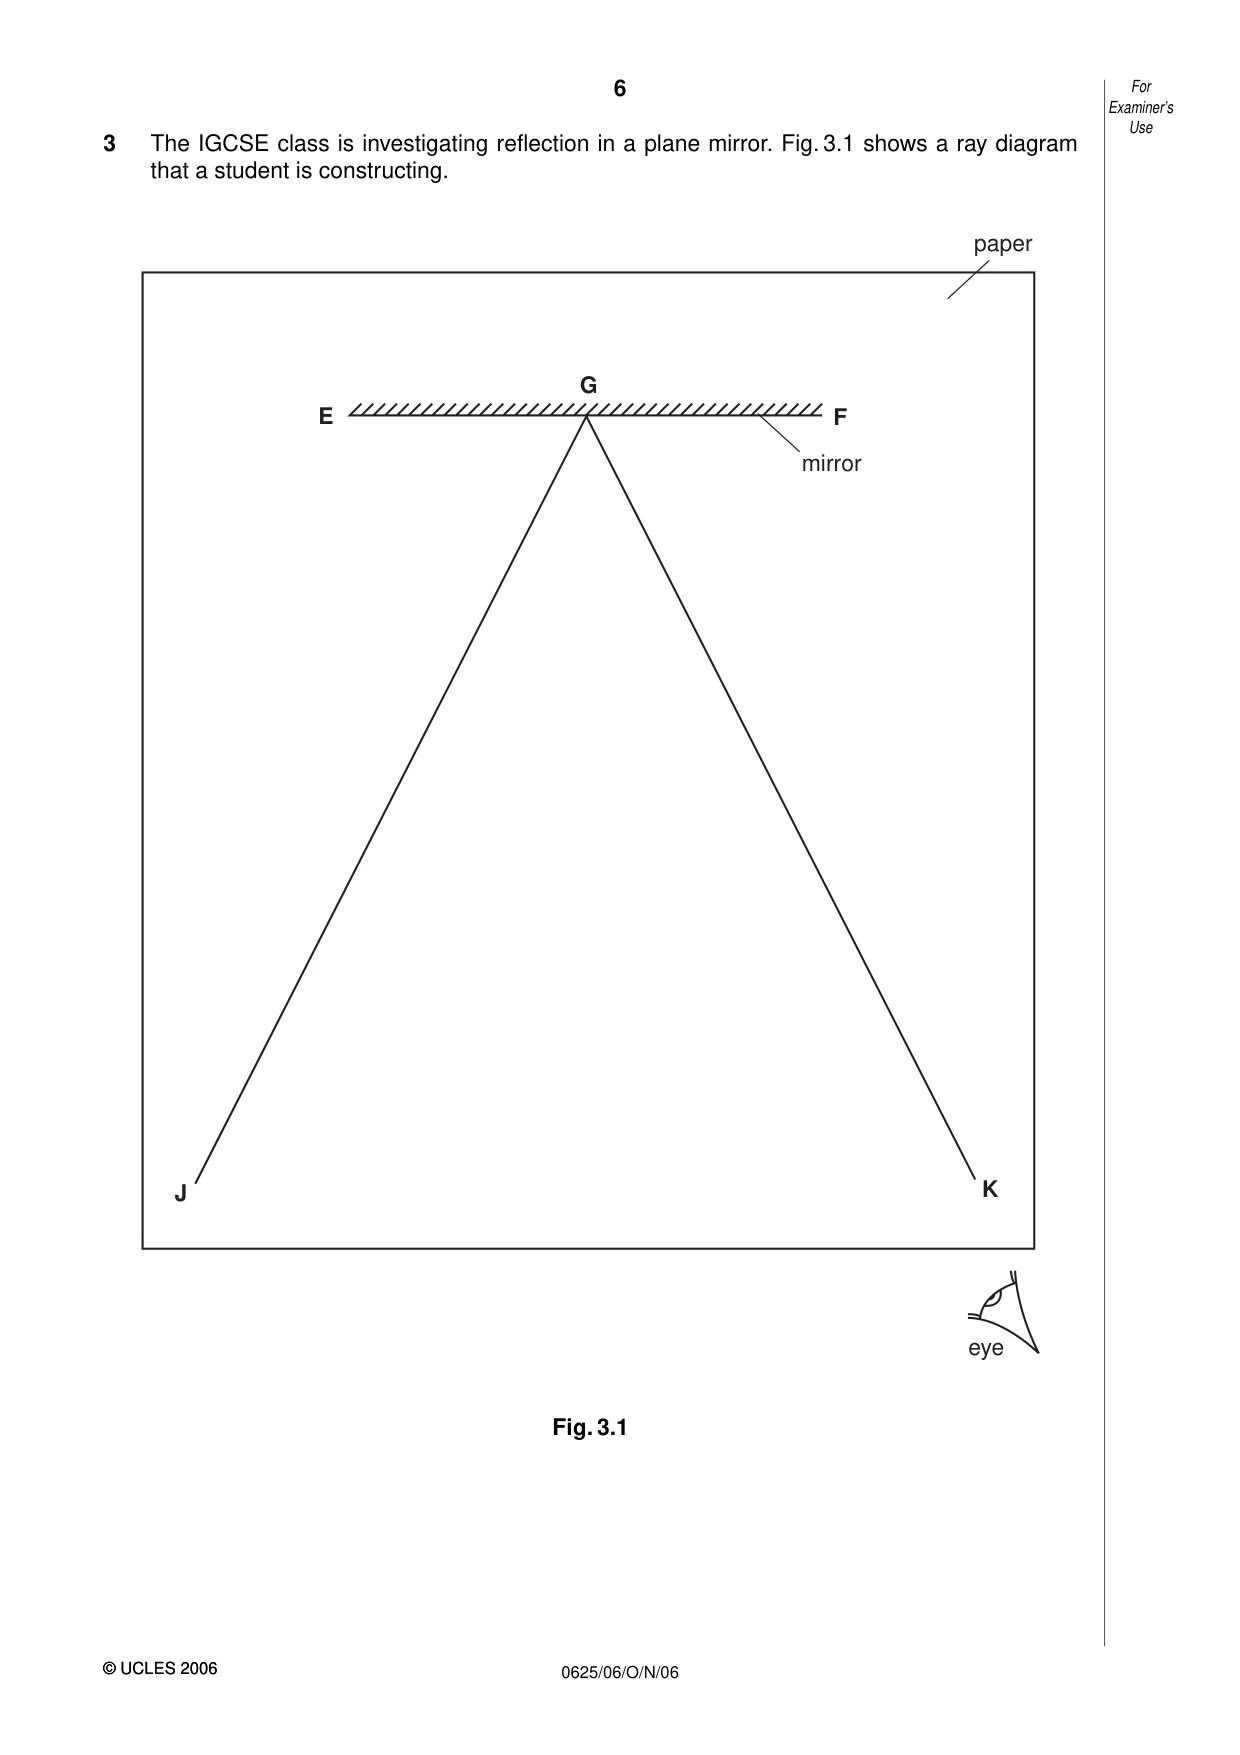
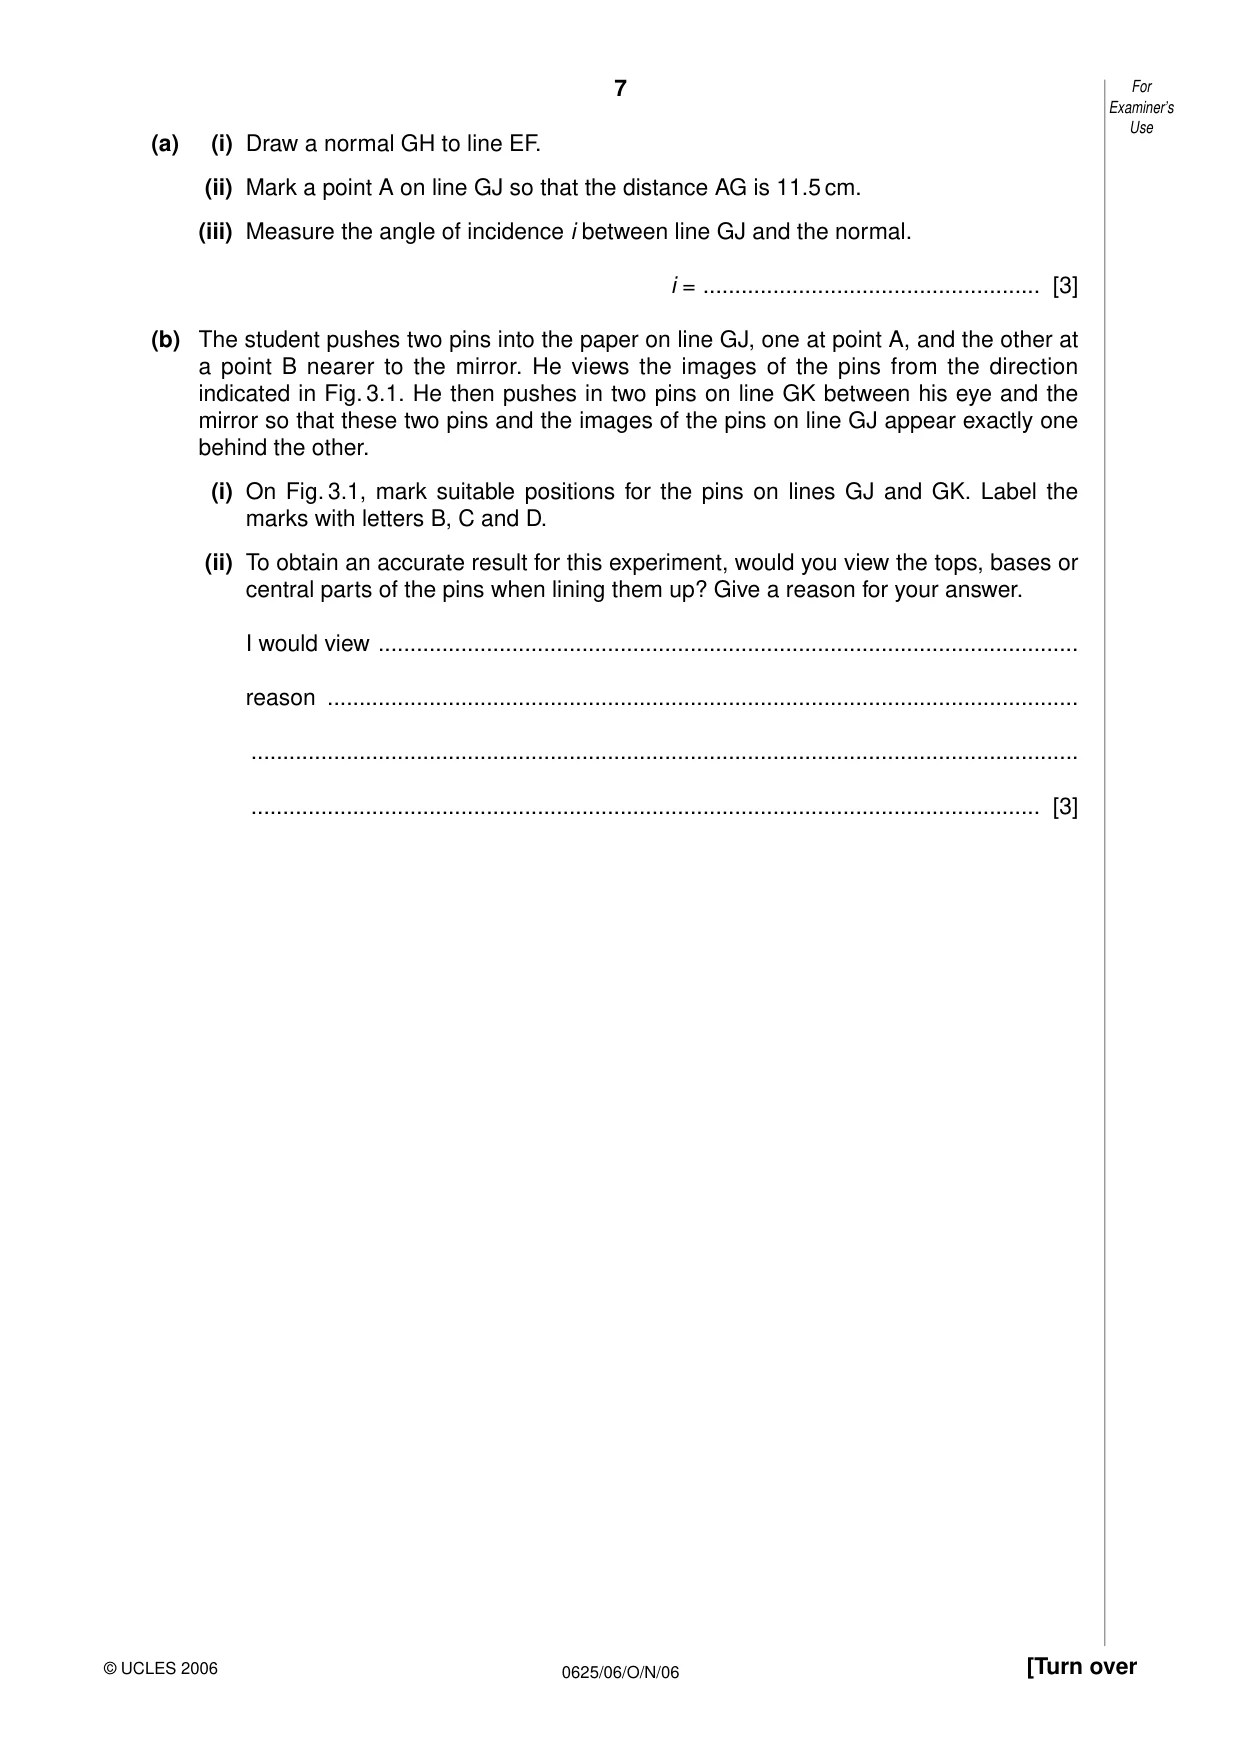
3 The IGCSE class is investigating reflection in a plane mirror. Fig. 3.1 shows a ray diagram that a student is constructing. paper G E F mirror J K eye Fig. 3.1 Examiner’s Use (a) (i) Draw a normal GH to line EF. (ii) Mark a point A on line GJ so that the distance AG is 11.5 cm. (iii) Measure the angle of incidence i between line GJ and the normal. i = ..................................................... [3] (b) The student pushes two pins into the paper on line GJ, one at point A, and the other at a point B nearer to the mirror. He views the images of the pins from the direction indicated in Fig. 3.1. He then pushes in two pins on line GK between his eye and the mirror so that these two pins and the images of the pins on line GJ appear exactly one behind the other. (i) On Fig. 3.1, mark suitable positions for the pins on lines GJ and GK. Label the marks with letters B, C and D. (ii) To obtain an accurate result for this experiment, would you view the tops, bases or central parts of the pins when lining them up? Give a reason for your answer. I would view .............................................................................................................. reason ...................................................................................................................... .................................................................................................................................. ............................................................................................................................ [3]
Mark scheme: 3 (a) (i) normal correct (by eye) (single, thin line) [1] (ii) AG = 11.5 cm (+ 0.1) [1] (iii) i = 26o/27o/28o (ignore unit) [1] (b) (i) CD pin separation > 5 cm [1] (ii) bases [1] pins may not be vertical [1] [Total: 6] IGCSE - OCT/NOV 2006 0625 06
Q4 · The IGCSE class is investigating conditions affecting the rate of cooling of a beaker of…
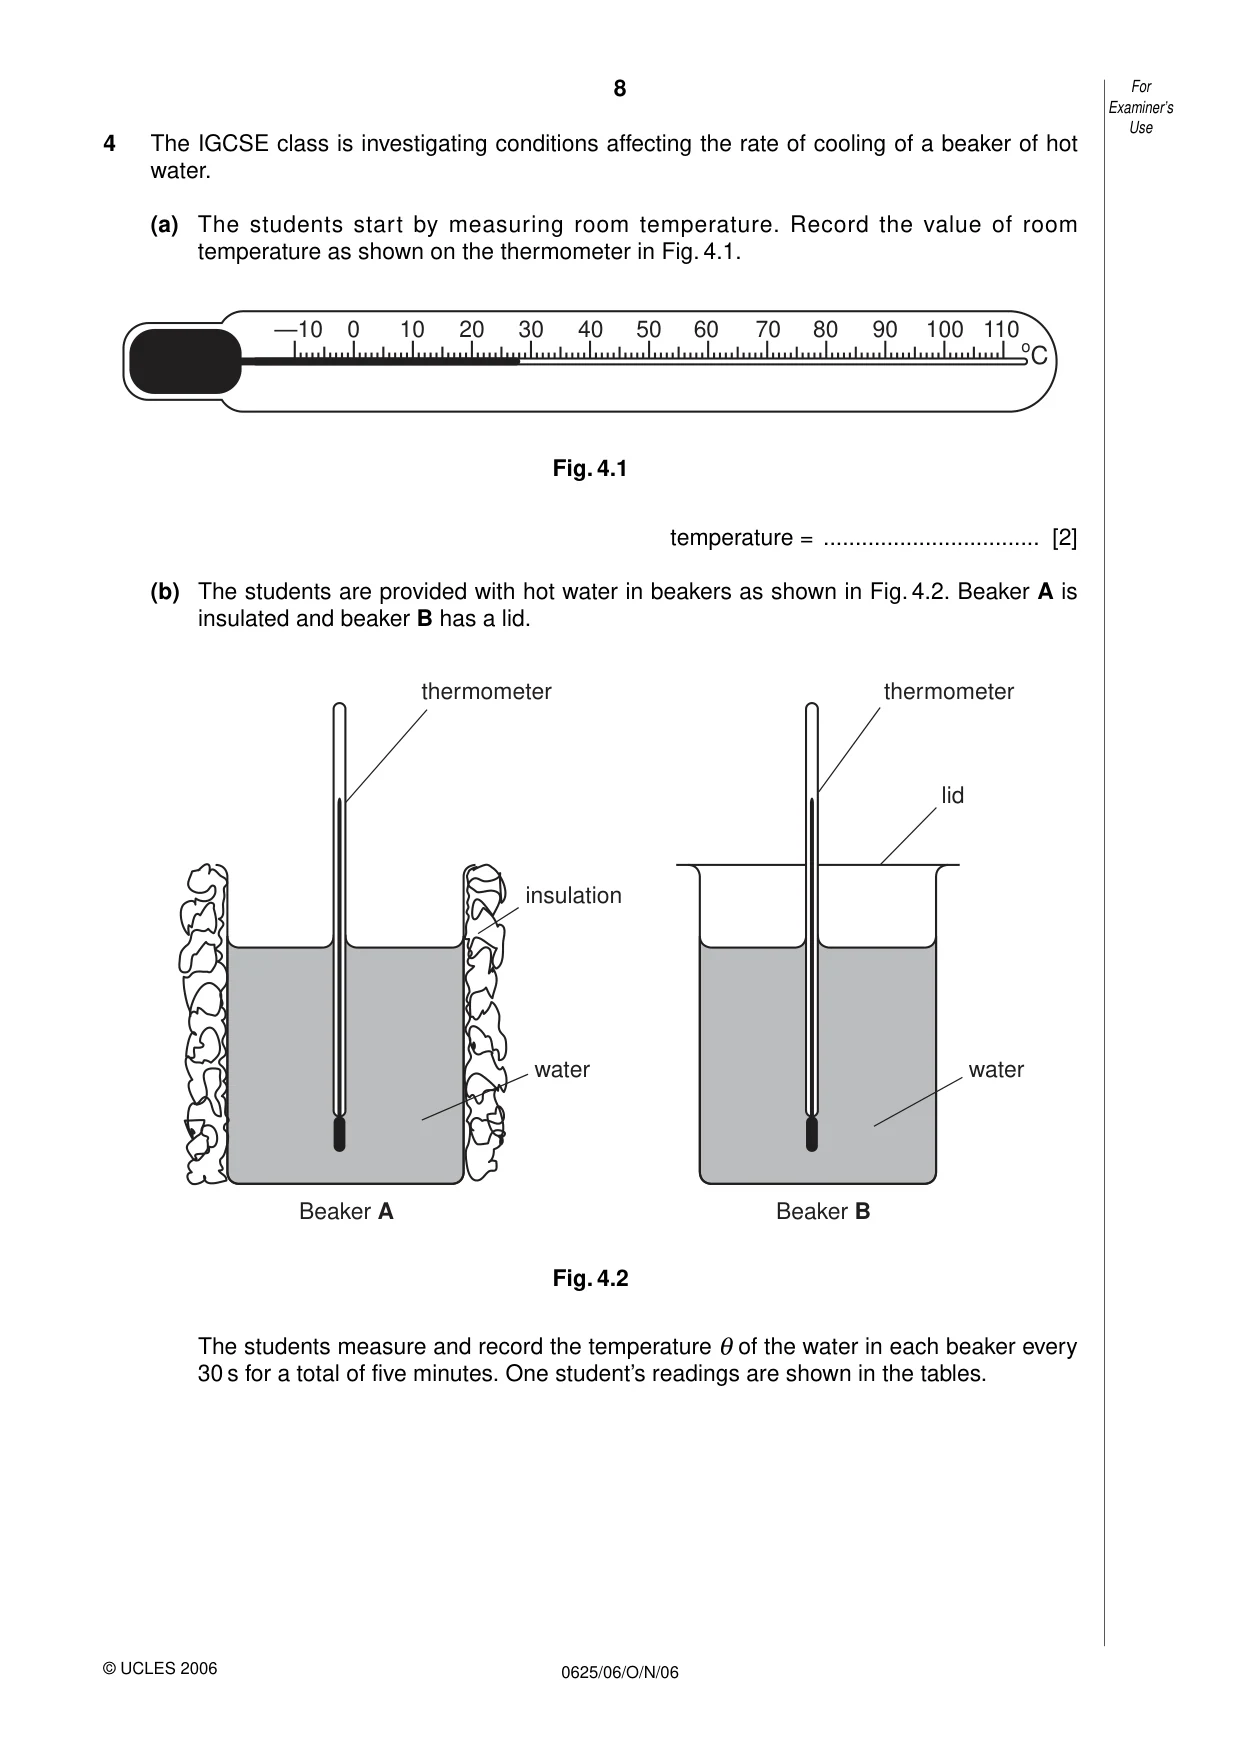
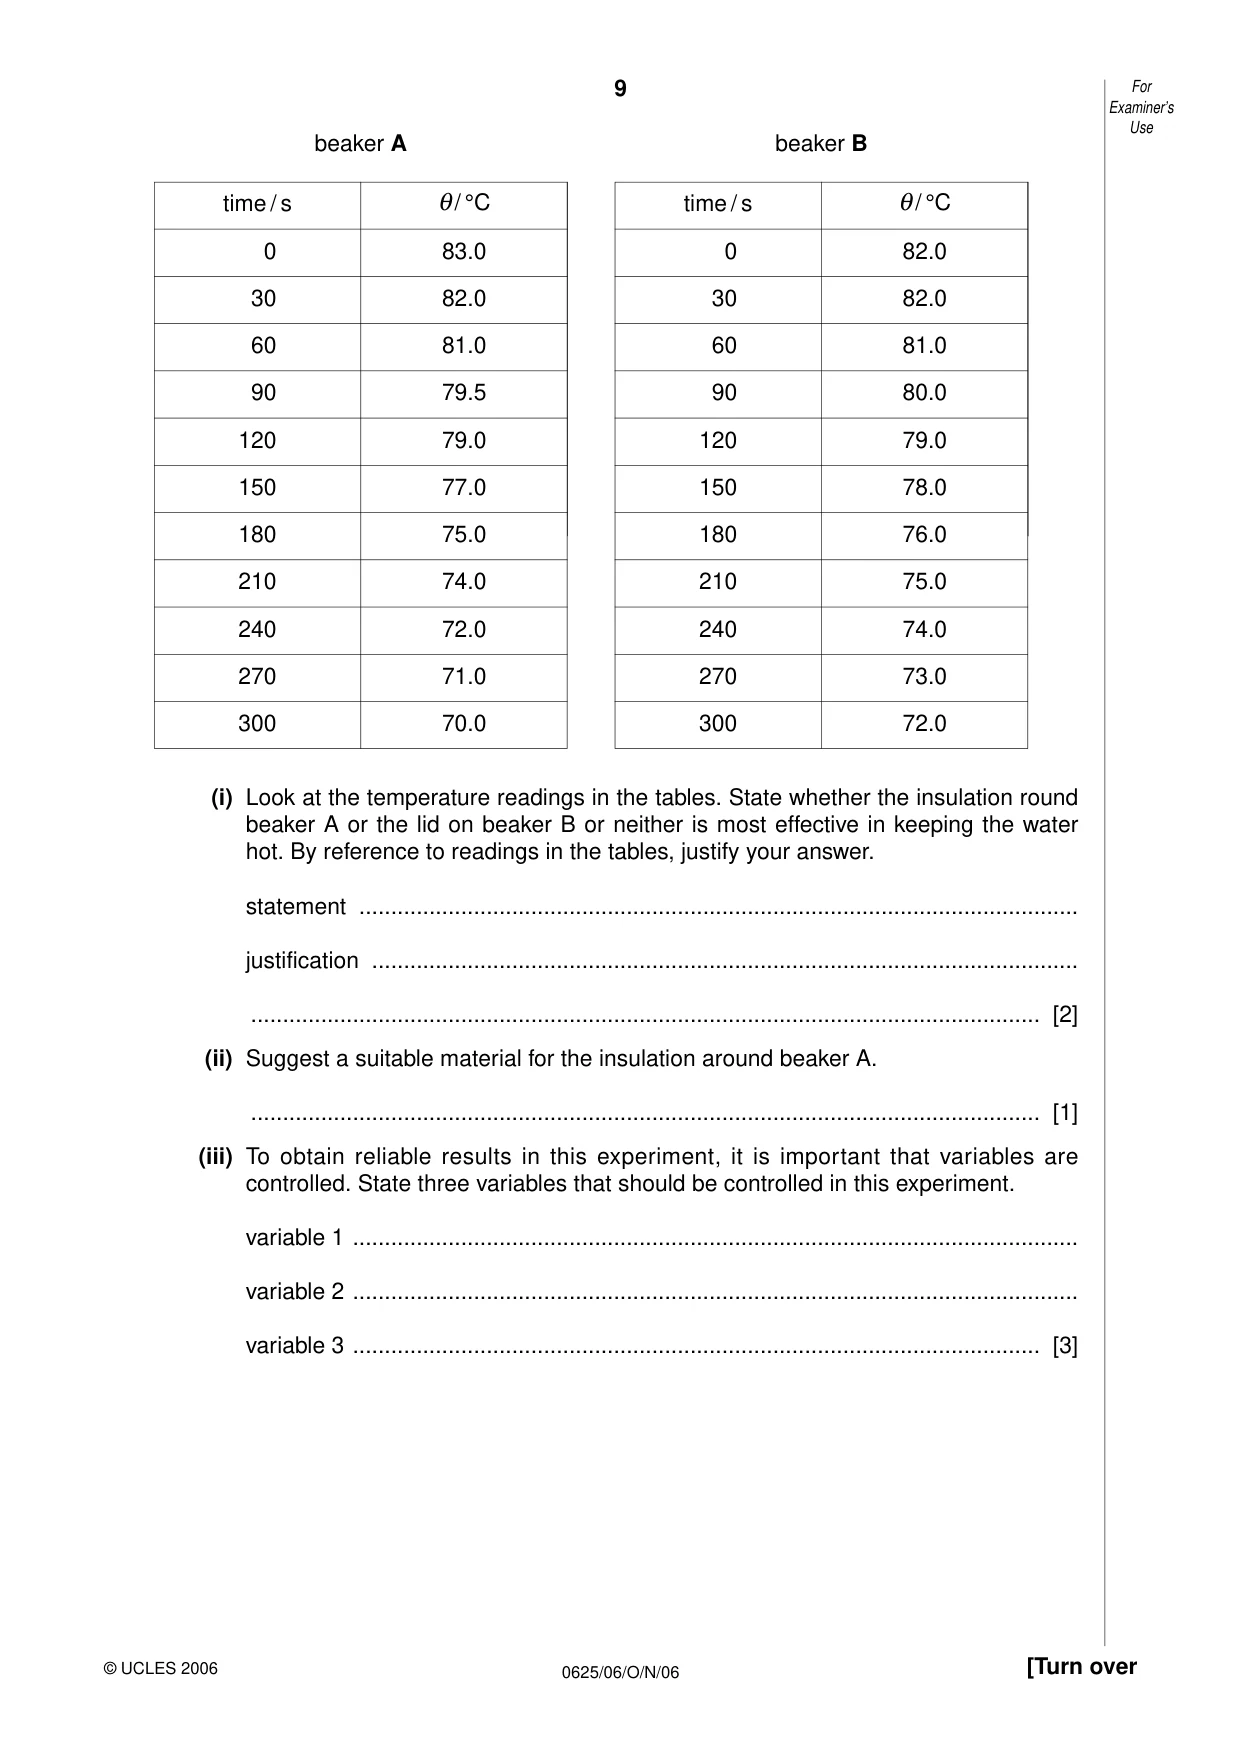
4 The IGCSE class is investigating conditions affecting the rate of cooling of a beaker of hot water. (a) The students start by measuring room temperature. Record the value of room temperature as shown on the thermometer in Fig. 4.1. —10 0 10 20 30 40 50 60 70 80 90 100 110 oC Fig. 4.1 temperature = .................................. [2] (b) The students are provided with hot water in beakers as shown in Fig. 4.2. Beaker A is insulated and beaker B has a lid. thermometer thermometer lid insulation water water Beaker A Beaker B Fig. 4.2 The students measure and record the temperature θ of the water in each beaker every 30 s for a total of five minutes. One student’s readings are shown in the tables. Examiner’s Use beaker A beaker B time / s θ/ °C time / s θ/ °C 0 83.0 0 82.0 30 82.0 30 82.0 60 81.0 60 81.0 90 79.5 90 80.0 120 79.0 120 79.0 150 77.0 150 78.0 180 75.0 180 76.0 210 74.0 210 75.0 240 72.0 240 74.0 270 71.0 270 73.0 300 70.0 300 72.0 (i) Look at the temperature readings in the tables. State whether the insulation round beaker A or the lid on beaker B or neither is most effective in keeping the water hot. By reference to readings in the tables, justify your answer. statement ................................................................................................................. justification ............................................................................................................... ............................................................................................................................ [2] (ii) Suggest a suitable material for the insulation around beaker A. ............................................................................................................................ [1] (iii) To obtain reliable results in this experiment, it is important that variables are controlled. State three variables that should be controlled in this experiment. variable 1 .................................................................................................................. variable 2 .................................................................................................................. variable 3 ............................................................................................................ [3]
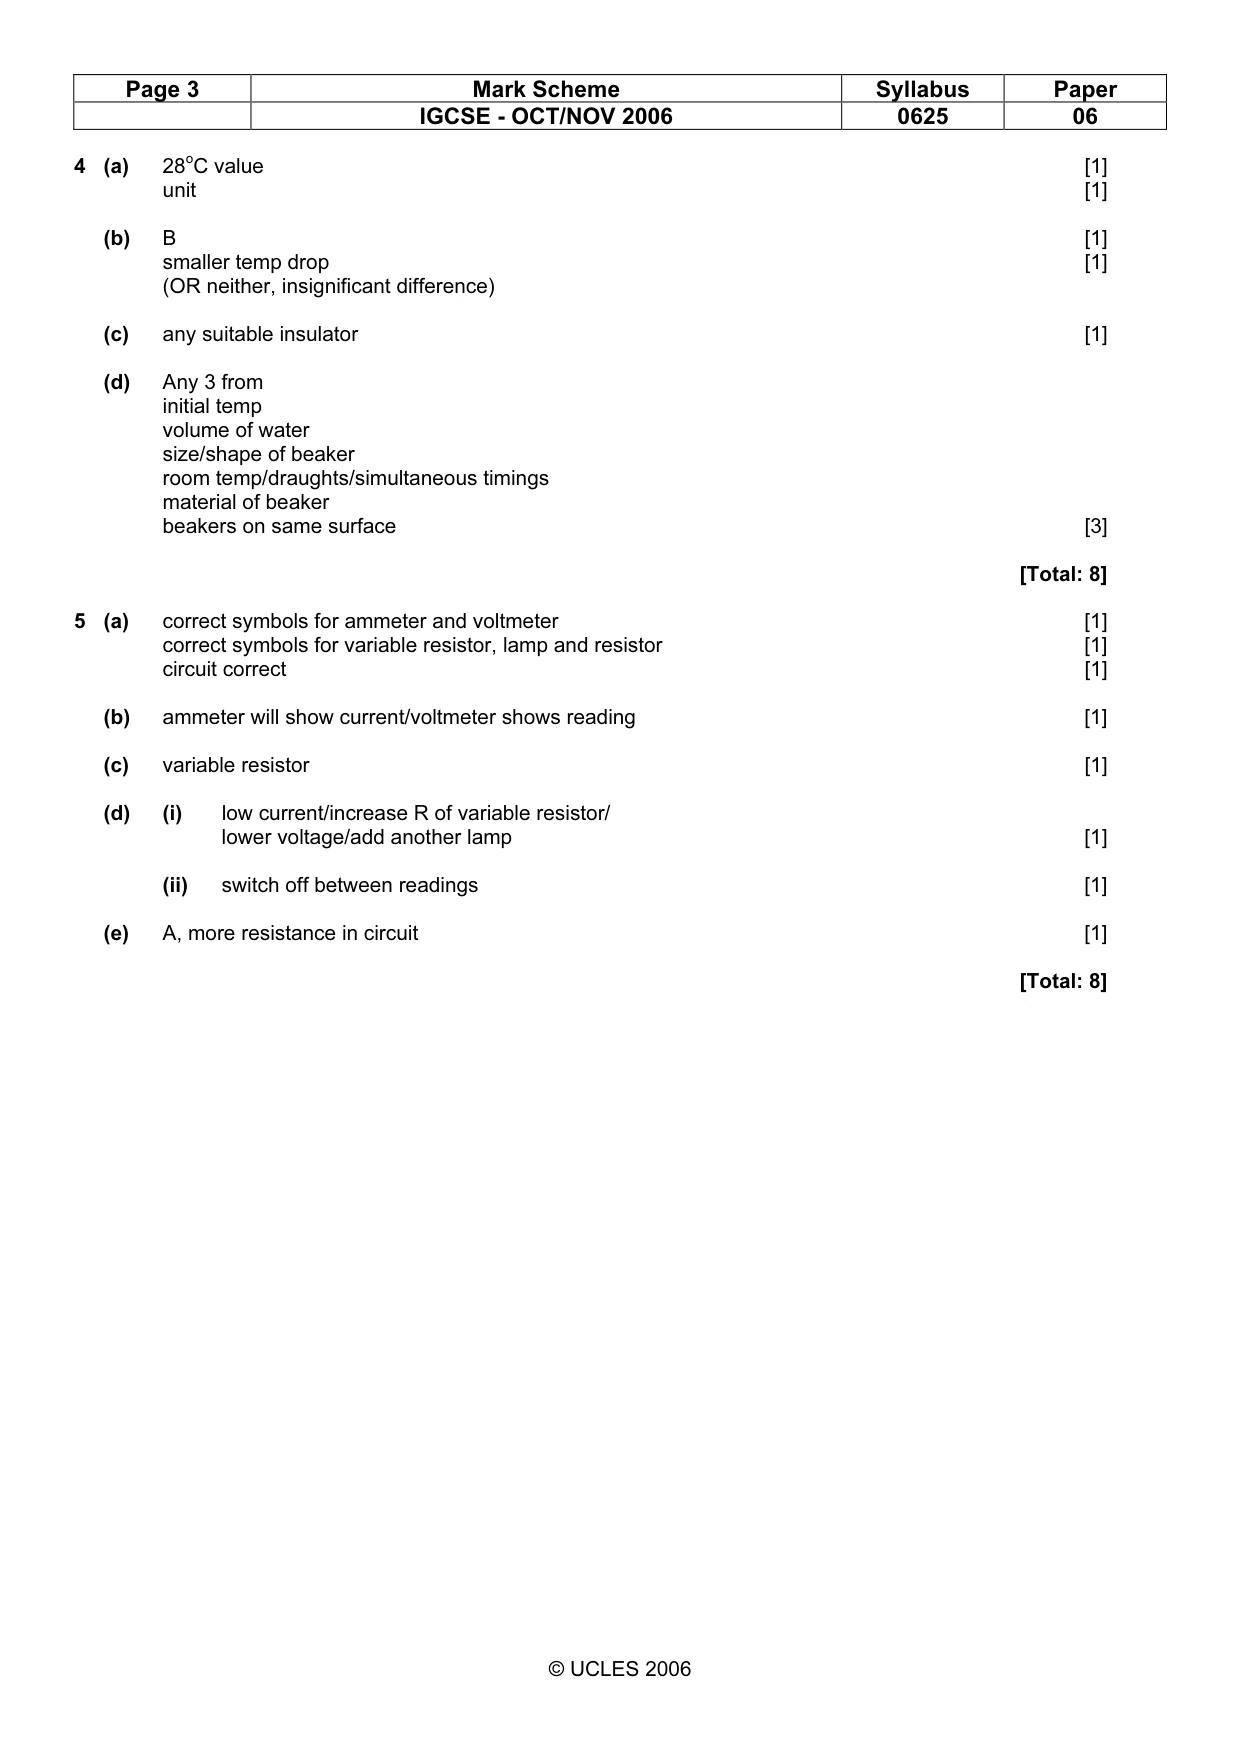
Mark scheme: 4 (a) 28oC value [1] unit [1] (b) B [1] smaller temp drop [1] (OR neither, insignificant difference) (c) any suitable insulator [1] (d) Any 3 from initial temp volume of water size/shape of beaker room temp/draughts/simultaneous timings material of beaker beakers on same surface [3] [Total: 8]
Q5 · A student is investigating the relationship between potential difference V across a…
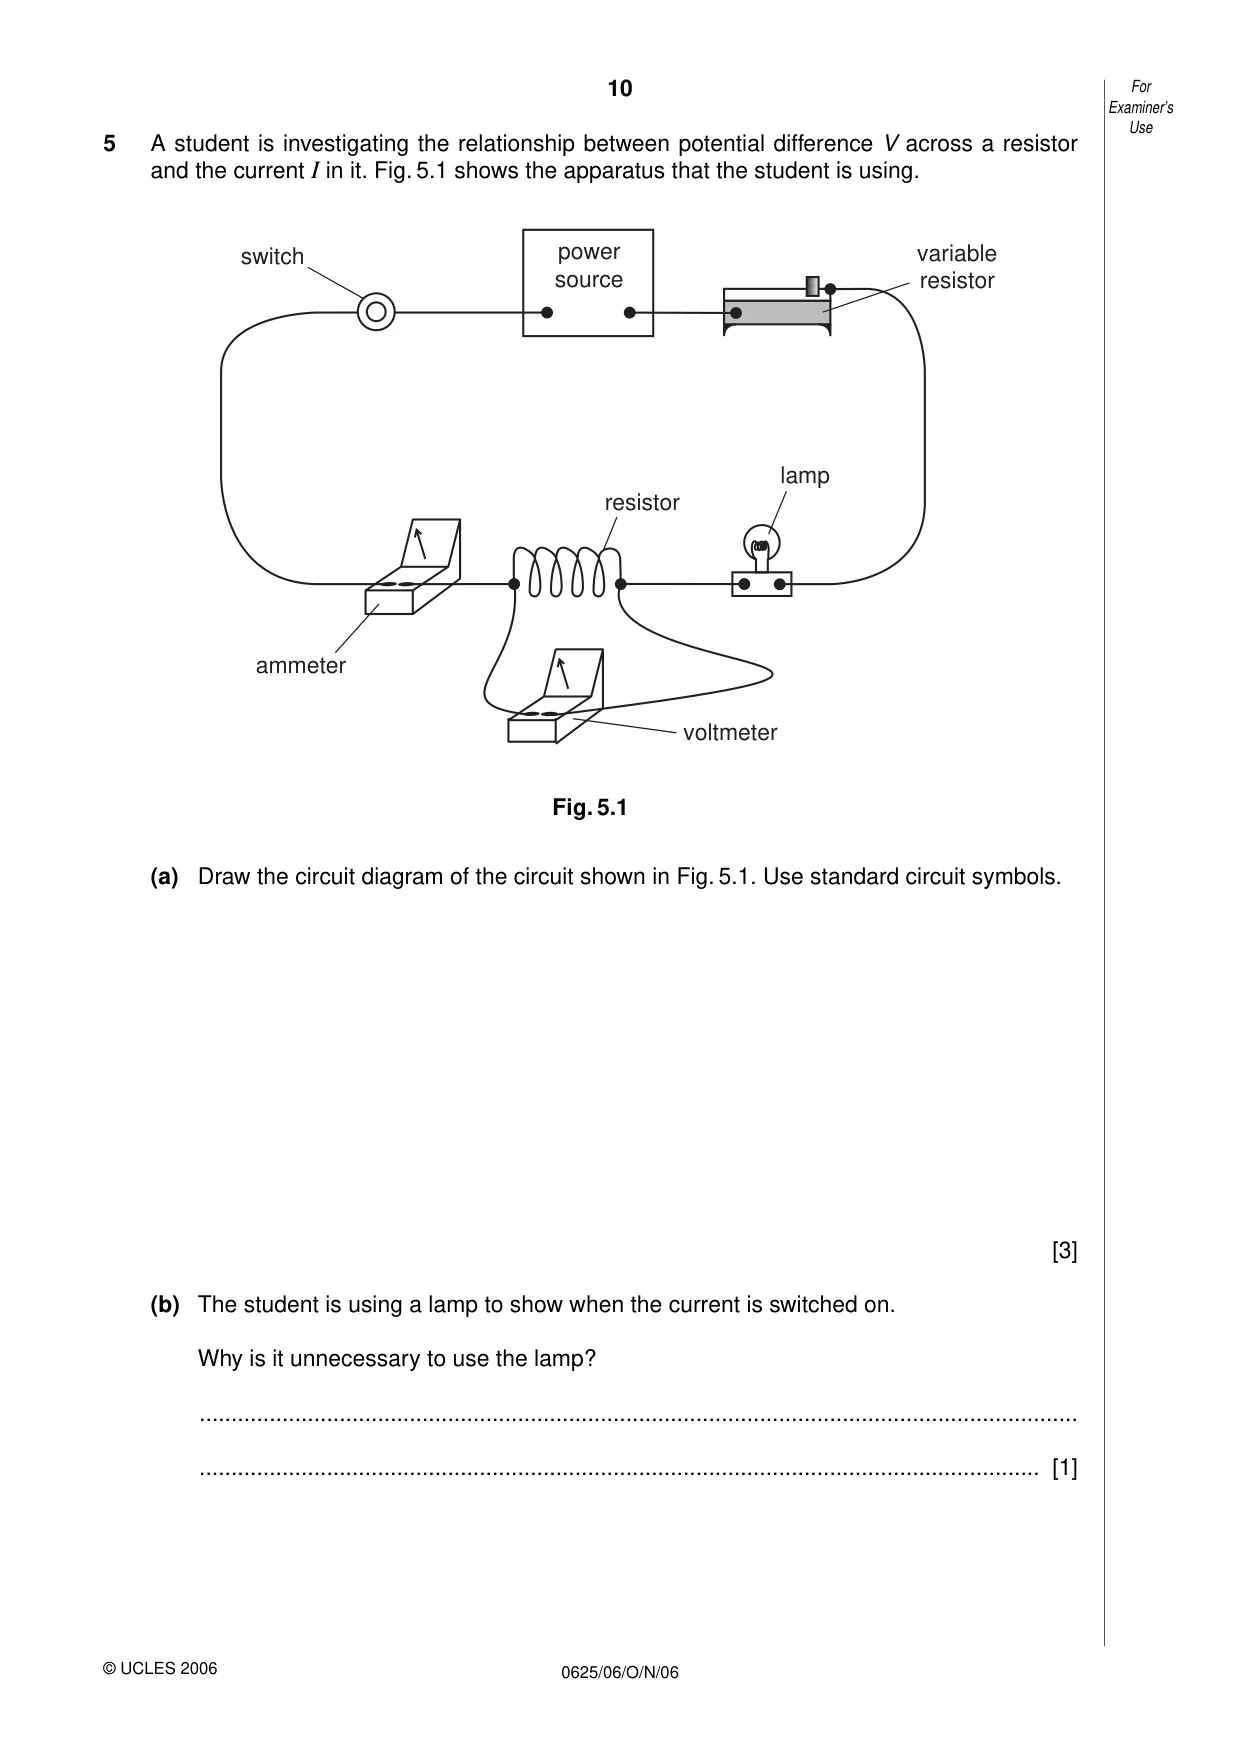
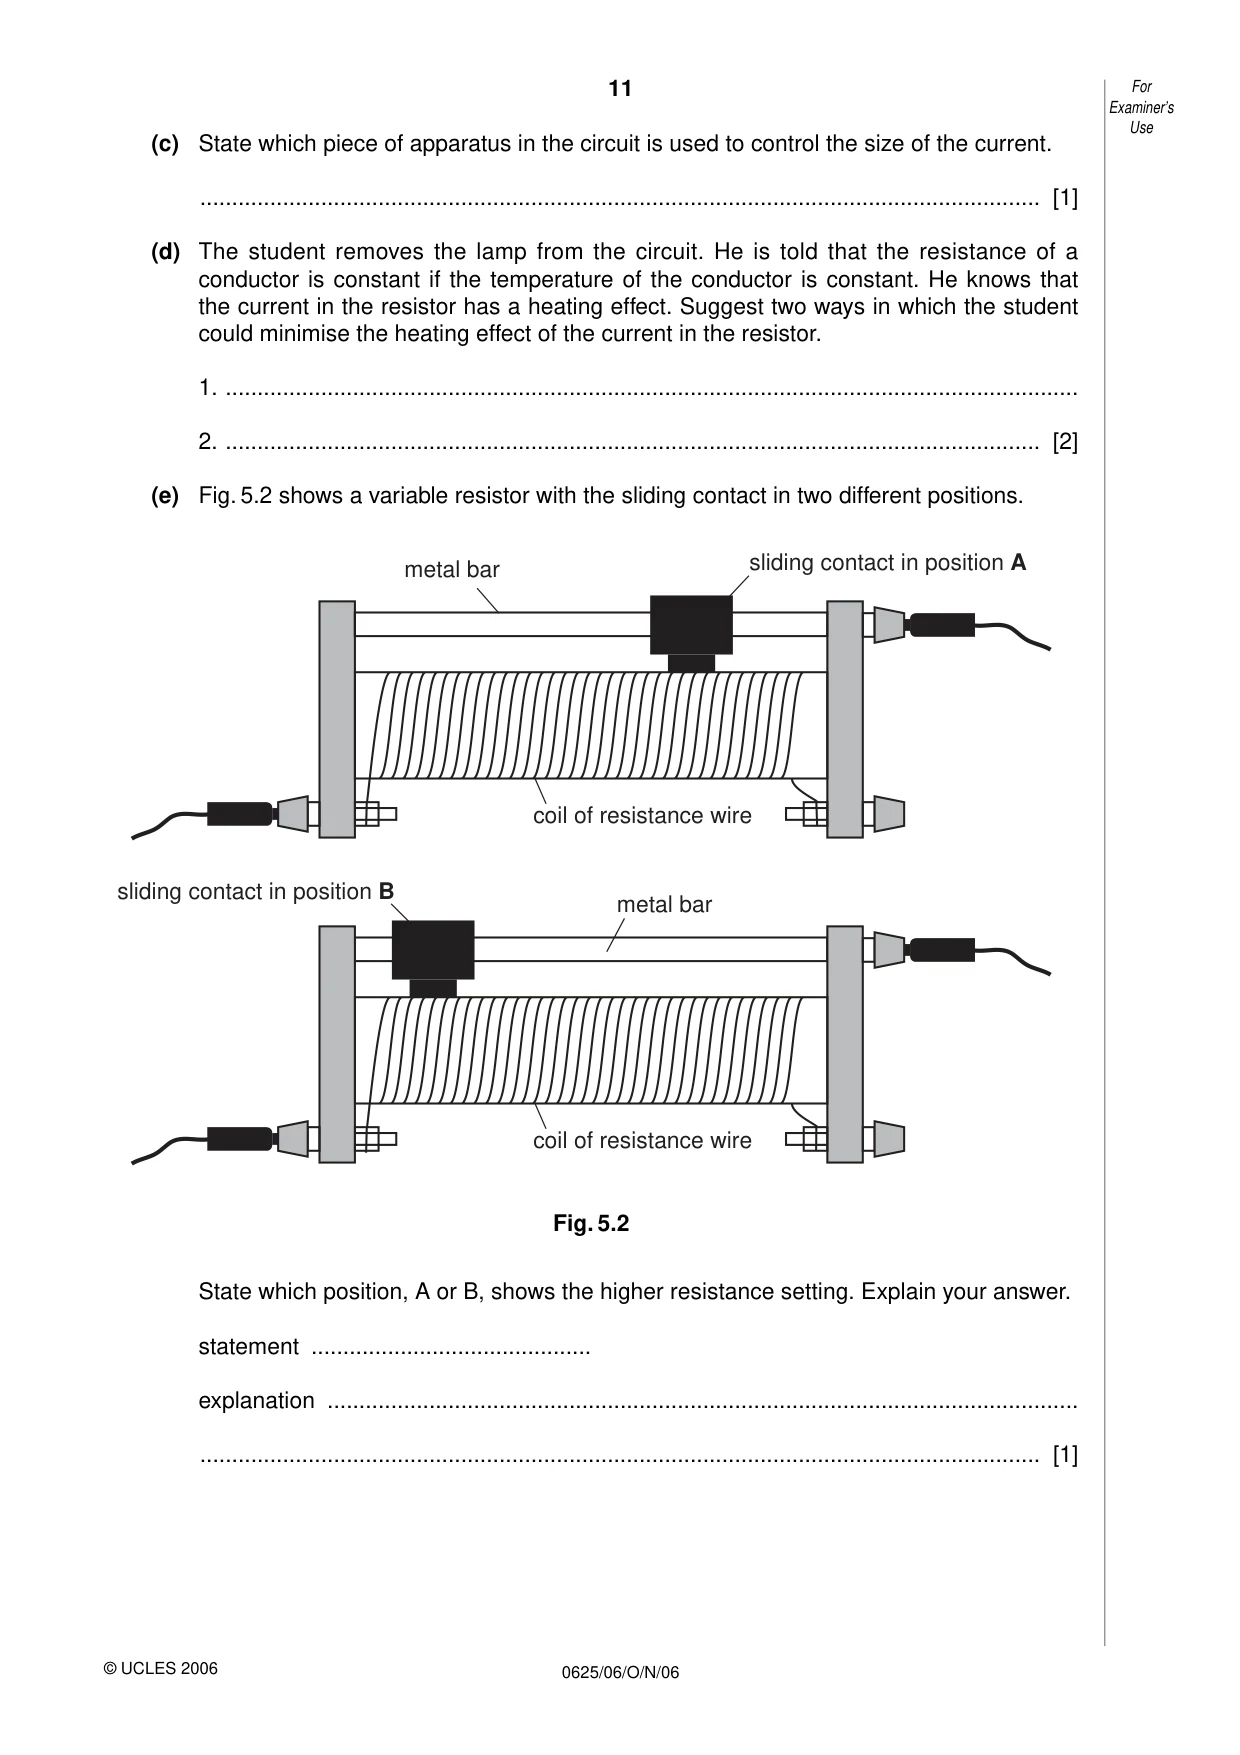
5 A student is investigating the relationship between potential difference V across a resistor and the current I in it. Fig. 5.1 shows the apparatus that the student is using. switch power variable source resistor lamp resistor ammeter voltmeter Fig. 5.1 (a) Draw the circuit diagram of the circuit shown in Fig. 5.1. Use standard circuit symbols. [3] (b) The student is using a lamp to show when the current is switched on. Why is it unnecessary to use the lamp? .......................................................................................................................................... .................................................................................................................................... [1] Examiner’s Use (c) State which piece of apparatus in the circuit is used to control the size of the current. .................................................................................................................................... [1] (d) The student removes the lamp from the circuit. He is told that the resistance of a conductor is constant if the temperature of the conductor is constant. He knows that the current in the resistor has a heating effect. Suggest two ways in which the student could minimise the heating effect of the current in the resistor. 1. ...................................................................................................................................... 2. ................................................................................................................................ [2] (e) Fig. 5.2 shows a variable resistor with the sliding contact in two different positions. sliding contact in position A metal bar coil of resistance wire sliding contact in position B metal bar coil of resistance wire Fig. 5.2 State which position, A or B, shows the higher resistance setting. Explain your answer. statement ............................................ explanation ...................................................................................................................... .................................................................................................................................... [1]
Mark scheme: 5 (a) correct symbols for ammeter and voltmeter [1] correct symbols for variable resistor, lamp and resistor [1] circuit correct [1] (b) ammeter will show current/voltmeter shows reading [1] (c) variable resistor [1] (d) (i) low current/increase R of variable resistor/ lower voltage/add another lamp [1] (ii) switch off between readings [1] (e) A, more resistance in circuit [1] [Total: 8]
What was in this paper
The subtopics covered by these 5 questions, and how many questions each got. Open one in a new tab to see every Cambridge question on it.
What you needed in this session
Cambridge’s own grade thresholds for 2006 Oct/Nov, Paper 6 · Variant 1. A higher threshold means an easier paper — the bar moves with how the cohort did.