Cambridge IGCSE Physical Science 0652 — 2018 Oct/Nov Paper 6 · Variant 1
0652/61/O/N/18 · 6 questions · 60 marks · ≈68 min
The question paper and its mark scheme, free to read here and free to download. This is Cambridge’s own paper, exactly as it was sat.
Question paper28 pages



Mark scheme7 pages
Answers below. Sit the paper first if you are practising.
Questions as text
Q1 · Solid H is a mixture of element J and compound K
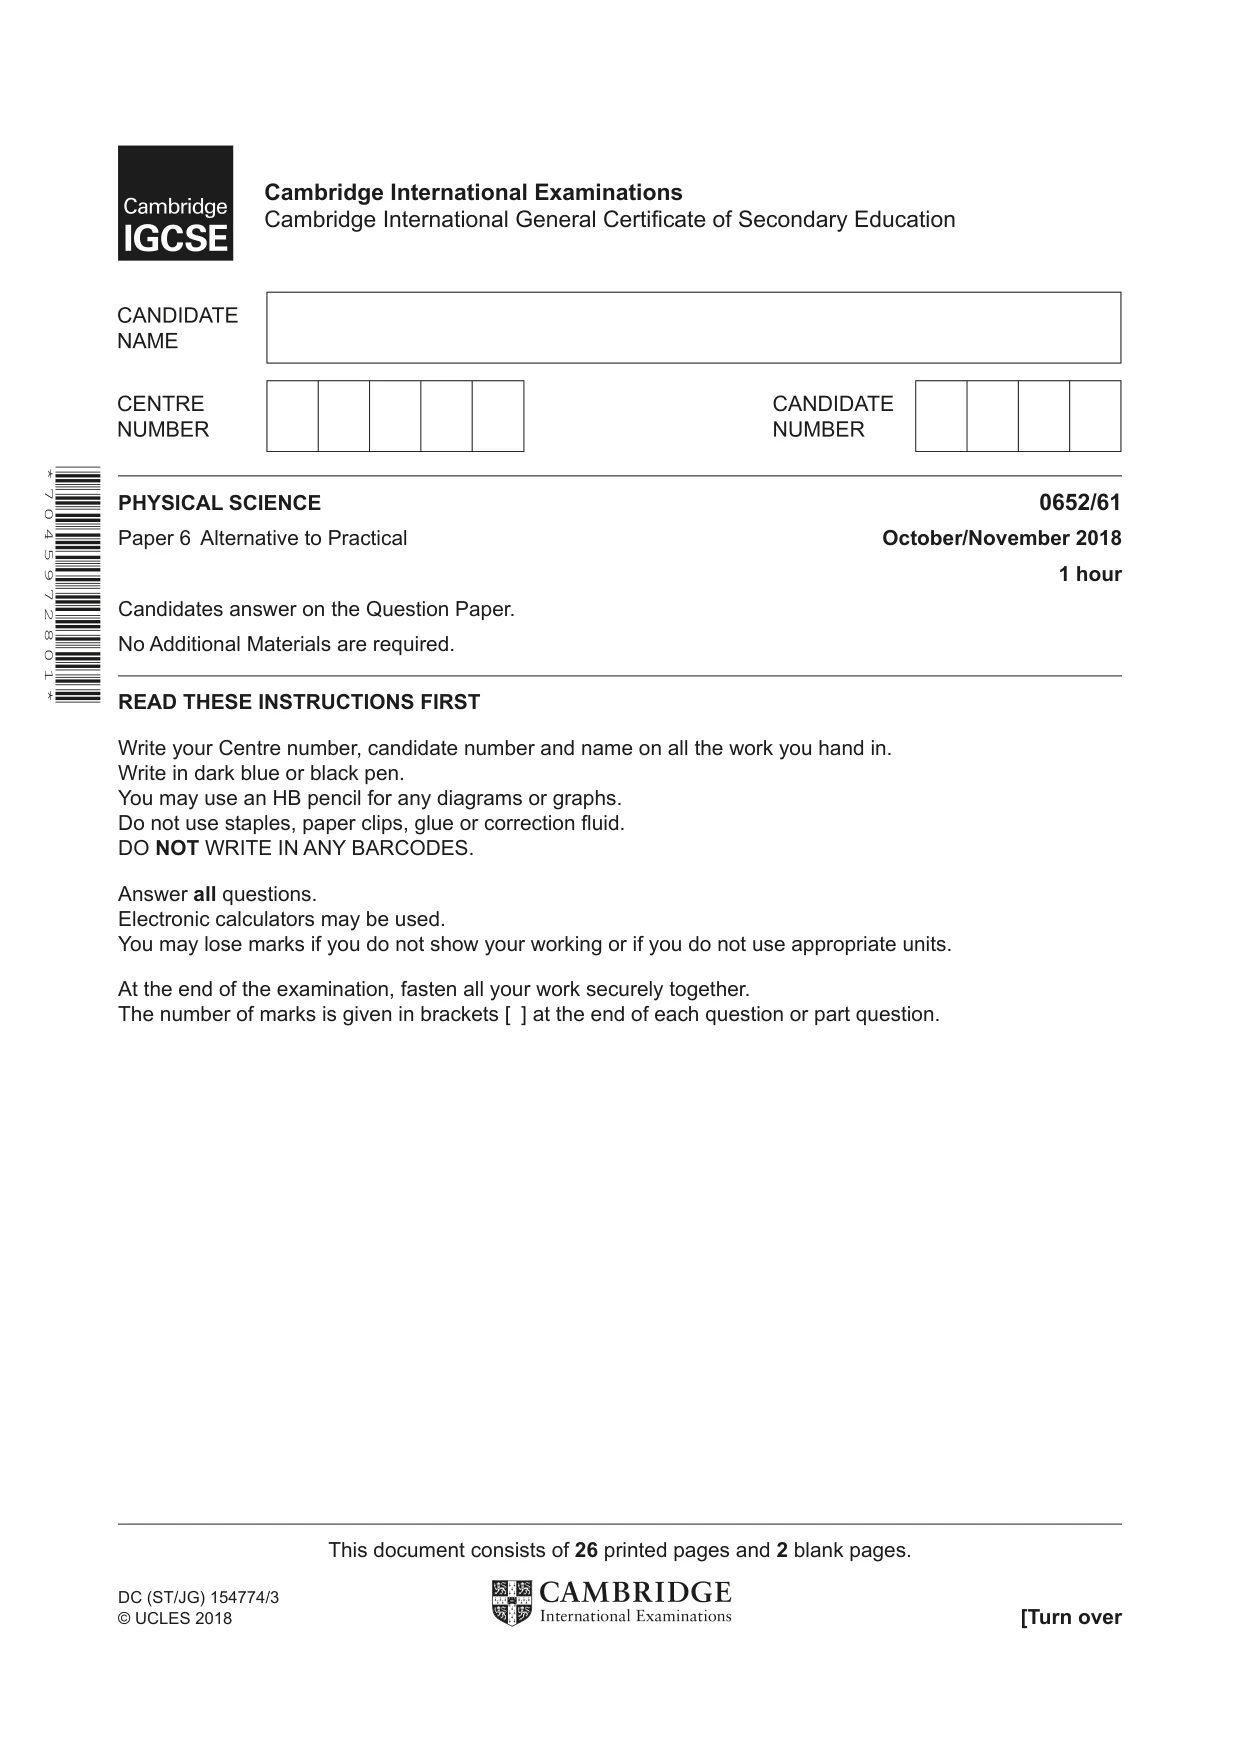
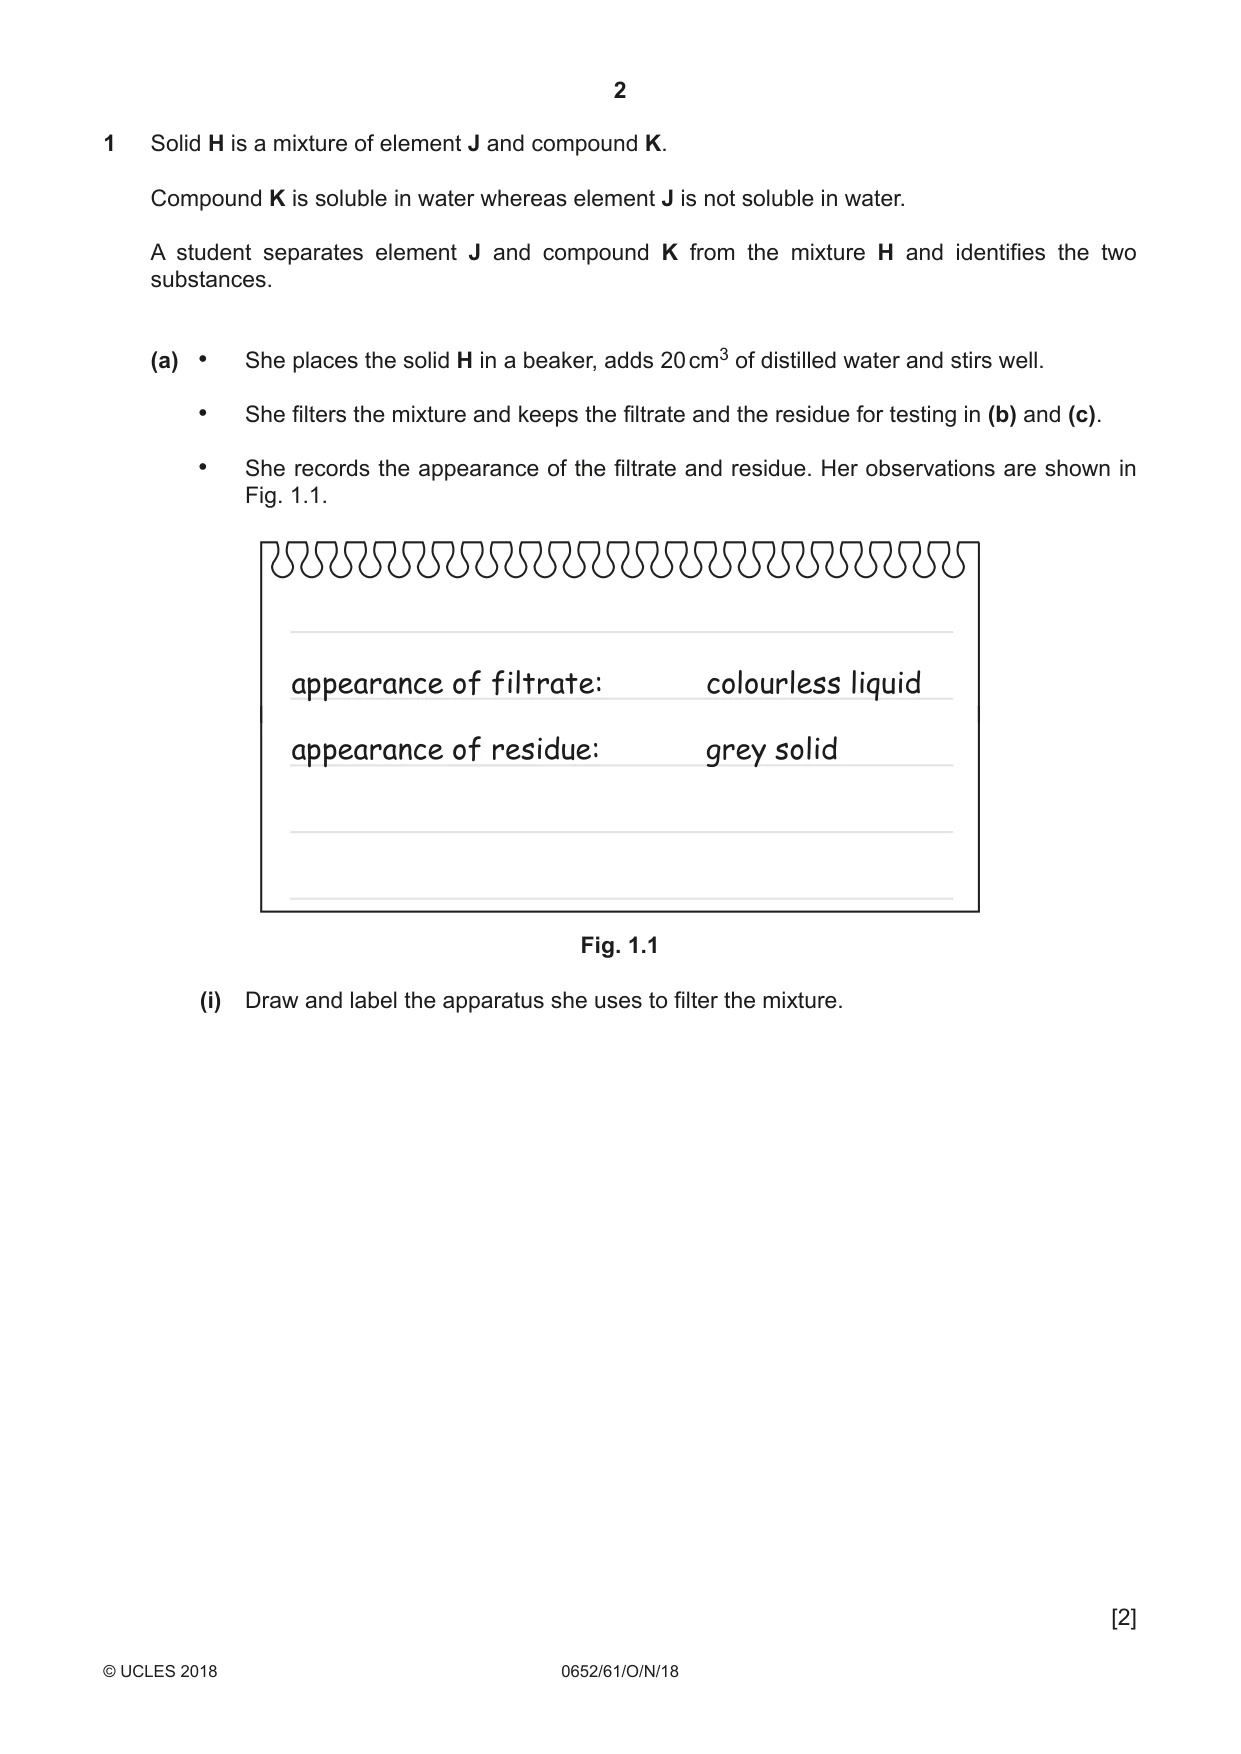
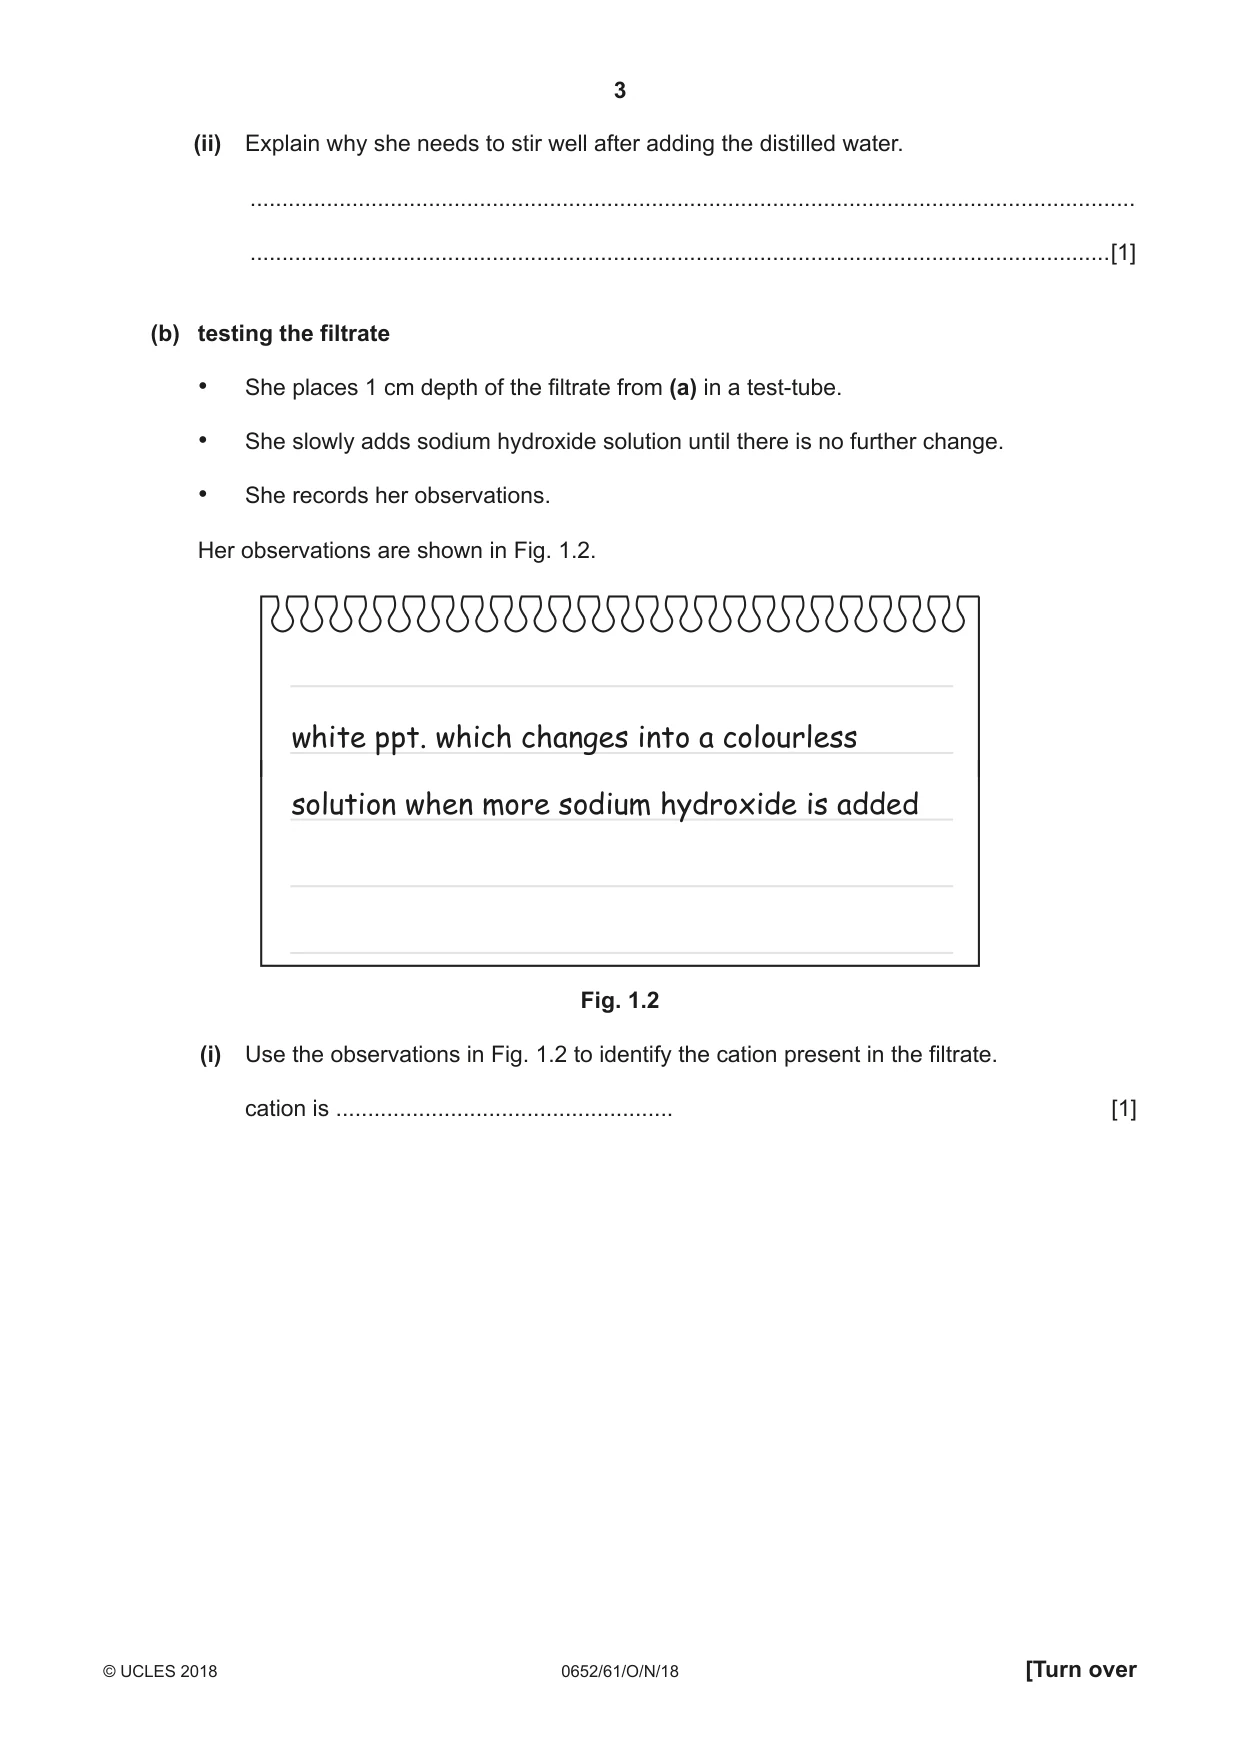
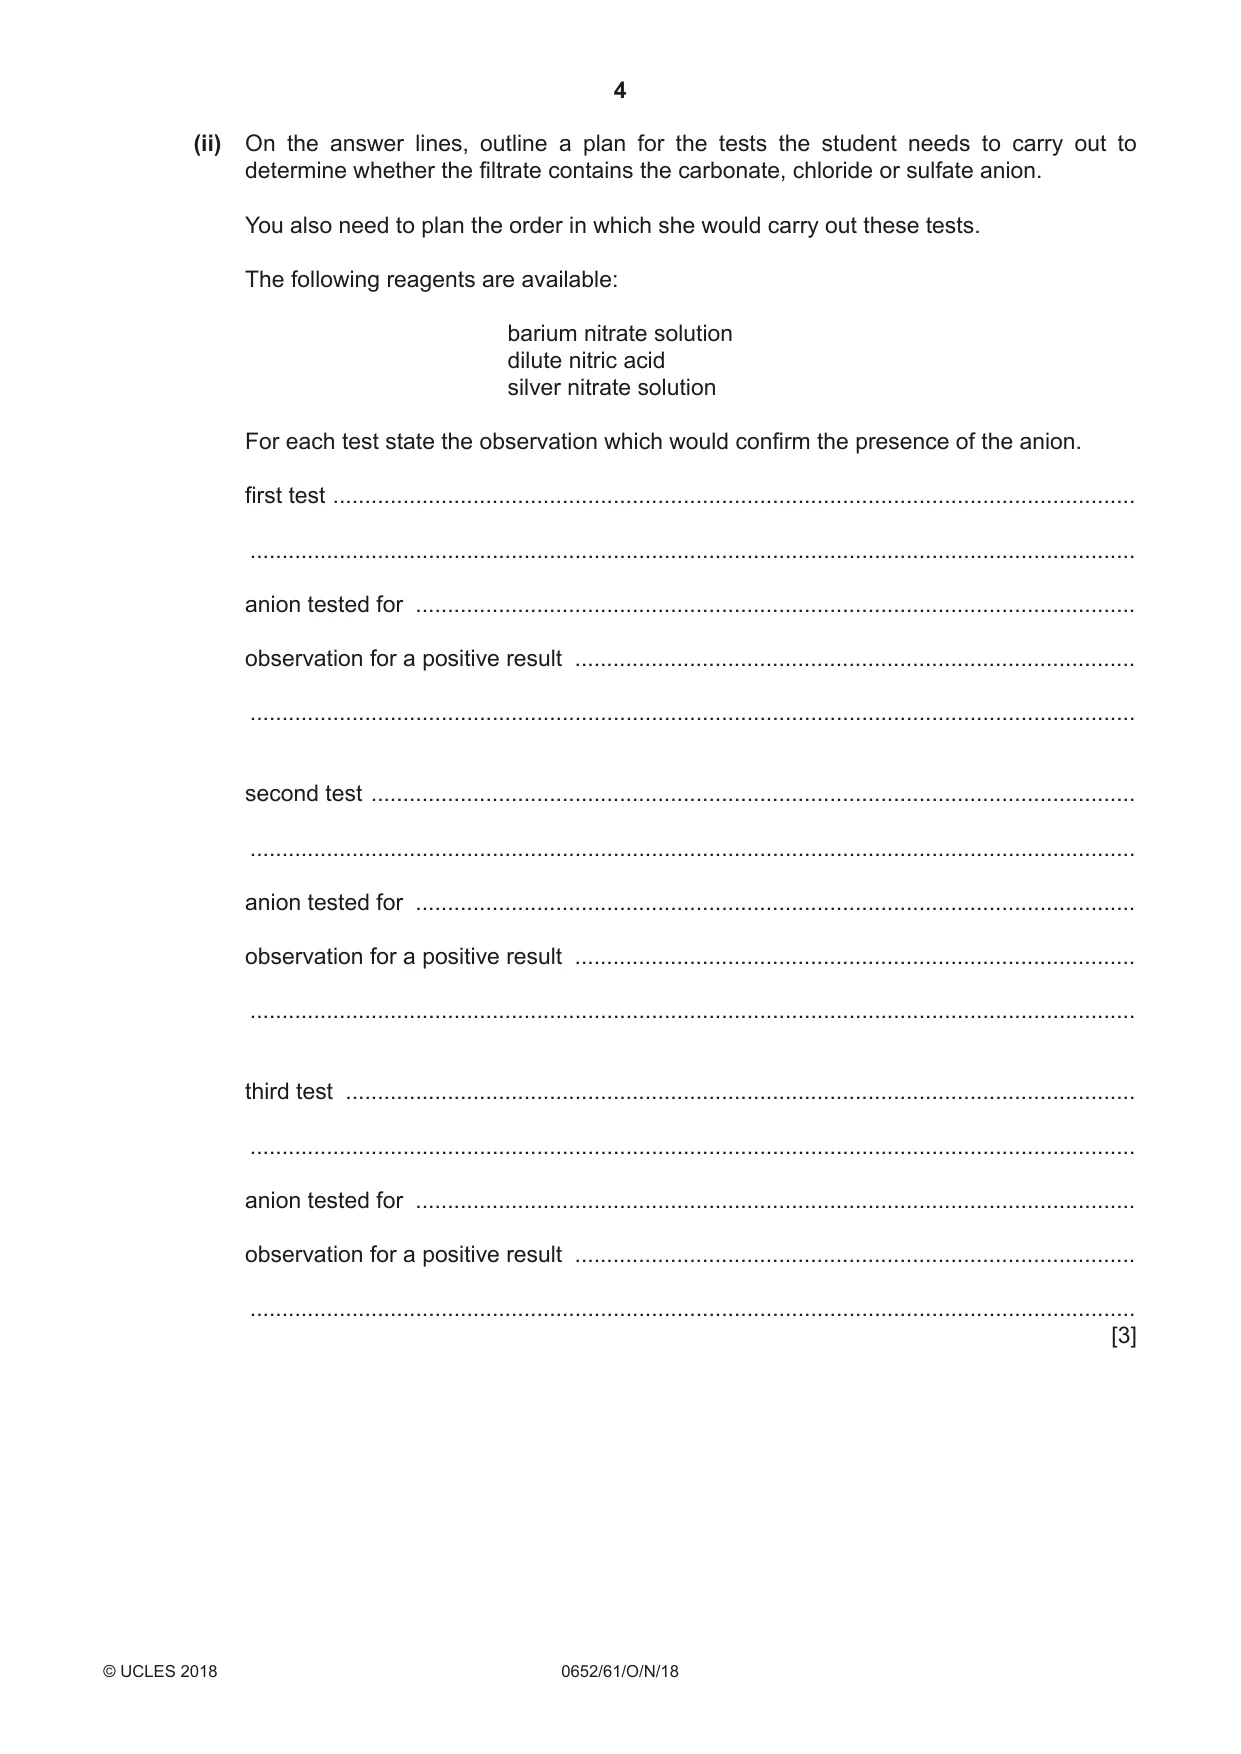
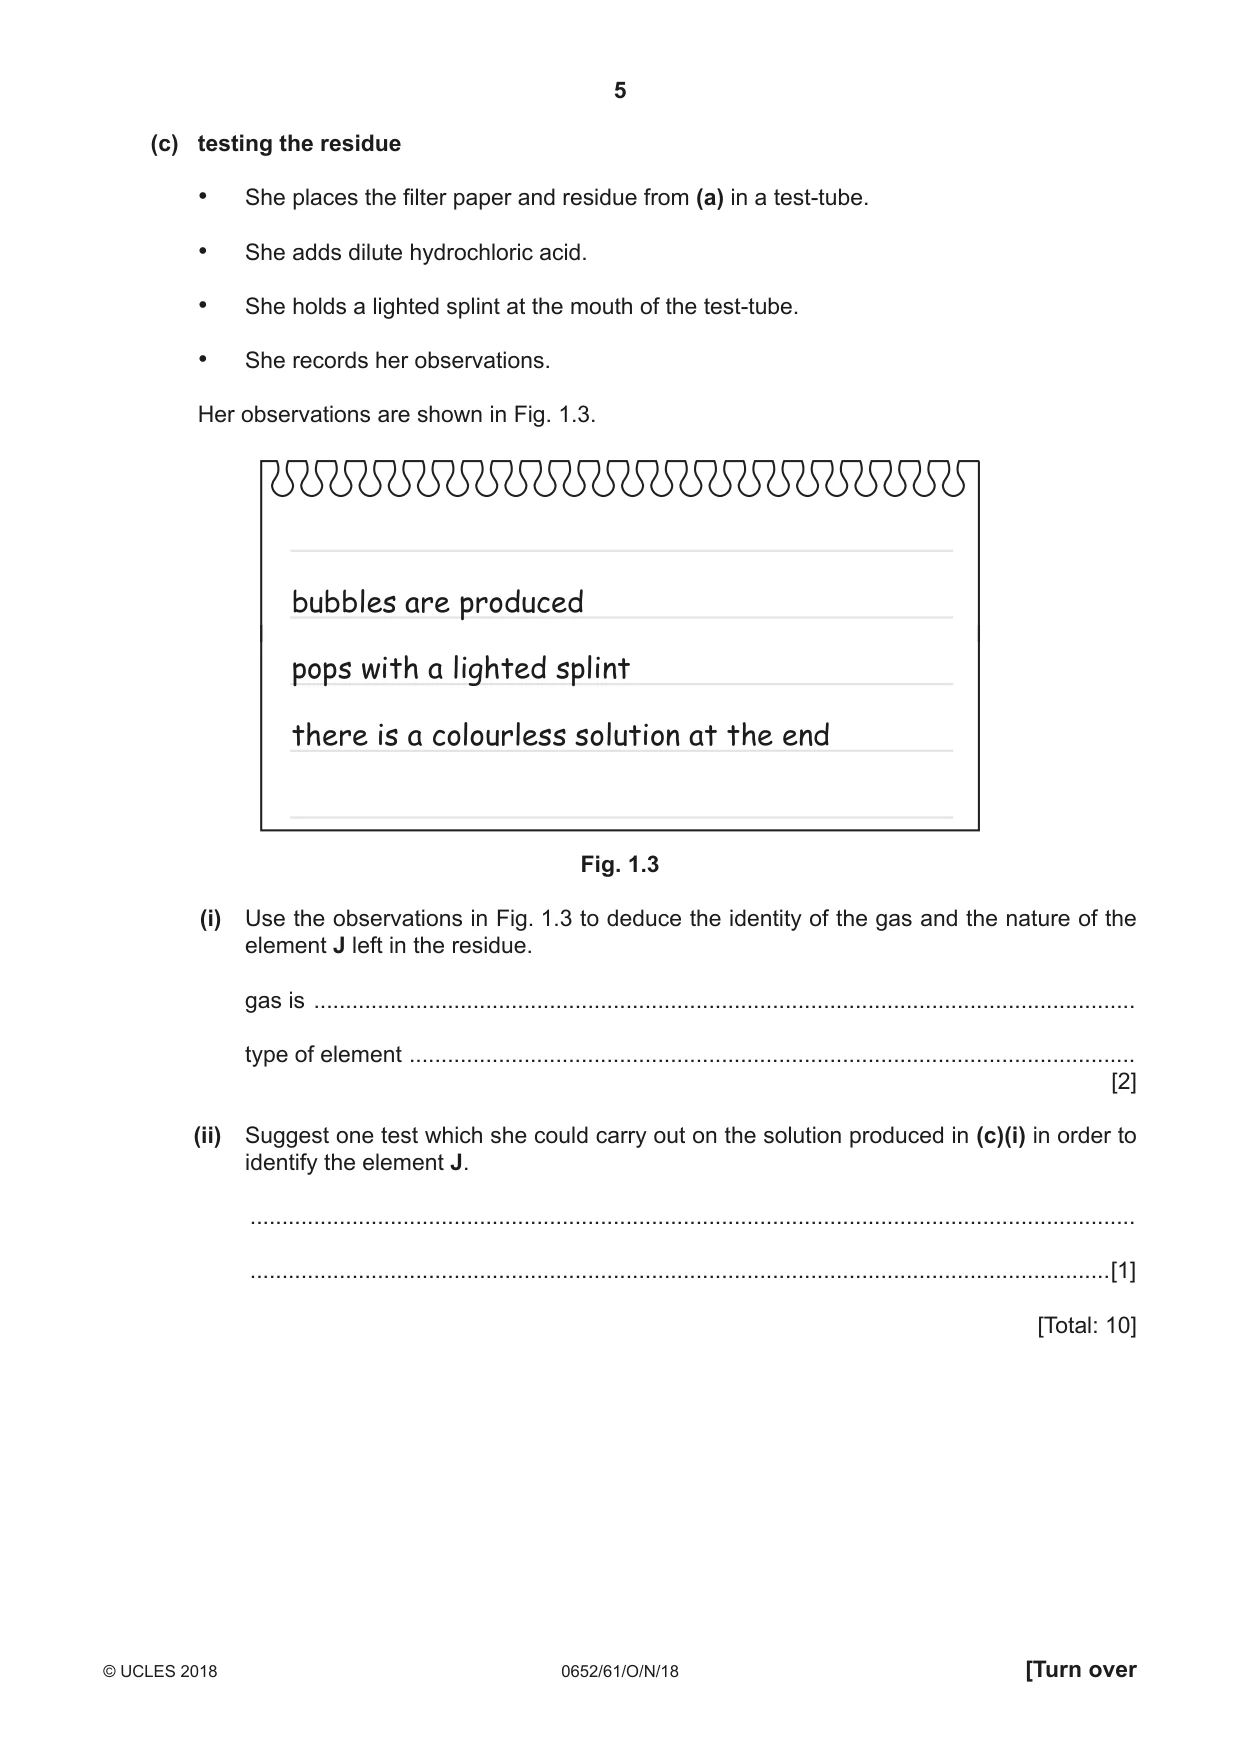
1 Solid H is a mixture of element J and compound K. Compound K is soluble in water whereas element J is not soluble in water. A student separates element J and compound K from the mixture H and identifies the two substances. (a) • She places the solid H in a beaker, adds 20 cm3 of distilled water and stirs well. • She filters the mixture and keeps the filtrate and the residue for testing in (b) and (c). • She records the appearance of the filtrate and residue. Her observations are shown in Fig. 1.1. appearance of filtrate: colourless liquid appearance of residue: grey solid Fig. 1.1 (i) Draw and label the apparatus she uses to filter the mixture. [2] (ii) Explain why she needs to stir well after adding the distilled water. ........................................................................................................................................... .......................................................................................................................................[1] (b) testing the filtrate • She places 1 cm depth of the filtrate from (a) in a test-tube. • She slowly adds sodium hydroxide solution until there is no further change. • She records her observations. Her observations are shown in Fig. 1.2. white ppt. which changes into a colourless solution when more sodium hydroxide is added Fig. 1.2 (i) Use the observations in Fig. 1.2 to identify the cation present in the filtrate. cation is ..................................................... [1] (ii) On the answer lines, outline a plan for the tests the student needs to carry out to determine whether the filtrate contains the carbonate, chloride or sulfate anion. You also need to plan the order in which she would carry out these tests. The following reagents are available: barium nitrate solution dilute nitric acid silver nitrate solution For each test state the observation which would confirm the presence of the anion. first test .............................................................................................................................. ........................................................................................................................................... anion tested for ................................................................................................................. observation for a positive result ........................................................................................ ........................................................................................................................................... second test ........................................................................................................................ ........................................................................................................................................... anion tested for ................................................................................................................. observation for a positive result ........................................................................................ ........................................................................................................................................... third test ............................................................................................................................ ........................................................................................................................................... anion tested for ................................................................................................................. observation for a positive result ........................................................................................ ........................................................................................................................................... [3] (c) testing the residue • She places the filter paper and residue from (a) in a test-tube. • She adds dilute hydrochloric acid. • She holds a lighted splint at the mouth of the test-tube. • She records her observations. Her observations are shown in Fig. 1.3. bubbles are produced pops with a lighted splint there is a colourless solution at the end Fig. 1.3 (i) Use the observations in Fig. 1.3 to deduce the identity of the gas and the nature of the element J left in the residue. gas is ................................................................................................................................. type of element .................................................................................................................. [2] (ii) Suggest one test which she could carry out on the solution produced in (c)(i) in order to identify the element J. ........................................................................................................................................... .......................................................................................................................................[1] [Total: 10]
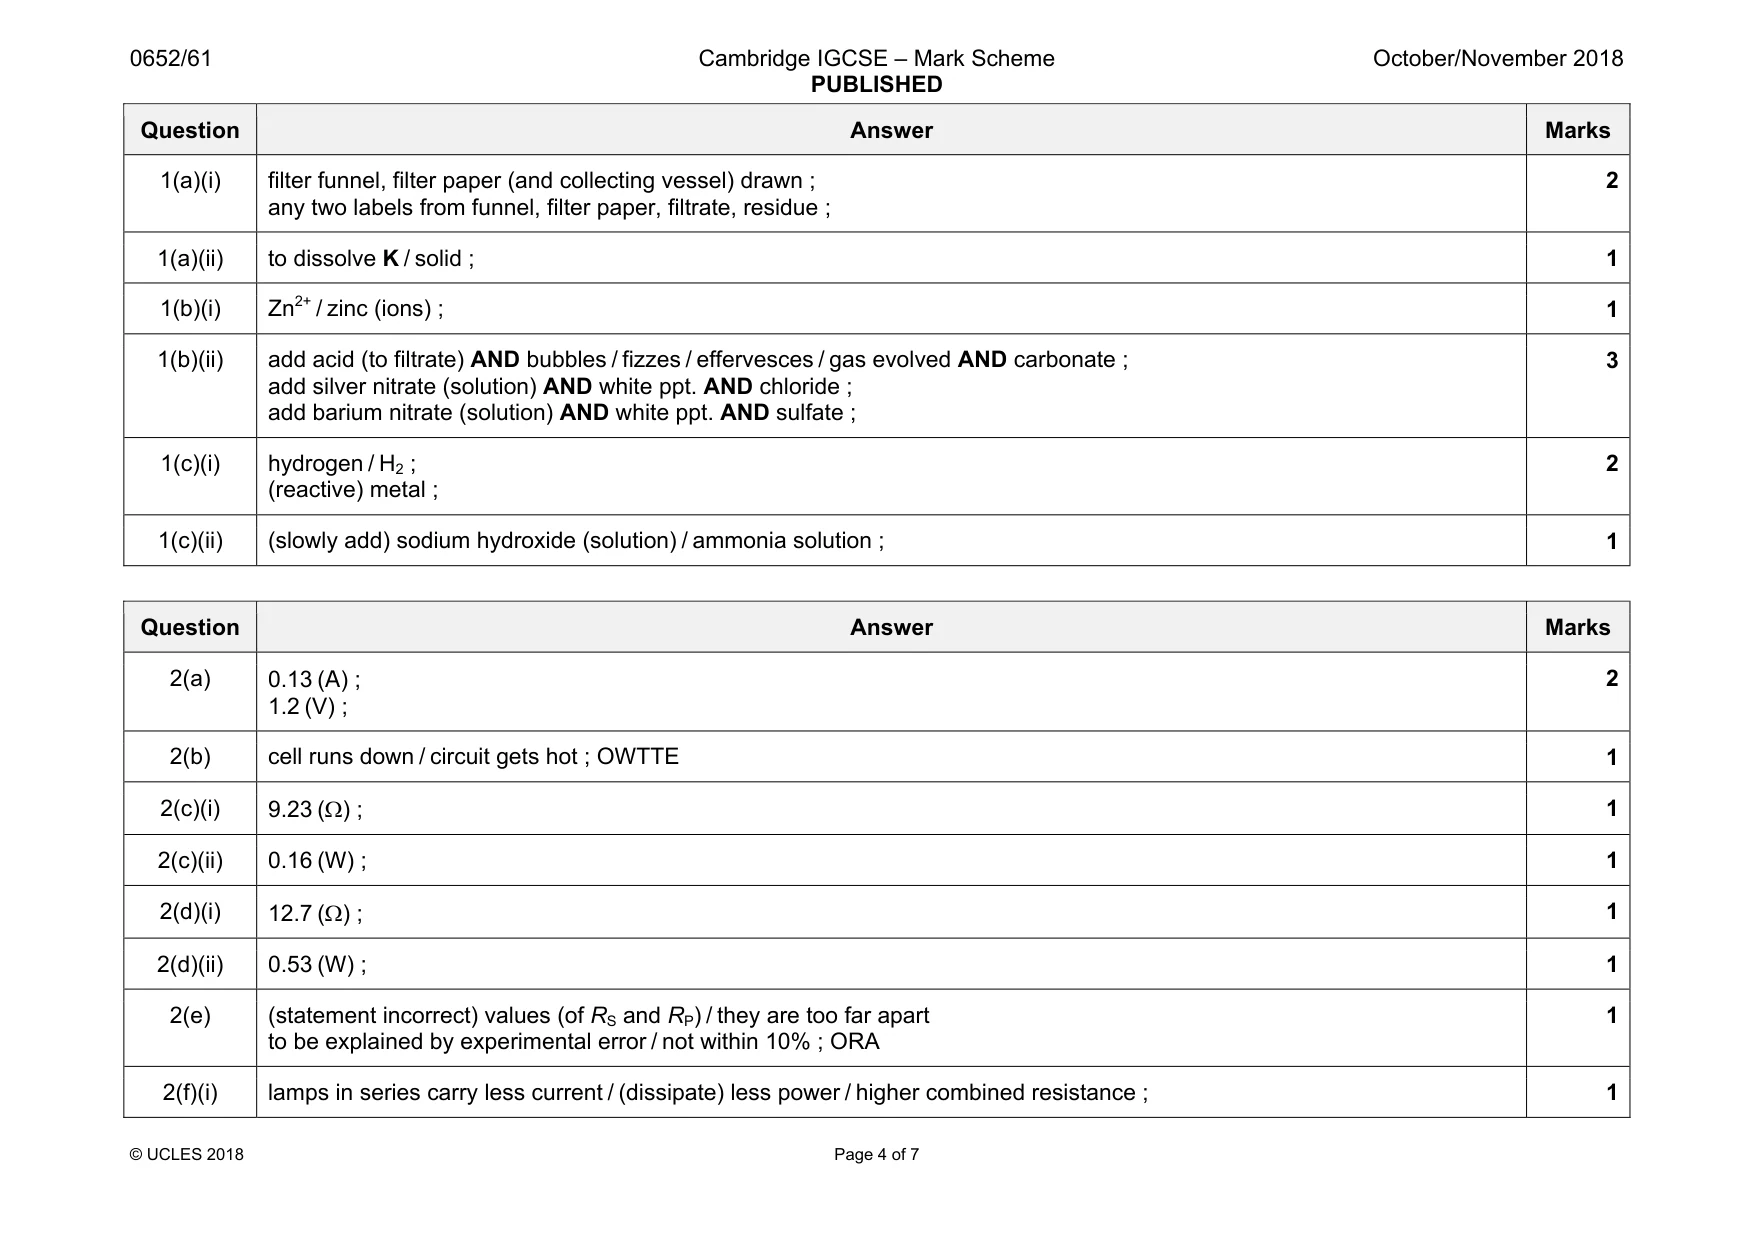
Mark scheme: 1(a)(i) filter funnel, filter paper (and collecting vessel) drawn ; any two labels from funnel, filter paper, filtrate, residue ; 2 1(a)(ii) to dissolve K / solid ; 1 1(b)(i) Zn2+ / zinc (ions) ; 1 1(b)(ii) add acid (to filtrate) AND bubbles / fizzes / effervesces / gas evolved AND carbonate ; add silver nitrate (solution) AND white ppt. AND chloride ; add barium nitrate (solution) AND white ppt. AND sulfate ; 3 1(c)(i) hydrogen / H2 ; (reactive) metal ; 2 1(c)(ii) (slowly add) sodium hydroxide (solution) / ammonia solution ; 1
Q2 · A student investigates the resistance and the power output of two lamps, L and M, first…
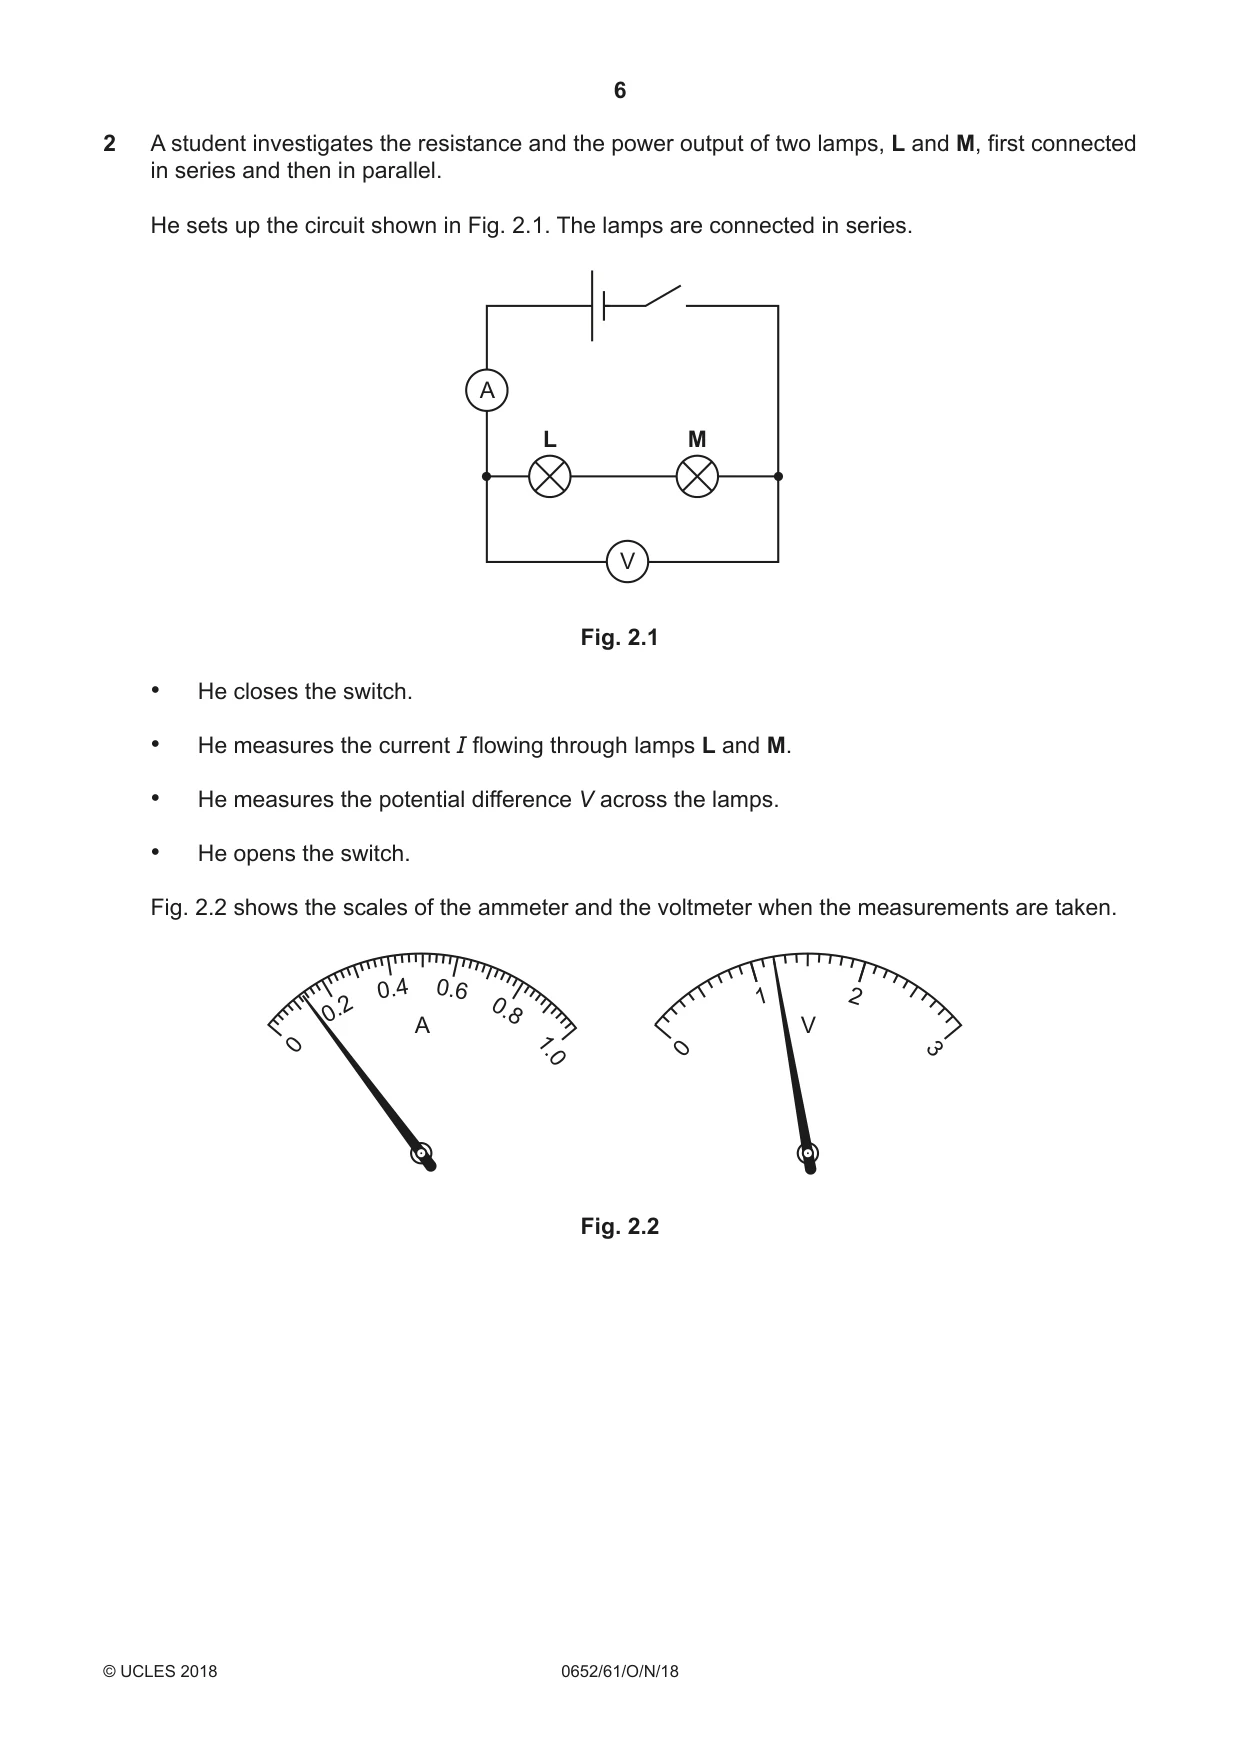
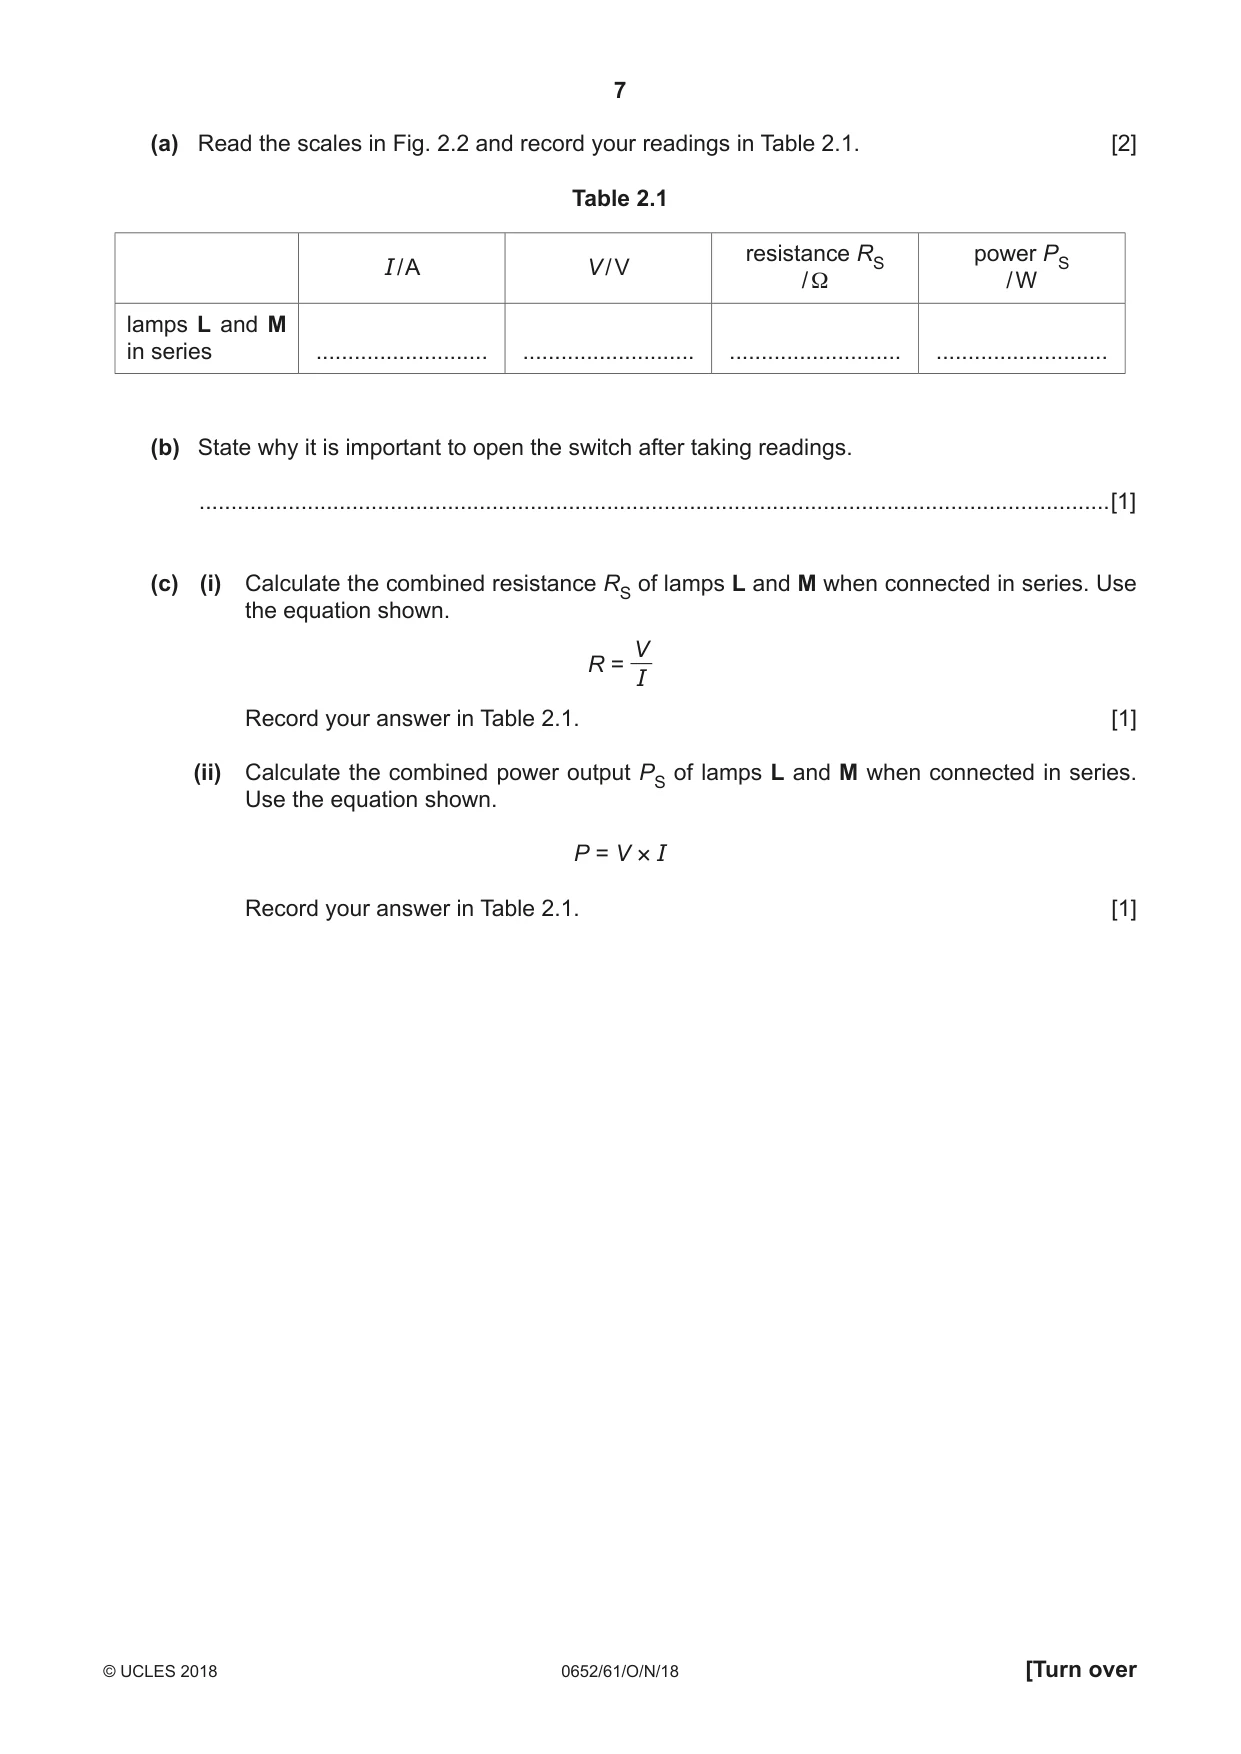
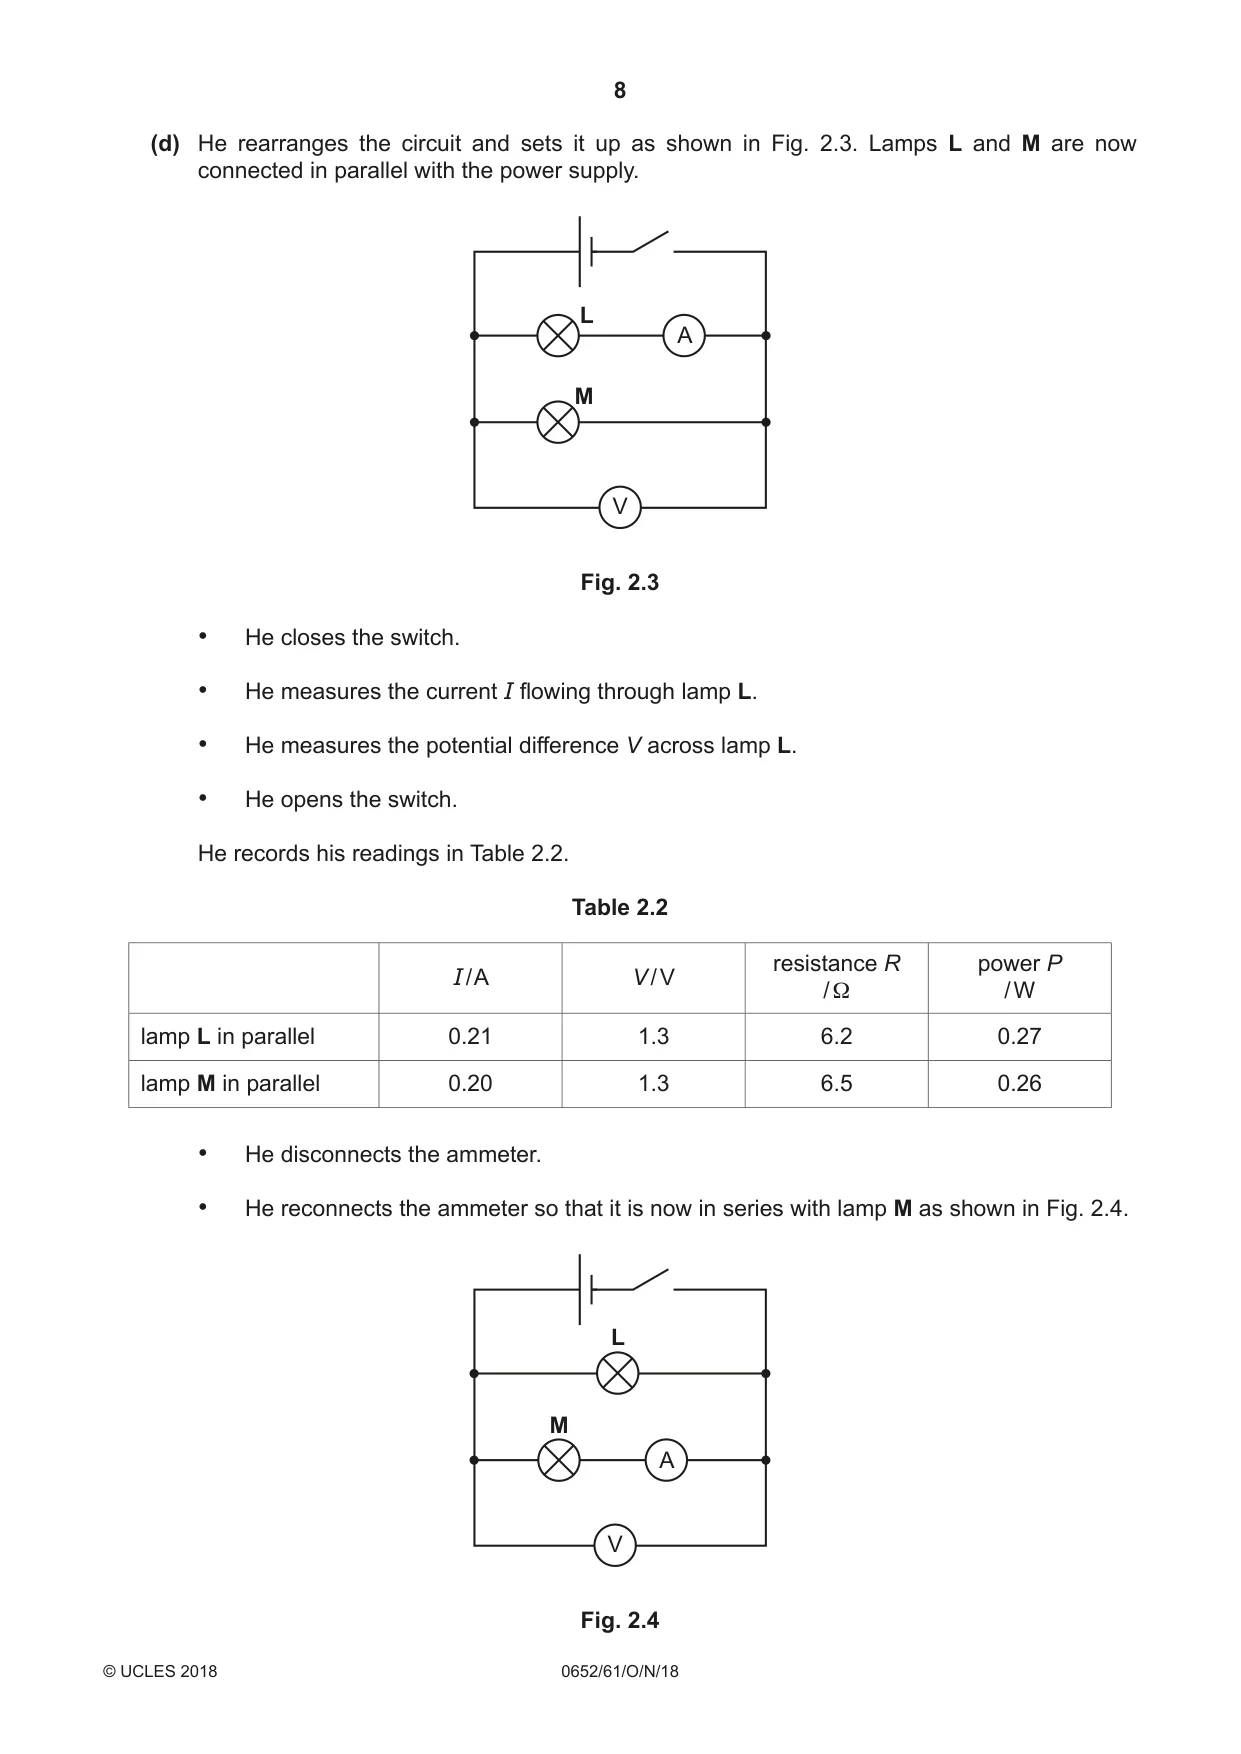
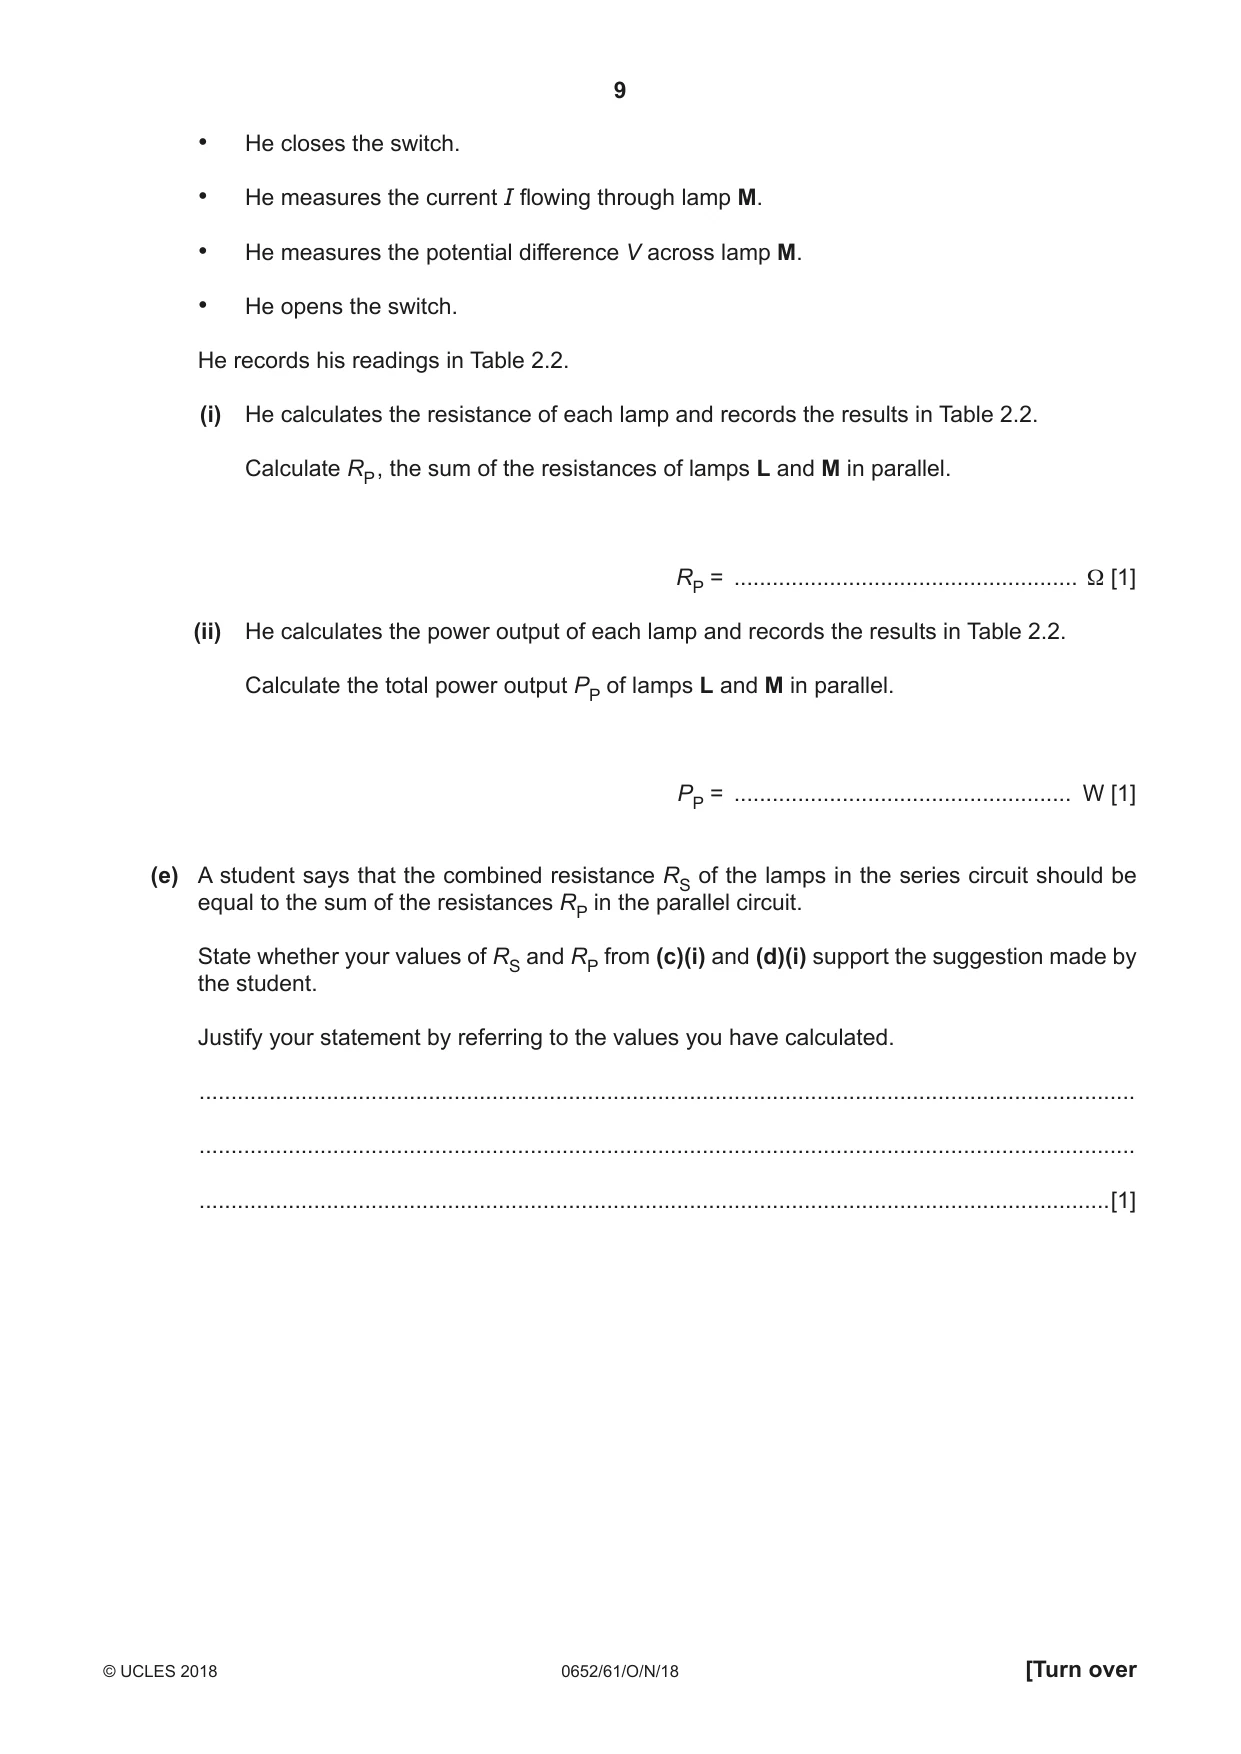
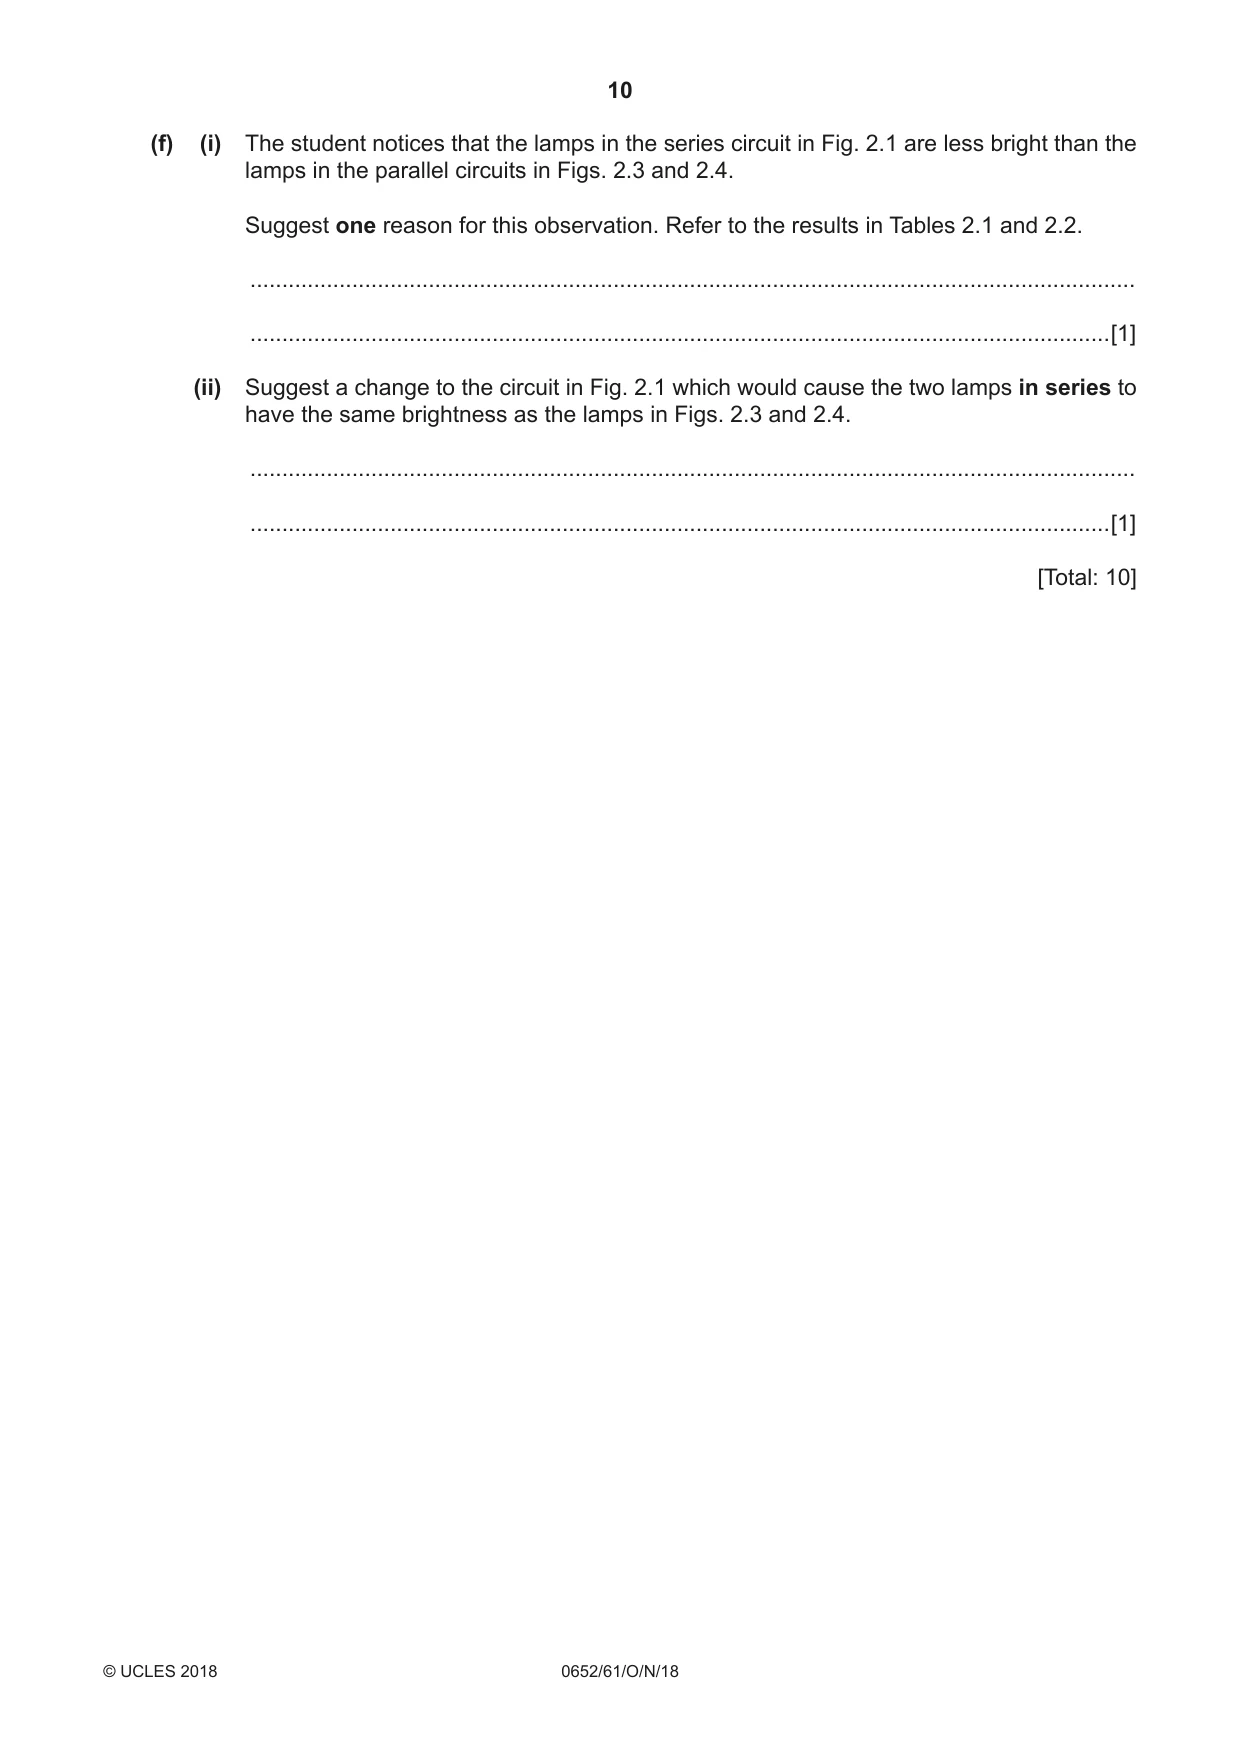
2 A student investigates the resistance and the power output of two lamps, L and M, first connected in series and then in parallel. He sets up the circuit shown in Fig. 2.1. The lamps are connected in series. A L M V Fig. 2.1 • He closes the switch. • He measures the current I flowing through lamps L and M. • He measures the potential difference V across the lamps. • He opens the switch. Fig. 2.2 shows the scales of the ammeter and the voltmeter when the measurements are taken. 0.4 0.6 1 2 0.2 0.8 A V 0 1.0 0 3 Fig. 2.2 (a) Read the scales in Fig. 2.2 and record your readings in Table 2.1. [2] Table 2.1 resistance RS power PS I / A V / V / Ω / W lamps L and M in series ........................... ........................... ........................... ........................... (b) State why it is important to open the switch after taking readings. ...............................................................................................................................................[1] (c) (i) Calculate the combined resistance RS of lamps L and M when connected in series. Use the equation shown. V R = I Record your answer in Table 2.1. [1] (ii) Calculate the combined power output PS of lamps L and M when connected in series. Use the equation shown. P = V × I Record your answer in Table 2.1. [1] (d) He rearranges the circuit and sets it up as shown in Fig. 2.3. Lamps L and M are now connected in parallel with the power supply. L A M V Fig. 2.3 • He closes the switch. • He measures the current I flowing through lamp L. • He measures the potential difference V across lamp L. • He opens the switch. He records his readings in Table 2.2. Table 2.2 resistance R power P I / A V / V / Ω / W lamp L in parallel 0.21 1.3 6.2 0.27 lamp M in parallel 0.20 1.3 6.5 0.26 • He disconnects the ammeter. • He reconnects the ammeter so that it is now in series with lamp M as shown in Fig. 2.4. L M A V Fig. 2.4 • He closes the switch. • He measures the current I flowing through lamp M. • He measures the potential difference V across lamp M. • He opens the switch. He records his readings in Table 2.2. (i) He calculates the resistance of each lamp and records the results in Table 2.2. Calculate RP , the sum of the resistances of lamps L and M in parallel. RP = ...................................................... Ω [1] (ii) He calculates the power output of each lamp and records the results in Table 2.2. Calculate the total power output PP of lamps L and M in parallel. PP = ..................................................... W [1] (e) A student says that the combined resistance RS of the lamps in the series circuit should be equal to the sum of the resistances RP in the parallel circuit. State whether your values of RS and RP from (c)(i) and (d)(i) support the suggestion made by the student. Justify your statement by referring to the values you have calculated. ................................................................................................................................................... ................................................................................................................................................... ...............................................................................................................................................[1] (f) (i) The student notices that the lamps in the series circuit in Fig. 2.1 are less bright than the lamps in the parallel circuits in Figs. 2.3 and 2.4. Suggest one reason for this observation. Refer to the results in Tables 2.1 and 2.2. ........................................................................................................................................... .......................................................................................................................................[1] (ii) Suggest a change to the circuit in Fig. 2.1 which would cause the two lamps in series to have the same brightness as the lamps in Figs. 2.3 and 2.4. ........................................................................................................................................... .......................................................................................................................................[1] [Total: 10] Please turn over for Question 3.
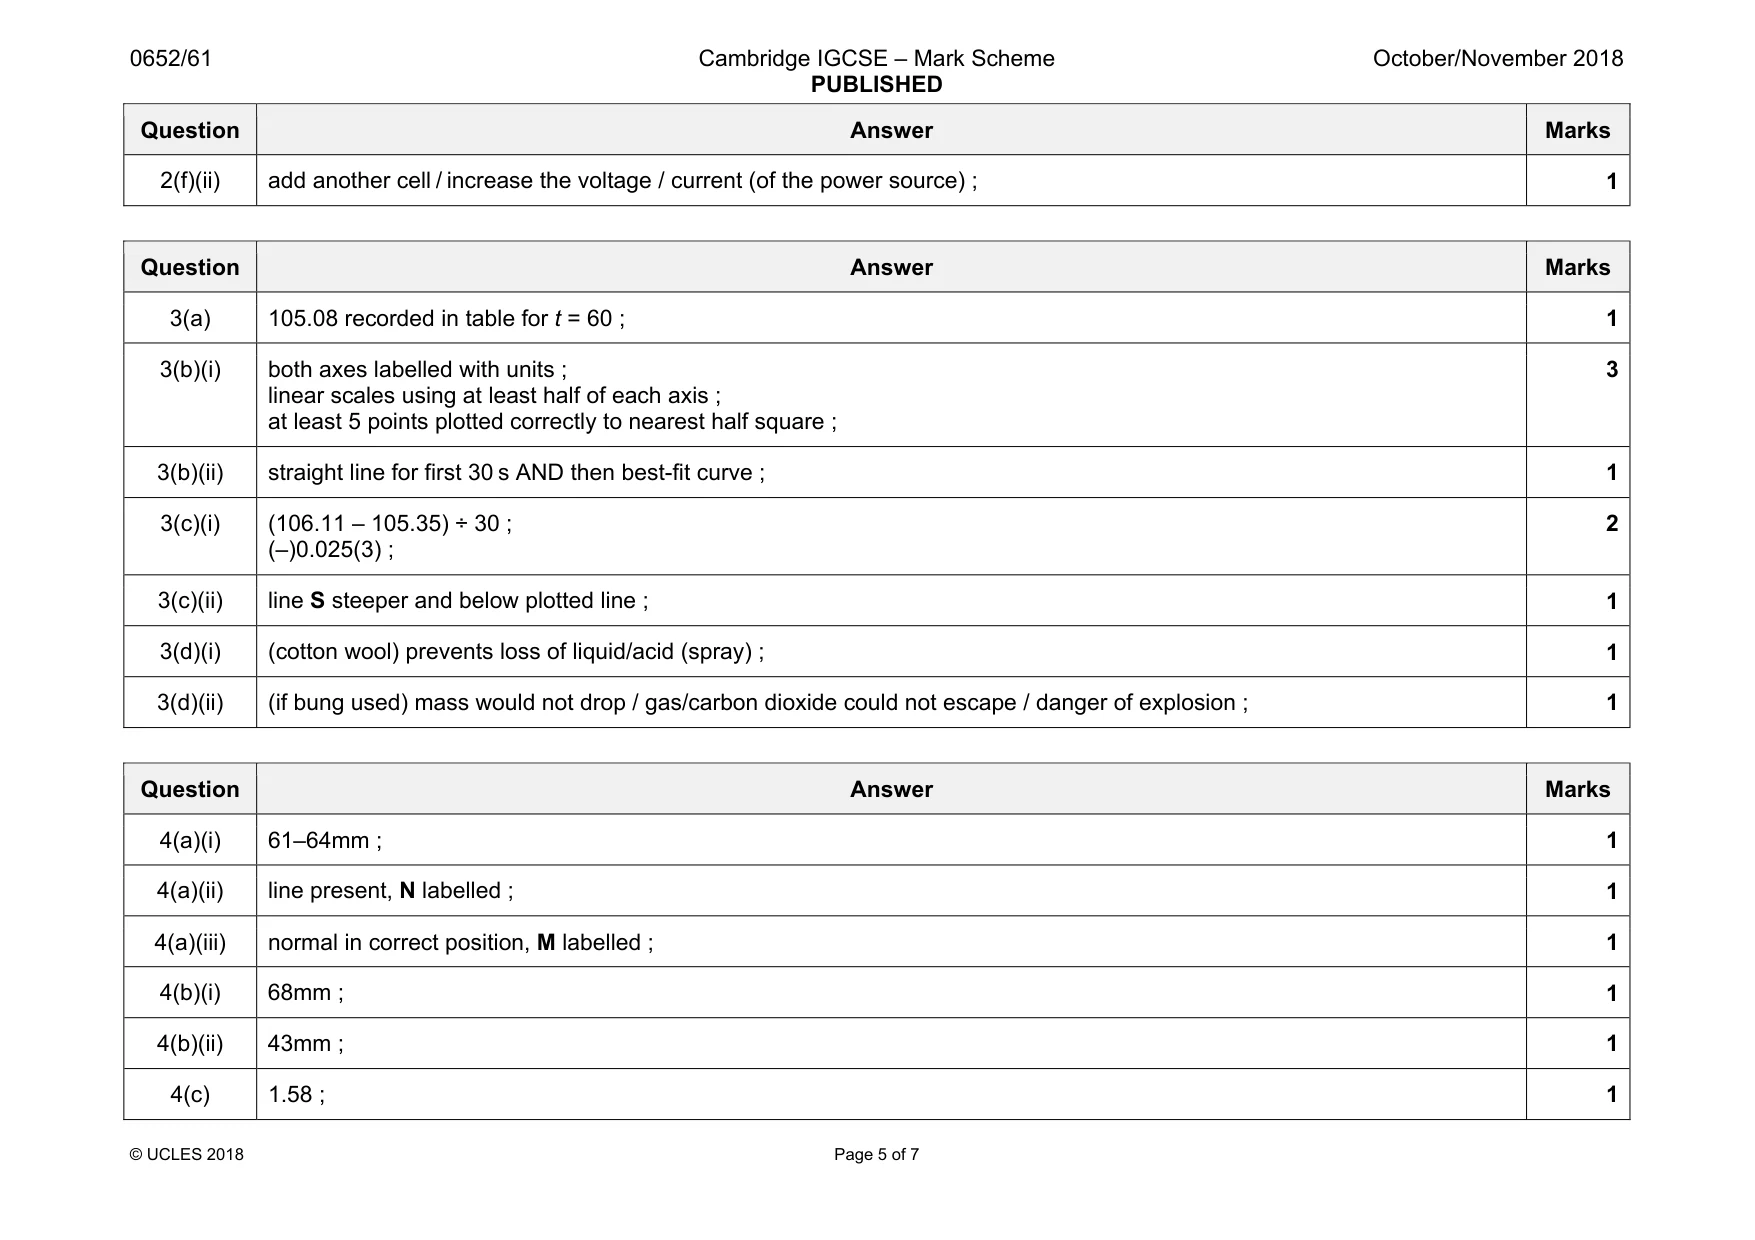
Mark scheme: 2(a) 1.2 (V) ; 2 2(b) cell runs down / circuit gets hot ; OWTTE 1 2(c)(i) 9.23 (Ω) ; 1 2(c)(ii) 0.16 (W) ; 1 2(d)(i) 12.7 (Ω) ; 1 2(d)(ii) 0.53 (W) ; 1 2(e) (statement incorrect) values (of RS and RP) / they are too far apart to be explained by experimental error / not within 10% ; ORA 1 2(f)(i) lamps in series carry less current / (dissipate) less power / higher combined resistance ; 1 Question Answer Marks 2(f)(ii) add another cell / increase the voltage / current (of the power source) ; 1
Q3 · A student investigates the rate of reaction between calcium carbonate and hydrochloric…
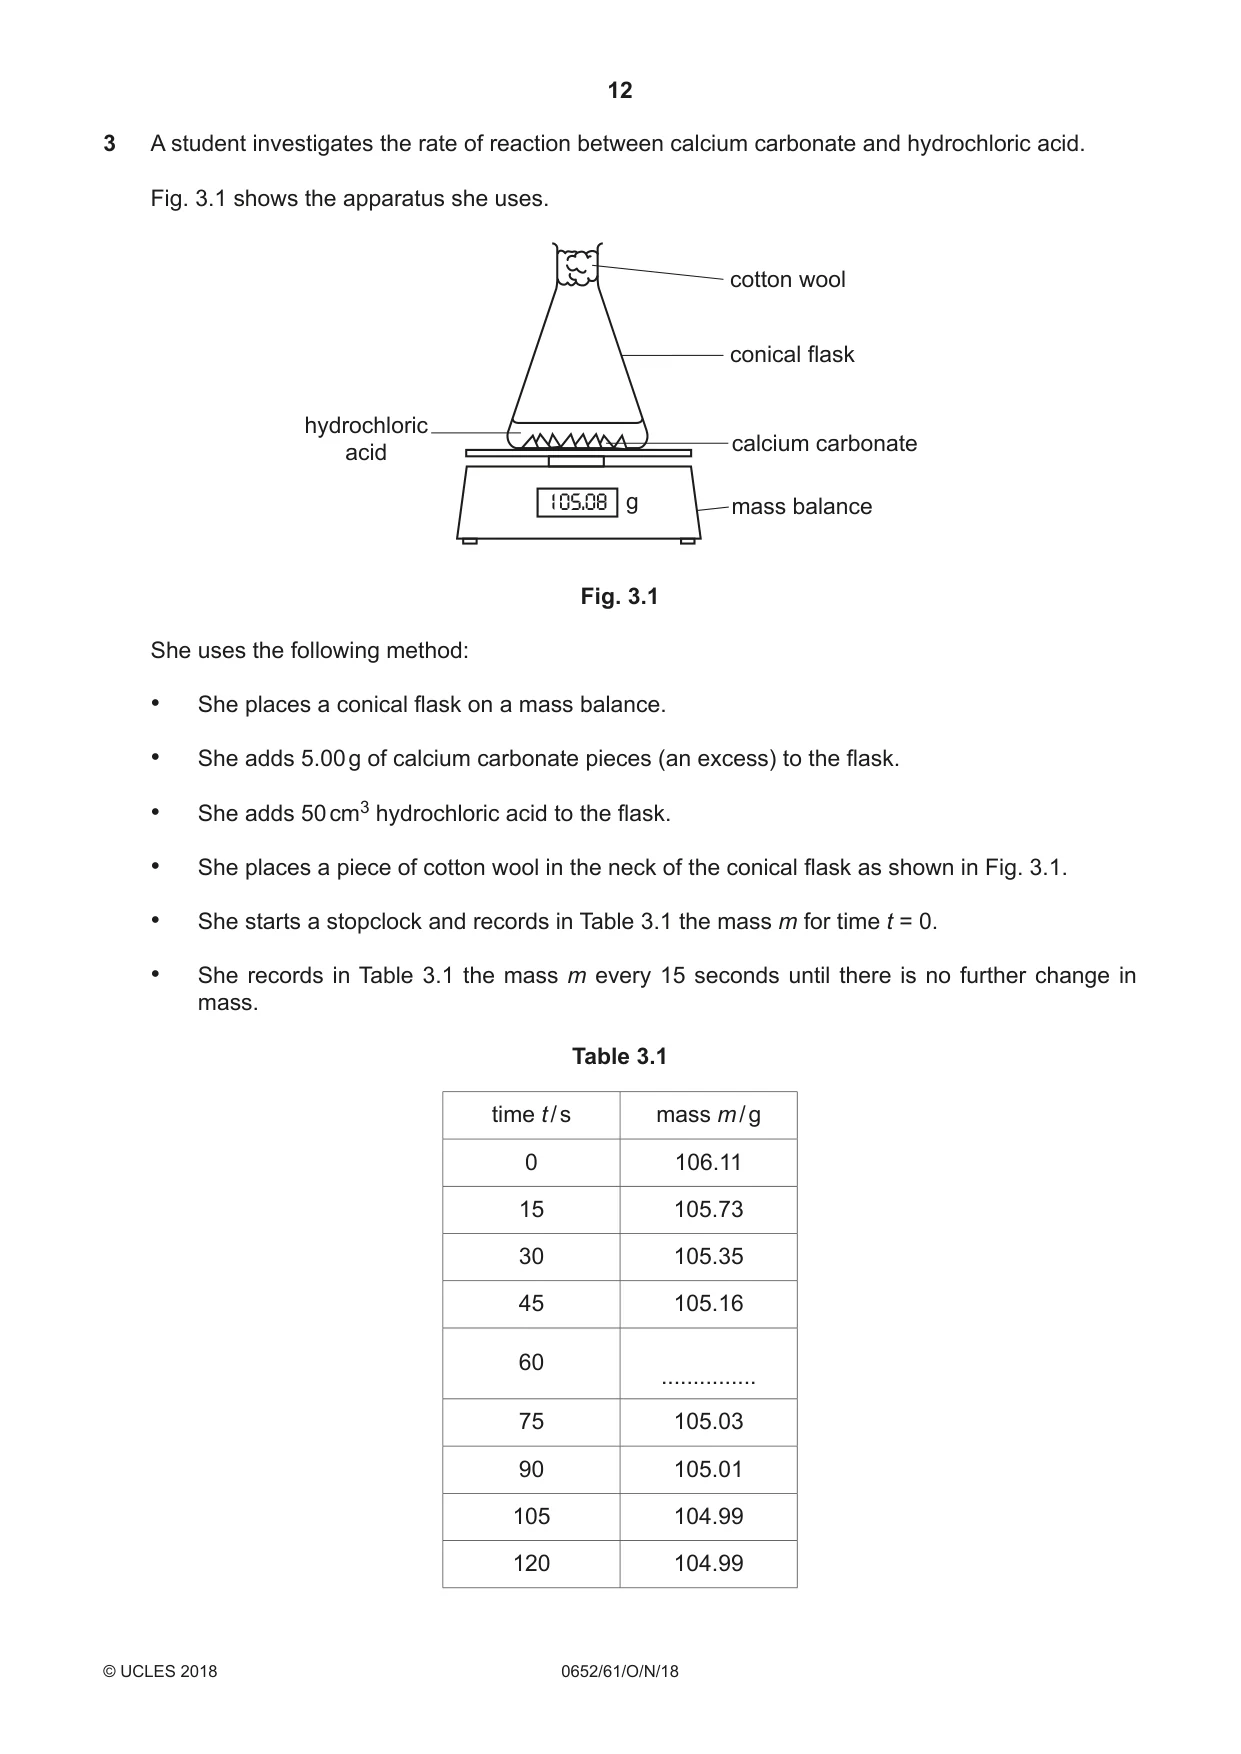
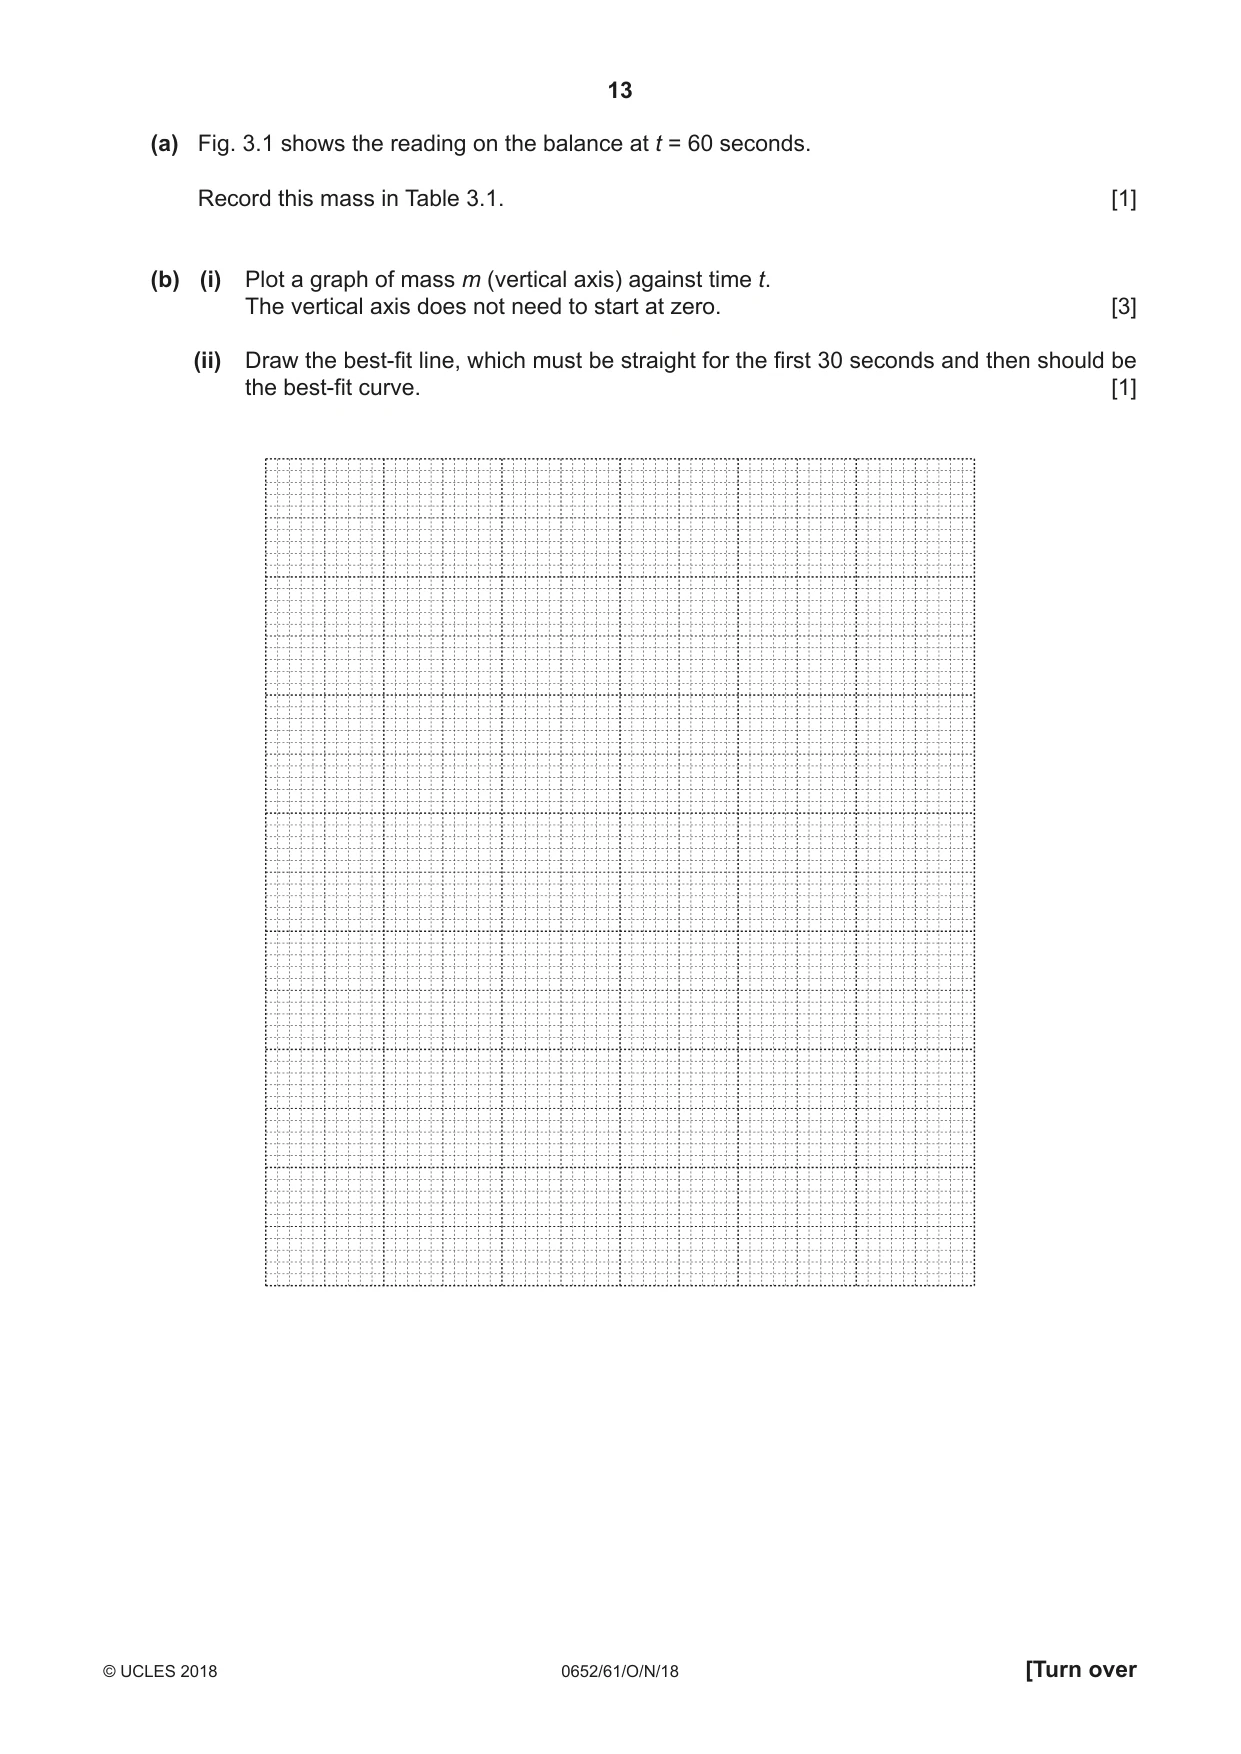
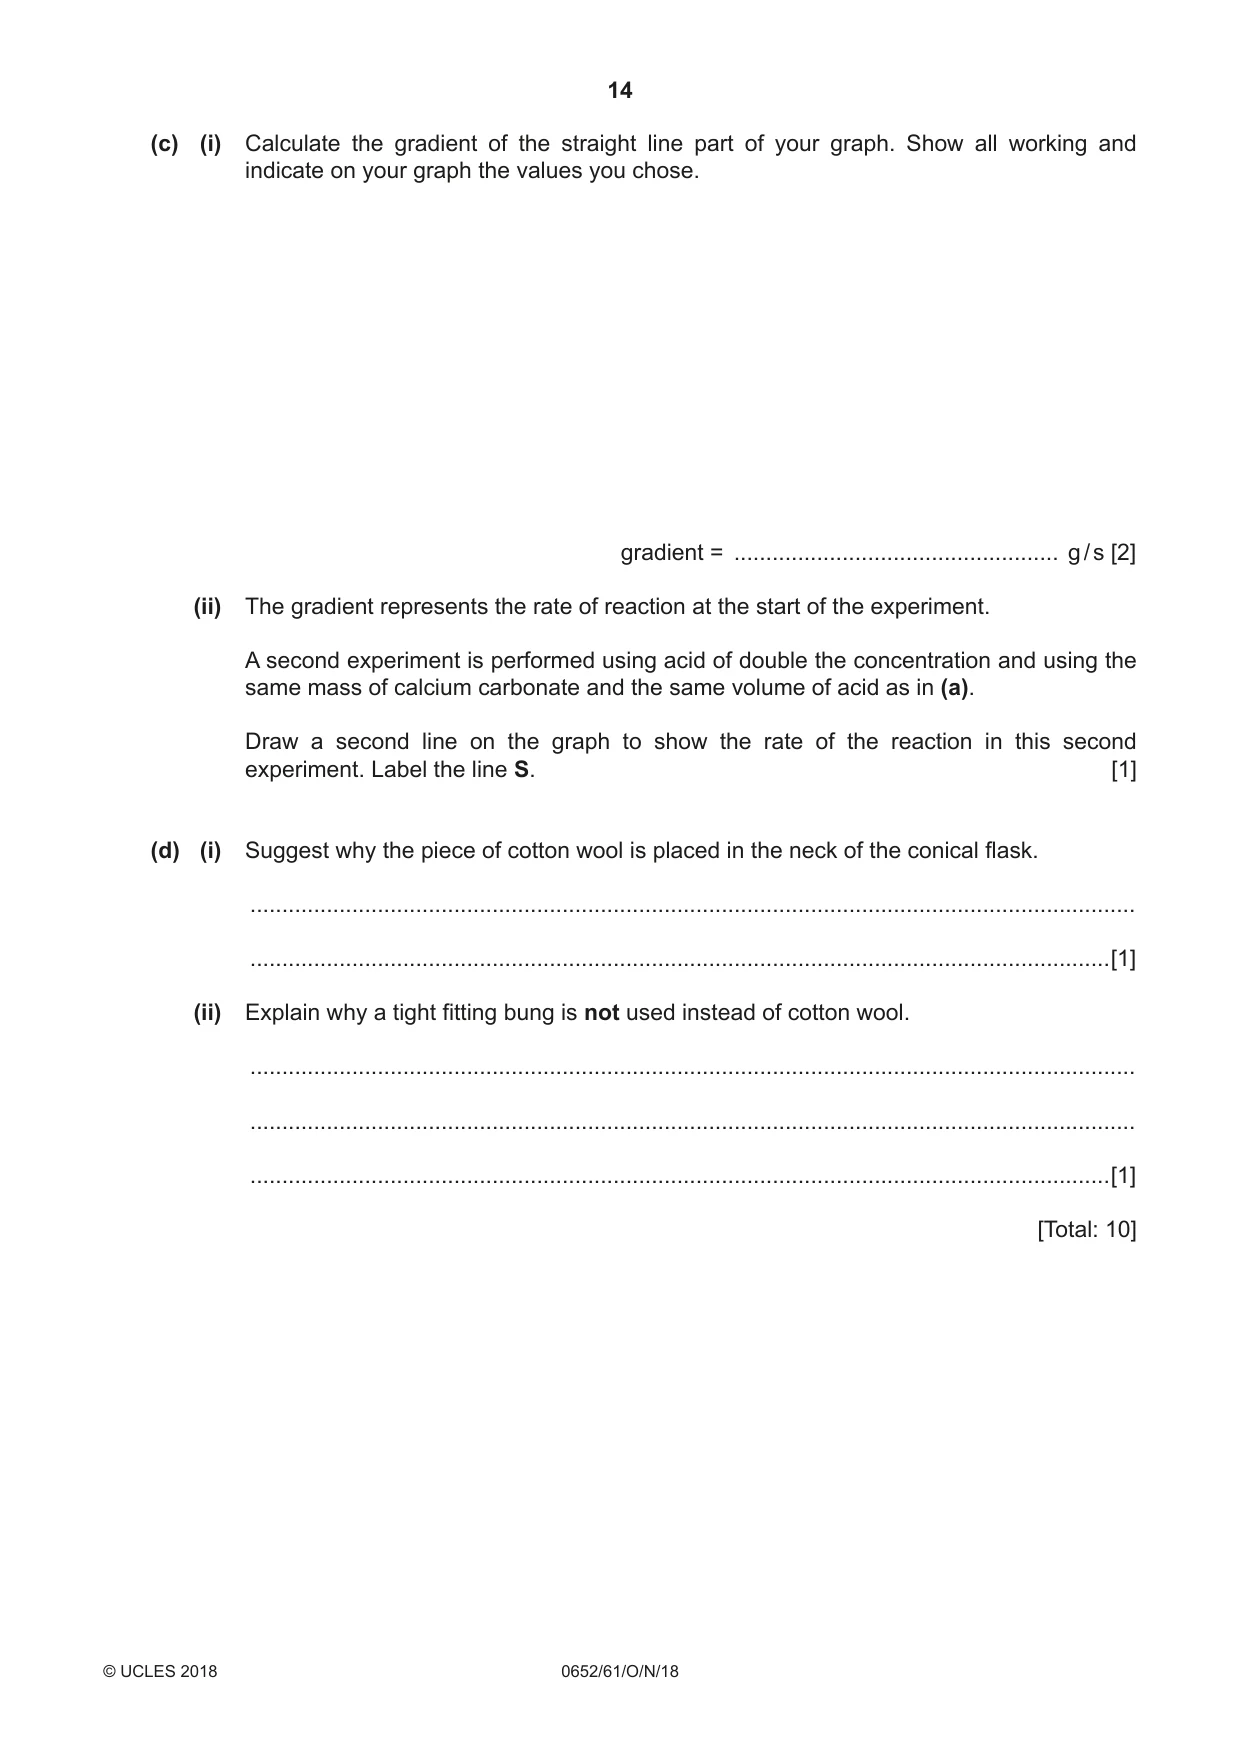
3 A student investigates the rate of reaction between calcium carbonate and hydrochloric acid. Fig. 3.1 shows the apparatus she uses. cotton wool conical flask hydrochloric calcium carbonate acid 105.08 g mass balance Fig. 3.1 She uses the following method: • She places a conical flask on a mass balance. • She adds 5.00 g of calcium carbonate pieces (an excess) to the flask. • She adds 50 cm3 hydrochloric acid to the flask. • She places a piece of cotton wool in the neck of the conical flask as shown in Fig. 3.1. • She starts a stopclock and records in Table 3.1 the mass m for time t = 0. • She records in Table 3.1 the mass m every 15 seconds until there is no further change in mass. Table 3.1 time t / s mass m / g 0 106.11 15 105.73 30 105.35 45 105.16 60 ............... 75 105.03 90 105.01 105 104.99 120 104.99 (a) Fig. 3.1 shows the reading on the balance at t = 60 seconds. Record this mass in Table 3.1. [1] (b) (i) Plot a graph of mass m (vertical axis) against time t. The vertical axis does not need to start at zero. [3] (ii) Draw the best-fit line, which must be straight for the first 30 seconds and then should be the best-fit curve. [1] (c) (i) Calculate the gradient of the straight line part of your graph. Show all working and indicate on your graph the values you chose. gradient = ................................................... g / s [2] (ii) The gradient represents the rate of reaction at the start of the experiment. A second experiment is performed using acid of double the concentration and using the same mass of calcium carbonate and the same volume of acid as in (a). Draw a second line on the graph to show the rate of the reaction in this second experiment. Label the line S. [1] (d) (i) Suggest why the piece of cotton wool is placed in the neck of the conical flask. ........................................................................................................................................... .......................................................................................................................................[1] (ii) Explain why a tight fitting bung is not used instead of cotton wool. ........................................................................................................................................... ........................................................................................................................................... .......................................................................................................................................[1] [Total: 10] Please turn over for Question 4.
Mark scheme: 3(a) 105.08 recorded in table for t = 60 ; 1 3(b)(i) both axes labelled with units ; linear scales using at least half of each axis ; at least 5 points plotted correctly to nearest half square ; 3 3(b)(ii) straight line for first 30 s AND then best-fit curve ; 1 3(c)(i) (106.11 – 105.35) ÷ 30 ; (–)0.025(3) ; 2 3(c)(ii) line S steeper and below plotted line ; 1 3(d)(i) (cotton wool) prevents loss of liquid/acid (spray) ; 1 3(d)(ii) (if bung used) mass would not drop / gas/carbon dioxide could not escape / danger of explosion ; 1
Q4 · A student uses optics pins to trace the path of light through a rectangular block of…
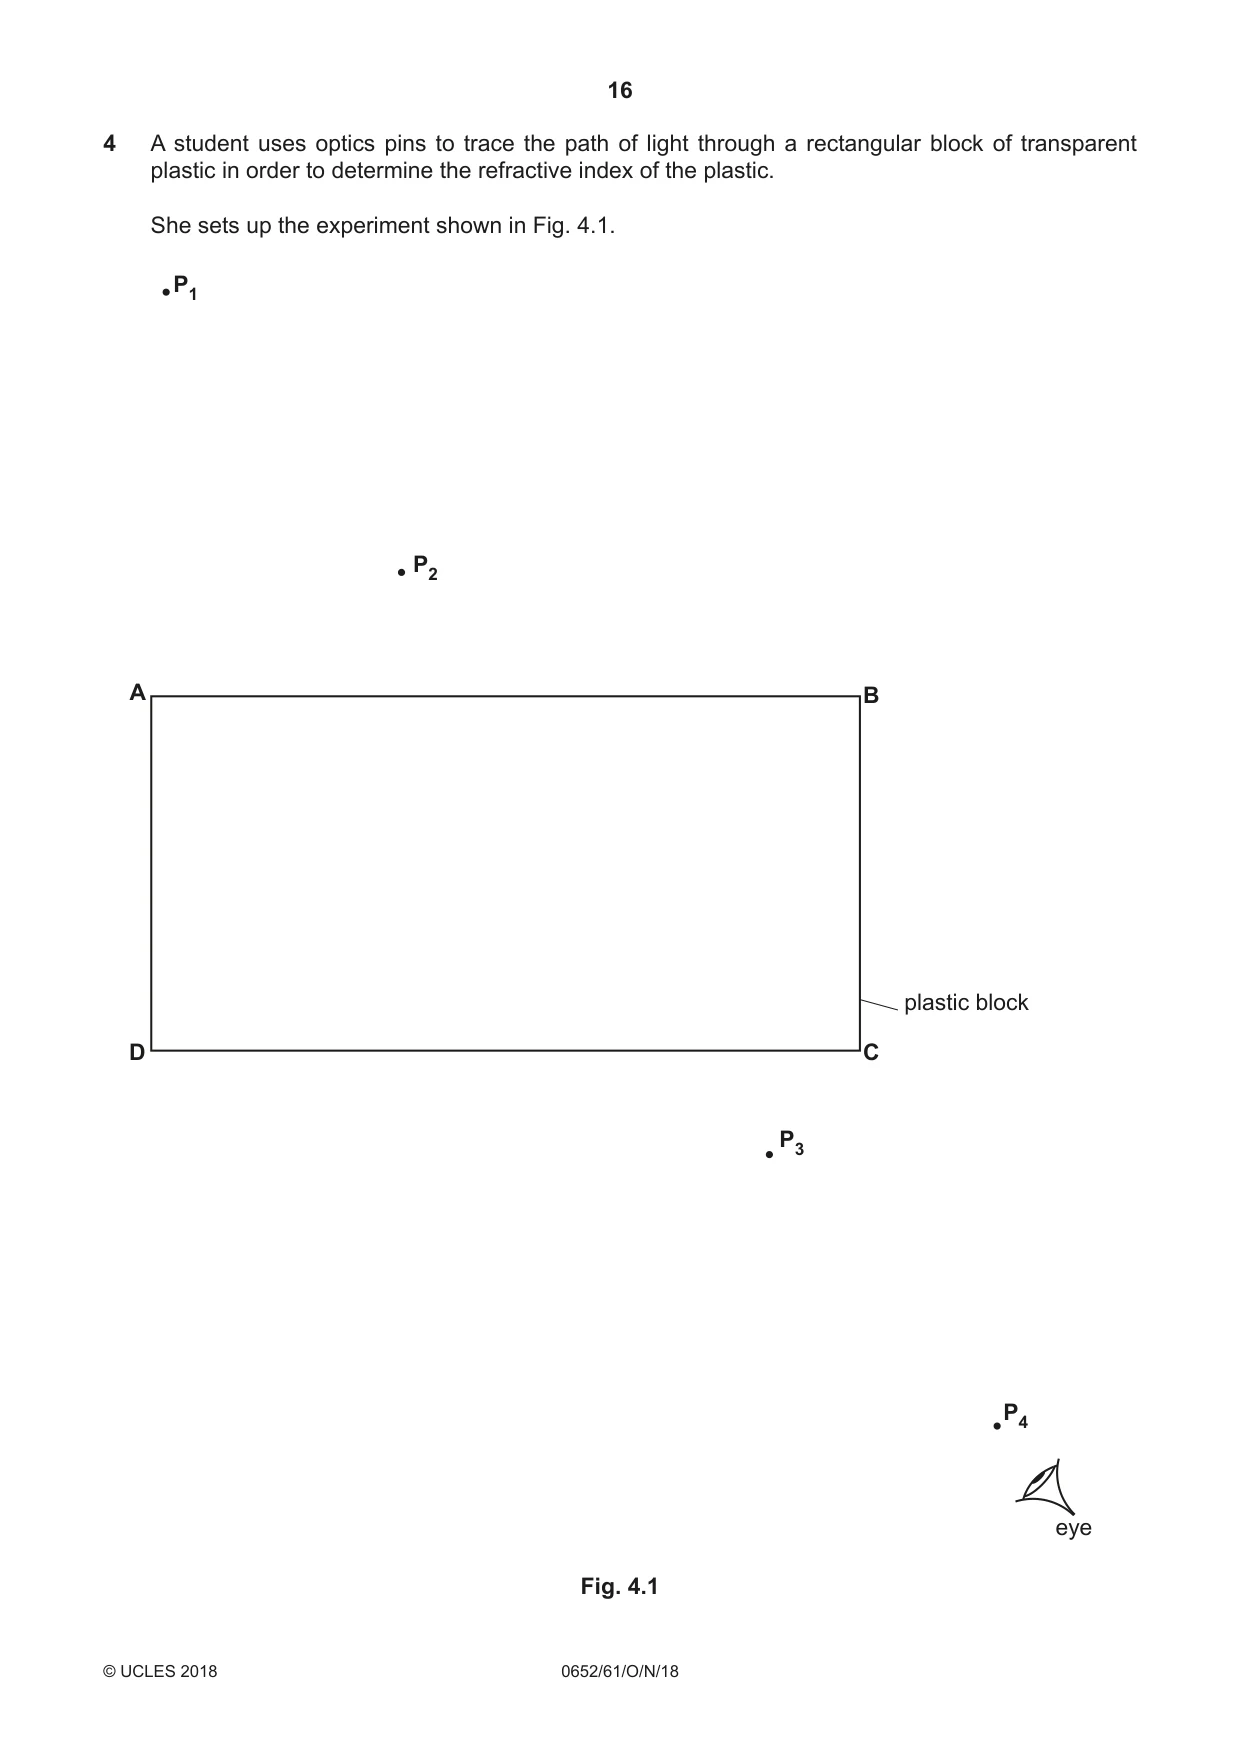
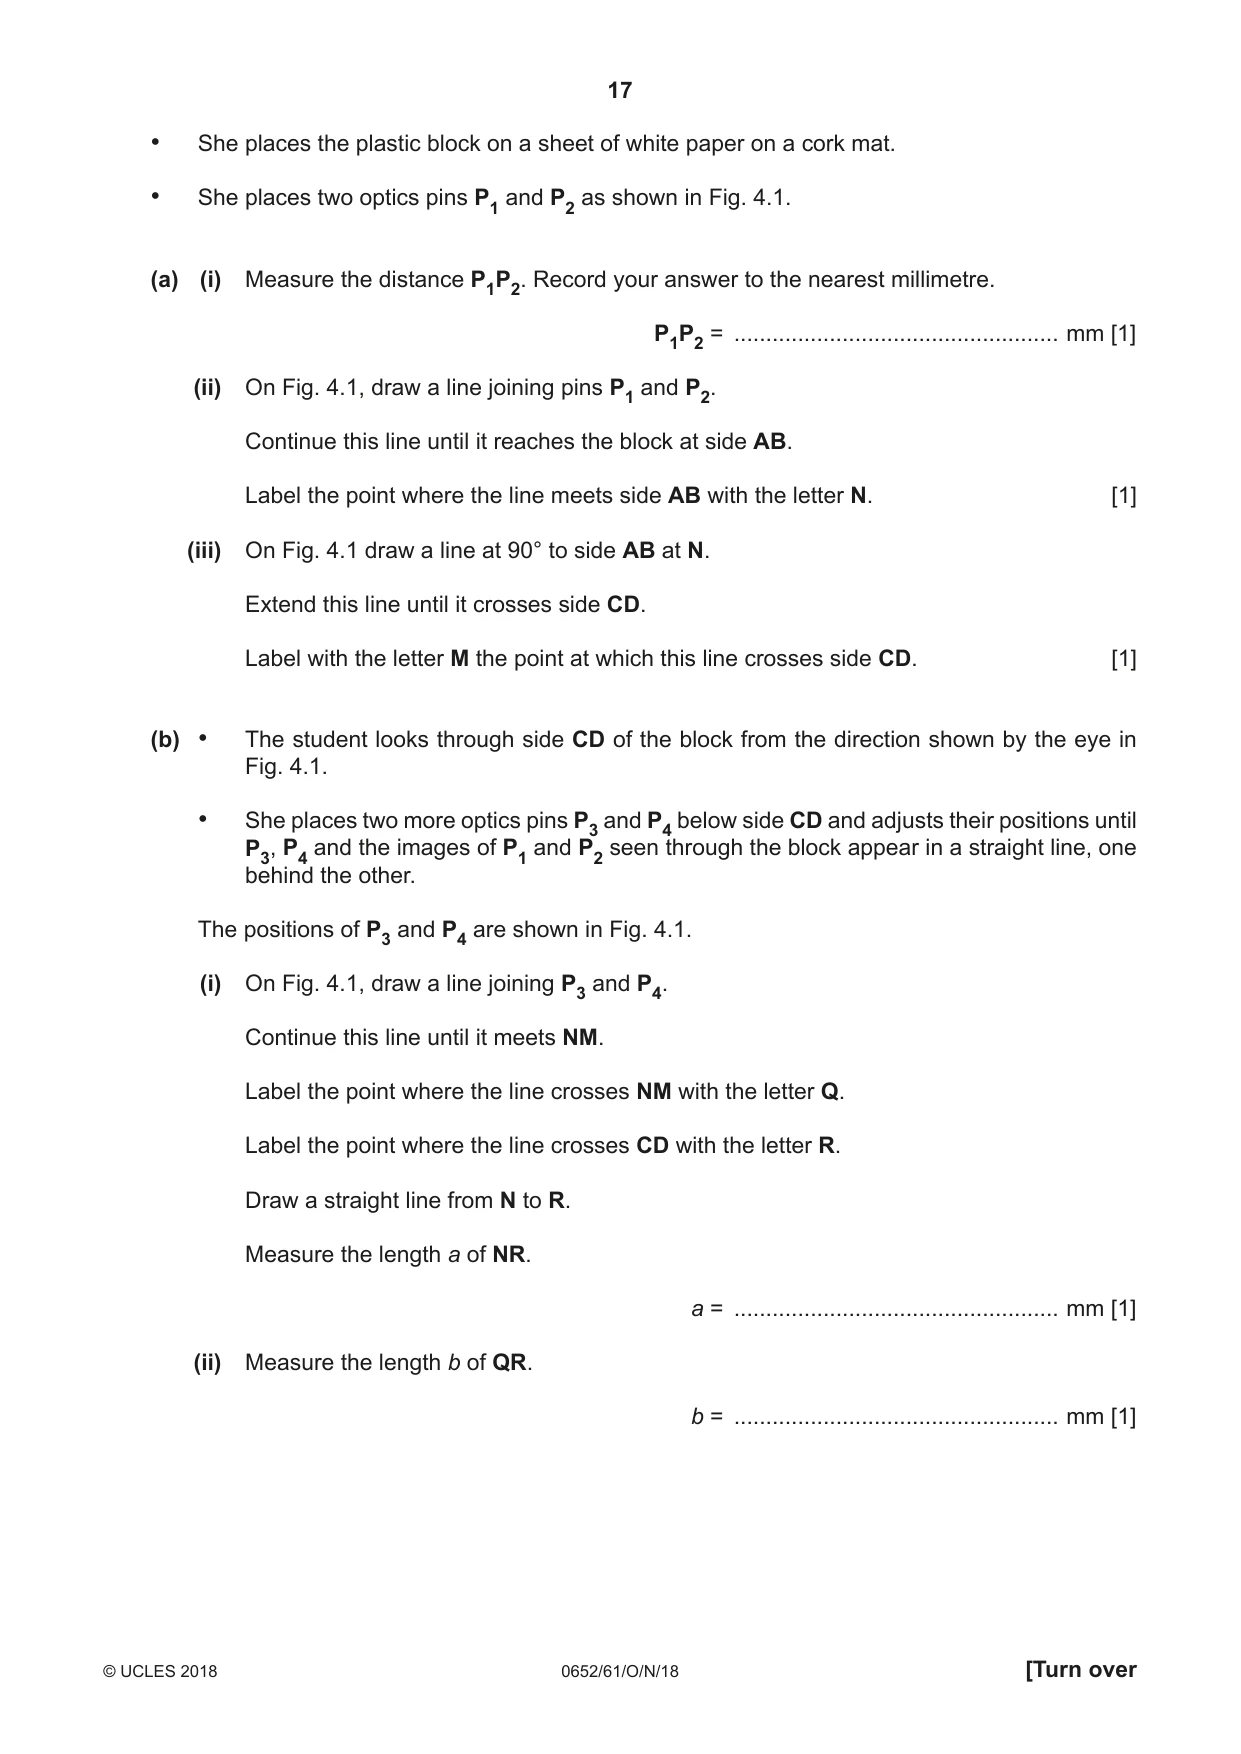
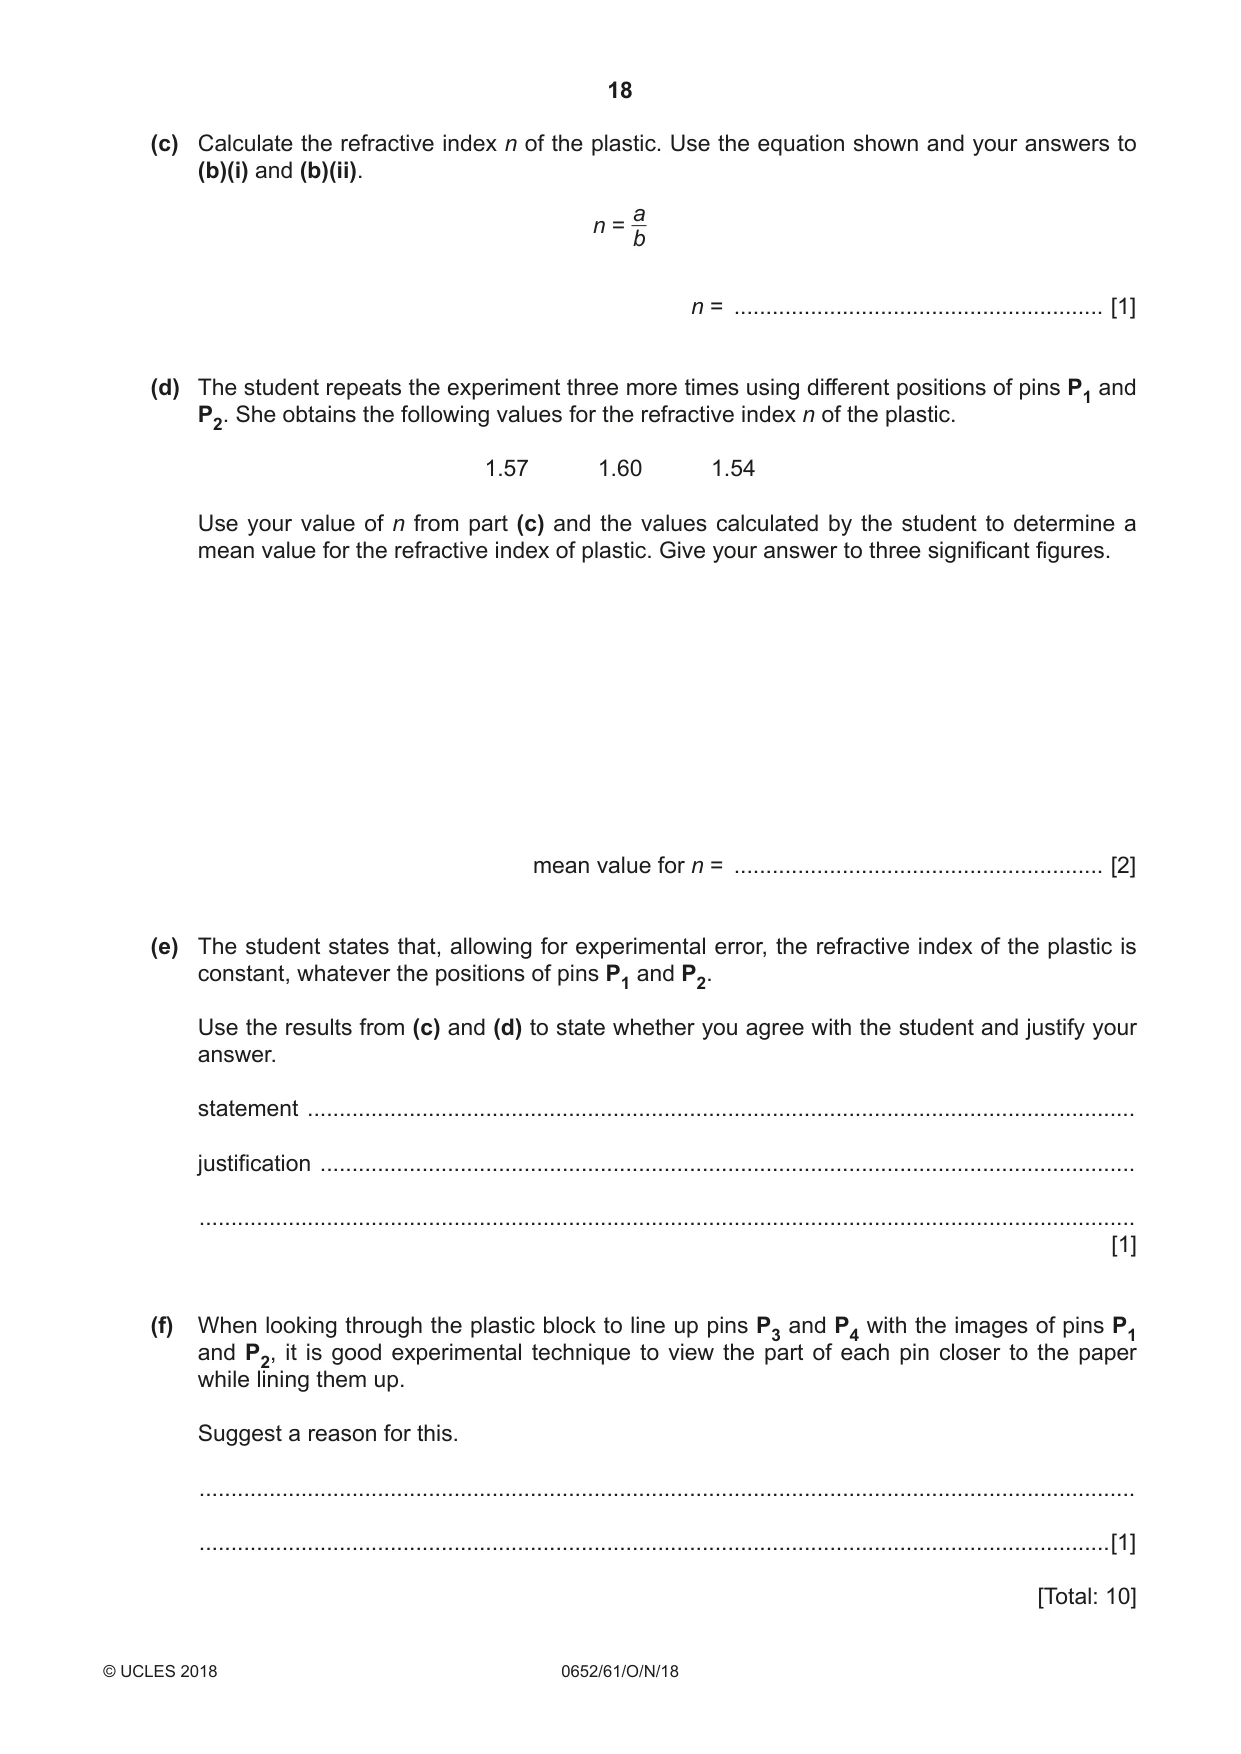
4 A student uses optics pins to trace the path of light through a rectangular block of transparent plastic in order to determine the refractive index of the plastic. She sets up the experiment shown in Fig. 4.1. P1 P2 A B plastic block D C P3 P4 eye Fig. 4.1 • She places the plastic block on a sheet of white paper on a cork mat. • She places two optics pins P1 and P2 as shown in Fig. 4.1. (a) (i) Measure the distance P1P2. Record your answer to the nearest millimetre. P1P2 = ................................................... mm [1] (ii) On Fig. 4.1, draw a line joining pins P1 and P2. Continue this line until it reaches the block at side AB. Label the point where the line meets side AB with the letter N. [1] (iii) On Fig. 4.1 draw a line at 90° to side AB at N. Extend this line until it crosses side CD. Label with the letter M the point at which this line crosses side CD. [1] (b) • The student looks through side CD of the block from the direction shown by the eye in Fig. 4.1. • She places two more optics pins P3 and P4 below side CD and adjusts their positions until P3, P4 and the images of P1 and P2 seen through the block appear in a straight line, one behind the other. The positions of P3 and P4 are shown in Fig. 4.1. (i) On Fig. 4.1, draw a line joining P3 and P4. Continue this line until it meets NM. Label the point where the line crosses NM with the letter Q. Label the point where the line crosses CD with the letter R. Draw a straight line from N to R. Measure the length a of NR. a = ................................................... mm [1] (ii) Measure the length b of QR. b = ................................................... mm [1] (c) Calculate the refractive index n of the plastic. Use the equation shown and your answers to (b)(i) and (b)(ii). a n = b n = .......................................................... [1] (d) The student repeats the experiment three more times using different positions of pins P1 and P2. She obtains the following values for the refractive index n of the plastic. 1.57 1.60 1.54 Use your value of n from part (c) and the values calculated by the student to determine a mean value for the refractive index of plastic. Give your answer to three significant figures. mean value for n = .......................................................... [2] (e) The student states that, allowing for experimental error, the refractive index of the plastic is constant, whatever the positions of pins P1 and P2. Use the results from (c) and (d) to state whether you agree with the student and justify your answer. statement .................................................................................................................................. justification ................................................................................................................................ ................................................................................................................................................... [1] (f) When looking through the plastic block to line up pins P3 and P4 with the images of pins P1 and P2, it is good experimental technique to view the part of each pin closer to the paper while lining them up. Suggest a reason for this. ................................................................................................................................................... ...............................................................................................................................................[1] [Total: 10]
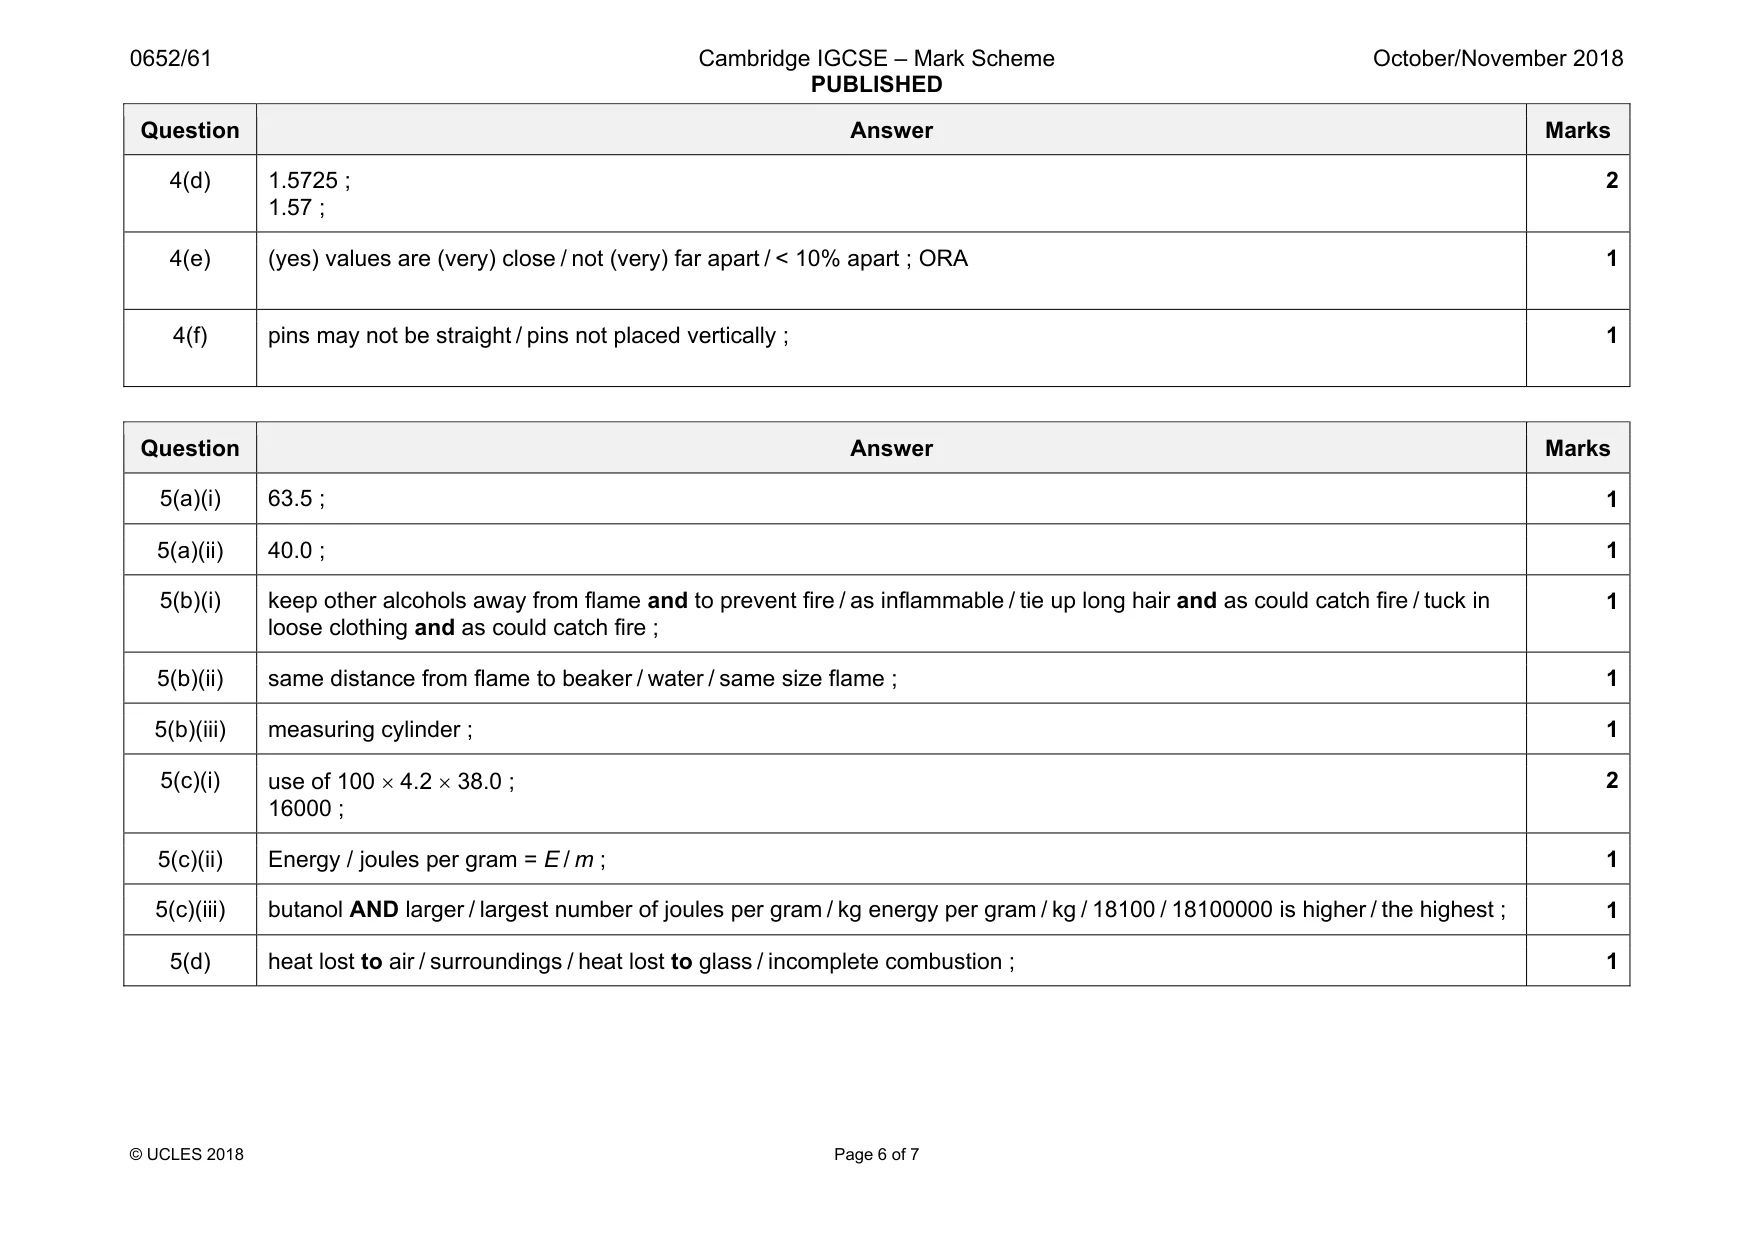
Mark scheme: 4(a)(i) 61–64mm ; 1 4(a)(ii) line present, N labelled ; 1 4(a)(iii) normal in correct position, M labelled ; 1 4(b)(i) 68mm ; 1 4(b)(ii) 43mm ; 1 4(c) 1.58 ; 1 Question Answer Marks 4(d) 1.5725 ; 1.57 ; 2 4(e) (yes) values are (very) close / not (very) far apart / < 10% apart ; ORA 1 4(f) pins may not be straight / pins not placed vertically ; 1
Q5 · A student investigates the three alcohol fuels, ethanol, propanol and butanol, to find…
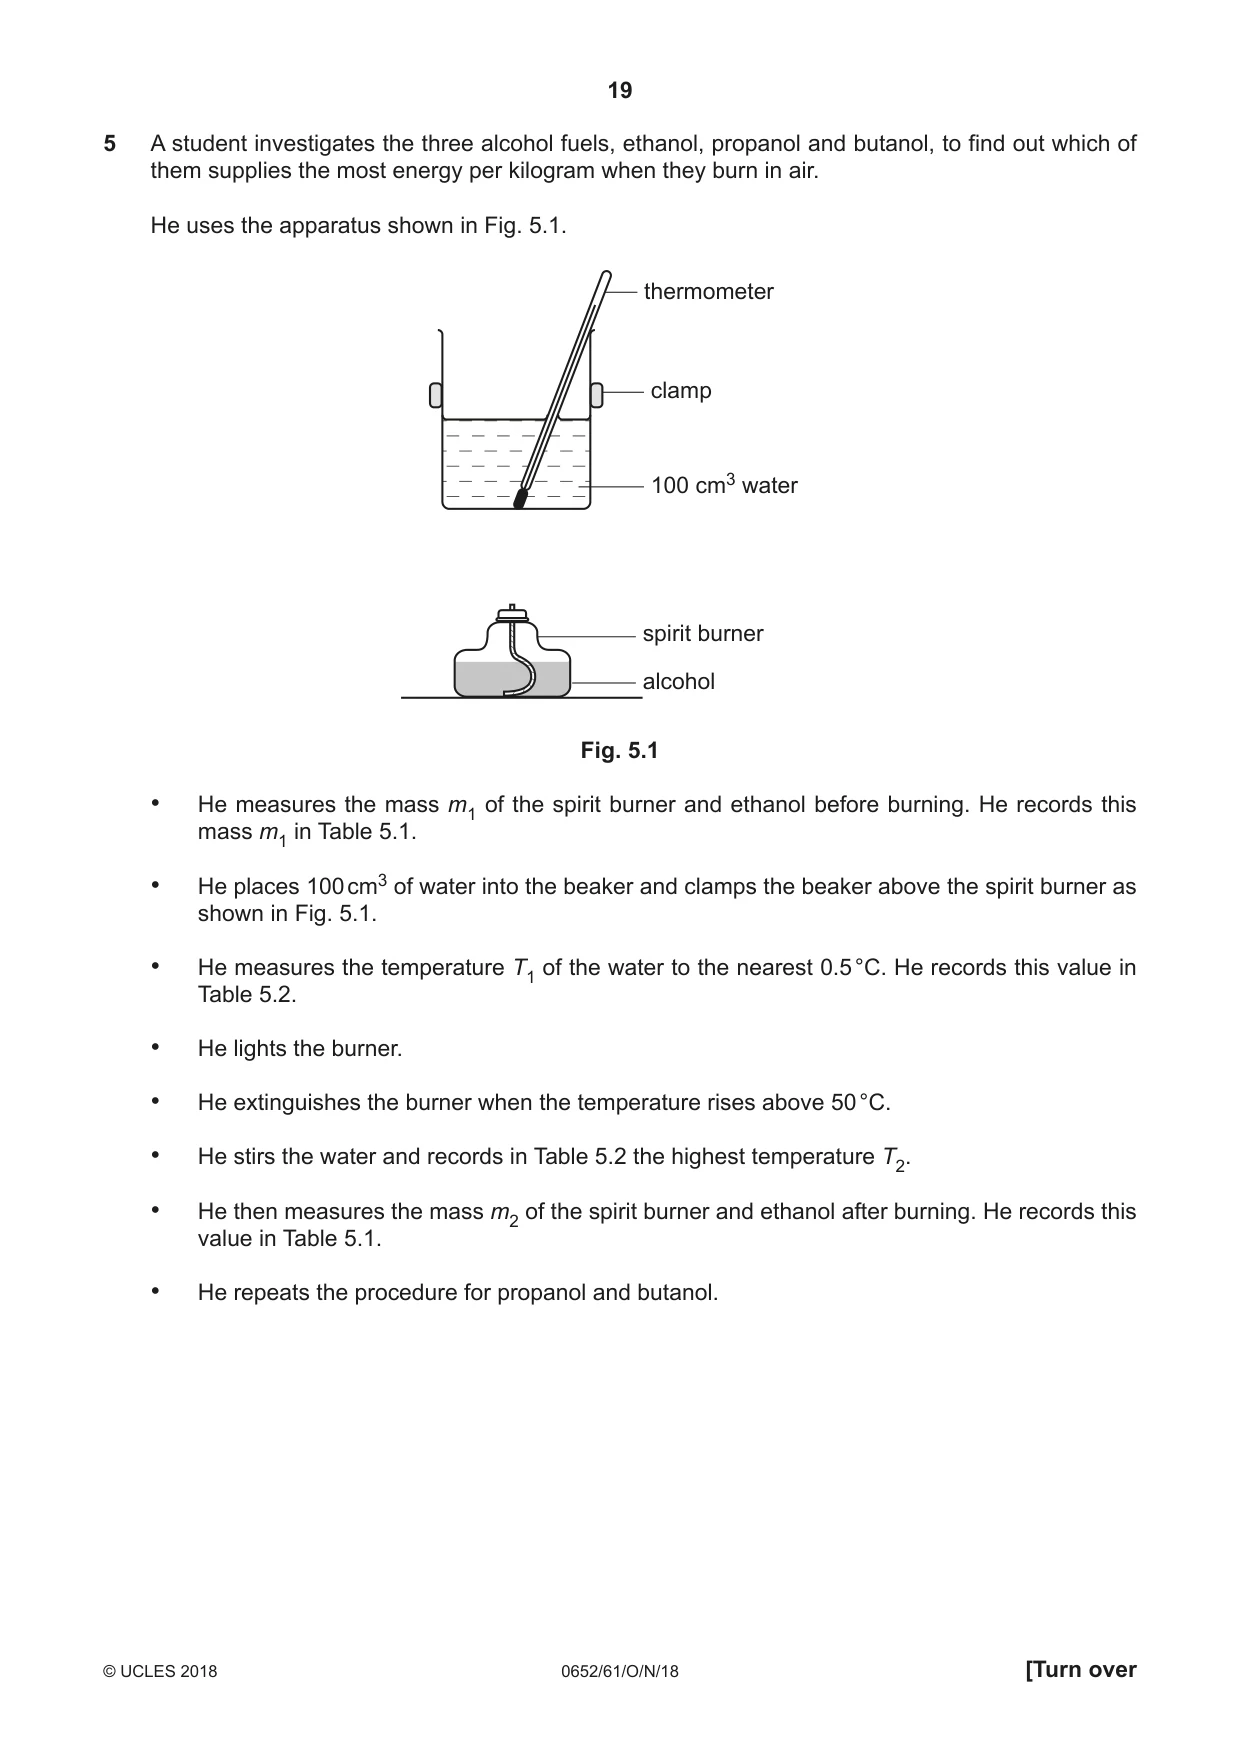
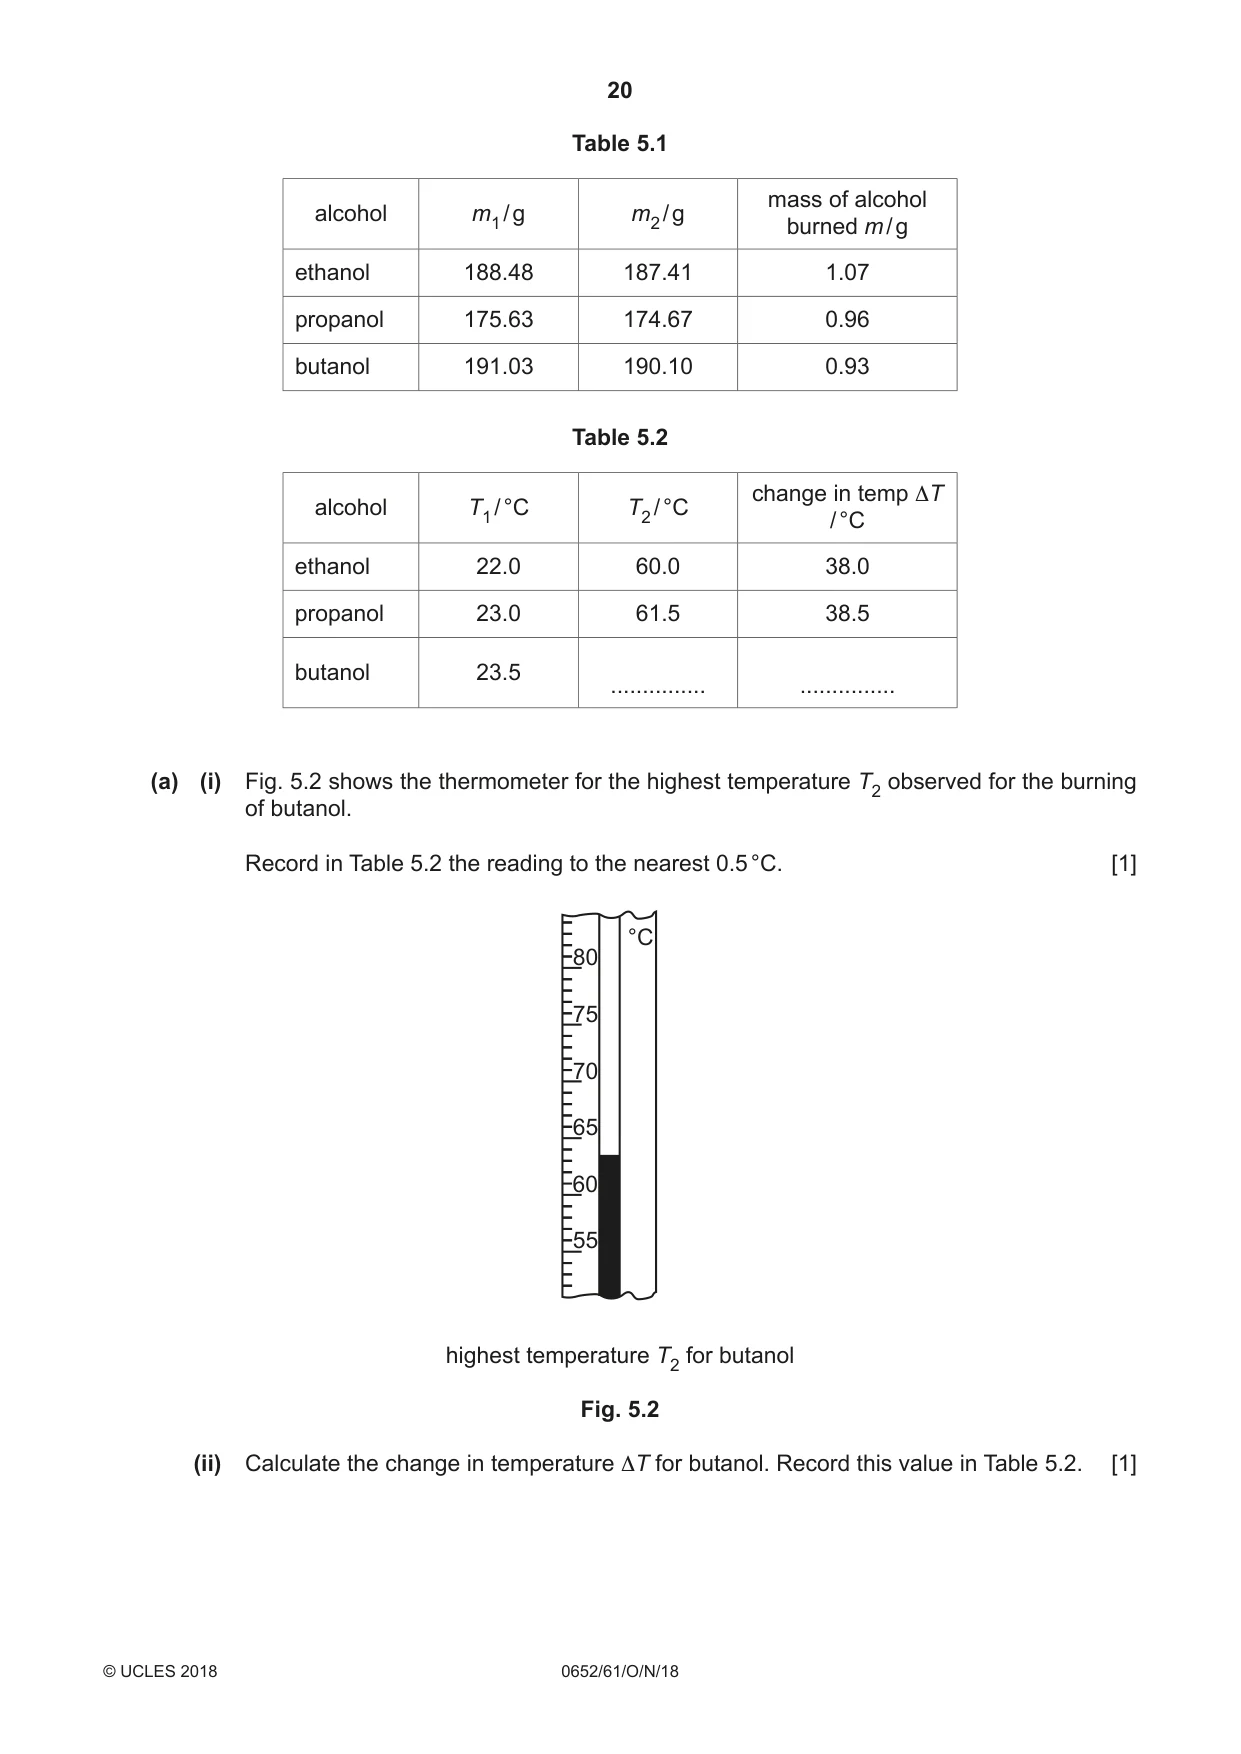
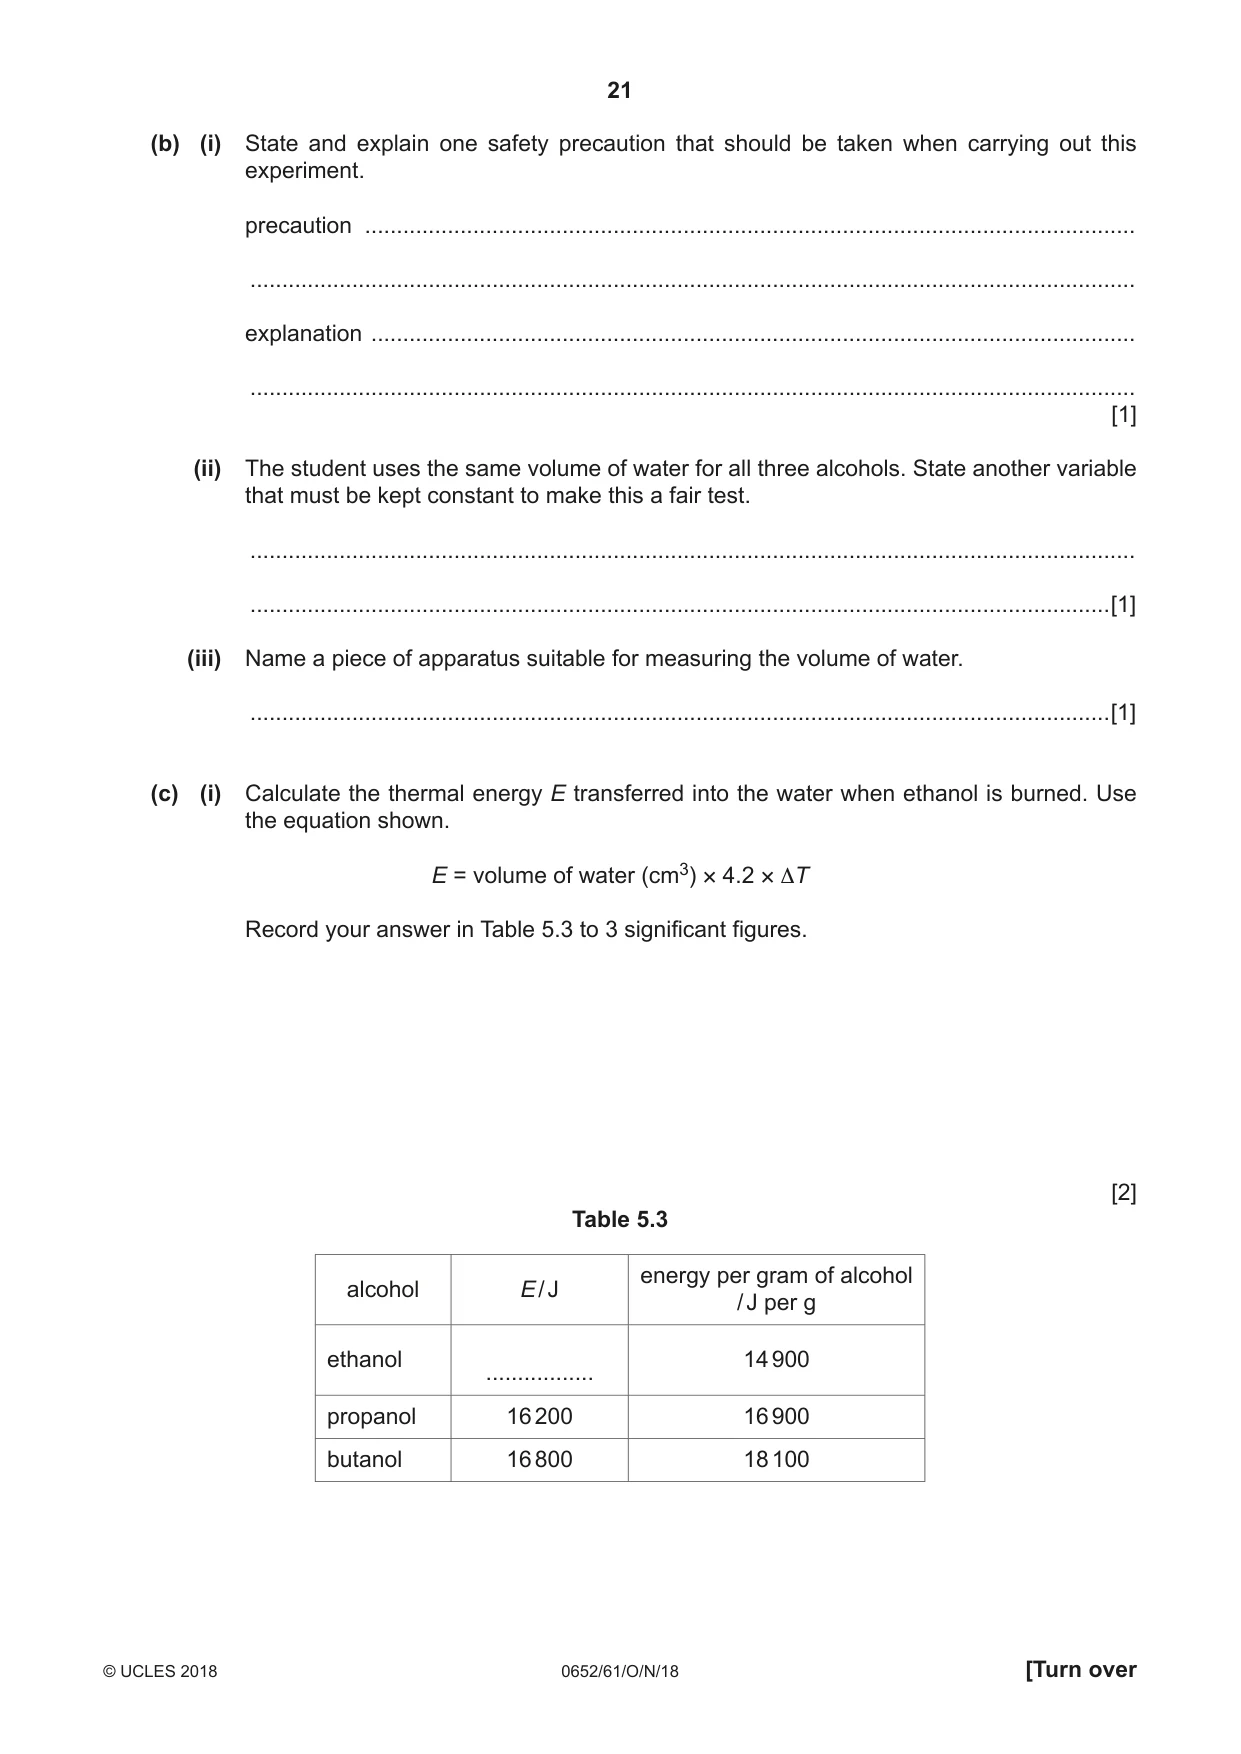
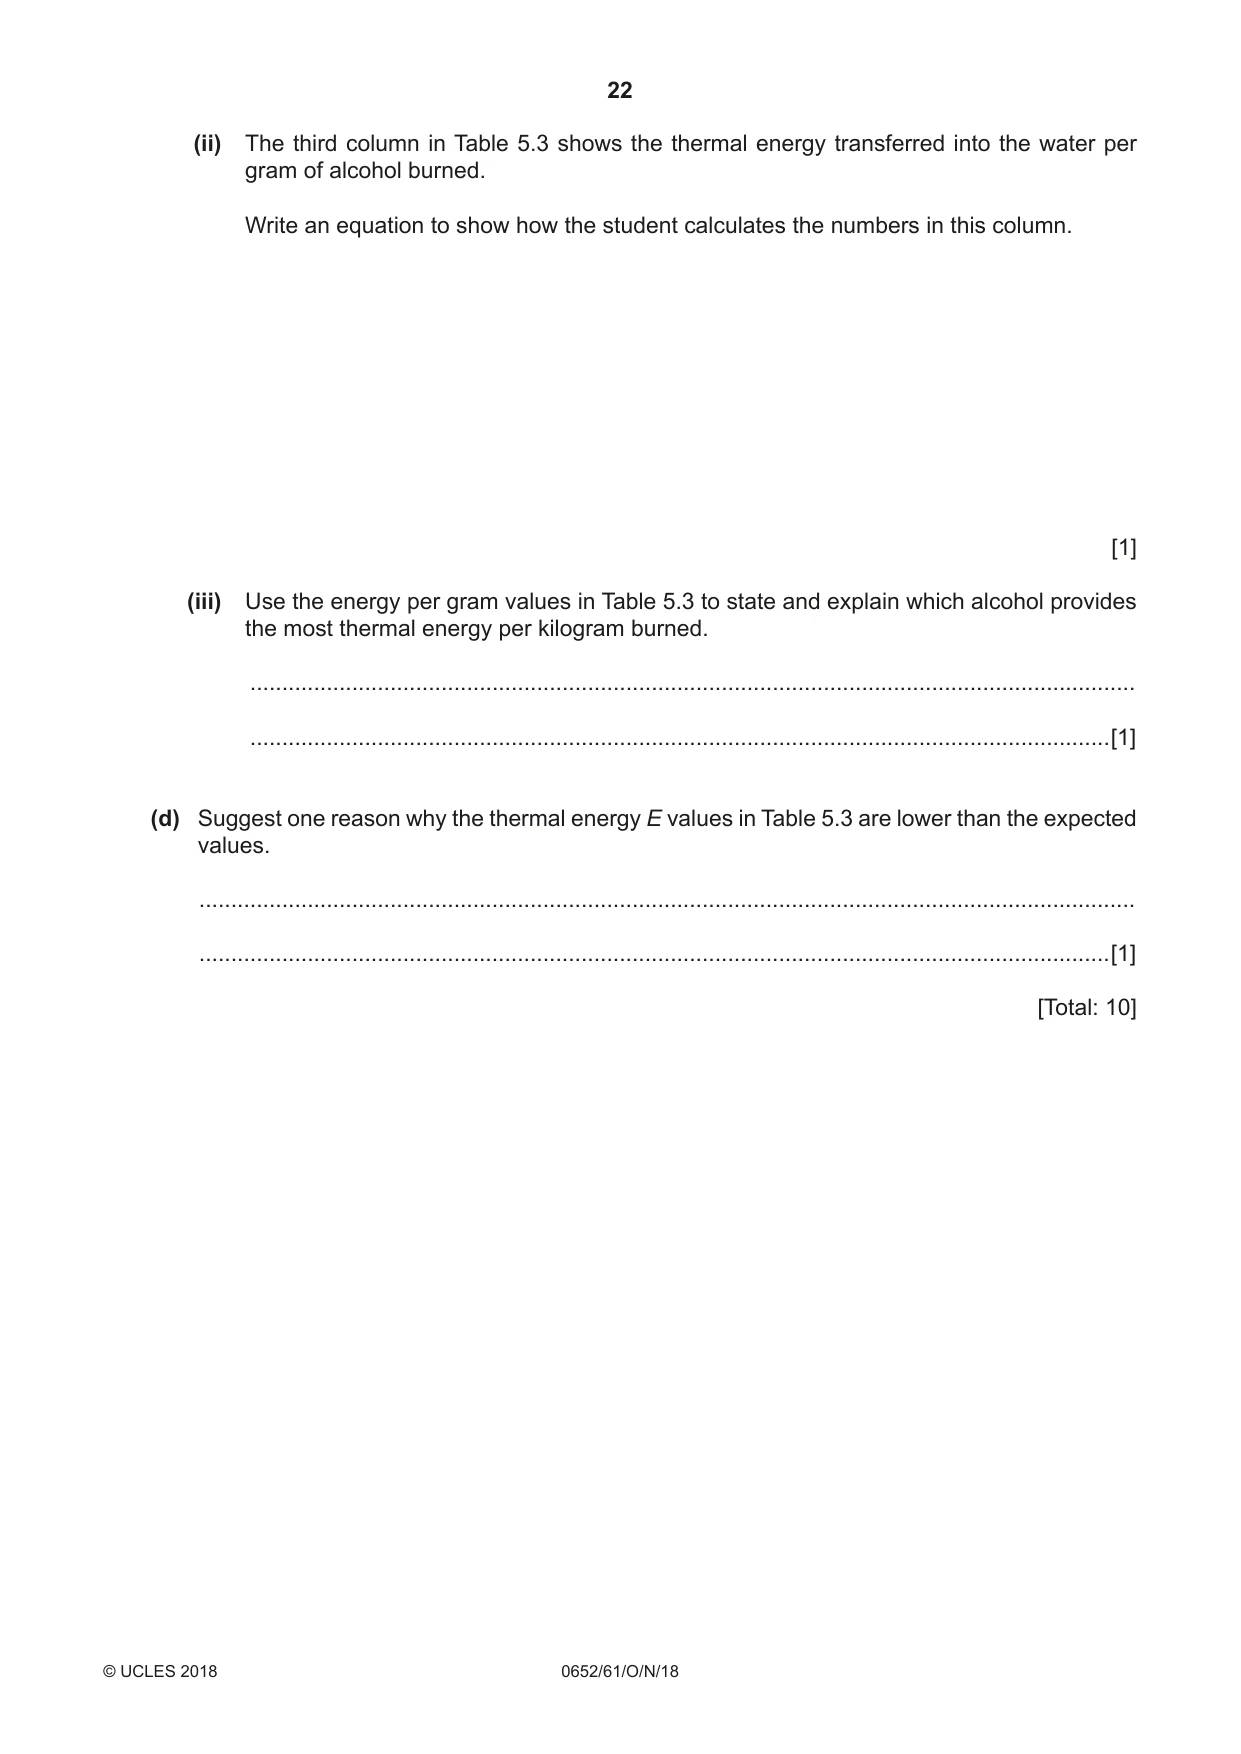
5 A student investigates the three alcohol fuels, ethanol, propanol and butanol, to find out which of them supplies the most energy per kilogram when they burn in air. He uses the apparatus shown in Fig. 5.1. thermometer clamp 100 cm3 water spirit burner alcohol Fig. 5.1 • He measures the mass m1 of the spirit burner and ethanol before burning. He records this mass m1 in Table 5.1. • He places 100 cm3 of water into the beaker and clamps the beaker above the spirit burner as shown in Fig. 5.1. • He measures the temperature T1 of the water to the nearest 0.5 °C. He records this value in Table 5.2. • He lights the burner. • He extinguishes the burner when the temperature rises above 50 °C. • He stirs the water and records in Table 5.2 the highest temperature T2. • He then measures the mass m2 of the spirit burner and ethanol after burning. He records this value in Table 5.1. • He repeats the procedure for propanol and butanol. Table 5.1 mass of alcohol alcohol m1 / g m2 / g burned m / g ethanol 188.48 187.41 1.07 propanol 175.63 174.67 0.96 butanol 191.03 190.10 0.93 Table 5.2 change in temp ΔT alcohol T1 / °C T2 / °C / °C ethanol 22.0 60.0 38.0 propanol 23.0 61.5 38.5 butanol 23.5 ............... ............... (a) (i) Fig. 5.2 shows the thermometer for the highest temperature T2 observed for the burning of butanol. Record in Table 5.2 the reading to the nearest 0.5 °C. [1] °C 80 75 70 65 60 55 highest temperature T2 for butanol Fig. 5.2 (ii) Calculate the change in temperature ΔT for butanol. Record this value in Table 5.2. [1] (b) (i) State and explain one safety precaution that should be taken when carrying out this experiment. precaution ......................................................................................................................... ........................................................................................................................................... explanation ........................................................................................................................ ........................................................................................................................................... [1] (ii) The student uses the same volume of water for all three alcohols. State another variable that must be kept constant to make this a fair test. ........................................................................................................................................... .......................................................................................................................................[1] (iii) Name a piece of apparatus suitable for measuring the volume of water. .......................................................................................................................................[1] (c) (i) Calculate the thermal energy E transferred into the water when ethanol is burned. Use the equation shown. E = volume of water (cm3) × 4.2 × ΔT Record your answer in Table 5.3 to 3 significant figures. [2] Table 5.3 energy per gram of alcohol alcohol E / J / J per g ethanol 14 900 ................. propanol 16 200 16 900 butanol 16 800 18 100 (ii) The third column in Table 5.3 shows the thermal energy transferred into the water per gram of alcohol burned. Write an equation to show how the student calculates the numbers in this column. [1] (iii) Use the energy per gram values in Table 5.3 to state and explain which alcohol provides the most thermal energy per kilogram burned. ........................................................................................................................................... .......................................................................................................................................[1] (d) Suggest one reason why the thermal energy E values in Table 5.3 are lower than the expected values. ................................................................................................................................................... ...............................................................................................................................................[1] [Total: 10]
Mark scheme: 5(a)(i) 63.5 ; 1 5(a)(ii) 40.0 ; 1 5(b)(i) keep other alcohols away from flame and to prevent fire / as inflammable / tie up long hair and as could catch fire / tuck in loose clothing and as could catch fire ; 1 5(b)(ii) same distance from flame to beaker / water / same size flame ; 1 5(b)(iii) measuring cylinder ; 1 5(c)(i) use of 100 × 4.2 × 38.0 ; 16000 ; 2 5(c)(ii) Energy / joules per gram = E / m ; 1 5(c)(iii) butanol AND larger / largest number of joules per gram / kg energy per gram / kg / 18100 / 18100000 is higher / the highest ; 1 5(d) heat lost to air / surroundings / heat lost to glass / incomplete combustion ; 1
Q6 · A teacher sets up the apparatus shown in Fig
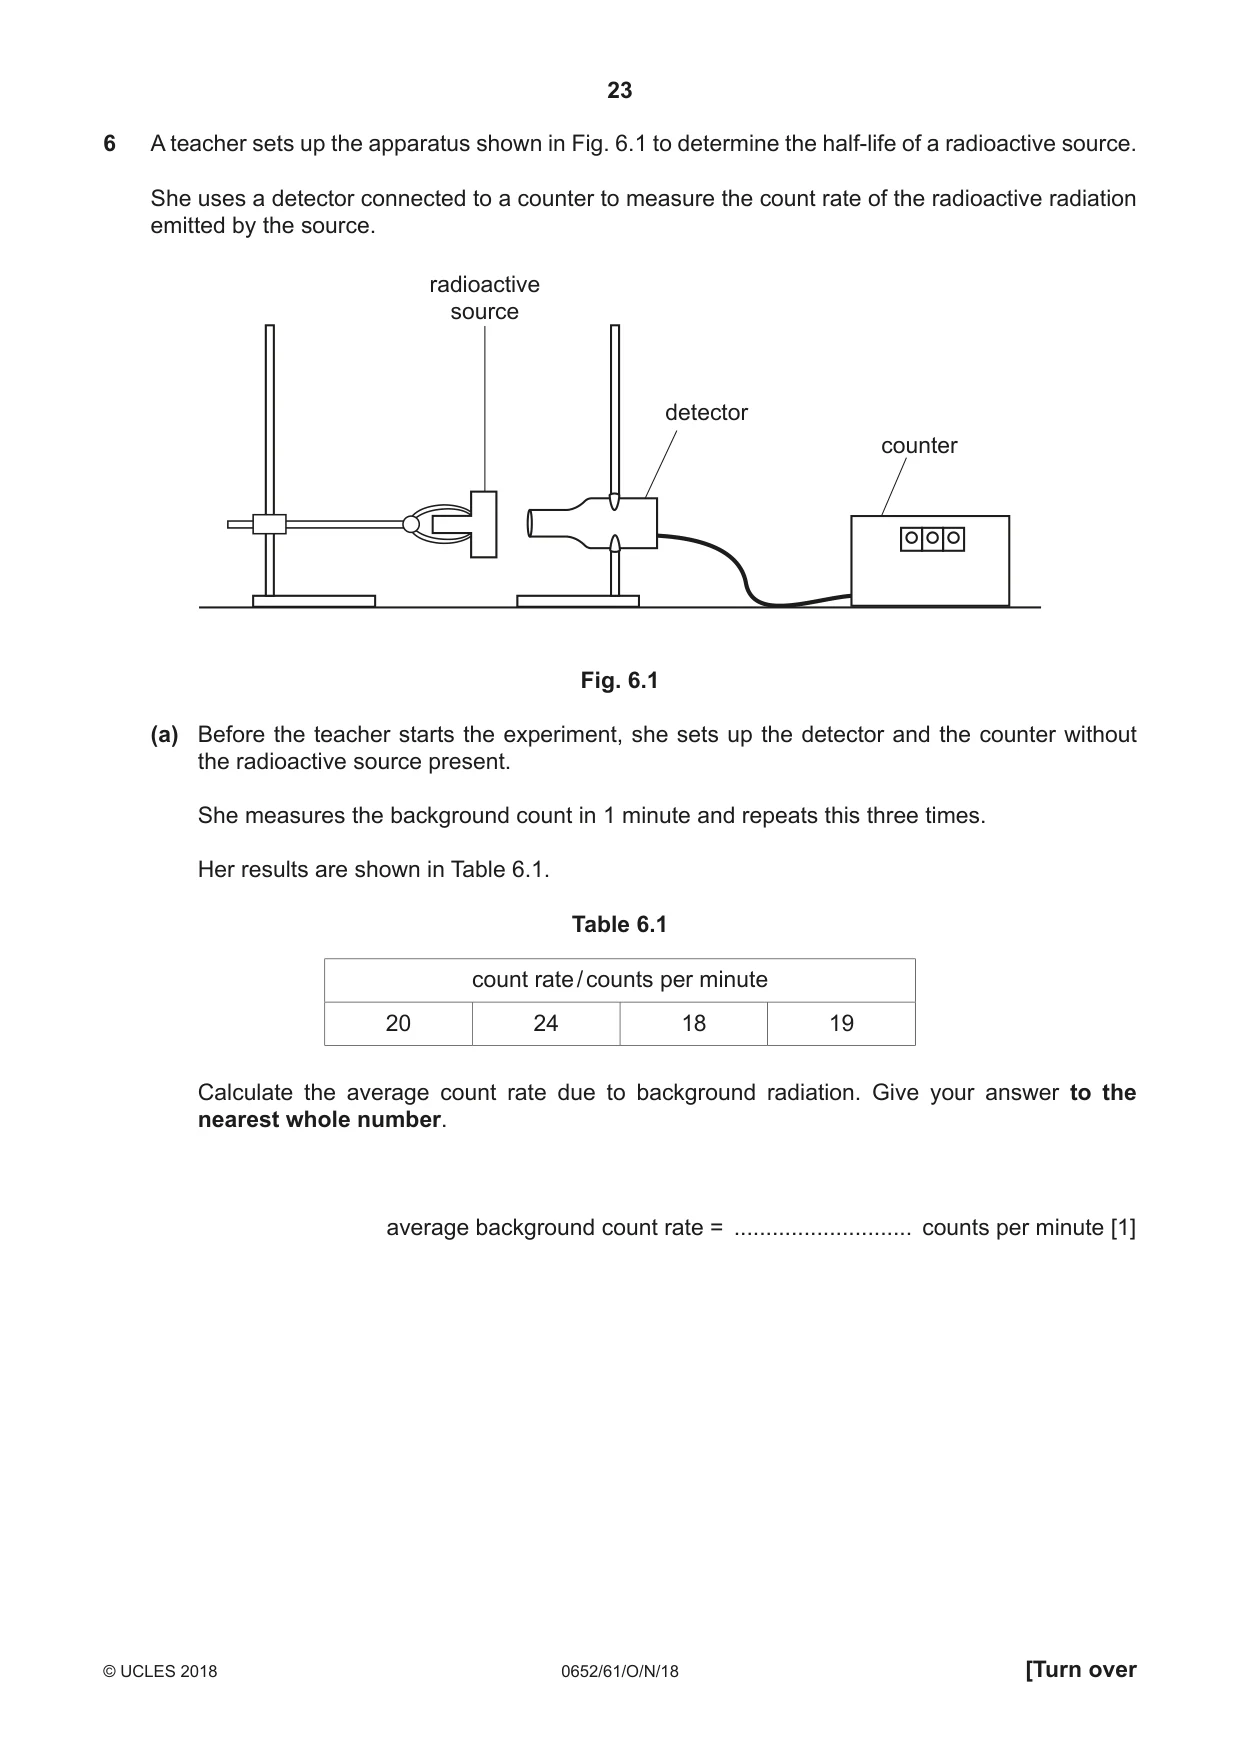
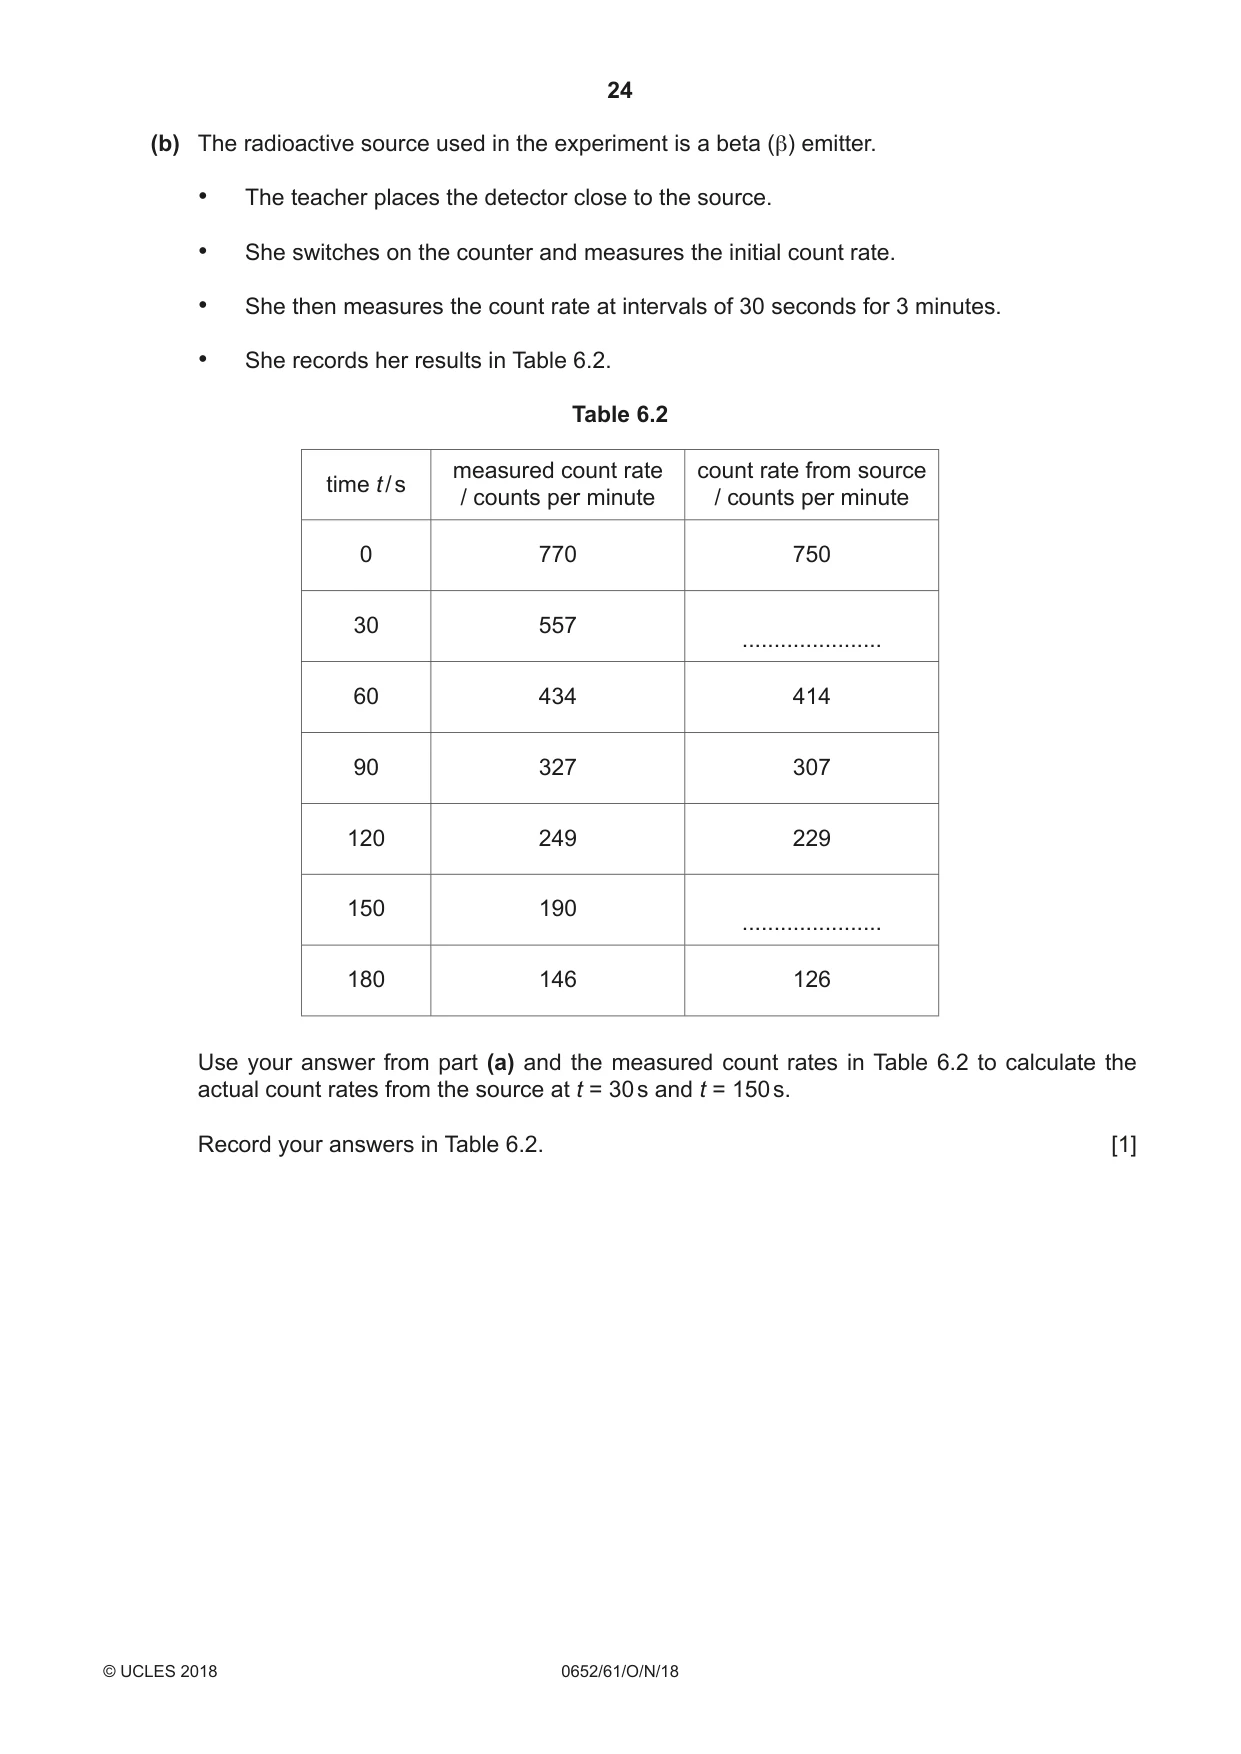
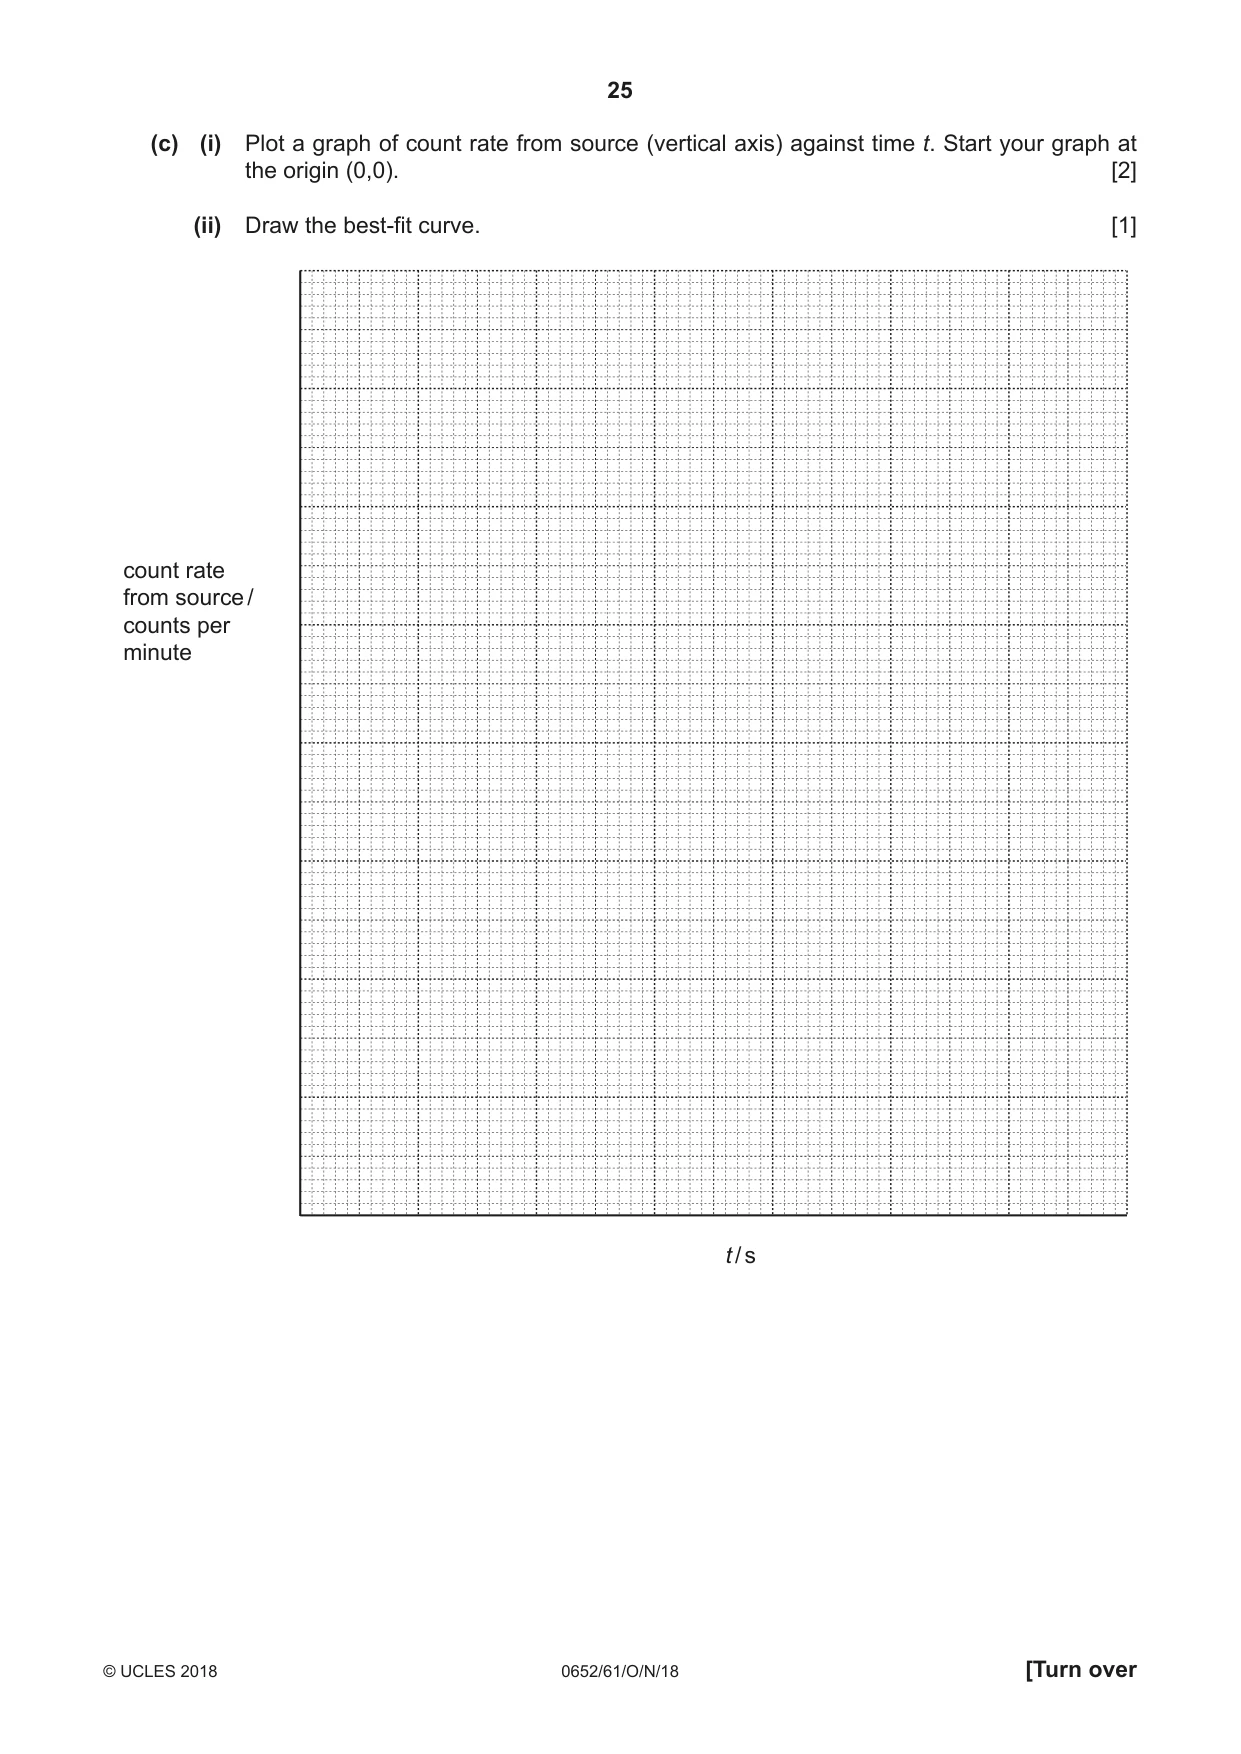
6 A teacher sets up the apparatus shown in Fig. 6.1 to determine the half-life of a radioactive source. She uses a detector connected to a counter to measure the count rate of the radioactive radiation emitted by the source. radioactive source detector counter Fig. 6.1 (a) Before the teacher starts the experiment, she sets up the detector and the counter without the radioactive source present. She measures the background count in 1 minute and repeats this three times. Her results are shown in Table 6.1. Table 6.1 count rate / counts per minute 20 24 18 19 Calculate the average count rate due to background radiation. Give your answer to the nearest whole number. average background count rate = ............................ counts per minute [1] (b) The radioactive source used in the experiment is a beta (β) emitter. • The teacher places the detector close to the source. • She switches on the counter and measures the initial count rate. • She then measures the count rate at intervals of 30 seconds for 3 minutes. • She records her results in Table 6.2. Table 6.2 measured count rate count rate from source time t / s / counts per minute / counts per minute 0 770 750 30 557 ...................... 60 434 414 90 327 307 120 249 229 150 190 ...................... 180 146 126 Use your answer from part (a) and the measured count rates in Table 6.2 to calculate the actual count rates from the source at t = 30 s and t = 150 s. Record your answers in Table 6.2. [1] (c) (i) Plot a graph of count rate from source (vertical axis) against time t. Start your graph at the origin (0,0). [2] (ii) Draw the best-fit curve. [1] count rate from source / counts per minute t / s
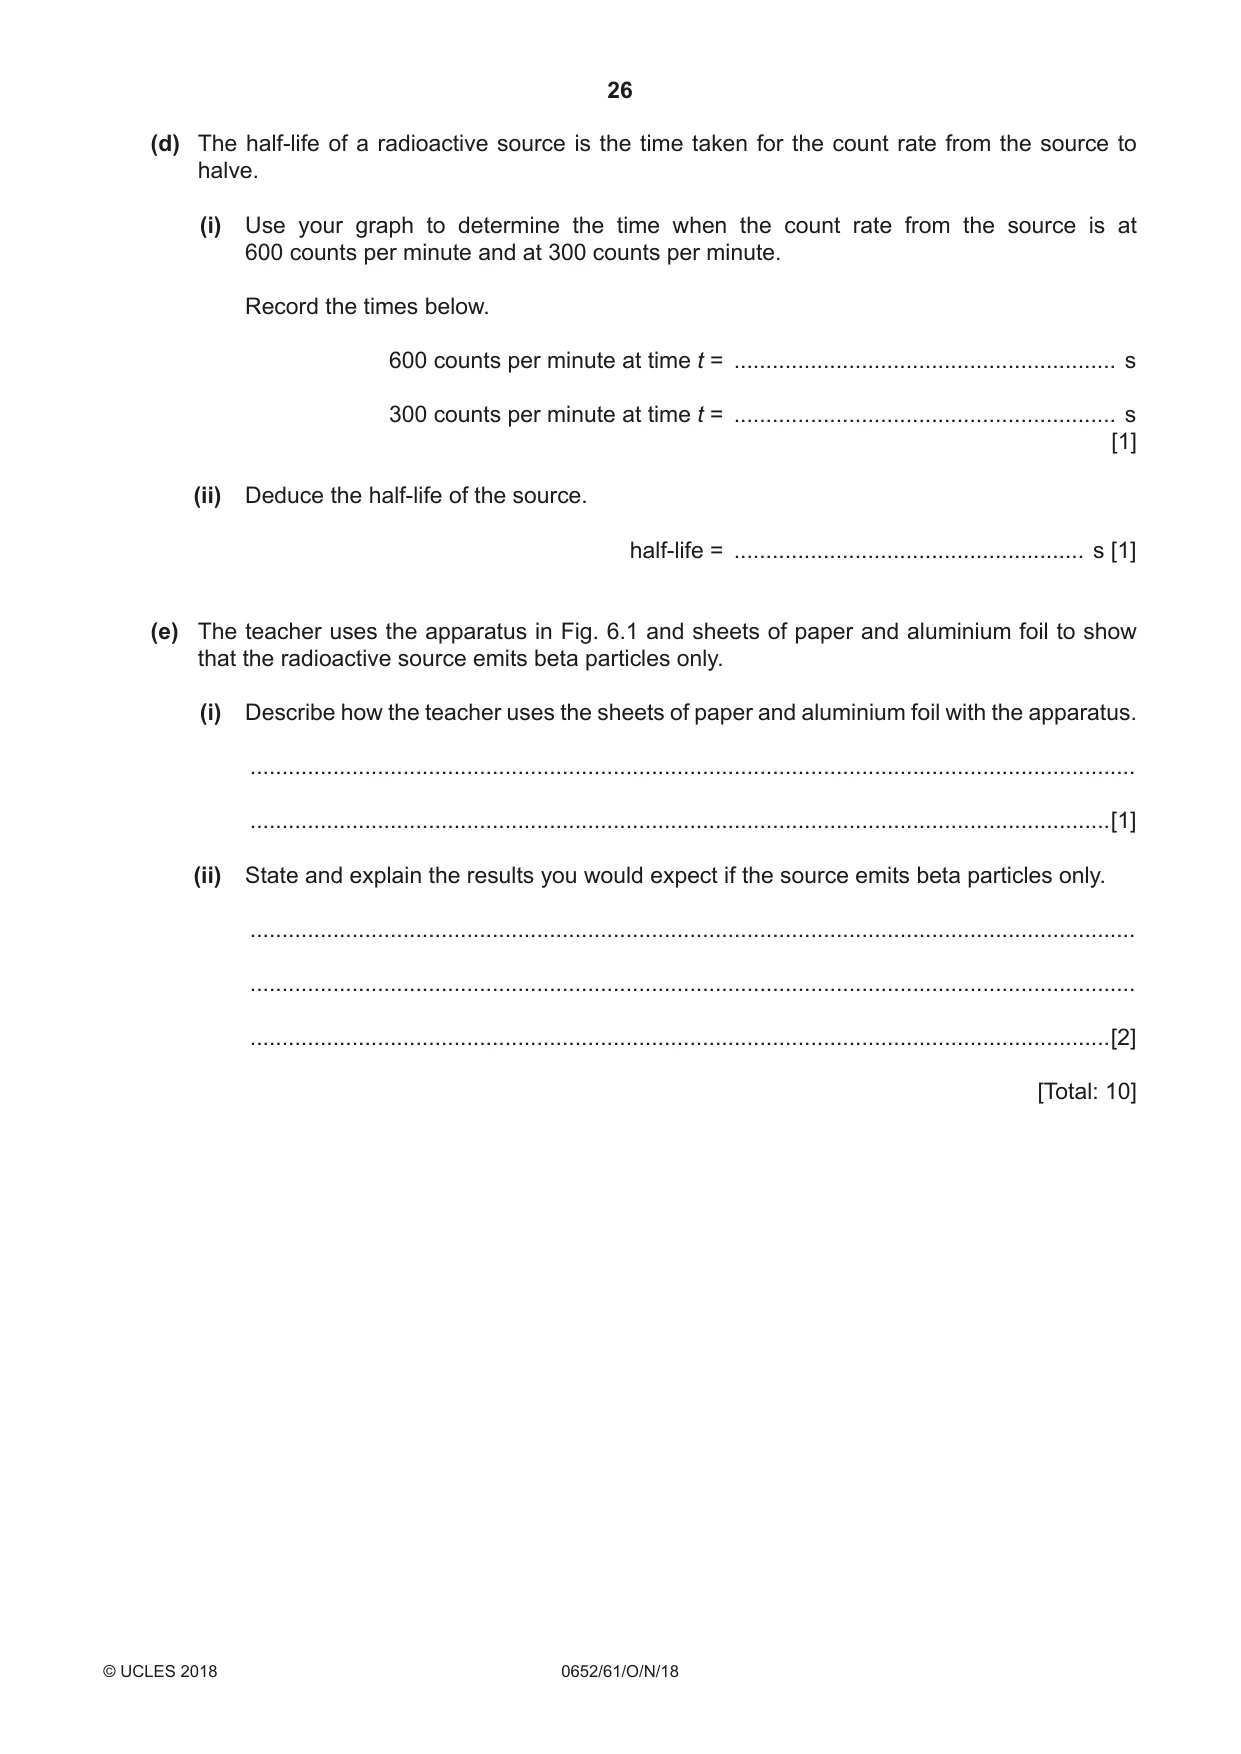
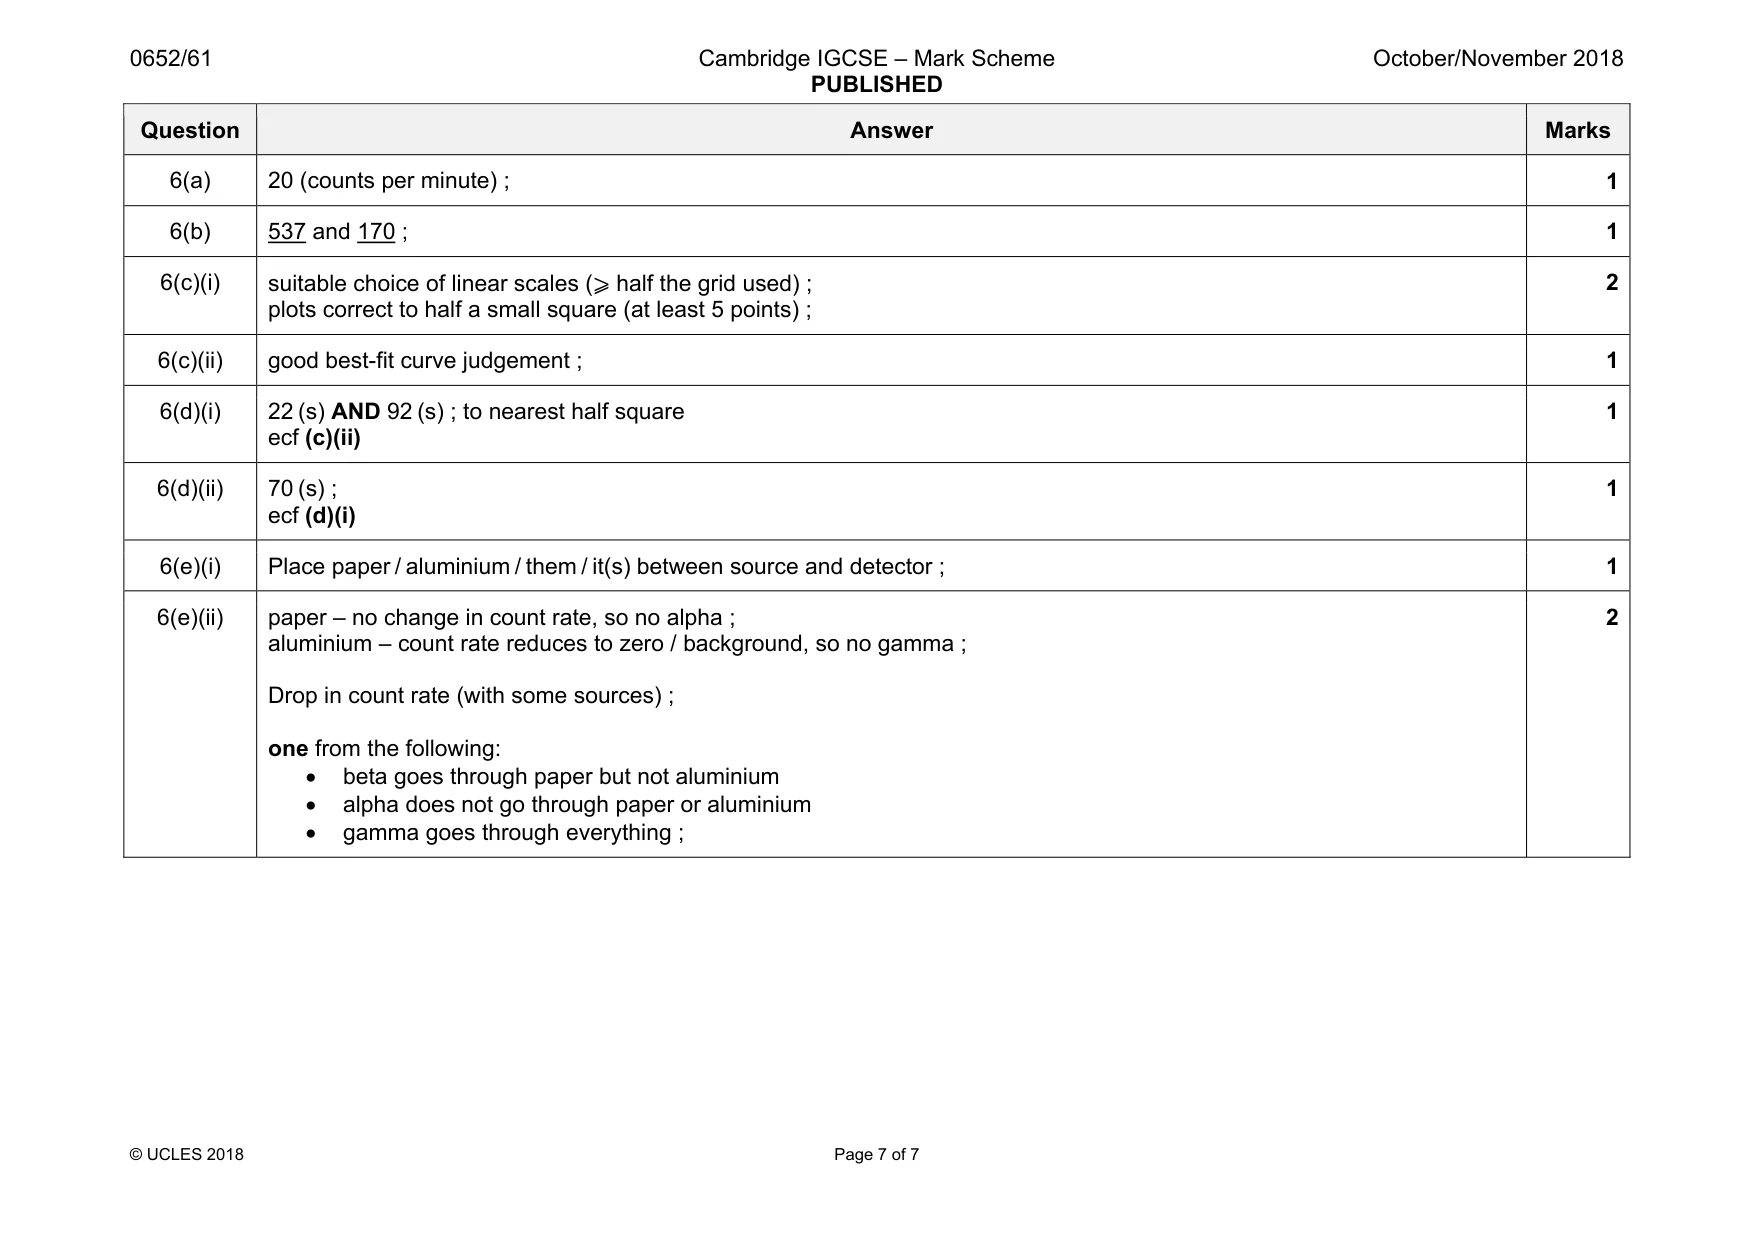
Mark scheme: 6(a) 20 (counts per minute) ; 1 6(b) 537 and 170 ; 1 6(c)(i) suitable choice of linear scales (⩾ half the grid used) ; plots correct to half a small square (at least 5 points) ; 2 6(c)(ii) good best-fit curve judgement ; 1 6(d)(i) 22 (s) AND 92 (s) ; to nearest half square ecf (c)(ii) 1 6(d)(ii) 70 (s) ; ecf (d)(i) 1 6(e)(i) Place paper / aluminium / them / it(s) between source and detector ; 1 6(e)(ii) paper – no change in count rate, so no alpha ; aluminium – count rate reduces to zero / background, so no gamma ; Drop in count rate (with some sources) ; one from the following: • beta goes through paper but not aluminium • alpha does not go through paper or aluminium • gamma goes through everything ; 2
What was in this paper
The subtopics covered by these 6 questions, and how many questions each got. Open one in a new tab to see every Cambridge question on it.
What you needed in this session
Cambridge’s own grade thresholds for 2018 Oct/Nov, Paper 6 · Variant 1. A higher threshold means an easier paper — the bar moves with how the cohort did.