Cambridge IGCSE Physical Science 0652 — 2021 Oct/Nov Paper 6 · Variant 1
0652/61/O/N/21 · 4 questions · 40 marks · ≈45 min
The question paper and its mark scheme, free to read here and free to download. This is Cambridge’s own paper, exactly as it was sat.
Question paper16 pages

Mark scheme7 pages
Answers below. Sit the paper first if you are practising.
Questions as text
Q1 · A student investigates different arrangements of resistors
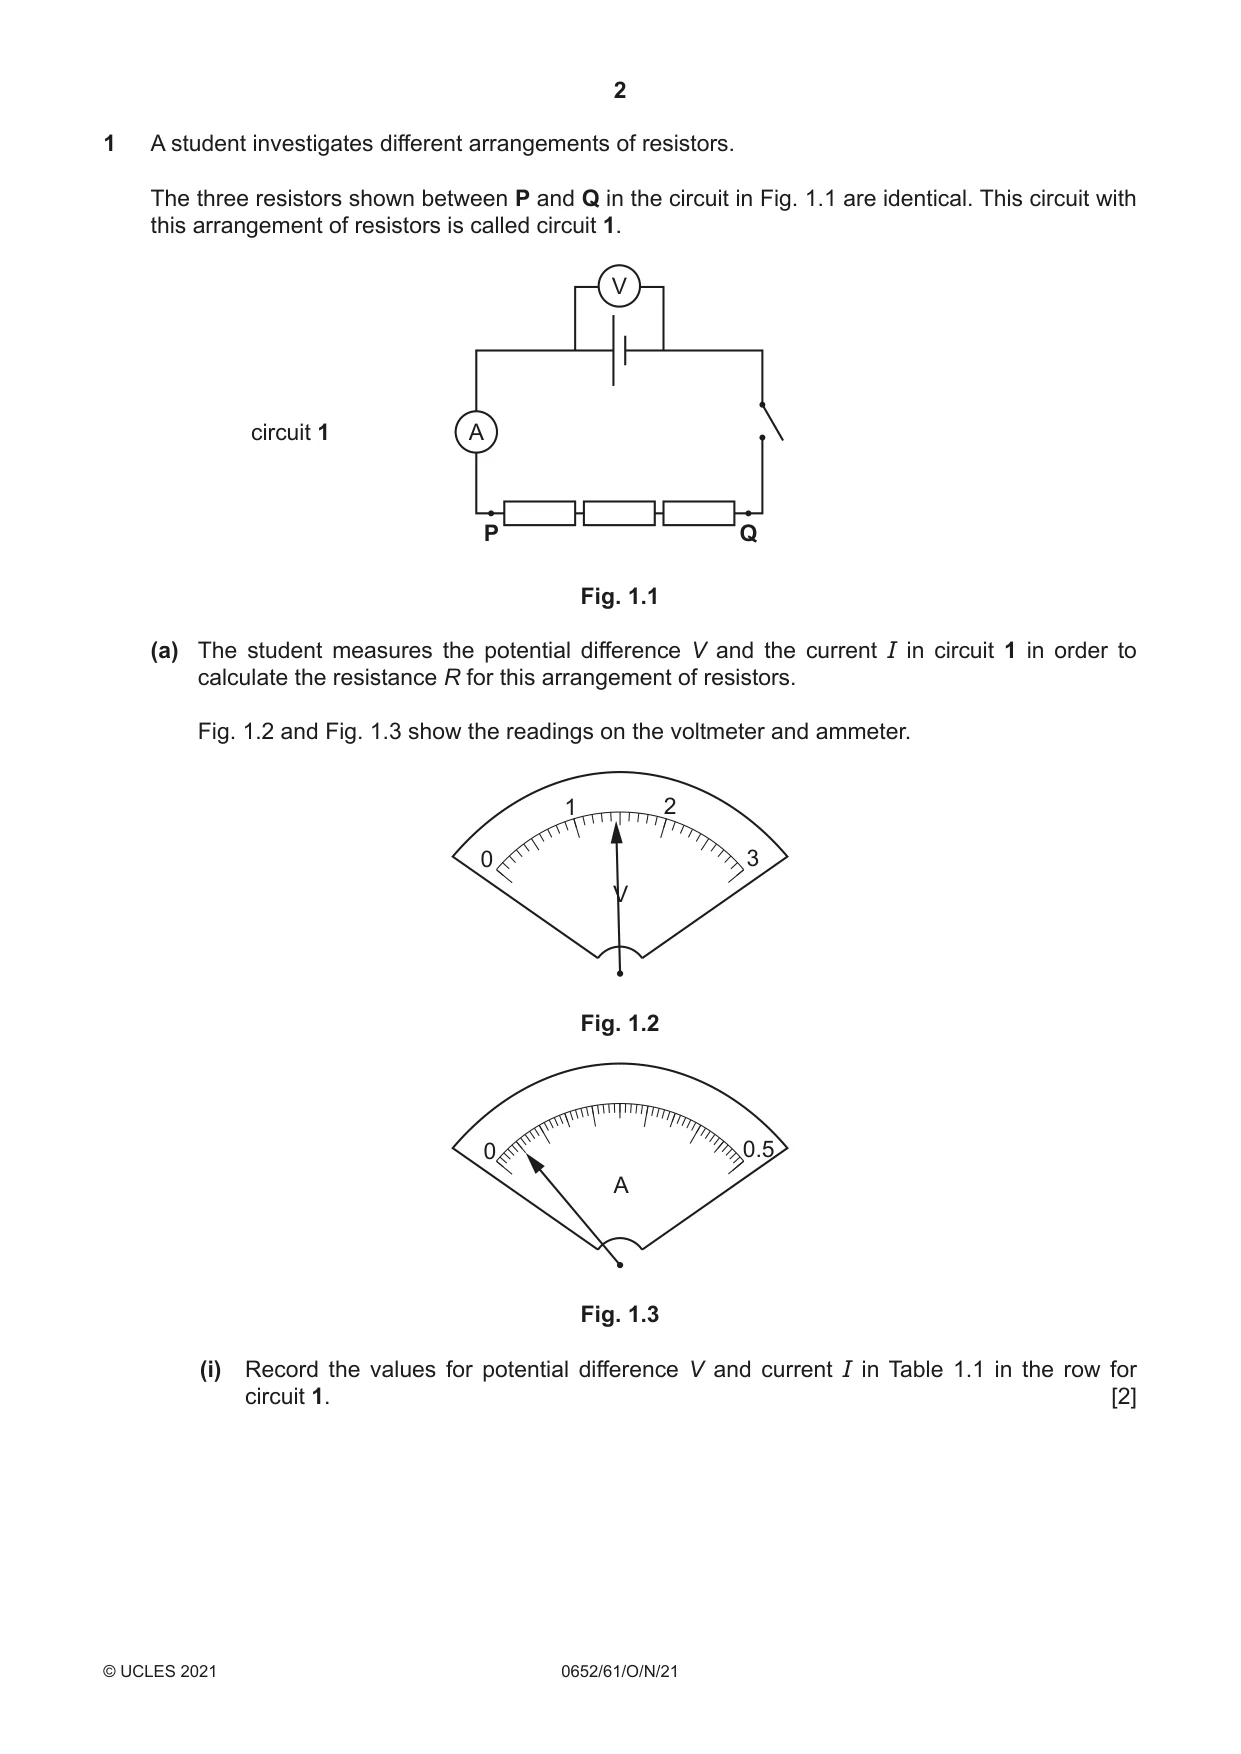
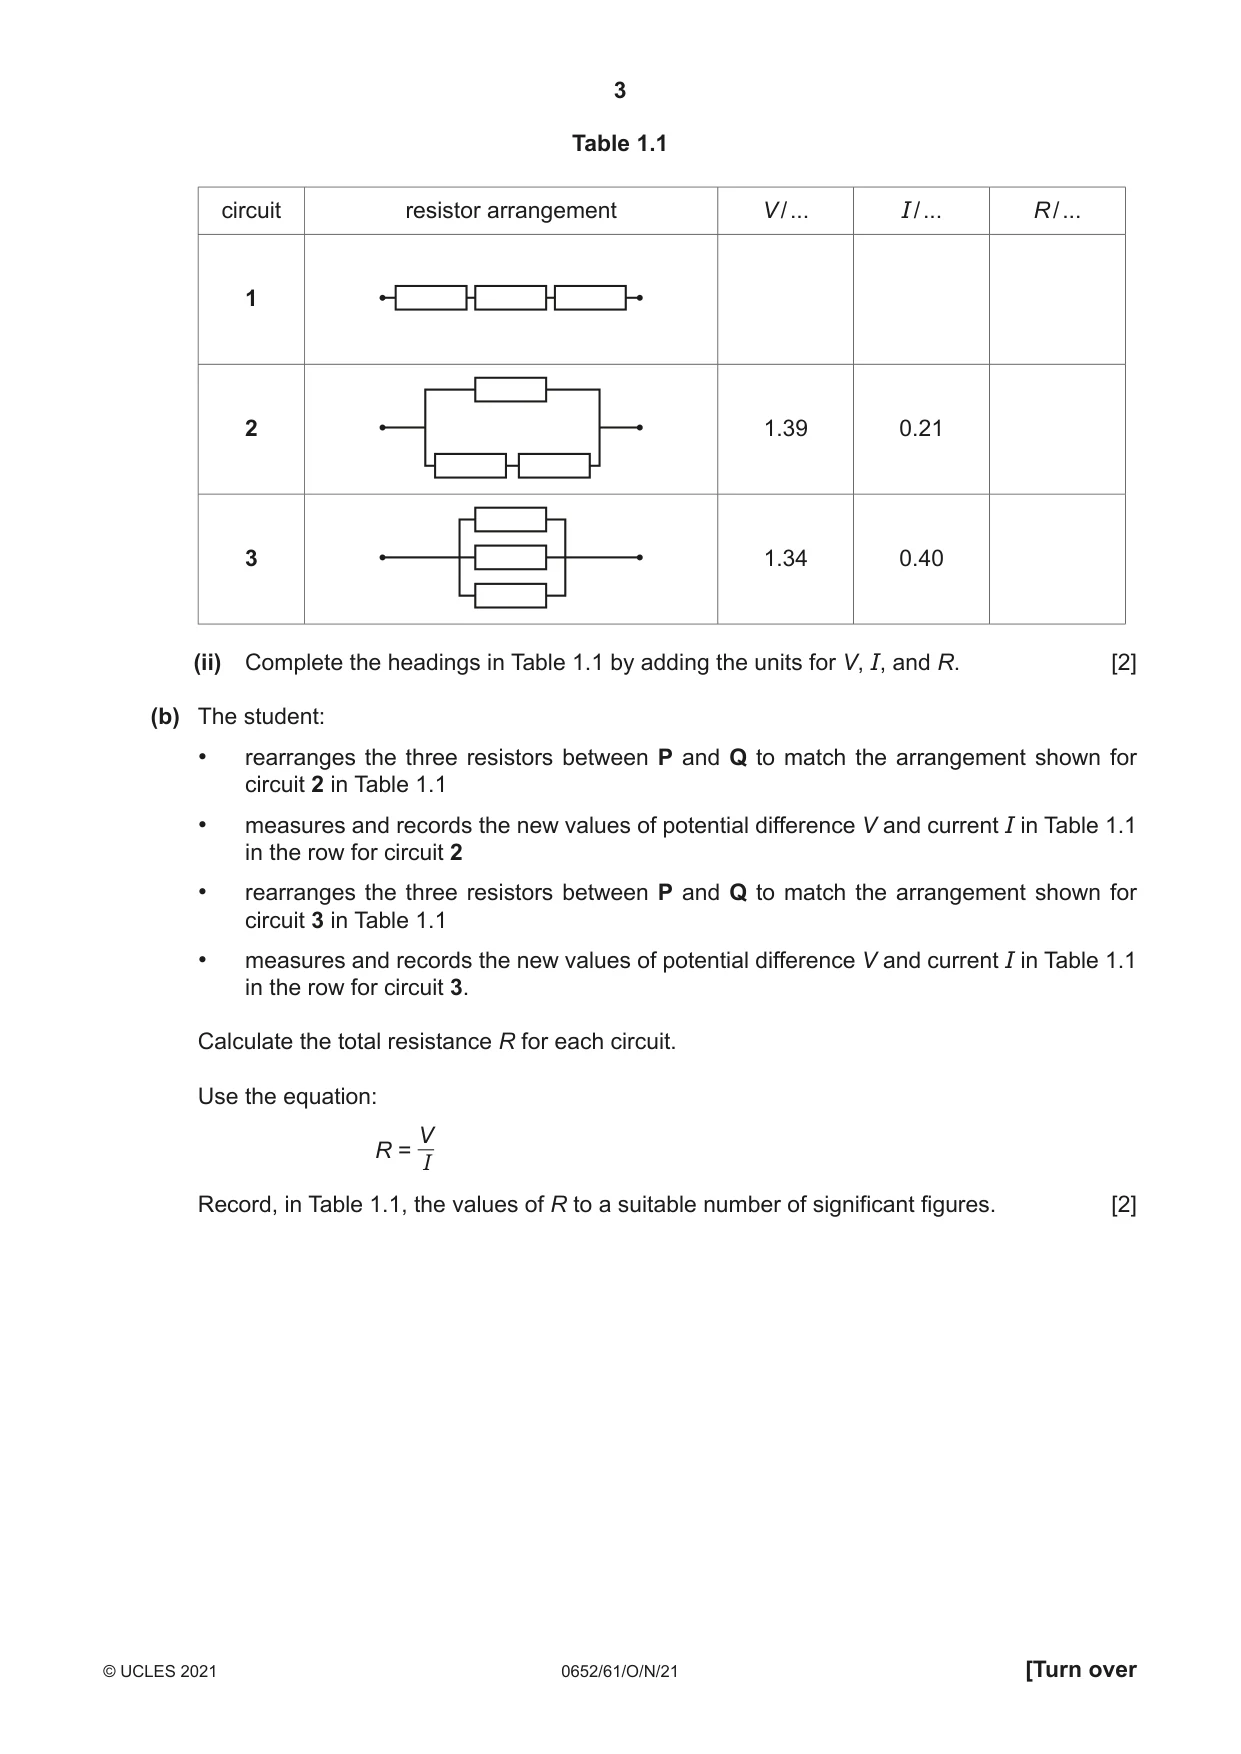
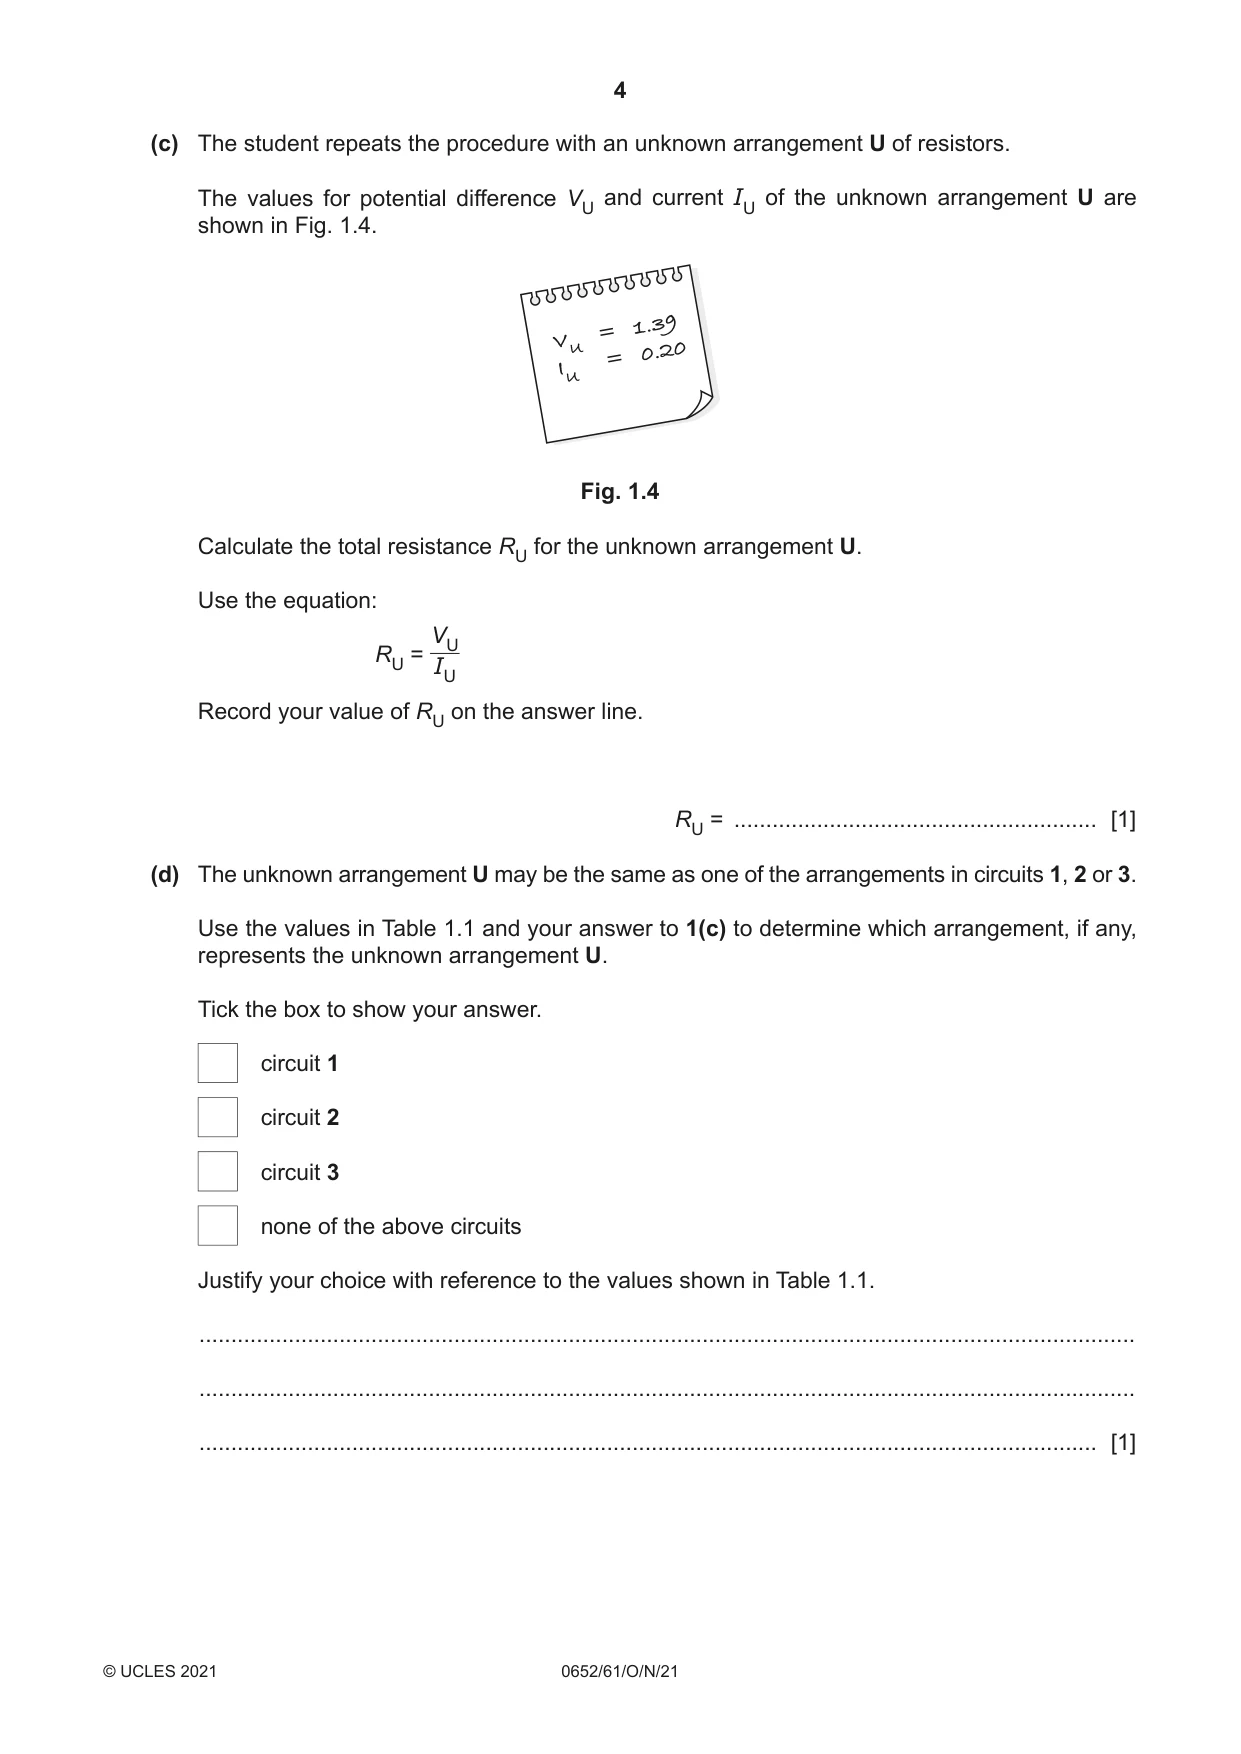
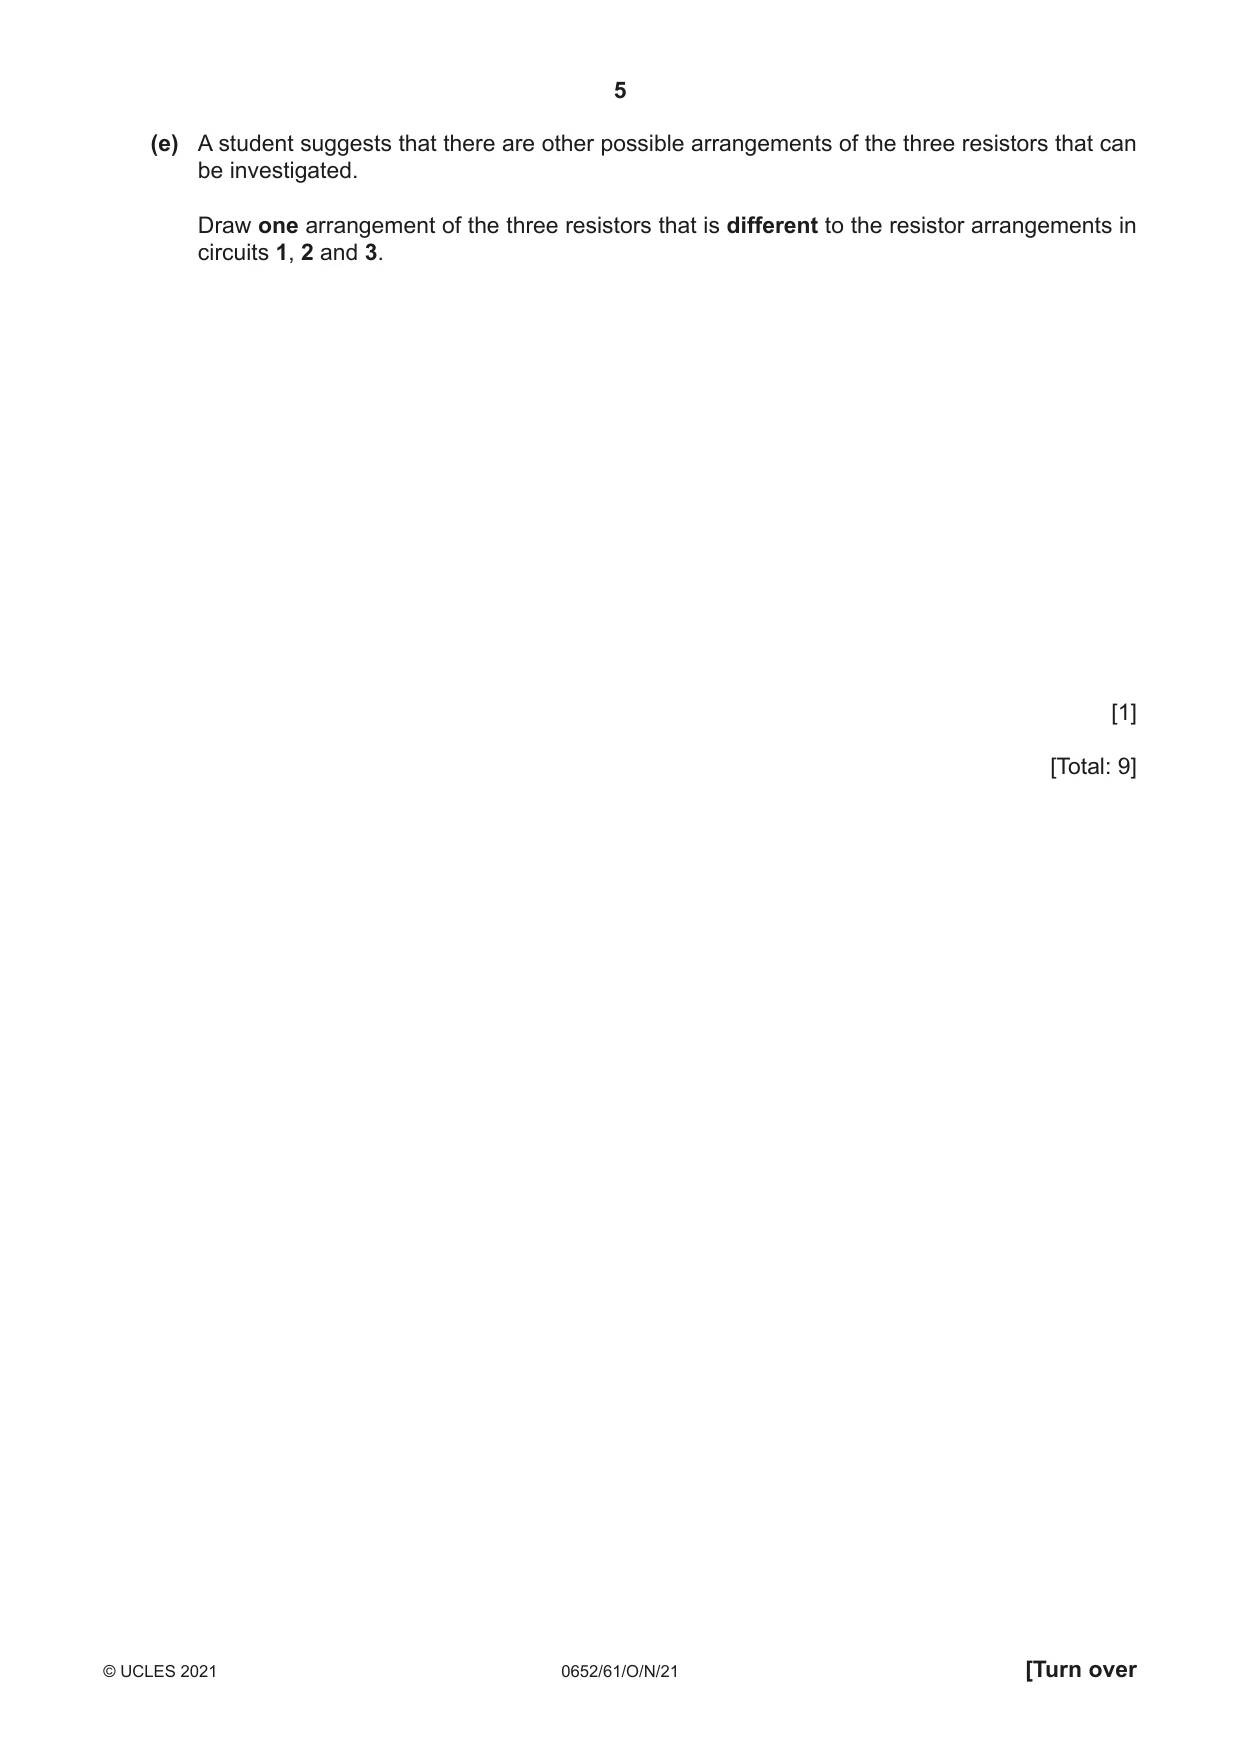
1 A student investigates different arrangements of resistors. The three resistors shown between P and Q in the circuit in Fig. 1.1 are identical. This circuit with this arrangement of resistors is called circuit 1. V circuit 1 A P Q Fig. 1.1 (a) The student measures the potential difference V and the current I in circuit 1 in order to calculate the resistance R for this arrangement of resistors. Fig. 1.2 and Fig. 1.3 show the readings on the voltmeter and ammeter. 1 2 0 3 V Fig. 1.2 0 0.5 A Fig. 1.3 (i) Record the values for potential difference V and current I in Table 1.1 in the row for circuit 1. [2] Table 1.1 circuit resistor arrangement V / ... I / ... R / ... 1 2 1.39 0.21 3 1.34 0.40 (ii) Complete the headings in Table 1.1 by adding the units for V, I, and R. [2] (b) The student: • rearranges the three resistors between P and Q to match the arrangement shown for circuit 2 in Table 1.1 • measures and records the new values of potential difference V and current I in Table 1.1 in the row for circuit 2 • rearranges the three resistors between P and Q to match the arrangement shown for circuit 3 in Table 1.1 • measures and records the new values of potential difference V and current I in Table 1.1 in the row for circuit 3. Calculate the total resistance R for each circuit. Use the equation: V R = I Record, in Table 1.1, the values of R to a suitable number of significant figures. [2] (c) The student repeats the procedure with an unknown arrangement U of resistors. The values for potential difference VU and current IU of the unknown arrangement U are shown in Fig. 1.4. 1.39 = VU 0.20 = IU Fig. 1.4 Calculate the total resistance RU for the unknown arrangement U. Use the equation: VU RU = IU Record your value of RU on the answer line. RU = ......................................................... [1] (d) The unknown arrangement U may be the same as one of the arrangements in circuits 1, 2 or 3. Use the values in Table 1.1 and your answer to 1(c) to determine which arrangement, if any, represents the unknown arrangement U. Tick the box to show your answer. circuit 1 circuit 2 circuit 3 none of the above circuits Justify your choice with reference to the values shown in Table 1.1. ................................................................................................................................................... ................................................................................................................................................... ............................................................................................................................................. [1] (e) A student suggests that there are other possible arrangements of the three resistors that can be investigated. Draw one arrangement of the three resistors that is different to the resistor arrangements in circuits 1, 2 and 3. [1] [Total: 9]
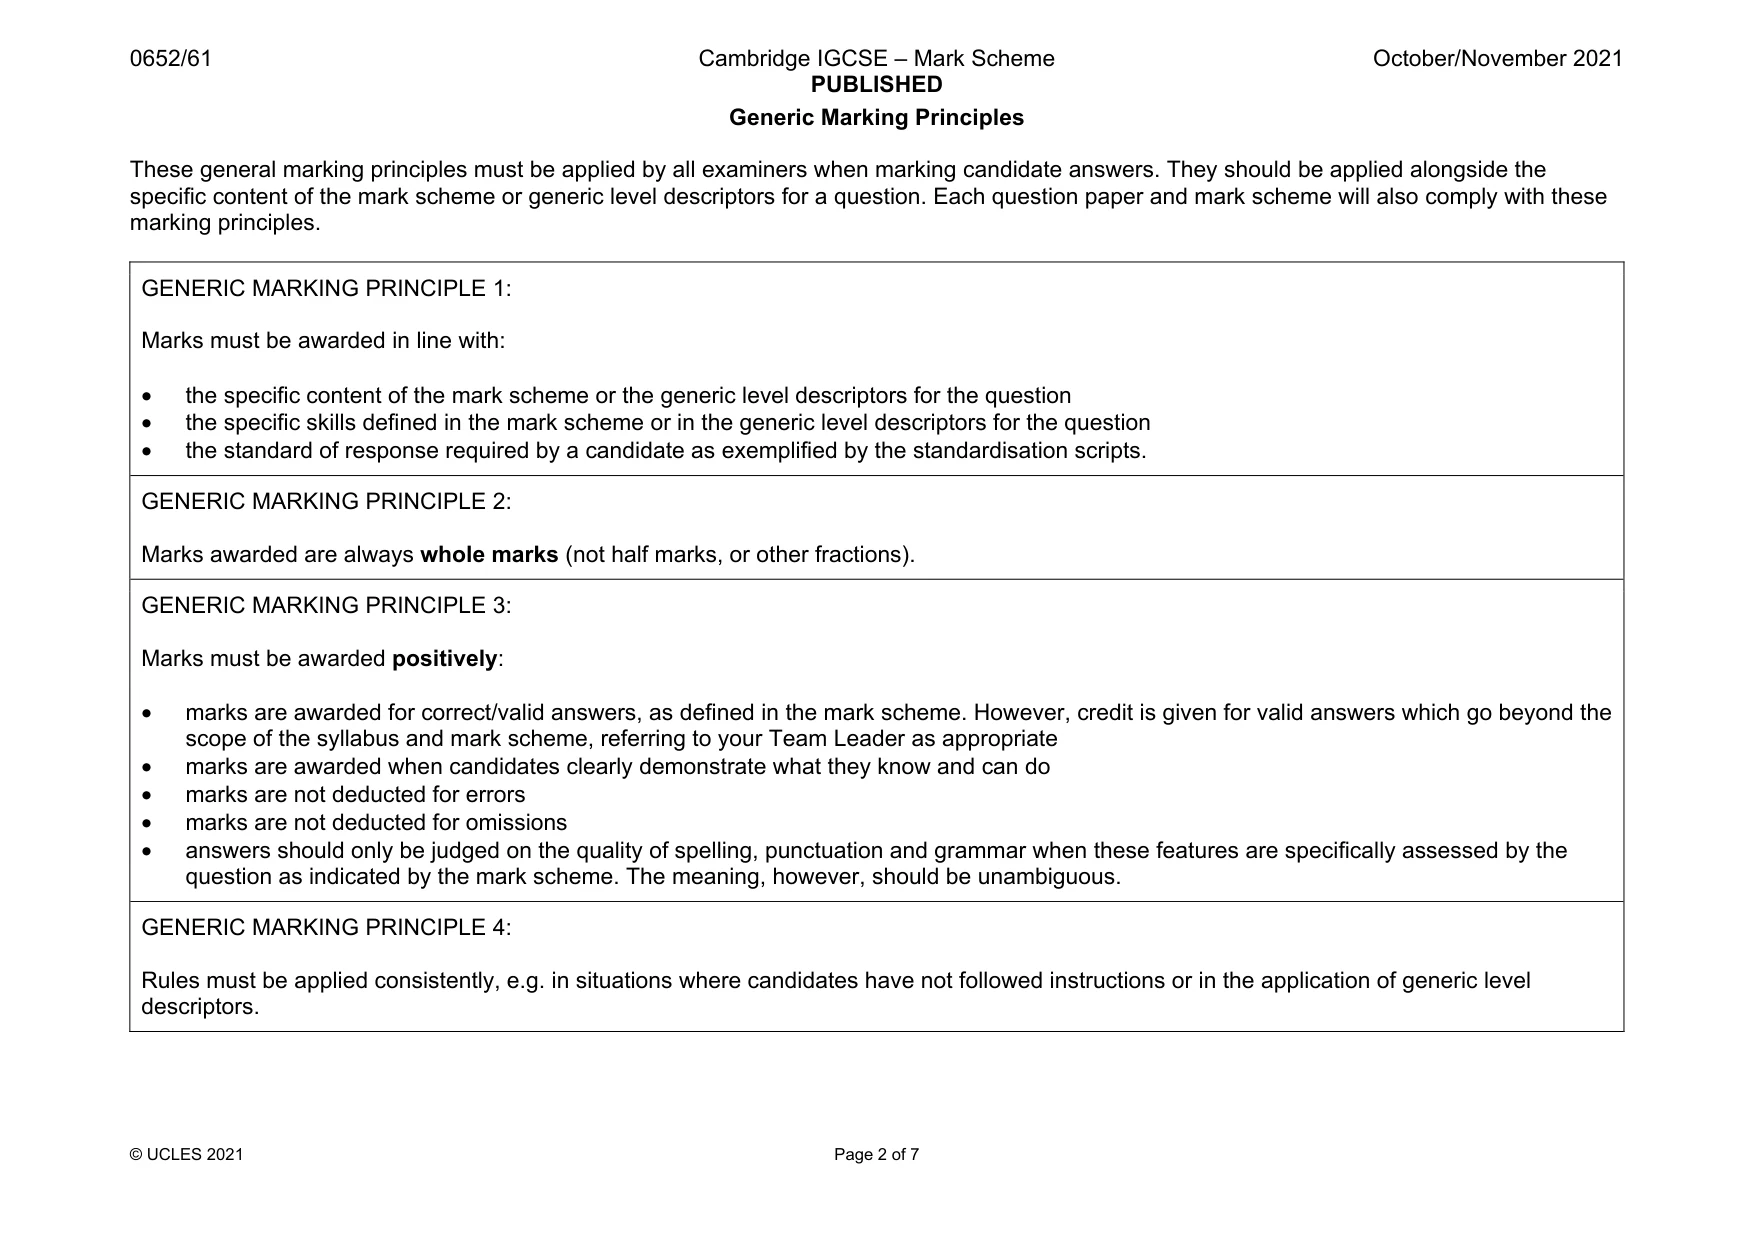
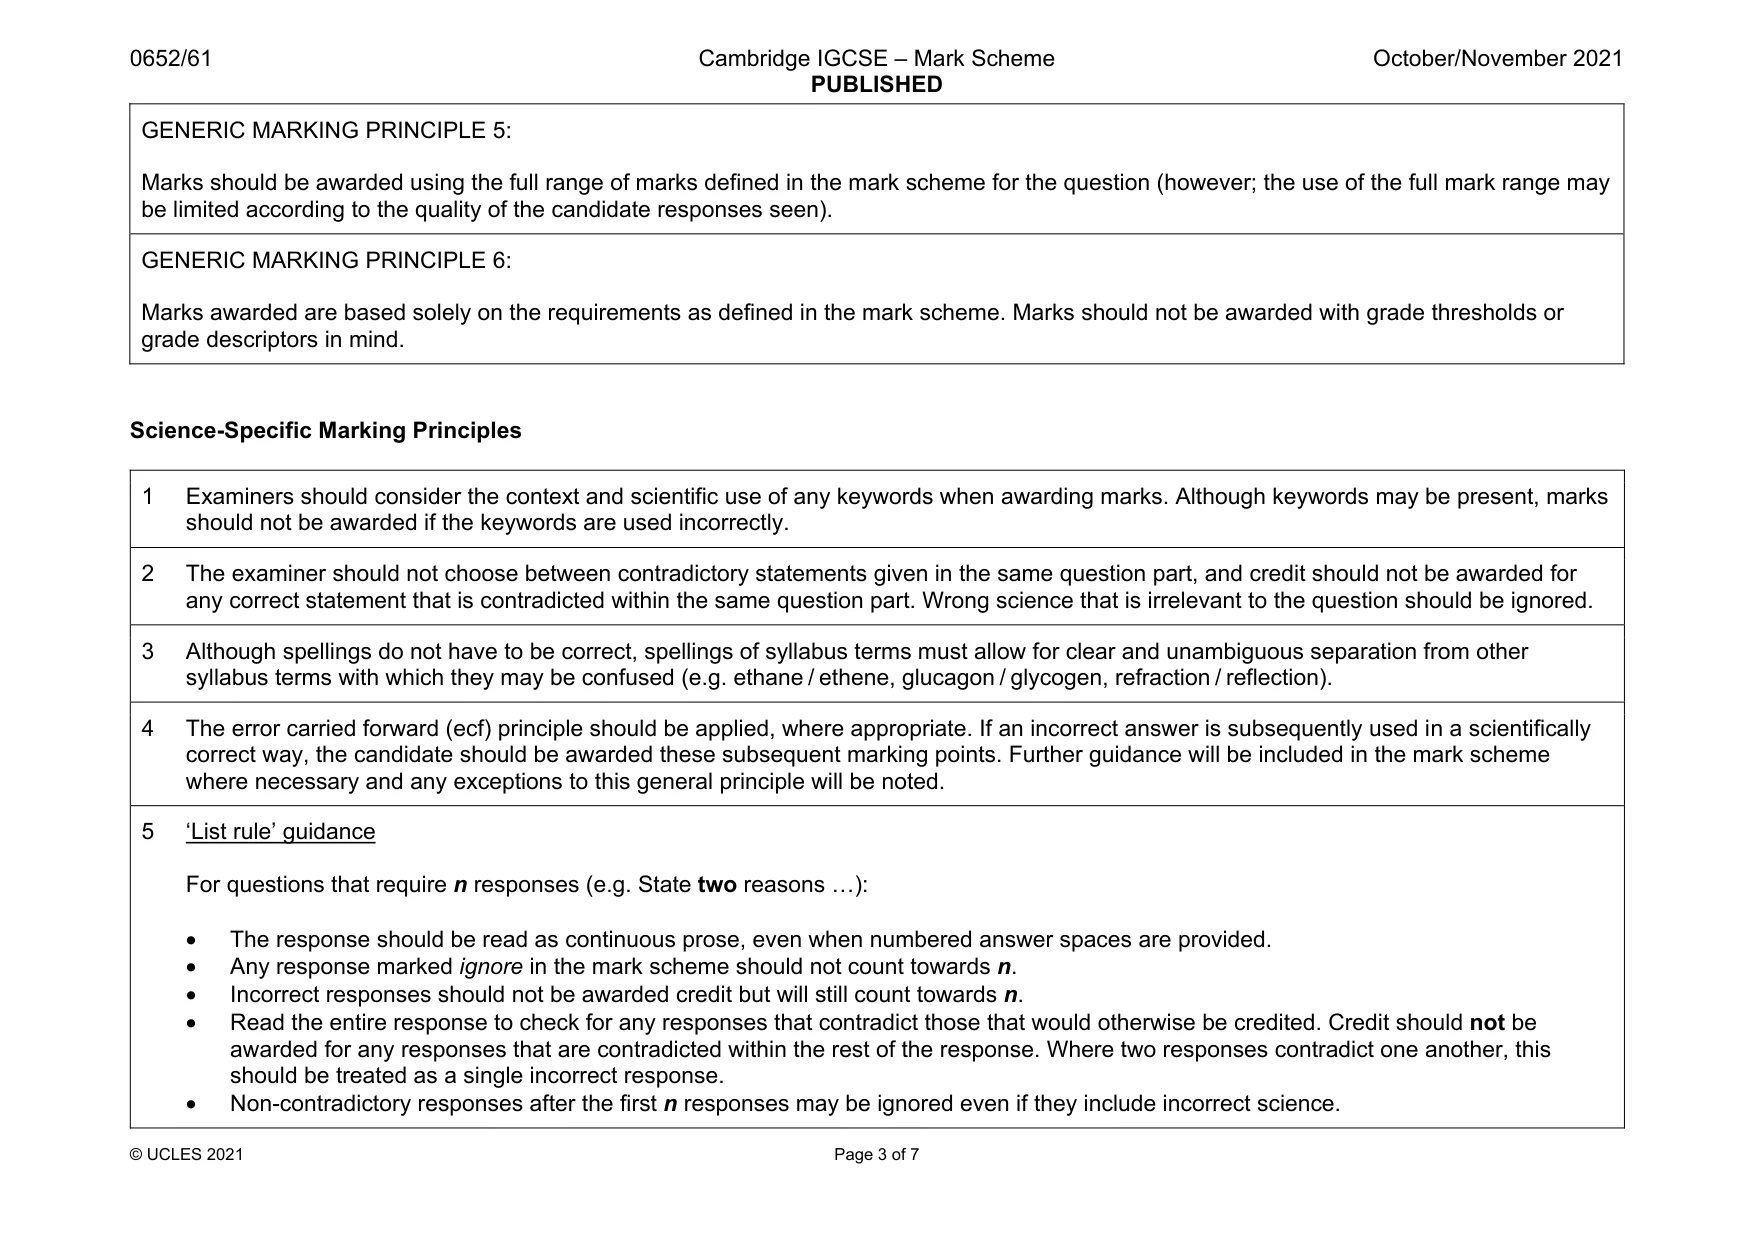
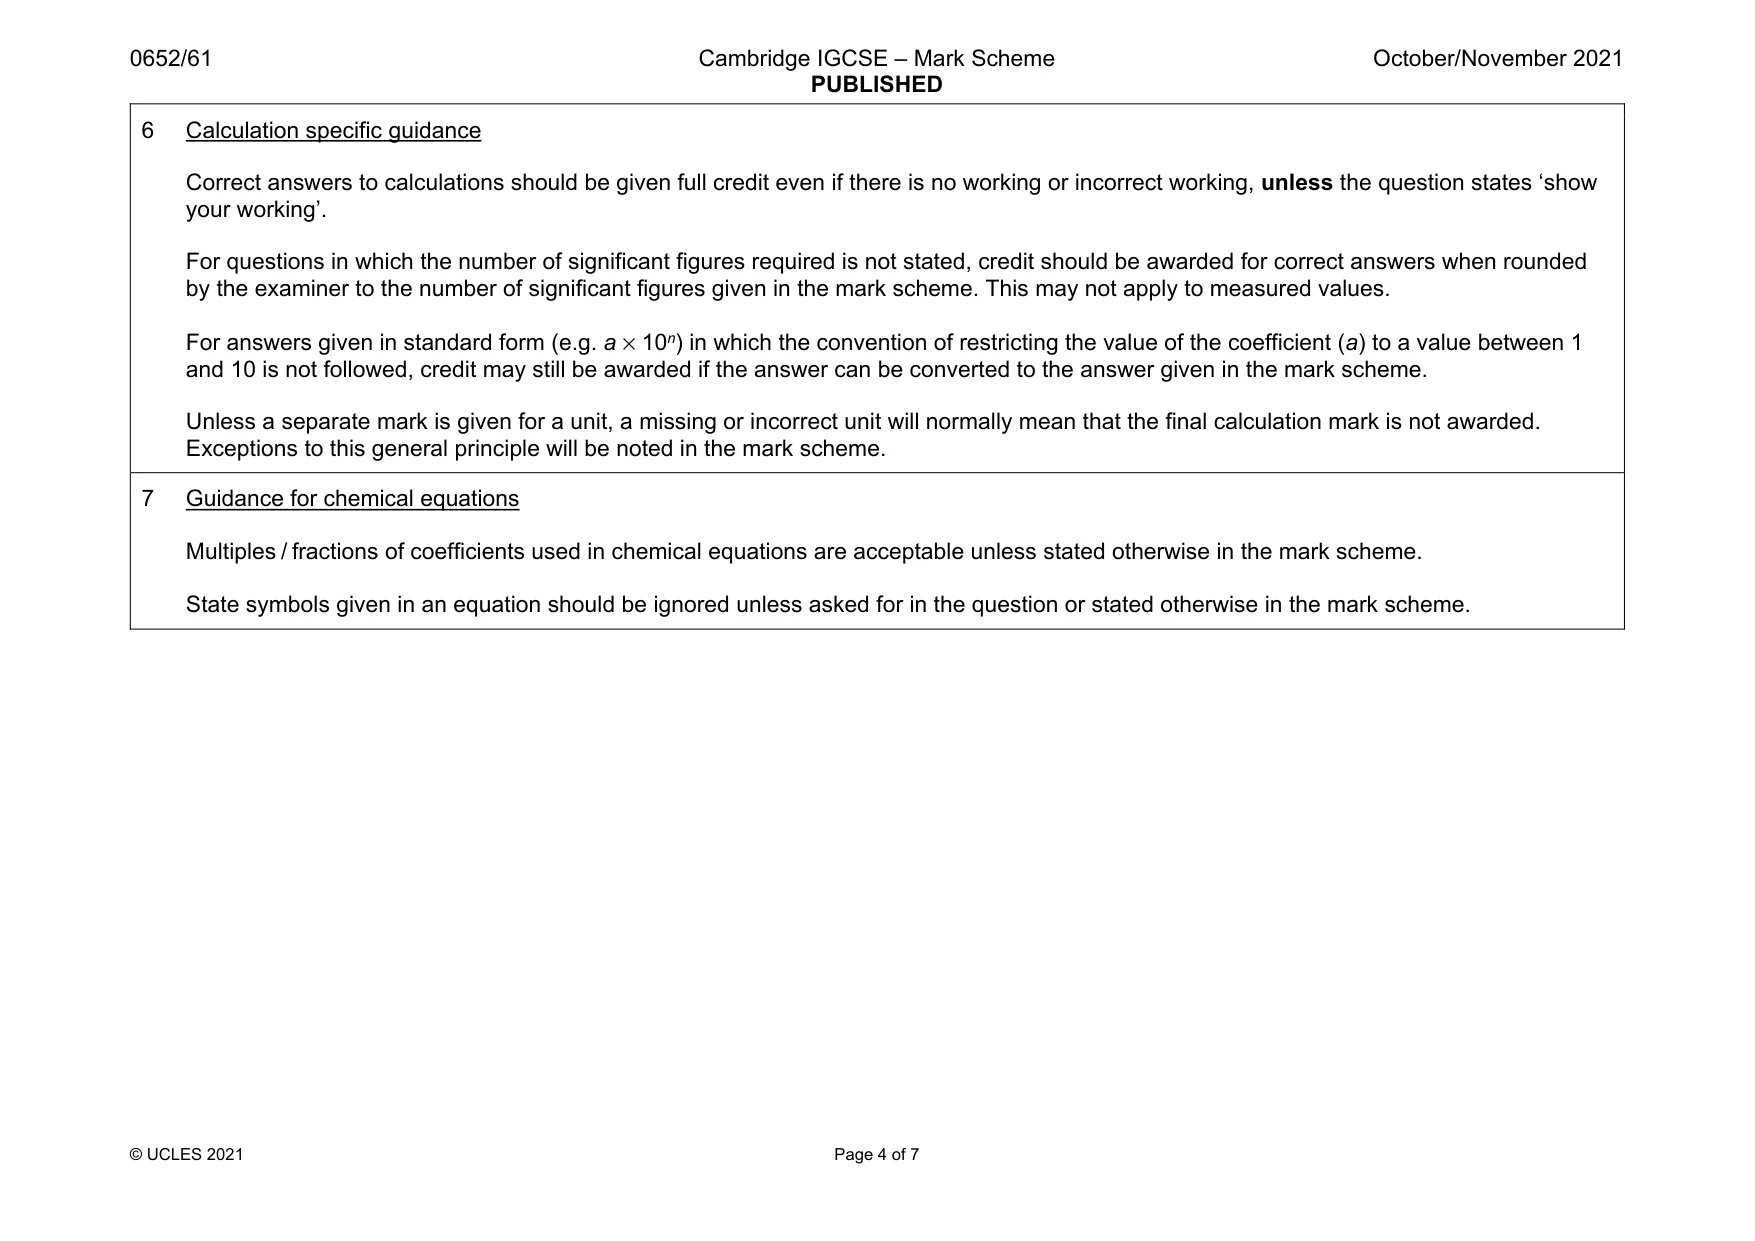
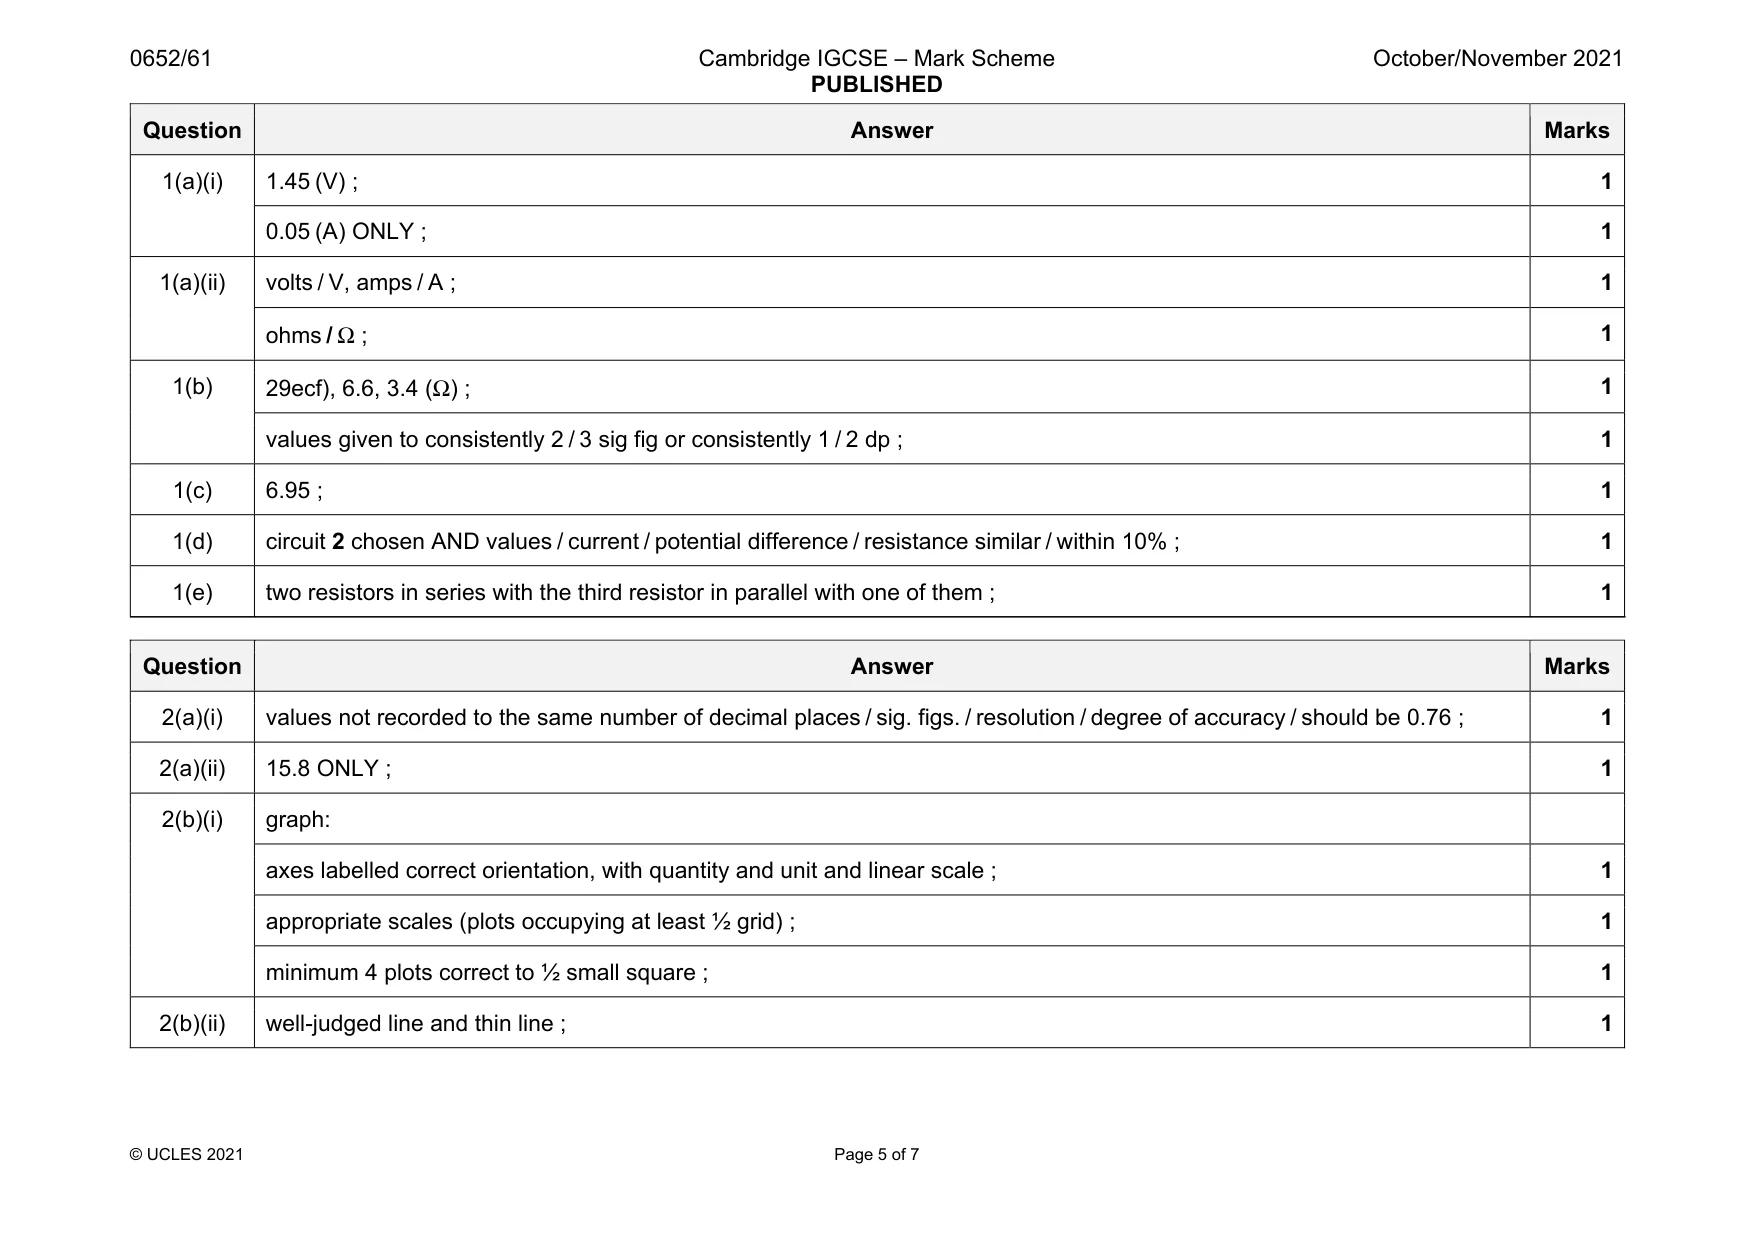
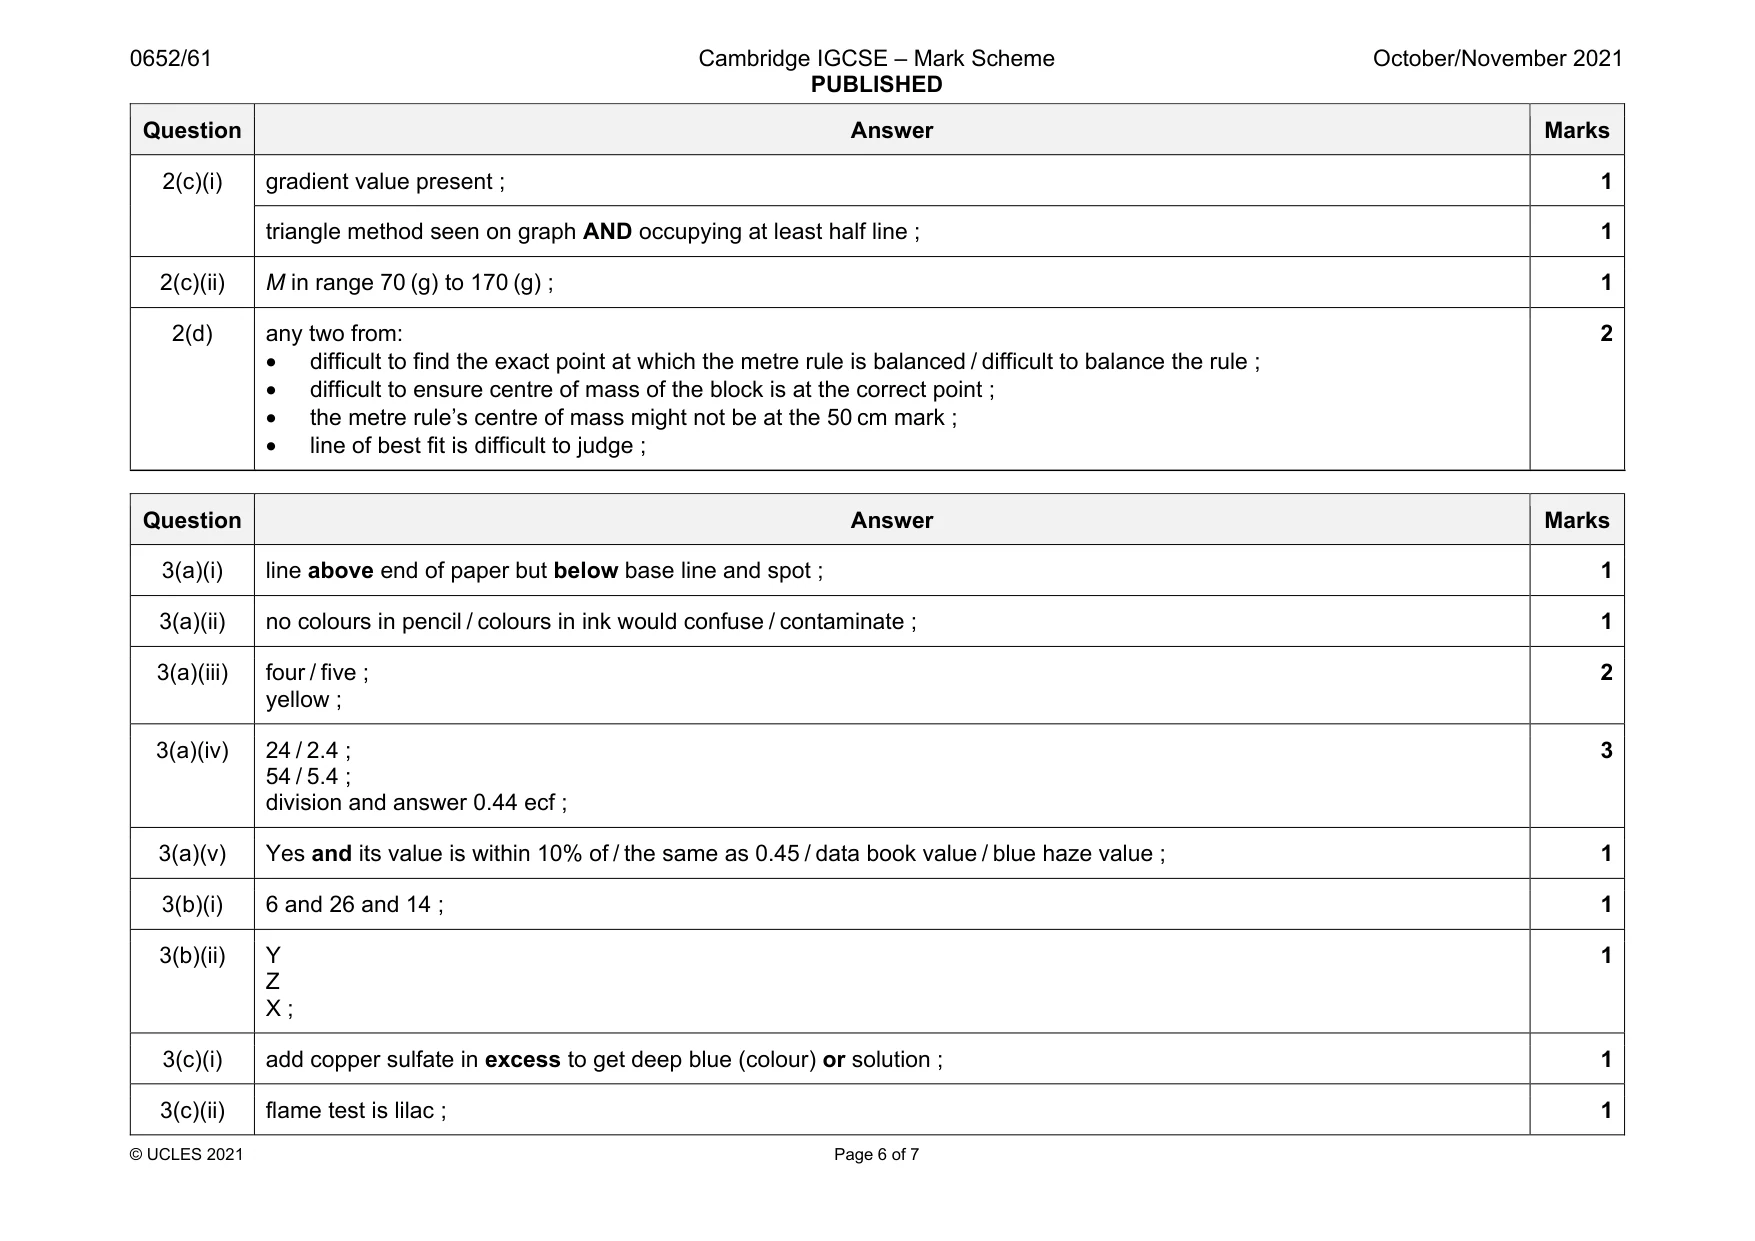
Mark scheme: 1(a)(i) 1.45 (V) ; 1 0.05 (A) ONLY ; 1 1(a)(ii) volts / V, amps / A ; 1 ohms / Ω ; 1 1(b) 29ecf), 6.6, 3.4 (Ω) ; 1 values given to consistently 2 / 3 sig fig or consistently 1 / 2 dp ; 1 1(c) 6.95 ; 1 1(d) circuit 2 chosen AND values / current / potential difference / resistance similar / within 10% ; 1 1(e) two resistors in series with the third resistor in parallel with one of them ; 1
Q2 · A student determines the mass of a metre rule using a balancing method
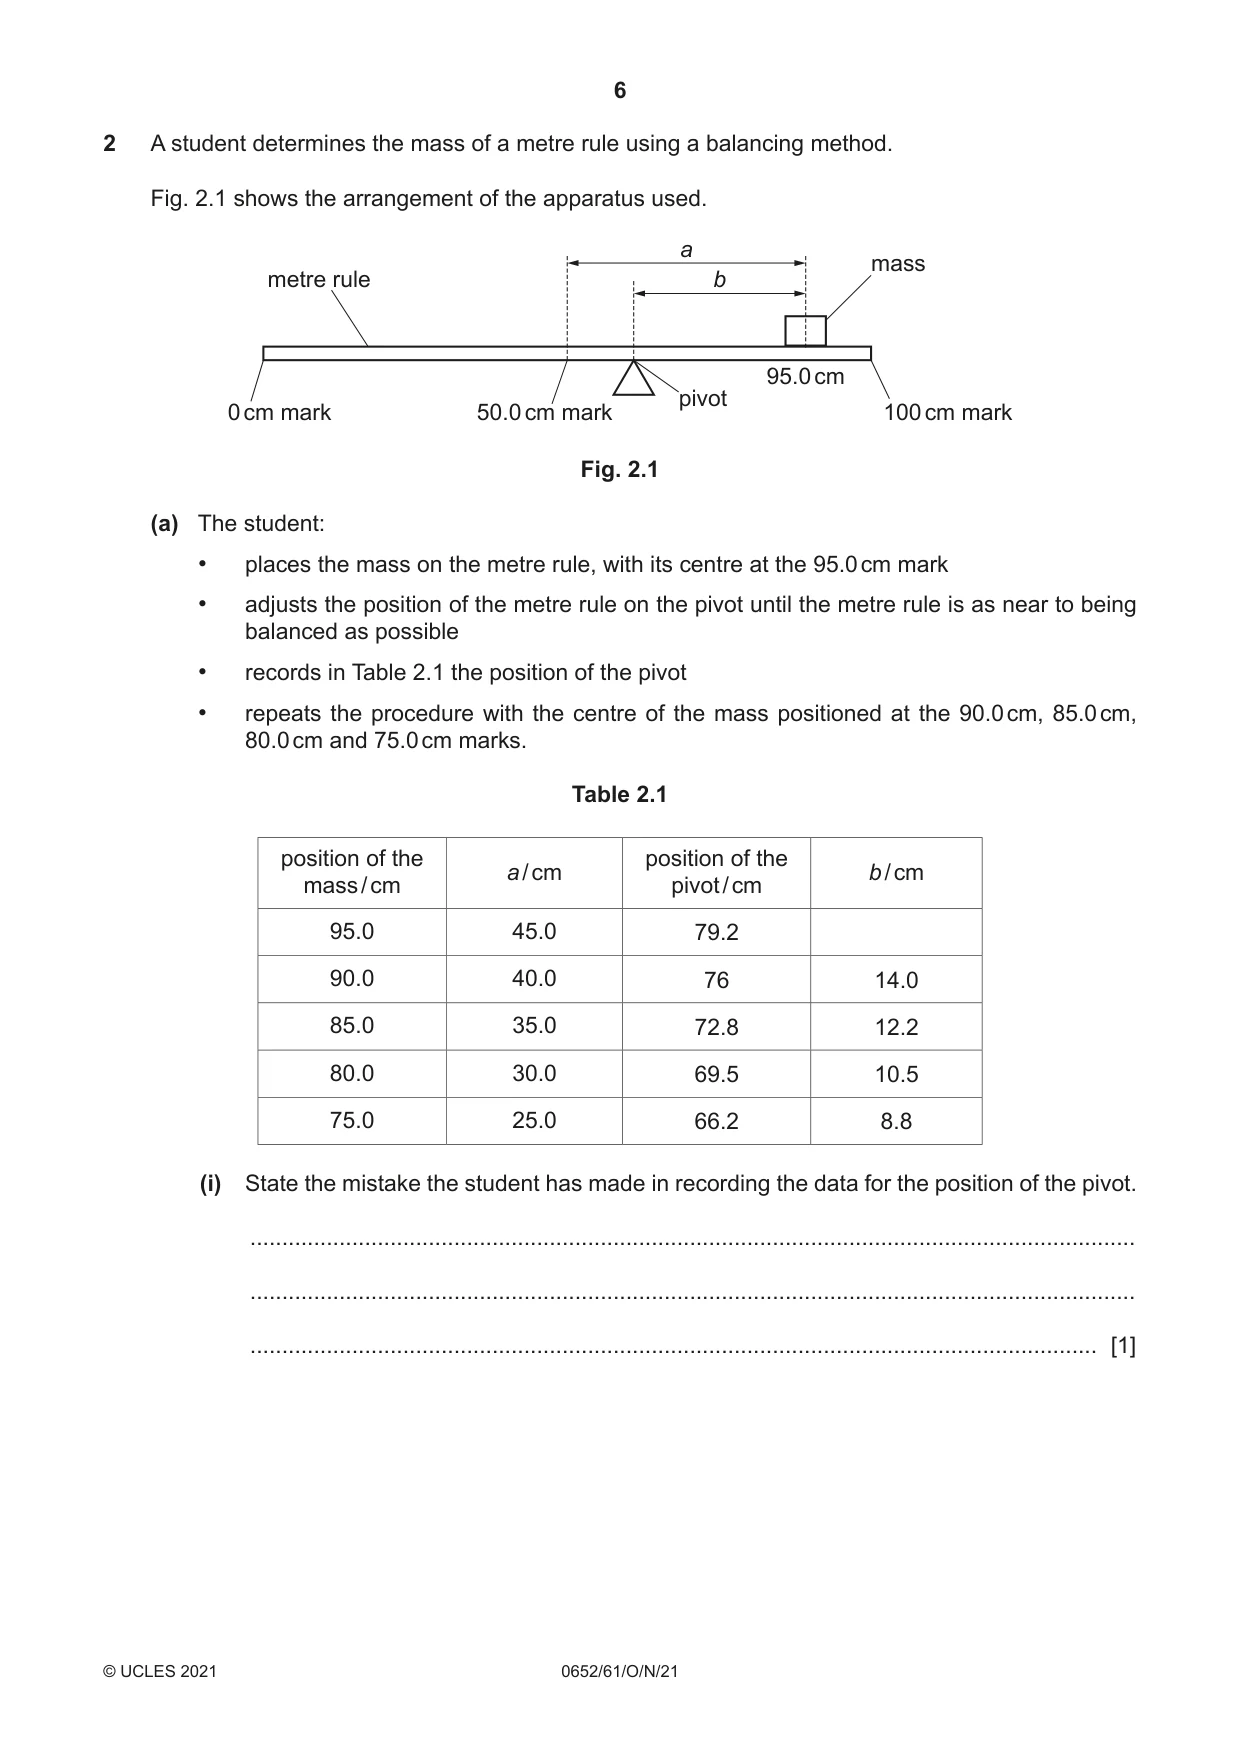
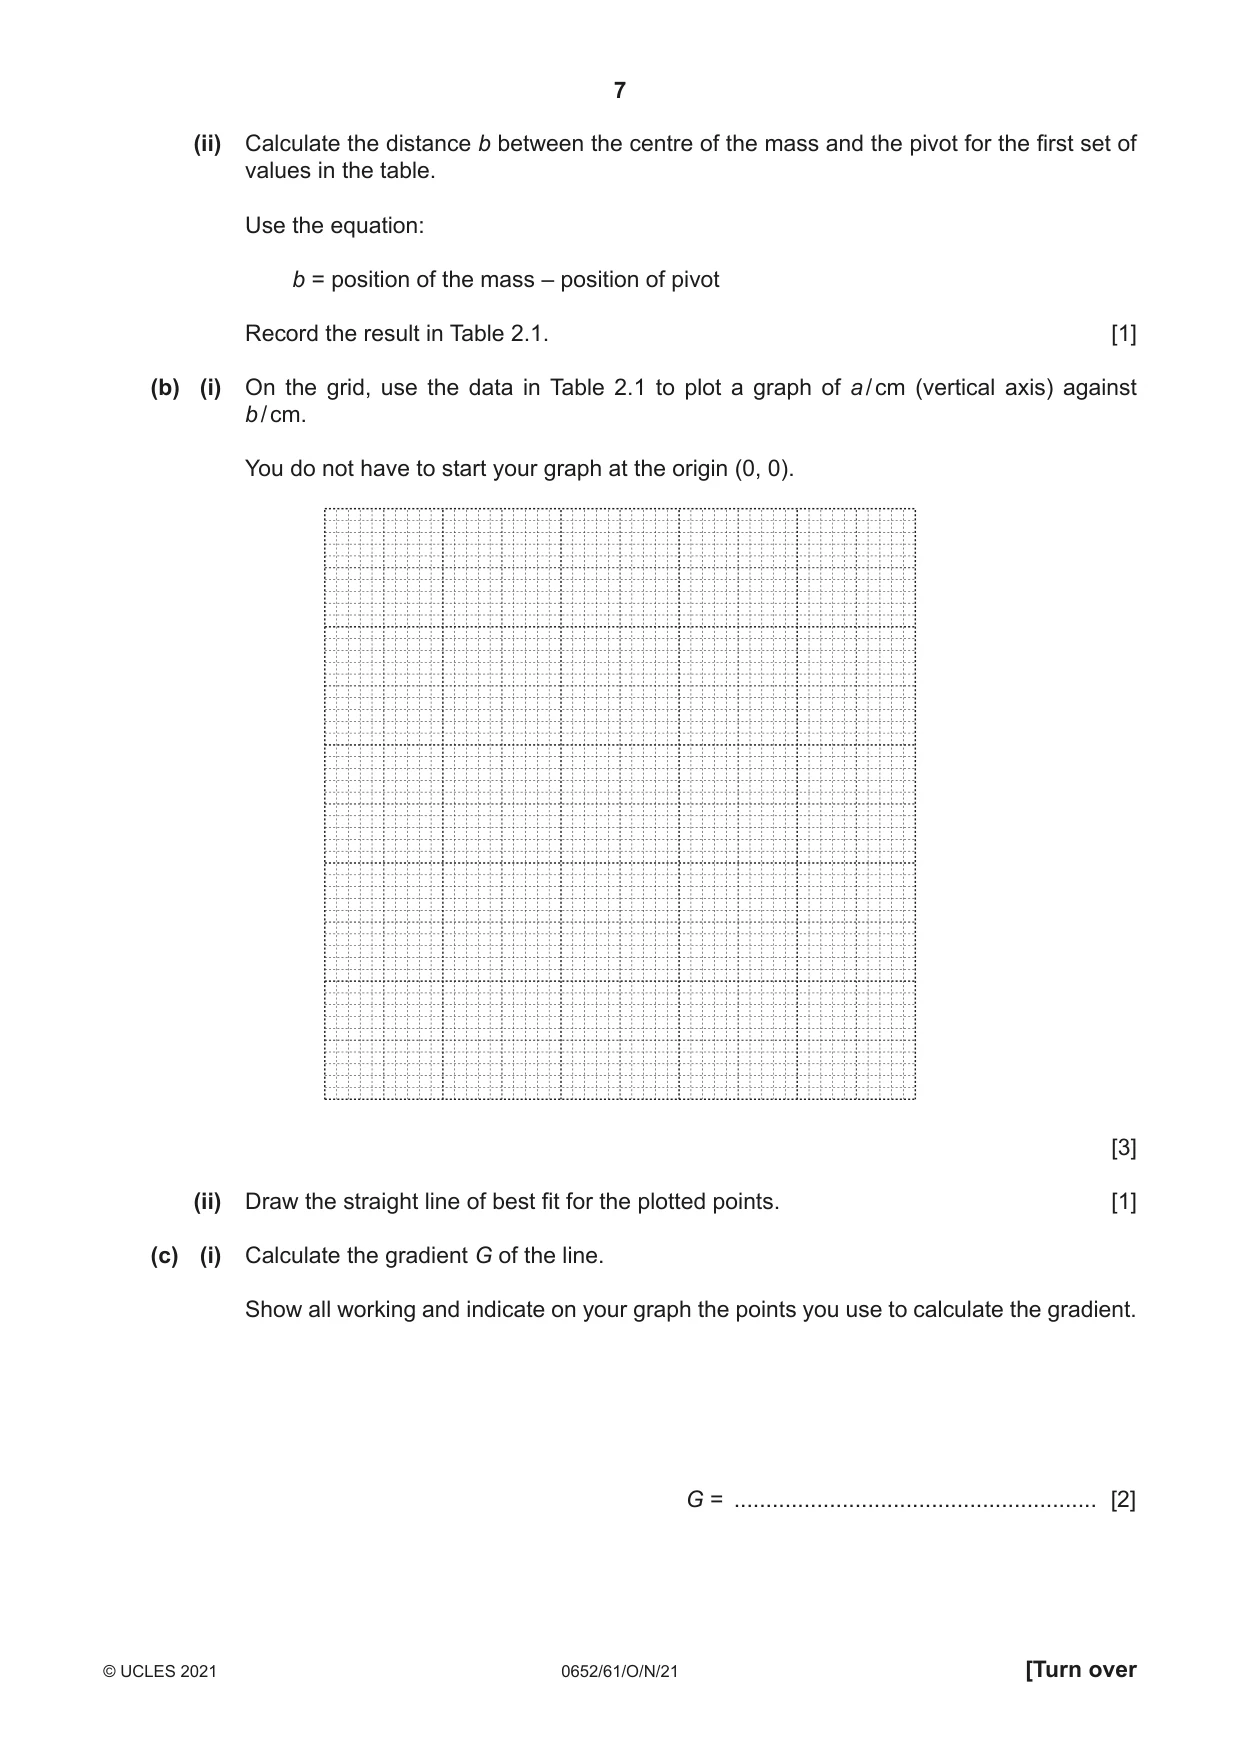
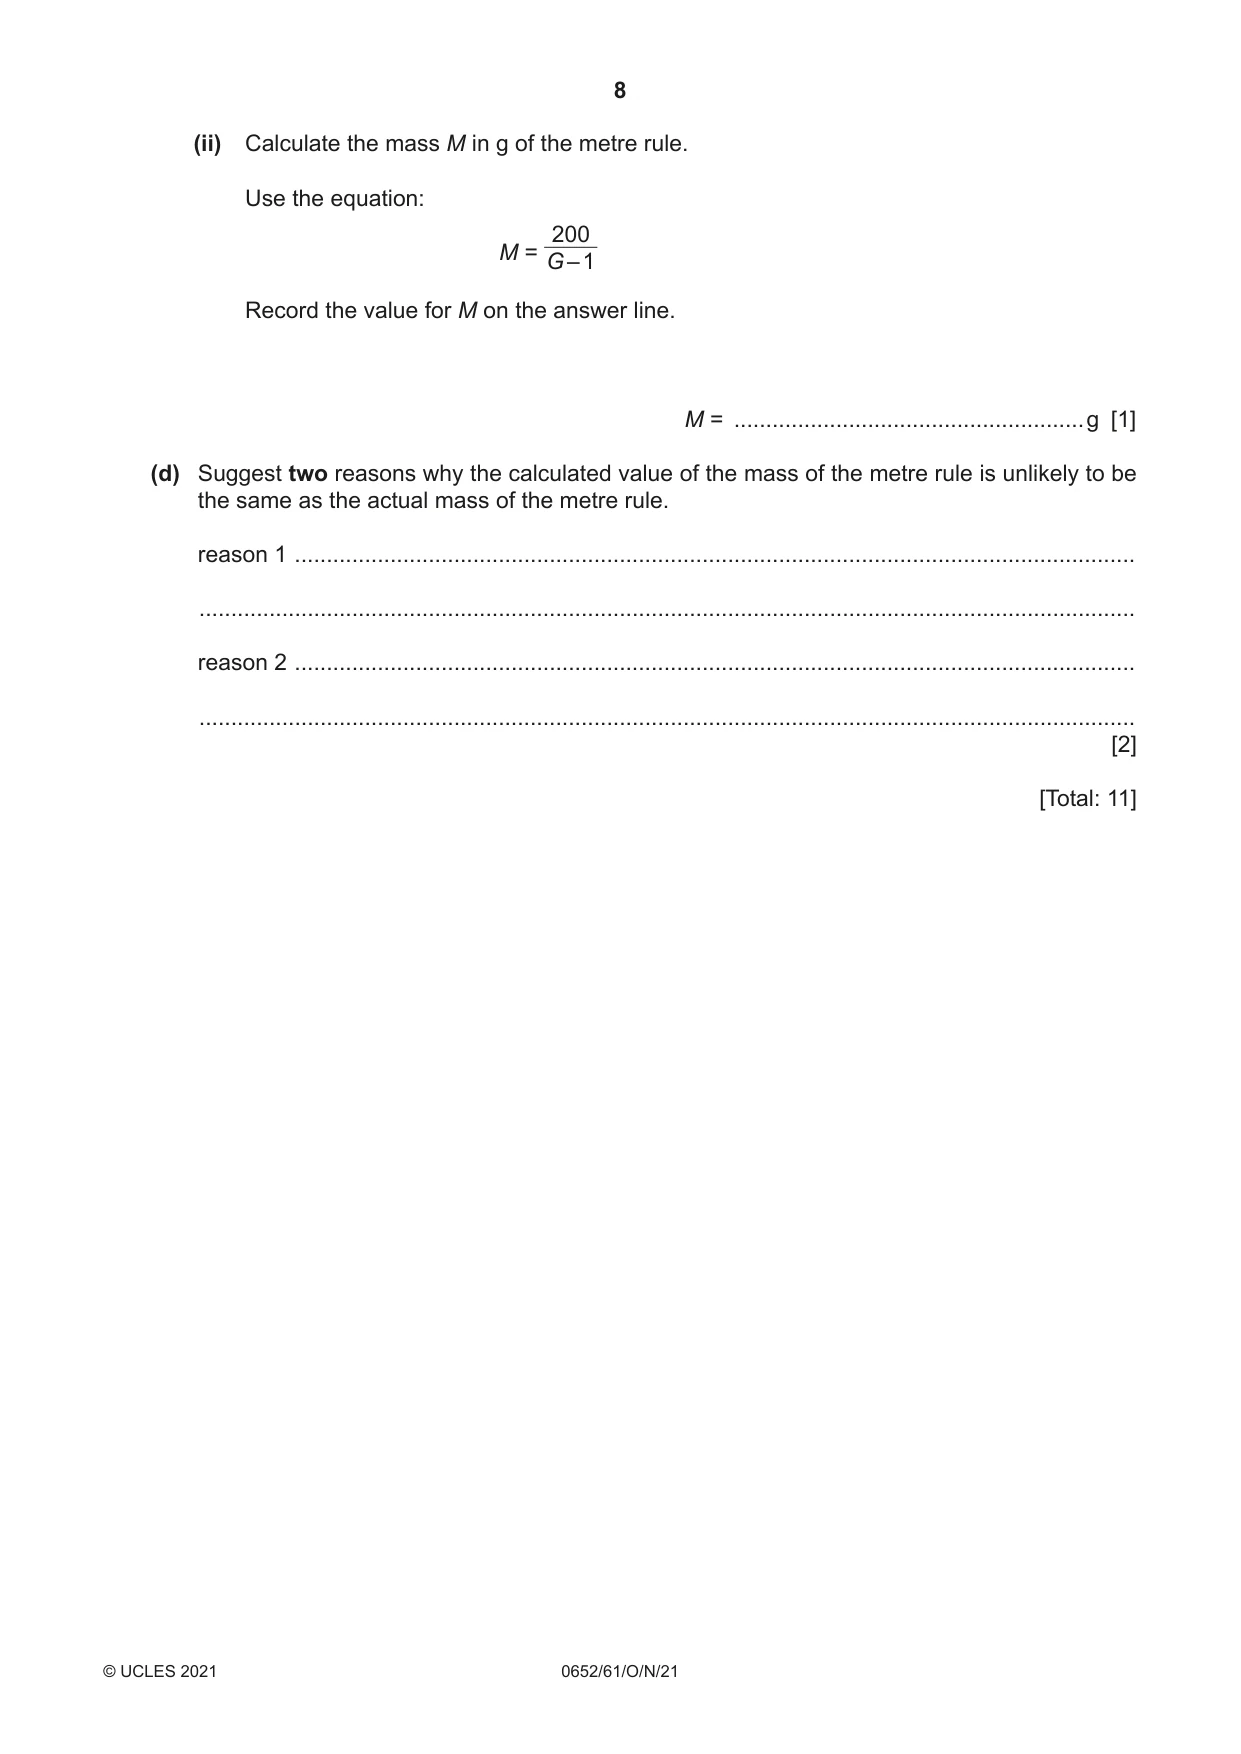
2 A student determines the mass of a metre rule using a balancing method. Fig. 2.1 shows the arrangement of the apparatus used. a mass metre rule b 95.0 cm pivot 0 cm mark 50.0 cm mark 100 cm mark Fig. 2.1 (a) The student: • places the mass on the metre rule, with its centre at the 95.0 cm mark • adjusts the position of the metre rule on the pivot until the metre rule is as near to being balanced as possible • records in Table 2.1 the position of the pivot • repeats the procedure with the centre of the mass positioned at the 90.0 cm, 85.0 cm, 80.0 cm and 75.0 cm marks. Table 2.1 position of the position of the a / cm b / cm mass / cm pivot / cm 95.0 45.0 79.2 90.0 40.0 76 14.0 85.0 35.0 72.8 12.2 80.0 30.0 69.5 10.5 75.0 25.0 66.2 8.8 (i) State the mistake the student has made in recording the data for the position of the pivot. ........................................................................................................................................... ........................................................................................................................................... ..................................................................................................................................... [1] (ii) Calculate the distance b between the centre of the mass and the pivot for the first set of values in the table. Use the equation: b = position of the mass – position of pivot Record the result in Table 2.1. [1] (b) (i) On the grid, use the data in Table 2.1 to plot a graph of a / cm (vertical axis) against b / cm. You do not have to start your graph at the origin (0, 0). [3] (ii) Draw the straight line of best fit for the plotted points. [1] (c) (i) Calculate the gradient G of the line. Show all working and indicate on your graph the points you use to calculate the gradient. G = ......................................................... [2] (ii) Calculate the mass M in g of the metre rule. Use the equation: 200 M = G – 1 Record the value for M on the answer line. M = ....................................................... g [1] (d) Suggest two reasons why the calculated value of the mass of the metre rule is unlikely to be the same as the actual mass of the metre rule. reason 1 .................................................................................................................................... ................................................................................................................................................... reason 2 .................................................................................................................................... ................................................................................................................................................... [2] [Total: 11]
Mark scheme: 2(a)(i) values not recorded to the same number of decimal places / sig. figs. / resolution / degree of accuracy / should be 0.76 ; 1 2(a)(ii) 15.8 ONLY ; 1 2(b)(i) graph: axes labelled correct orientation, with quantity and unit and linear scale ; 1 appropriate scales (plots occupying at least ½ grid) ; 1 minimum 4 plots correct to ½ small square ; 1 2(b)(ii) well-judged line and thin line ; 1 Question Answer Marks 2(c)(i) gradient value present ; 1 triangle method seen on graph AND occupying at least half line ; 1 2(c)(ii) M in range 70 (g) to 170 (g) ; 1 2(d) any two from: • difficult to find the exact point at which the metre rule is balanced / difficult to balance the rule ; • difficult to ensure centre of mass of the block is at the correct point ; • the metre rule’s centre of mass might not be at the 50 cm mark ; • line of best fit is difficult to judge ; 2
Q3 · In an investigation, a student: • investigates the colours that make up universal…
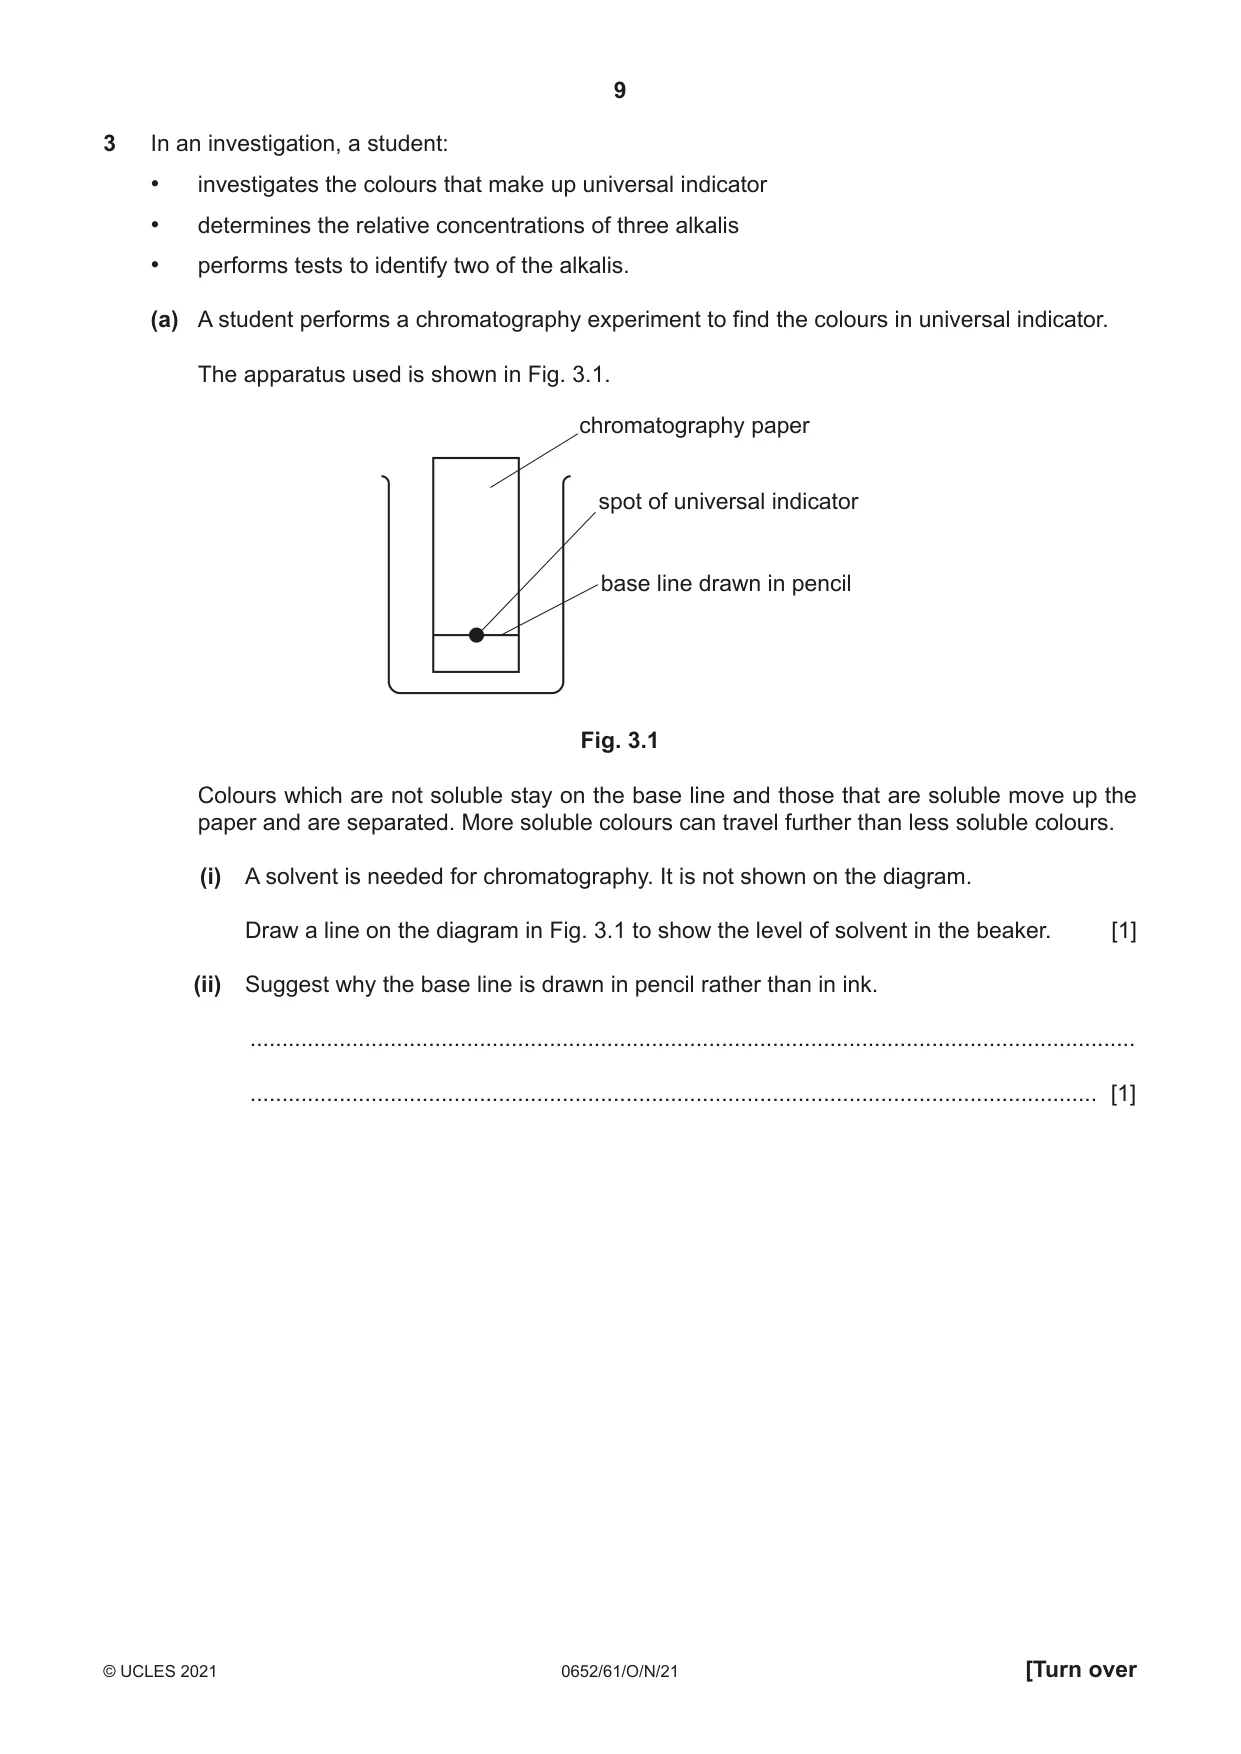
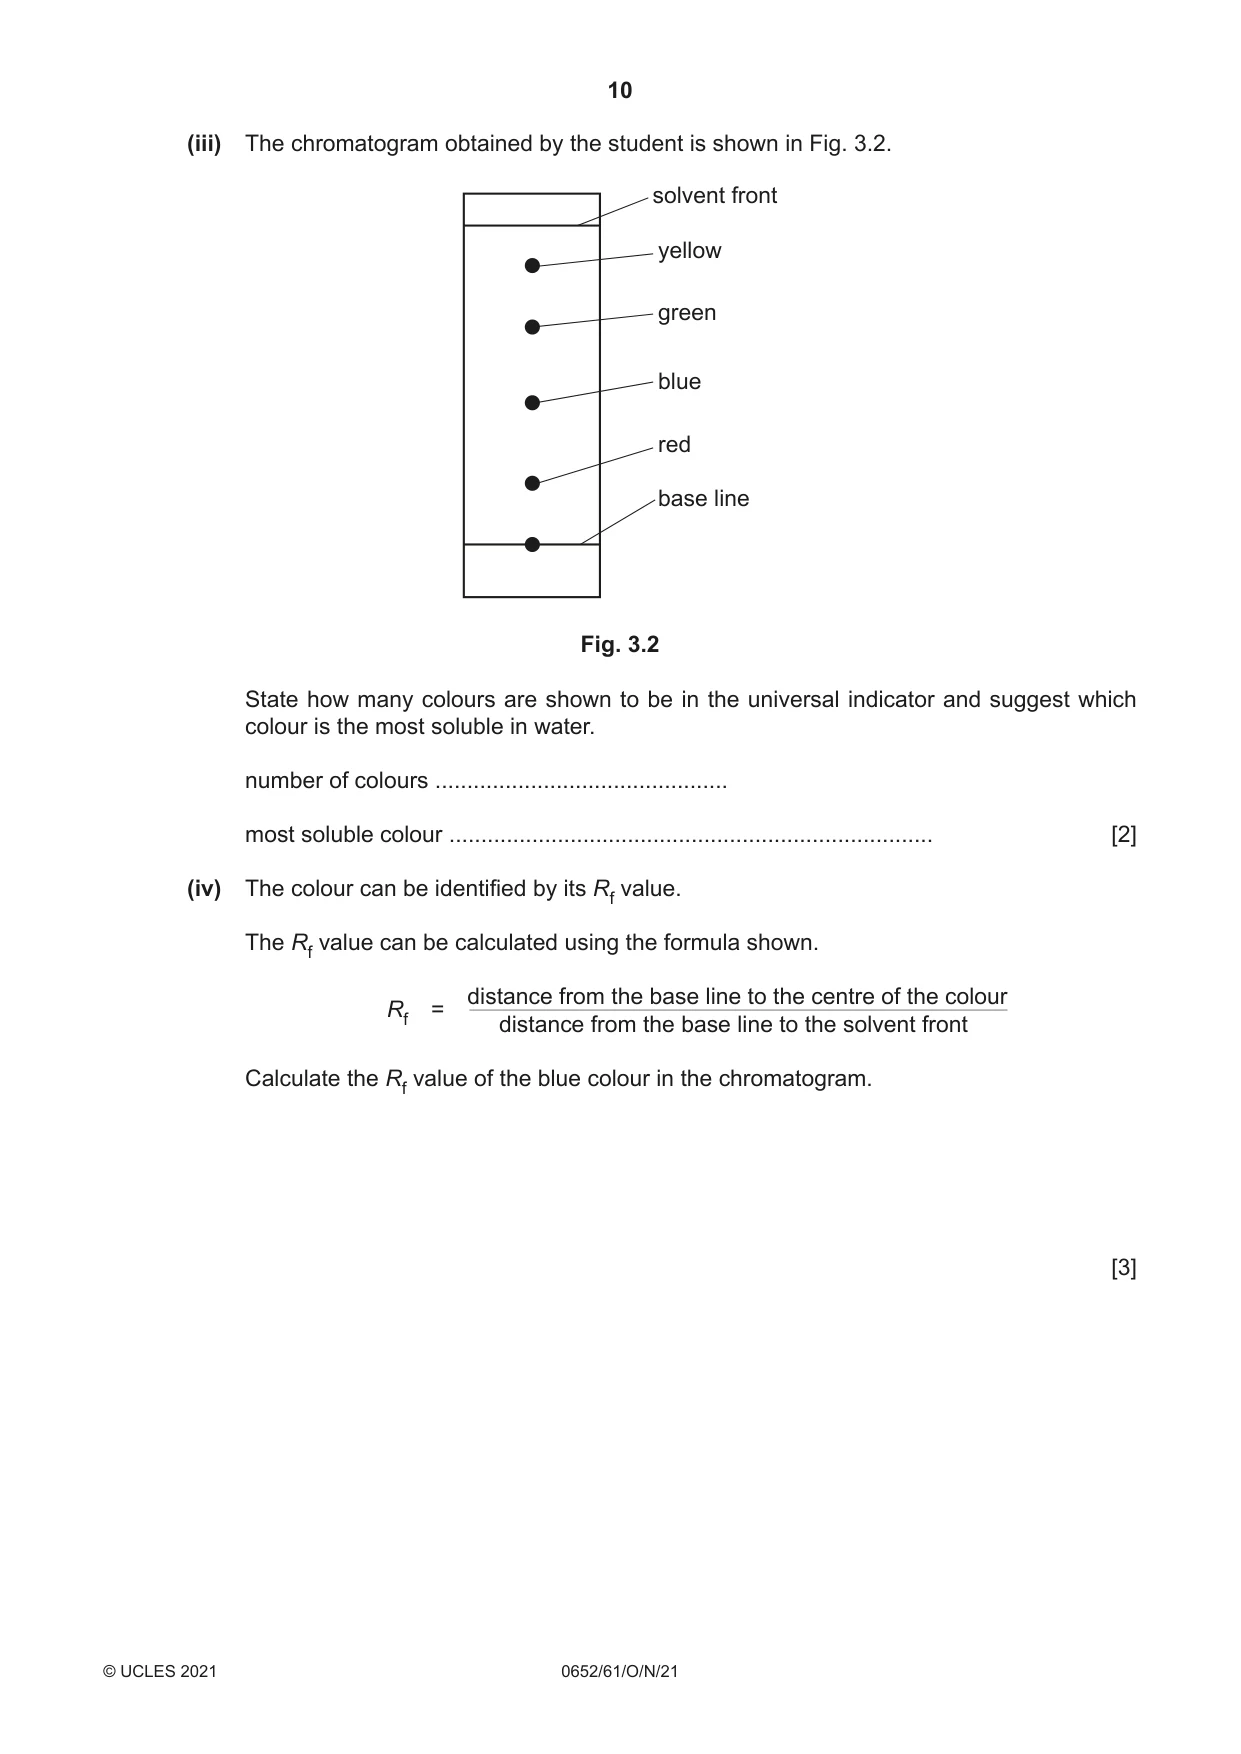
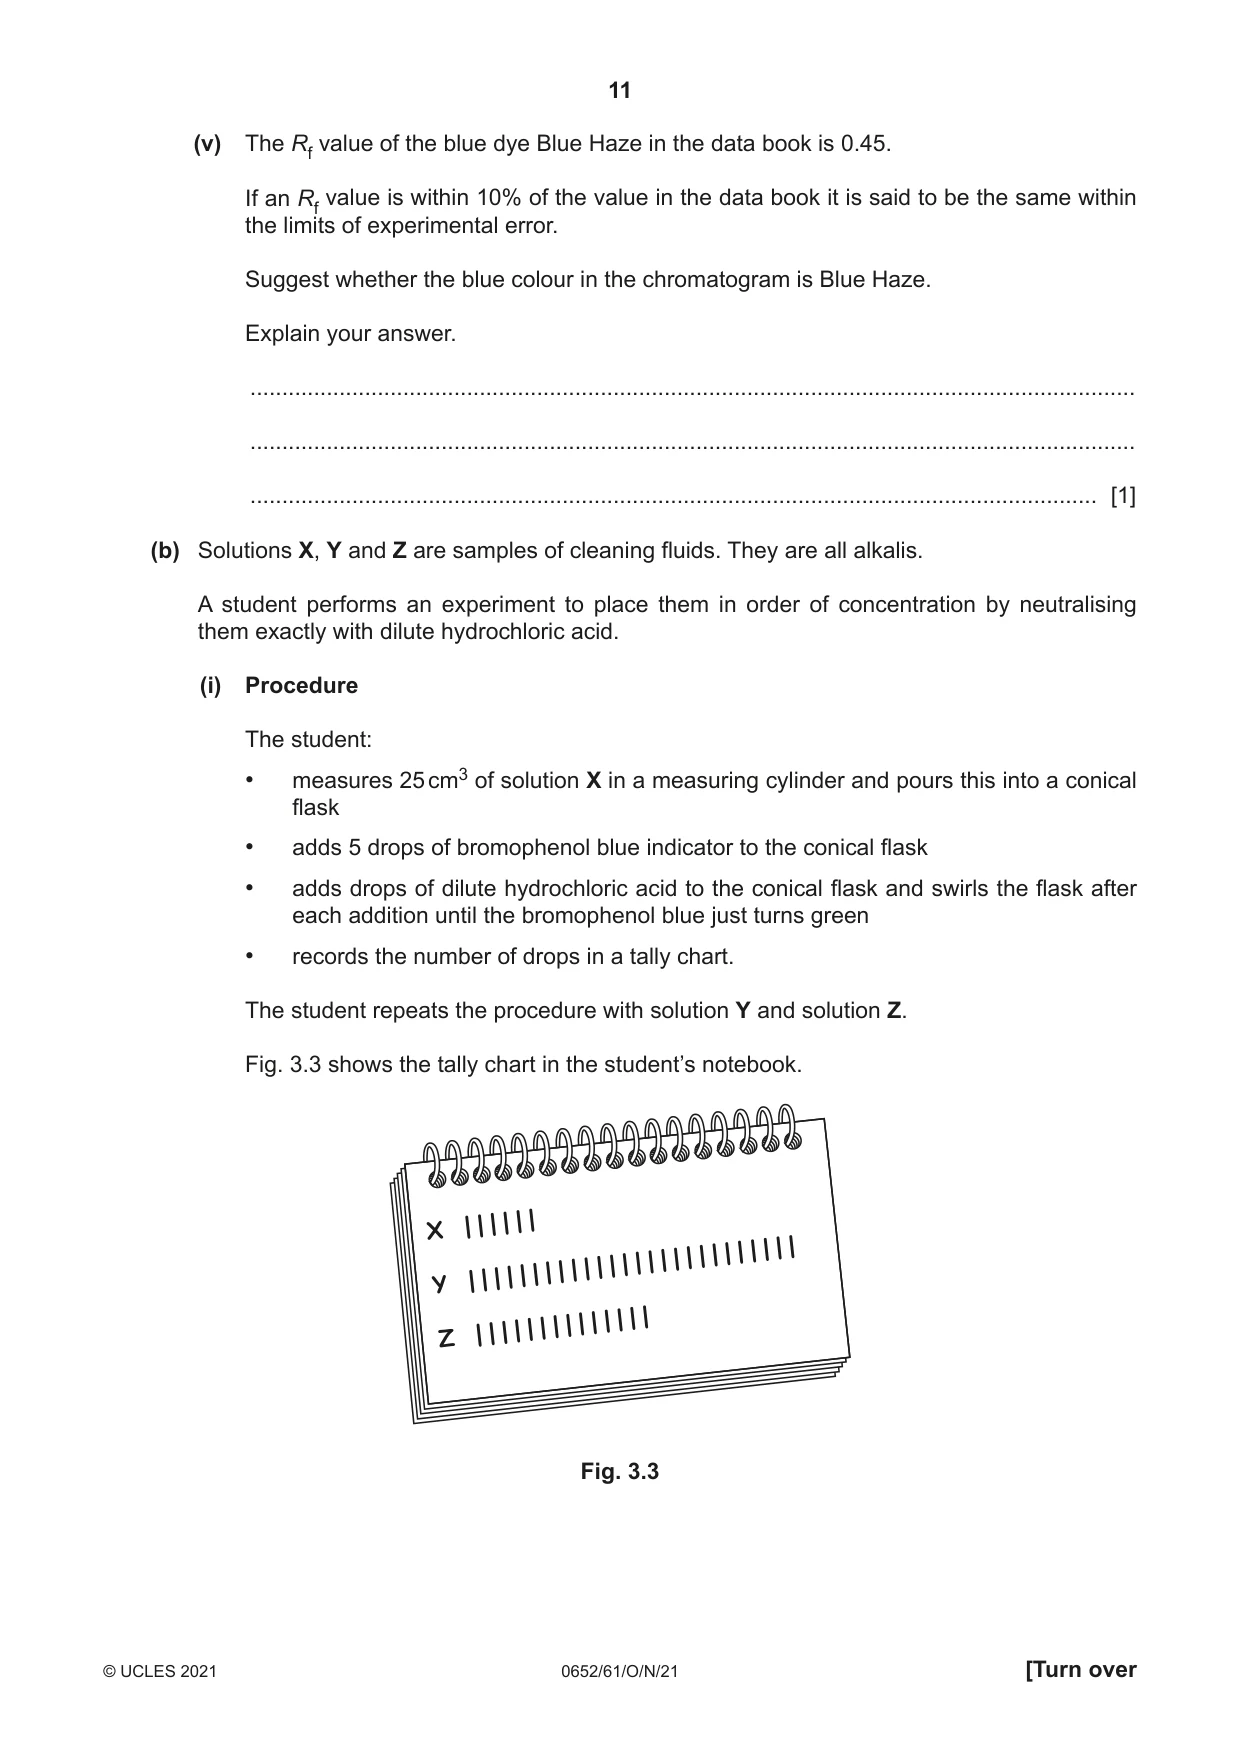
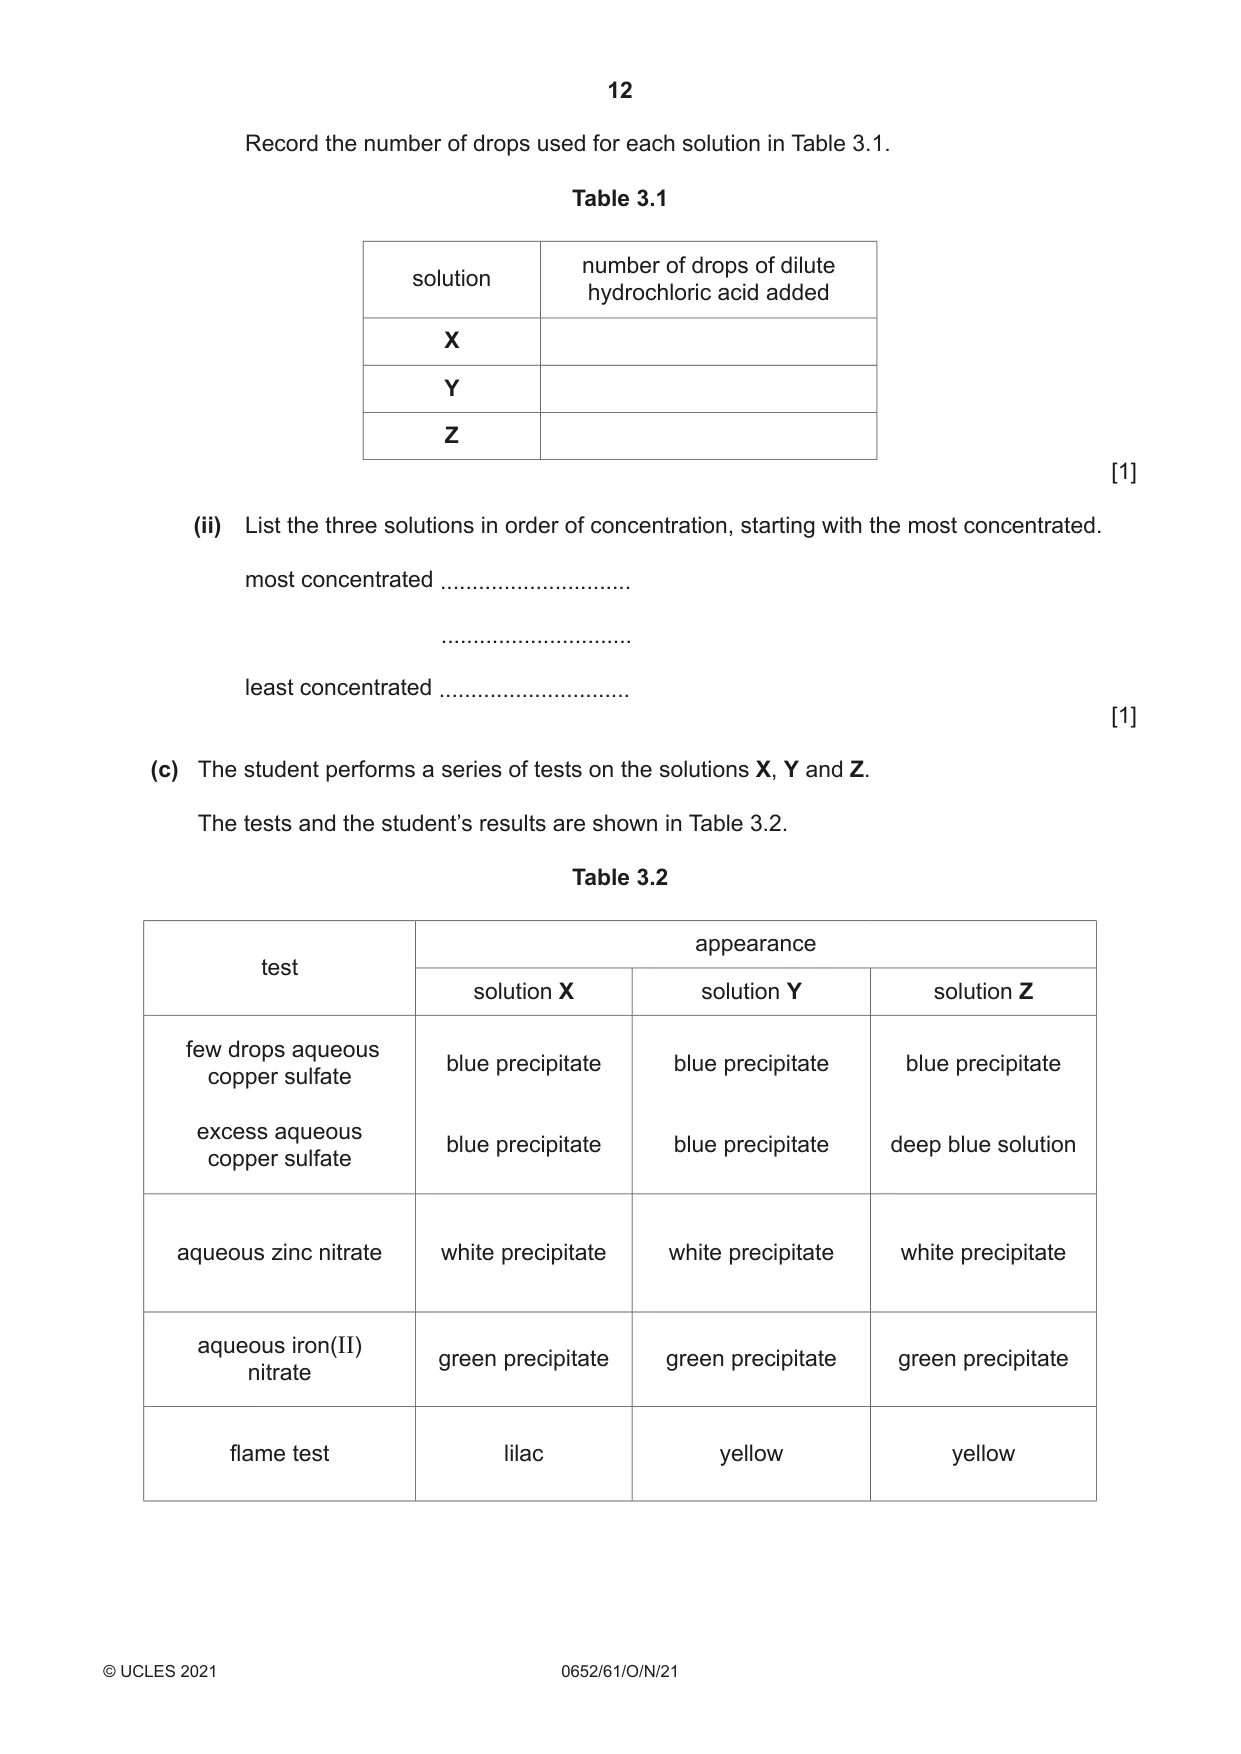
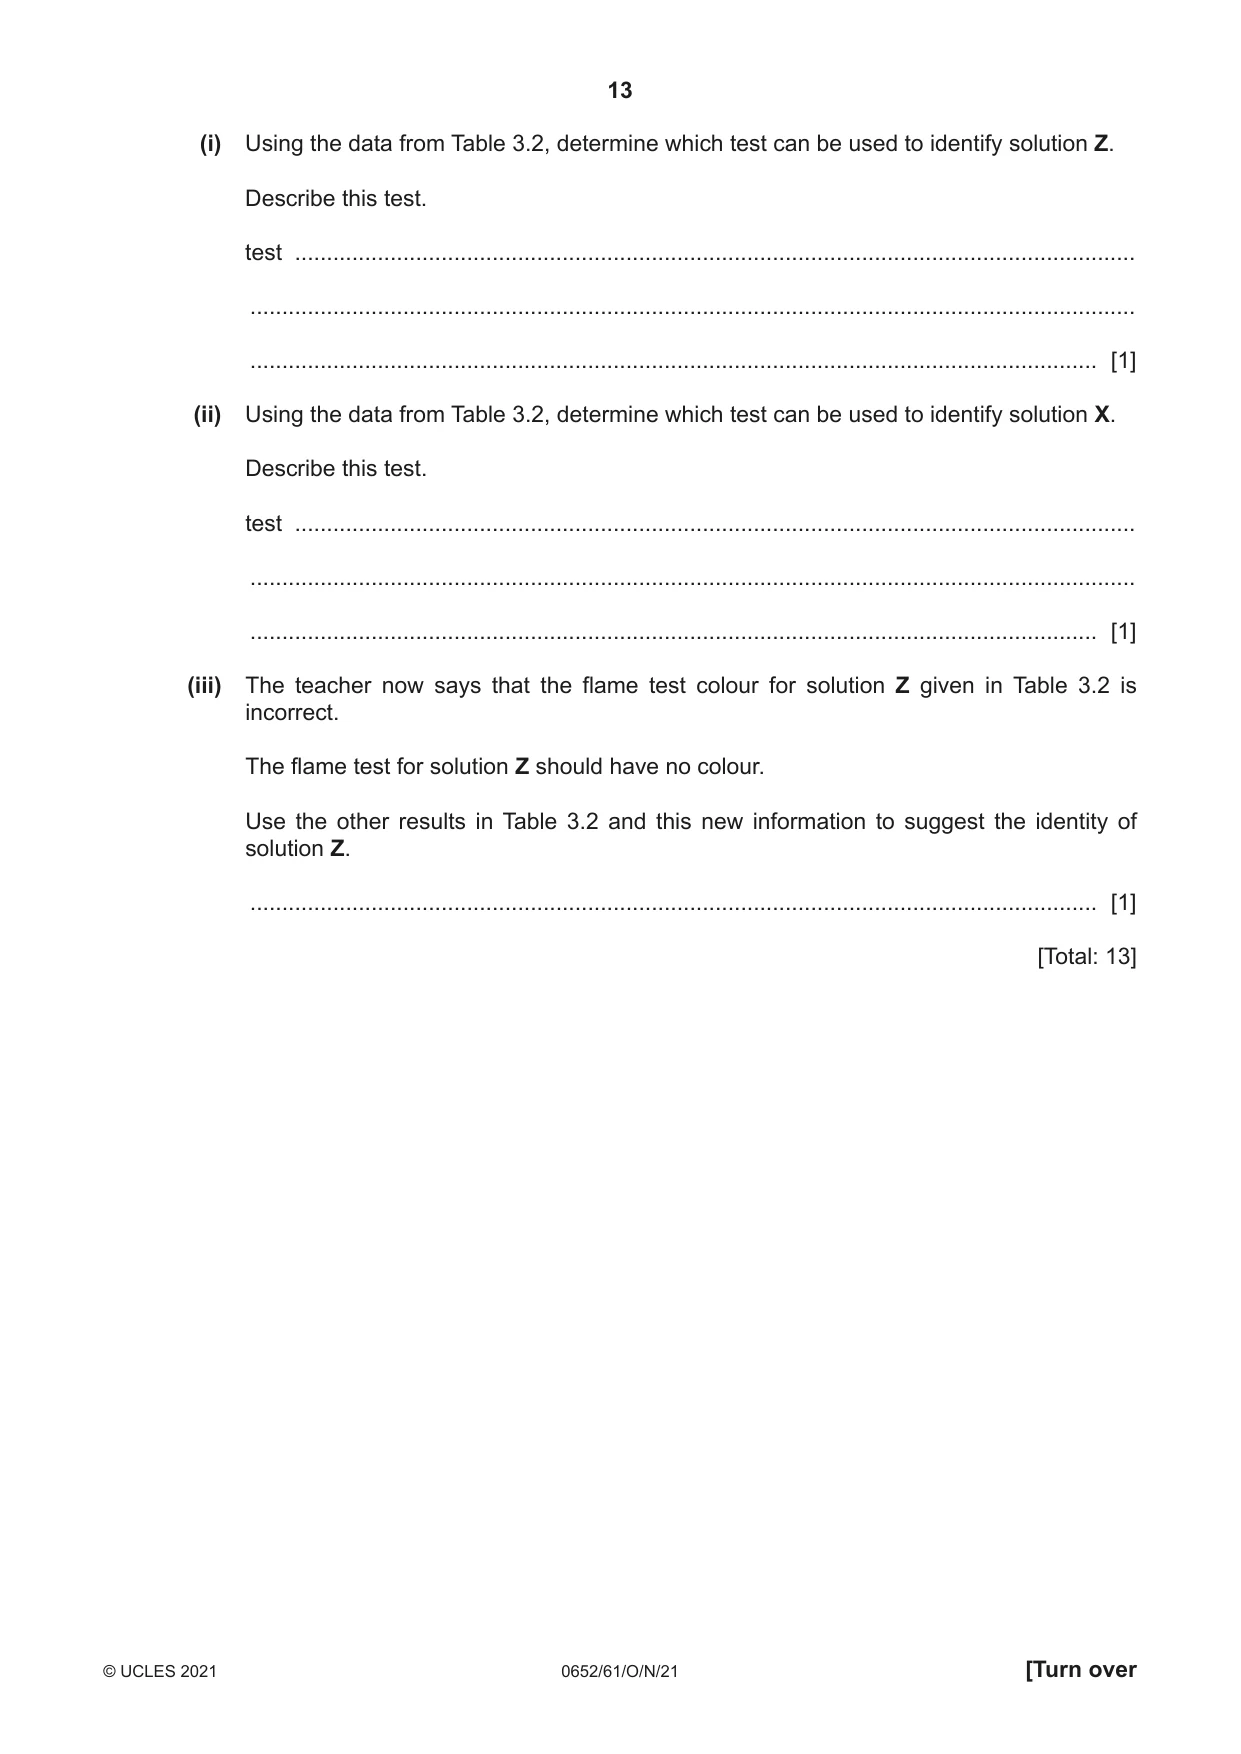
3 In an investigation, a student: • investigates the colours that make up universal indicator • determines the relative concentrations of three alkalis • performs tests to identify two of the alkalis. (a) A student performs a chromatography experiment to find the colours in universal indicator. The apparatus used is shown in Fig. 3.1. chromatography paper spot of universal indicator base line drawn in pencil Fig. 3.1 Colours which are not soluble stay on the base line and those that are soluble move up the paper and are separated. More soluble colours can travel further than less soluble colours. (i) A solvent is needed for chromatography. It is not shown on the diagram. Draw a line on the diagram in Fig. 3.1 to show the level of solvent in the beaker. [1] (ii) Suggest why the base line is drawn in pencil rather than in ink. ........................................................................................................................................... ..................................................................................................................................... [1] (iii) The chromatogram obtained by the student is shown in Fig. 3.2. solvent front yellow green blue red base line Fig. 3.2 State how many colours are shown to be in the universal indicator and suggest which colour is the most soluble in water. number of colours .............................................. most soluble colour ............................................................................ [2] (iv) The colour can be identified by its Rf value. The Rf value can be calculated using the formula shown. distance from the base line to the centre of the colour Rf = distance from the base line to the solvent front Calculate the Rf value of the blue colour in the chromatogram. [3] (v) The Rf value of the blue dye Blue Haze in the data book is 0.45. If an Rf value is within 10% of the value in the data book it is said to be the same within the limits of experimental error. Suggest whether the blue colour in the chromatogram is Blue Haze. Explain your answer. ........................................................................................................................................... ........................................................................................................................................... ..................................................................................................................................... [1] (b) Solutions X, Y and Z are samples of cleaning fluids. They are all alkalis. A student performs an experiment to place them in order of concentration by neutralising them exactly with dilute hydrochloric acid. (i) Procedure The student: • measures 25 cm3 of solution X in a measuring cylinder and pours this into a conical flask • adds 5 drops of bromophenol blue indicator to the conical flask • adds drops of dilute hydrochloric acid to the conical flask and swirls the flask after each addition until the bromophenol blue just turns green • records the number of drops in a tally chart. The student repeats the procedure with solution Y and solution Z. Fig. 3.3 shows the tally chart in the student’s notebook. X |||||| Y |||||||||||||||||||||||||| Z |||||||||||||| Fig. 3.3 Record the number of drops used for each solution in Table 3.1. Table 3.1 number of drops of dilute solution hydrochloric acid added X Y Z [1] (ii) List the three solutions in order of concentration, starting with the most concentrated. most concentrated .............................. .............................. least concentrated .............................. [1] (c) The student performs a series of tests on the solutions X, Y and Z. The tests and the student’s results are shown in Table 3.2. Table 3.2 appearance test solution X solution Y solution Z few drops aqueous blue precipitate blue precipitate blue precipitate copper sulfate excess aqueous blue precipitate blue precipitate deep blue solution copper sulfate aqueous zinc nitrate white precipitate white precipitate white precipitate aqueous iron(II) green precipitate green precipitate green precipitate nitrate flame test lilac yellow yellow (i) Using the data from Table 3.2, determine which test can be used to identify solution Z. Describe this test. test .................................................................................................................................... ........................................................................................................................................... ..................................................................................................................................... [1] (ii) Using the data from Table 3.2, determine which test can be used to identify solution X. Describe this test. test .................................................................................................................................... ........................................................................................................................................... ..................................................................................................................................... [1] (iii) The teacher now says that the flame test colour for solution Z given in Table 3.2 is incorrect. The flame test for solution Z should have no colour. Use the other results in Table 3.2 and this new information to suggest the identity of solution Z. ..................................................................................................................................... [1] [Total: 13]
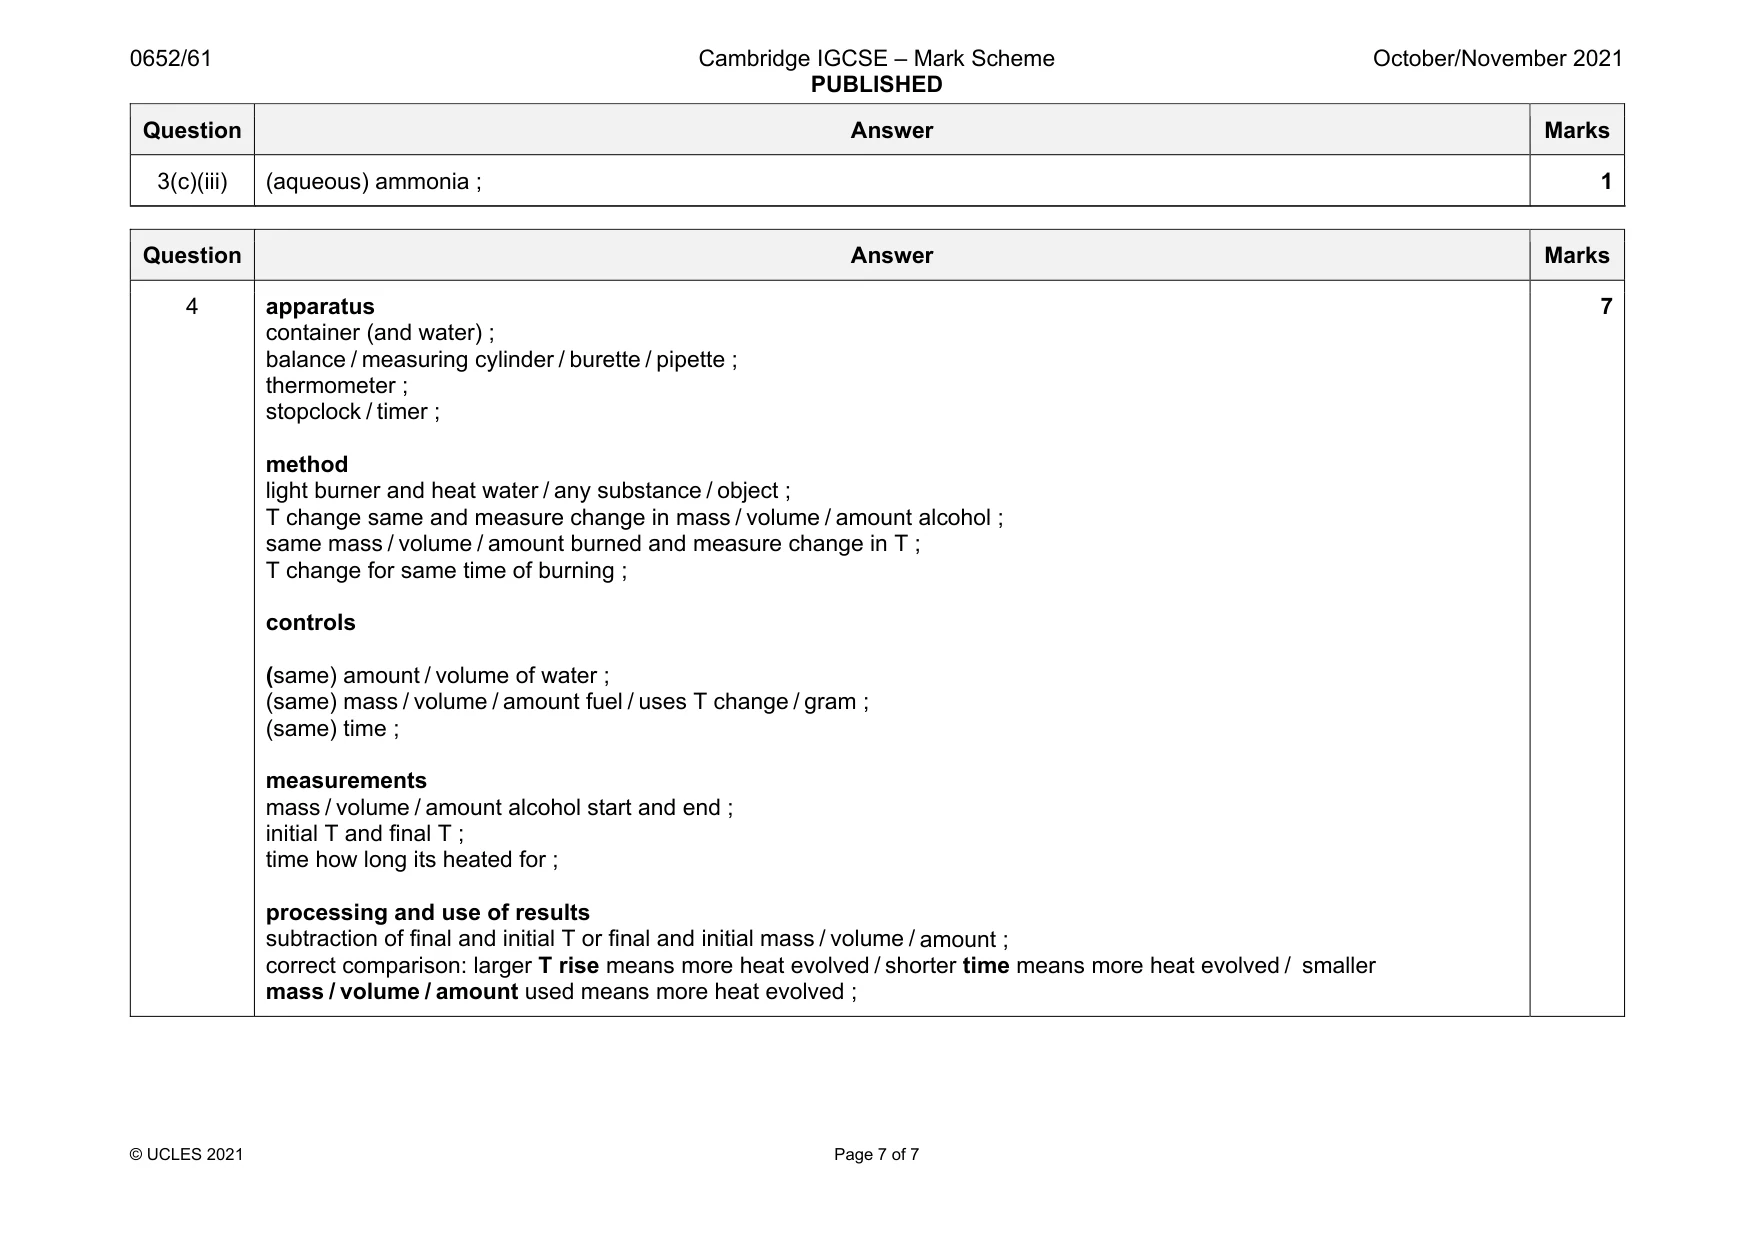
Mark scheme: 3(a)(i) line above end of paper but below base line and spot ; 1 3(a)(ii) no colours in pencil / colours in ink would confuse / contaminate ; 1 3(a)(iii) four / five ; yellow ; 2 3(a)(iv) 24 / 2.4 ; 54 / 5.4 ; division and answer 0.44 ecf ; 3 3(a)(v) Yes and its value is within 10% of / the same as 0.45 / data book value / blue haze value ; 1 3(b)(i) 6 and 26 and 14 ; 1 3(b)(ii) Y Z X ; 1 3(c)(i) add copper sulfate in excess to get deep blue (colour) or solution ; 1 3(c)(ii) flame test is lilac ; 1 Question Answer Marks 3(c)(iii) (aqueous) ammonia ; 1
Q4 · When fuels burn they give out energy
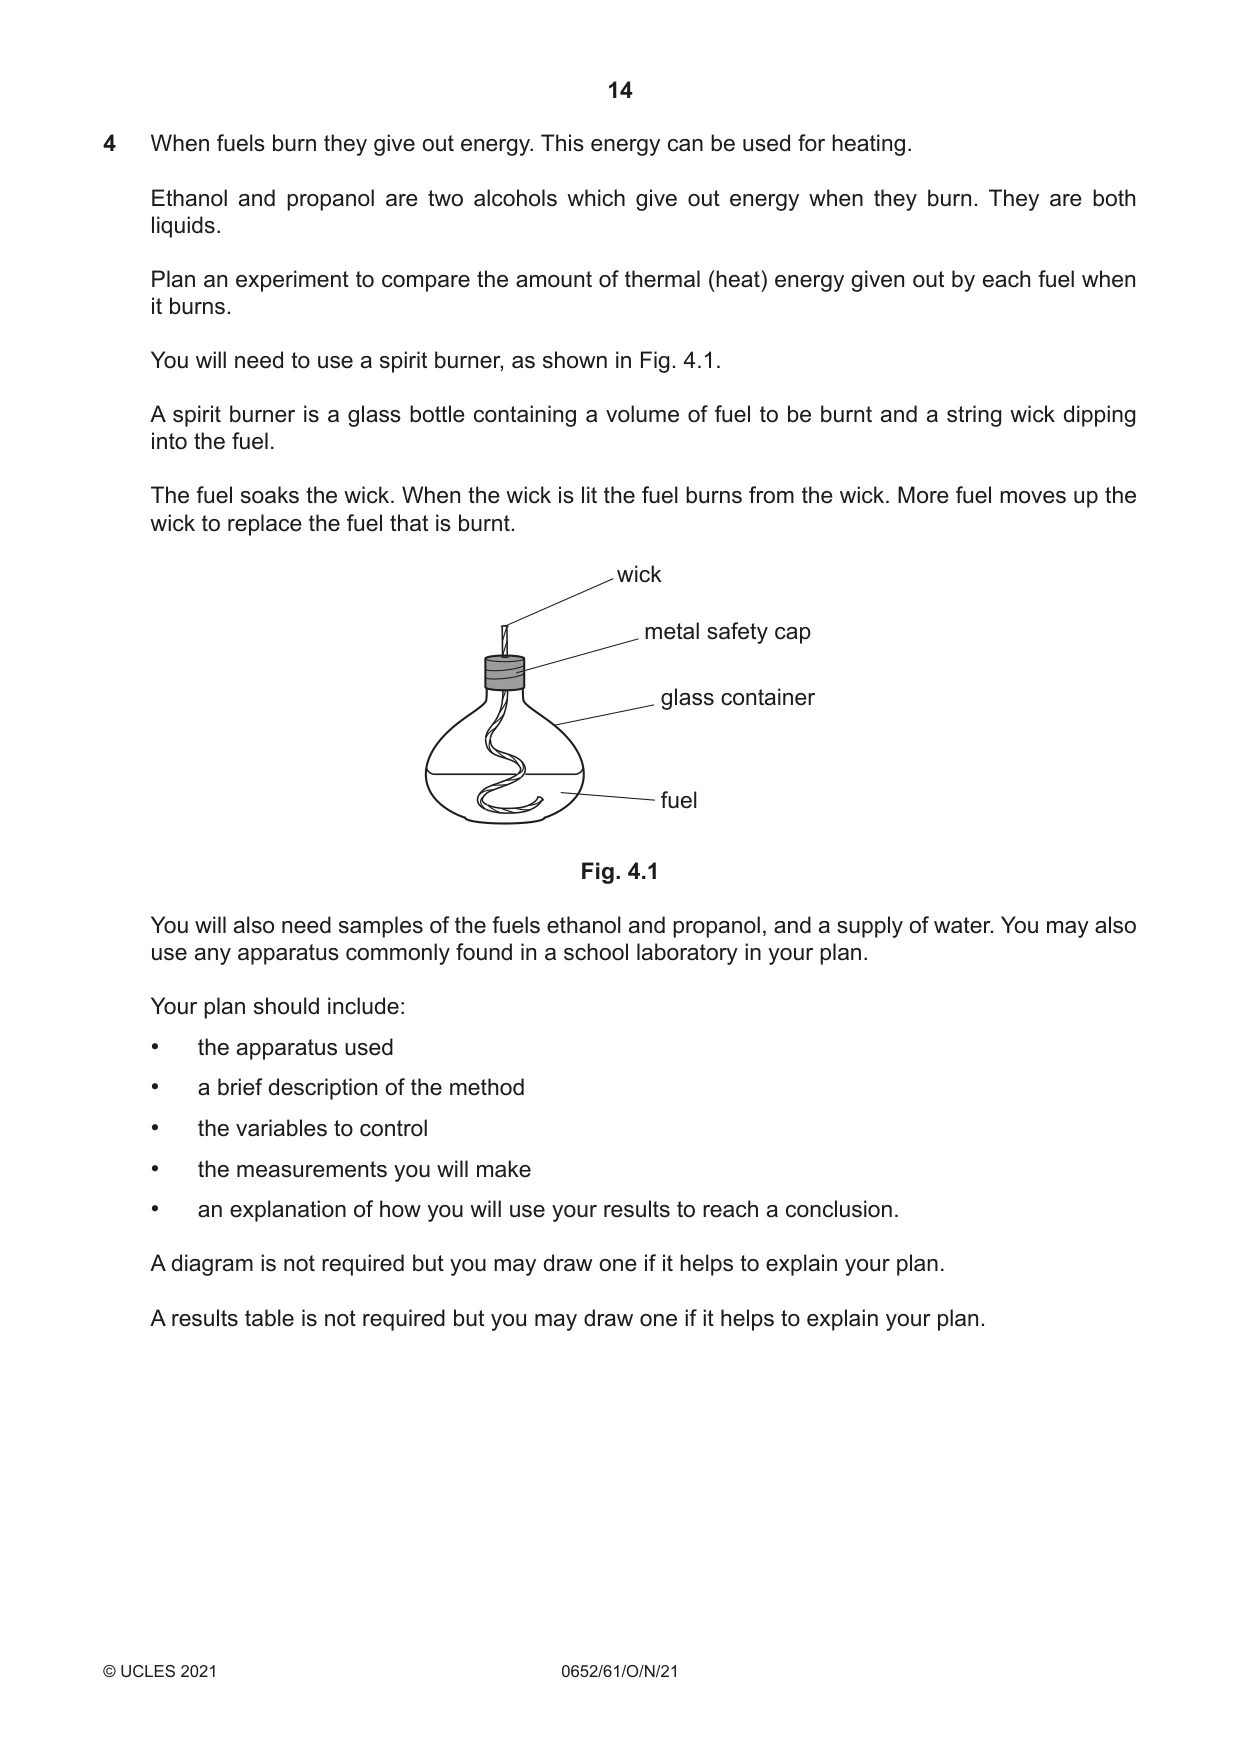
4 When fuels burn they give out energy. This energy can be used for heating. Ethanol and propanol are two alcohols which give out energy when they burn. They are both liquids. Plan an experiment to compare the amount of thermal (heat) energy given out by each fuel when it burns. You will need to use a spirit burner, as shown in Fig. 4.1. A spirit burner is a glass bottle containing a volume of fuel to be burnt and a string wick dipping into the fuel. The fuel soaks the wick. When the wick is lit the fuel burns from the wick. More fuel moves up the wick to replace the fuel that is burnt. wick metal safety cap glass container fuel Fig. 4.1 You will also need samples of the fuels ethanol and propanol, and a supply of water. You may also use any apparatus commonly found in a school laboratory in your plan. Your plan should include: • the apparatus used • a brief description of the method • the variables to control • the measurements you will make • an explanation of how you will use your results to reach a conclusion. A diagram is not required but you may draw one if it helps to explain your plan. A results table is not required but you may draw one if it helps to explain your plan. .......................................................................................................................................................... .......................................................................................................................................................... .......................................................................................................................................................... .......................................................................................................................................................... .......................................................................................................................................................... .......................................................................................................................................................... .......................................................................................................................................................... .......................................................................................................................................................... .......................................................................................................................................................... .......................................................................................................................................................... .......................................................................................................................................................... .......................................................................................................................................................... .......................................................................................................................................................... .......................................................................................................................................................... .......................................................................................................................................................... .......................................................................................................................................................... .......................................................................................................................................................... .......................................................................................................................................................... .......................................................................................................................................................... .......................................................................................................................................................... .......................................................................................................................................................... .......................................................................................................................................................... .......................................................................................................................................................... .......................................................................................................................................................... .......................................................................................................................................................... .......................................................................................................................................................... .......................................................................................................................................................... .......................................................................................................................................................... .......................................................................................................................................................... .......................................................................................................................................................... .................................................................................................................................................... [7]
Mark scheme: 4 apparatus container (and water) ; balance / measuring cylinder / burette / pipette ; thermometer ; stopclock / timer ; method light burner and heat water / any substance / object ; T change same and measure change in mass / volume / amount alcohol ; same mass / volume / amount burned and measure change in T ; T change for same time of burning ; controls (same) amount / volume of water ; (same) mass / volume / amount fuel / uses T change / gram ; (same) time ; measurements mass / volume / amount alcohol start and end ; initial T and final T ; time how long its heated for ; processing and use of results subtraction of final and initial T or final and initial mass / volume / amount ; correct comparison: larger T rise means more heat evolved / shorter time means more heat evolved / smaller mass / volume / amount used means more heat evolved ; 7
What was in this paper
The subtopics covered by these 4 questions, and how many questions each got. Open one in a new tab to see every Cambridge question on it.
What you needed in this session
Cambridge’s own grade thresholds for 2021 Oct/Nov, Paper 6 · Variant 1. A higher threshold means an easier paper — the bar moves with how the cohort did.