Cambridge IGCSE Mathematics 0580 — 2019 Oct/Nov Paper 1 · Variant 3
0580/13/O/N/19 · 23 questions · 56 marks · ≈63 min
The question paper and its mark scheme, free to read here and free to download. This is Cambridge’s own paper, exactly as it was sat.
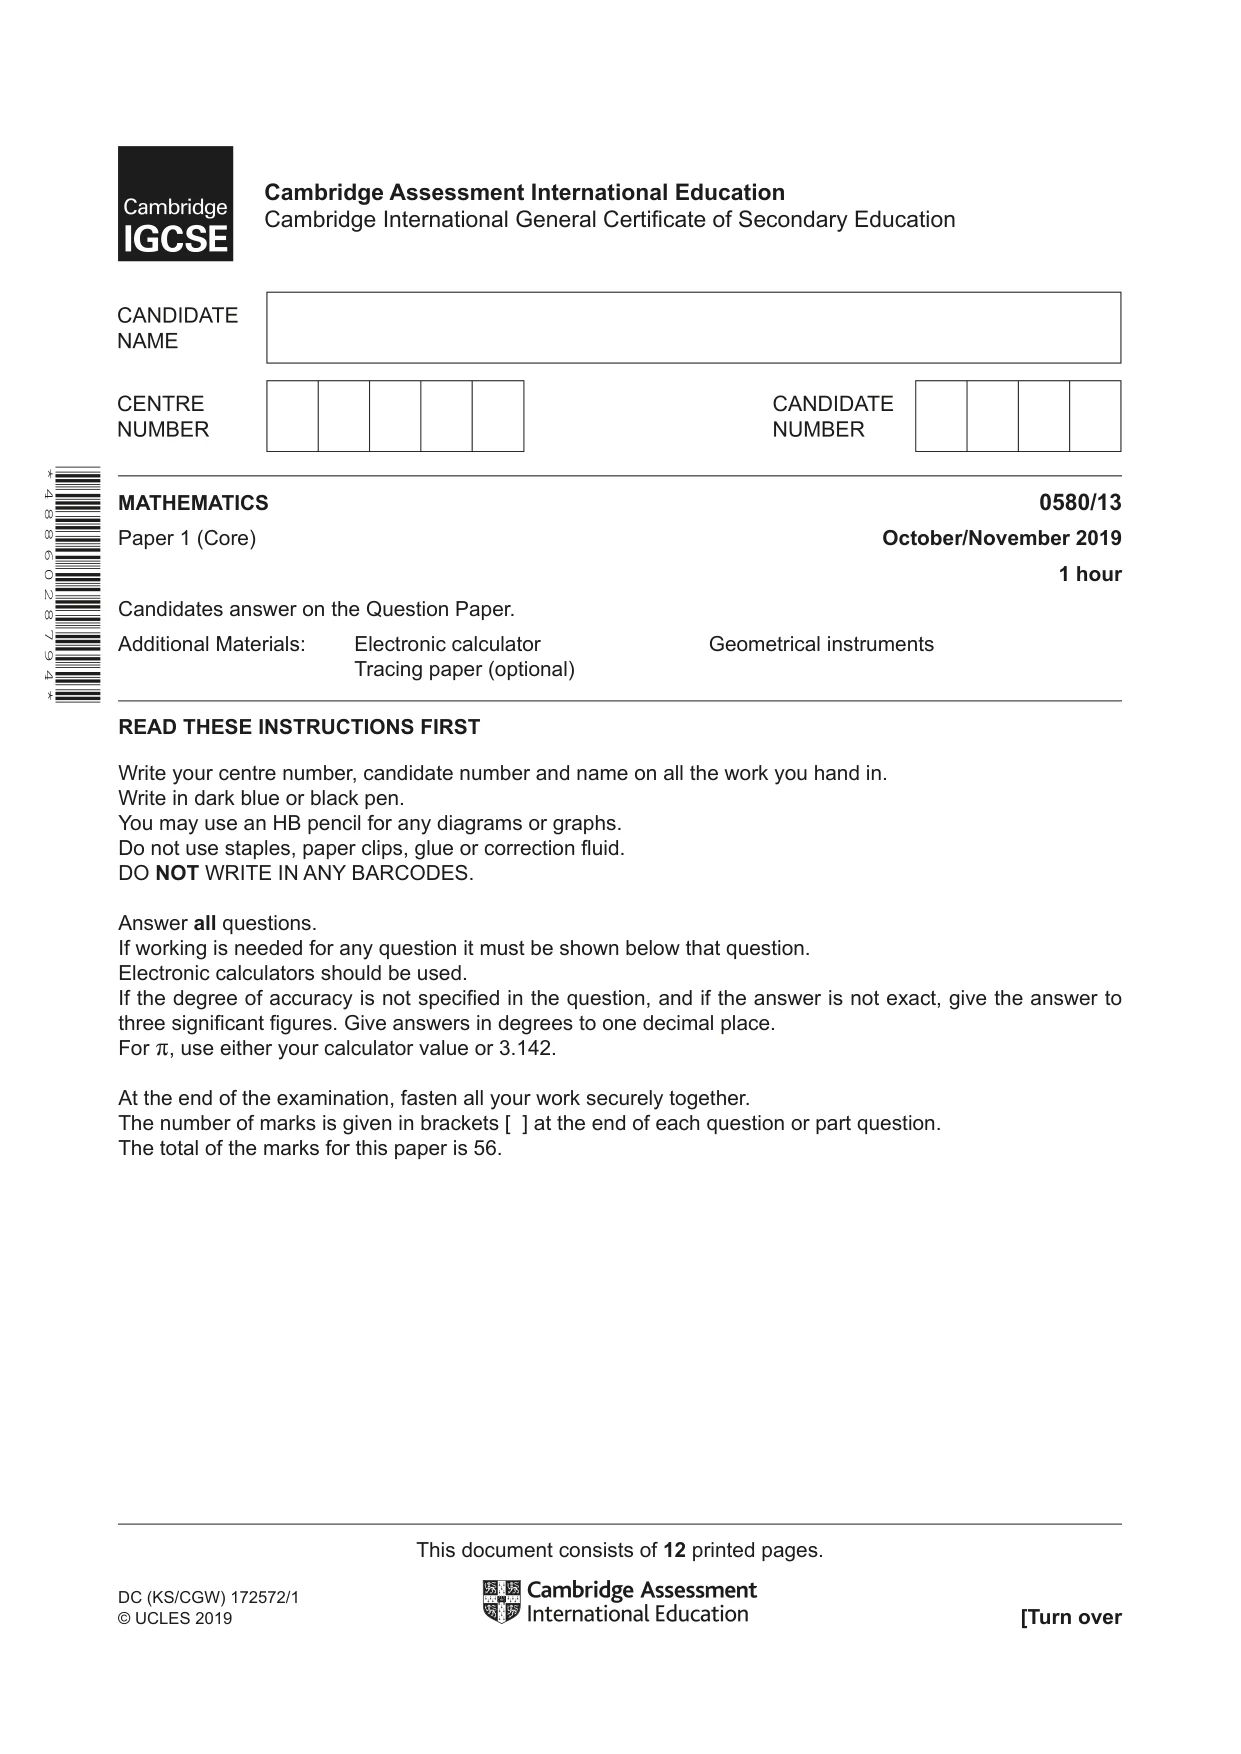
Question paper12 pages
Mark scheme5 pages
Answers below. Sit the paper first if you are practising.
Questions as text
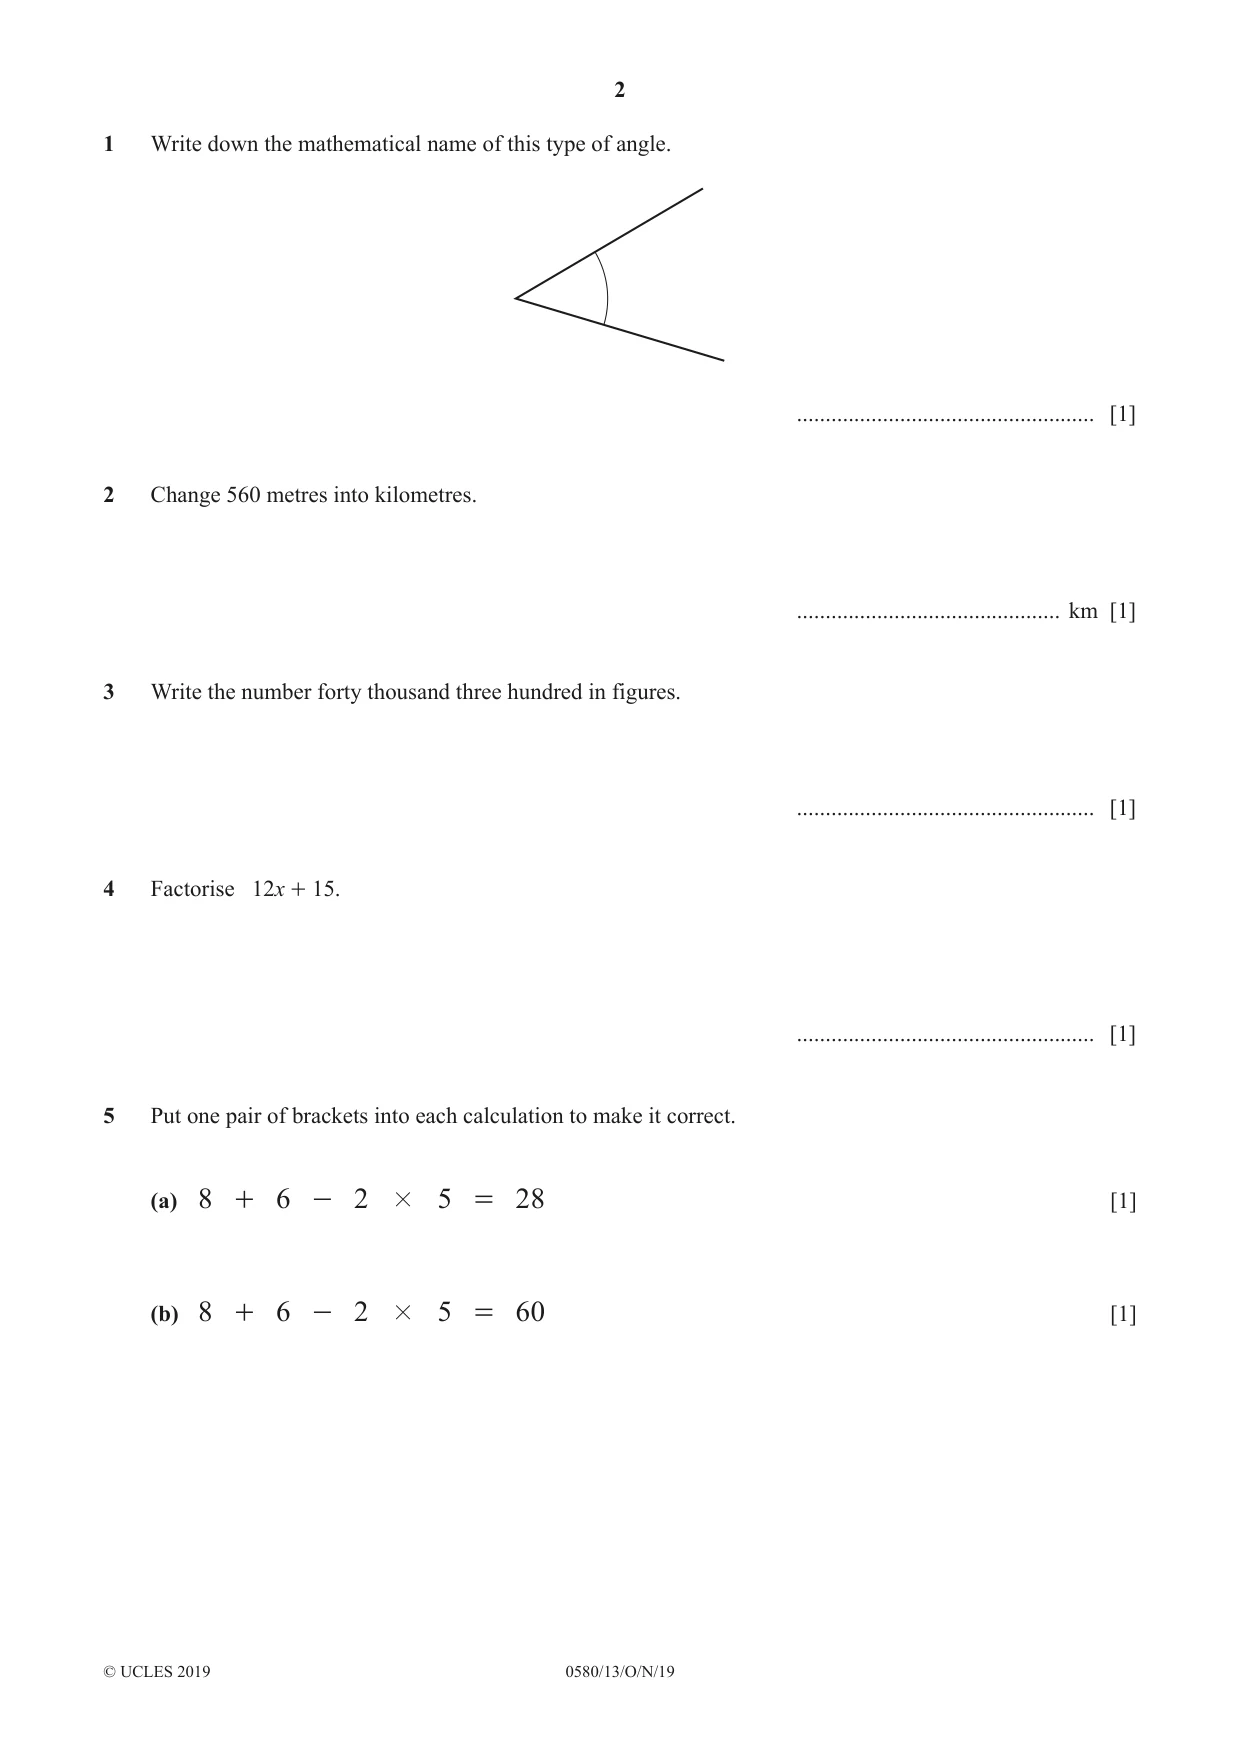
Q1 · Write down the mathematical name of this type of angle
1 Write down the mathematical name of this type of angle. .................................................... [1]
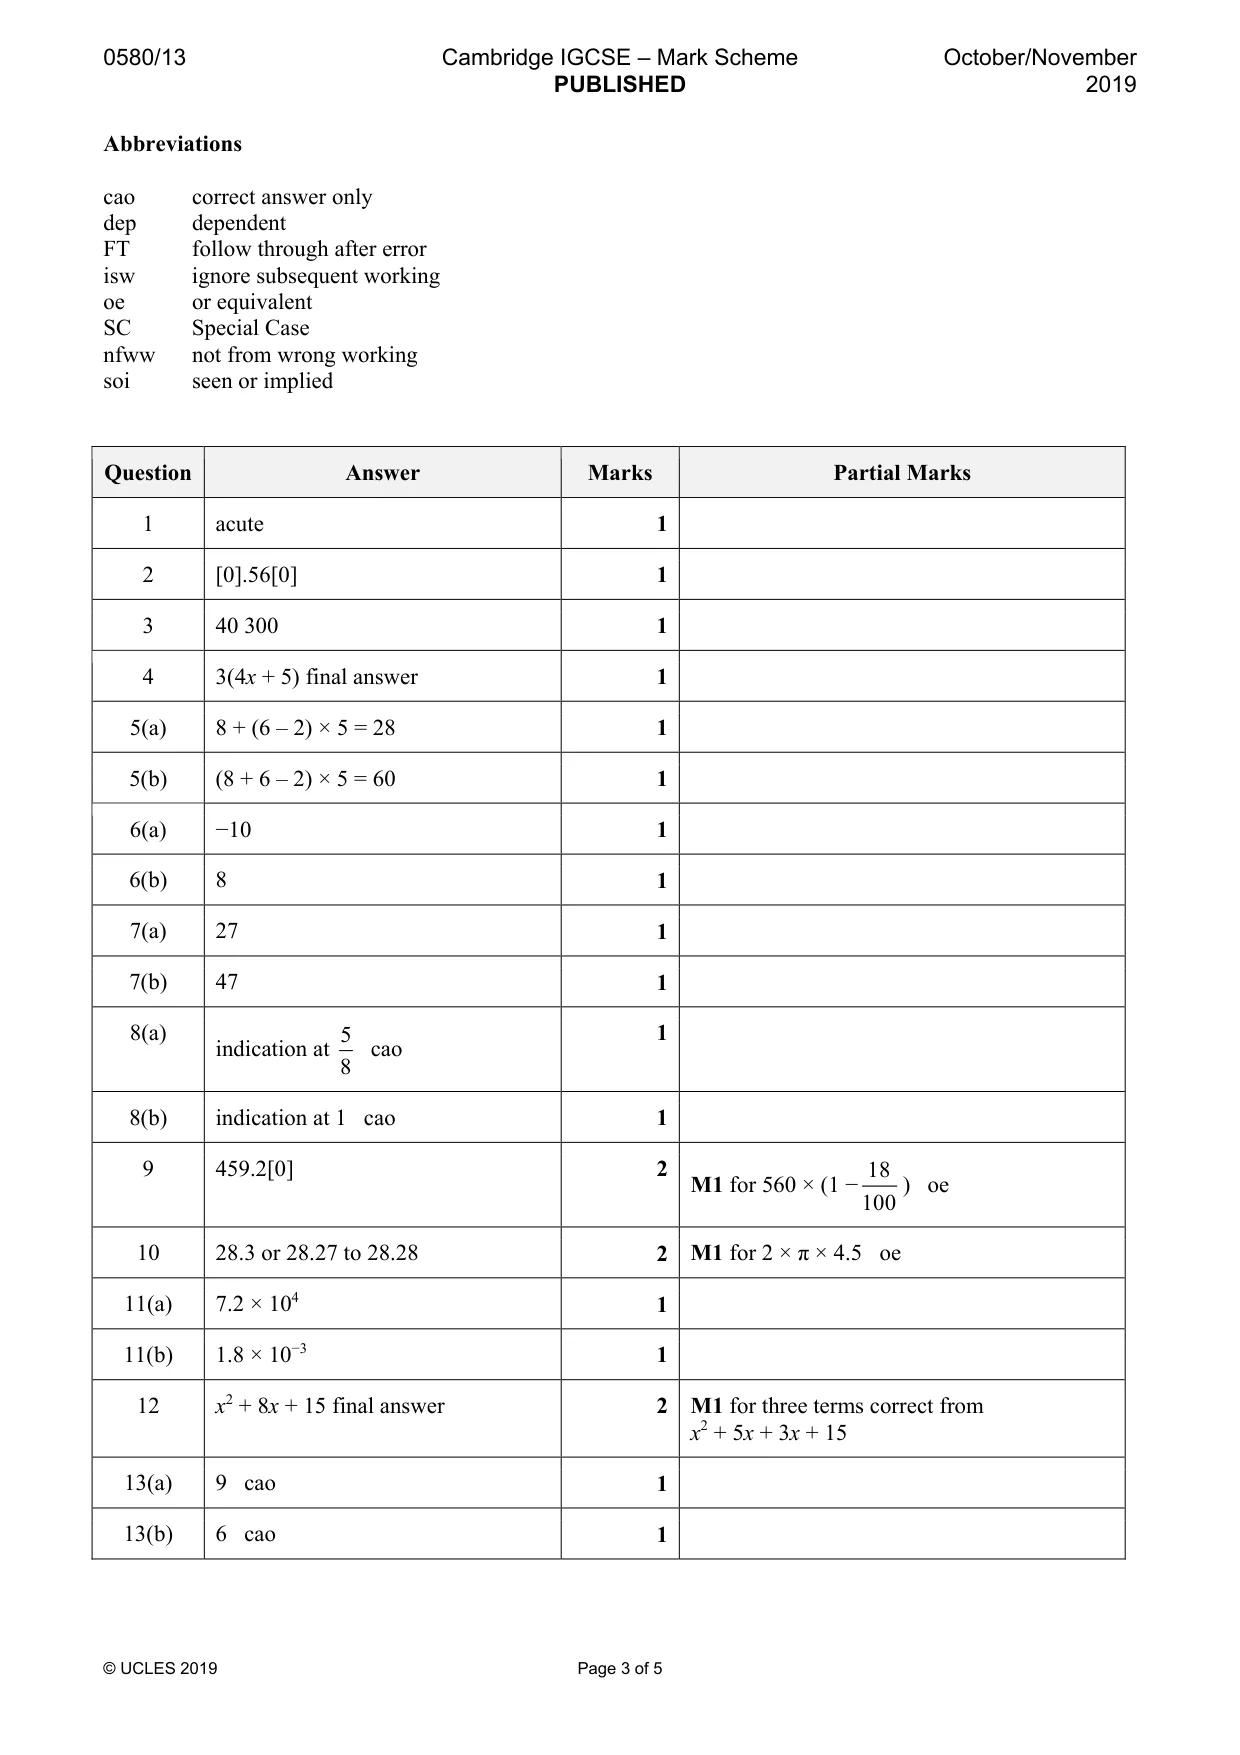
Mark scheme: Question Answer Marks Partial Marks 1 acute 1
Q2 · Change 560 metres into kilometres
2 Change 560 metres into kilometres. .............................................. km [1]
Mark scheme: 2 [0].56[0] 1
Q3 · Write the number forty thousand three hundred in figures
3 Write the number forty thousand three hundred in figures. .................................................... [1]
Mark scheme: 3 40 300 1
Q4 · Factorise 12x + 15
4 Factorise 12x + 15. .................................................... [1]
Mark scheme: 4 3(4x + 5) final answer 1
Q5 · Put one pair of brackets into each calculation to make it correct
5 Put one pair of brackets into each calculation to make it correct. (a) 8 + 6 - 2 # 5 = 28 [1] (b) 8 + 6 - 2 # 5 = 60 [1]
Mark scheme: 5(a) 8 + (6 – 2) × 5 = 28 1 5(b) (8 + 6 – 2) × 5 = 60 1
Q6 · Write down the temperature that is 7 °C below -3 °C
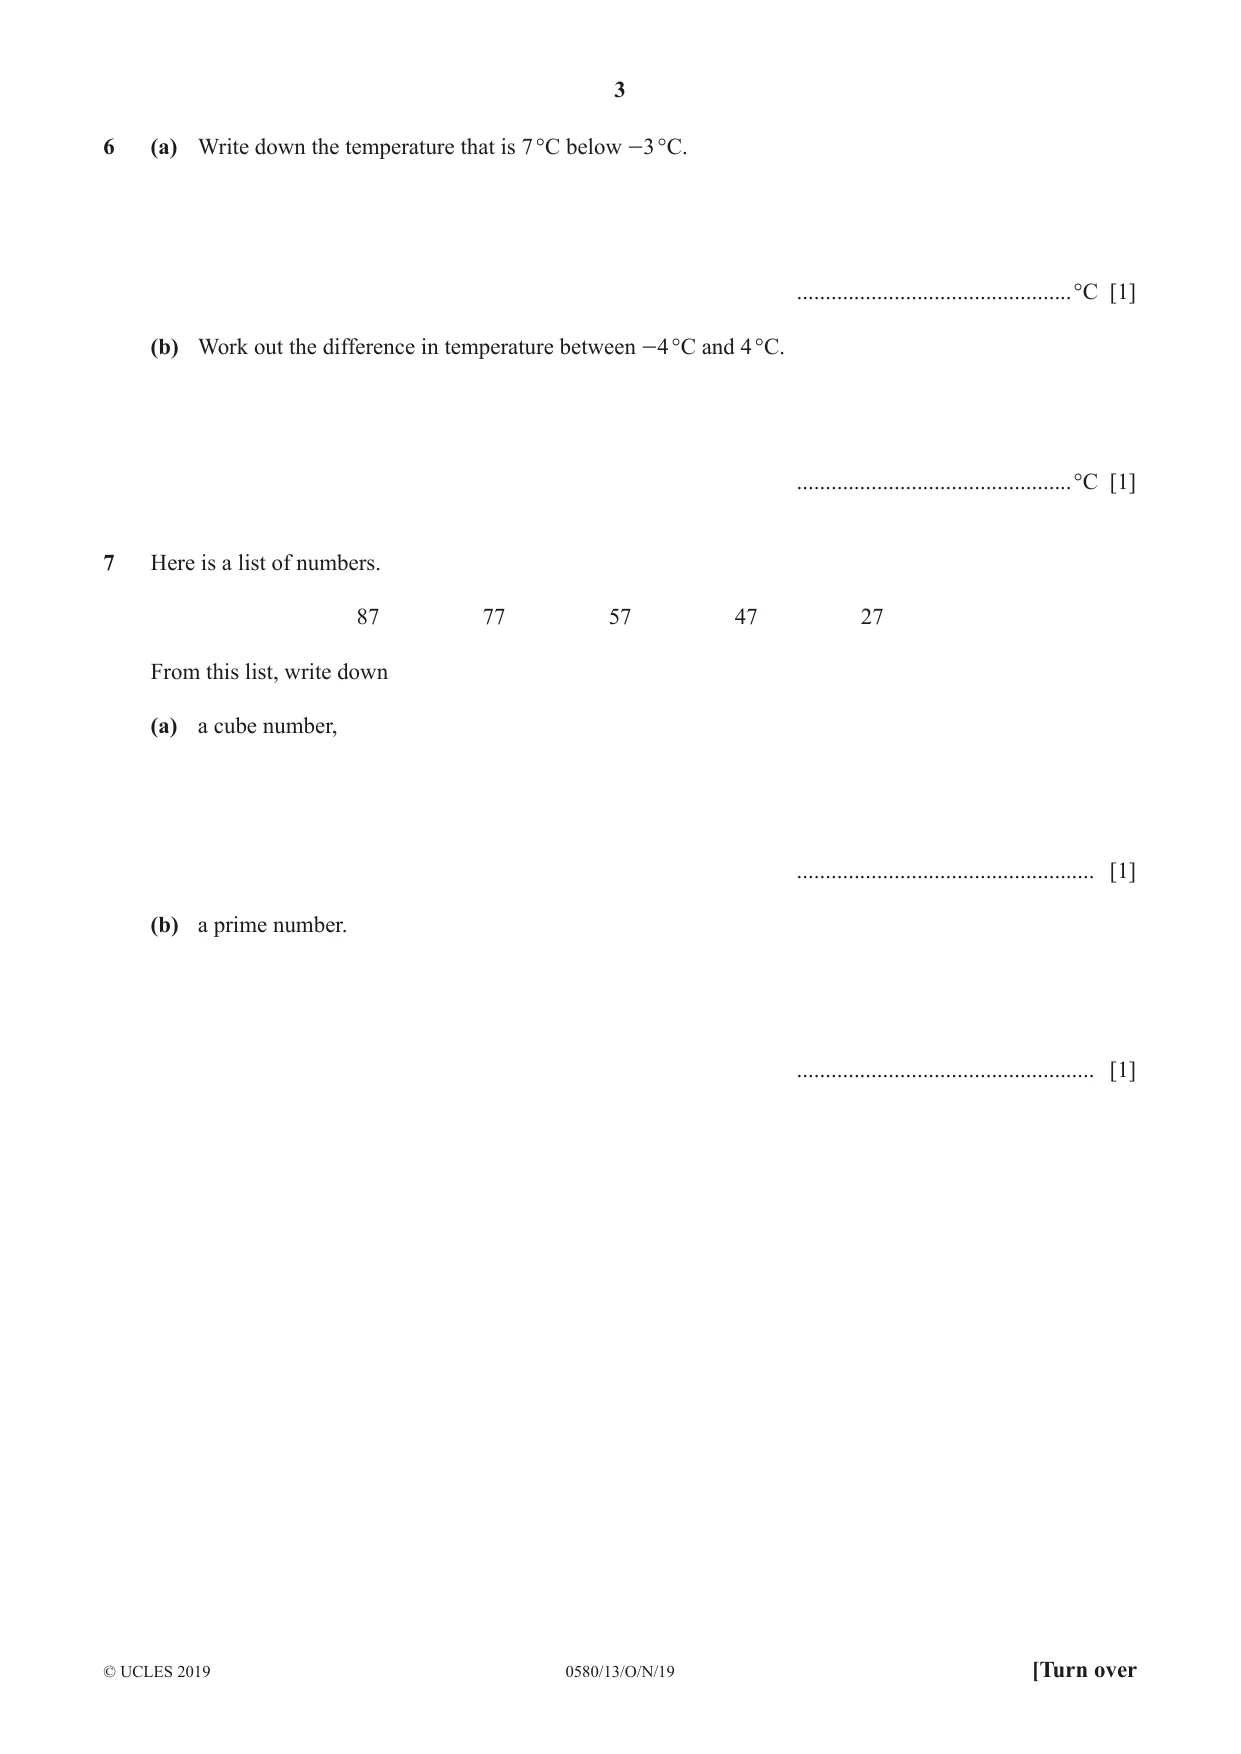
6 (a) Write down the temperature that is 7 °C below -3 °C. ................................................°C [1] (b) Work out the difference in temperature between -4 °C and 4 °C. ................................................°C [1]
Mark scheme: 6(a) −10 1 6(b) 8 1
Q7 · Here is a list of numbers
7 Here is a list of numbers. 87 77 57 47 27 From this list, write down (a) a cube number, .................................................... [1] (b) a prime number. .................................................... [1]
Mark scheme: 7(a) 27 1 7(b) 47 1
Q8 · A bag contains 6 red balls and 10 blue balls only
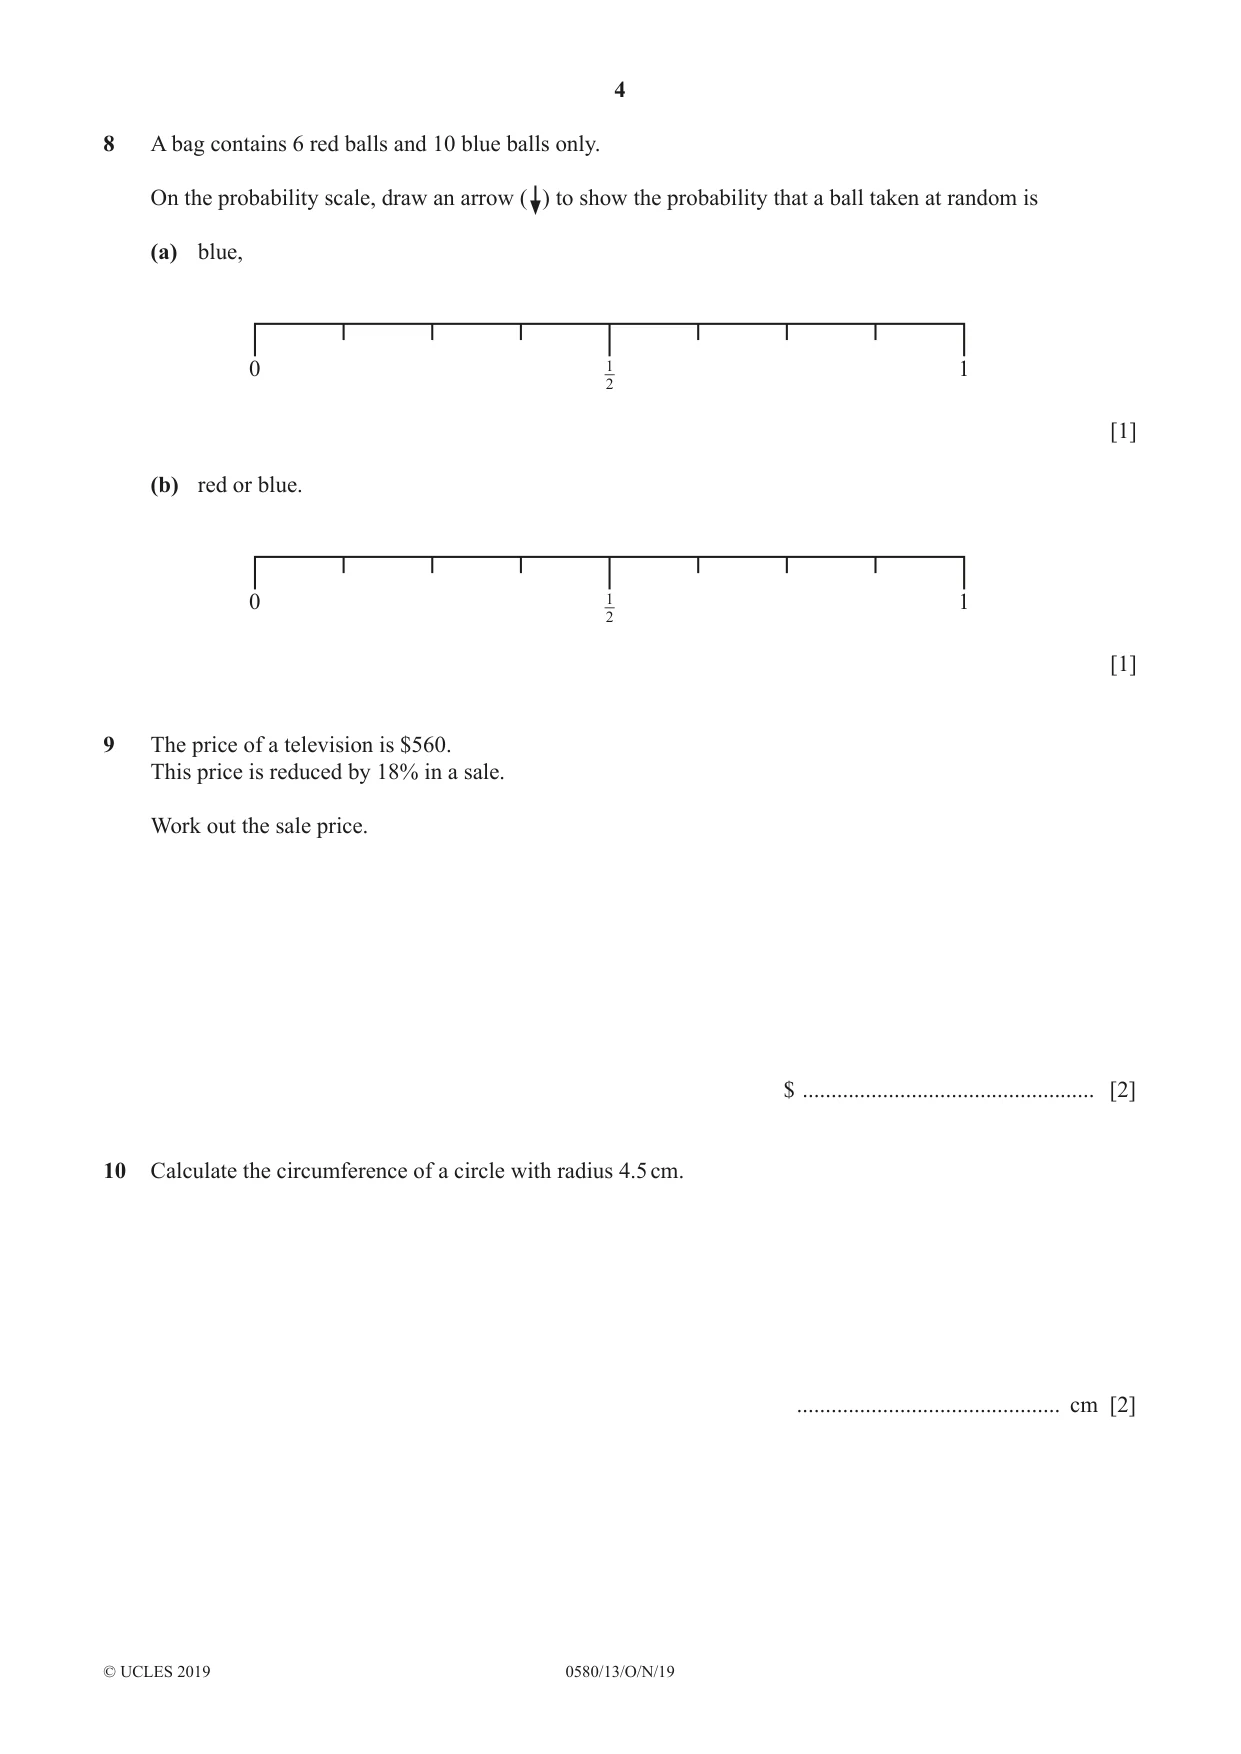
8 A bag contains 6 red balls and 10 blue balls only. On the probability scale, draw an arrow ( ) to show the probability that a ball taken at random is (a) blue, 0 1 1 2 [1] (b) red or blue. 0 1 1 2 [1]
Mark scheme: 8(a) 5 1 indication at cao 8 8(b) indication at 1 cao 1
Q9 · The price of a television is $560
9 The price of a television is $560. This price is reduced by 18% in a sale. Work out the sale price. $ ................................................... [2]
Mark scheme: 9 459.2[0] 2 M1 for 560 × (1 −18 ) oe 100
Q10 · Calculate the circumference of a circle with radius 4.5 cm
10 Calculate the circumference of a circle with radius 4.5 cm. .............................................. cm [2]
Mark scheme: 10 28.3 or 28.27 to 28.28 2 M1 for 2 × π × 4.5 oe
Q11 · Write in standard form
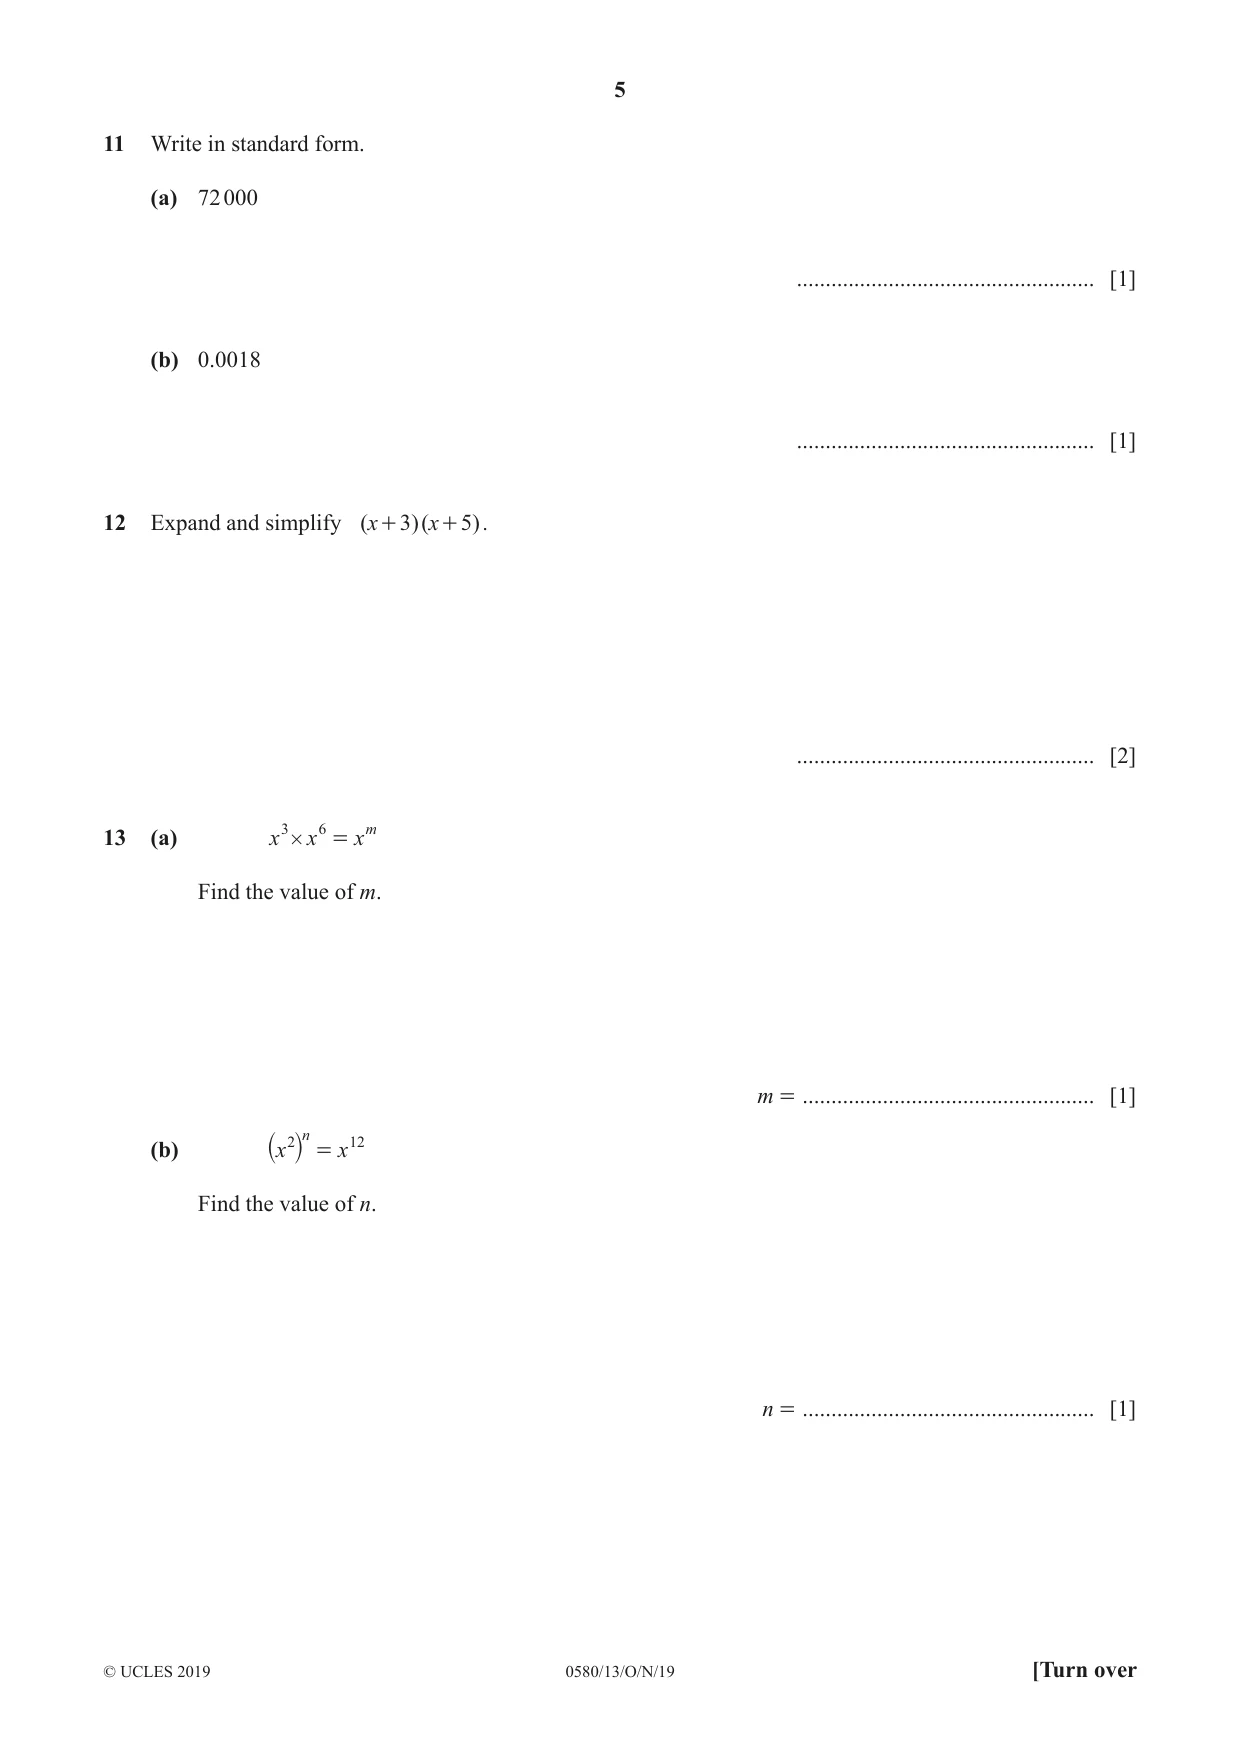
11 Write in standard form. (a) 72 000 .................................................... [1] (b) 0.0018 .................................................... [1]
Mark scheme: 11(a) 7.2 × 10⁴ 1 11(b) 1.8 × 10⁻³ 1
Q12 · Expand and simplify (x + 3)(x + 5)
12 Expand and simplify (x + 3)(x + 5). .................................................... [2]
Mark scheme: 12 x2 + 8x + 15 final answer 2 M1 for three terms correct from x2 + 5x + 3x + 15
Q13 · X 3 # x 6 = xm Find the value of m
13 (a) x 3 # x 6 = xm Find the value of m. m = ................................................... [1] n (b) x 2 = x 12 ` j Find the value of n. n = ................................................... [1]
Mark scheme: 13(a) 9 cao 1 13(b) 6 cao 1
Q14 · The diagram shows a right-angled triangle
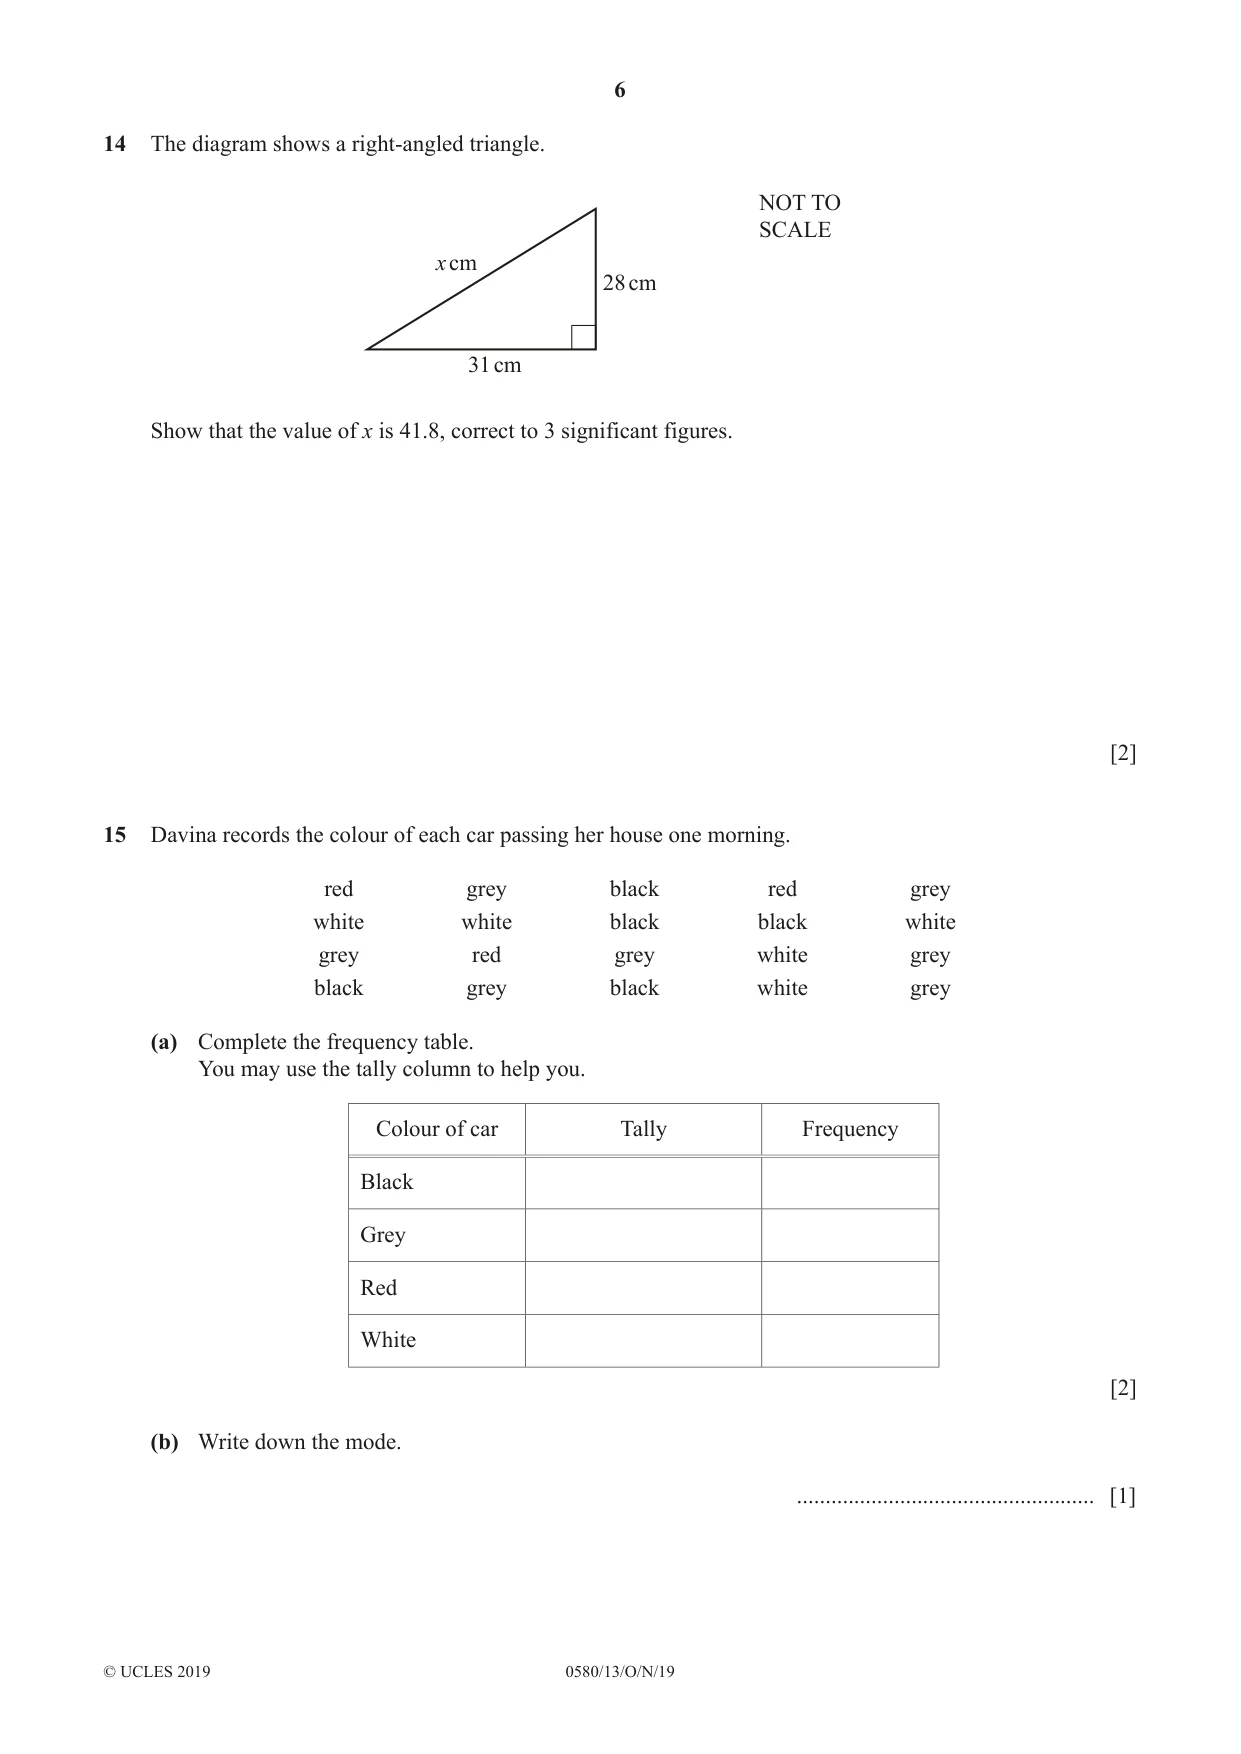
14 The diagram shows a right-angled triangle. NOT TO SCALE x cm 28 cm 31 cm Show that the value of x is 41.8, correct to 3 significant figures. [2]
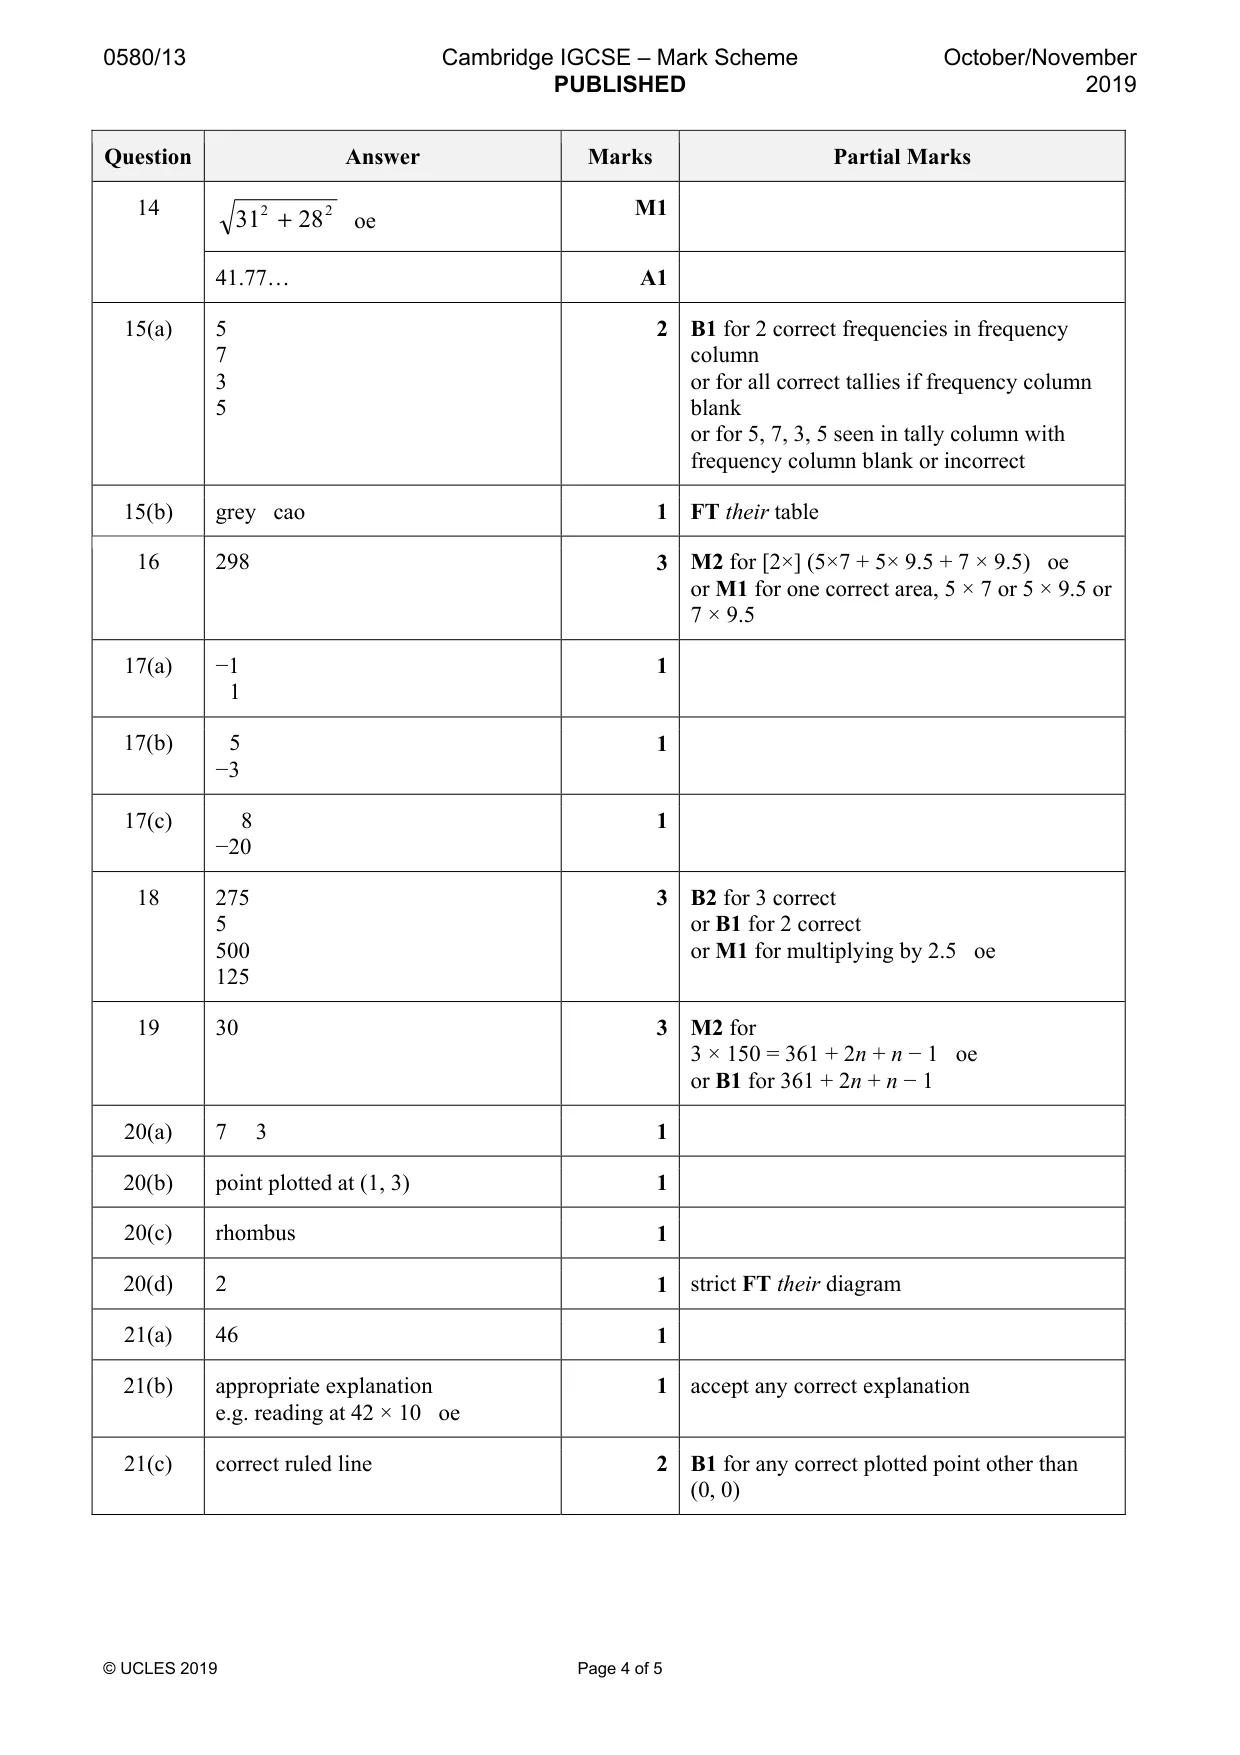
Mark scheme: 14 2 2 M1 31 + 28 oe 41.77… A1
Q15 · Davina records the colour of each car passing her house one morning
15 Davina records the colour of each car passing her house one morning. red grey black red grey white white black black white grey red grey white grey black grey black white grey (a) Complete the frequency table. You may use the tally column to help you. Colour of car Tally Frequency Black Grey Red White [2] (b) Write down the mode. .................................................... [1]
Mark scheme: 15(a) 5 2 B1 for 2 correct frequencies in frequency 7 column 3 or for all correct tallies if frequency column 5 blank or for 5, 7, 3, 5 seen in tally column with frequency column blank or incorrect 15(b) grey cao 1 FT their table
Q16 · A cuboid measures 5 cm by 7 cm by 9.5 cm
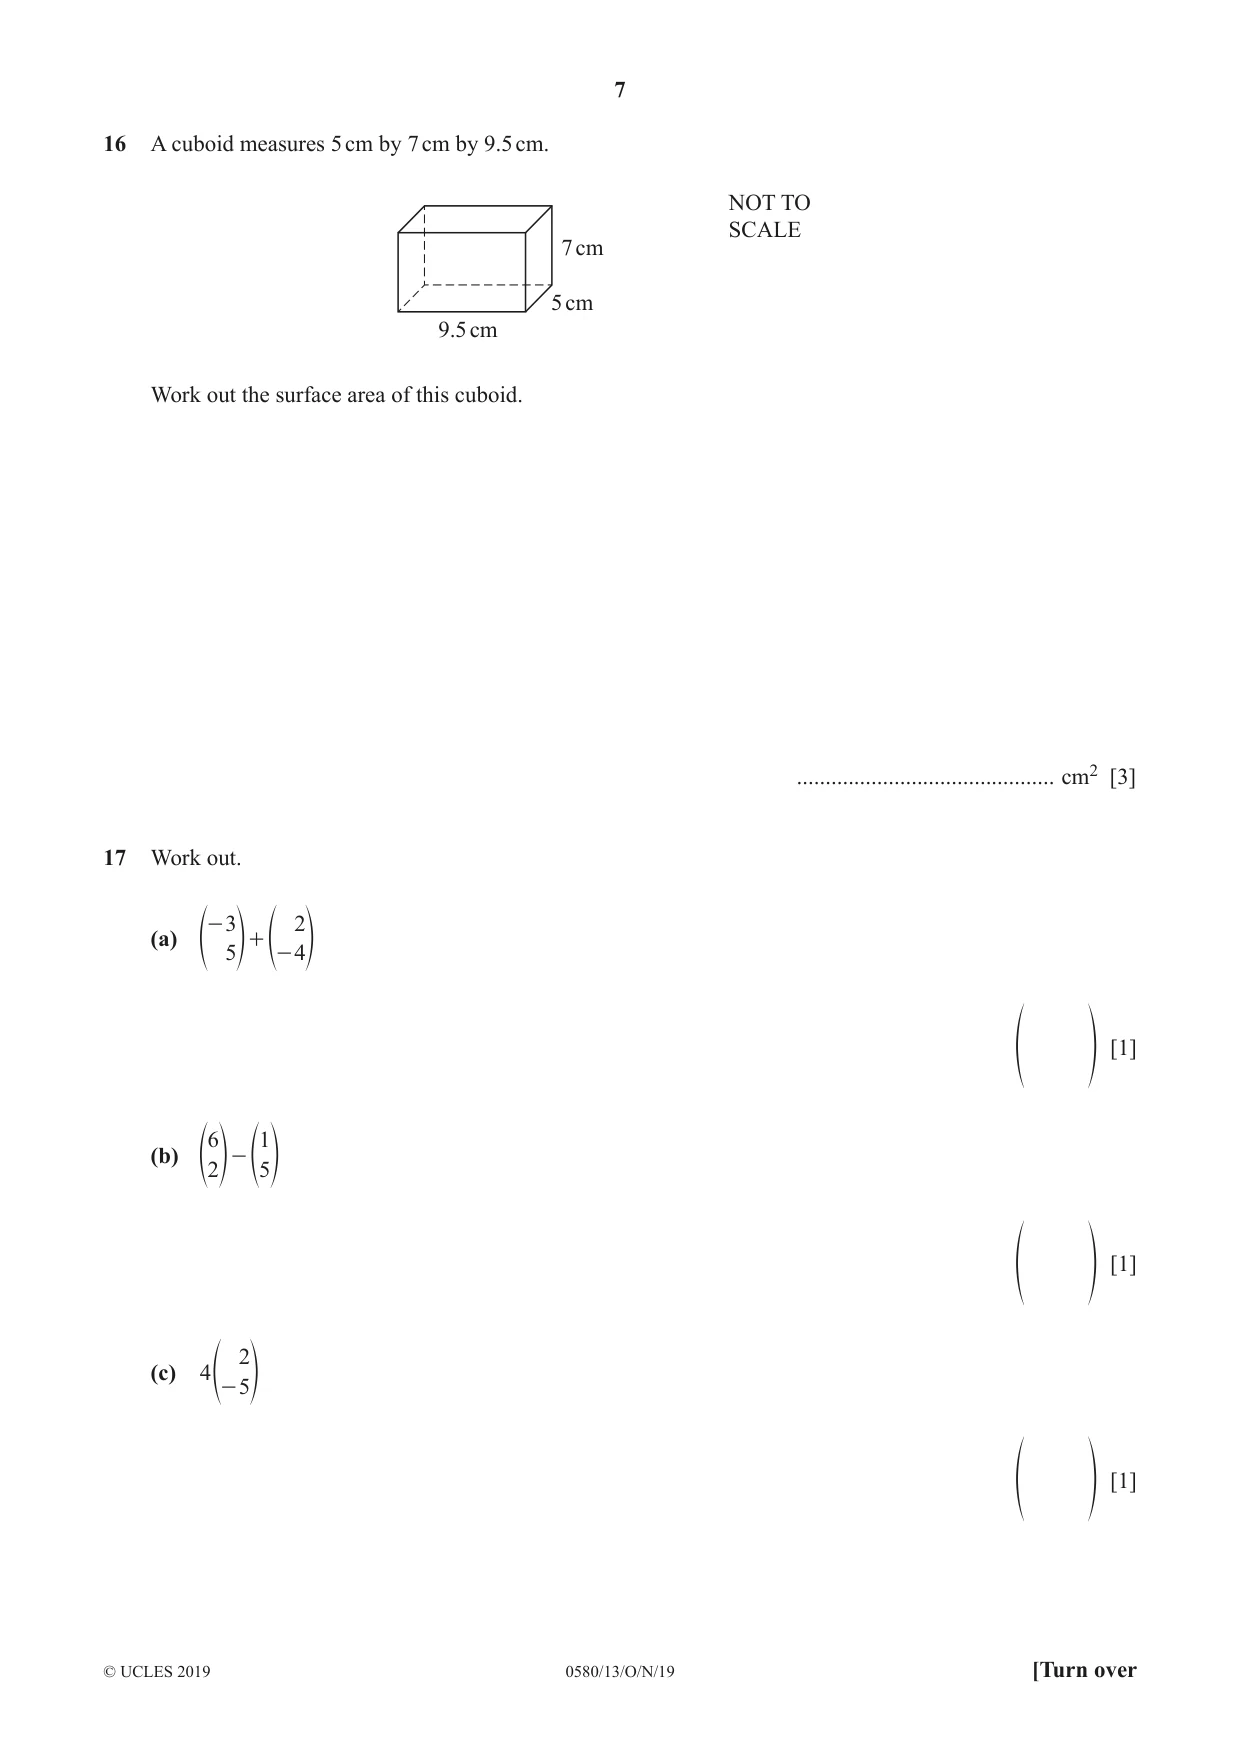
16 A cuboid measures 5 cm by 7 cm by 9.5 cm. NOT TO SCALE 7 cm 5 cm 9.5 cm Work out the surface area of this cuboid. ............................................. cm2 [3]
Mark scheme: 16 298 3 M2 for [2×] (5×7 + 5× 9.5 + 7 × 9.5) oe or M1 for one correct area, 5 × 7 or 5 × 9.5 or 7 × 9.5
Question 17
17 Work out. - 3 2 (a) + f 5p f - 4p [1] f p 6 1 (b) - f2p f5p [1] f p 2 (c) 4 f - 5p [1] f p
Mark scheme: 17(a) −1 1 1 17(b) 5 1 −3 17(c) 8 1 −20
Q18 · Here is a list of ingredients to make 12 pancakes
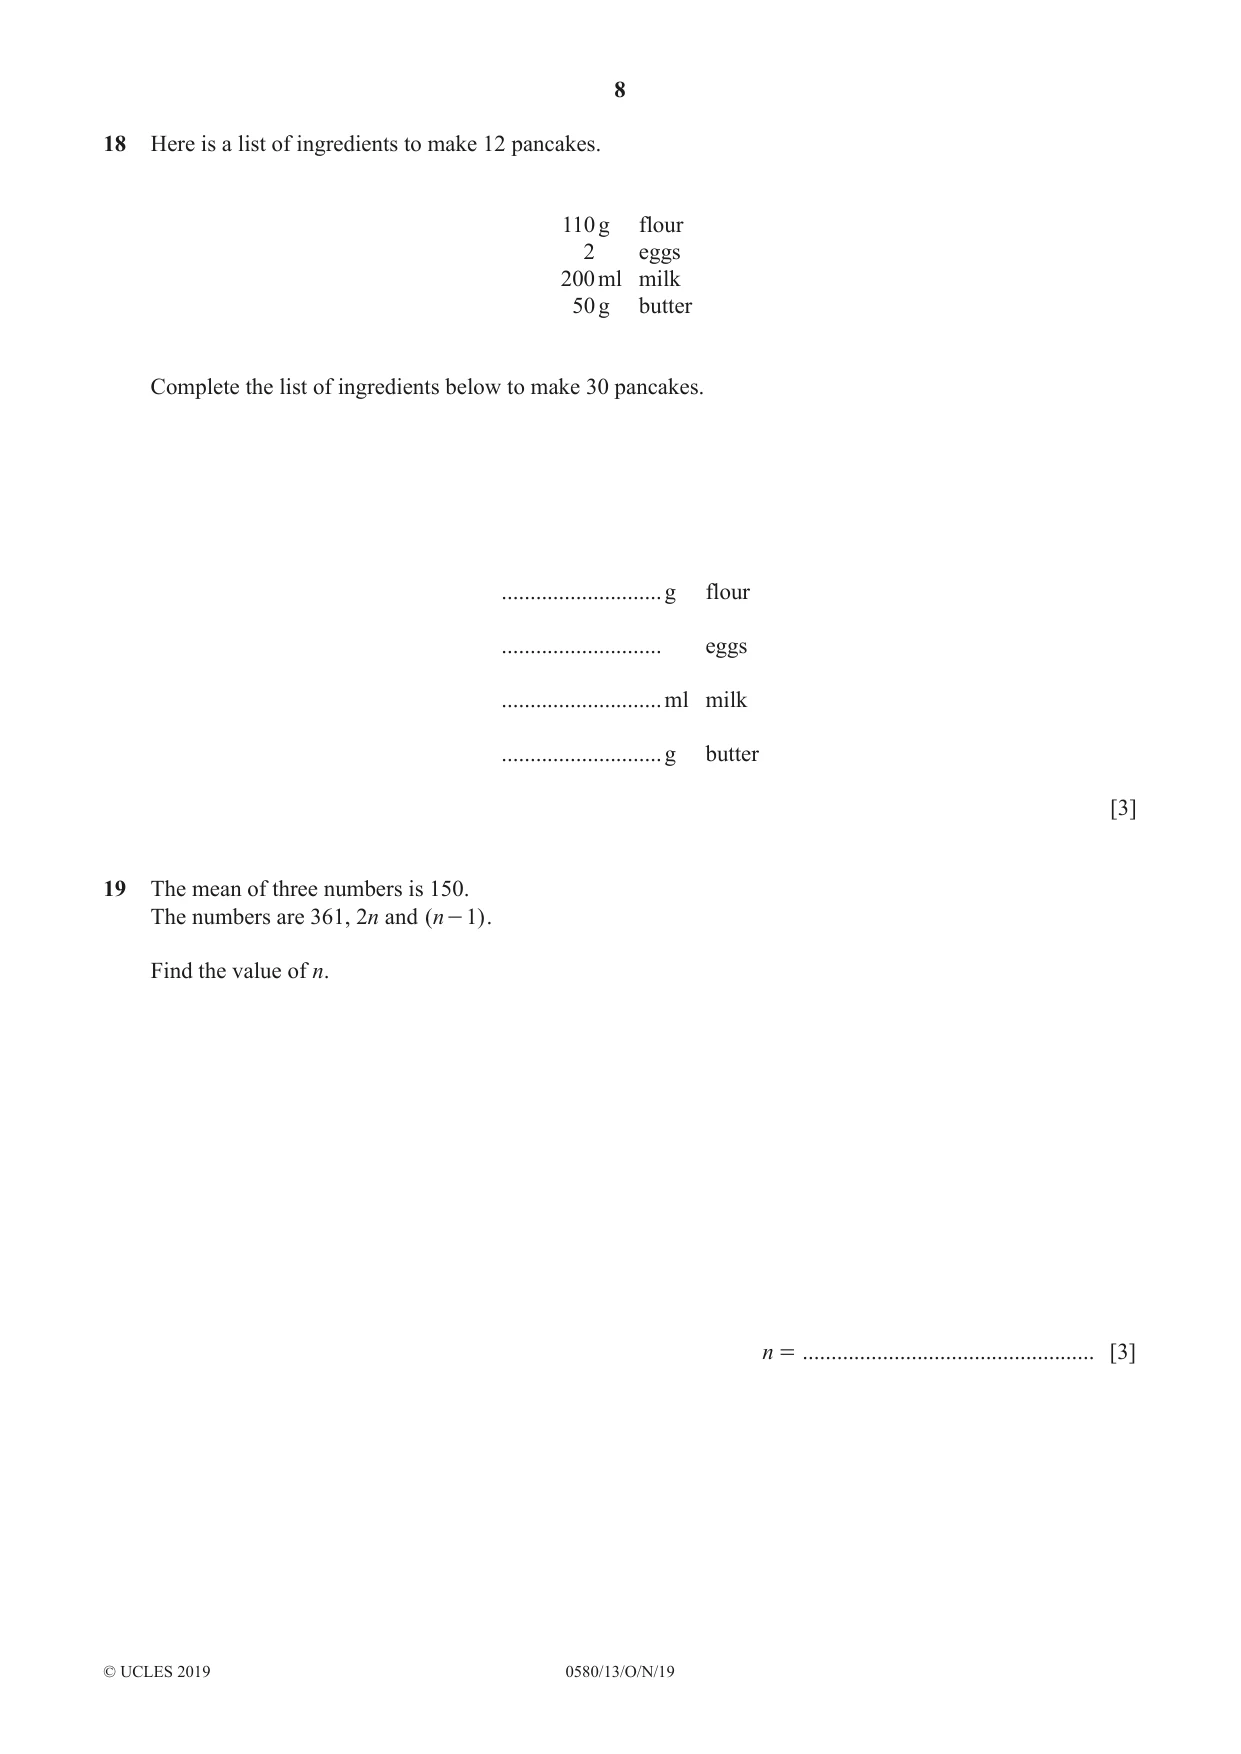
18 Here is a list of ingredients to make 12 pancakes. 110 g flour 2 eggs 200 ml milk 50 g butter Complete the list of ingredients below to make 30 pancakes. ............................ g flour ............................ eggs ............................ ml milk ............................ g butter [3]
Mark scheme: 18 275 3 B2 for 3 correct 5 or B1 for 2 correct 500 or M1 for multiplying by 2.5 oe 125
Q19 · The mean of three numbers is 150
19 The mean of three numbers is 150. The numbers are 361, 2n and (n - 1) . Find the value of n. n = ................................................... [3]
Mark scheme: 19 30 3 M2 for 3 × 150 = 361 + 2n + n − 1 oe or B1 for 361 + 2n + n − 1
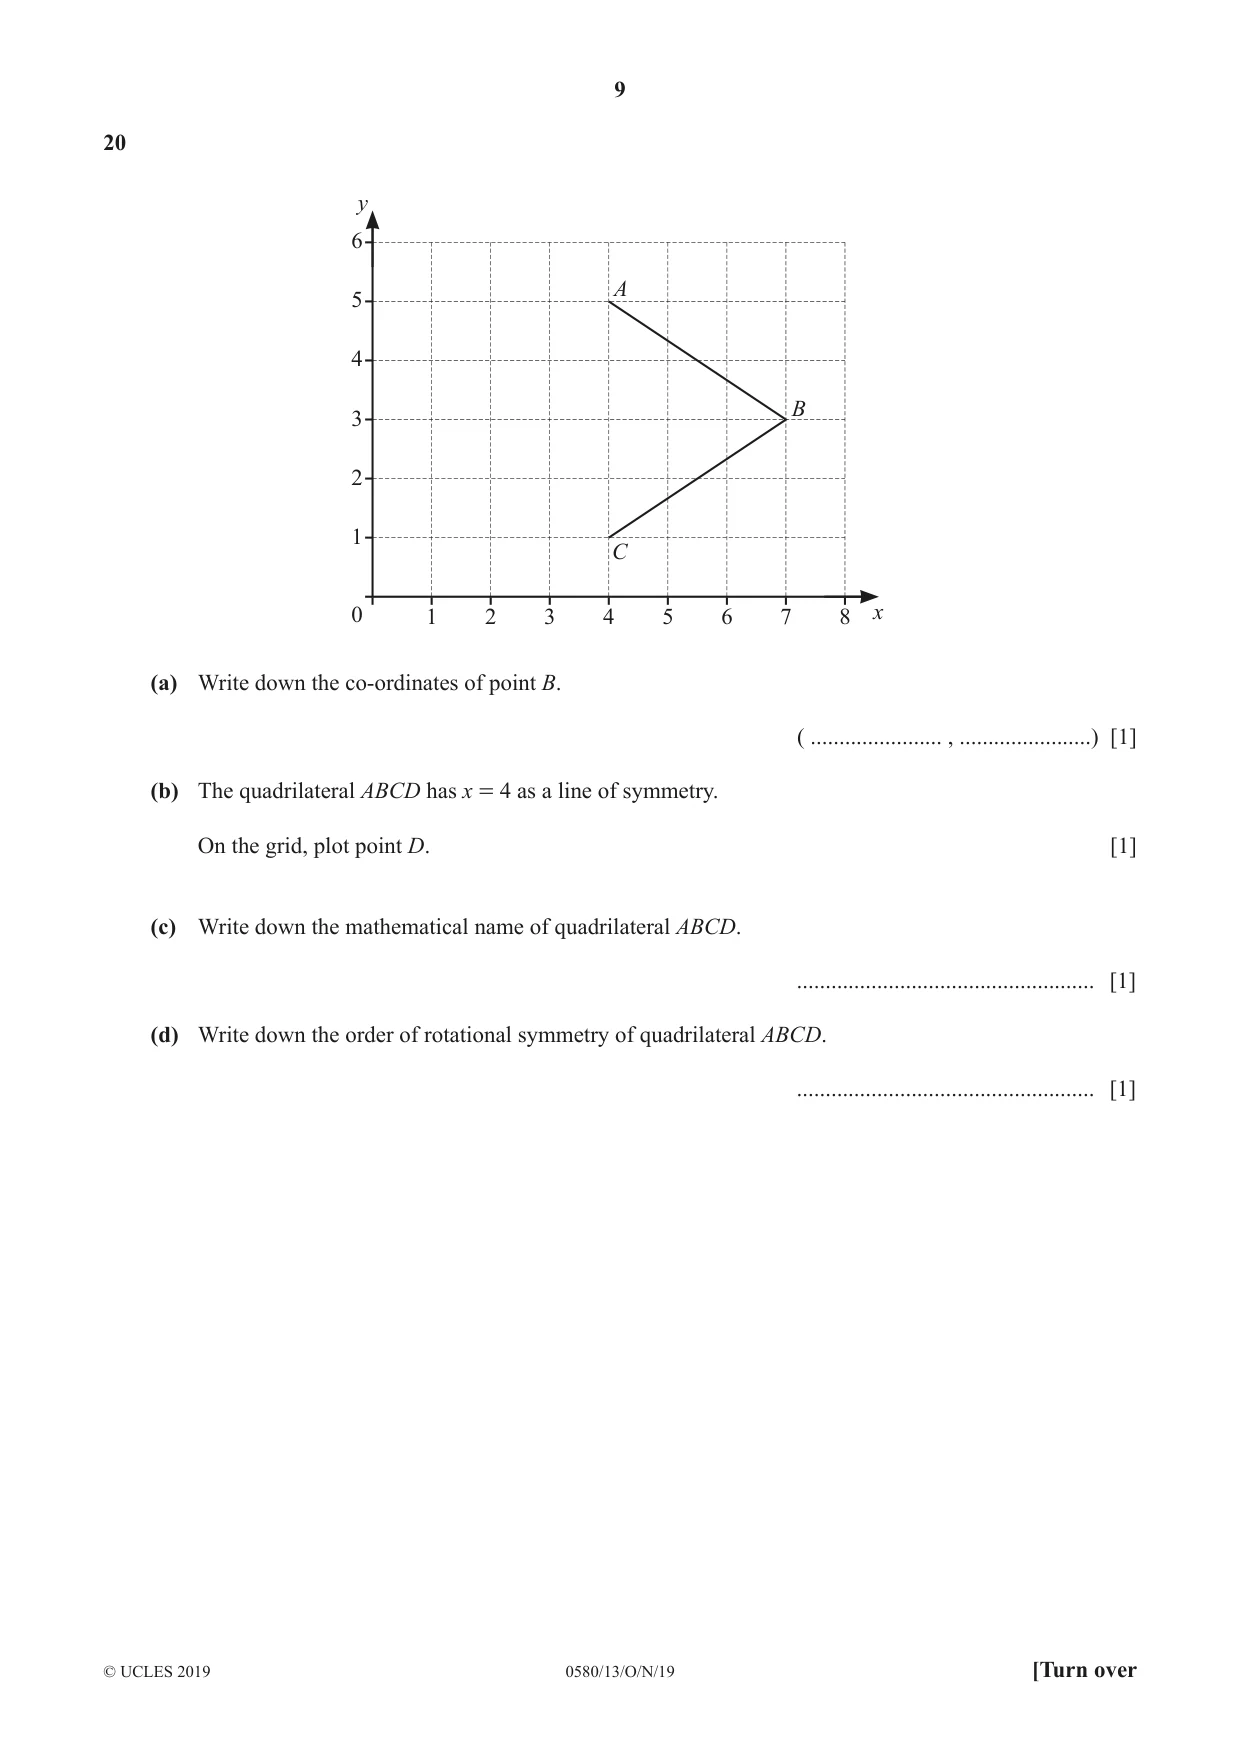
Q20 · Y 6 A 5 4 B 3 2 1 C 0 1 2 3 4 5 6 7 8 x (a) Write down the co-ordinates of point B
20 y 6 A 5 4 B 3 2 1 C 0 1 2 3 4 5 6 7 8 x (a) Write down the co-ordinates of point B. ( ....................... , .......................) [1] (b) The quadrilateral ABCD has x = 4 as a line of symmetry. On the grid, plot point D. [1] (c) Write down the mathematical name of quadrilateral ABCD. .................................................... [1] (d) Write down the order of rotational symmetry of quadrilateral ABCD. .................................................... [1]
Mark scheme: 20(a) 7 3 1 20(b) point plotted at (1, 3) 1 20(c) rhombus 1 20(d) 2 1 strict FT their diagram
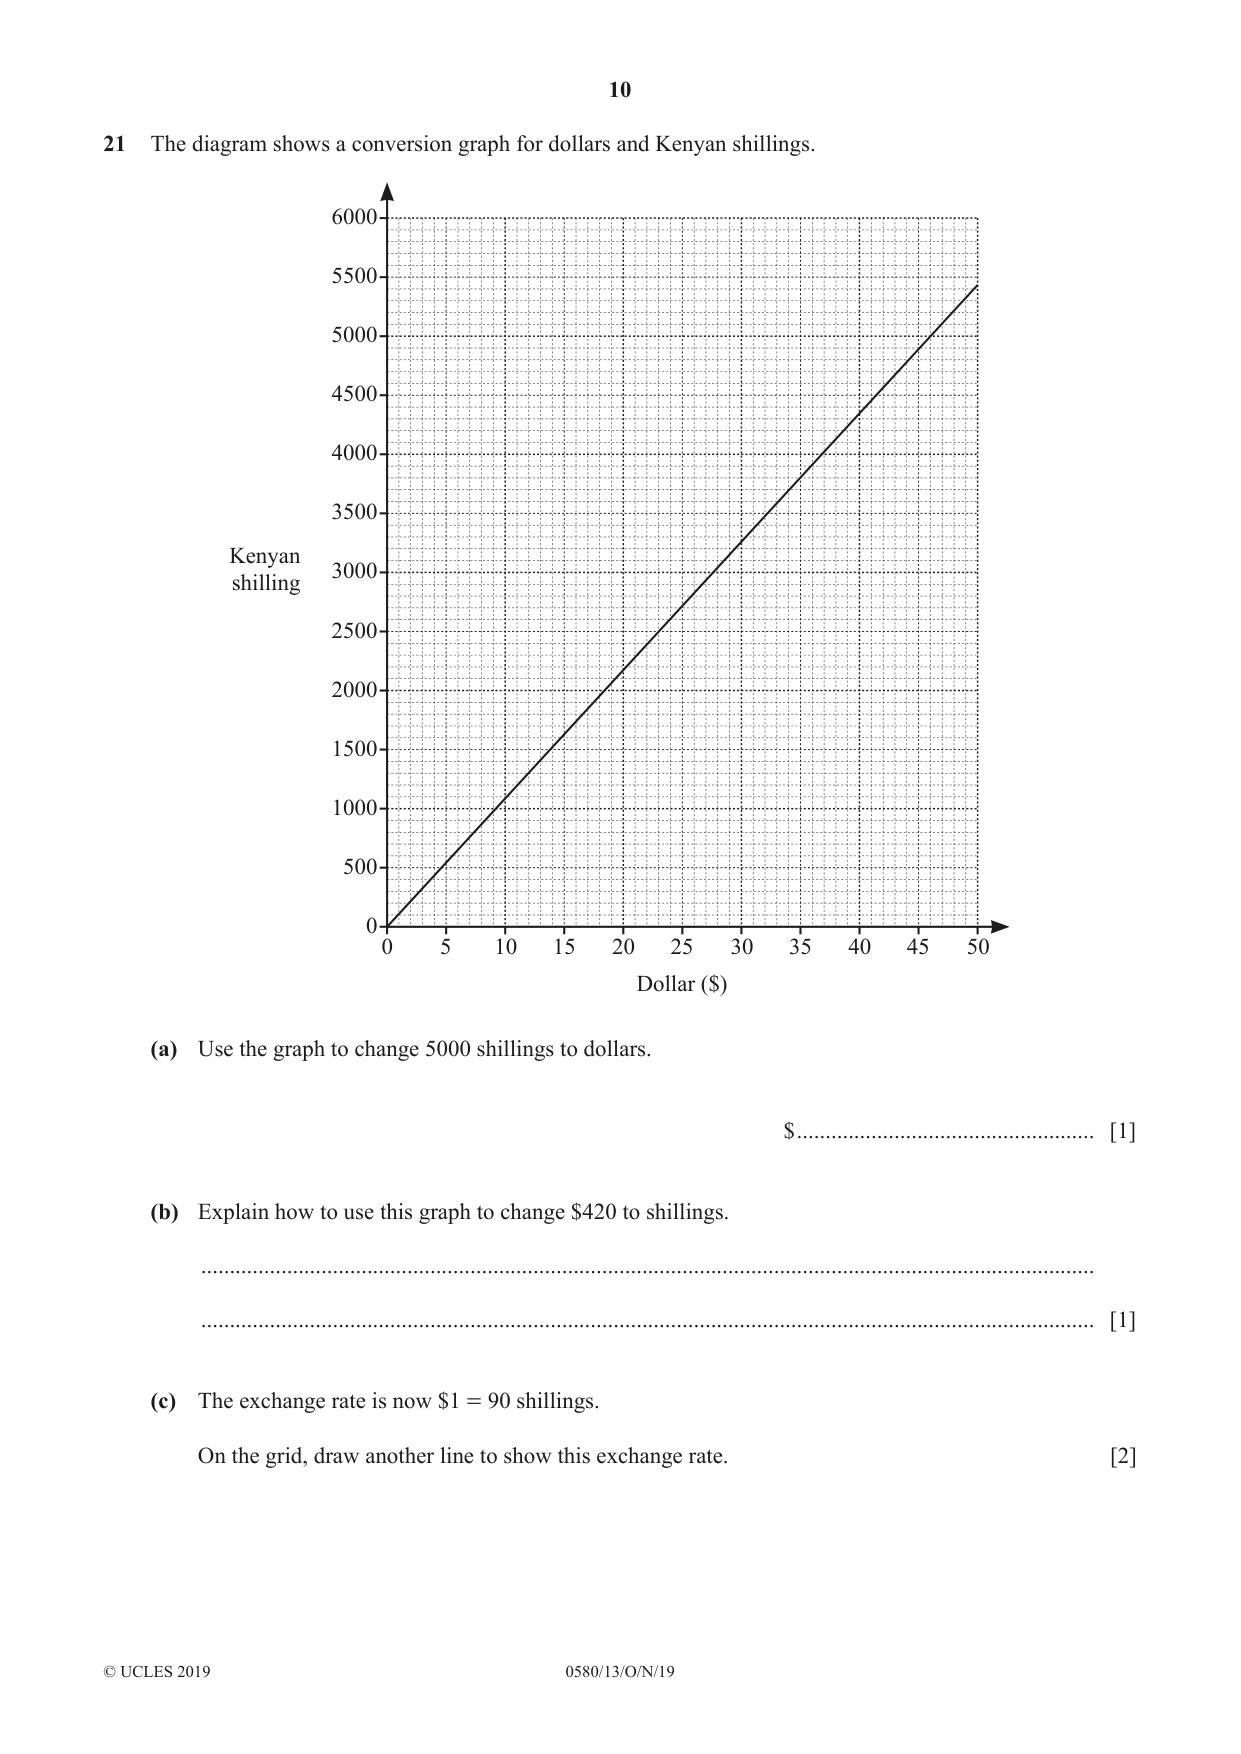
Q21 · The diagram shows a conversion graph for dollars and Kenyan shillings
21 The diagram shows a conversion graph for dollars and Kenyan shillings. 6000 5500 5000 4500 4000 3500 Kenyan 3000 shilling 2500 2000 1500 1000 500 0 0 5 10 15 20 25 30 35 40 45 50 Dollar ($) (a) Use the graph to change 5000 shillings to dollars. $ .................................................... [1] (b) Explain how to use this graph to change $420 to shillings. ............................................................................................................................................................ ............................................................................................................................................................ [1] (c) The exchange rate is now $1 = 90 shillings. On the grid, draw another line to show this exchange rate. [2]
Mark scheme: 21(a) 46 1 21(b) appropriate explanation 1 accept any correct explanation e.g. reading at 42 × 10 oe 21(c) correct ruled line 2 B1 for any correct plotted point other than (0, 0)
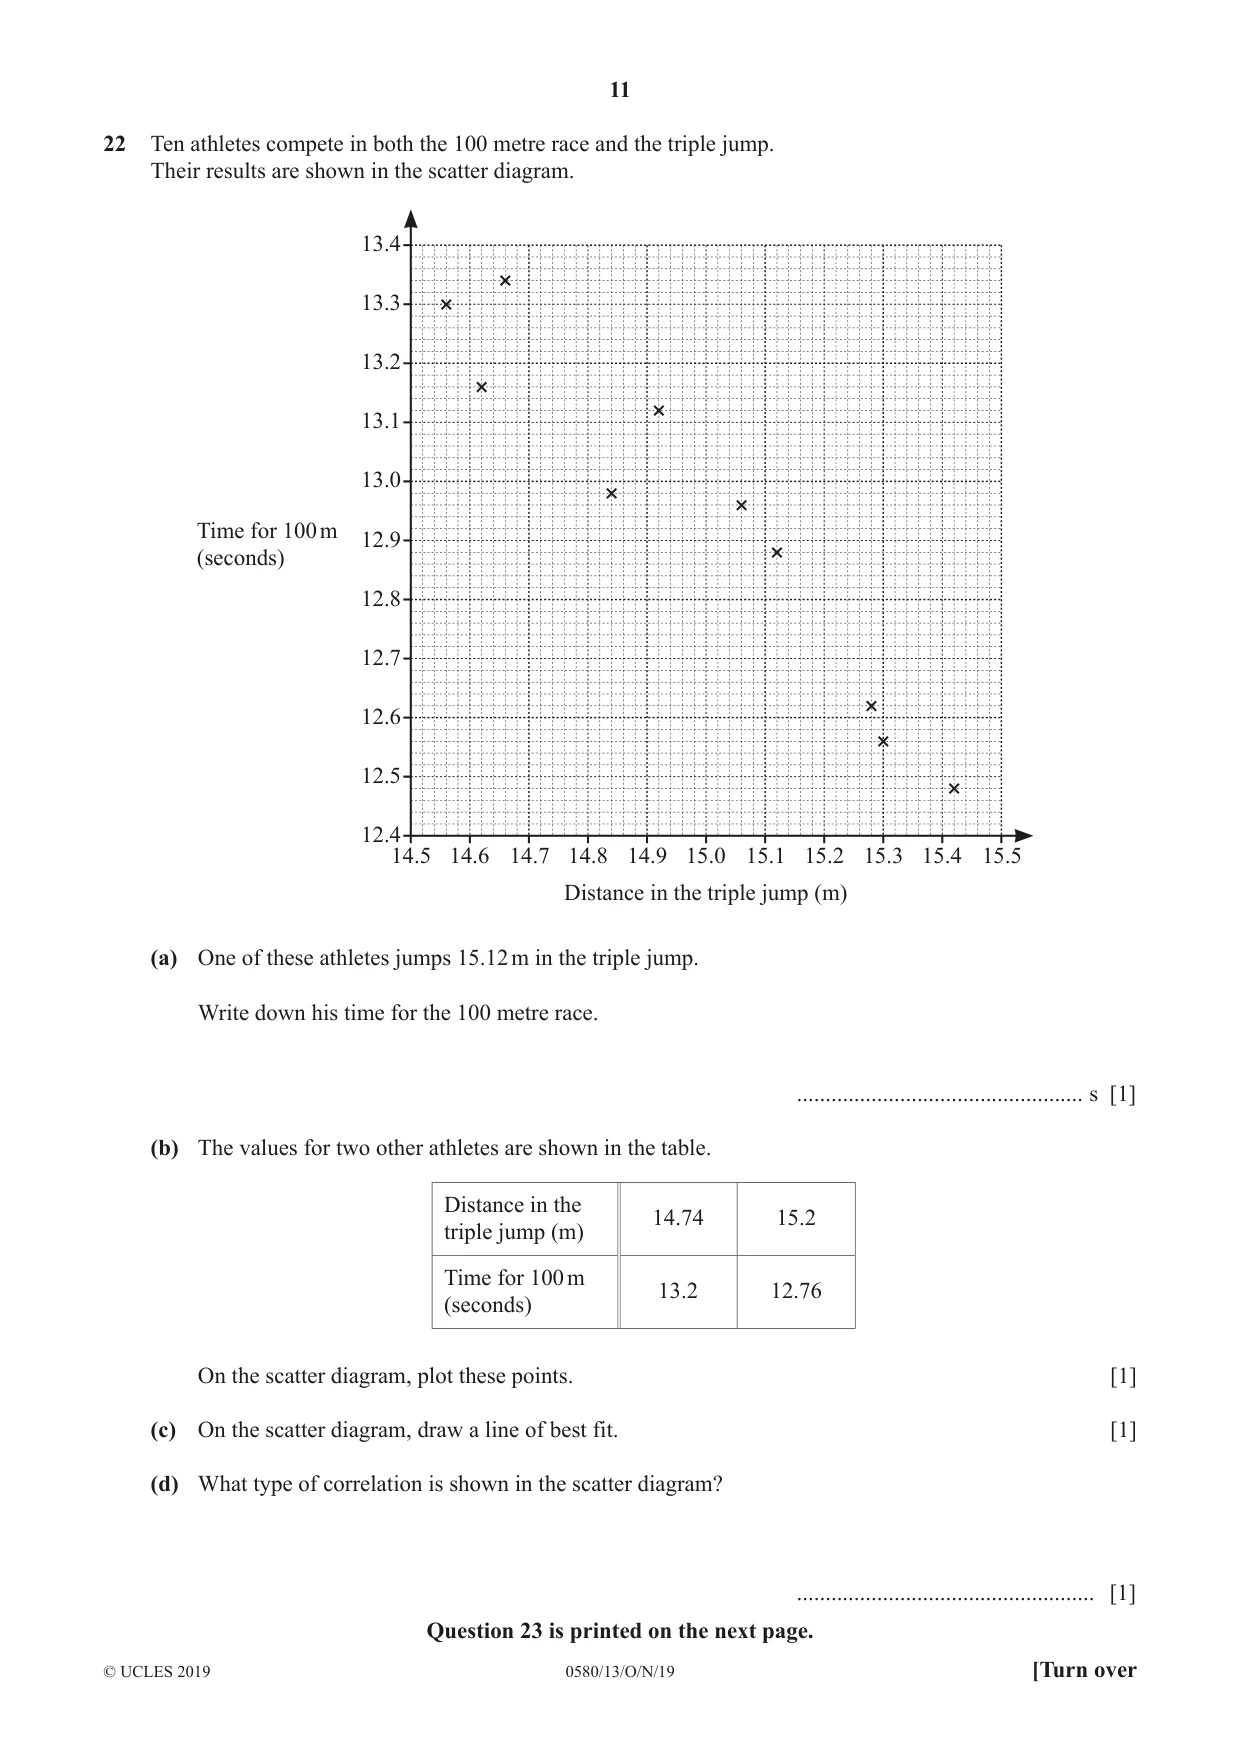
Q22 · Ten athletes compete in both the 100 metre race and the triple jump
22 Ten athletes compete in both the 100 metre race and the triple jump. Their results are shown in the scatter diagram. 13.4 13.3 13.2 13.1 13.0 Time for 100 m 12.9 (seconds) 12.8 12.7 12.6 12.5 12.4 14.5 14.6 14.7 14.8 14.9 15.0 15.1 15.2 15.3 15.4 15.5 Distance in the triple jump (m) (a) One of these athletes jumps 15.12 m in the triple jump. Write down his time for the 100 metre race. .................................................. s [1] (b) The values for two other athletes are shown in the table. Distance in the 14.74 15.2 triple jump (m) Time for 100 m 13.2 12.76 (seconds) On the scatter diagram, plot these points. [1] (c) On the scatter diagram, draw a line of best fit. [1] (d) What type of correlation is shown in the scatter diagram? .................................................... [1] Question 23 is printed on the next page.
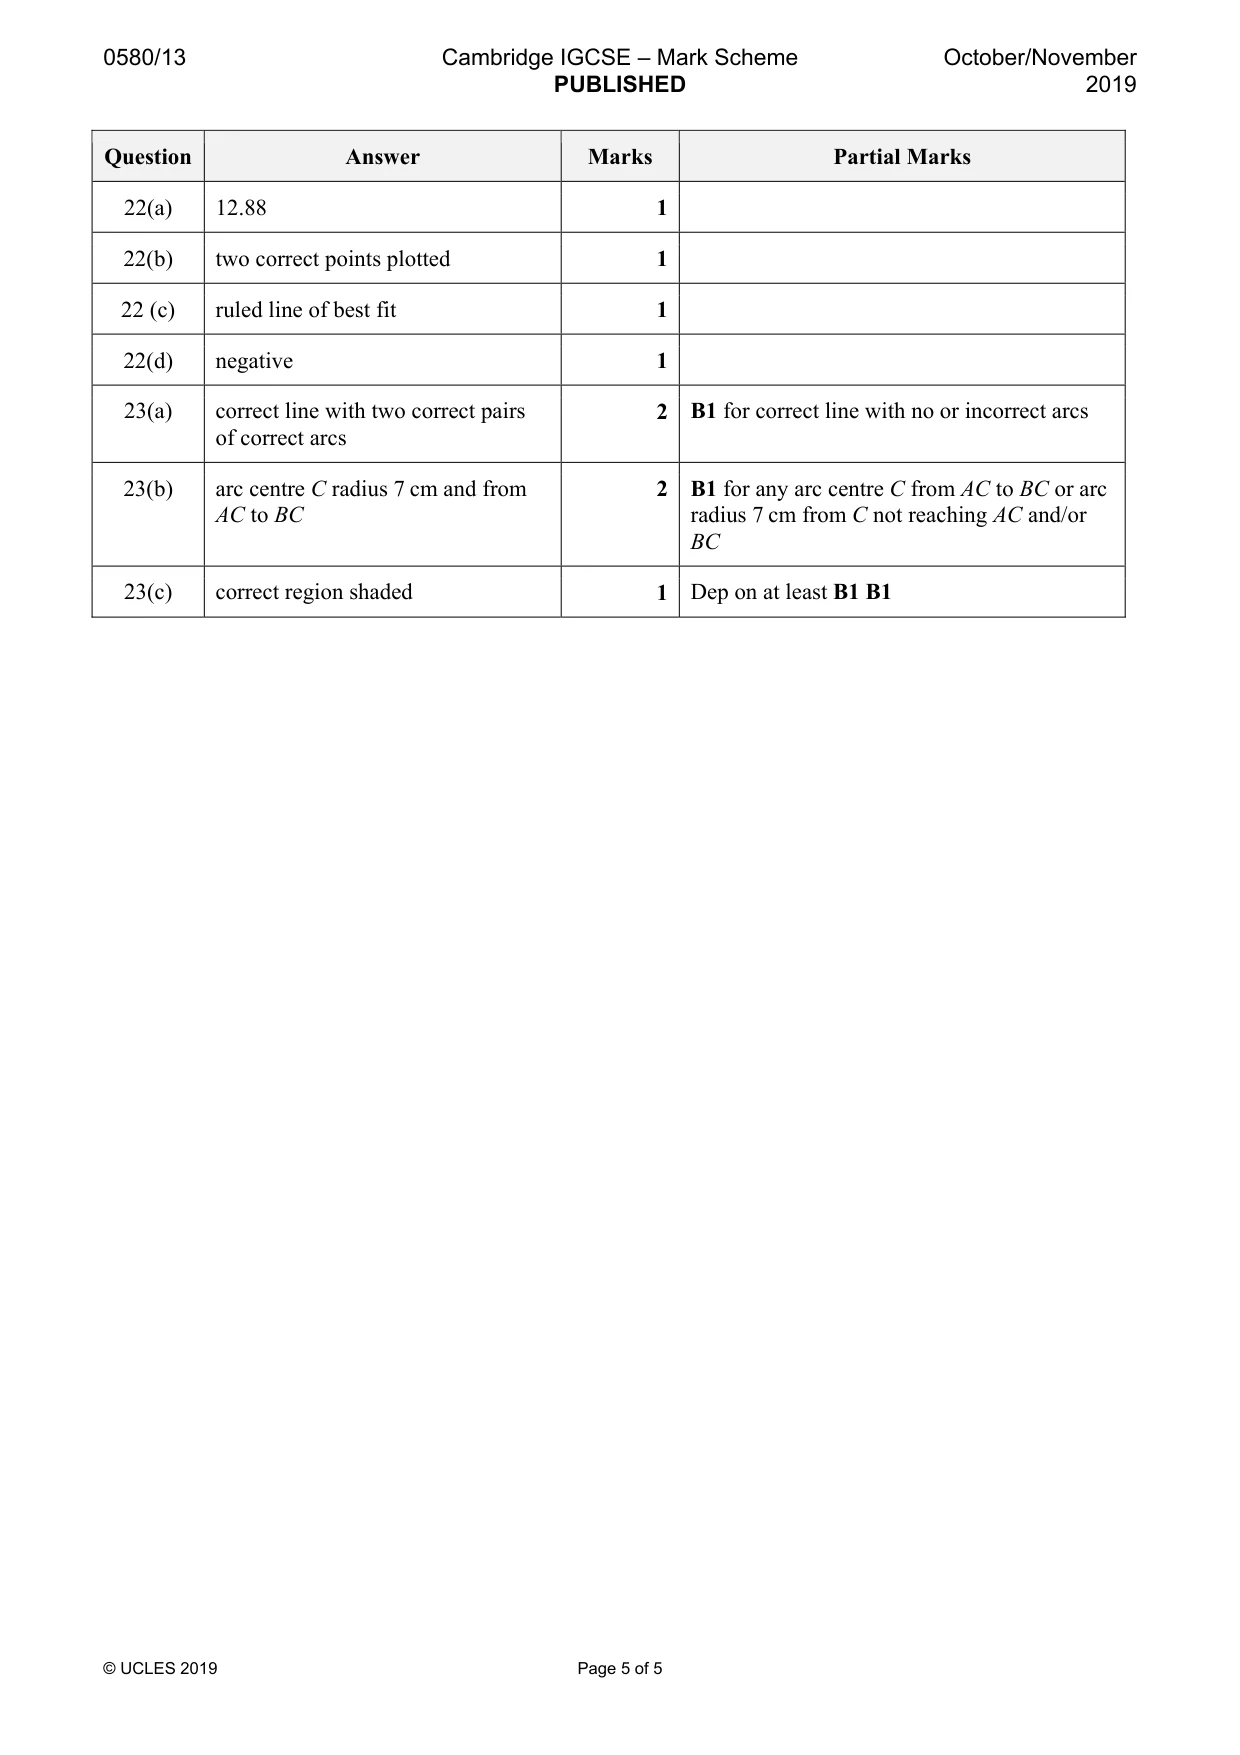
Mark scheme: 22(a) 12.88 1 22(b) two correct points plotted 1 22 (c) ruled line of best fit 1 22(d) negative 1
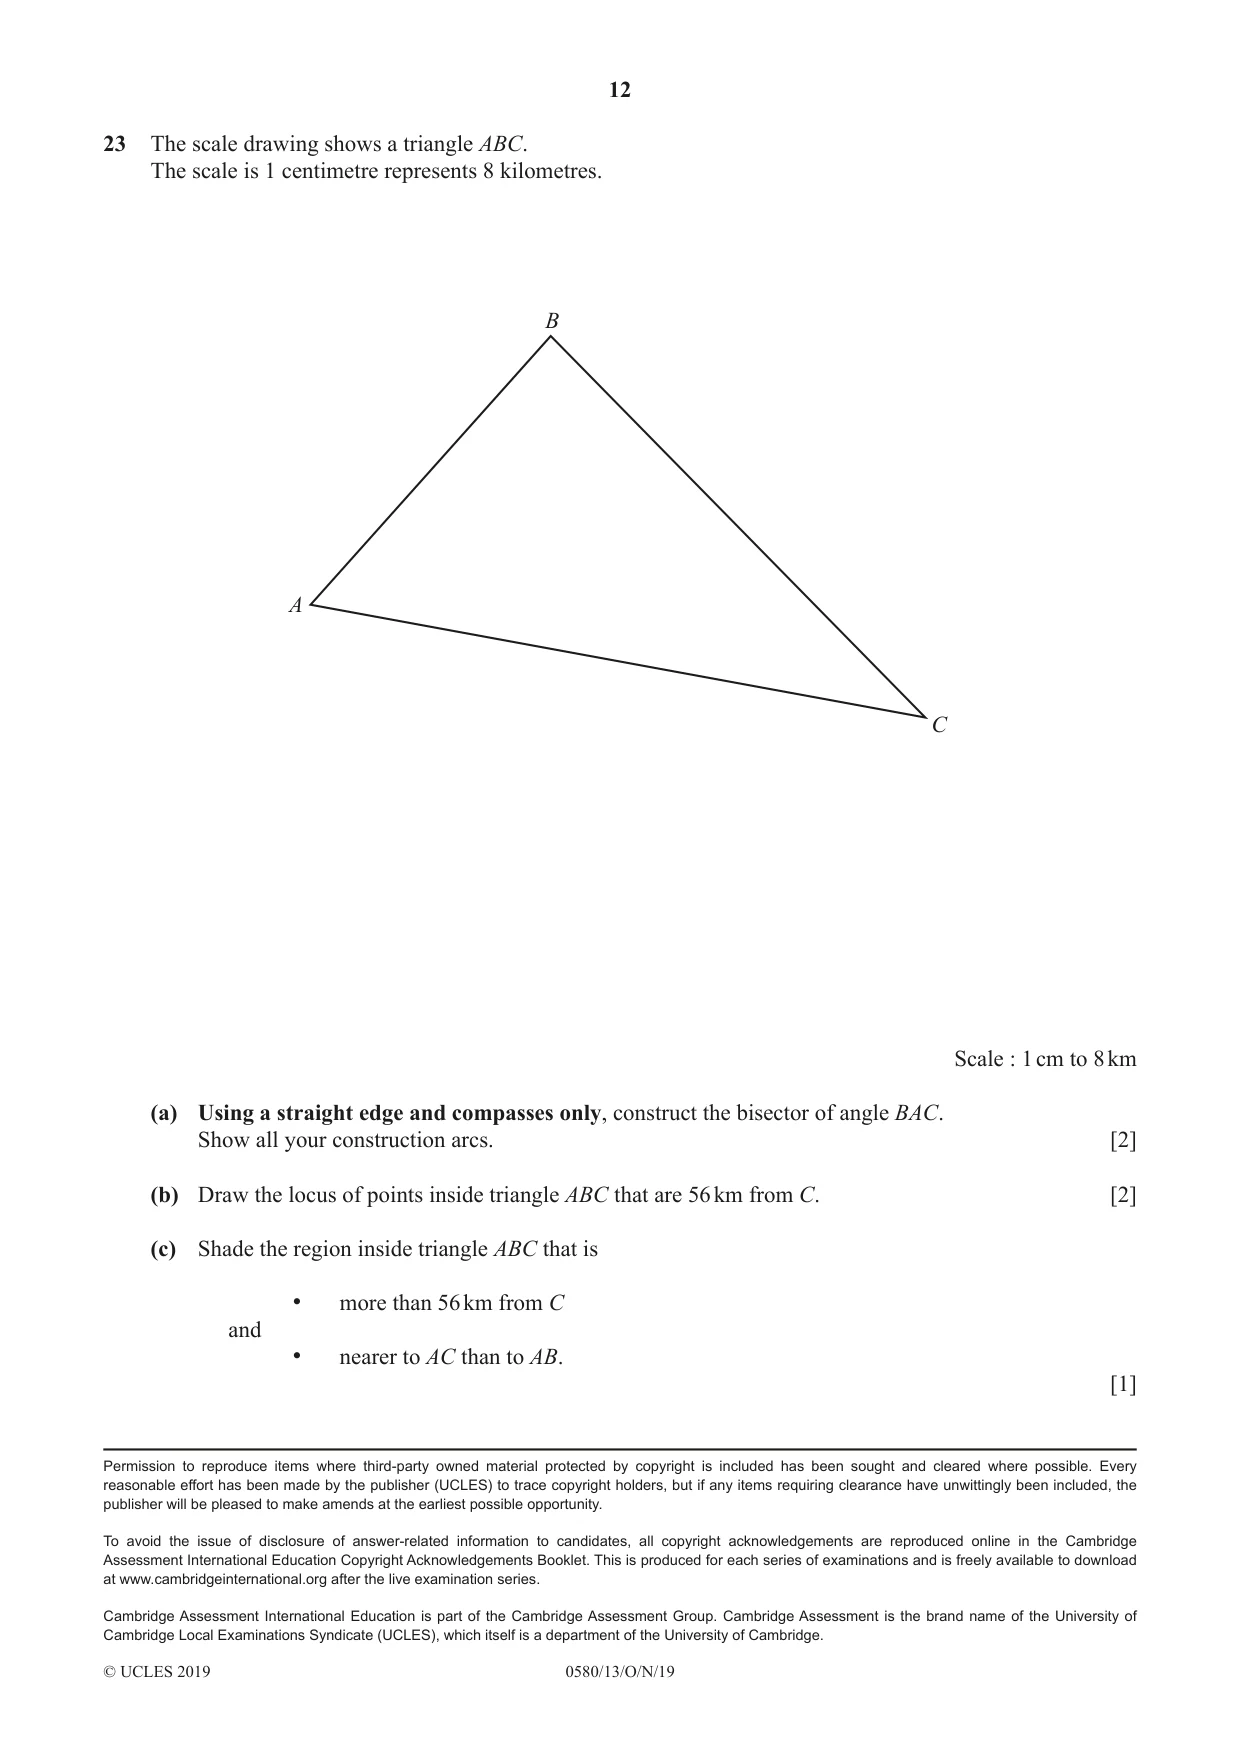
Q23 · The scale drawing shows a triangle ABC
23 The scale drawing shows a triangle ABC. The scale is 1 centimetre represents 8 kilometres. B A C Scale : 1 cm to 8 km (a) Using a straight edge and compasses only, construct the bisector of angle BAC. Show all your construction arcs. [2] (b) Draw the locus of points inside triangle ABC that are 56 km from C. [2] (c) Shade the region inside triangle ABC that is • more than 56 km from C and • nearer to AC than to AB. [1]
Mark scheme: 23(a) correct line with two correct pairs 2 B1 for correct line with no or incorrect arcs of correct arcs 23(b) arc centre C radius 7 cm and from 2 B1 for any arc centre C from AC to BC or arc AC to BC radius 7 cm from C not reaching AC and/or BC 23(c) correct region shaded 1 Dep on at least B1 B1
What was in this paper
The subtopics covered by these 23 questions, and how many questions each got. Open one in a new tab to see every Cambridge question on it.
2Ratio and proportion2The four operations2Types of number2Angles1Area and perimeter1Averages and range1Circles, arcs and sectors1Classifying statistical data1Coordinates1Geometrical constructions1Indices I1Introduction to probability1Percentages1Pythagoras’ theorem1Scatter diagrams1Standard form1Units of measure1Vectors in two dimensions1What you needed in this session
Cambridge’s own grade thresholds for 2019 Oct/Nov, Paper 1 · Variant 3. A higher threshold means an easier paper — the bar moves with how the cohort did.