Cambridge IGCSE Mathematics 0580 — 2019 Oct/Nov Paper 1 · Variant 2
0580/12/O/N/19 · 23 questions · 56 marks · ≈63 min
The question paper and its mark scheme, free to read here and free to download. This is Cambridge’s own paper, exactly as it was sat.
Question paper12 pages
Mark scheme5 pages
Answers below. Sit the paper first if you are practising.
Questions as text
Q1 · Simplify 5t + 4t - 2t
1 Simplify 5t + 4t - 2t . .................................................... [1]
Mark scheme: Question Answer Marks Partial Marks 1 7t 1
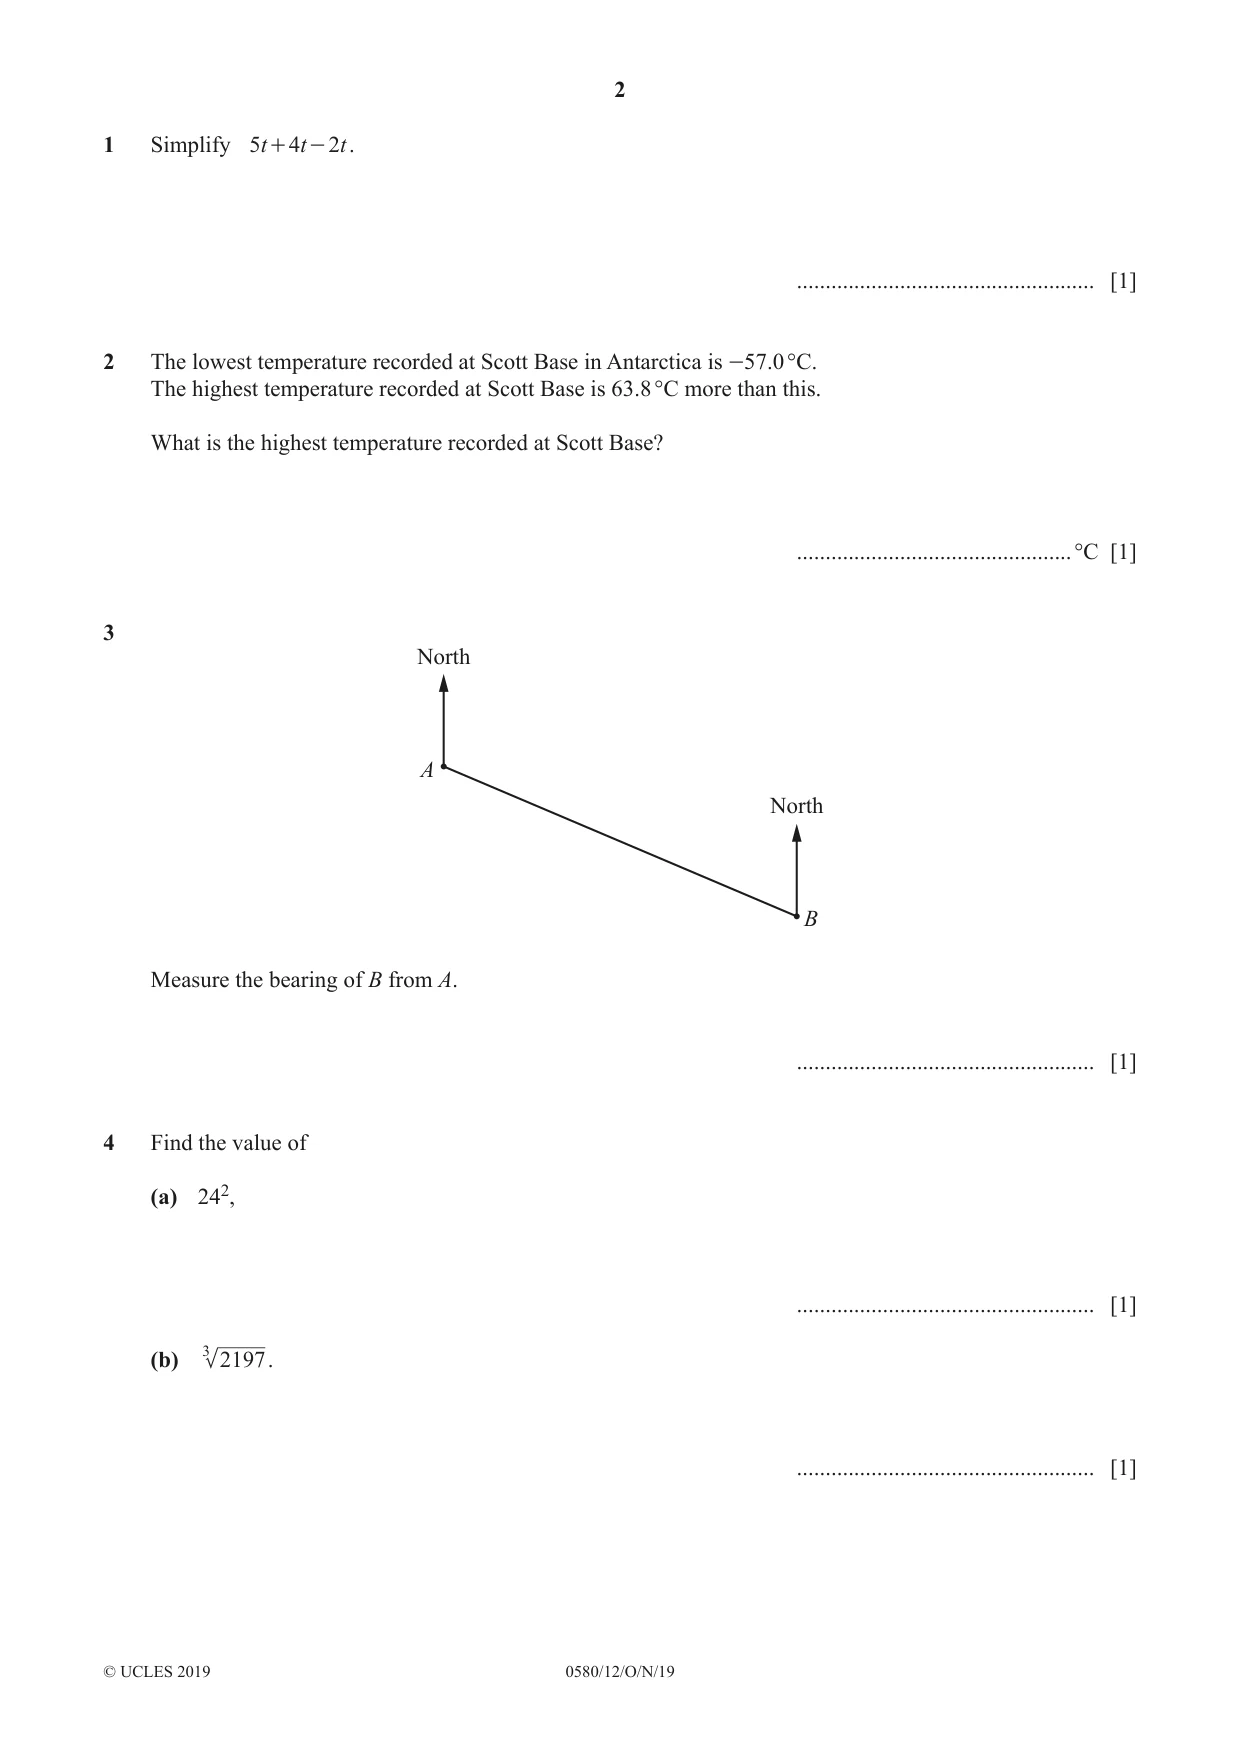
Q2 · The lowest temperature recorded at Scott Base in Antarctica is -57.0 °C
2 The lowest temperature recorded at Scott Base in Antarctica is -57.0 °C. The highest temperature recorded at Scott Base is 63.8 °C more than this. What is the highest temperature recorded at Scott Base? ................................................°C [1]
Mark scheme: 2 6.8 1
Q3 · North A North B Measure the bearing of B from A
3 North A North B Measure the bearing of B from A. .................................................... [1]
Mark scheme: 3 113° 1
Q4 · Find the value of (a) 242, ...................................................
4 Find the value of (a) 242, .................................................... [1] (b) 3 2197 . .................................................... [1]
Mark scheme: 4(a) 576 1 4(b) 13 1
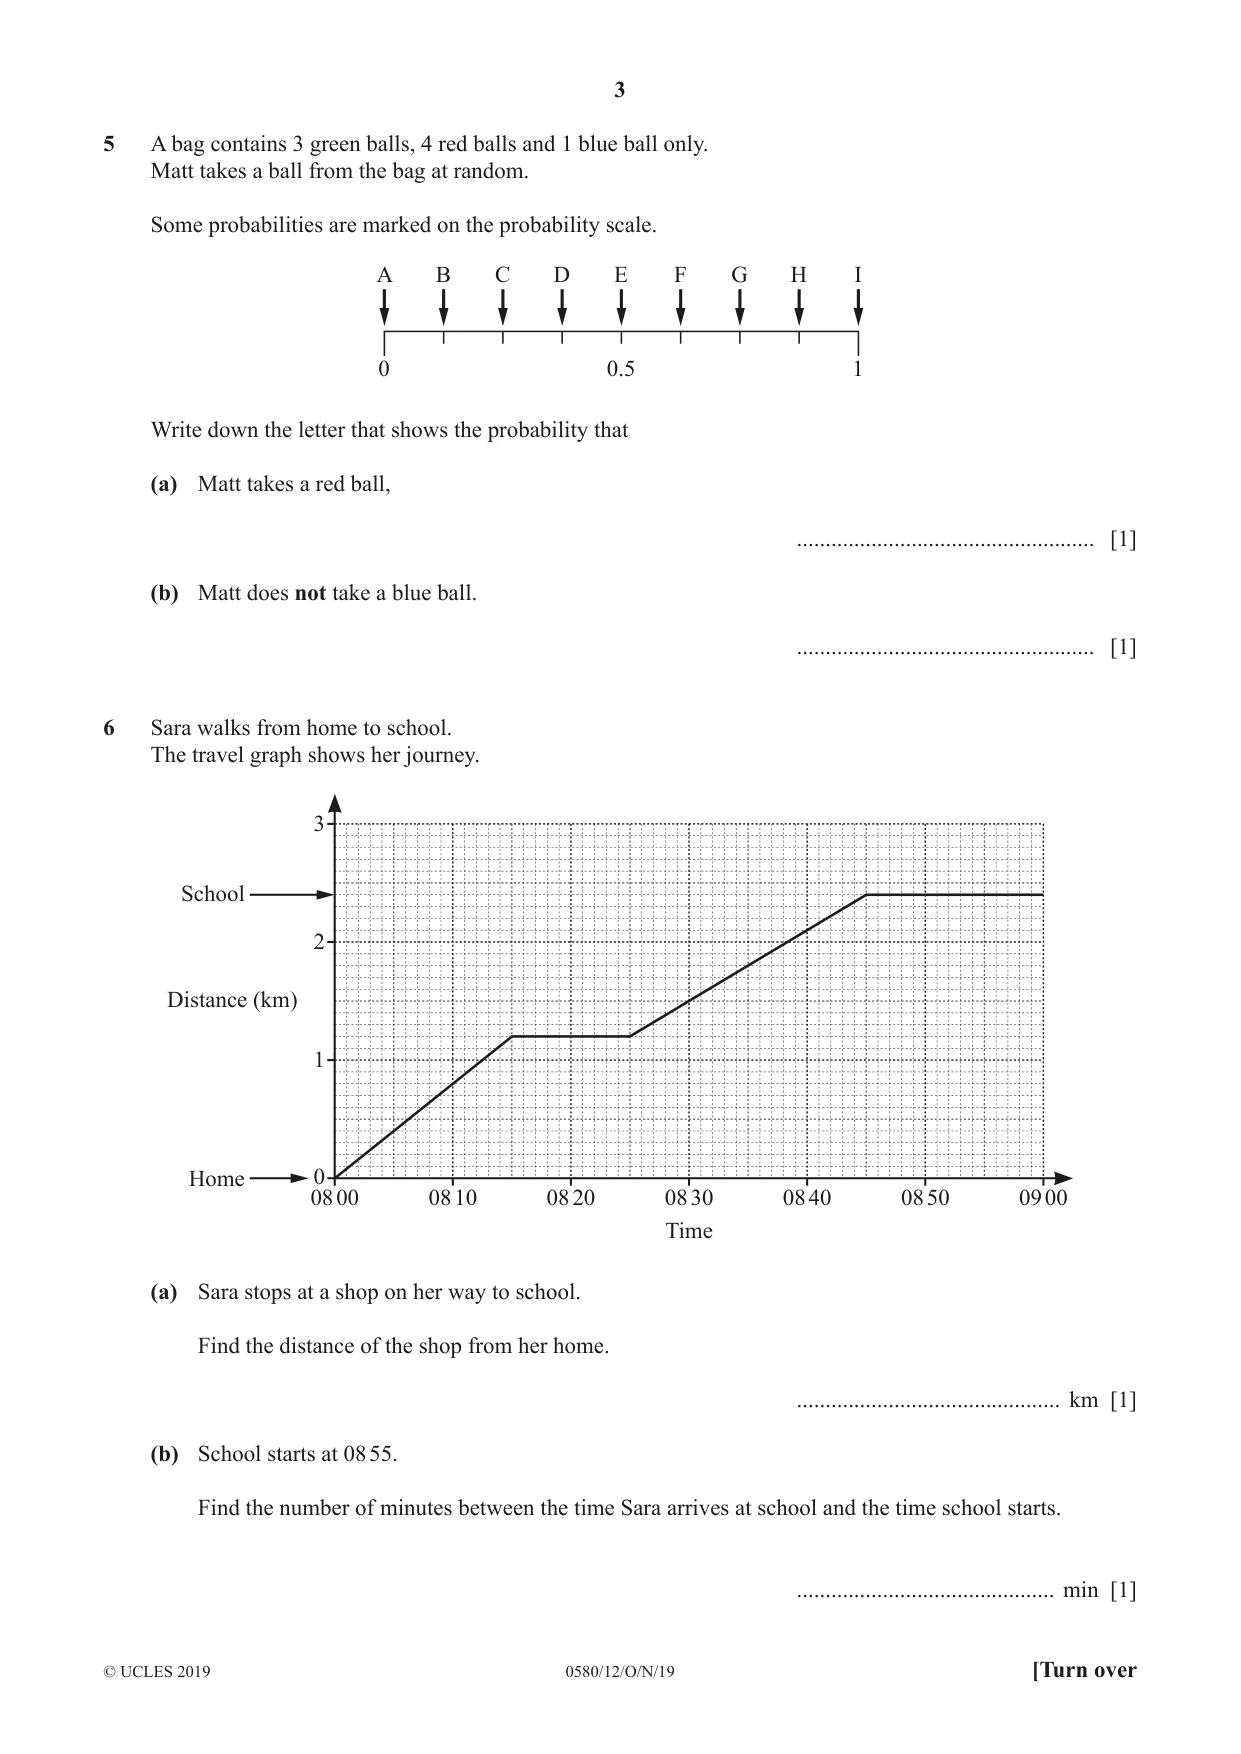
Q5 · A bag contains 3 green balls, 4 red balls and 1 blue ball only
5 A bag contains 3 green balls, 4 red balls and 1 blue ball only. Matt takes a ball from the bag at random. Some probabilities are marked on the probability scale. A B C D E F G H I 0 0.5 1 Write down the letter that shows the probability that (a) Matt takes a red ball, .................................................... [1] (b) Matt does not take a blue ball. .................................................... [1]
Mark scheme: 5(a) E cao 1 5(b) H cao 1
Q6 · Sara walks from home to school
6 Sara walks from home to school. The travel graph shows her journey. 3 School 2 Distance (km) 1 Home 0 08 00 08 10 08 20 08 30 08 40 08 50 09 00 Time (a) Sara stops at a shop on her way to school. Find the distance of the shop from her home. .............................................. km [1] (b) School starts at 08 55. Find the number of minutes between the time Sara arrives at school and the time school starts. ............................................. min [1]
Mark scheme: 6(a) 1.2 1 6(b) 10 1
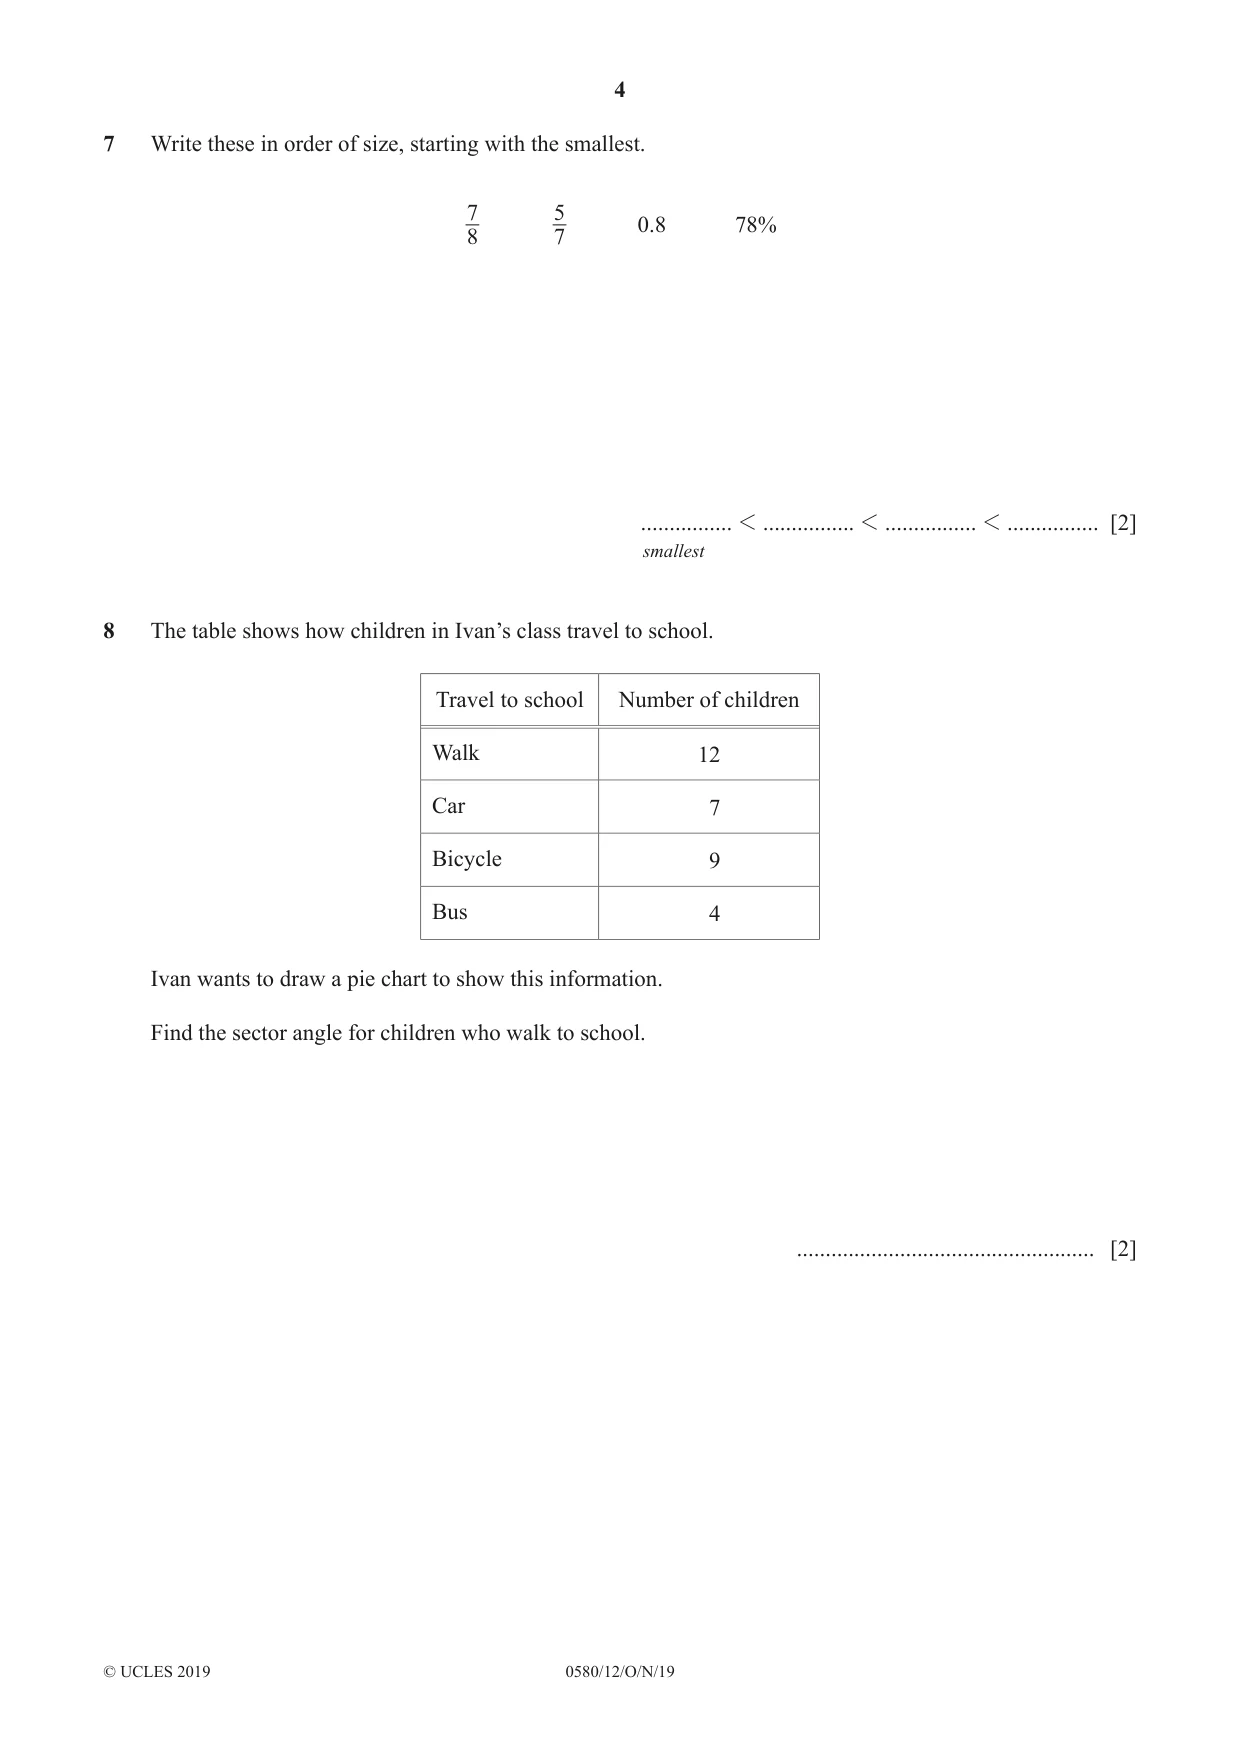
Q7 · Write these in order of size, starting with the smallest
7 Write these in order of size, starting with the smallest. 7 5 0.8 78% 8 7 ................ 1 ................ 1 ................ 1 ................ [2] smallest
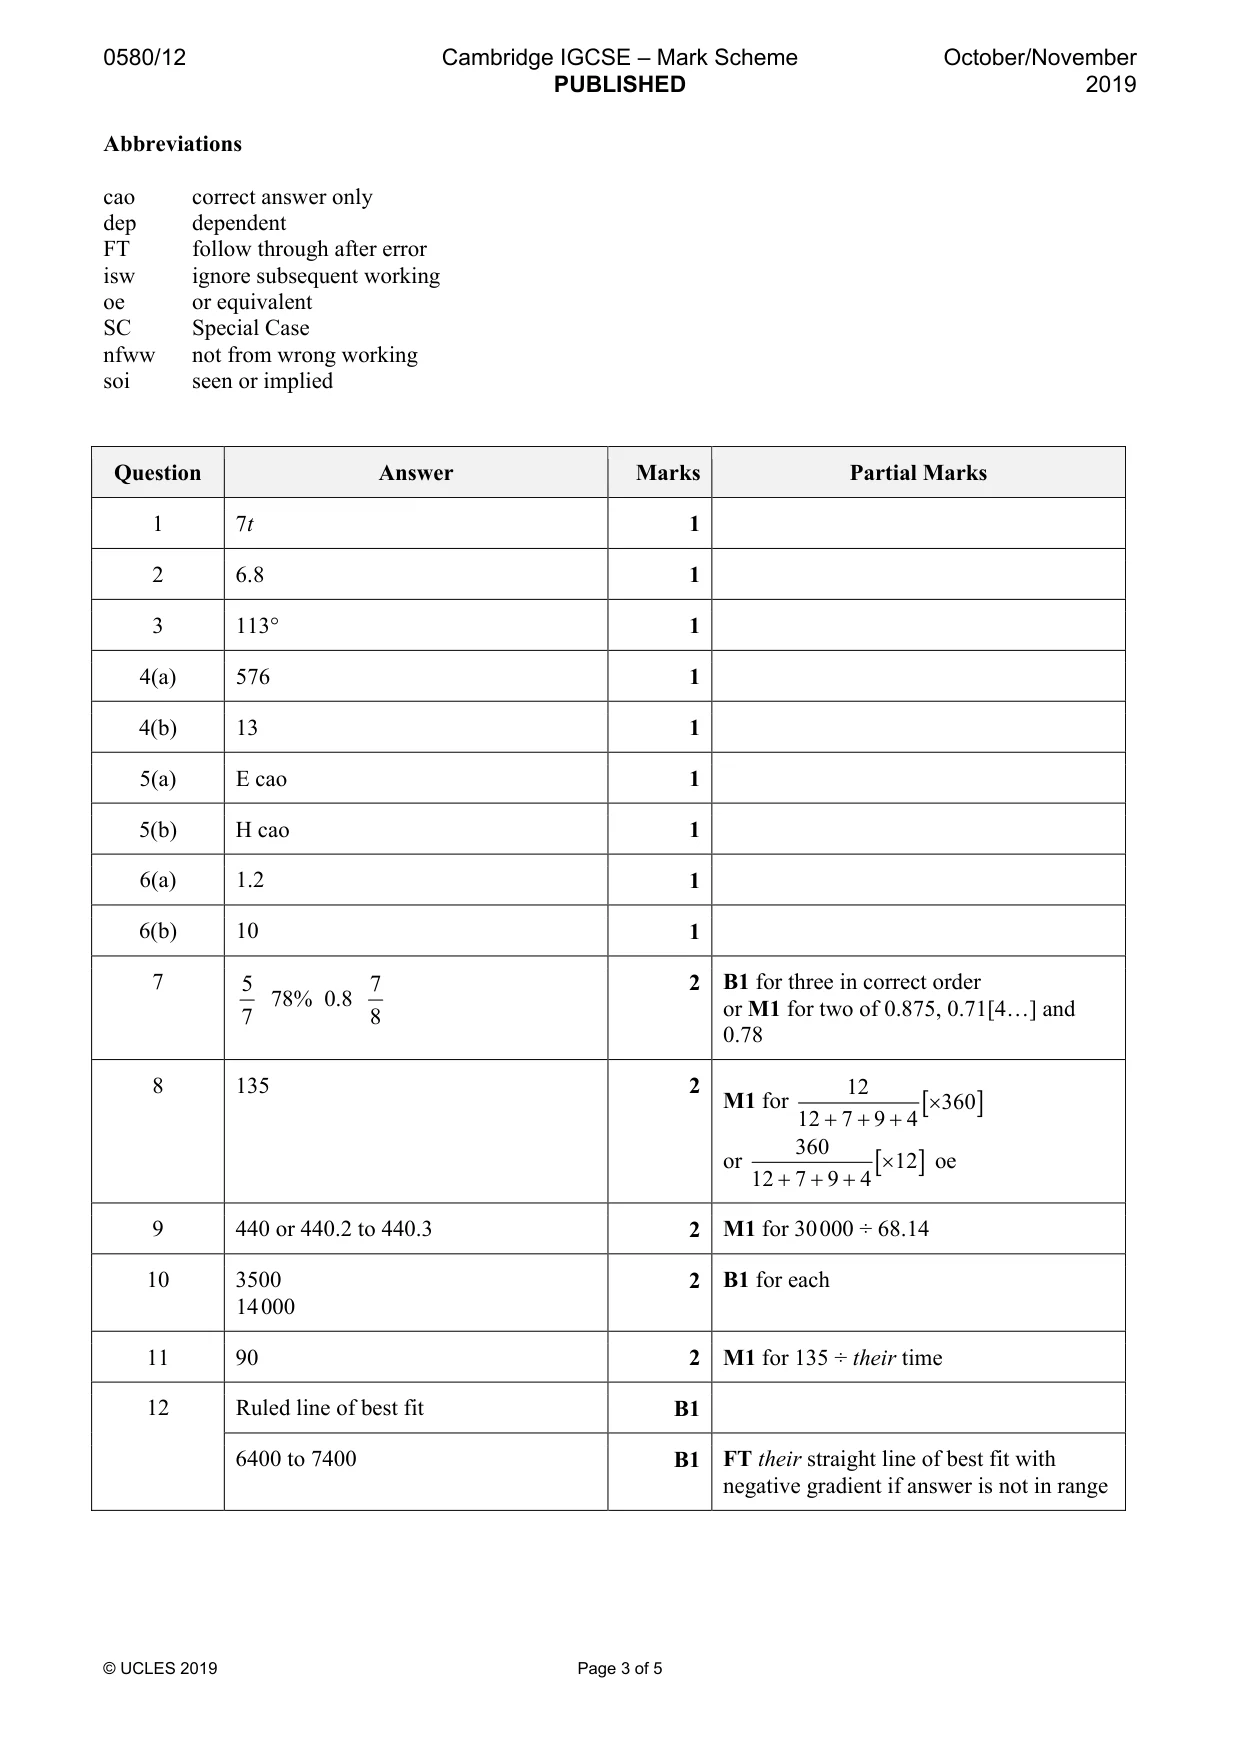
Mark scheme: 7 5 7 2 B1 for three in correct order 78% 0.8 or M1 for two of 0.875, 0.71[4…] and 7 8 0.78
Q8 · The table shows how children in Ivan’s class travel to school
8 The table shows how children in Ivan’s class travel to school. Travel to school Number of children Walk 12 Car 7 Bicycle 9 Bus 4 Ivan wants to draw a pie chart to show this information. Find the sector angle for children who walk to school. .................................................... [2]
Mark scheme: 8 135 2 12 M1 for [× 360 ] 12 + 7 + 9 + 4 360 or [× 12 ] oe 12 + 7 + 9 + 4
Q9 · Rashid changes 30 000 rupees to dollars when the exchange rate is $1 = 68.14 rupees
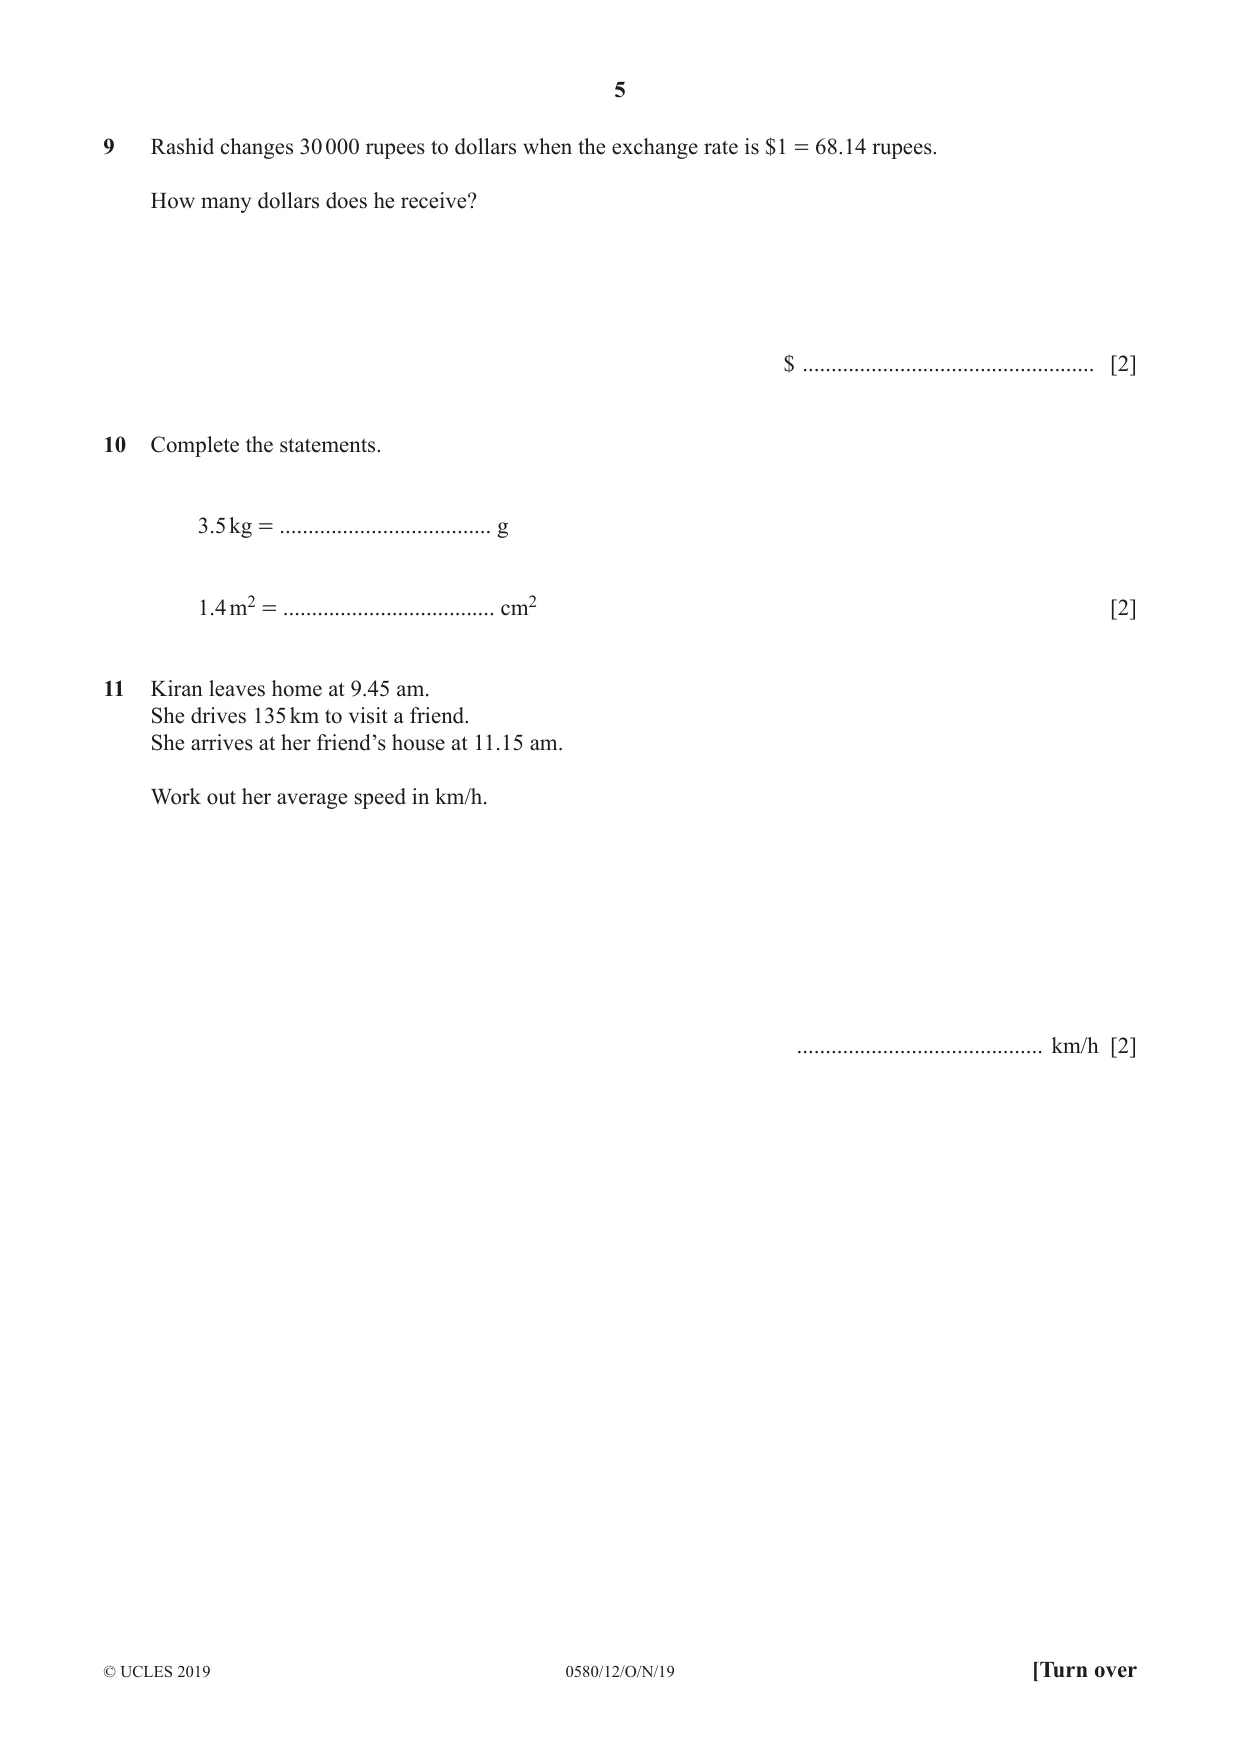
9 Rashid changes 30 000 rupees to dollars when the exchange rate is $1 = 68.14 rupees. How many dollars does he receive? $ ................................................... [2]
Mark scheme: 9 440 or 440.2 to 440.3 2 M1 for 30 000 ÷ 68.14
Question 10
10 Complete the statements. 3.5 kg = ..................................... g 1.4 m2 = ..................................... cm2 [2]
Mark scheme: 10 3500 2 B1 for each 14 000
Q11 · Kiran leaves home at 9.45 am
11 Kiran leaves home at 9.45 am. She drives 135 km to visit a friend. She arrives at her friend’s house at 11.15 am. Work out her average speed in km/h. ........................................... km/h [2]
Mark scheme: 11 90 2 M1 for 135 ÷ their time
Q12 · The scatter diagram shows the age and value of each of ten cars, all of the same model
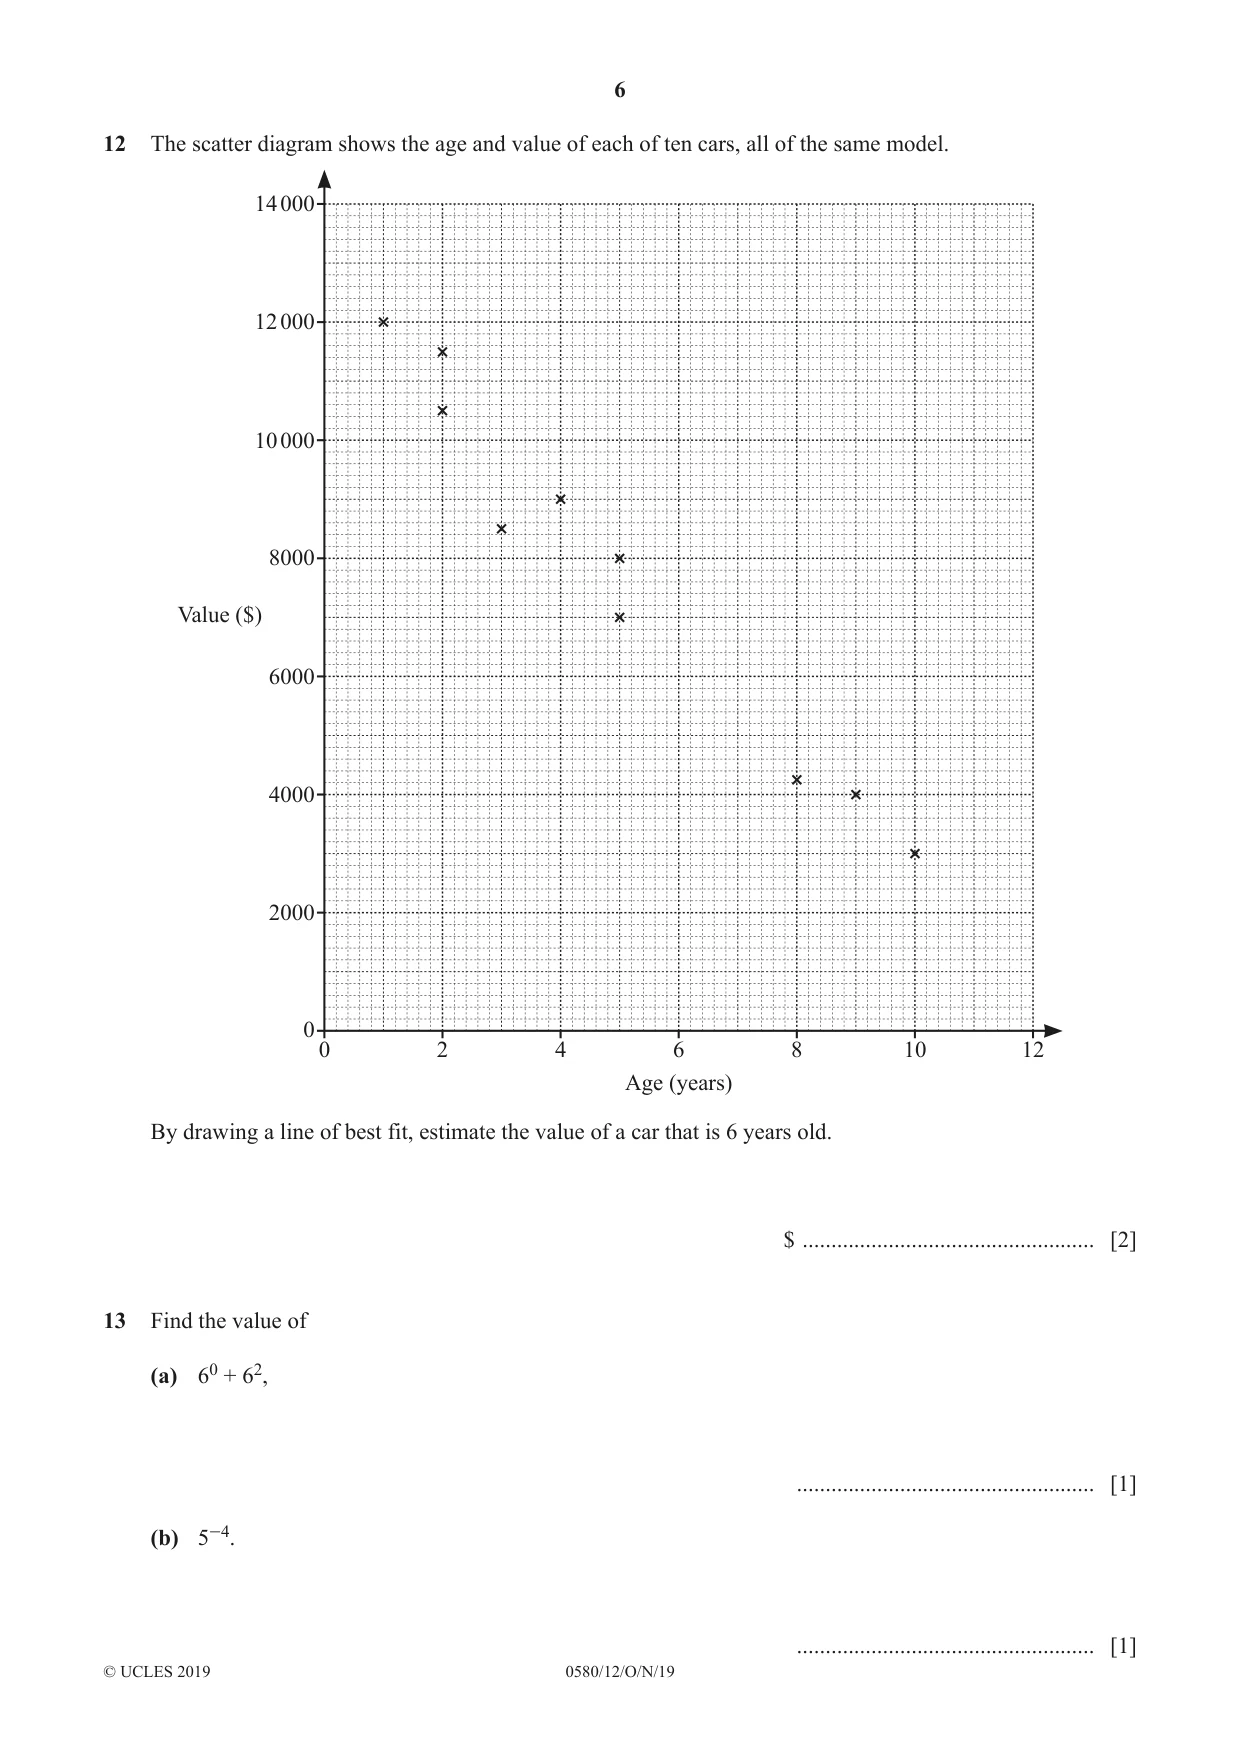
12 The scatter diagram shows the age and value of each of ten cars, all of the same model. 14 000 12 000 10 000 8000 Value ($) 6000 4000 2000 0 0 2 4 6 8 10 12 Age (years) By drawing a line of best fit, estimate the value of a car that is 6 years old. $ ................................................... [2]
Mark scheme: 12 Ruled line of best fit B1 6400 to 7400 B1 FT their straight line of best fit with negative gradient if answer is not in range
Q13 · Find the value of (a) 60 + 62, ...................................................
13 Find the value of (a) 60 + 62, .................................................... [1] (b) 5-4. .................................................... [1]
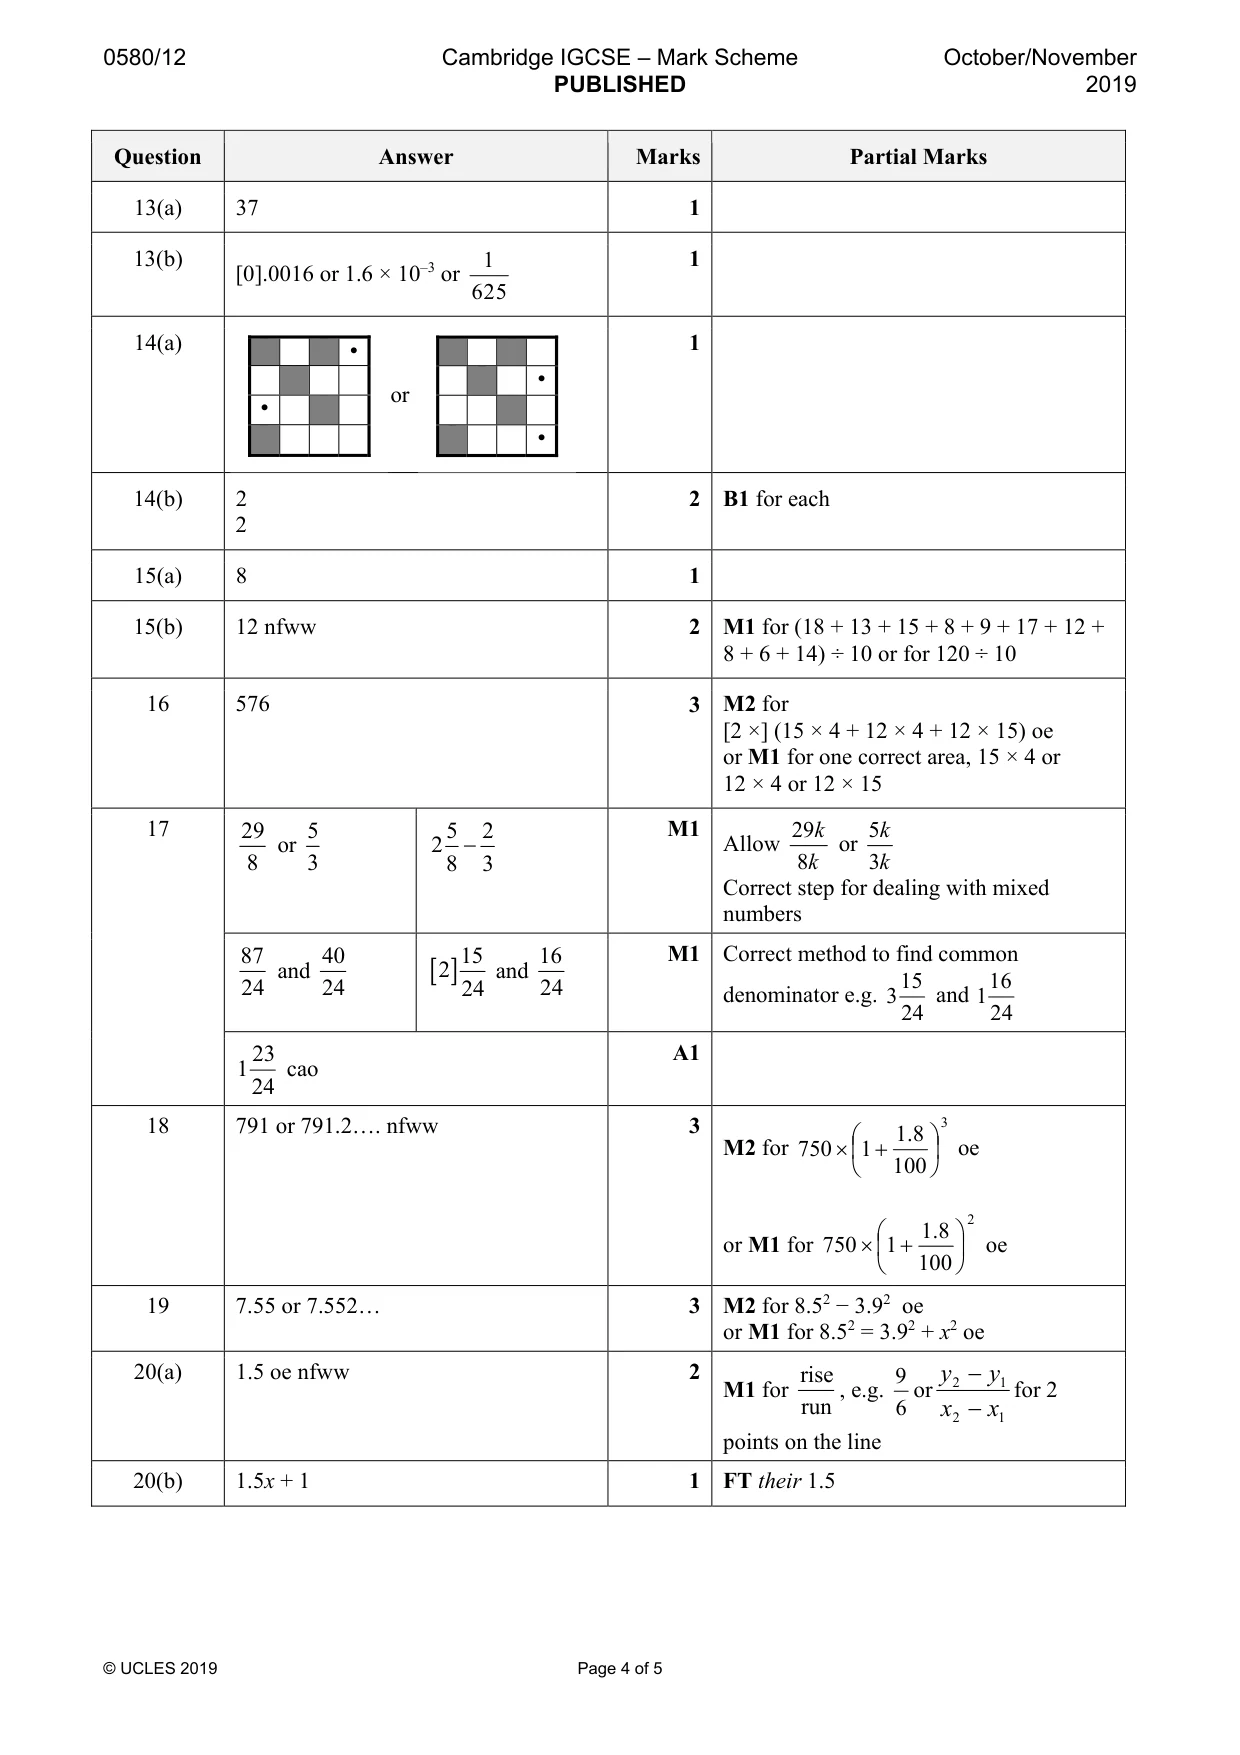
Mark scheme: 13(a) 37 1 13(b) 1 1 [0].0016 or 1.6 × 10⁻³ or 625
Q14 · Shade two more small squares to give a pattern with exactly one line of symmetry
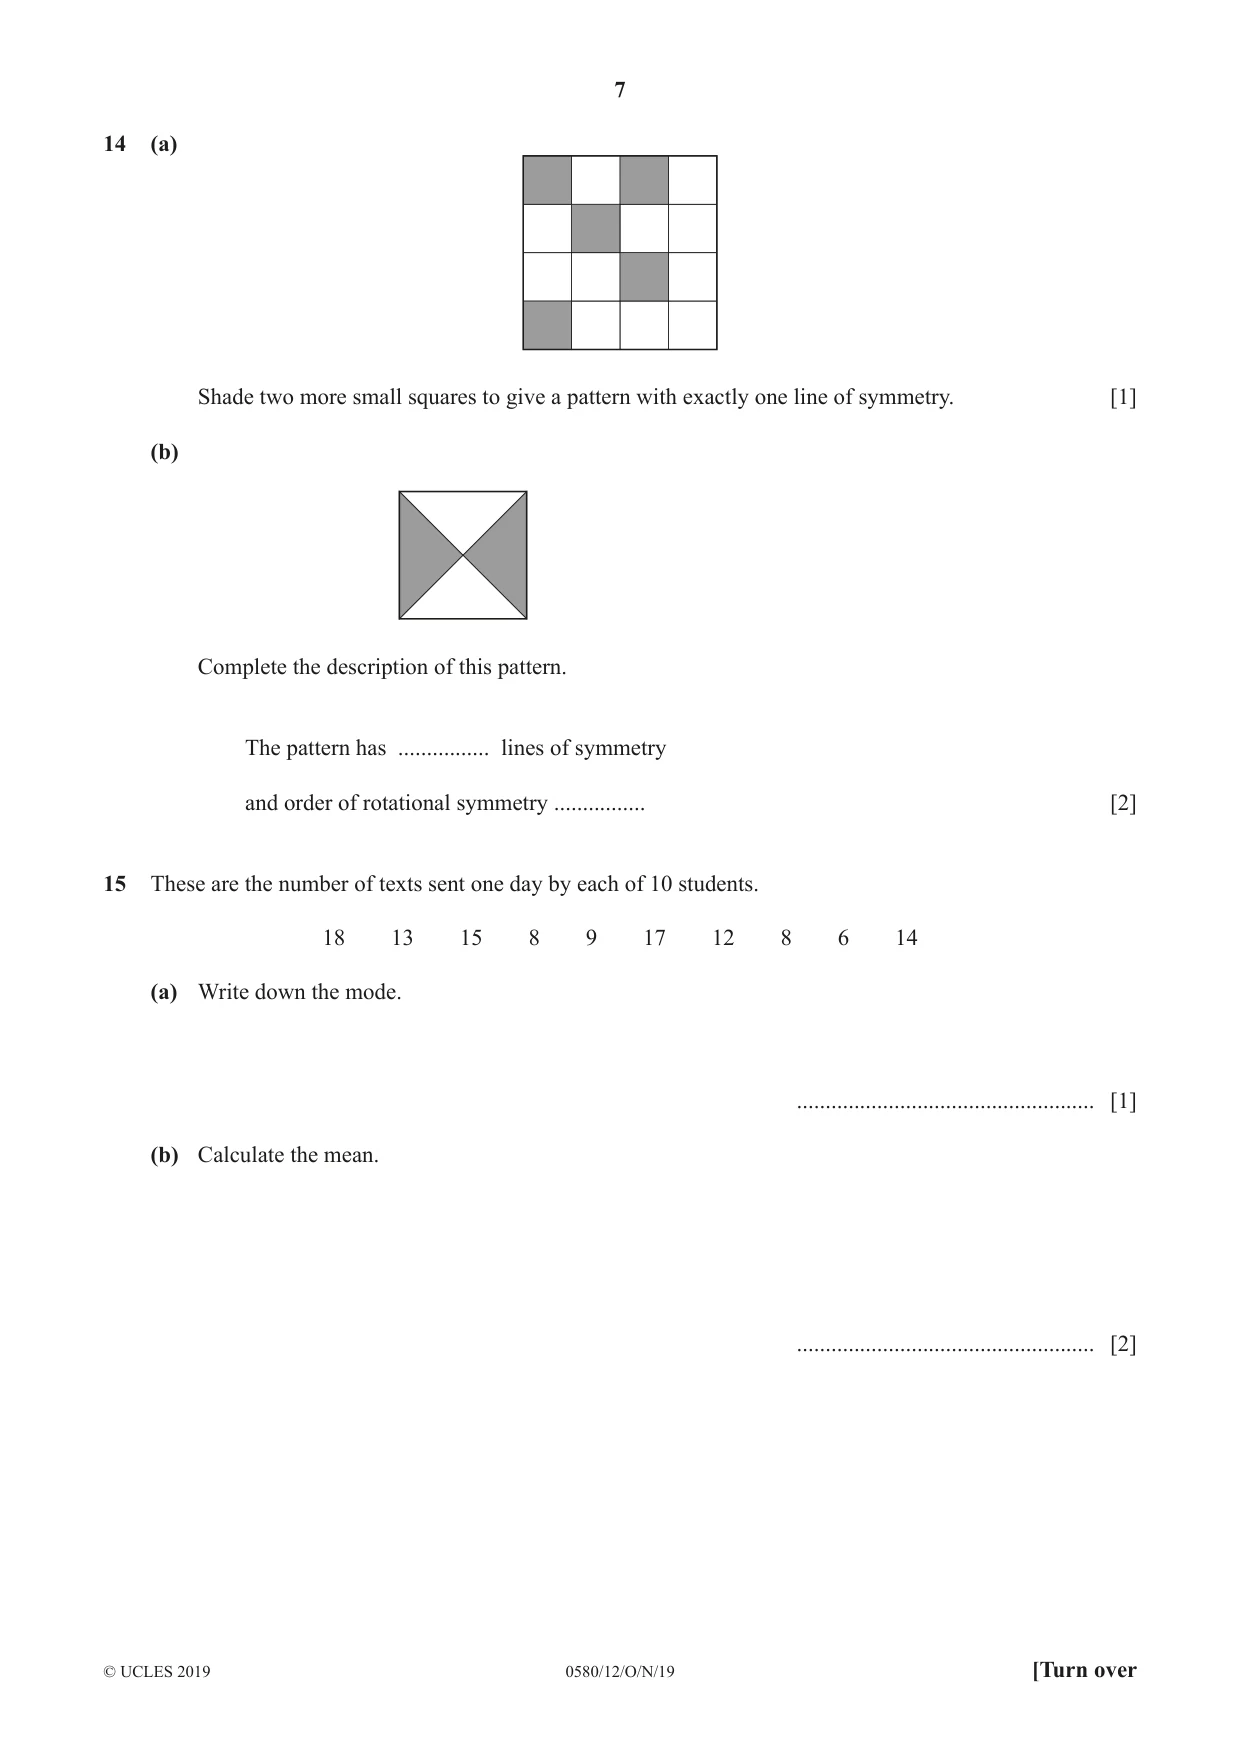
14 (a) Shade two more small squares to give a pattern with exactly one line of symmetry. [1] (b) Complete the description of this pattern. The pattern has ................ lines of symmetry and order of rotational symmetry ................ [2]
Mark scheme: 14(a) • 1 • or • • 14(b) 2 2 B1 for each 2
Q15 · These are the number of texts sent one day by each of 10 students
15 These are the number of texts sent one day by each of 10 students. 18 13 15 8 9 17 12 8 6 14 (a) Write down the mode. .................................................... [1] (b) Calculate the mean. .................................................... [2]
Mark scheme: 15(a) 8 1 15(b) 12 nfww 2 M1 for (18 + 13 + 15 + 8 + 9 + 17 + 12 + 8 + 6 + 14) ÷ 10 or for 120 ÷ 10
Q16 · NOT TO SCALE 4 cm 12 cm 15 cm The diagram shows a cuboid measuring 15 cm by 12 cm by 4 cm
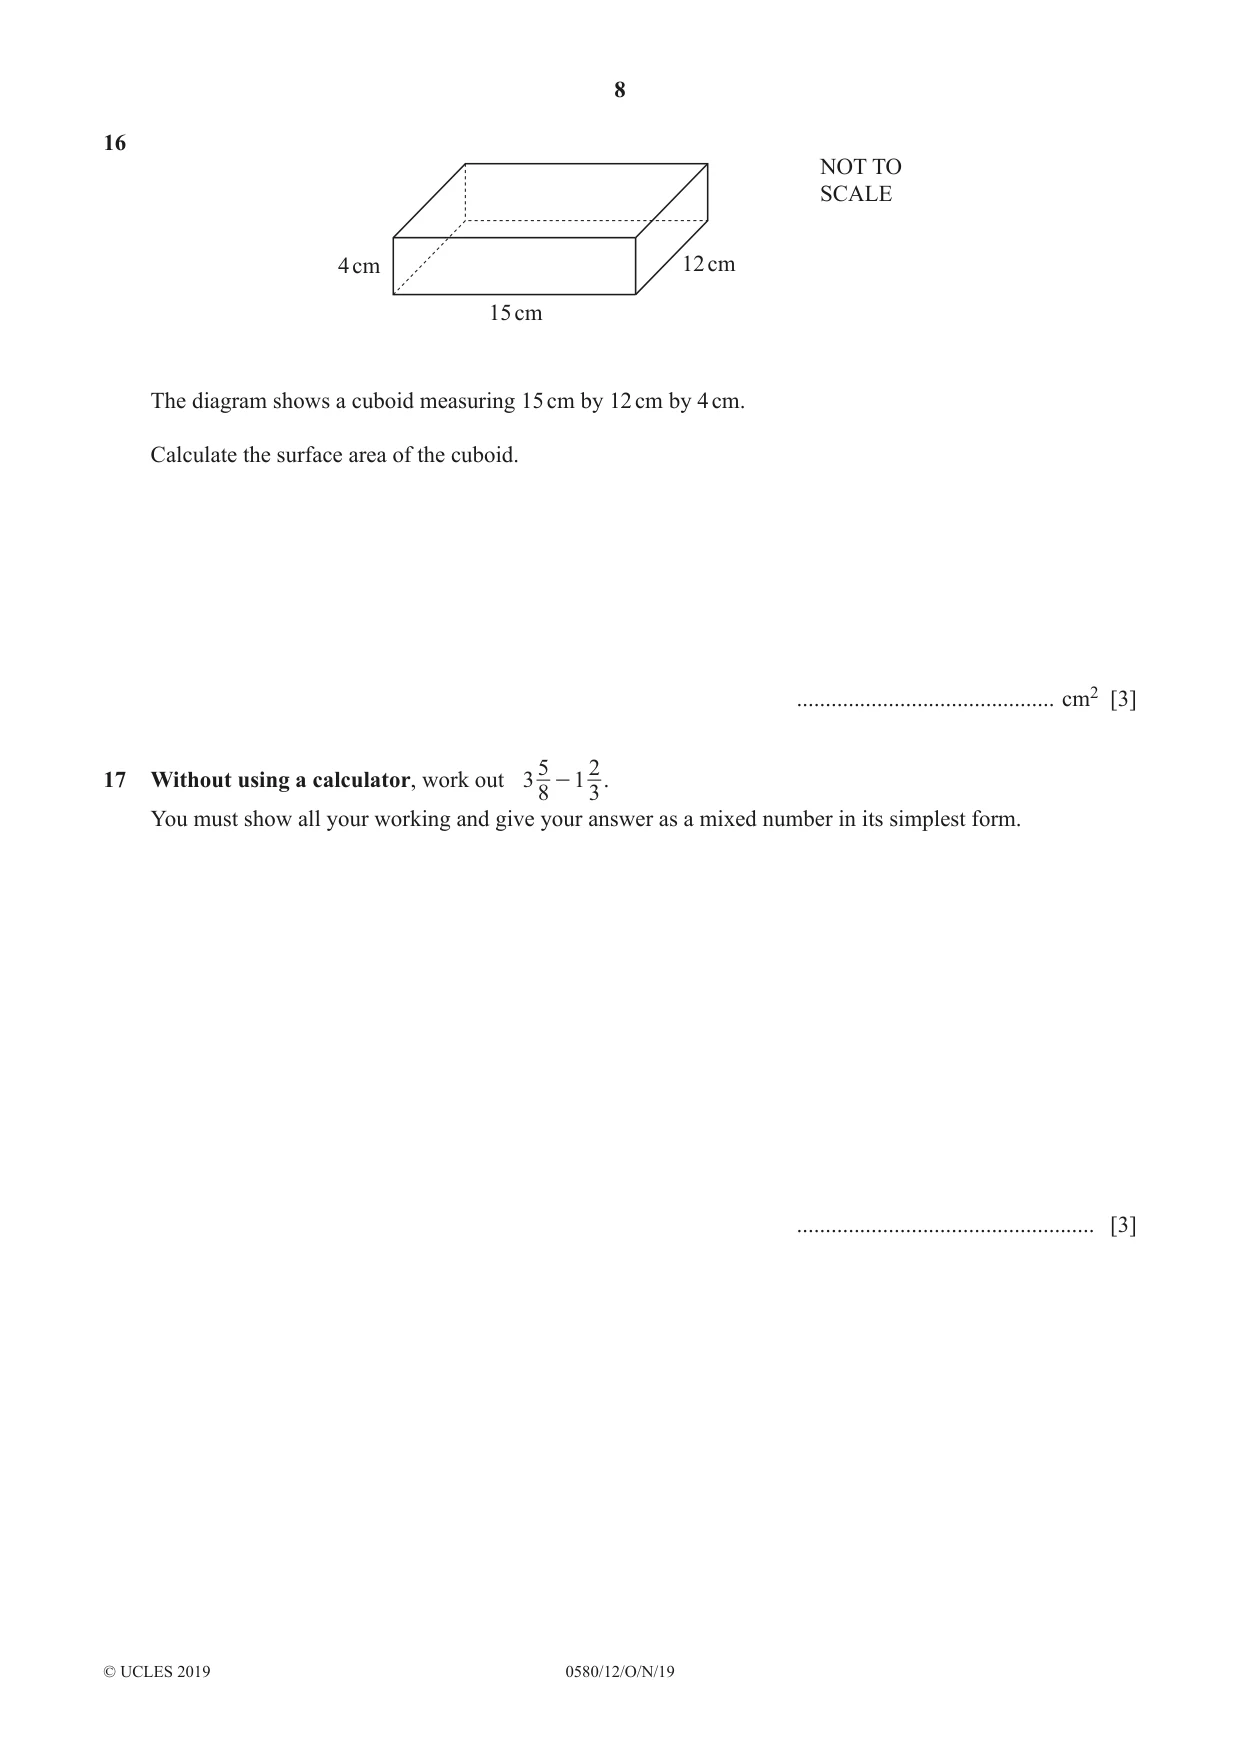
16 NOT TO SCALE 4 cm 12 cm 15 cm The diagram shows a cuboid measuring 15 cm by 12 cm by 4 cm. Calculate the surface area of the cuboid. ............................................. cm2 [3]
Mark scheme: 16 576 3 M2 for [2 ×] (15 × 4 + 12 × 4 + 12 × 15) oe or M1 for one correct area, 15 × 4 or 12 × 4 or 12 × 15
Q17 · 217 Without using a calculator, work out 3 - 1
5 217 Without using a calculator, work out 3 - 1 . 8 3 You must show all your working and give your answer as a mixed number in its simplest form. .................................................... [3]
Mark scheme: 17 29 5 5 2 M1 29 k 5k or − Allow or 8 3 28 3 8k 3k Correct step for dealing with mixed numbers 87 40 16 M1 Correct method to find common and [ 2 ]15 and 15 16 24 24 24 24 denominator e.g. 3 and 24 124 23 A1 1 cao 24
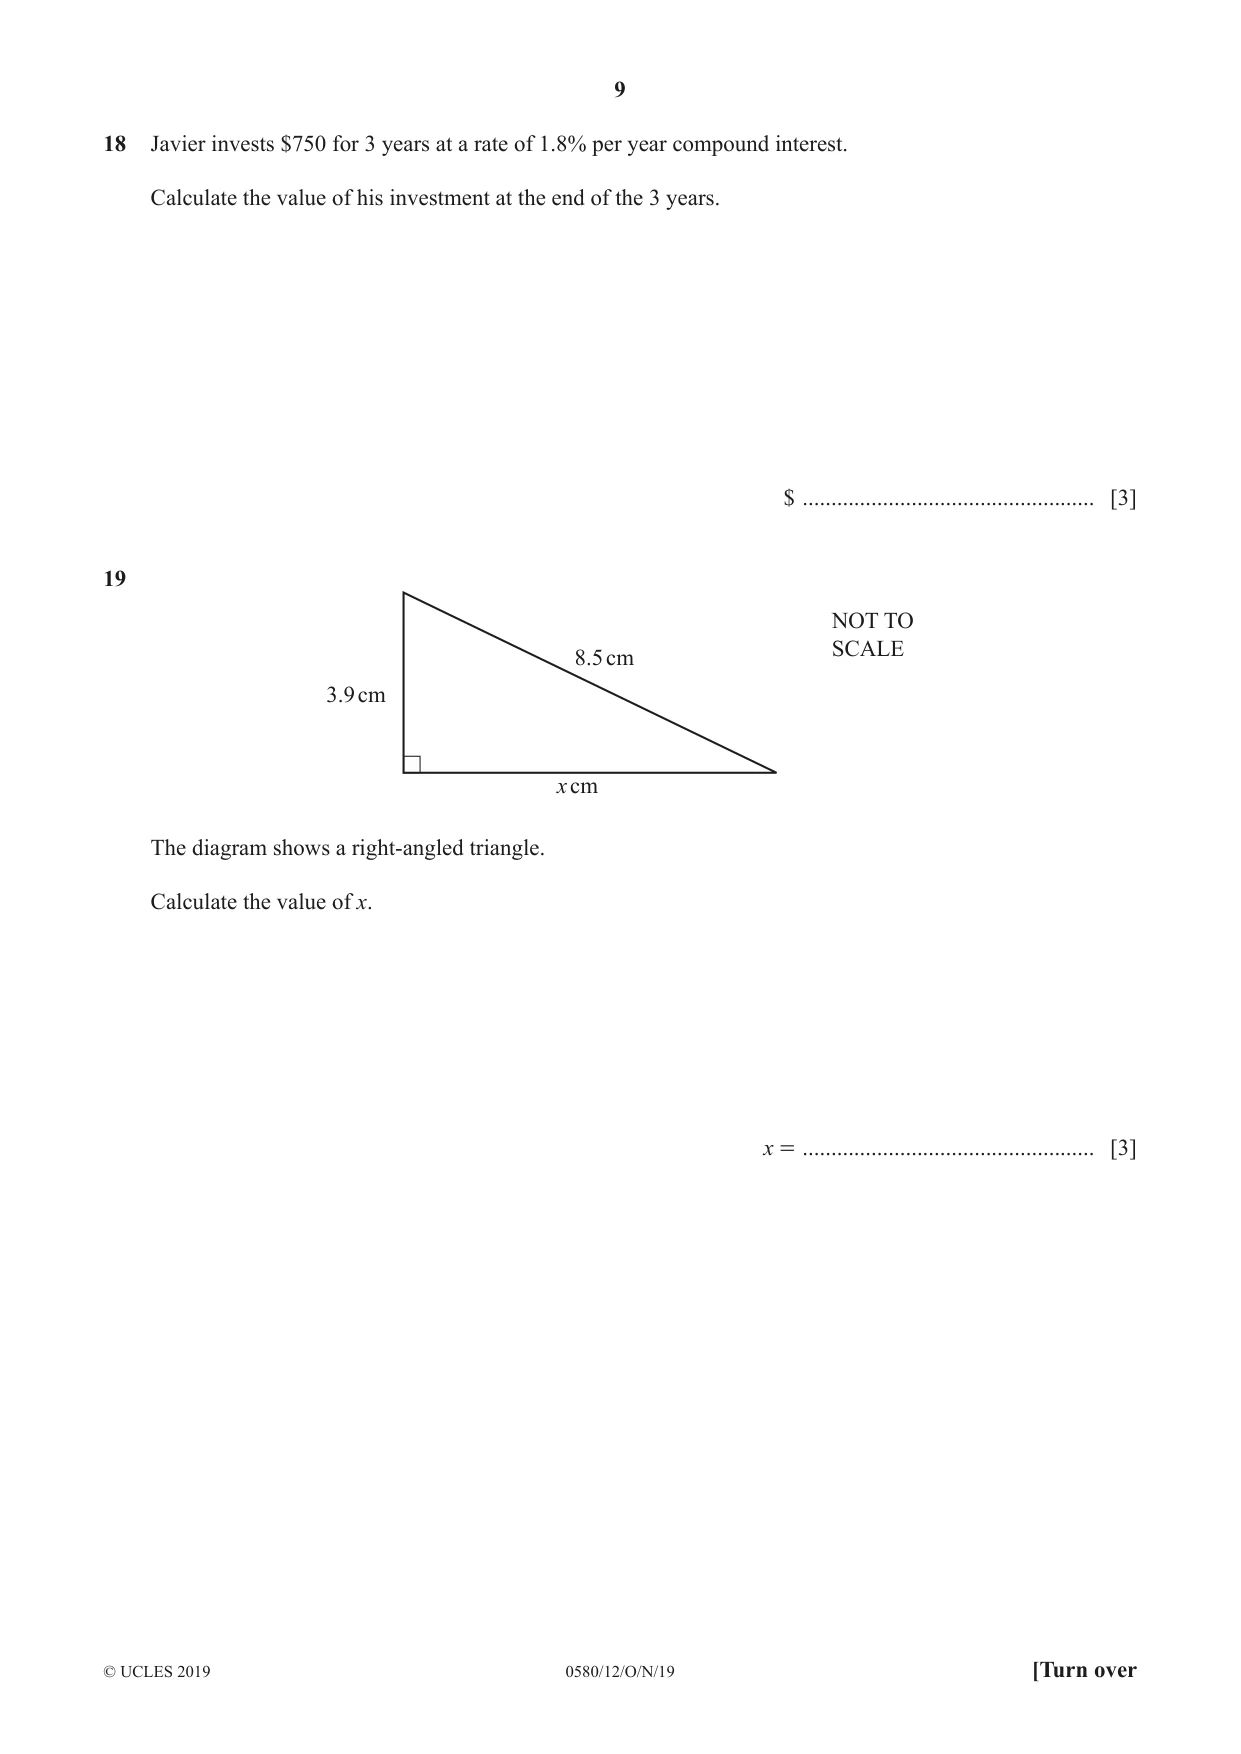
Q18 · Javier invests $750 for 3 years at a rate of 1.8% per year compound interest
18 Javier invests $750 for 3 years at a rate of 1.8% per year compound interest. Calculate the value of his investment at the end of the 3 years. $ ................................................... [3]
Mark scheme: 18 791 or 791.2…. nfww 3 3 8.1 M2 for 750 × + 1 oe 100 2 8.1 or M1 for 750 × + 1 oe 100
Q19 · NOT TO SCALE 8.5 cm 3.9 cm x cm The diagram shows a right-angled triangle
19 NOT TO SCALE 8.5 cm 3.9 cm x cm The diagram shows a right-angled triangle. Calculate the value of x. x = ................................................... [3]
Mark scheme: 19 7.55 or 7.552… 3 M2 for 8.52 − 3.92 oe or M1 for 8.52 = 3.92 + x2 oe
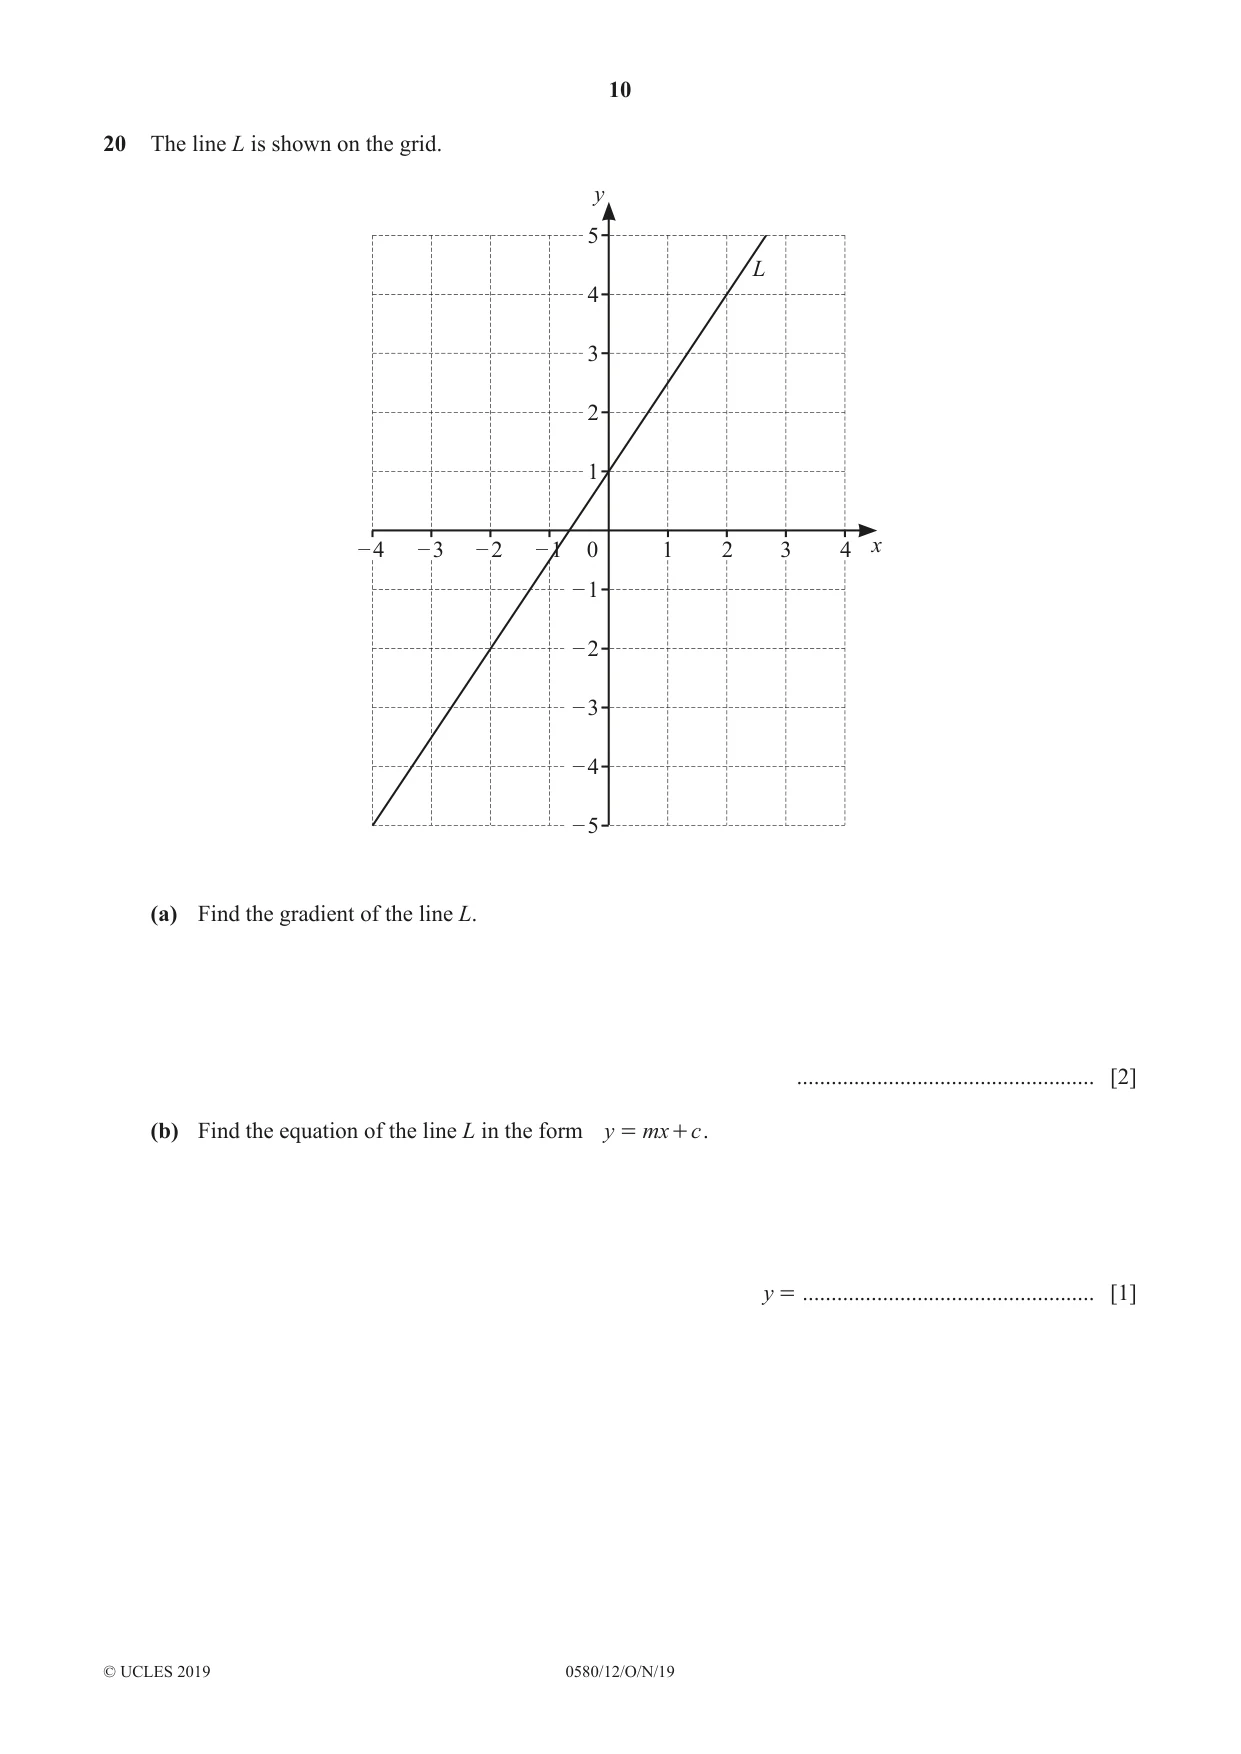
Q20 · The line L is shown on the grid
20 The line L is shown on the grid. y 5 L 4 3 2 1 – 4 – 3 – 2 – 1 0 1 2 3 4 x – 1 – 2 – 3 – 4 – 5 (a) Find the gradient of the line L. .................................................... [2] (b) Find the equation of the line L in the form y = mx + c . y = ................................................... [1]
Mark scheme: 20(a) 1.5 oe nfww 2 rise 9 y 2 − y1 M1 for , e.g. or for 2 run 6 x 2 − x1 points on the line 20(b) 1.5x + 1 1 FT their 1.5
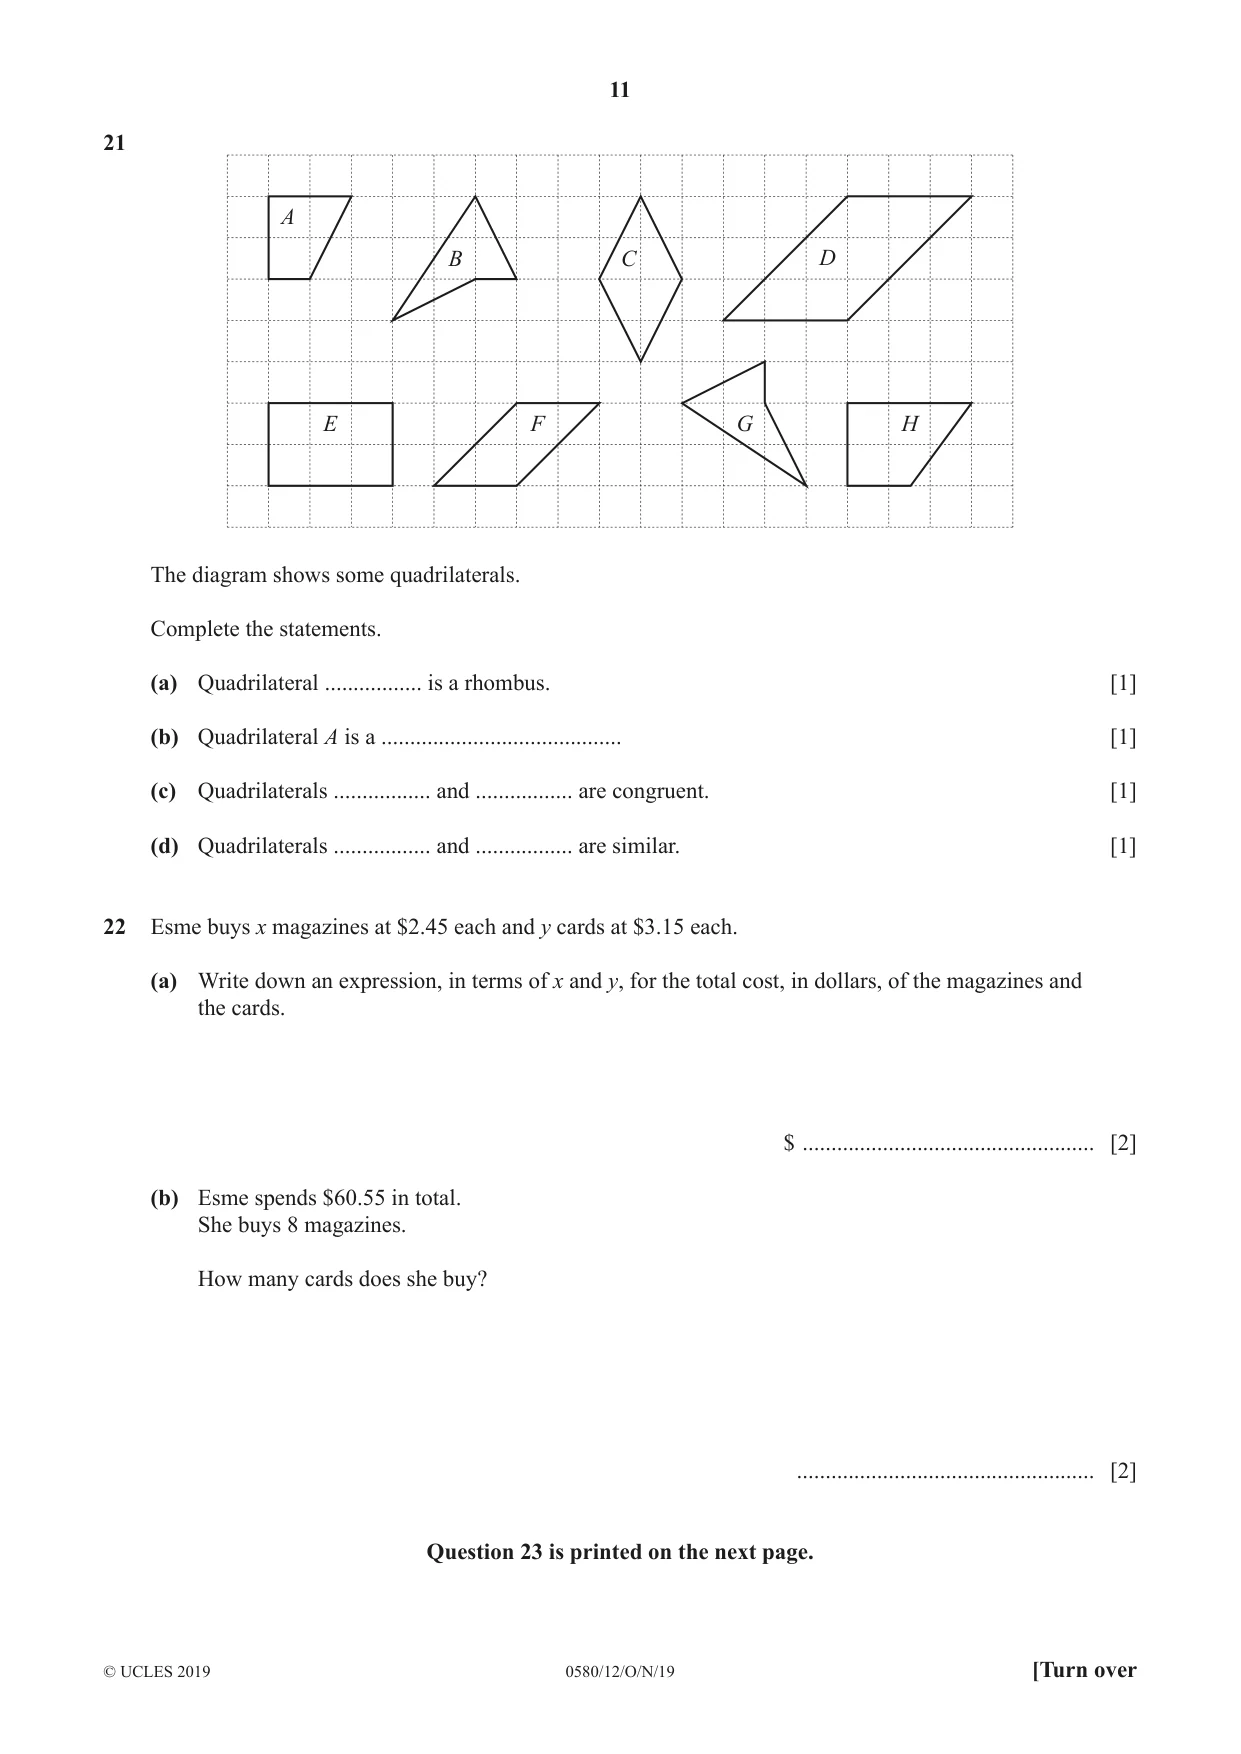
Q21 · A B C D E F G H The diagram shows some quadrilaterals
21 A B C D E F G H The diagram shows some quadrilaterals. Complete the statements. (a) Quadrilateral ................. is a rhombus. [1] (b) Quadrilateral A is a .......................................... [1] (c) Quadrilaterals ................. and ................. are congruent. [1] (d) Quadrilaterals ................. and ................. are similar. [1]
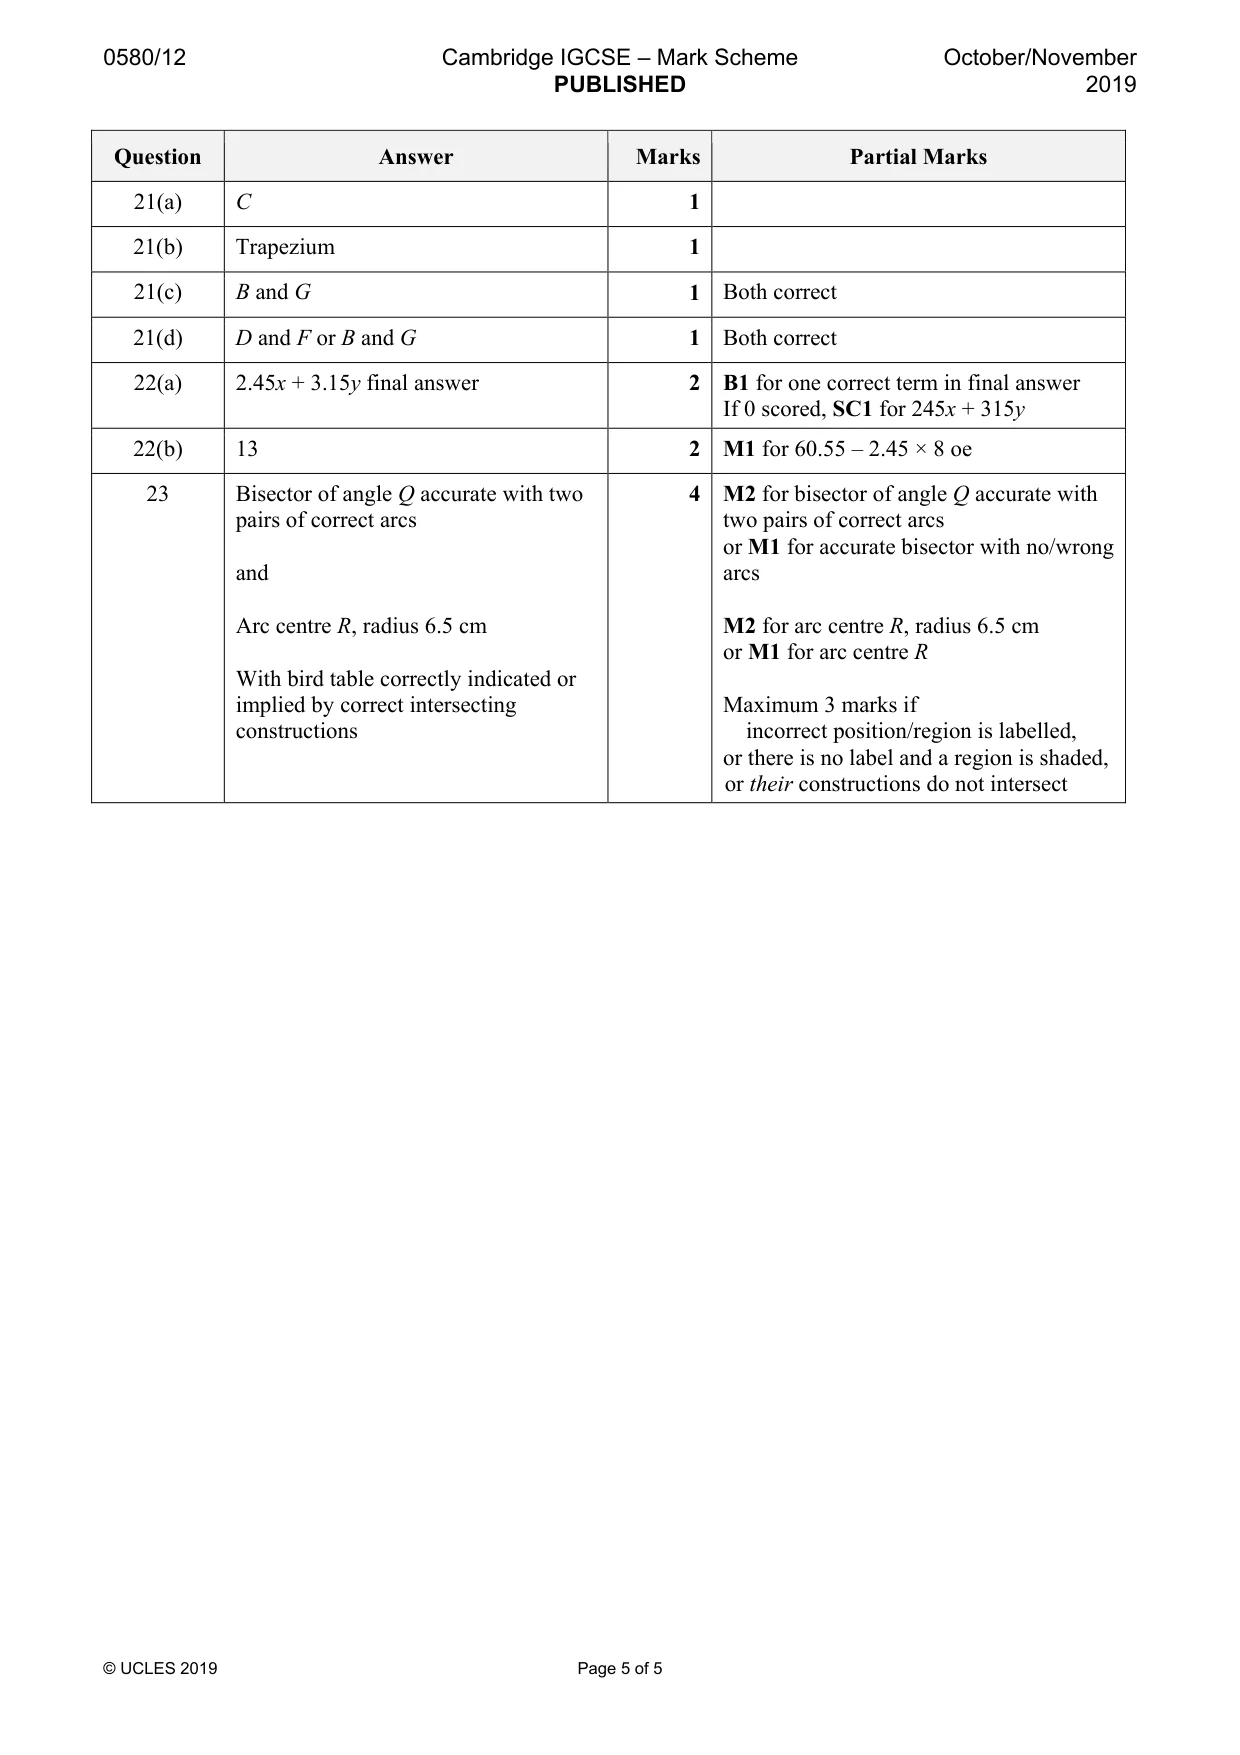
Mark scheme: 21(a) C 1 21(b) Trapezium 1 21(c) B and G 1 Both correct 21(d) D and F or B and G 1 Both correct
Q22 · Esme buys x magazines at $2.45 each and y cards at $3.15 each
22 Esme buys x magazines at $2.45 each and y cards at $3.15 each. (a) Write down an expression, in terms of x and y, for the total cost, in dollars, of the magazines and the cards. $ ................................................... [2] (b) Esme spends $60.55 in total. She buys 8 magazines. How many cards does she buy? .................................................... [2] Question 23 is printed on the next page.
Mark scheme: 22(a) 2.45x + 3.15y final answer 2 B1 for one correct term in final answer If 0 scored, SC1 for 245x + 315y 22(b) 13 2 M1 for 60.55 – 2.45 × 8 oe
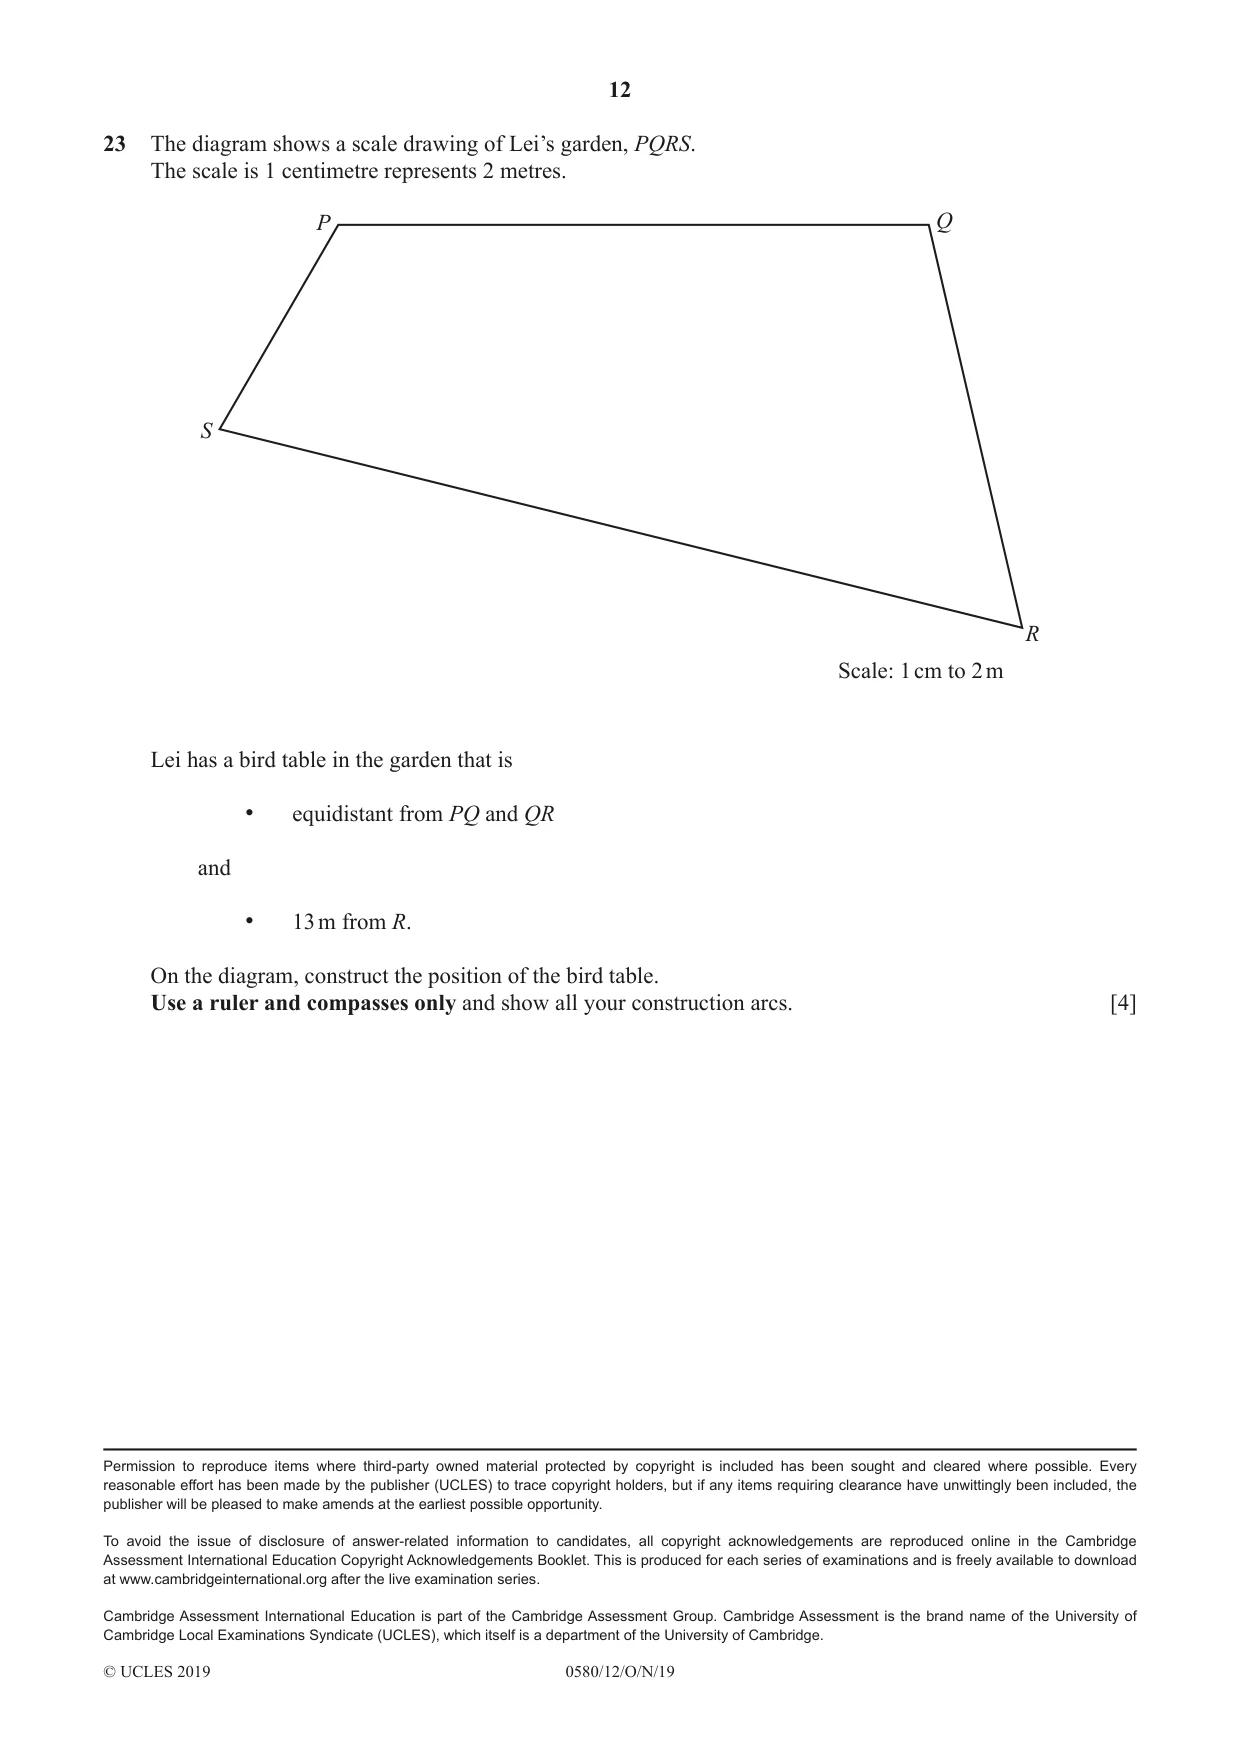
Q23 · The diagram shows a scale drawing of Lei’s garden, PQRS
23 The diagram shows a scale drawing of Lei’s garden, PQRS. The scale is 1 centimetre represents 2 metres. P Q S R Scale: 1 cm to 2 m Lei has a bird table in the garden that is • equidistant from PQ and QR and • 13 m from R. On the diagram, construct the position of the bird table. Use a ruler and compasses only and show all your construction arcs. [4]
Mark scheme: 23 Bisector of angle Q accurate with two 4 M2 for bisector of angle Q accurate with pairs of correct arcs two pairs of correct arcs or M1 for accurate bisector with no/wrong and arcs Arc centre R, radius 6.5 cm M2 for arc centre R, radius 6.5 cm or M1 for arc centre R With bird table correctly indicated or implied by correct intersecting Maximum 3 marks if constructions incorrect position/region is labelled, or there is no label and a region is shaded, or their constructions do not intersect
What was in this paper
The subtopics covered by these 23 questions, and how many questions each got. Open one in a new tab to see every Cambridge question on it.
2Powers and roots2Algebraic manipulation1Angles1Area and perimeter1Averages and range1Geometrical constructions1Geometrical terms1Gradient of linear graphs1Interpreting statistical data1Introduction to probability1Money1Percentages1Pythagoras’ theorem1Rates1Ratio and proportion1Scatter diagrams1Statistical charts and diagrams1Symmetry1The four operations1Units of measure1What you needed in this session
Cambridge’s own grade thresholds for 2019 Oct/Nov, Paper 1 · Variant 2. A higher threshold means an easier paper — the bar moves with how the cohort did.