Cambridge IGCSE Marine Science (Maldives only) 0697 — 2023 May/June Paper 1 · Variant 0
0697/10/M/J/23 · 80 marks · ≈90 min
The question paper and its mark scheme, free to read here and free to download. This is Cambridge’s own paper, exactly as it was sat.
Question paper16 pages

Mark scheme
No mark scheme is in the library for this paper.
Paper as text
Question paper, page 1
This document has 16 pages. Any blank pages are indicated. [Turn over DC (CE/JG) 327317 © UCLES 2023 * 0 7 4 7 4 5 6 9 3 4 * MARINE SCIENCE 0697/01 Paper 1 Structured May/June 2023 1 hour 30 minutes You must answer on the question paper. No additional materials are needed. INSTRUCTIONS ● Answer all questions. ● Use a black or dark blue pen. You may use an HB pencil for any diagrams or graphs. ● Write your name, centre number and candidate number in the boxes at the top of the page. ● Write your answer to each question in the space provided. ● Do not use an erasable pen or correction fluid. ● Do not write on any bar codes. ● You may use a calculator. ● You should show all your working and use appropriate units. INFORMATION ● The total mark for this paper is 80. ● The number of marks for each question or part question is shown in brackets [ ]. Cambridge IGCSE™
Question paper, page 2
2 0697/01/M/J/23 © UCLES 2023 Answer all questions. 1 (a) Complete the sentences using words from the box. autolysis carbohydrates carbon dioxide fertilisation hydrogen lipids oxygen protein putrefaction rancidity rigor mortis Soon after being caught, fish start to spoil. … happens when the muscles start to stiffen. Fish can also spoil due to bacteria in the fish causing … . Enzymes in the fish start to cause … . Rancidity occurs when the … in the fish react with … in the air. [5] (b) (i) Many fisheries products are exported to other countries. List three factors that affect international trade in fisheries products. 1 … 2 … 3 … [3] (ii) Suggest why exported fish are often preserved. … … … … [2]
Question paper, page 3
3 0697/01/M/J/23 © UCLES 2023 [Turn over (c) Two methods of preservation are canning and irradiation. Outline each method of preservation. (i) canning … … … … … … … … [4] (ii) irradiation … … … … … [3] [Total: 17]
Question paper, page 4
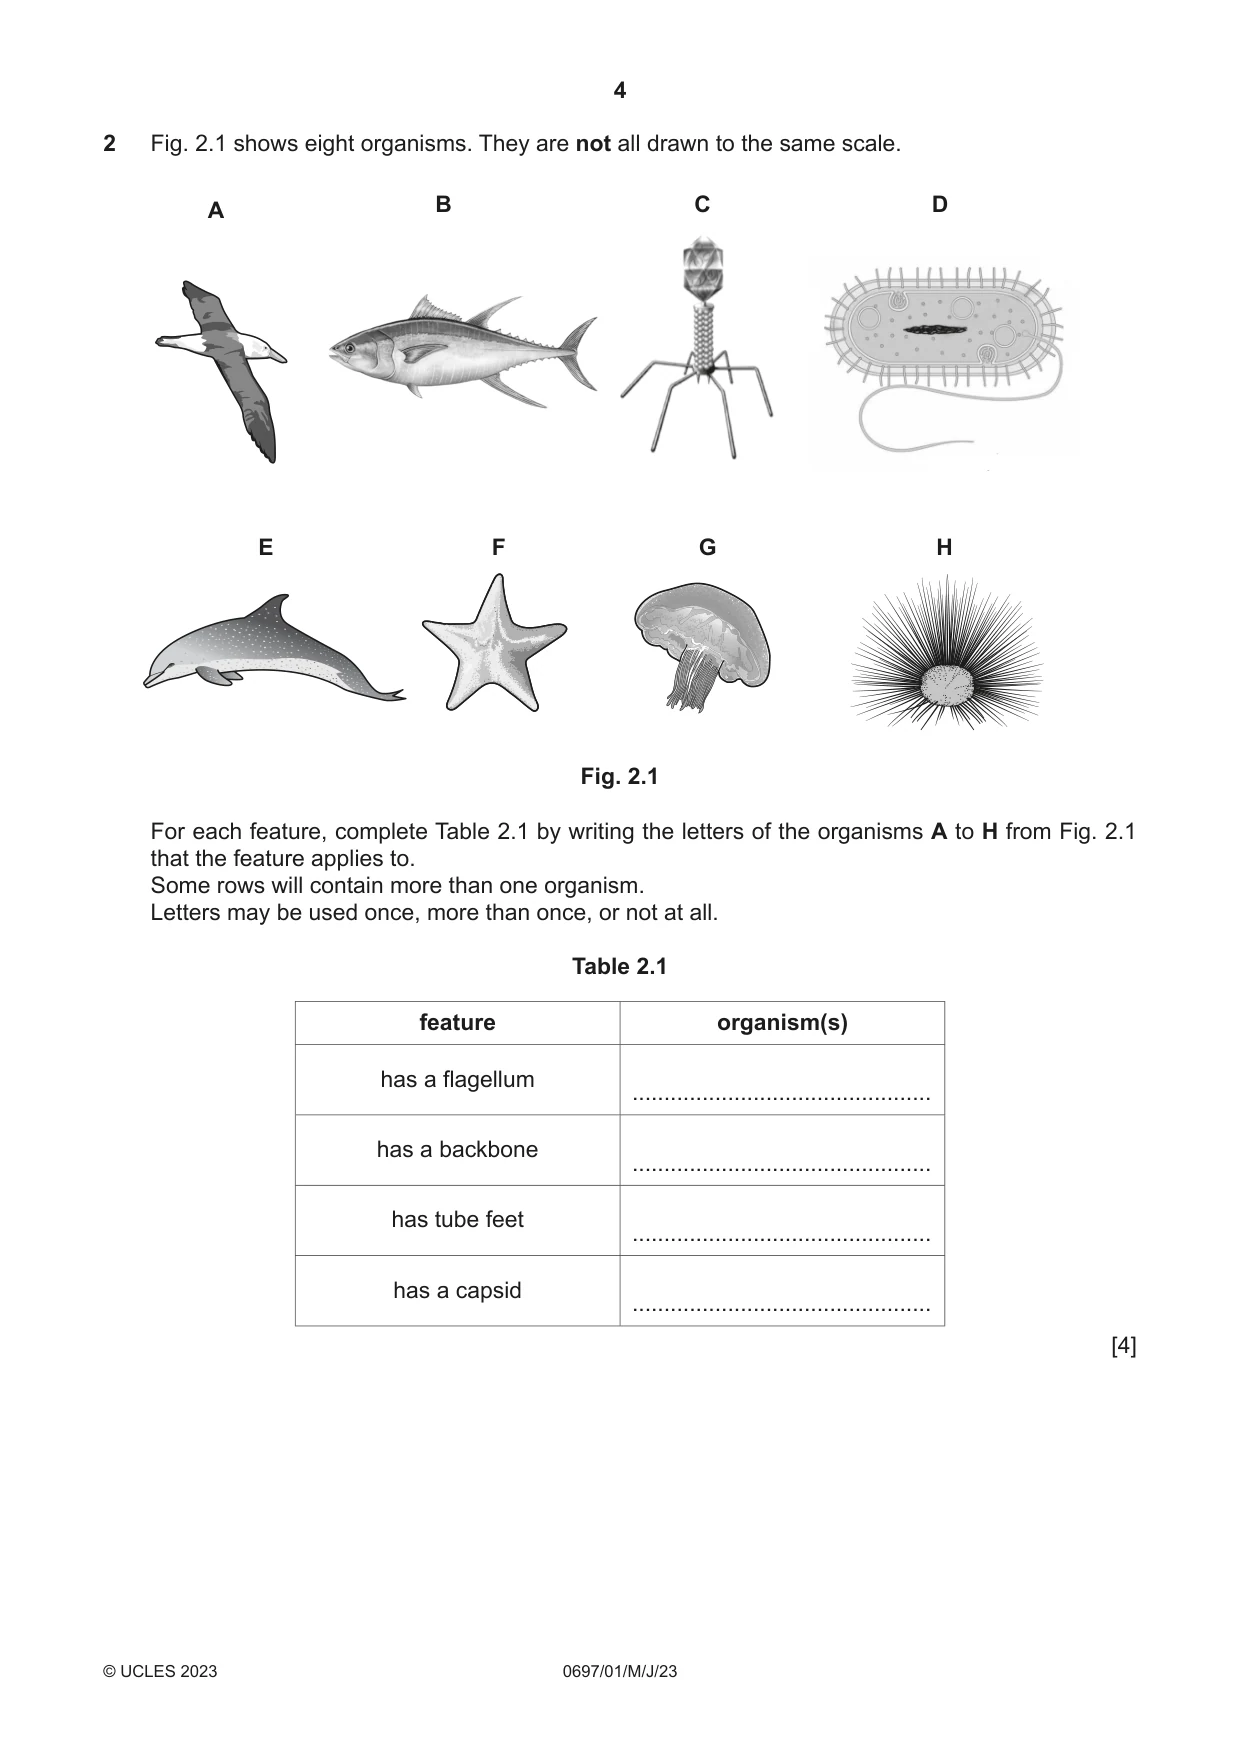
4 0697/01/ M / J /23 © UCLES 2023 2 Fig. 2.1 shows eight organisms. They are not all drawn to the same scale. A B C D E F G H Fig. 2.1 For each feature, complete Table 2.1 by writing the letters of the organisms A to H from Fig. 2.1 that the feature applies to. Some rows will contain more than one organism. Letters may be used once, more than once, or not at all. Table 2.1 feature organism(s) has a flagellum … has a backbone … has tube feet … has a capsid … [4]
Question paper, page 5
5 0697/01/M/J/23 © UCLES 2023 [Turn over BLANK PAGE
Question paper, page 6
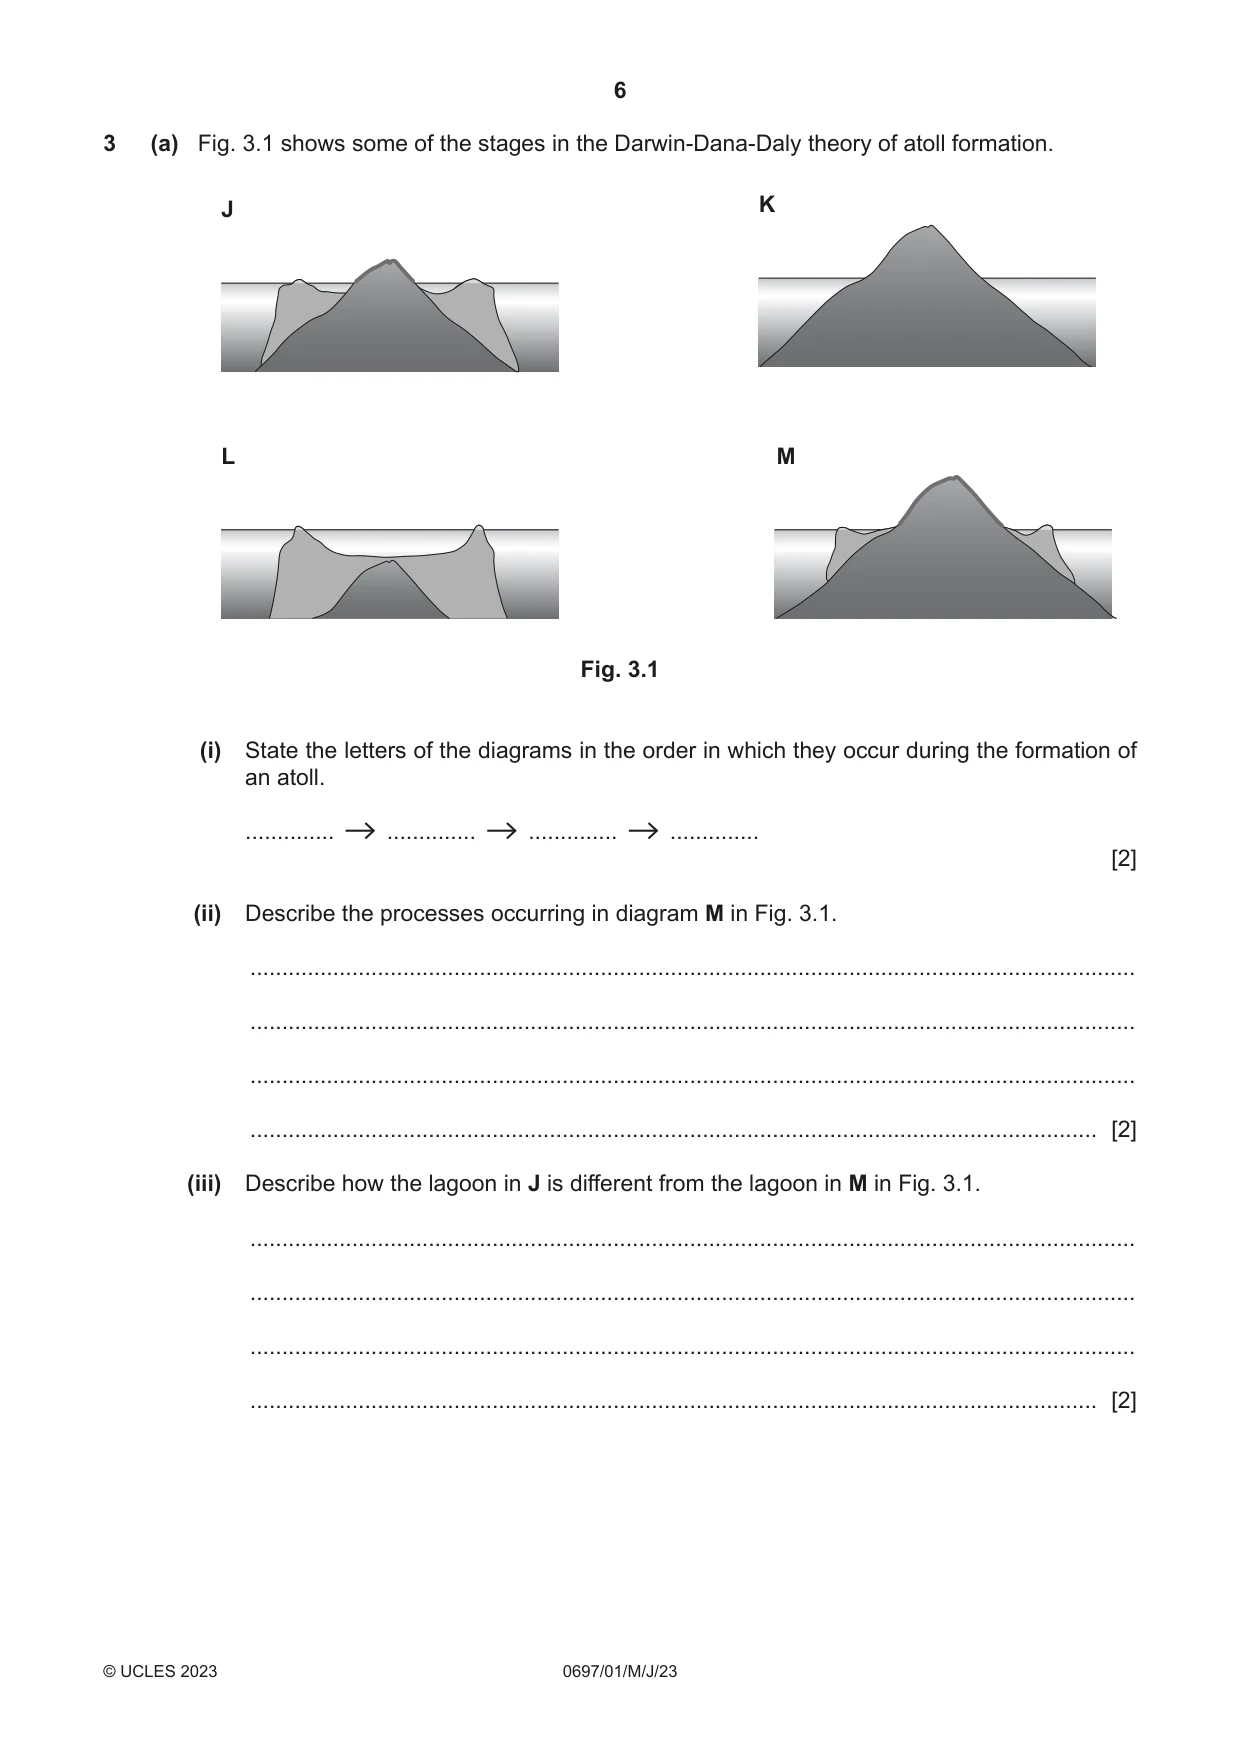
6 0697/01/M/J/23 © UCLES 2023 3 (a) Fig. 3.1 shows some of the stages in the Darwin‑Dana‑Daly theory of atoll formation. J K L M Fig. 3.1 (i) State the letters of the diagrams in the order in which they occur during the formation of an atoll. … … … … [2] (ii) Describe the processes occurring in diagram M in Fig. 3.1. … … … … [2] (iii) Describe how the lagoon in J is different from the lagoon in M in Fig. 3.1. … … … … [2]
Question paper, page 7
7 0697/01/M/J/23 © UCLES 2023 [Turn over (b) Discuss the causes of global warming and the effects it may have on atolls. … … … … … … … … [4] [Total: 10]
Question paper, page 8
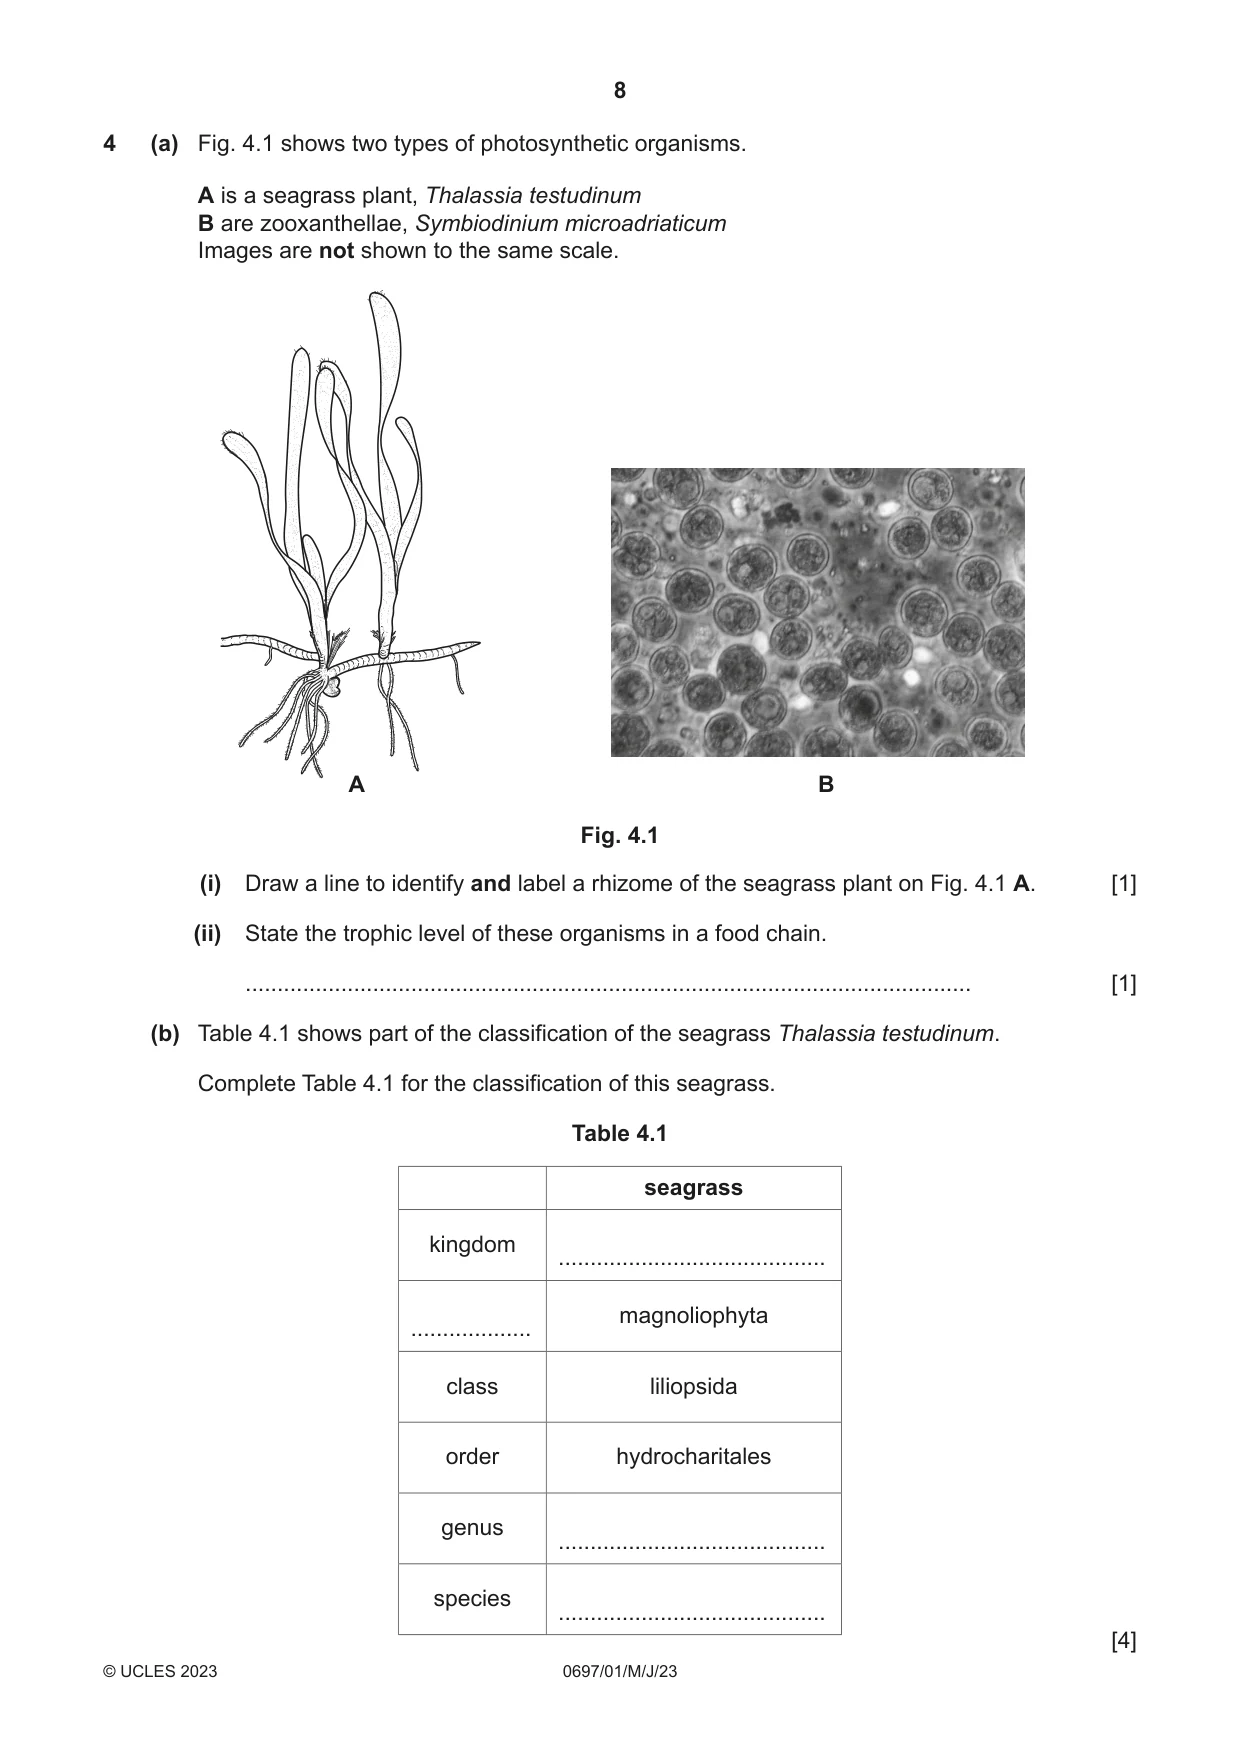
8 0697/01/M/J/23 © UCLES 2023 4 (a) Fig. 4.1 shows two types of photosynthetic organisms. A is a seagrass plant, Thalassia testudinum B are zooxanthellae, Symbiodinium microadriaticum Images are not shown to the same scale. A B Fig. 4.1 (i) Draw a line to identify and label a rhizome of the seagrass plant on Fig. 4.1 A. [1] (ii) State the trophic level of these organisms in a food chain. … [1] (b) Table 4.1 shows part of the classification of the seagrass Thalassia testudinum. Complete Table 4.1 for the classification of this seagrass. Table 4.1 seagrass kingdom … … magnoliophyta class liliopsida order hydrocharitales genus … species … [4]
Question paper, page 9
9 0697/01/M/J/23 © UCLES 2023 [Turn over (c) Name two inorganic nutrients required by photosynthetic marine organisms. … and … [1] (d) (i) Name a type of organism with which species B often has a symbiotic relationship. … [1] (ii) Explain the symbiotic relationship between species B and the organism in (d)(i). … … … … … … [3] (e) Outline the role of decomposers in nutrient recycling of nutrients from species A. … … … … … … … … [4] [Total: 15]
Question paper, page 10
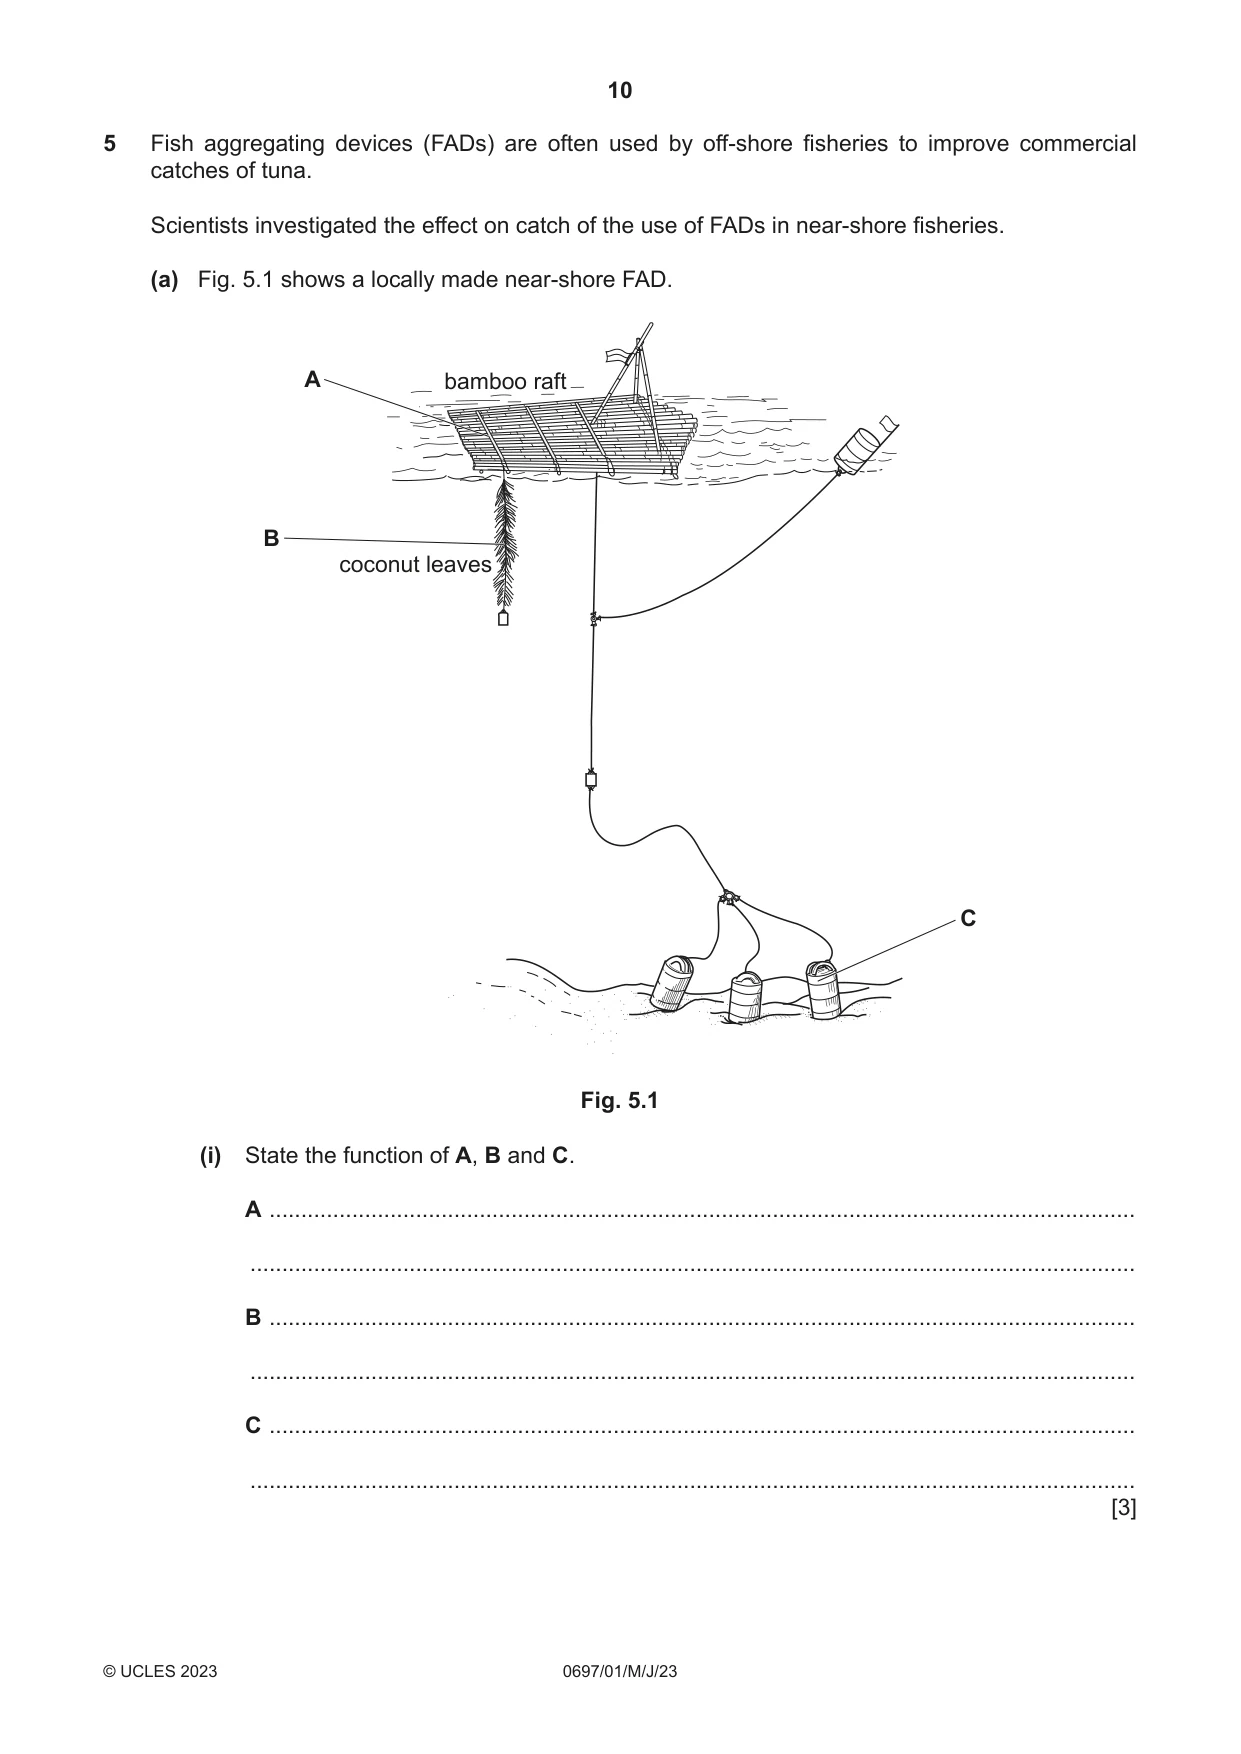
10 0697/01/M/J/23 © UCLES 2023 5 Fish aggregating devices (FADs) are often used by off‑shore fisheries to improve commercial catches of tuna. Scientists investigated the effect on catch of the use of FADs in near‑shore fisheries. (a) Fig. 5.1 shows a locally made near‑shore FAD. A B C bamboo raft coconut leaves Fig. 5.1 (i) State the function of A, B and C. A … … B … … C … … [3]
Question paper, page 11
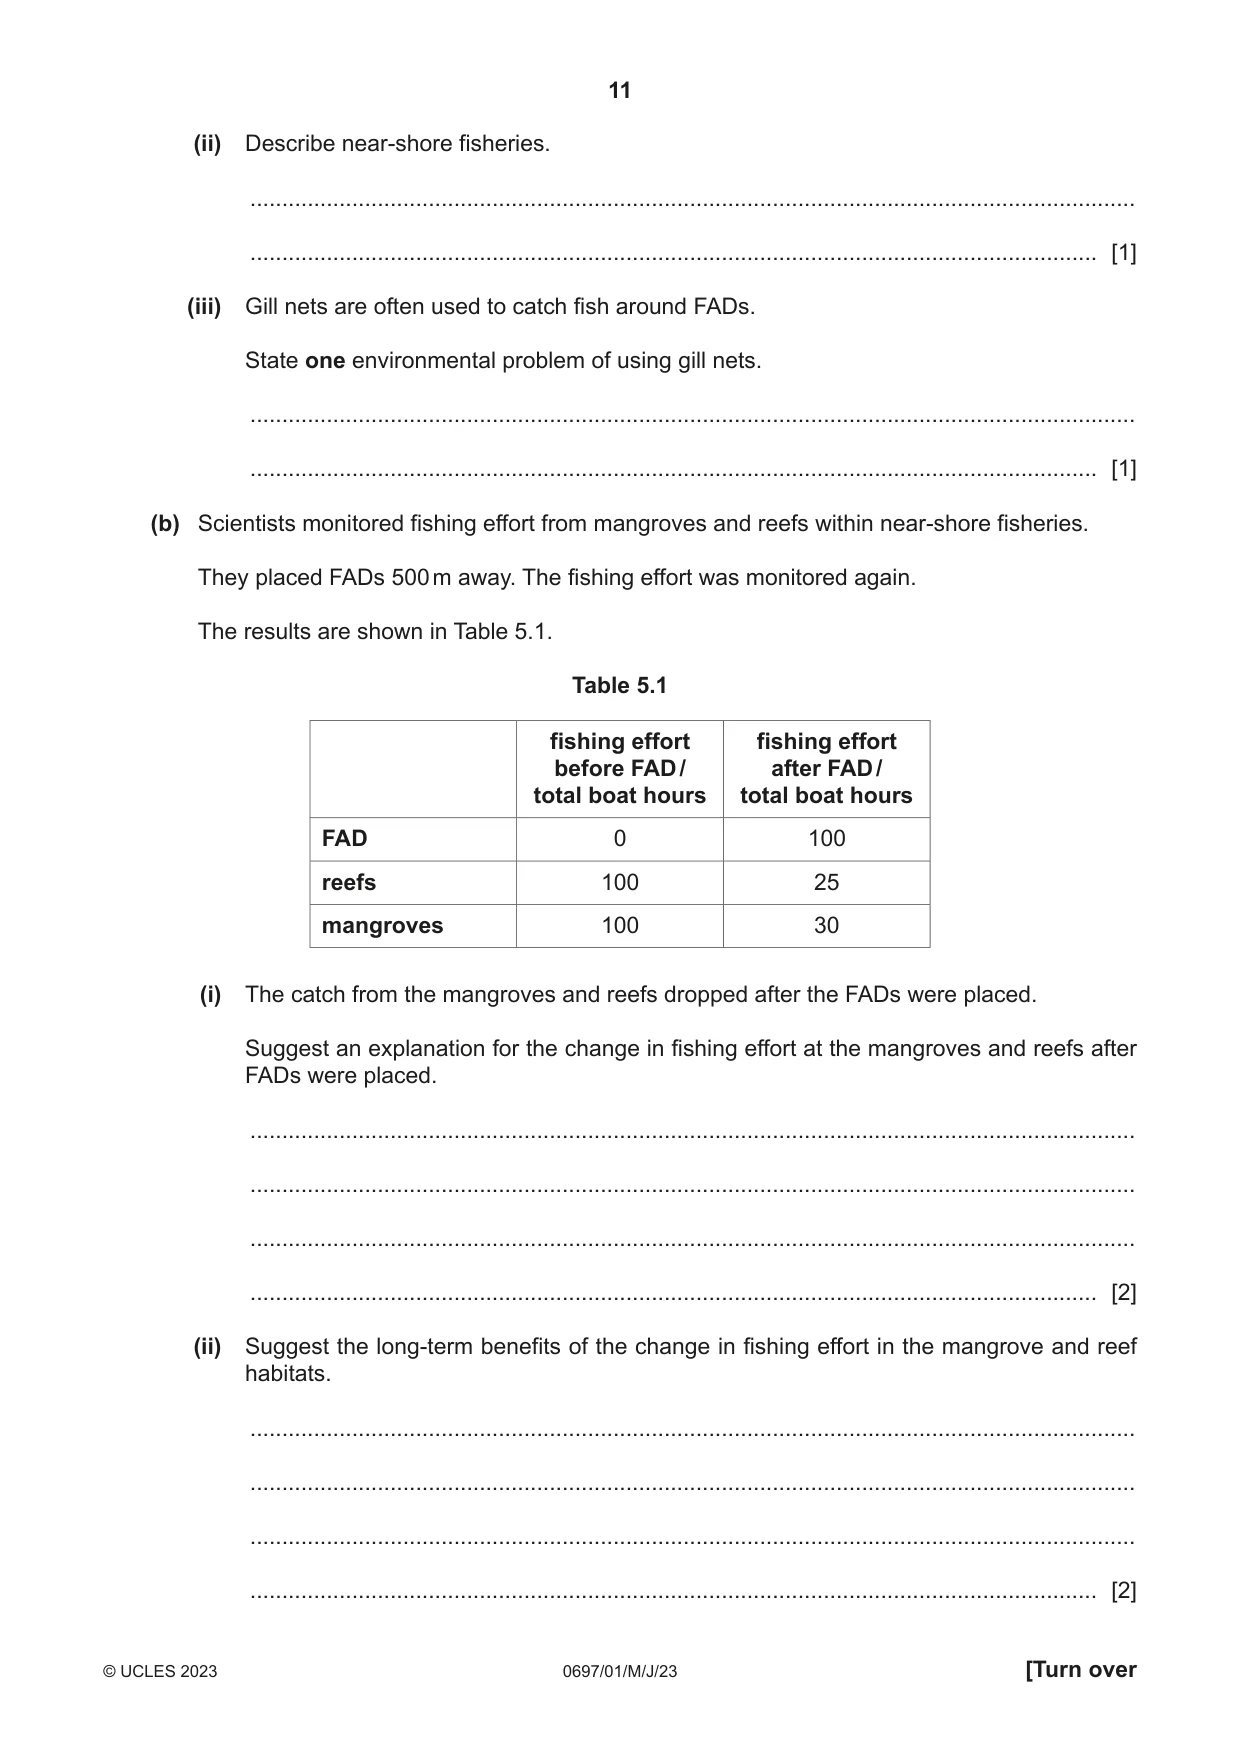
11 0697/01/M/J/23 © UCLES 2023 [Turn over (ii) Describe near‑shore fisheries. … … [1] (iii) Gill nets are often used to catch fish around FADs. State one environmental problem of using gill nets. … … [1] (b) Scientists monitored fishing effort from mangroves and reefs within near‑shore fisheries. They placed FADs 500 m away. The fishing effort was monitored again. The results are shown in Table 5.1. Table 5.1 fishing effort before FAD / total boat hours fishing effort after FAD / total boat hours FAD 0 100 reefs 100 25 mangroves 100 30 (i) The catch from the mangroves and reefs dropped after the FADs were placed. Suggest an explanation for the change in fishing effort at the mangroves and reefs after FADs were placed. … … … … [2] (ii) Suggest the long‑term benefits of the change in fishing effort in the mangrove and reef habitats. … … … … [2]
Question paper, page 12
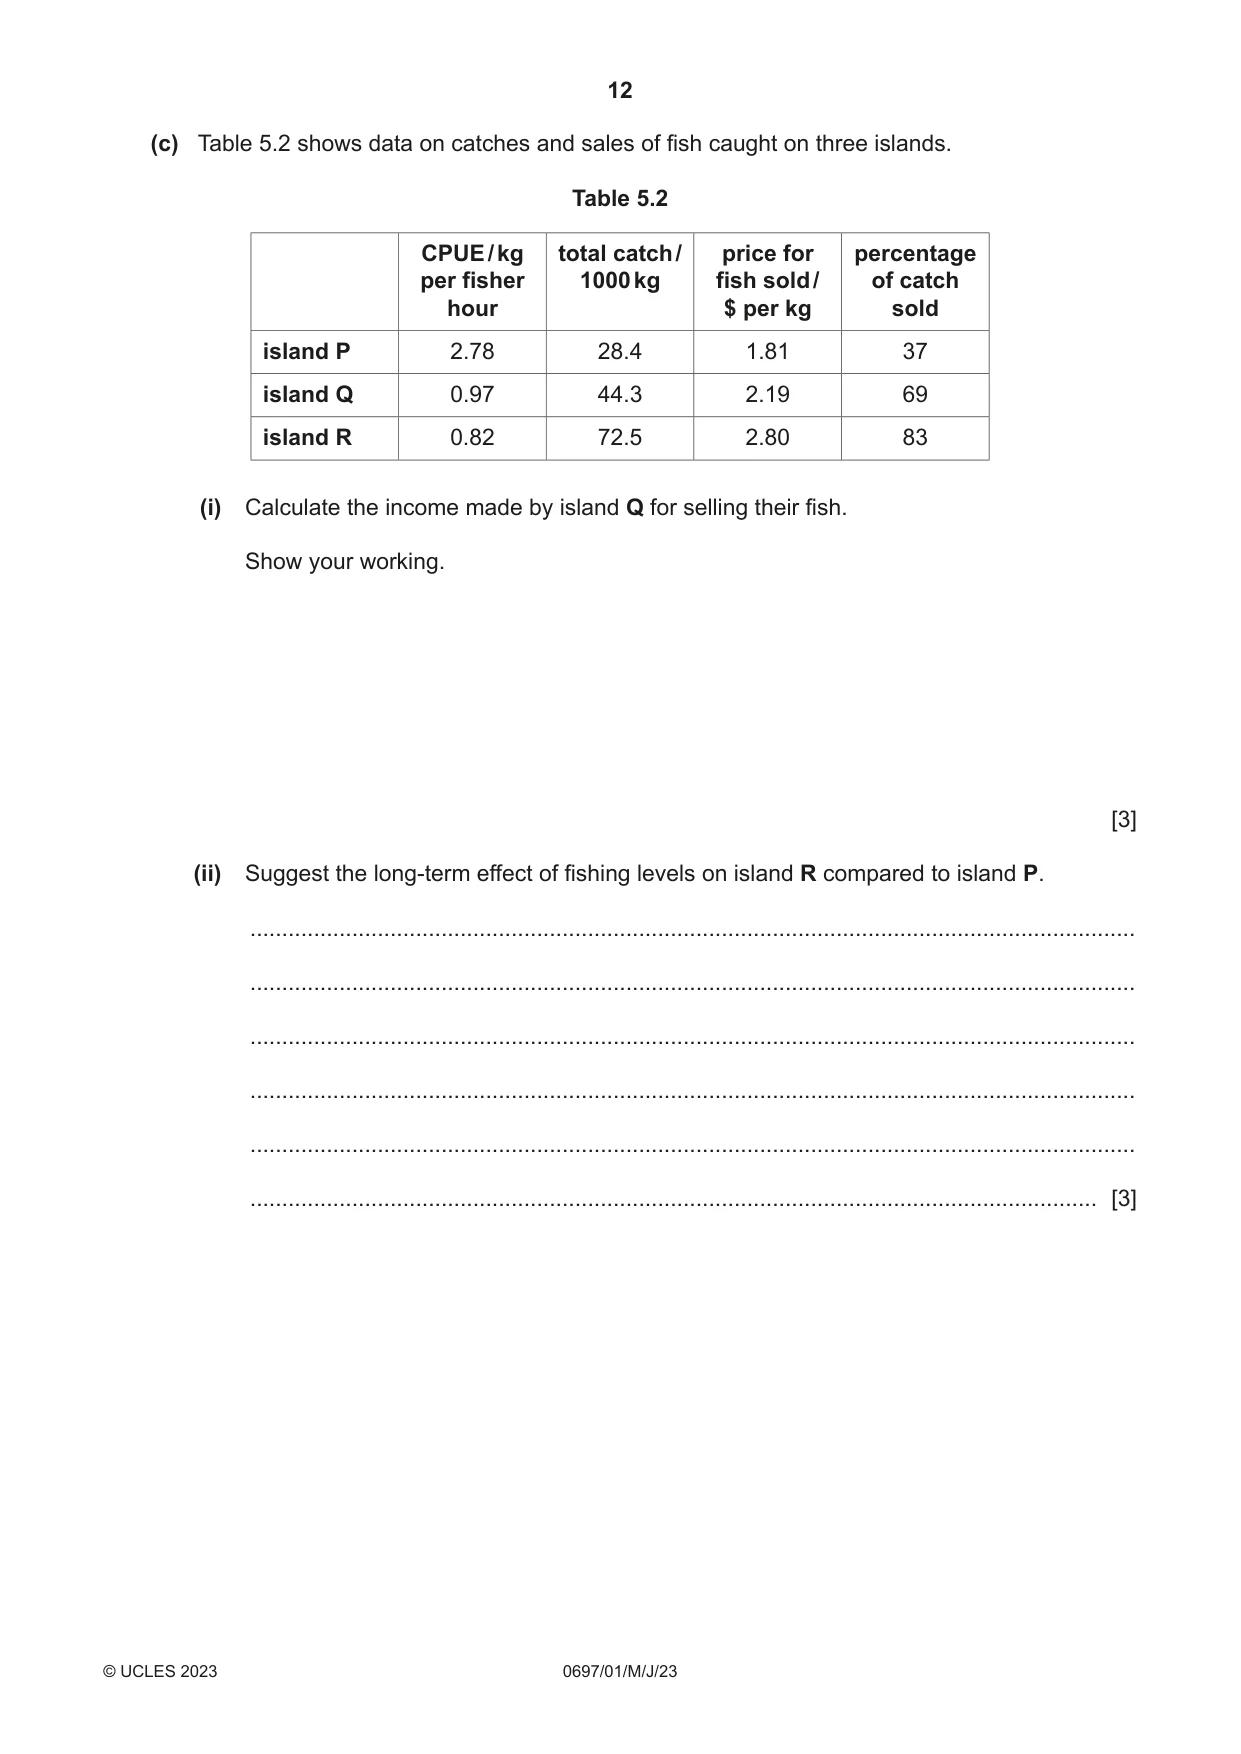
12 0697/01/M/J/23 © UCLES 2023 (c) Table 5.2 shows data on catches and sales of fish caught on three islands. Table 5.2 CPUE / kg per fisher hour total catch / 1000 kg price for fish sold / $ per kg percentage of catch sold island P 2.78 28.4 1.81 37 island Q 0.97 44.3 2.19 69 island R 0.82 72.5 2.80 83 (i) Calculate the income made by island Q for selling their fish. Show your working. [3] (ii) Suggest the long‑term effect of fishing levels on island R compared to island P. … … … … … … [3]
Question paper, page 13
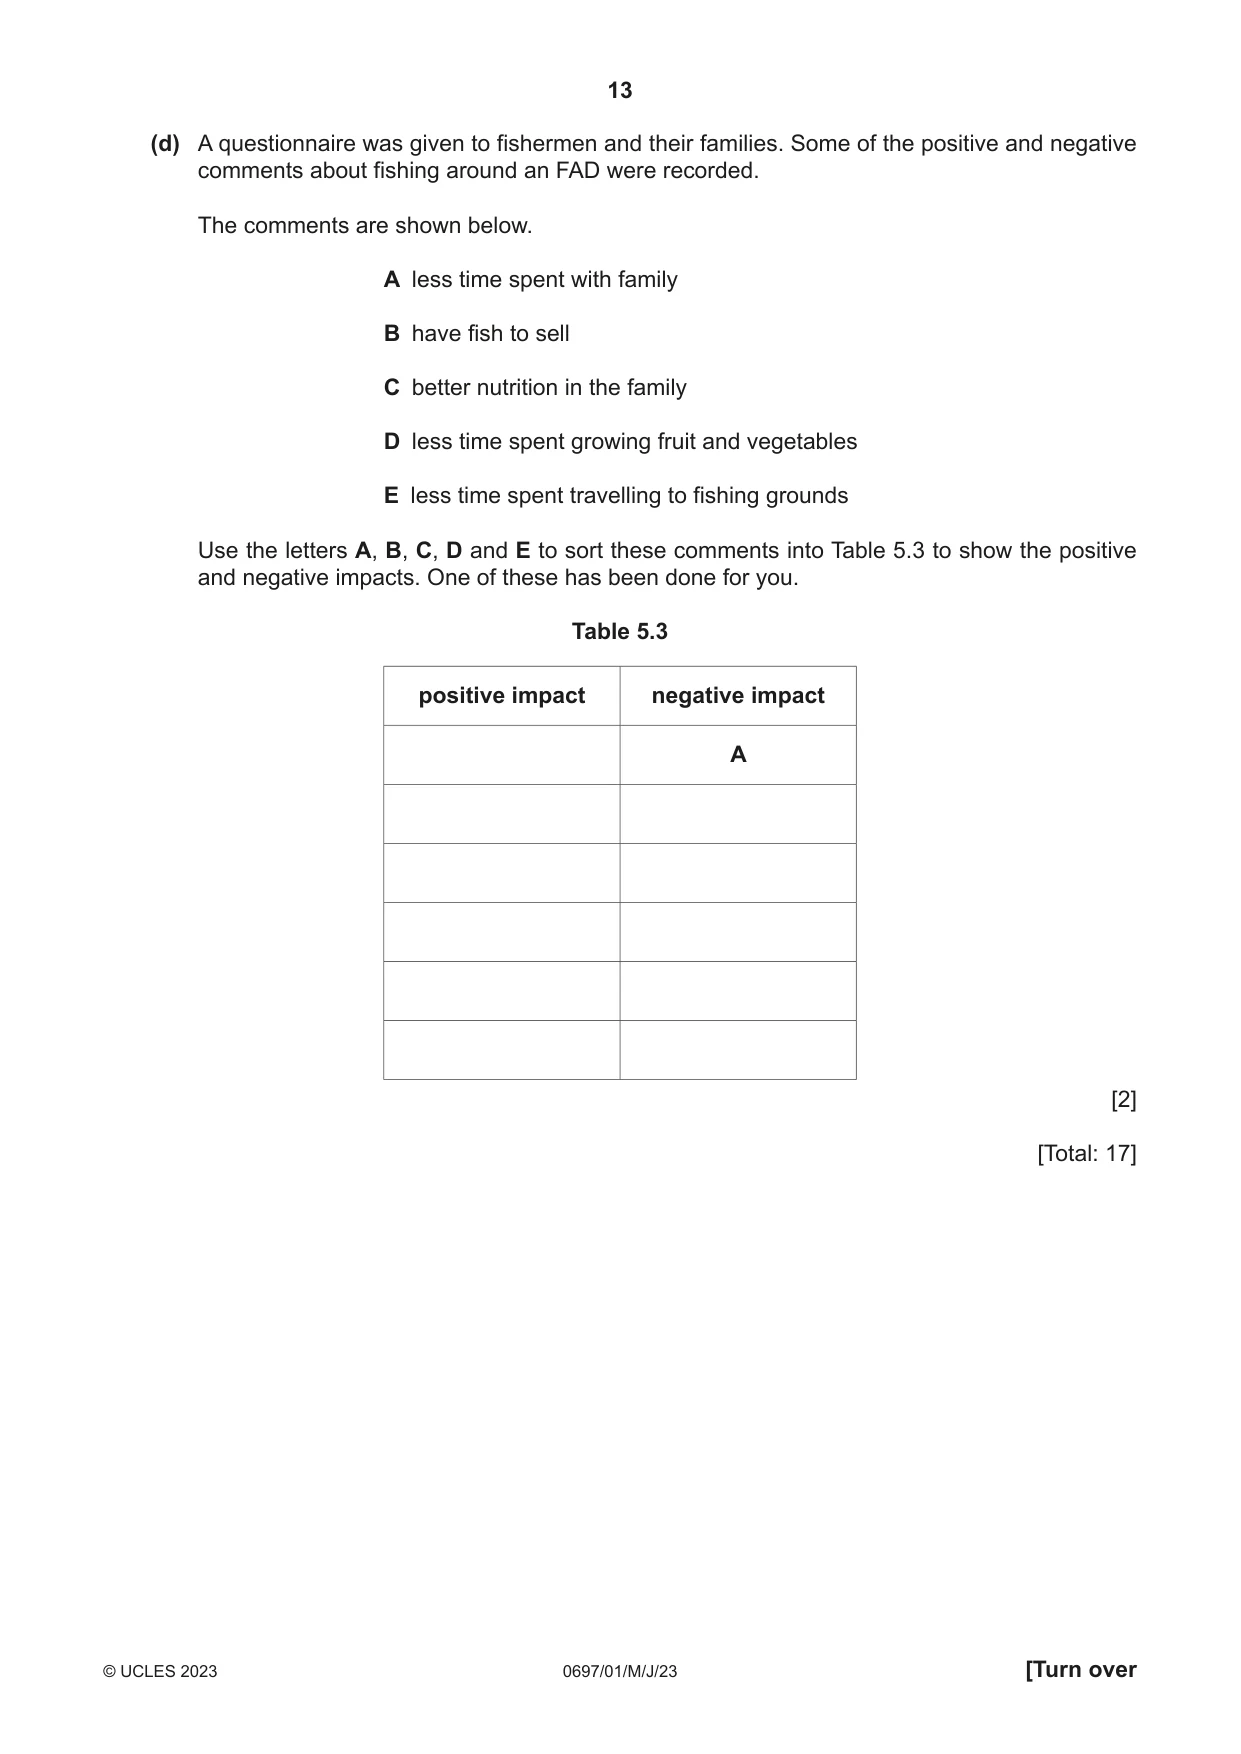
13 0697/01/M/J/23 © UCLES 2023 [Turn over (d) A questionnaire was given to fishermen and their families. Some of the positive and negative comments about fishing around an FAD were recorded. The comments are shown below. A less time spent with family B have fish to sell C better nutrition in the family D less time spent growing fruit and vegetables E less time spent travelling to fishing grounds Use the letters A, B, C, D and E to sort these comments into Table 5.3 to show the positive and negative impacts. One of these has been done for you. Table 5.3 positive impact negative impact A [2] [Total: 17]
Question paper, page 14
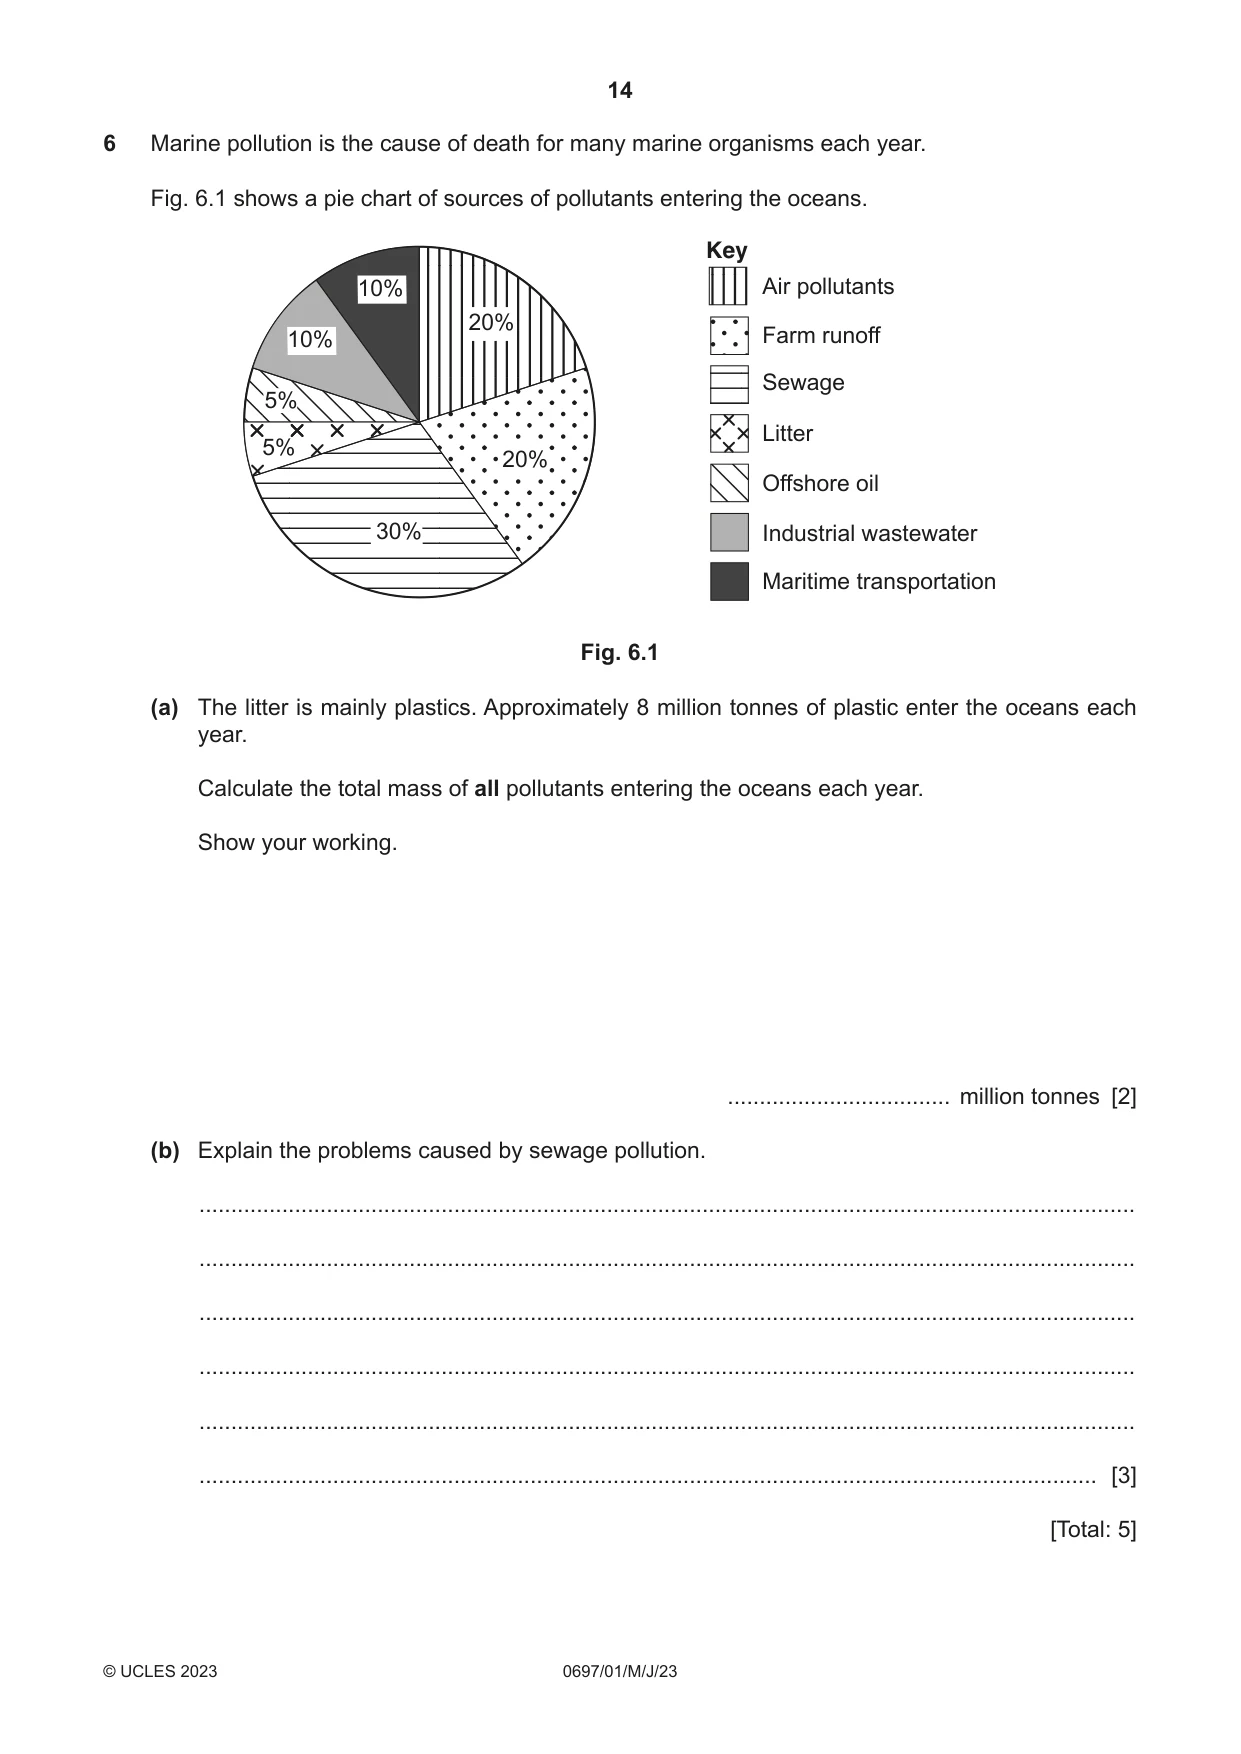
14 0697/01/M/J/23 © UCLES 2023 6 Marine pollution is the cause of death for many marine organisms each year. Fig. 6.1 shows a pie chart of sources of pollutants entering the oceans. Key 20% 20% 30% 10% 10% 5% 5% Air pollutants Farm runoff Sewage Litter Offshore oil Industrial wastewater Maritime transportation Fig. 6.1 (a) The litter is mainly plastics. Approximately 8 million tonnes of plastic enter the oceans each year. Calculate the total mass of all pollutants entering the oceans each year. Show your working. … million tonnes [2] (b) Explain the problems caused by sewage pollution. … … … … … … [3] [Total: 5]
Question paper, page 15
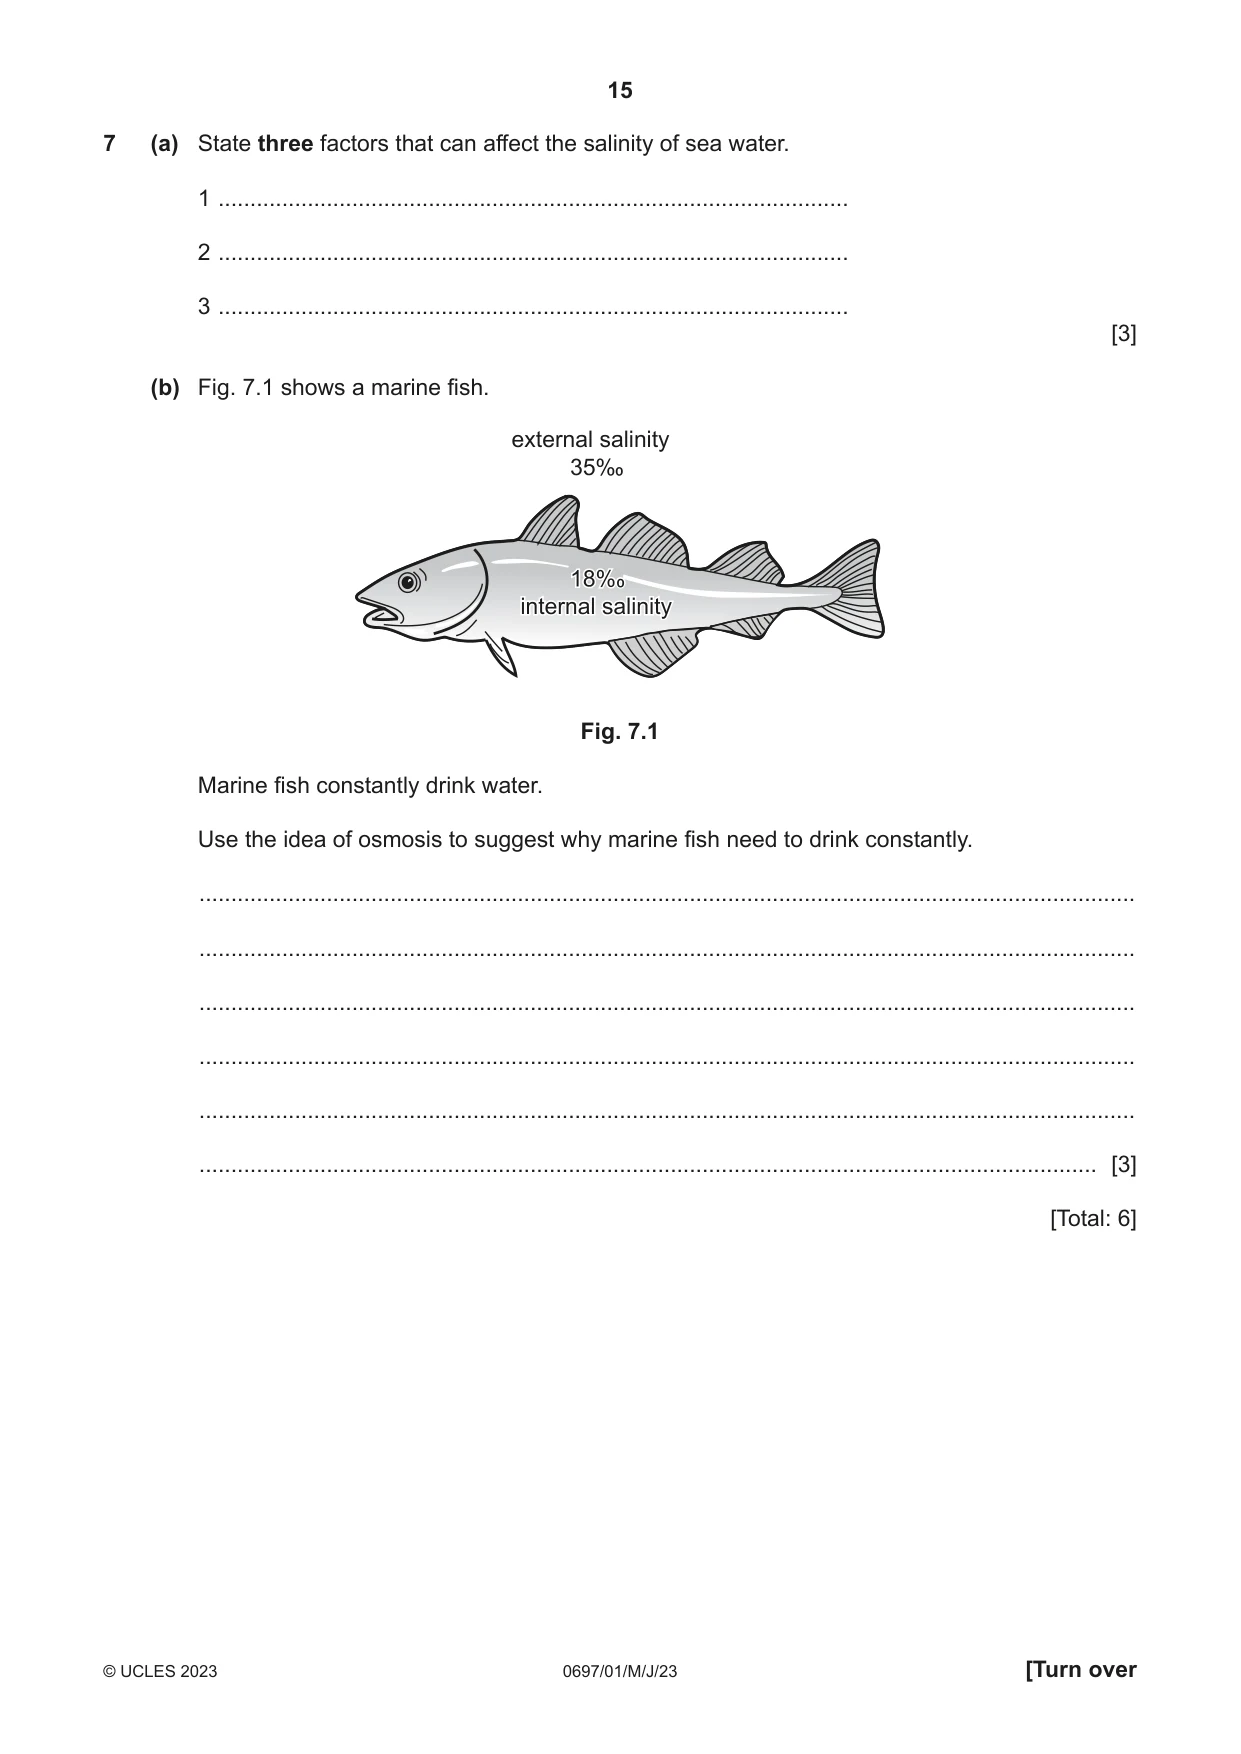
15 0697/01/M/J/23 © UCLES 2023 [Turn over 7 (a) State three factors that can affect the salinity of sea water. 1 … 2 … 3 … [3] (b) Fig. 7.1 shows a marine fish. external salinity 18% internal salinity Fig. 7.1 Marine fish constantly drink water. Use the idea of osmosis to suggest why marine fish need to drink constantly. … … … … … … [3] [Total: 6]
Question paper, page 16
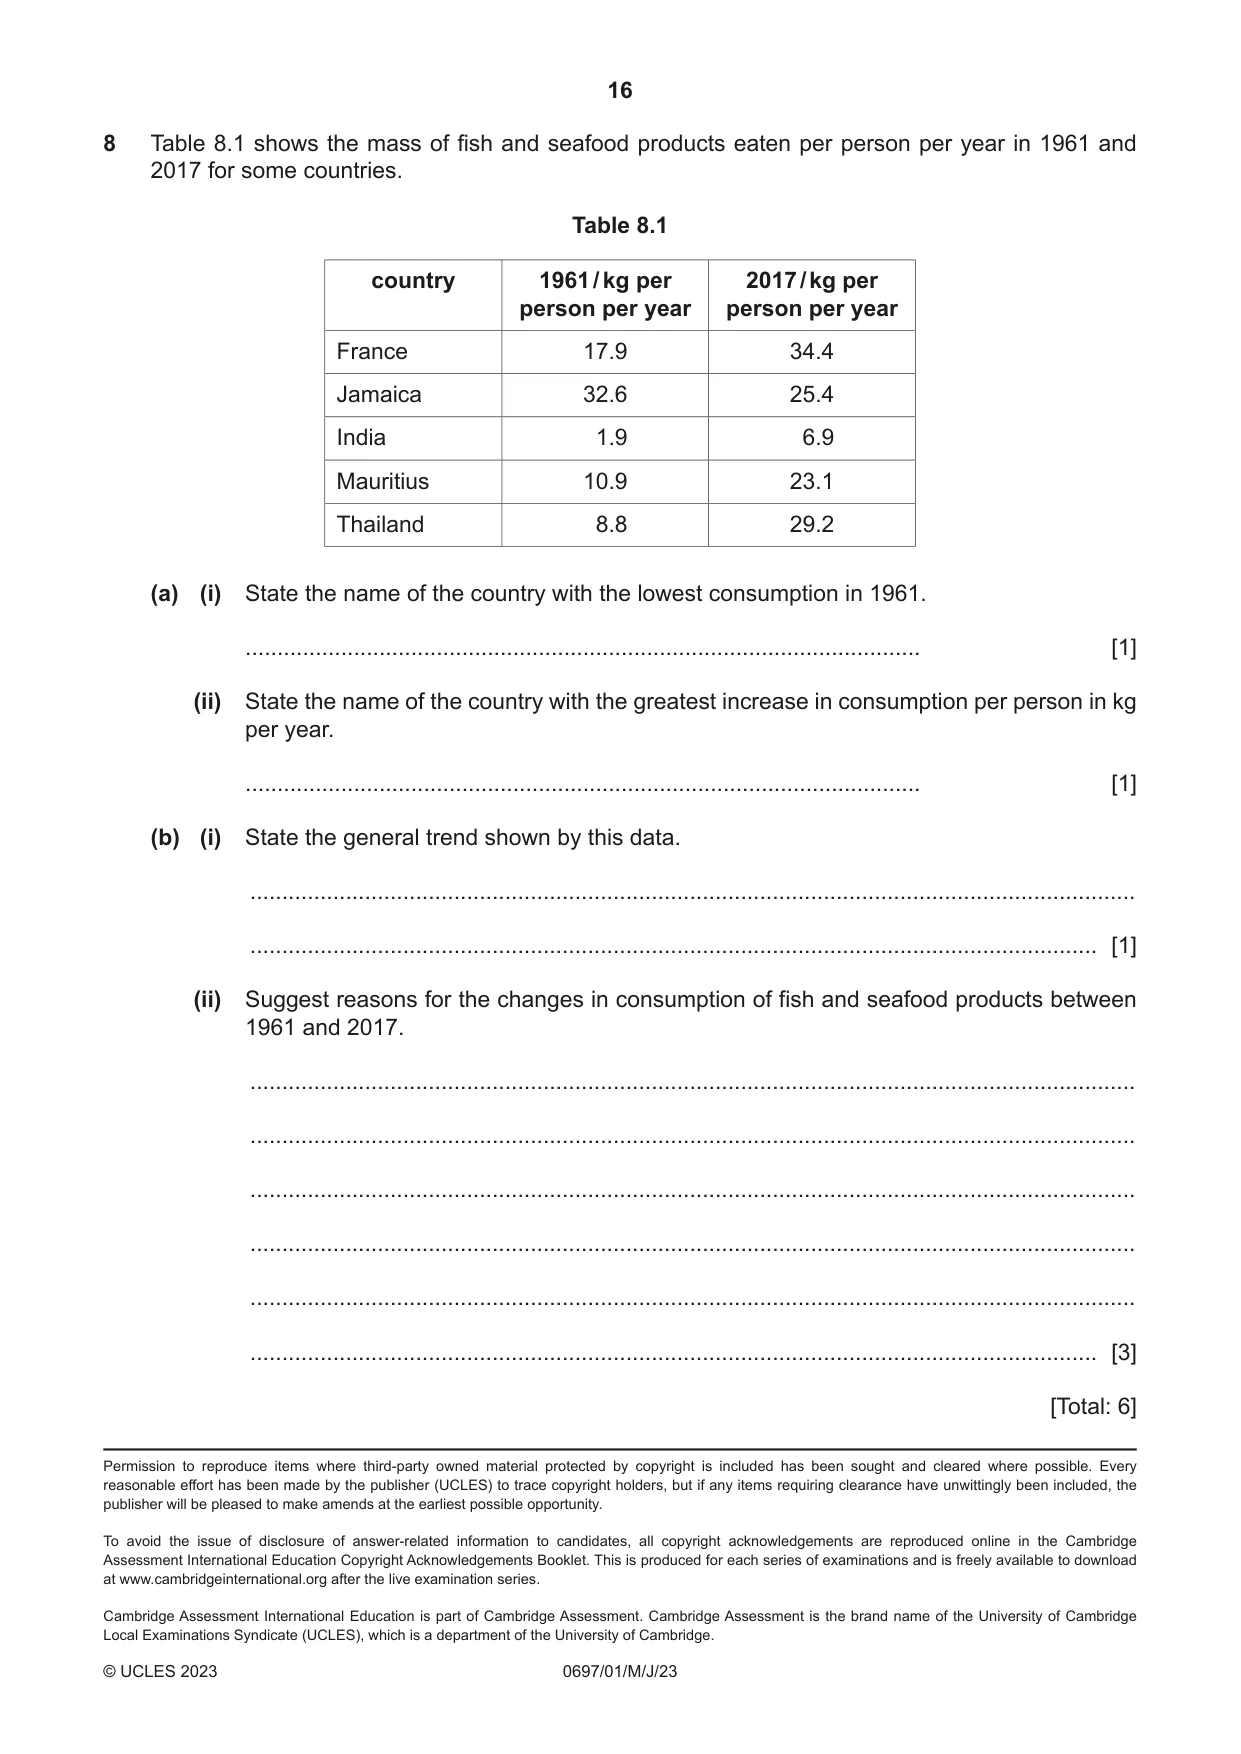
16 0697/01/M/J/23 © UCLES 2023 Permission to reproduce items where third‑party owned material protected by copyright is included has been sought and cleared where possible. Every reasonable effort has been made by the publisher (UCLES) to trace copyright holders, but if any items requiring clearance have unwittingly been included, the publisher will be pleased to make amends at the earliest possible opportunity. To avoid the issue of disclosure of answer‑related information to candidates, all copyright acknowledgements are reproduced online in the Cambridge Assessment International Education Copyright Acknowledgements Booklet. This is produced for each series of examinations and is freely available to download at www.cambridgeinternational.org after the live examination series. Cambridge Assessment International Education is part of Cambridge Assessment. Cambridge Assessment is the brand name of the University of Cambridge Local Examinations Syndicate (UCLES), which is a department of the University of Cambridge. 8 Table 8.1 shows the mass of fish and seafood products eaten per person per year in 1961 and 2017 for some countries. Table 8.1 country 1961 / kg per person per year 2017 / kg per person per year France 17.9 34.4 Jamaica 32.6 25.4 India 1.9 6.9 Mauritius 10.9 23.1 Thailand 8.8 29.2 (a) (i) State the name of the country with the lowest consumption in 1961. … [1] (ii) State the name of the country with the greatest increase in consumption per person in kg per year. … [1] (b) (i) State the general trend shown by this data. … … [1] (ii) Suggest reasons for the changes in consumption of fish and seafood products between 1961 and 2017. … … … … … … [3] [Total: 6]
What you needed in this session
Cambridge’s own grade thresholds for 2023 May/June, Paper 1 · Variant 0. A higher threshold means an easier paper — the bar moves with how the cohort did.