Cambridge IGCSE Geography (9-1) 0976 — 2021 May/June Paper 2 · Variant 2
0976/22/M/J/21 · 6 questions · 60 marks · ≈68 min
The question paper and its mark scheme, free to read here and free to download. This is Cambridge’s own paper, exactly as it was sat.
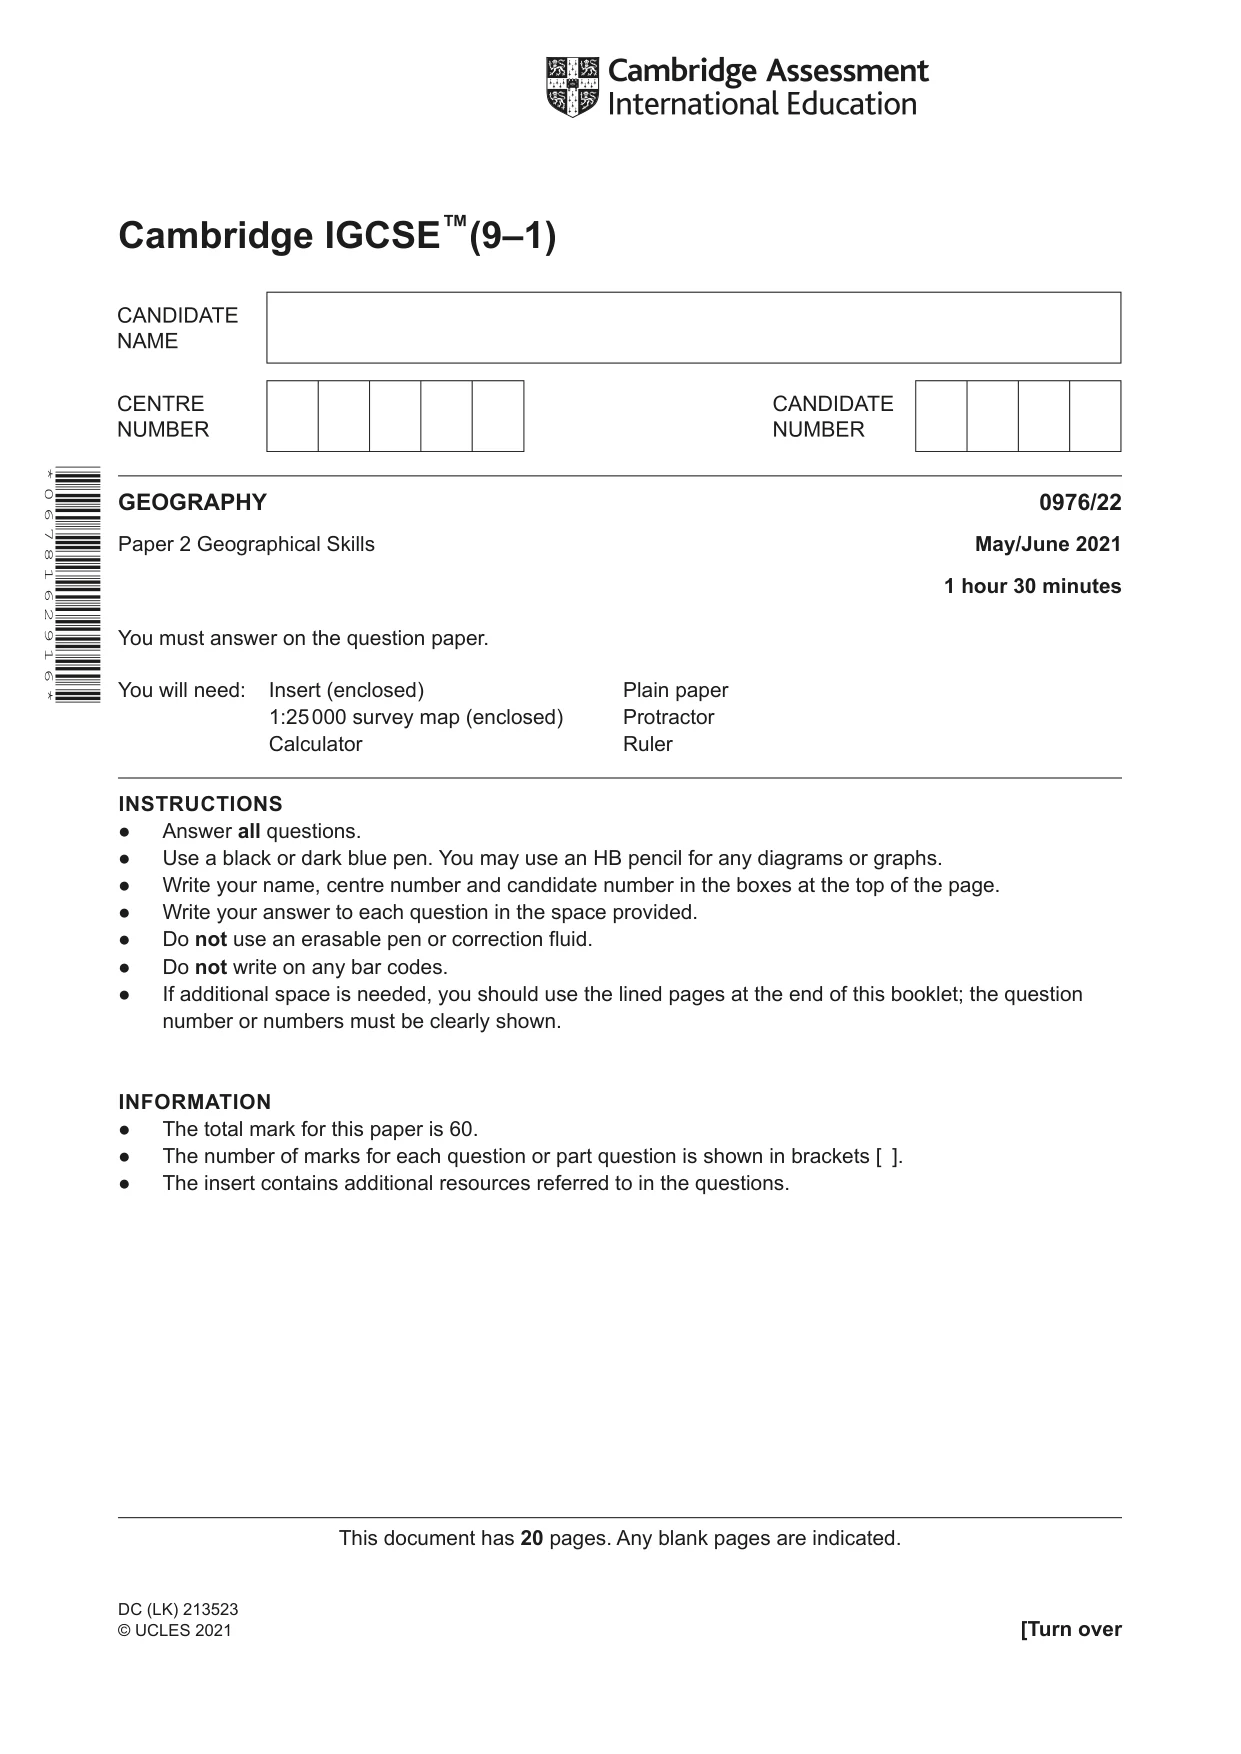
Question paper20 pages

Mark scheme6 pages
Answers below. Sit the paper first if you are practising.
Questions as text
Q1 · Study the map extract for Carnac, France
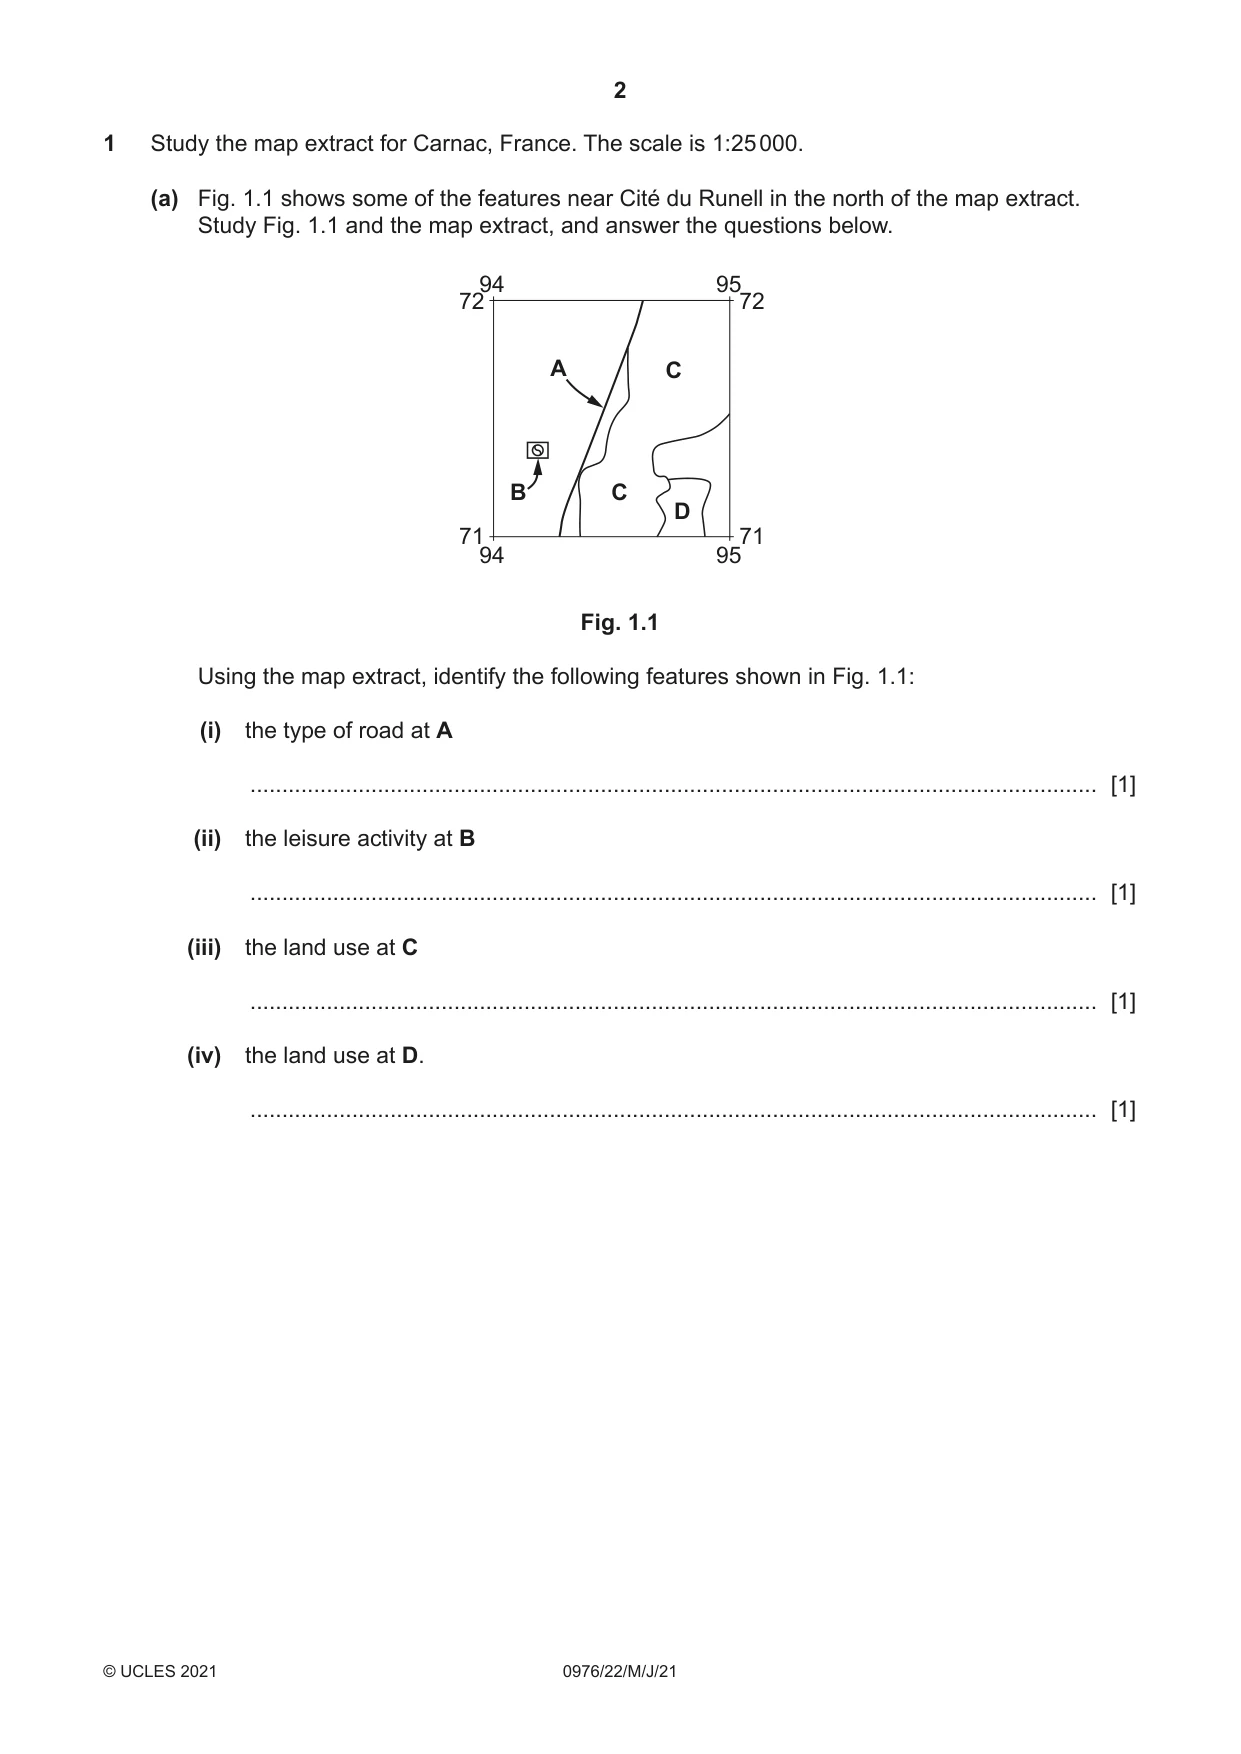
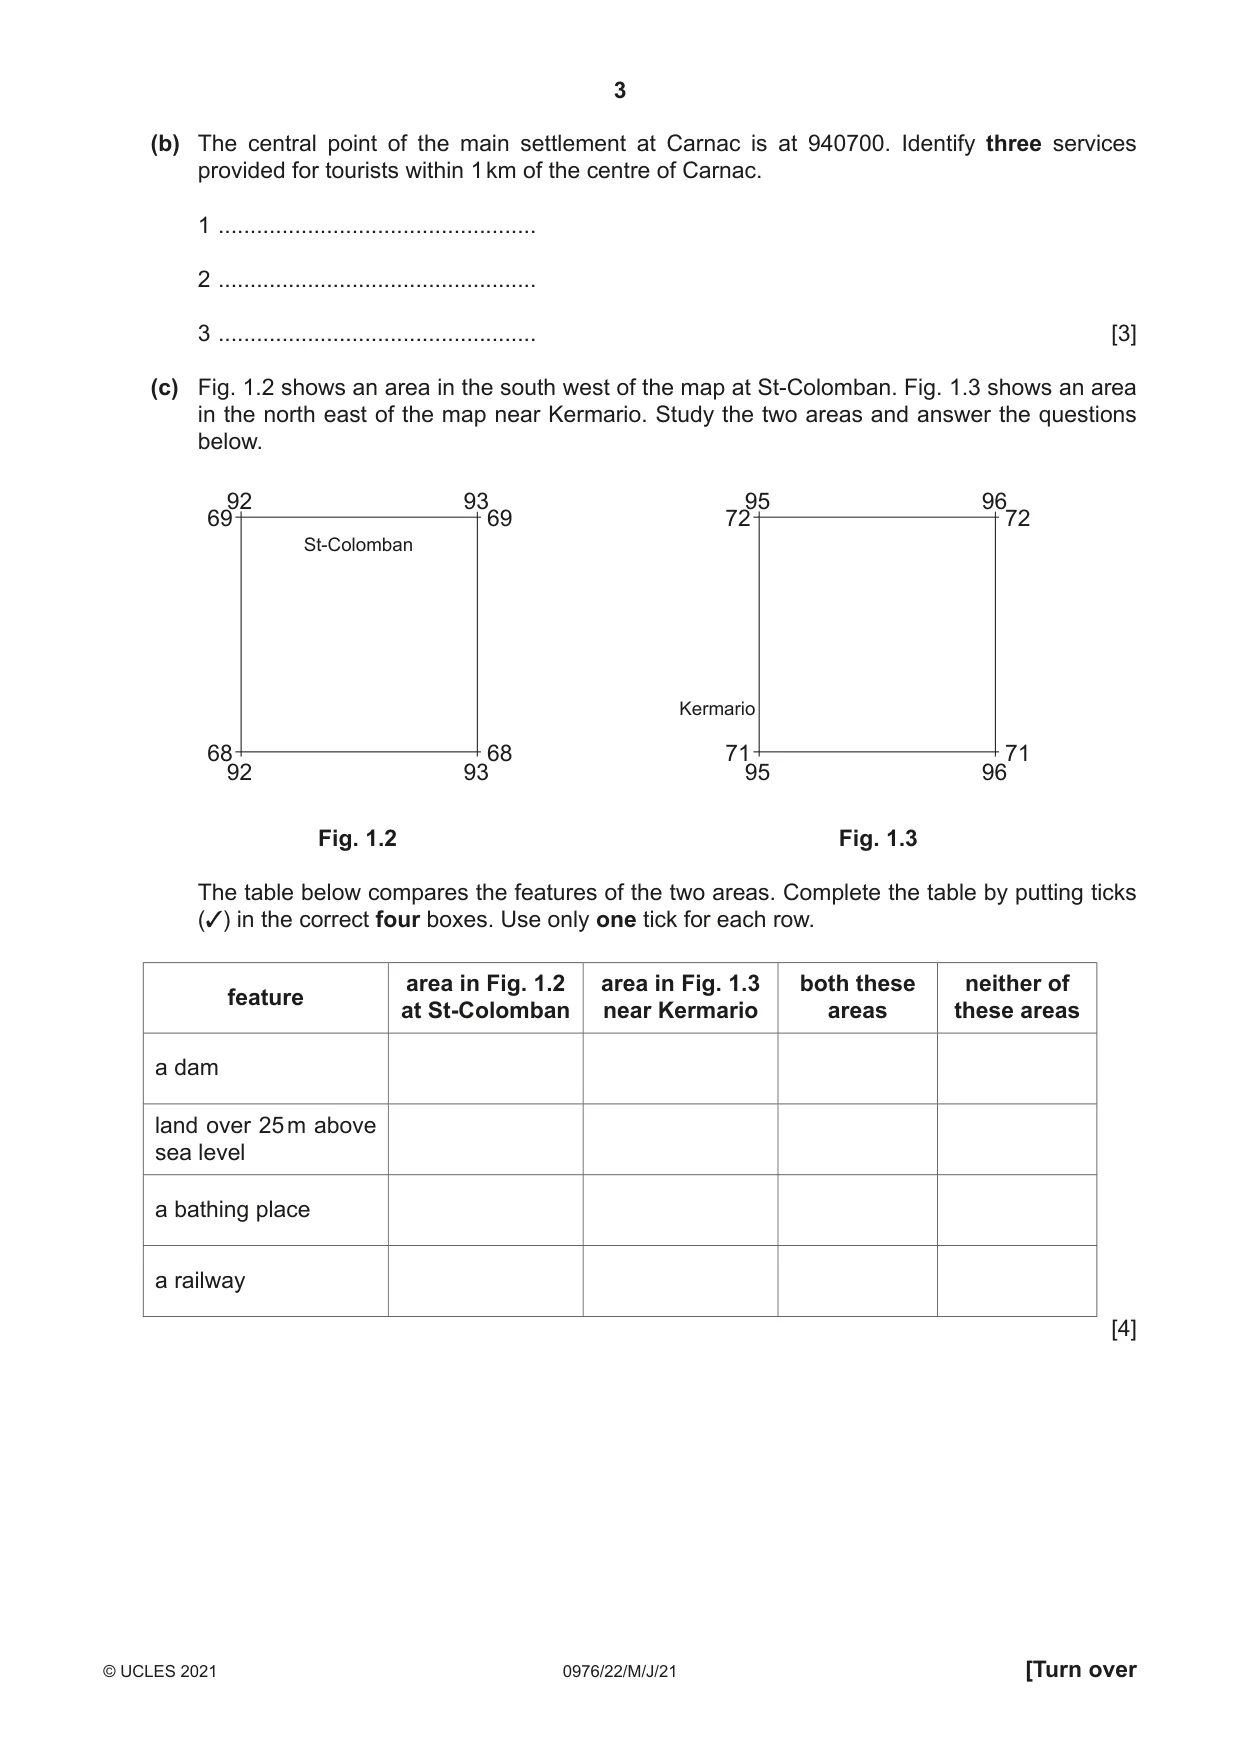
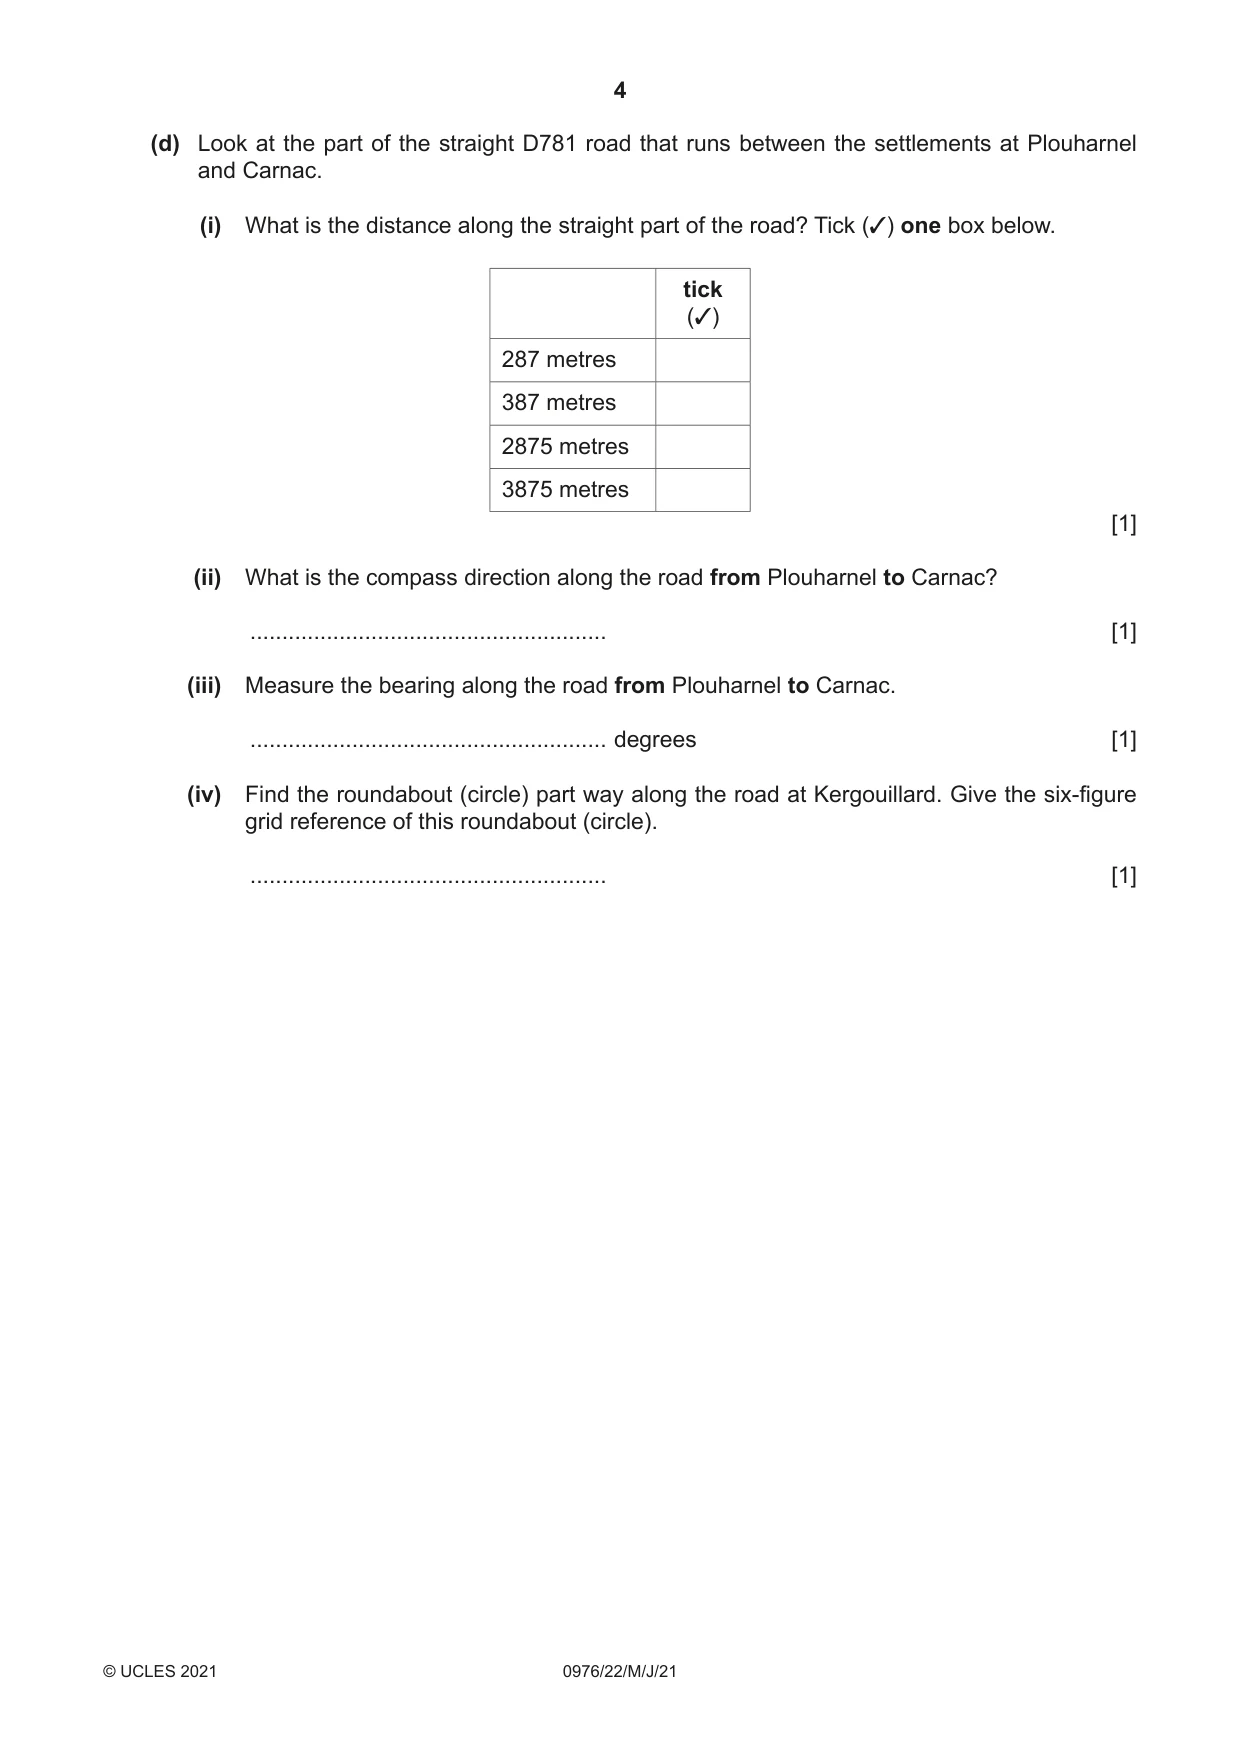
1 Study the map extract for Carnac, France. The scale is 1:25 000. (a) Fig. 1.1 shows some of the features near Cité du Runell in the north of the map extract. Study Fig. 1.1 and the map extract, and answer the questions below. 94 95 72 72 A C B C D 71 71 94 95 Fig. 1.1 Using the map extract, identify the following features shown in Fig. 1.1: (i) the type of road at A ..................................................................................................................................... [1] (ii) the leisure activity at B ..................................................................................................................................... [1] (iii) the land use at C ..................................................................................................................................... [1] (iv) the land use at D. ..................................................................................................................................... [1] (b) The central point of the main settlement at Carnac is at 940700. Identify three services provided for tourists within 1 km of the centre of Carnac. 1 .................................................. 2 .................................................. 3 .................................................. [3] (c) Fig. 1.2 shows an area in the south west of the map at St-Colomban. Fig. 1.3 shows an area in the north east of the map near Kermario. Study the two areas and answer the questions below. 92 93 95 96 69 69 72 72 St-Colomban Kermario 68 68 71 71 92 93 95 96 Fig. 1.2 Fig. 1.3 The table below compares the features of the two areas. Complete the table by putting ticks (✓) in the correct four boxes. Use only one tick for each row. area in Fig. 1.2 area in Fig. 1.3 both these neither of feature at St-Colomban near Kermario areas these areas a dam land over 25 m above sea level a bathing place a railway [4] (d) Look at the part of the straight D781 road that runs between the settlements at Plouharnel and Carnac. (i) What is the distance along the straight part of the road? Tick (✓) one box below. tick (✓) 287 metres 387 metres 2875 metres 3875 metres [1] (ii) What is the compass direction along the road from Plouharnel to Carnac? ........................................................ [1] (iii) Measure the bearing along the road from Plouharnel to Carnac. ........................................................ degrees [1] (iv) Find the roundabout (circle) part way along the road at Kergouillard. Give the six-figure grid reference of this roundabout (circle). ........................................................ [1] (e) Describe the natural features of the coast shown on the map. ................................................................................................................................................... ................................................................................................................................................... ................................................................................................................................................... ................................................................................................................................................... ................................................................................................................................................... ................................................................................................................................................... ................................................................................................................................................... ................................................................................................................................................... ................................................................................................................................................... ............................................................................................................................................. [5] [Total: 20]
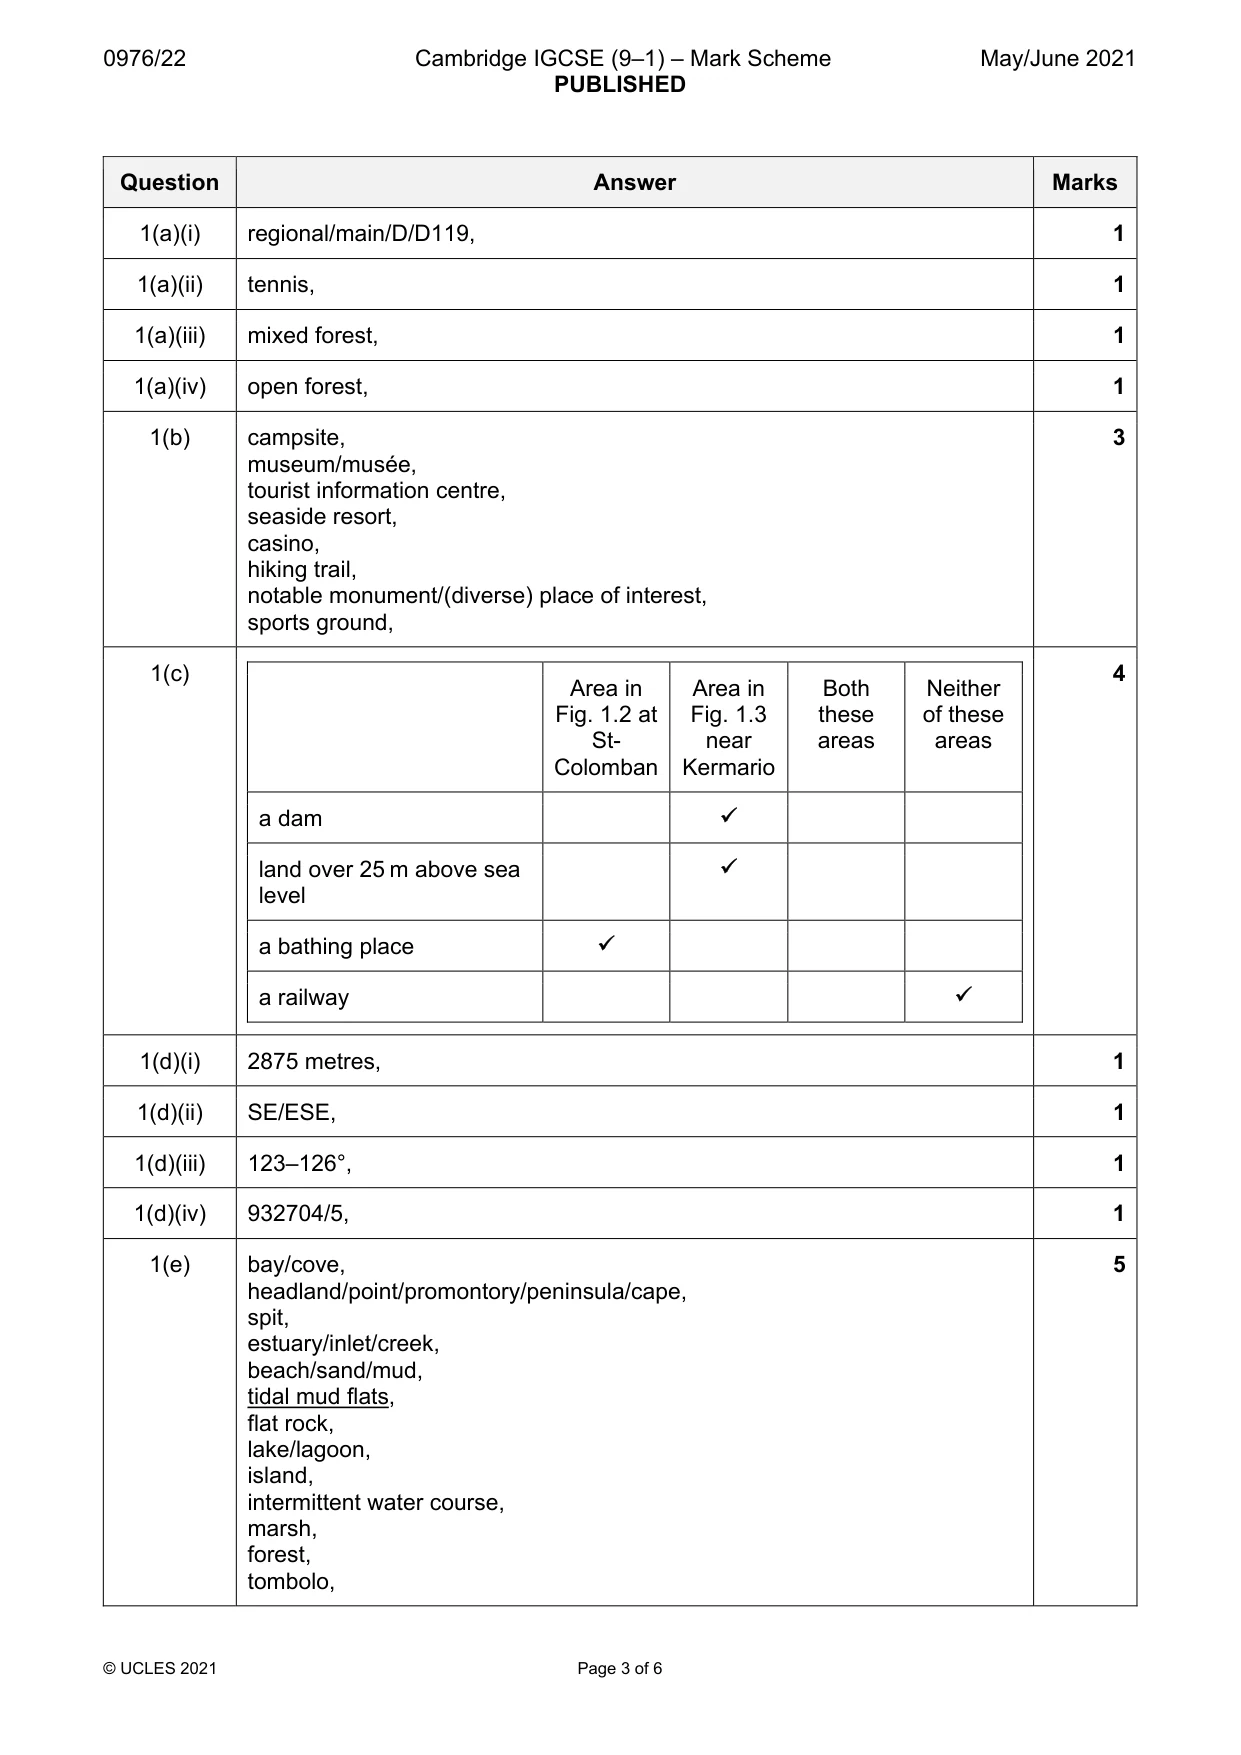
Mark scheme: Question Answer Marks 1(a)(i) regional/main/D/D119, 1 1(a)(ii) tennis, 1 1(a)(iii) mixed forest, 1 1(a)(iv) open forest, 1 1(b) campsite, 3 museum/musée, tourist information centre, seaside resort, casino, hiking trail, notable monument/(diverse) place of interest, sports ground, 1(c) 4 Area in Area in Both Neither Fig. 1.2 at Fig. 1.3 these of these St- near areas areas Colomban Kermario a dam land over 25 m above sea level a bathing place a railway 1(d)(i) 2875 metres, 1 1(d)(ii) SE/ESE, 1 1(d)(iii) 123–126°, 1 1(d)(iv) 932704/5, 1 1(e) bay/cove, 5 headland/point/promontory/peninsula/cape, spit, estuary/inlet/creek, beach/sand/mud, tidal mud flats, flat rock, lake/lagoon, island, intermittent water course, marsh, forest, tombolo,
Q2 · The population distribution of South America
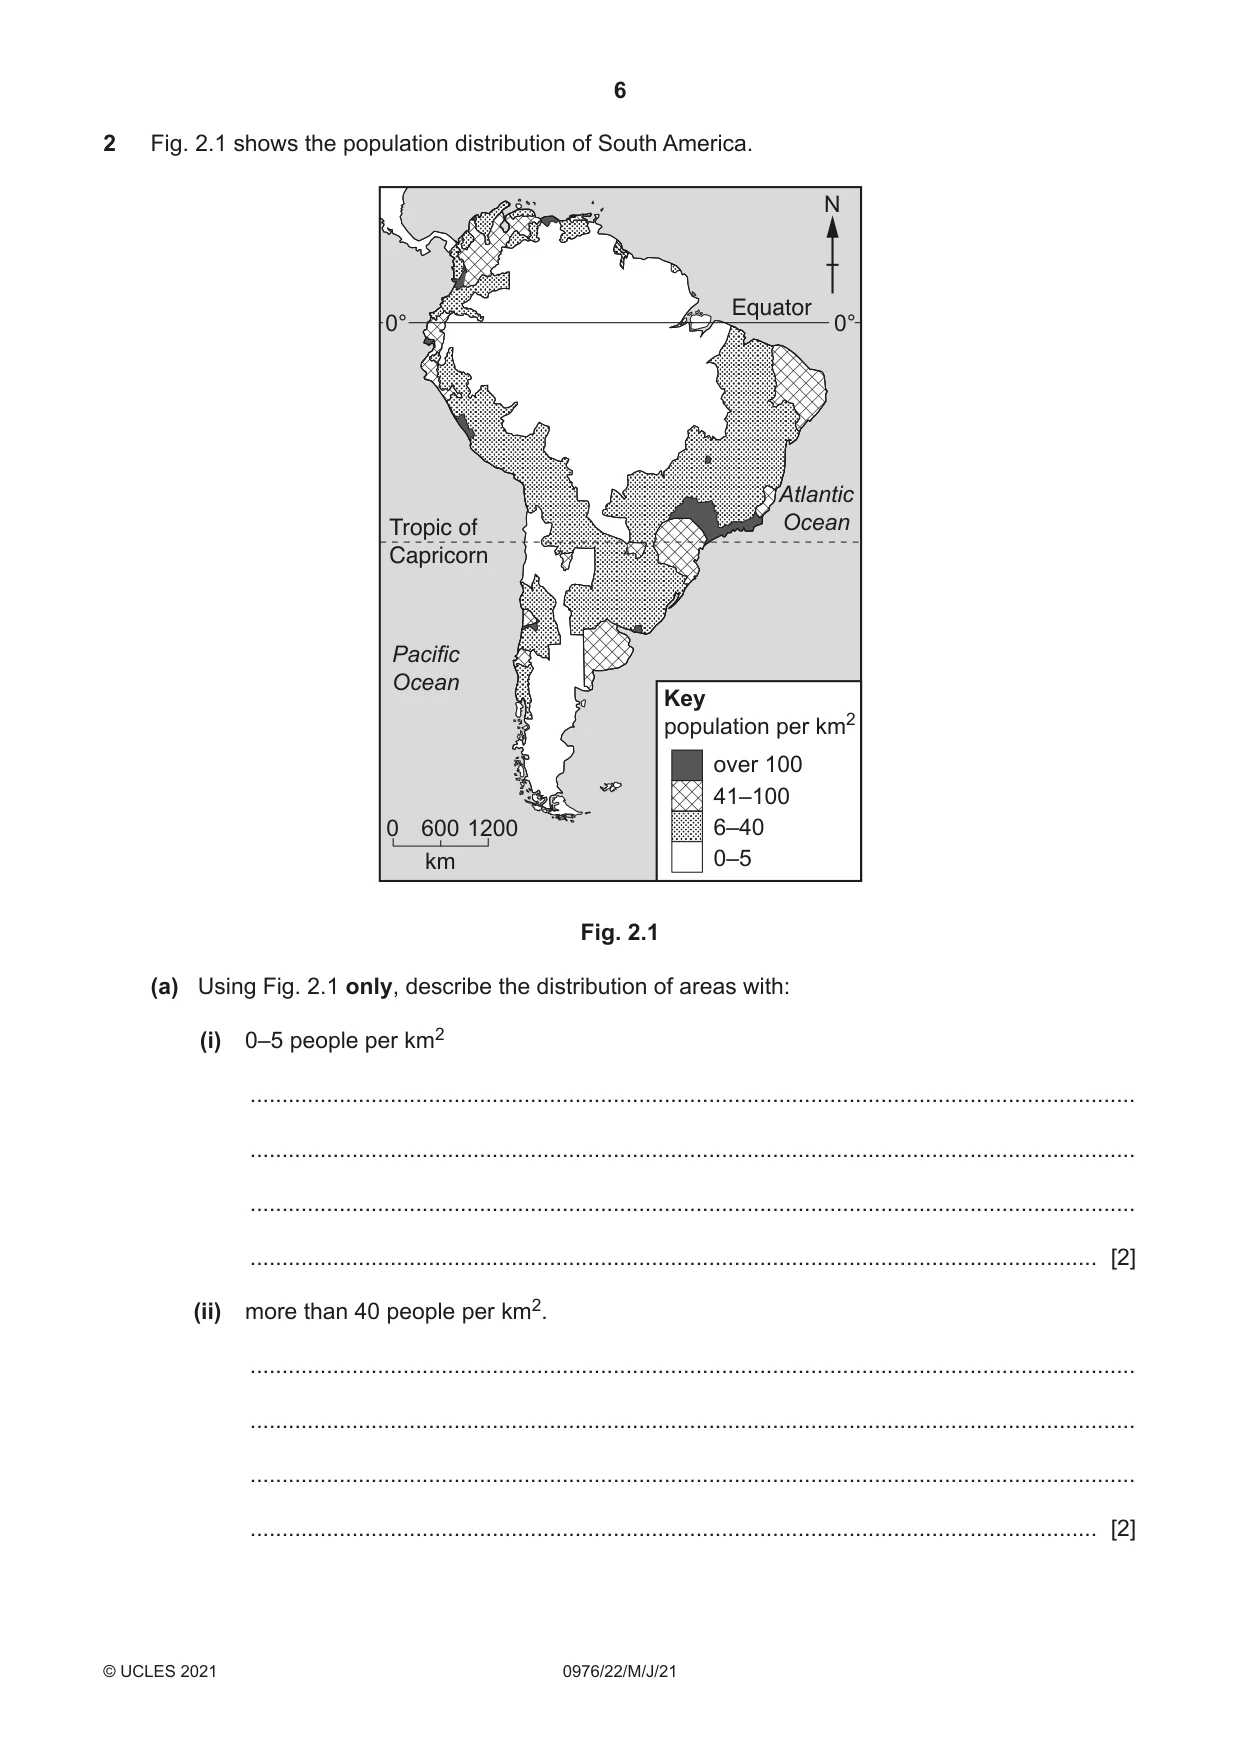
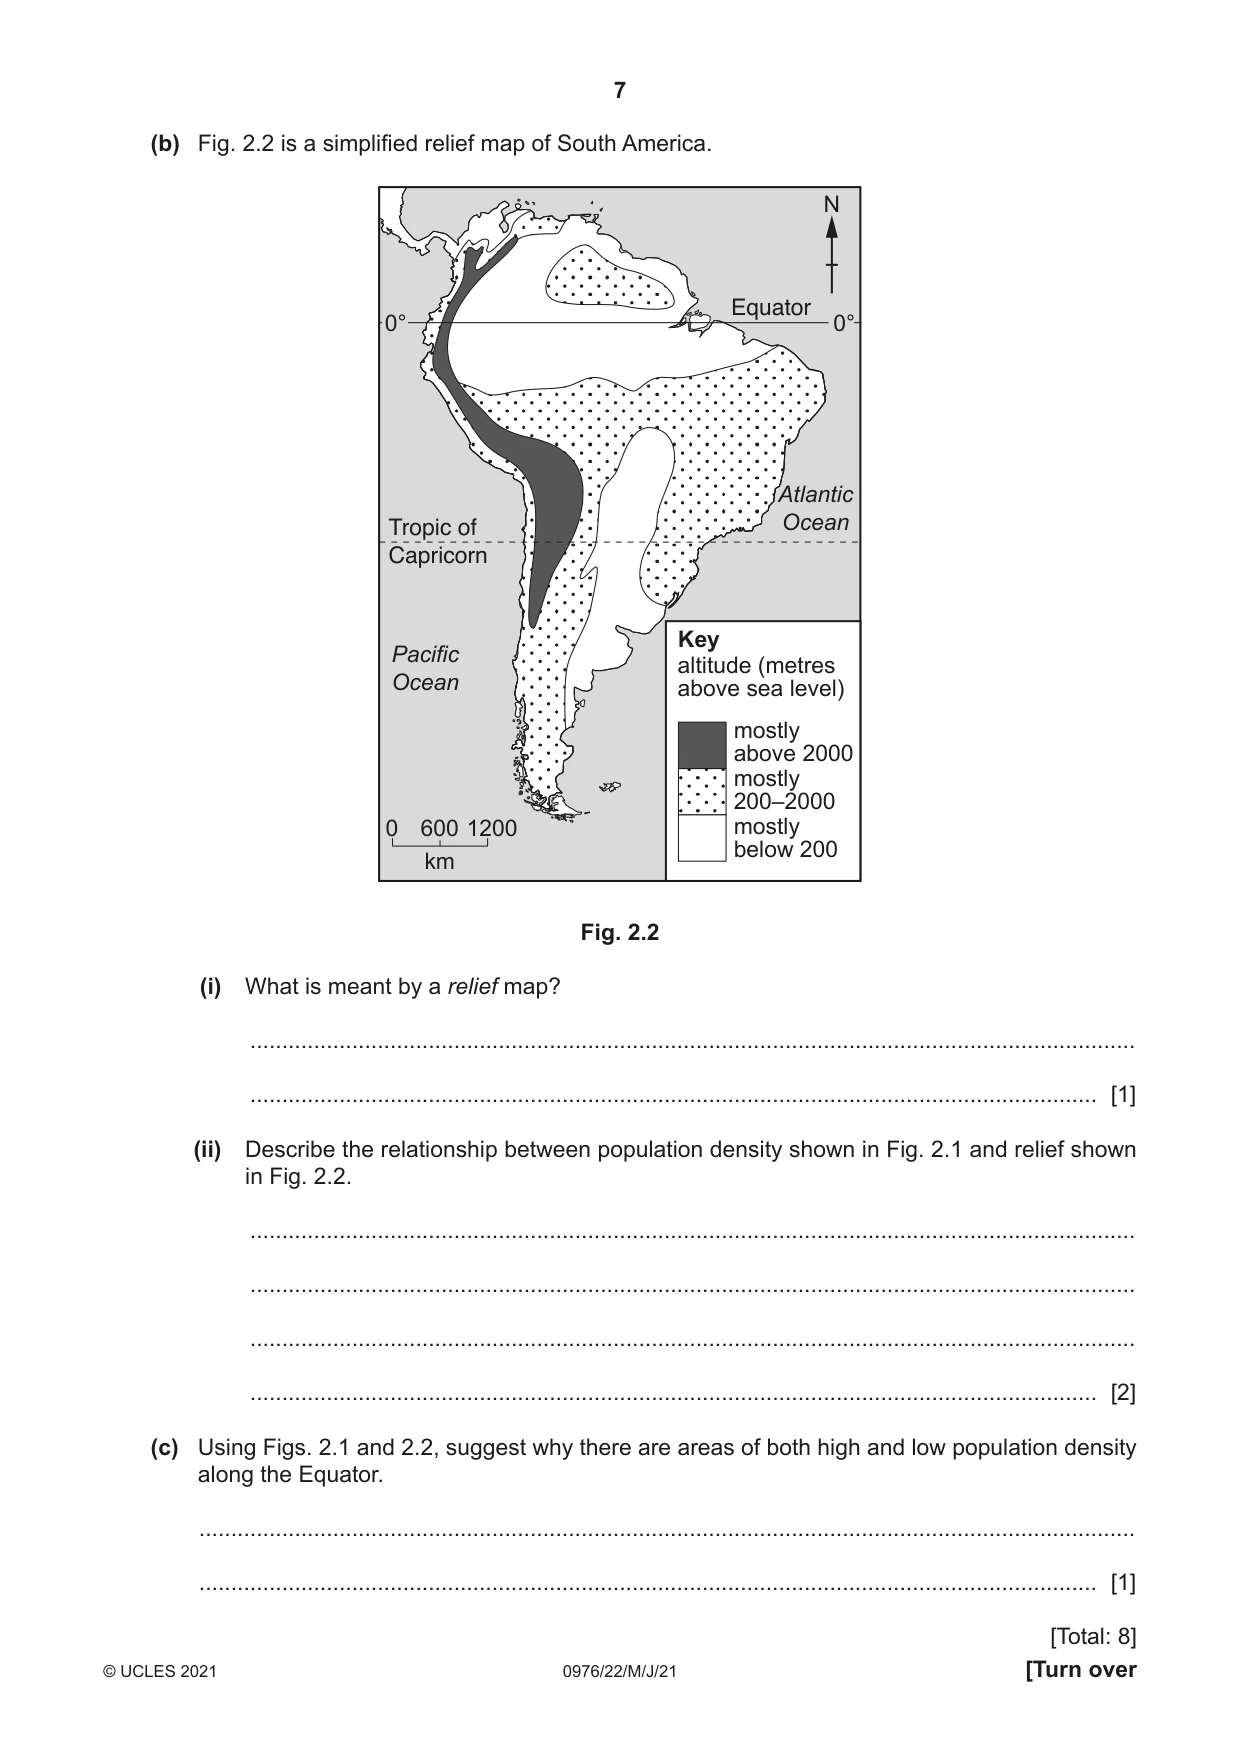
2 Fig. 2.1 shows the population distribution of South America. N Equator 0° 0° Atlantic Tropic of Ocean Capricorn Pacific Ocean Key population per km2 over 100 41–100 0 600 1200 6–40 km 0–5 Fig. 2.1 (a) Using Fig. 2.1 only, describe the distribution of areas with: (i) 0–5 people per km2 ........................................................................................................................................... ........................................................................................................................................... ........................................................................................................................................... ..................................................................................................................................... [2] (ii) more than 40 people per km2. ........................................................................................................................................... ........................................................................................................................................... ........................................................................................................................................... ..................................................................................................................................... [2] (b) Fig. 2.2 is a simplified relief map of South America. N Equator 0° 0° Atlantic Tropic of Ocean Capricorn Key Pacific altitude (metres Ocean above sea level) mostly above 2000 mostly 200–2000 0 600 1200 mostly below 200 km Fig. 2.2 (i) What is meant by a relief map? ........................................................................................................................................... ..................................................................................................................................... [1] (ii) Describe the relationship between population density shown in Fig. 2.1 and relief shown in Fig. 2.2. ........................................................................................................................................... ........................................................................................................................................... ........................................................................................................................................... ..................................................................................................................................... [2] (c) Using Figs. 2.1 and 2.2, suggest why there are areas of both high and low population density along the Equator. ................................................................................................................................................... ............................................................................................................................................. [1] [Total: 8]
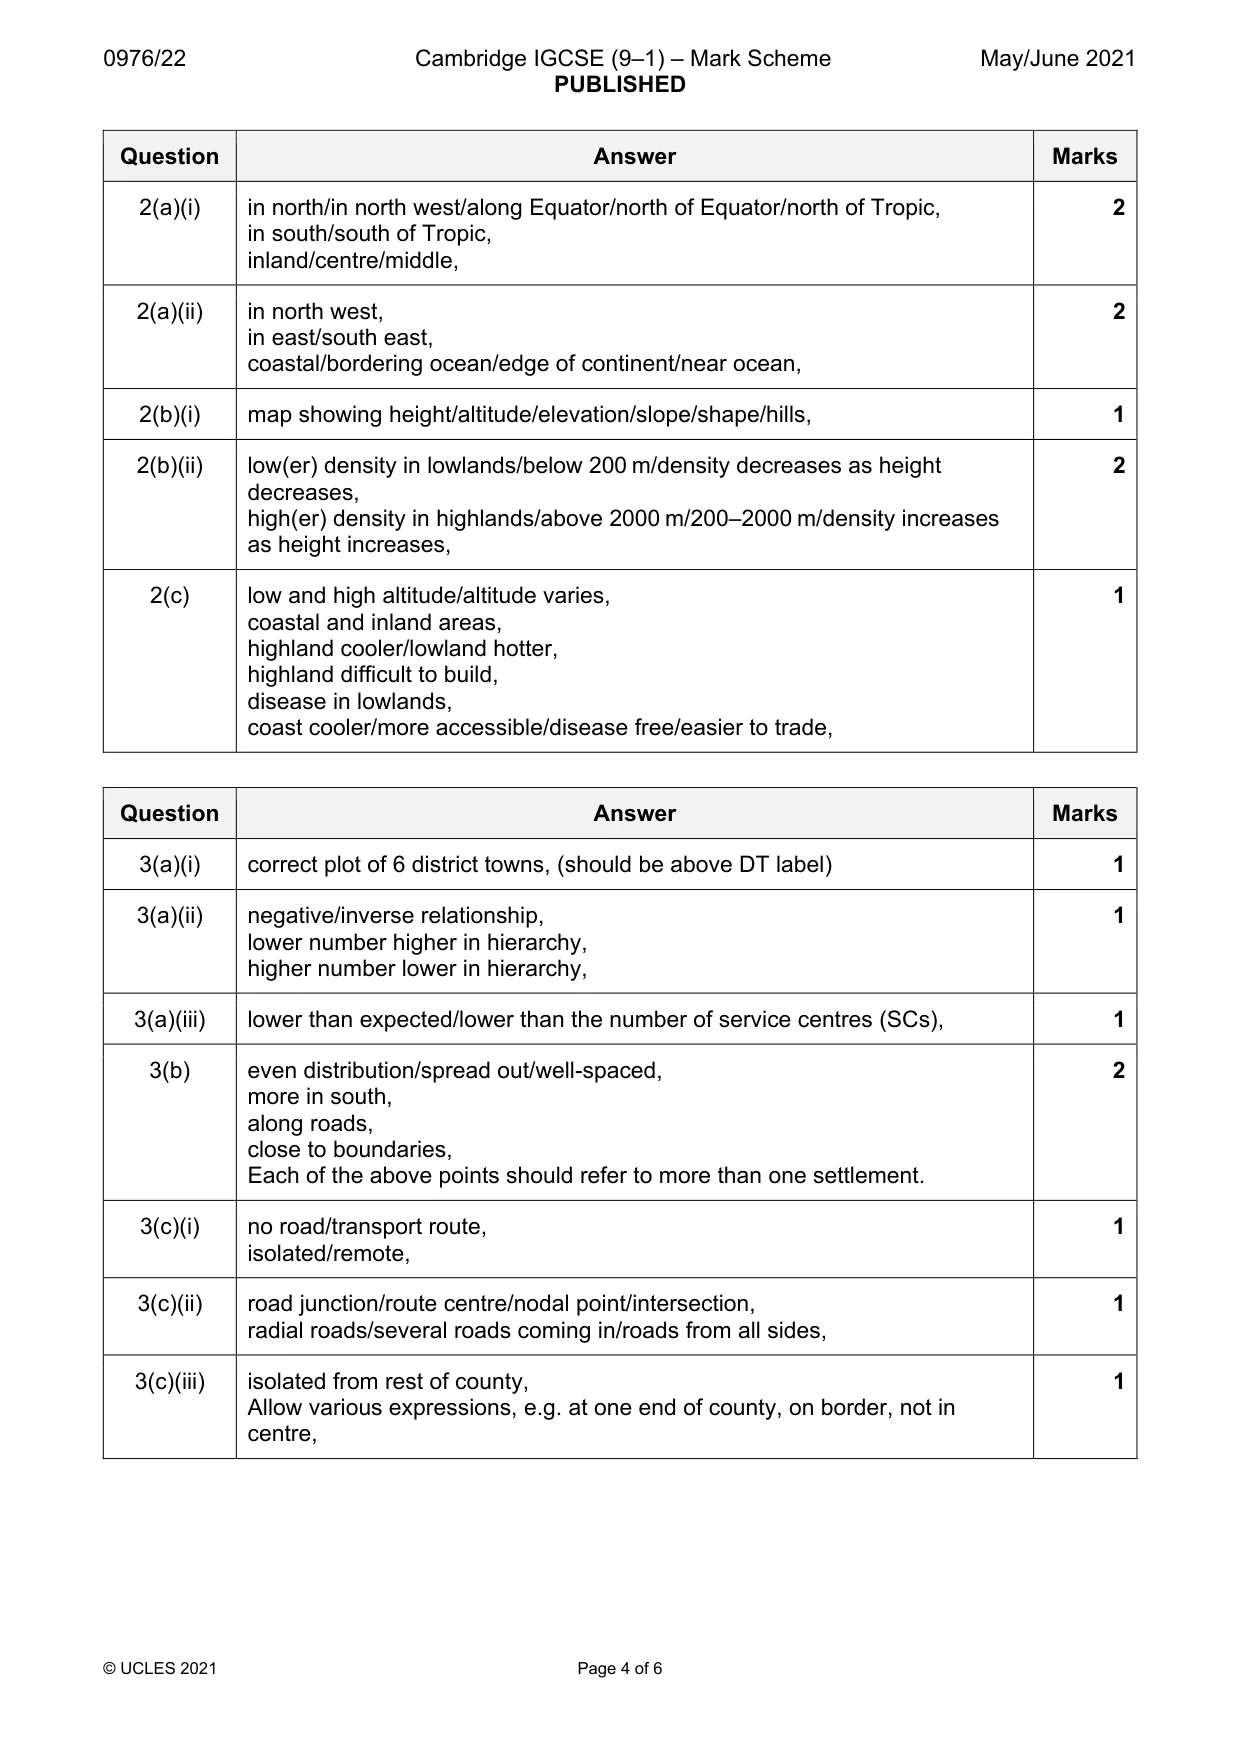
Mark scheme: 2(a)(i) in north/in north west/along Equator/north of Equator/north of Tropic, 2 in south/south of Tropic, inland/centre/middle, 2(a)(ii) in north west, 2 in east/south east, coastal/bordering ocean/edge of continent/near ocean, 2(b)(i) map showing height/altitude/elevation/slope/shape/hills, 1 2(b)(ii) low(er) density in lowlands/below 200 m/density decreases as height 2 decreases, high(er) density in highlands/above 2000 m/200–2000 m/density increases as height increases, 2(c) low and high altitude/altitude varies, 1 coastal and inland areas, highland cooler/lowland hotter, highland difficult to build, disease in lowlands, coast cooler/more accessible/disease free/easier to trade,
Q3 · The settlement hierarchy in County Tipperary, Ireland
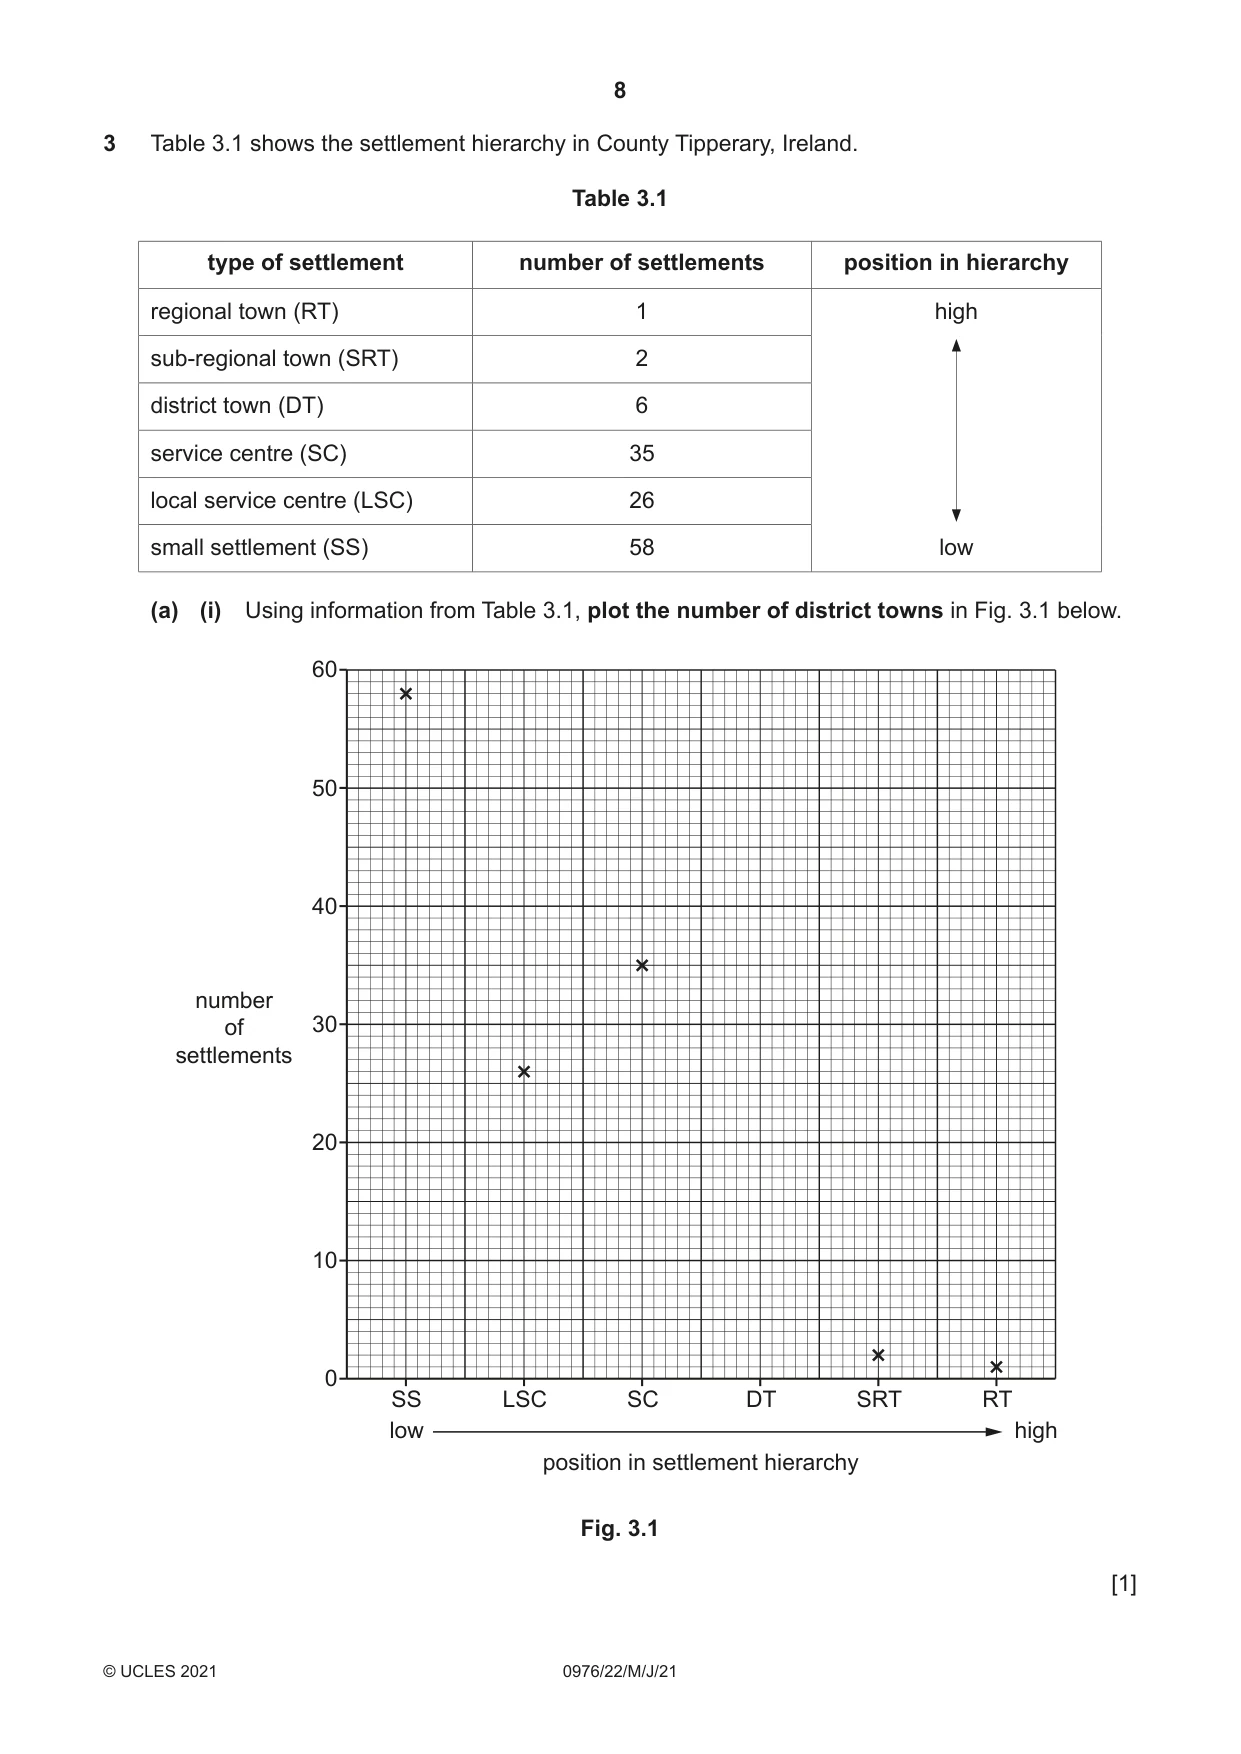
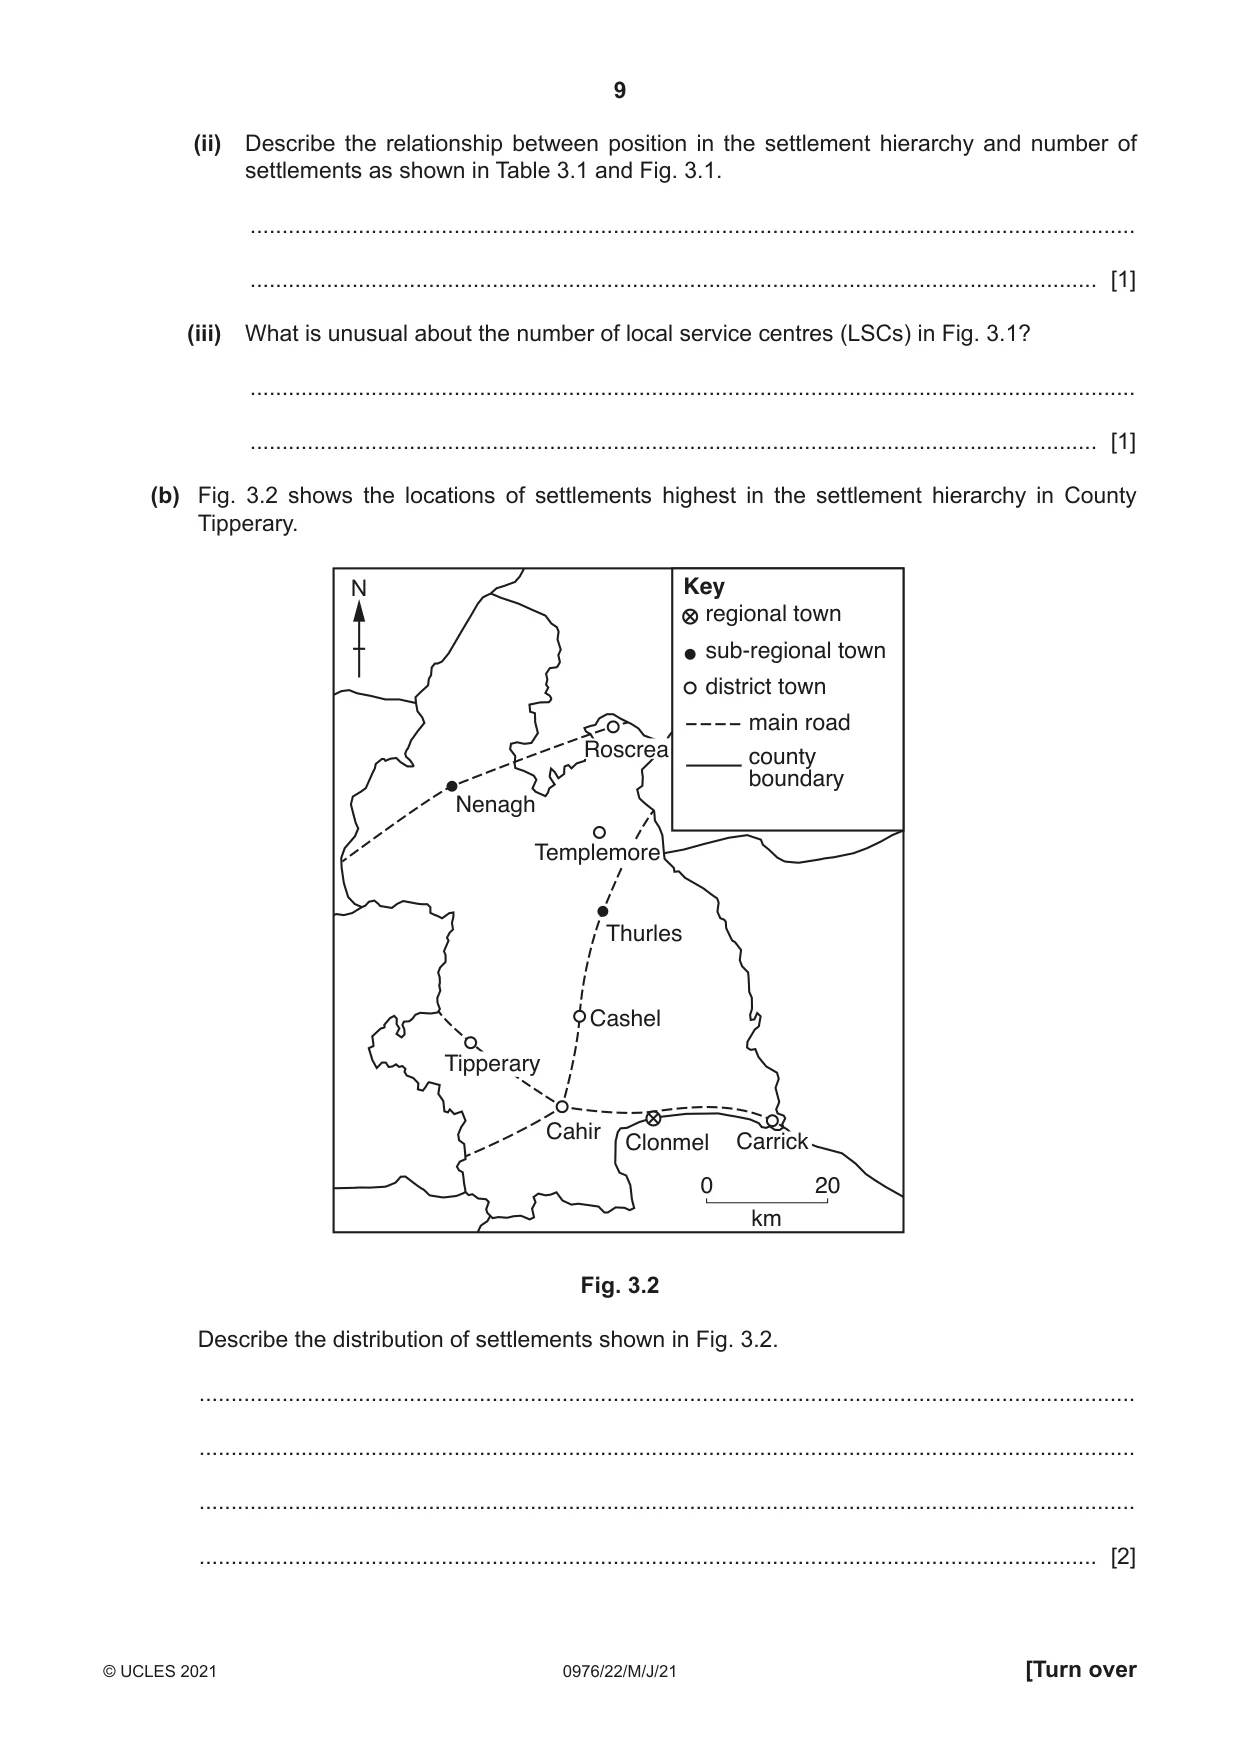
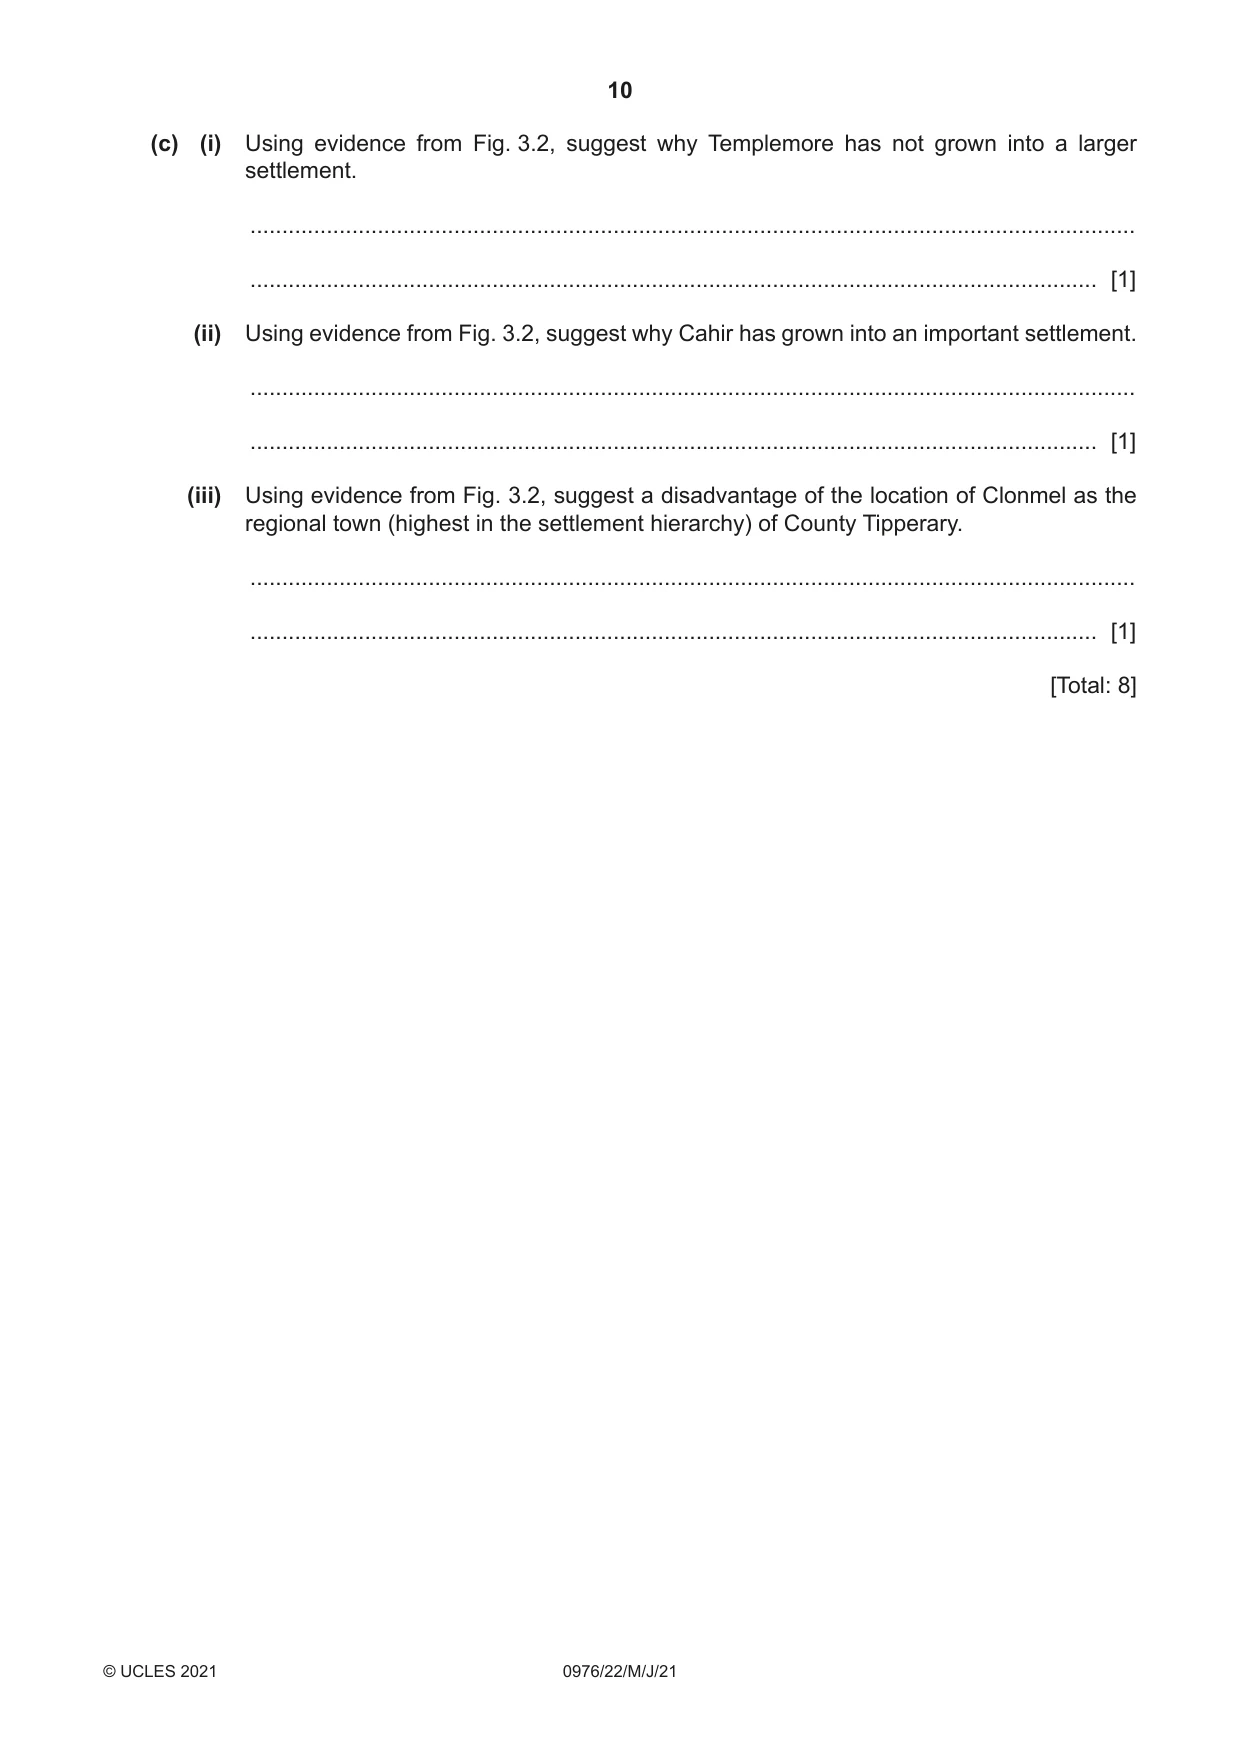
3 Table 3.1 shows the settlement hierarchy in County Tipperary, Ireland. Table 3.1 type of settlement number of settlements position in hierarchy regional town (RT) 1 high sub-regional town (SRT) 2 district town (DT) 6 service centre (SC) 35 local service centre (LSC) 26 small settlement (SS) 58 low (a) (i) Using information from Table 3.1, plot the number of district towns in Fig. 3.1 below. 60 50 40 number of 30 settlements 20 10 0 SS LSC SC DT SRT RT low high position in settlement hierarchy Fig. 3.1 [1] (ii) Describe the relationship between position in the settlement hierarchy and number of settlements as shown in Table 3.1 and Fig. 3.1. ........................................................................................................................................... ..................................................................................................................................... [1] (iii) What is unusual about the number of local service centres (LSCs) in Fig. 3.1? ........................................................................................................................................... ..................................................................................................................................... [1] (b) Fig. 3.2 shows the locations of settlements highest in the settlement hierarchy in County Tipperary. N Key regional town sub-regional town district town main road Roscrea county boundary Nenagh Templemore Thurles Cashel Tipperary Cahir Clonmel Carrick 0 20 km Fig. 3.2 Describe the distribution of settlements shown in Fig. 3.2. ................................................................................................................................................... ................................................................................................................................................... ................................................................................................................................................... ............................................................................................................................................. [2] (c) (i) Using evidence from Fig. 3.2, suggest why Templemore has not grown into a larger settlement. ........................................................................................................................................... ..................................................................................................................................... [1] (ii) Using evidence from Fig. 3.2, suggest why Cahir has grown into an important settlement. ........................................................................................................................................... ..................................................................................................................................... [1] (iii) Using evidence from Fig. 3.2, suggest a disadvantage of the location of Clonmel as the regional town (highest in the settlement hierarchy) of County Tipperary. ........................................................................................................................................... ..................................................................................................................................... [1] [Total: 8]
Mark scheme: 3(a)(i) correct plot of 6 district towns, (should be above DT label) 1 3(a)(ii) negative/inverse relationship, 1 lower number higher in hierarchy, higher number lower in hierarchy, 3(a)(iii) lower than expected/lower than the number of service centres (SCs), 1 3(b) even distribution/spread out/well-spaced, 2 more in south, along roads, close to boundaries, Each of the above points should refer to more than one settlement. 3(c)(i) no road/transport route, 1 isolated/remote, 3(c)(ii) road junction/route centre/nodal point/intersection, 1 radial roads/several roads coming in/roads from all sides, 3(c)(iii) isolated from rest of county, 1 Allow various expressions, e.g. at one end of county, on border, not in centre,
More questions on Settlements (rural and urban) and service provision
Question 4
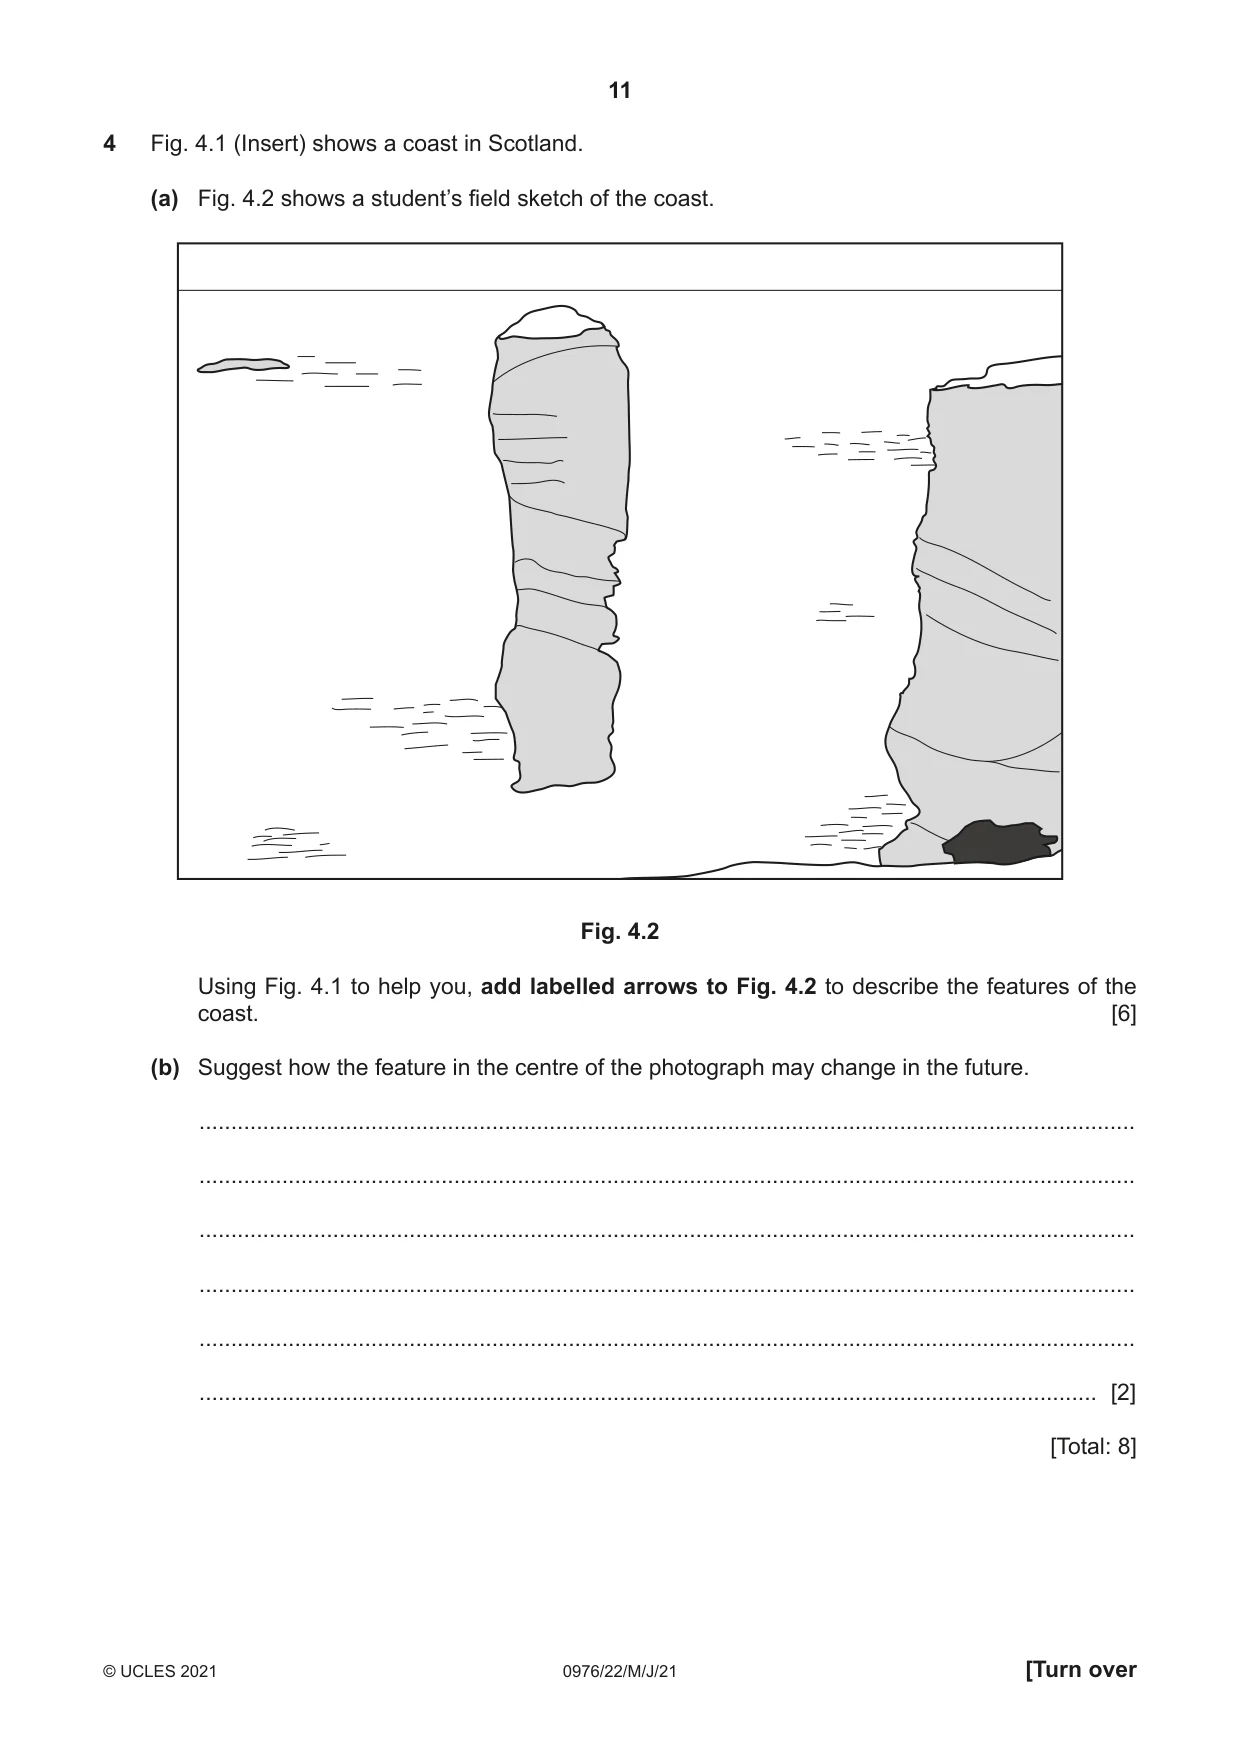
4 Fig. 4.1 (Insert) shows a coast in Scotland. (a) Fig. 4.2 shows a student’s field sketch of the coast. Fig. 4.2 Using Fig. 4.1 to help you, add labelled arrows to Fig. 4.2 to describe the features of the coast. [6] (b) Suggest how the feature in the centre of the photograph may change in the future. ................................................................................................................................................... ................................................................................................................................................... ................................................................................................................................................... ................................................................................................................................................... ................................................................................................................................................... ............................................................................................................................................. [2] [Total: 8]
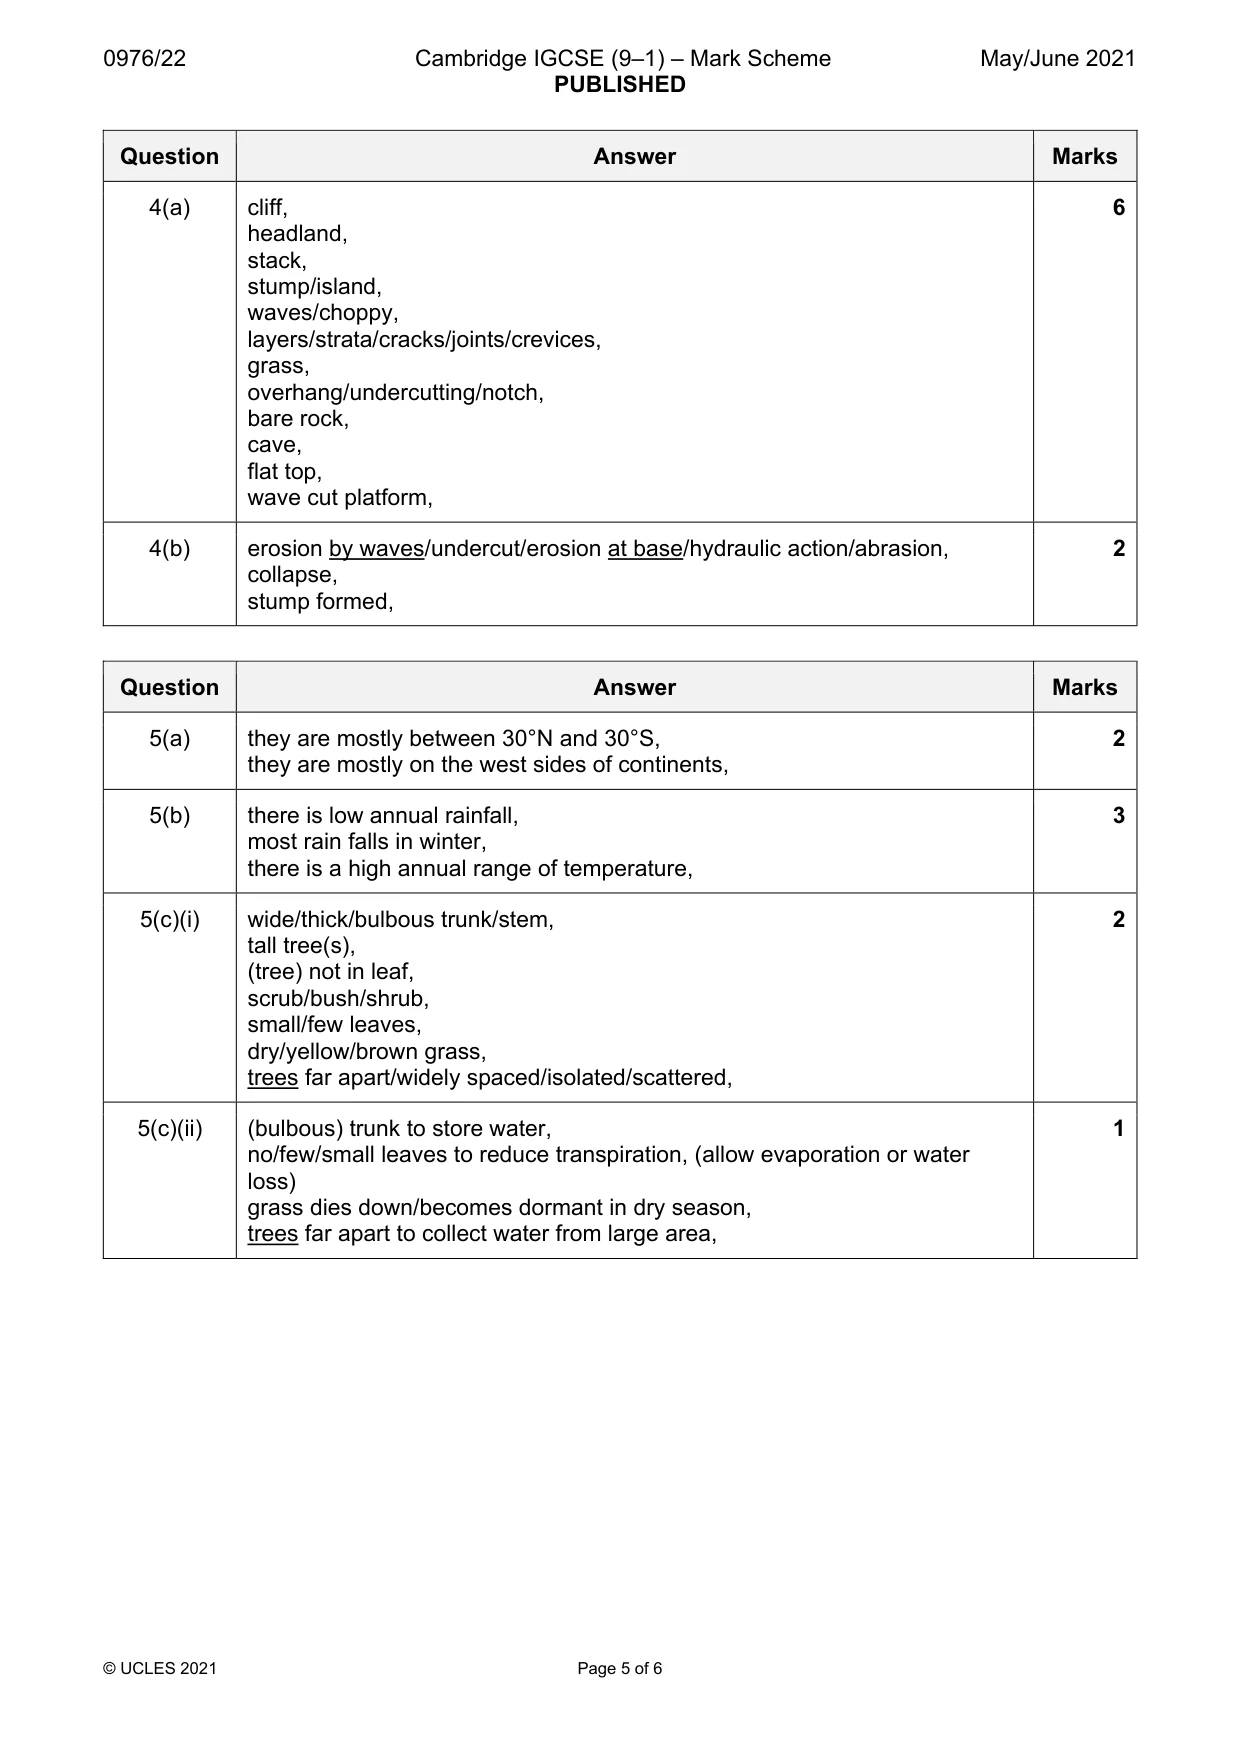
Mark scheme: 4(a) cliff, 6 headland, stack, stump/island, waves/choppy, layers/strata/cracks/joints/crevices, grass, overhang/undercutting/notch, bare rock, cave, flat top, wave cut platform, 4(b) erosion by waves/undercut/erosion at base/hydraulic action/abrasion, 2 collapse, stump formed,
Q5 · The world distribution of areas of hot desert climate
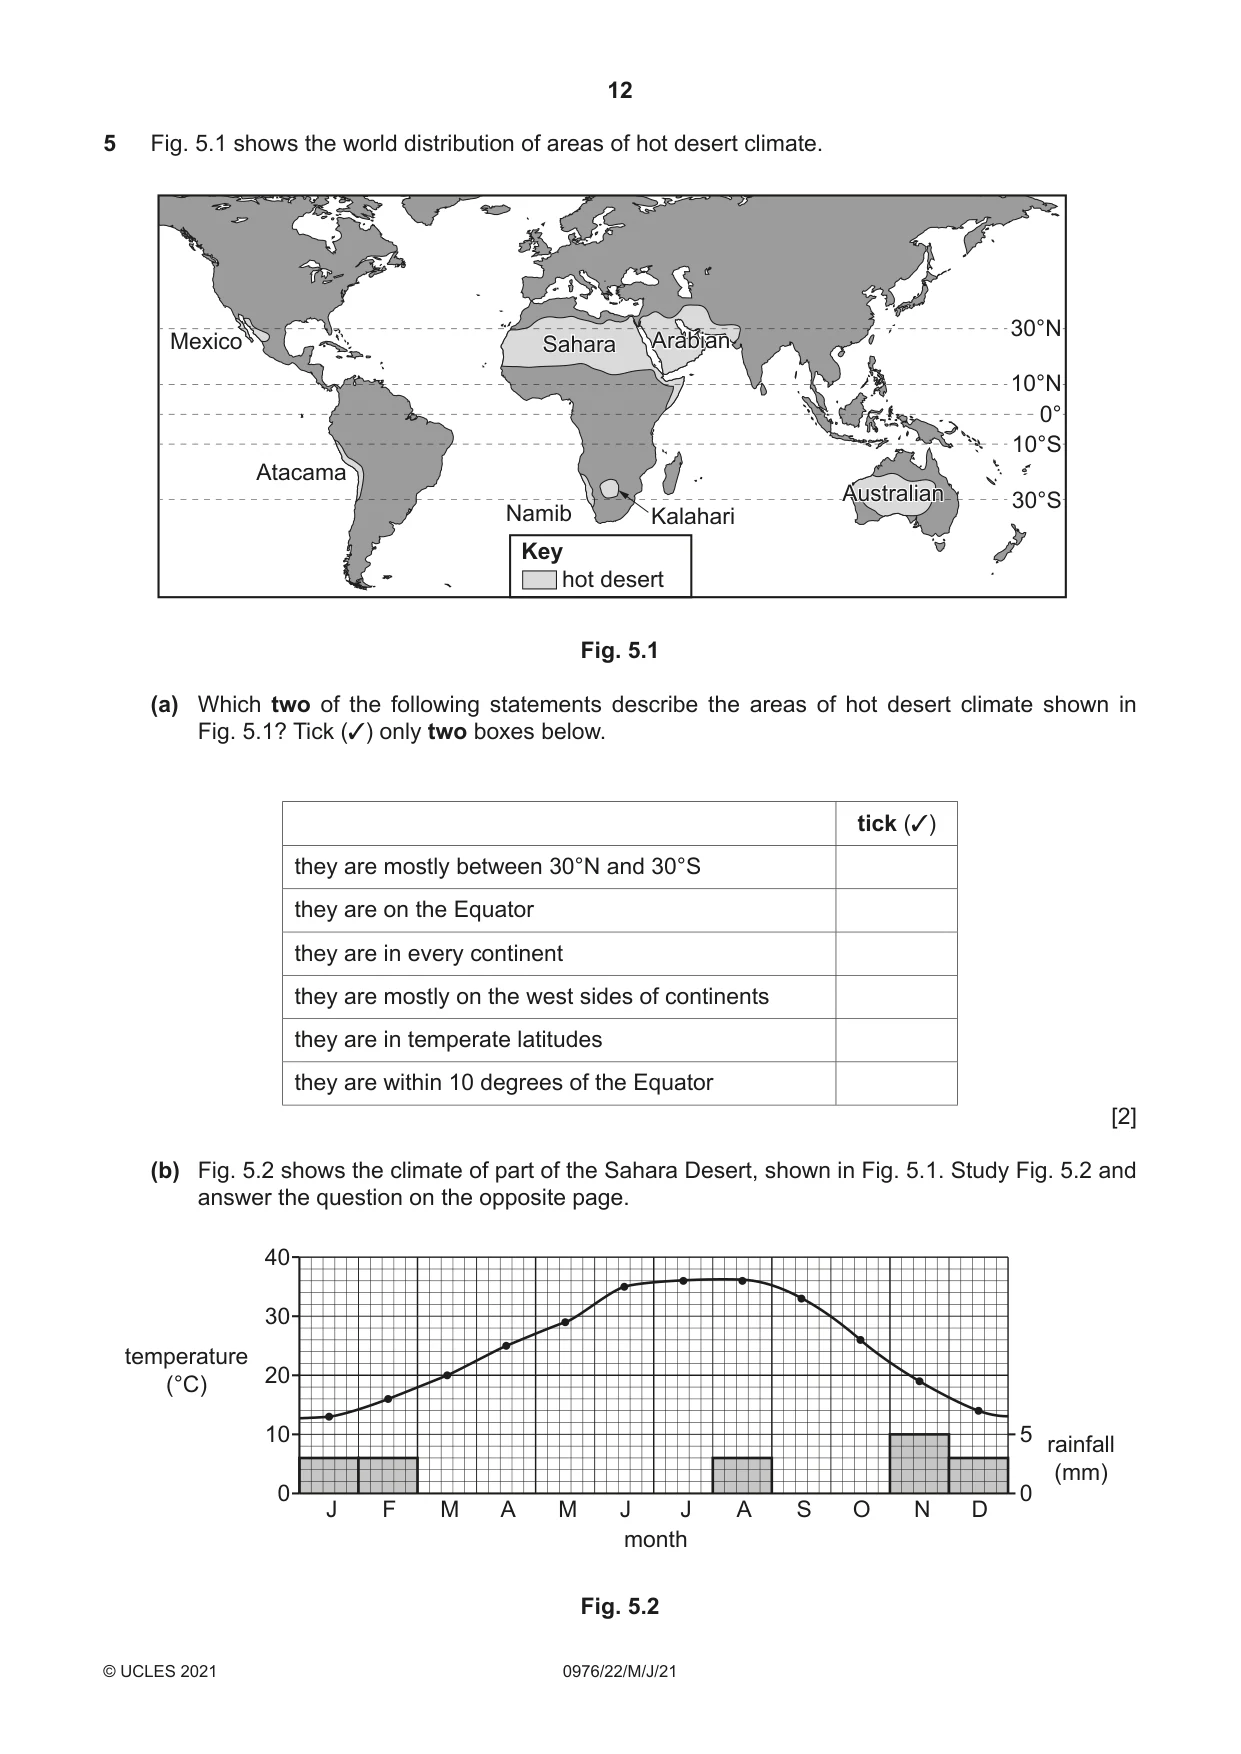
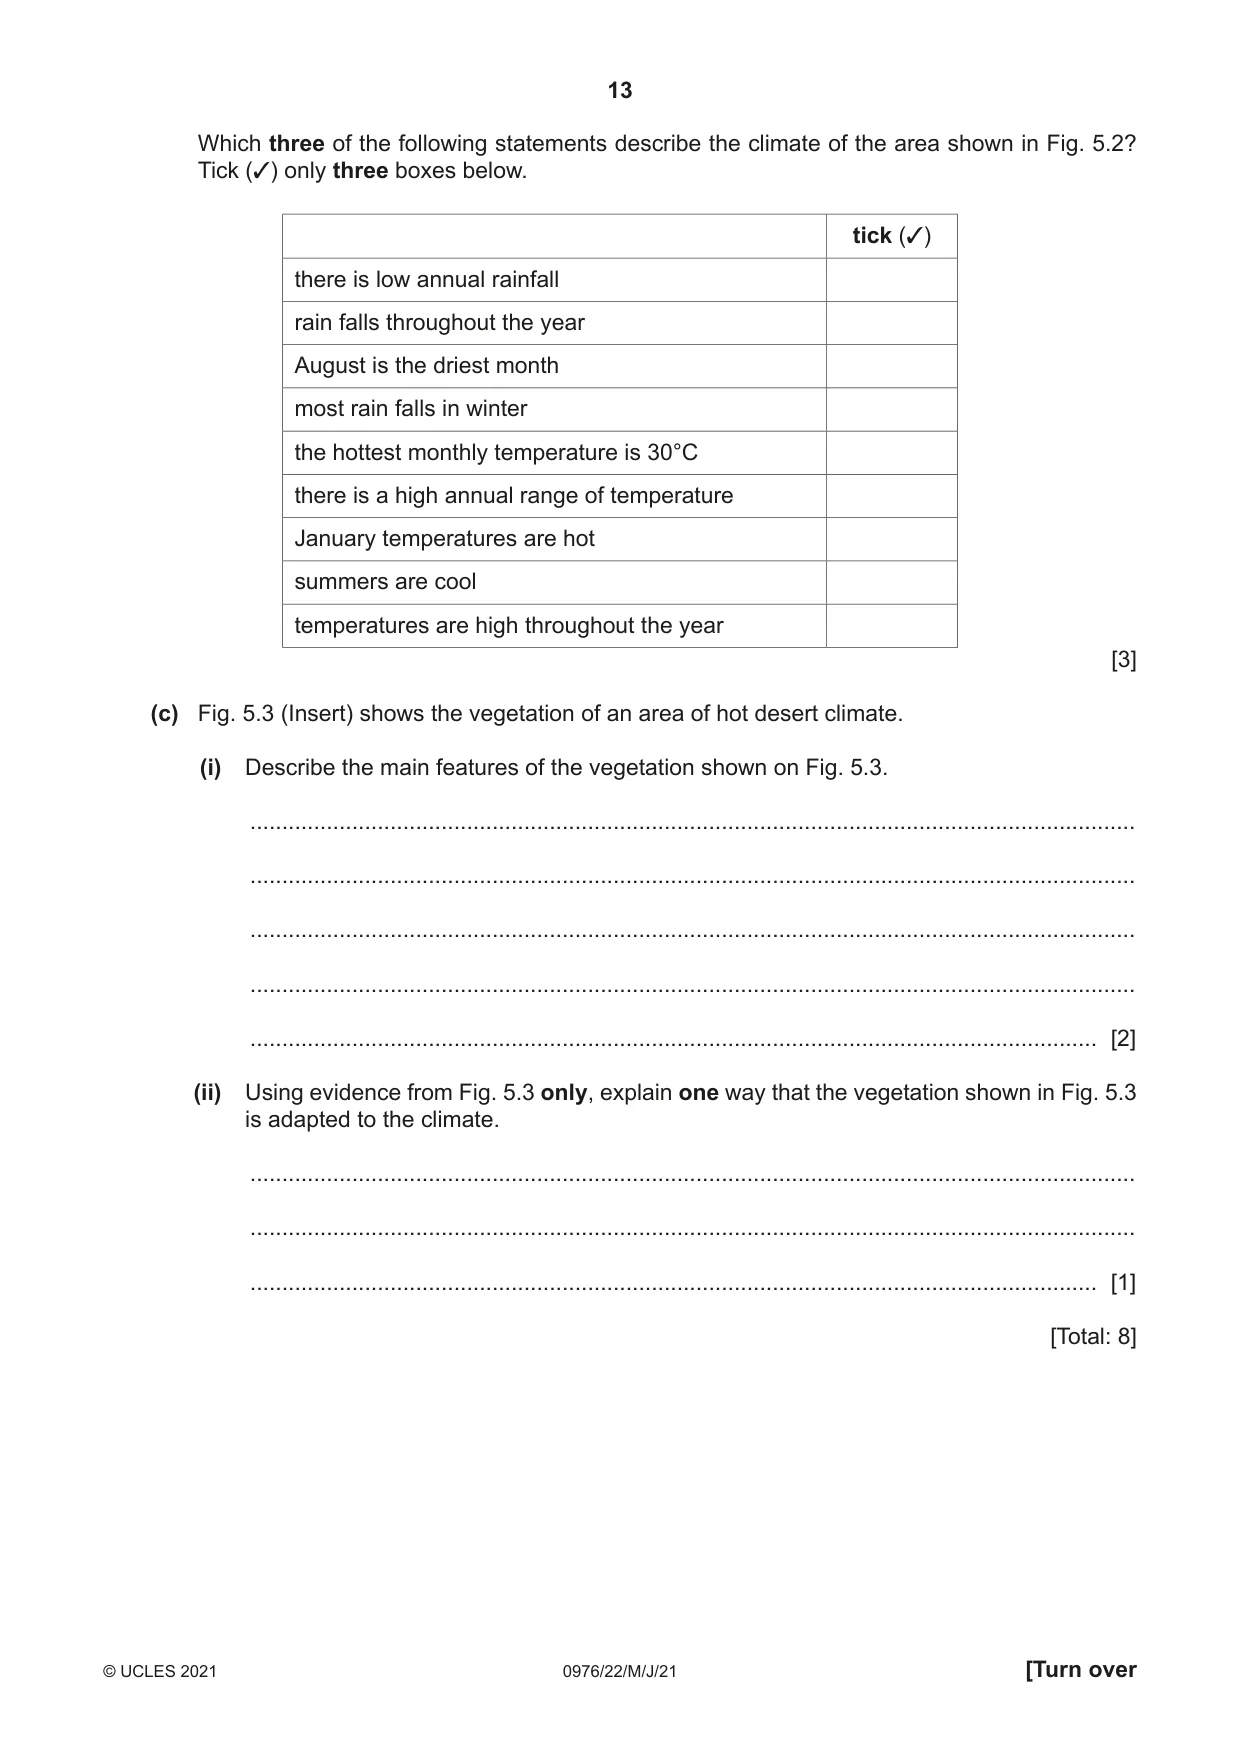
5 Fig. 5.1 shows the world distribution of areas of hot desert climate. 30°N Mexico Sahara Arabian 10°N 0° 10°S Atacama Australian 30°S Namib Kalahari Key hot desert Fig. 5.1 (a) Which two of the following statements describe the areas of hot desert climate shown in Fig. 5.1? Tick (✓) only two boxes below. tick (✓) they are mostly between 30°N and 30°S they are on the Equator they are in every continent they are mostly on the west sides of continents they are in temperate latitudes they are within 10 degrees of the Equator [2] (b) Fig. 5.2 shows the climate of part of the Sahara Desert, shown in Fig. 5.1. Study Fig. 5.2 and answer the question on the opposite page. 40 30 temperature 20 (°C) 10 5 rainfall (mm) 0 0 J F M A M J J A S O N D month Fig. 5.2 Which three of the following statements describe the climate of the area shown in Fig. 5.2? Tick (✓) only three boxes below. tick (✓) there is low annual rainfall rain falls throughout the year August is the driest month most rain falls in winter the hottest monthly temperature is 30°C there is a high annual range of temperature January temperatures are hot summers are cool temperatures are high throughout the year [3] (c) Fig. 5.3 (Insert) shows the vegetation of an area of hot desert climate. (i) Describe the main features of the vegetation shown on Fig. 5.3. ........................................................................................................................................... ........................................................................................................................................... ........................................................................................................................................... ........................................................................................................................................... ..................................................................................................................................... [2] (ii) Using evidence from Fig. 5.3 only, explain one way that the vegetation shown in Fig. 5.3 is adapted to the climate. ........................................................................................................................................... ........................................................................................................................................... ..................................................................................................................................... [1] [Total: 8]
Mark scheme: 5(a) they are mostly between 30°N and 30°S, 2 they are mostly on the west sides of continents, 5(b) there is low annual rainfall, 3 most rain falls in winter, there is a high annual range of temperature, 5(c)(i) wide/thick/bulbous trunk/stem, 2 tall tree(s), (tree) not in leaf, scrub/bush/shrub, small/few leaves, dry/yellow/brown grass, trees far apart/widely spaced/isolated/scattered, 5(c)(ii) (bulbous) trunk to store water, 1 no/few/small leaves to reduce transpiration, (allow evaporation or water loss) grass dies down/becomes dormant in dry season, trees far apart to collect water from large area,
Q6 · Which two of the following are non-renewable fuels?
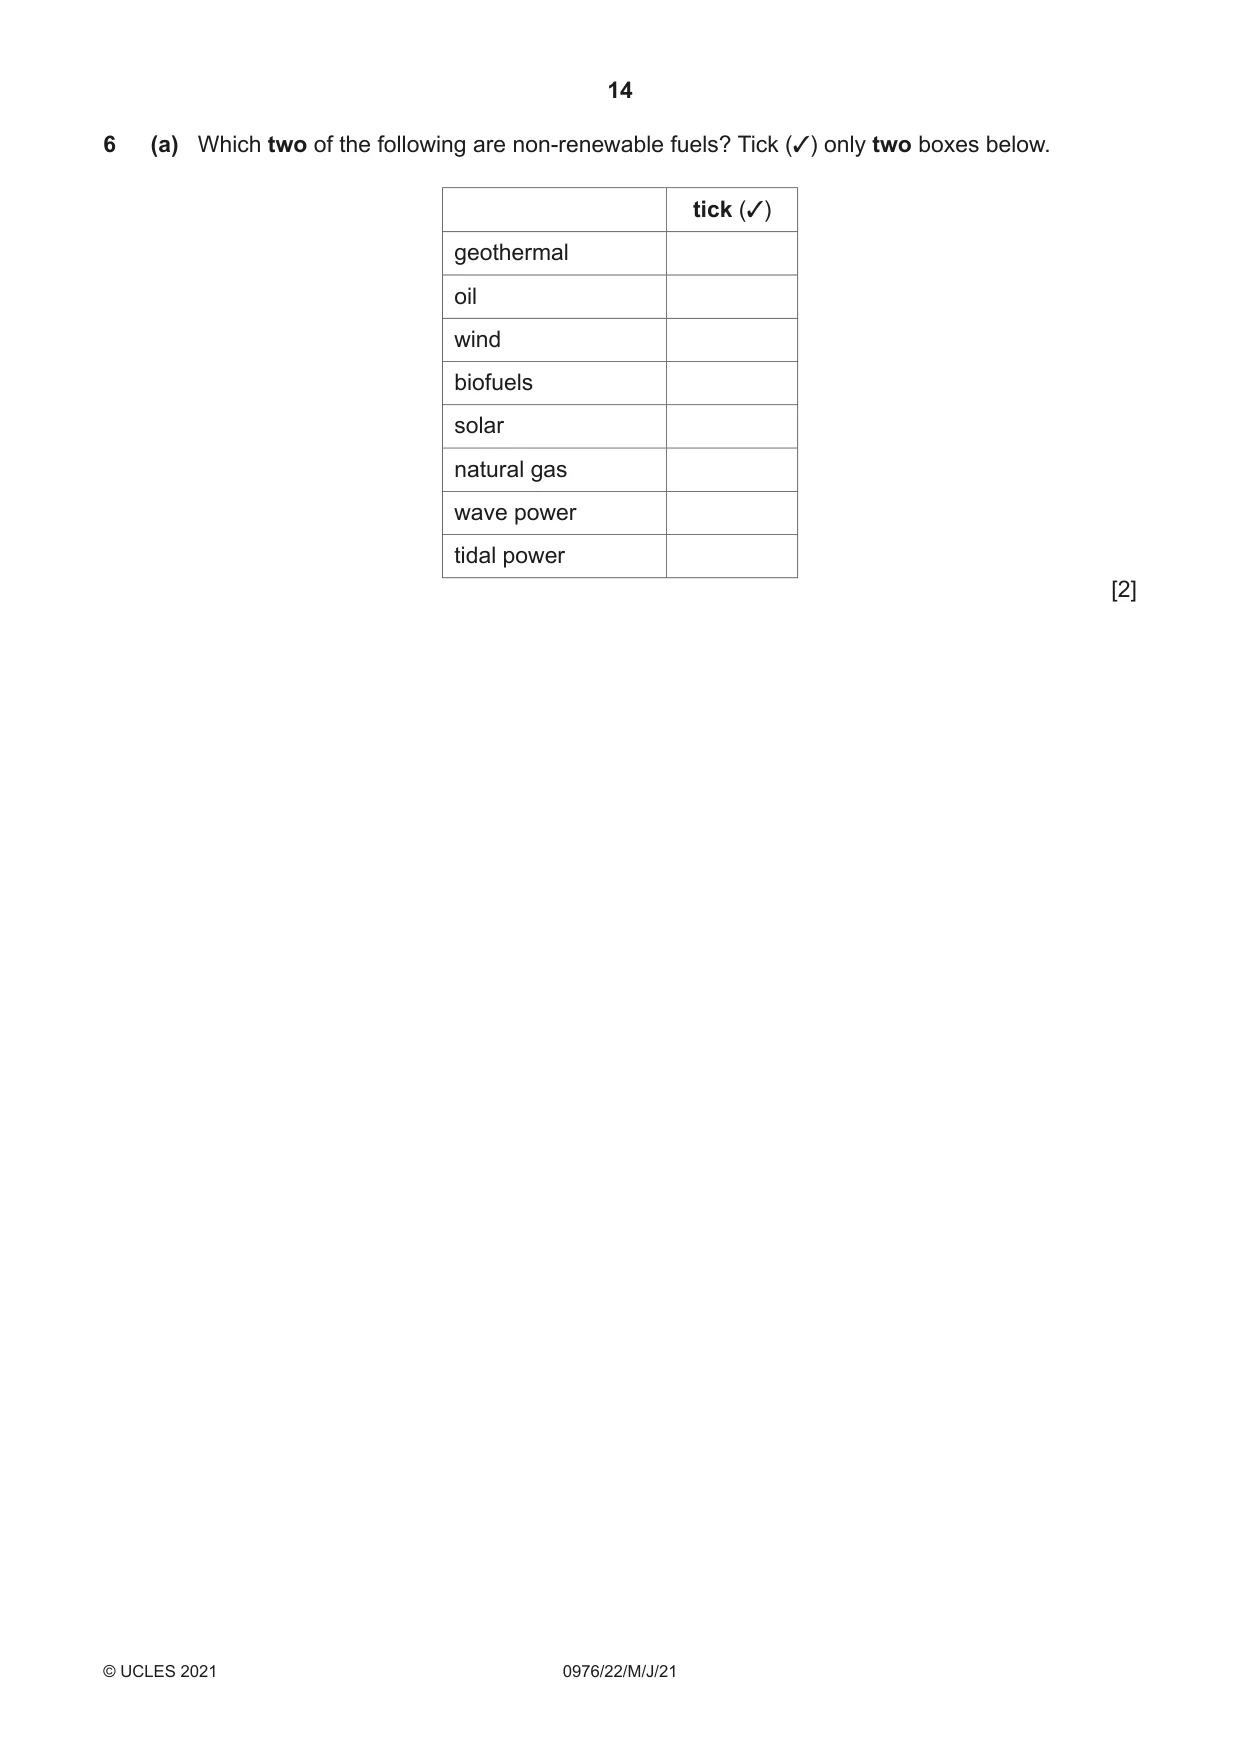
6 (a) Which two of the following are non-renewable fuels? Tick (✓) only two boxes below. tick (✓) geothermal oil wind biofuels solar natural gas wave power tidal power [2] (b) Nuclear power divides people’s opinions. Some people are for its development and other people are against it. Suggest why people are for and against nuclear power. For ................................................................................................................................................... ................................................................................................................................................... ................................................................................................................................................... ................................................................................................................................................... ................................................................................................................................................... ................................................................................................................................................... ................................................................................................................................................... ................................................................................................................................................... Against ................................................................................................................................................... ................................................................................................................................................... ................................................................................................................................................... ................................................................................................................................................... ................................................................................................................................................... ................................................................................................................................................... ................................................................................................................................................... ................................................................................................................................................... ................................................................................................................................................... ............................................................................................................................................. [6] [Total: 8] Additional Pages If you use the following lined pages to complete the answer(s) to any question(s), the question number(s) must be clearly shown. .................................................................................................................................................................. .................................................................................................................................................................. .................................................................................................................................................................. .................................................................................................................................................................. .................................................................................................................................................................. .................................................................................................................................................................. .................................................................................................................................................................. .................................................................................................................................................................. .................................................................................................................................................................. .................................................................................................................................................................. .................................................................................................................................................................. .................................................................................................................................................................. .................................................................................................................................................................. .................................................................................................................................................................. .................................................................................................................................................................. .................................................................................................................................................................. .................................................................................................................................................................. .................................................................................................................................................................. .................................................................................................................................................................. .................................................................................................................................................................. .................................................................................................................................................................. .................................................................................................................................................................. .................................................................................................................................................................. .................................................................................................................................................................. ..................................................................................................................................................................
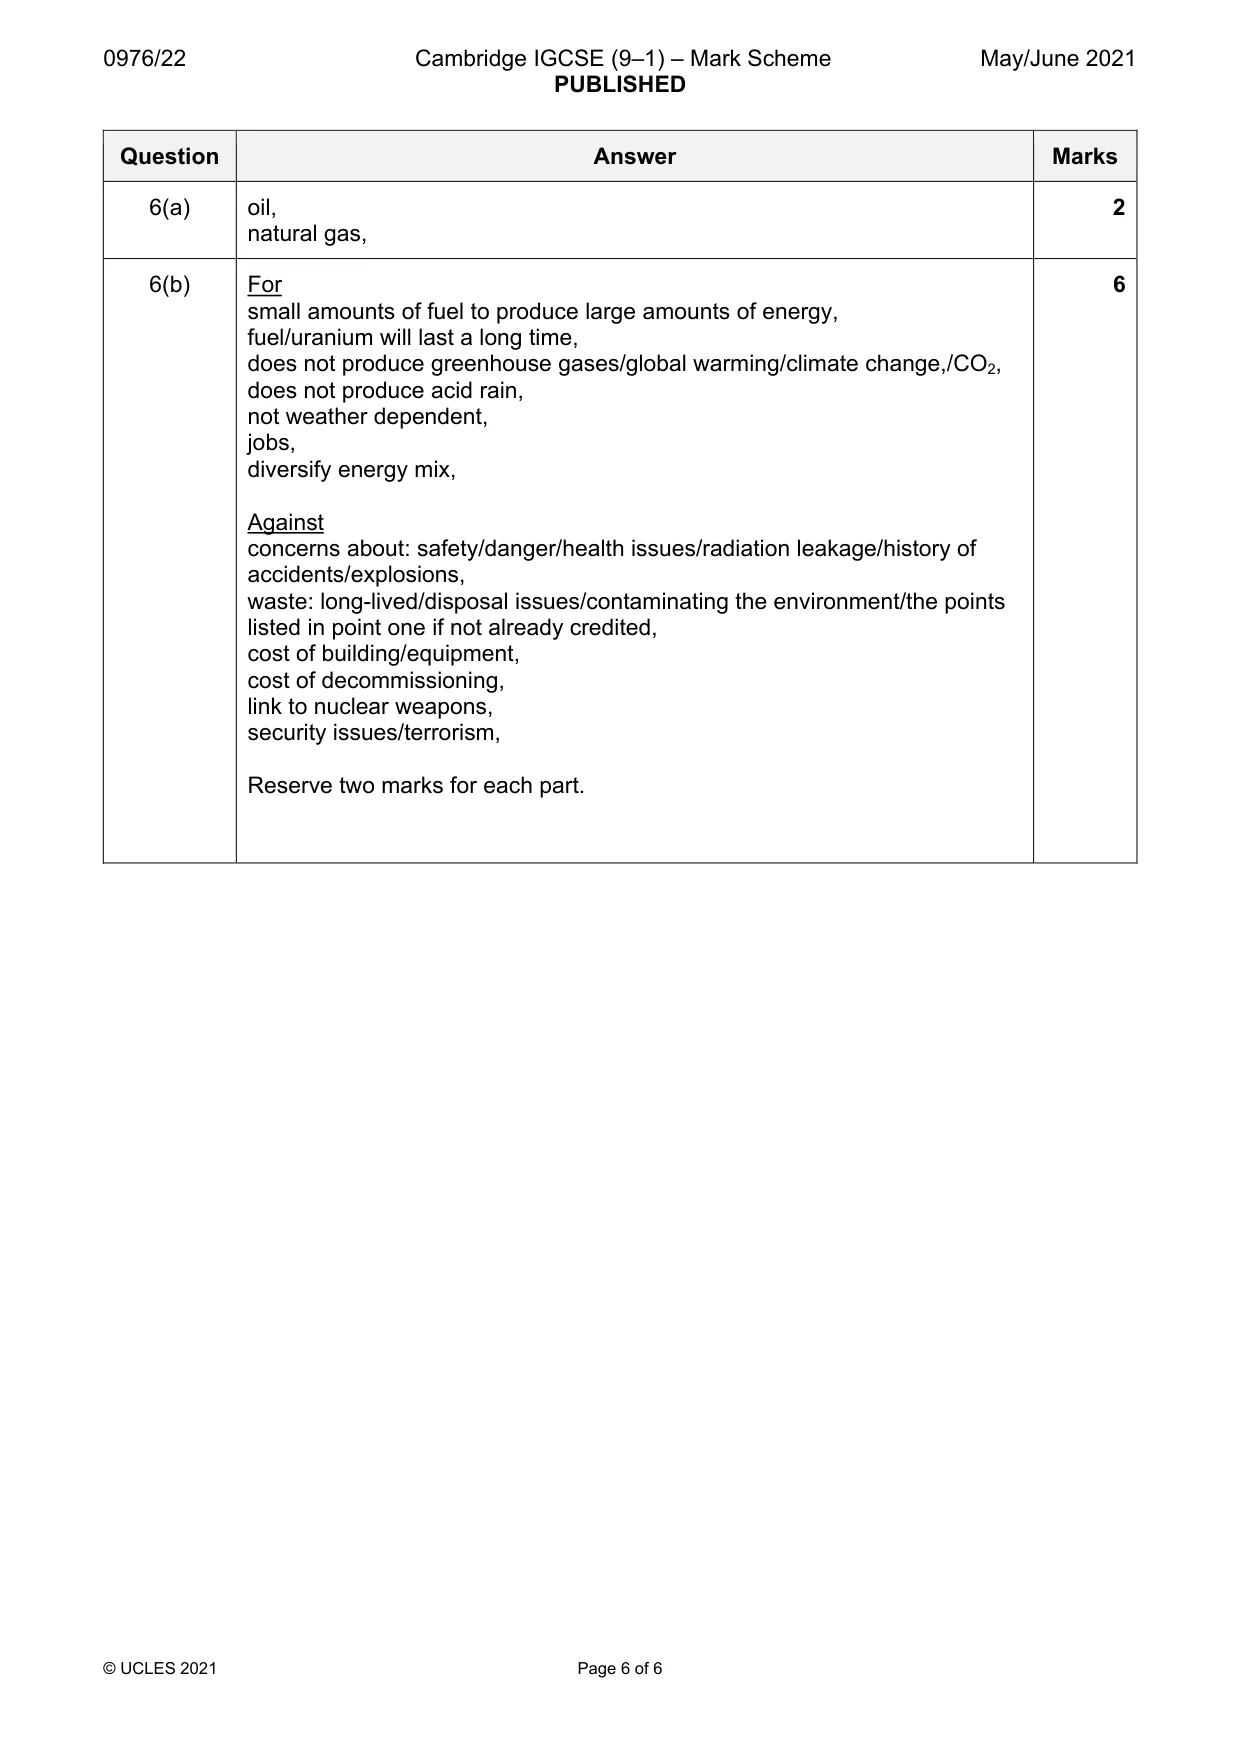
Mark scheme: 6(a) oil, 2 natural gas, 6(b) For 6 small amounts of fuel to produce large amounts of energy, fuel/uranium will last a long time, does not produce greenhouse gases/global warming/climate change,/CO2, does not produce acid rain, not weather dependent, jobs, diversify energy mix, Against concerns about: safety/danger/health issues/radiation leakage/history of accidents/explosions, waste: long-lived/disposal issues/contaminating the environment/the points listed in point one if not already credited, cost of building/equipment, cost of decommissioning, link to nuclear weapons, security issues/terrorism, Reserve two marks for each part.
What was in this paper
The subtopics covered by these 6 questions, and how many questions each got. Open one in a new tab to see every Cambridge question on it.
What you needed in this session
Cambridge’s own grade thresholds for 2021 May/June, Paper 2 · Variant 2. A higher threshold means an easier paper — the bar moves with how the cohort did.