Cambridge IGCSE Geography (9-1) 0976 — 2025 Oct/Nov Paper 2 · Variant 2
0976/22/O/N/25 · 6 questions · 60 marks · 90 min
The question paper and its mark scheme, free to read here and free to download. This is Cambridge’s own paper, exactly as it was sat.
Question paper20 pages
Mark scheme10 pages
Answers below. Sit the paper first if you are practising.
Questions as text
Q1 · Study the map extract for Dublin (Baile Átha Cliath), Ireland
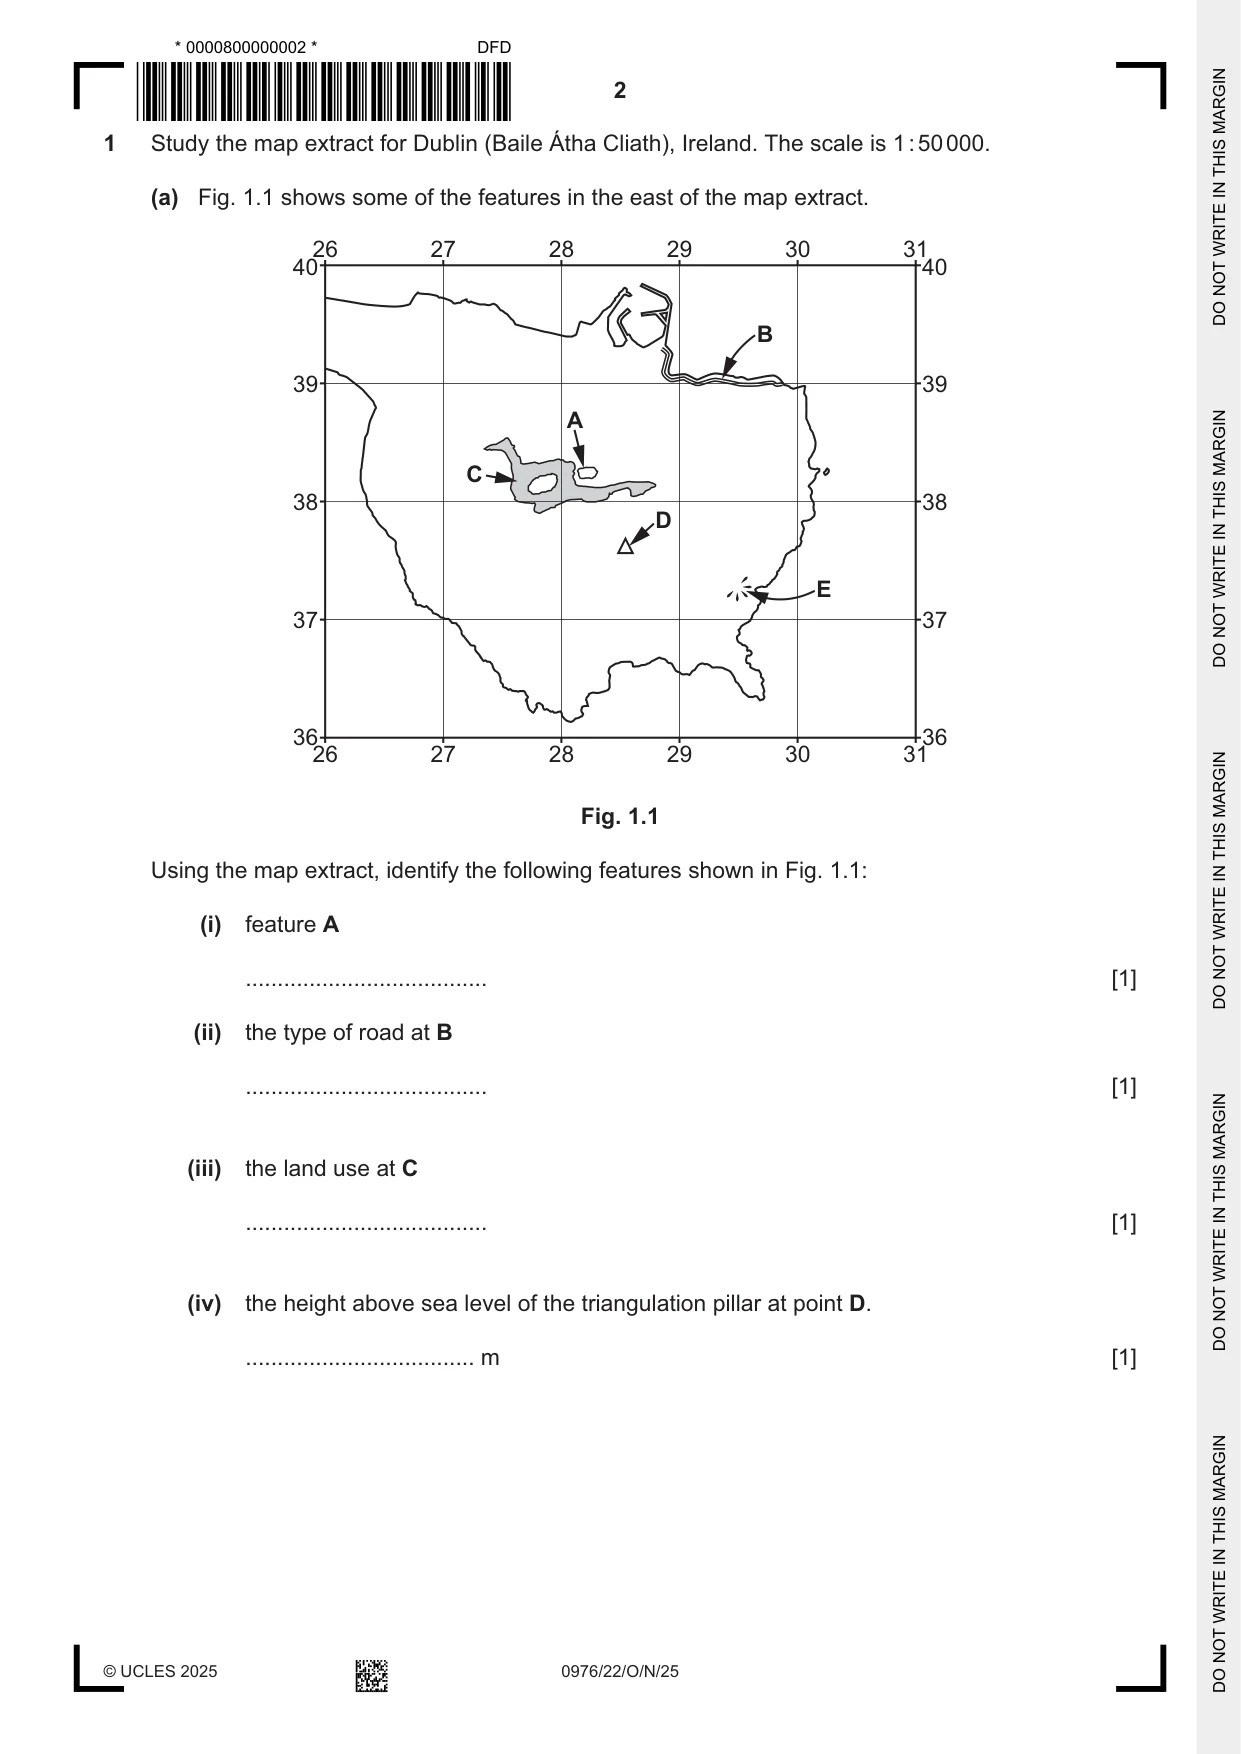
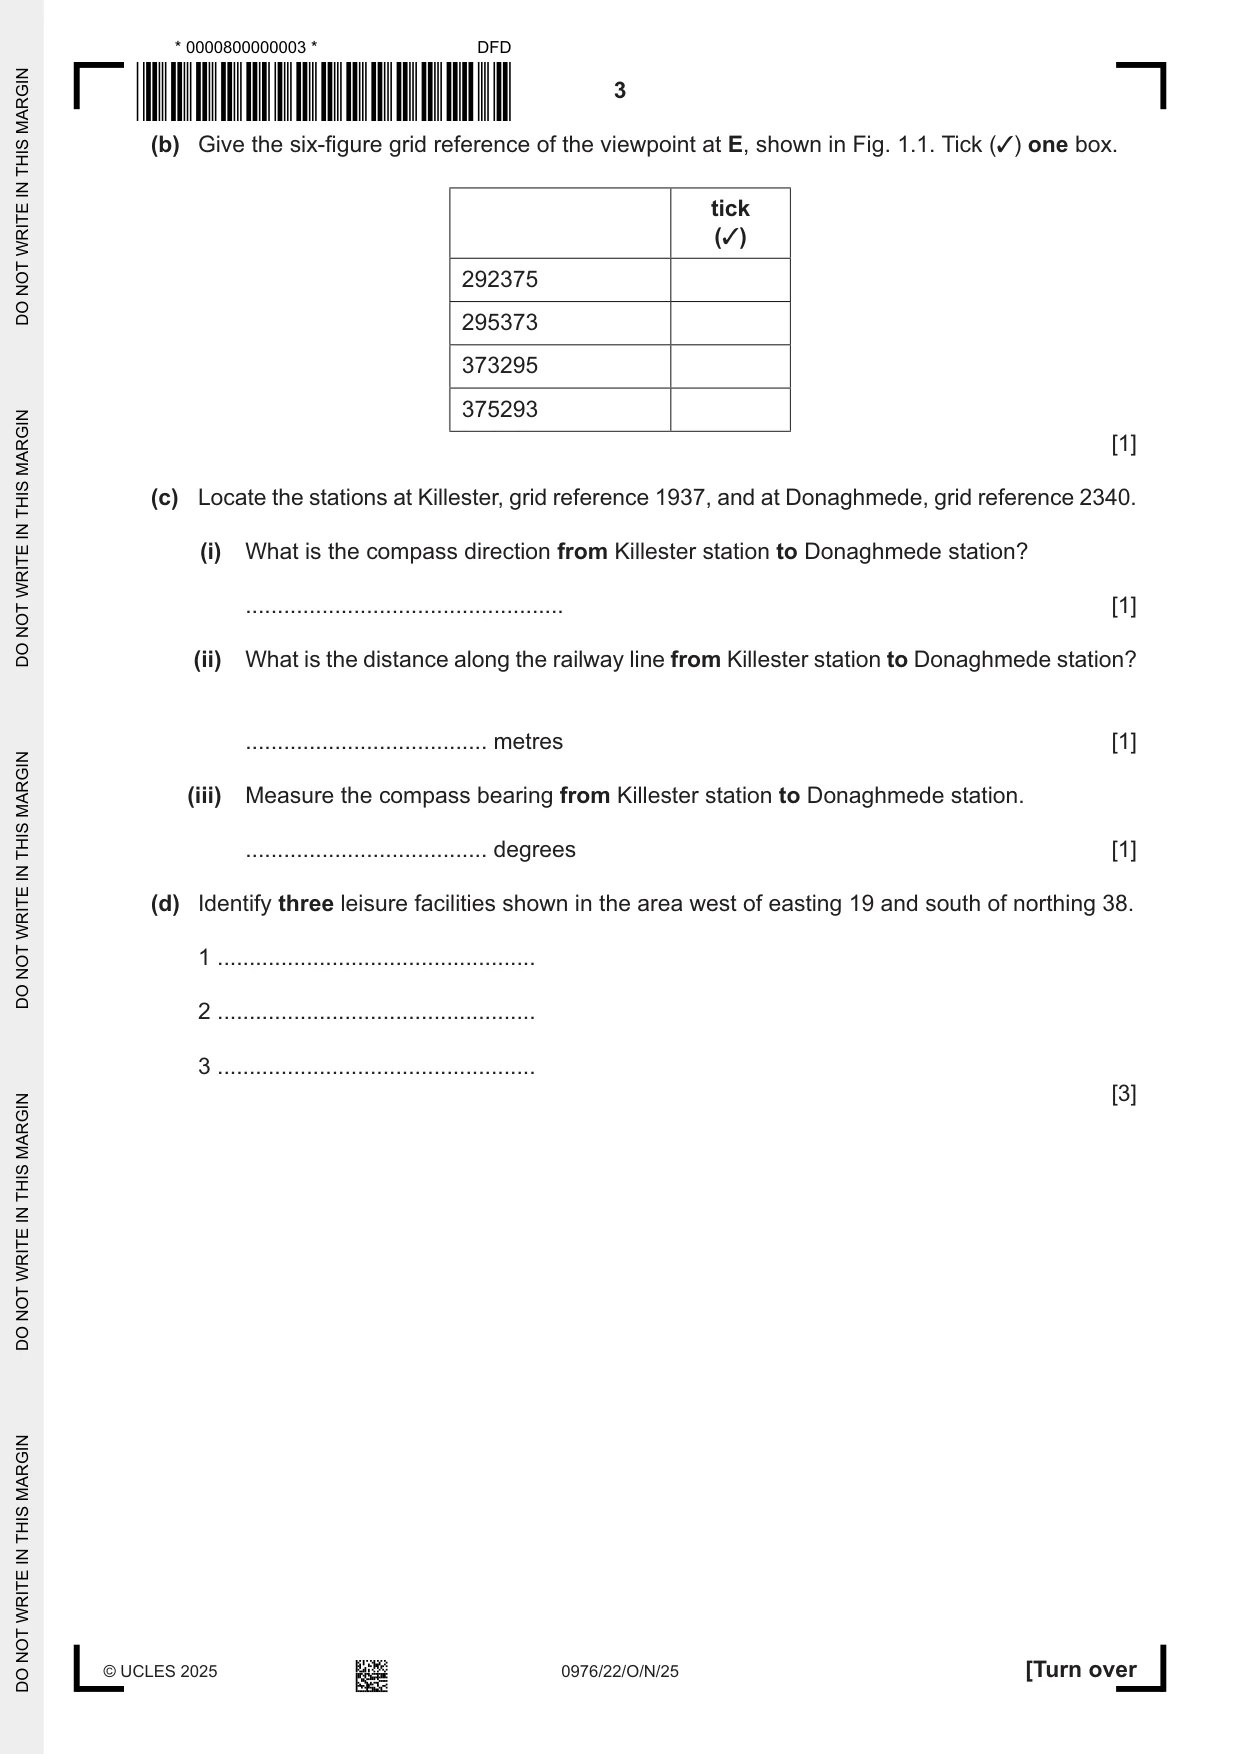
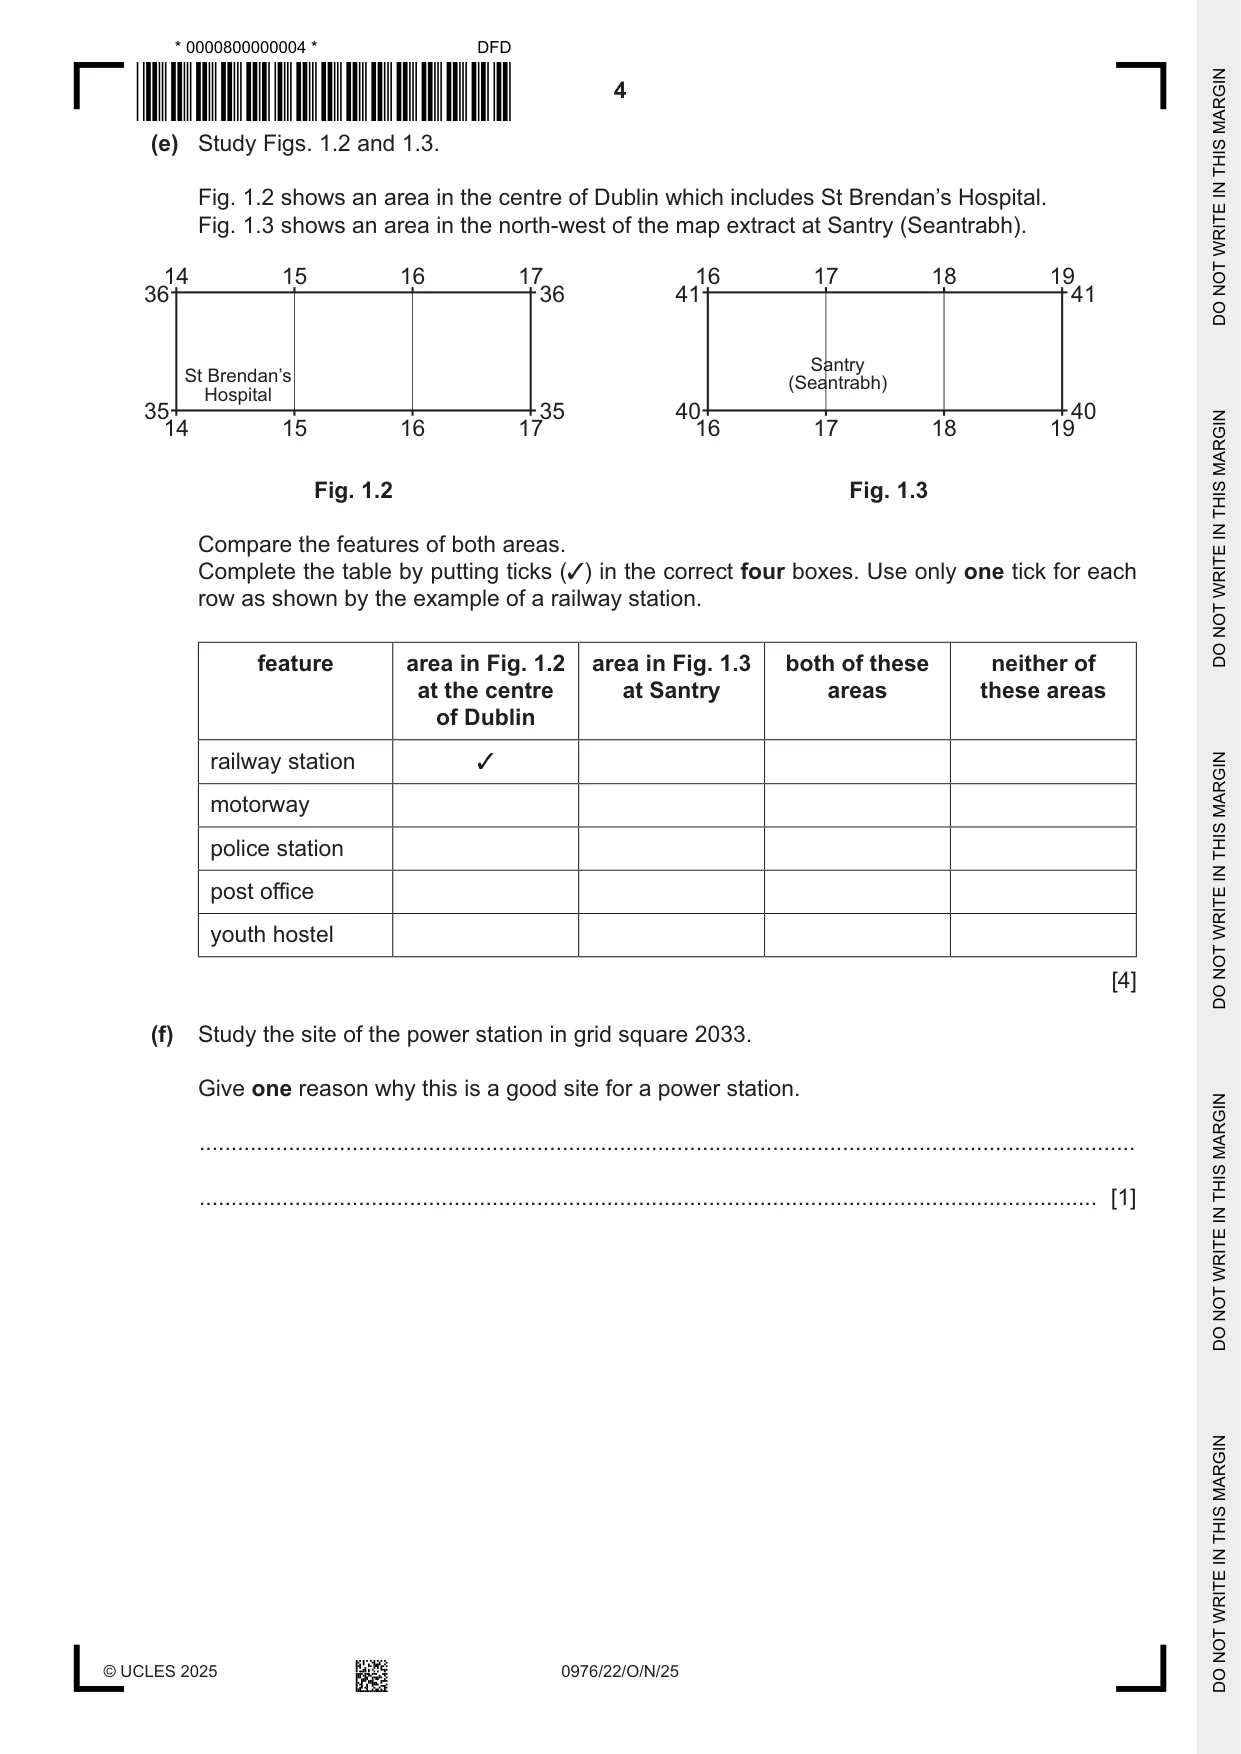
1 Study the map extract for Dublin (Baile Átha Cliath), Ireland. The scale is 1 : 50 000. (a) Fig. 1.1 shows some of the features in the east of the map extract. 26 27 28 29 30 31 40 40 B 39 39 A C 38 38 D E 37 37 36 36 26 27 28 29 30 31 Fig. 1.1 Using the map extract, identify the following features shown in Fig. 1.1: (i) feature A ...................................... [1] (ii) the type of road at B ...................................... [1] (iii) the land use at C ...................................... [1] (iv) the height above sea level of the triangulation pillar at point D. .................................... m [1] (b) Give the six-figure grid reference of the viewpoint at E, shown in Fig. 1.1. Tick (3) one box. tick (3) 292375 295373 373295 375293 [1] (c) Locate the stations at Killester, grid reference 1937, and at Donaghmede, grid reference 2340. (i) What is the compass direction from Killester station to Donaghmede station? .................................................. [1] (ii) What is the distance along the railway line from Killester station to Donaghmede station? ...................................... metres [1] (iii) Measure the compass bearing from Killester station to Donaghmede station. ...................................... degrees [1] (d) Identify three leisure facilities shown in the area west of easting 19 and south of northing 38. 1 .................................................. 2 .................................................. 3 .................................................. [3] (e) Study Figs. 1.2 and 1.3. Fig. 1.2 shows an area in the centre of Dublin which includes St Brendan’s Hospital. Fig. 1.3 shows an area in the north-west of the map extract at Santry (Seantrabh). 14 15 16 17 16 17 18 19 36 36 41 41 Santry St Brendan’s (Seantrabh) Hospital 35 35 40 40 14 15 16 17 16 17 18 19 Fig. 1.2 Fig. 1.3 Compare the features of both areas. Complete the table by putting ticks (3) in the correct four boxes. Use only one tick for each row as shown by the example of a railway station. feature area in Fig. 1.2 area in Fig. 1.3 both of these neither of at the centre at Santry areas these areas of Dublin railway station 3 motorway police station post office youth hostel [4] (f) Study the site of the power station in grid square 2033. Give one reason why this is a good site for a power station. ................................................................................................................................................... ............................................................................................................................................. [1] (g) Compare the relief and shape of North Bull Island and the land area east of easting 26. ................................................................................................................................................... ................................................................................................................................................... ................................................................................................................................................... ................................................................................................................................................... ................................................................................................................................................... ................................................................................................................................................... ................................................................................................................................................... ............................................................................................................................................. [4] [Total: 20]
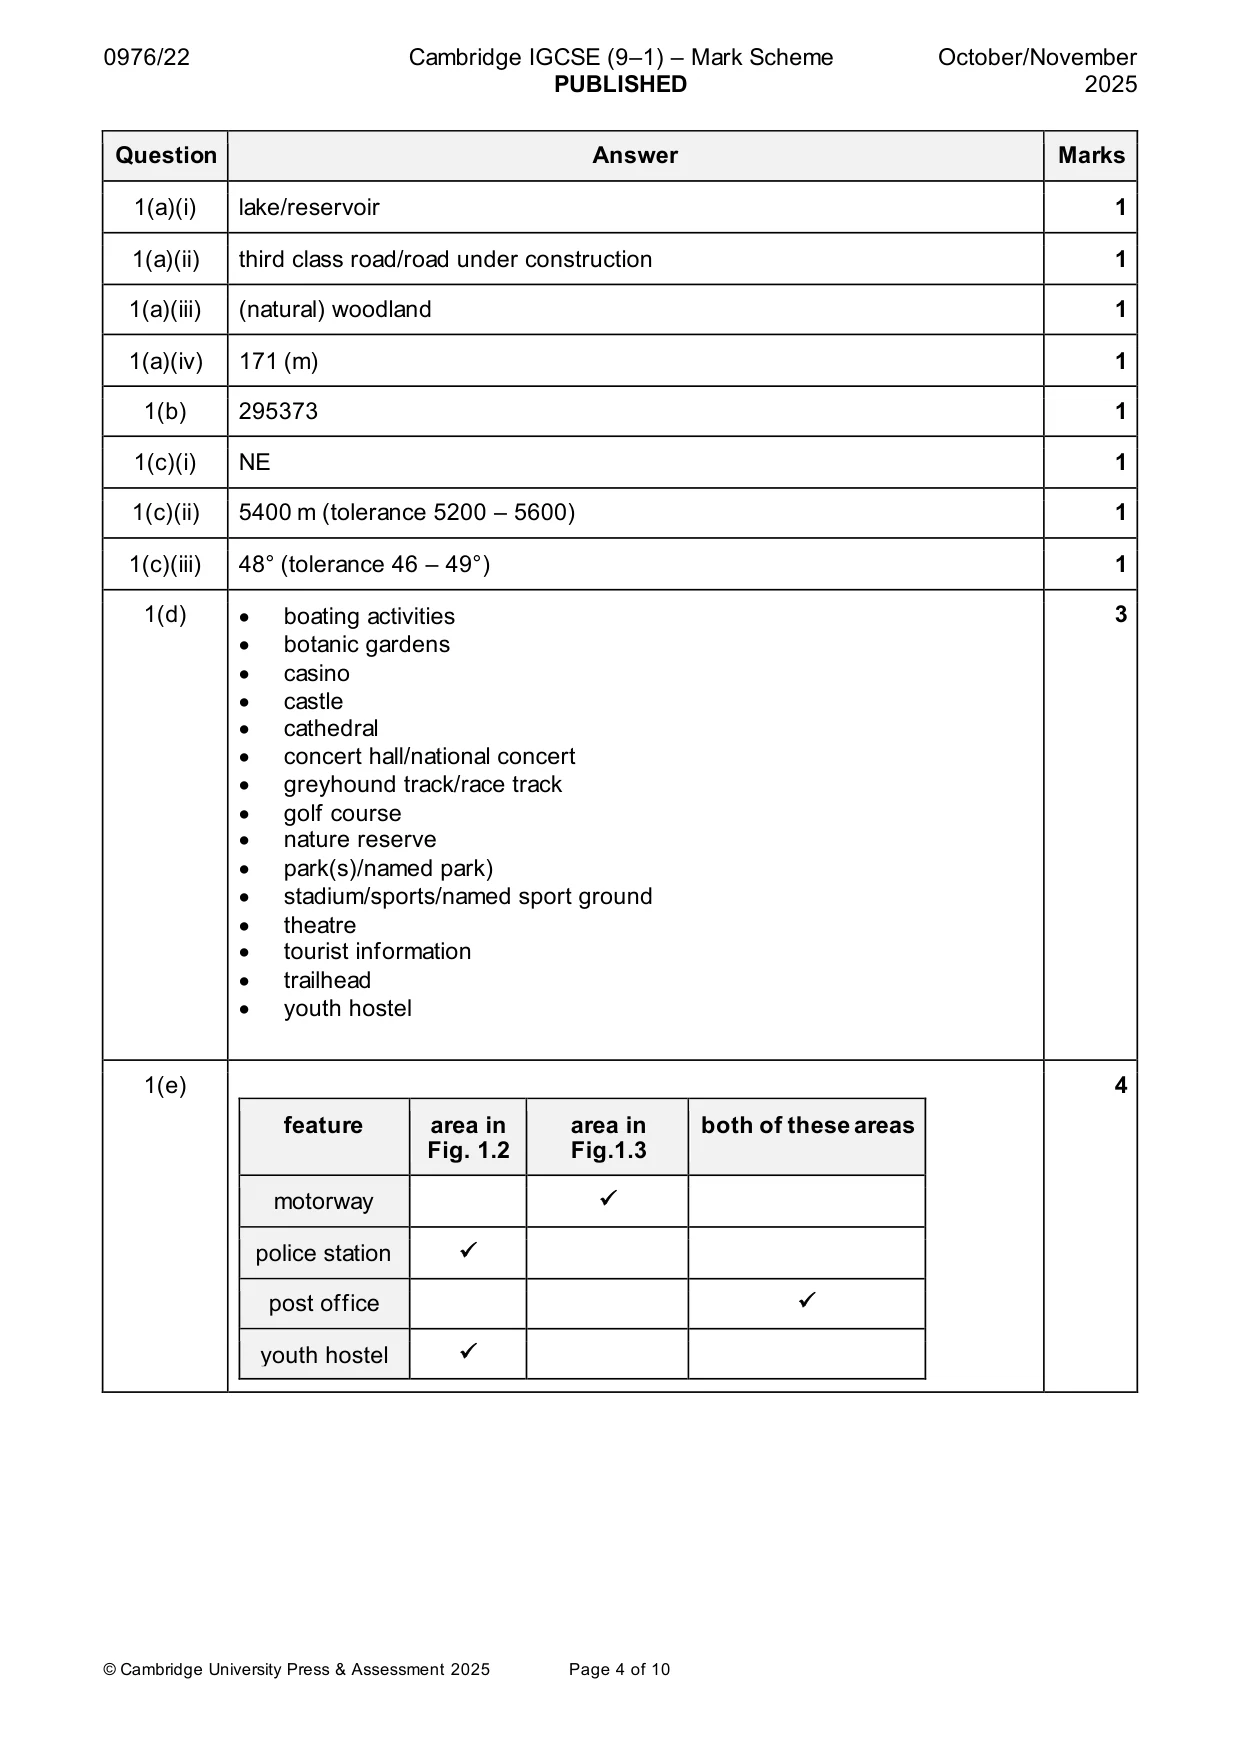
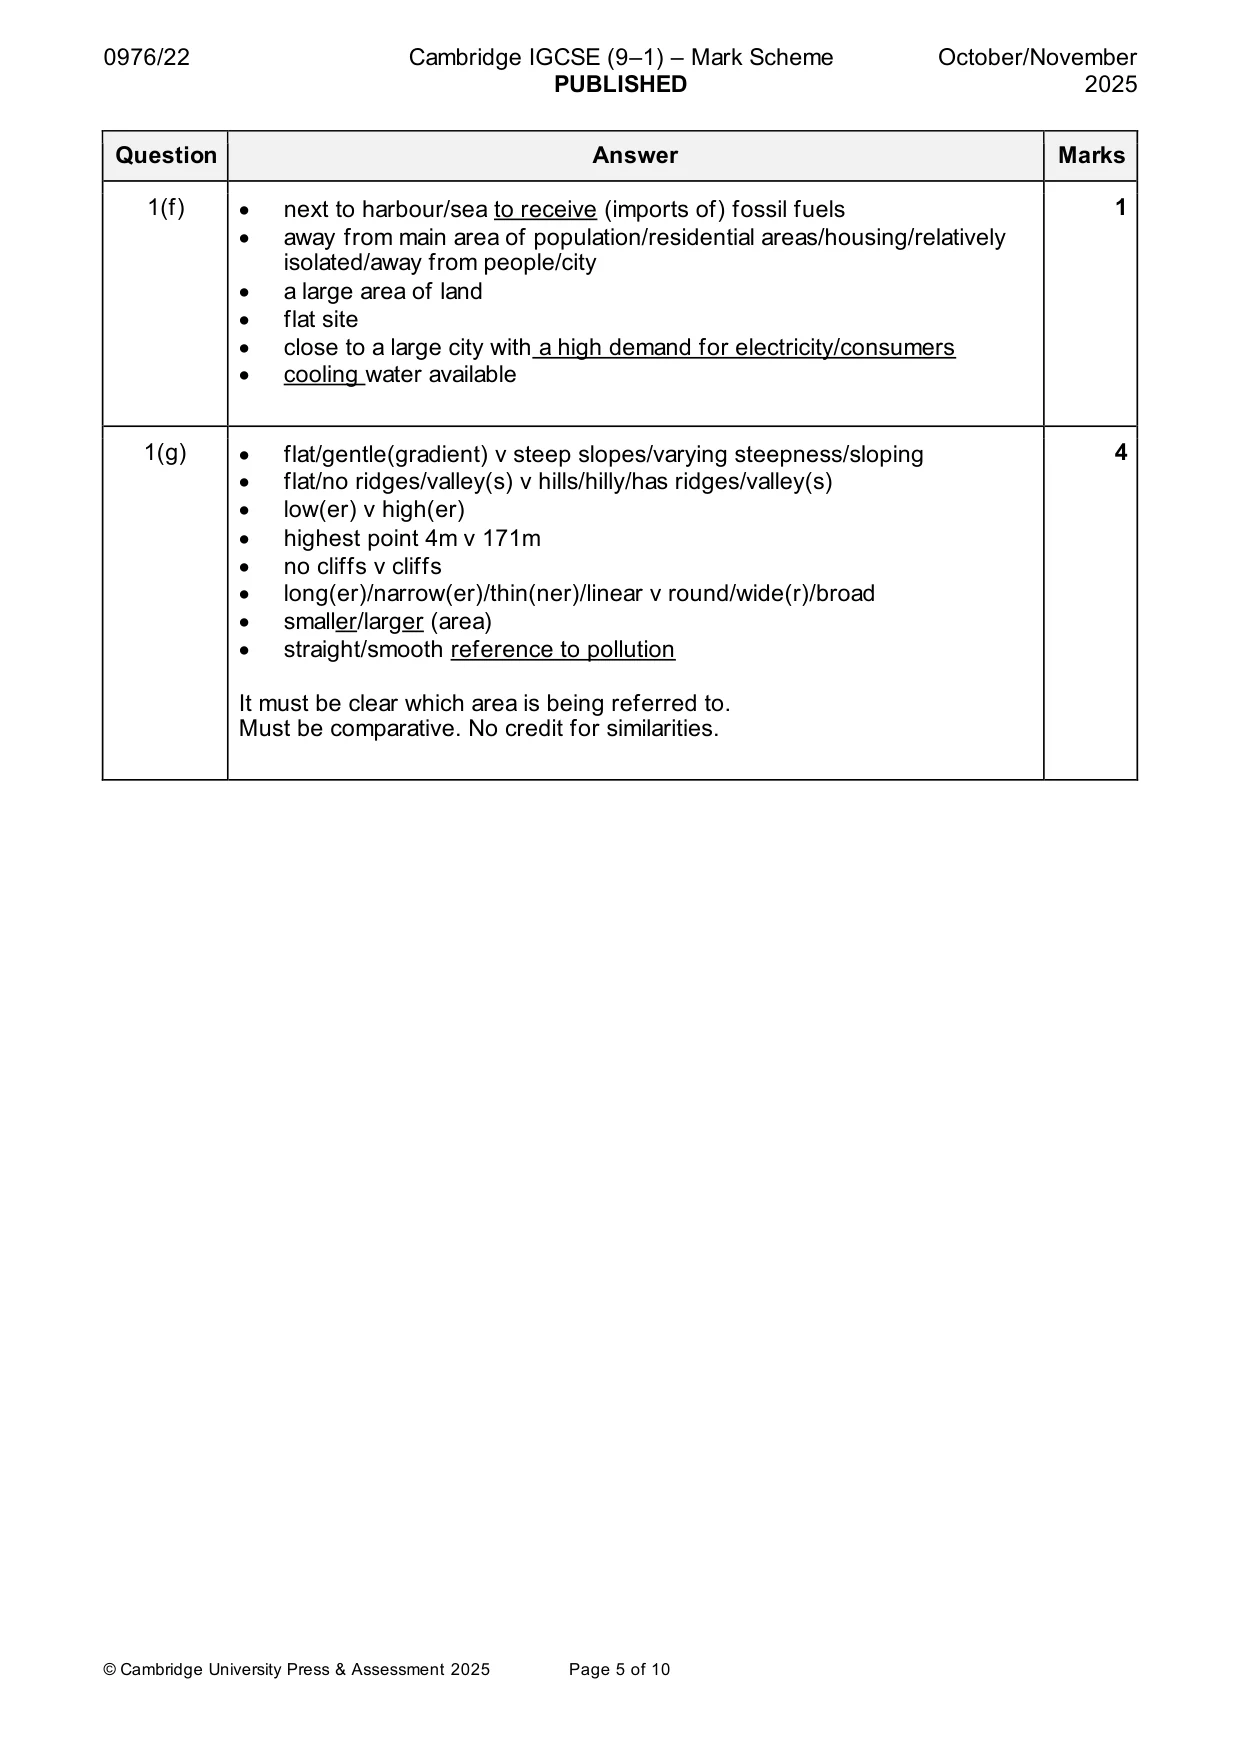
Mark scheme: Question Answer Marks 1(a)(i) lake/reservoir 1 1(a)(ii) third class road/road under construction 1 1(a)(iii) (natural) woodland 1 1(a)(iv) 171 (m) 1 1(b) 295373 1 1(c)(i) NE 1 1(c)(ii) 5400 m (tolerance 5200 – 5600) 1 1(c)(iii) 48° (tolerance 46 – 49°) 1 1(d) • boating activities 3 • botanic gardens • casino • castle • cathedral • concert hall/national concert • greyhound track/race track • golf course • nature reserve • park(s)/named park) • stadium/sports/named sport ground • theatre • tourist information • trailhead • youth hostel 1(e) 4 feature area in area in both of these areas Fig. 1.2 Fig.1.3 motorway ✓ police station ✓ post office ✓ youth hostel ✓ 1(f) • next to harbour/sea to receive (imports of) fossil fuels 1 • away from main area of population/residential areas/housing/relatively isolated/away from people/city • a large area of land • flat site • close to a large city with a high demand for electricity/consumers • cooling water available 1(g) • flat/gentle(gradient) v steep slopes/varying steepness/sloping 4 • flat/no ridges/valley(s) v hills/hilly/has ridges/valley(s) • low(er) v high(er) • highest point 4m v 171m • no cliffs v cliffs • long(er)/narrow(er)/thin(ner)/linear v round/wide(r)/broad • smaller/larger (area) • straight/smooth reference to pollution It must be clear which area is being referred to. Must be comparative. No credit for similarities.
More questions on Settlements (rural and urban) and service provision
Q2 · Information about the population of the Philippines
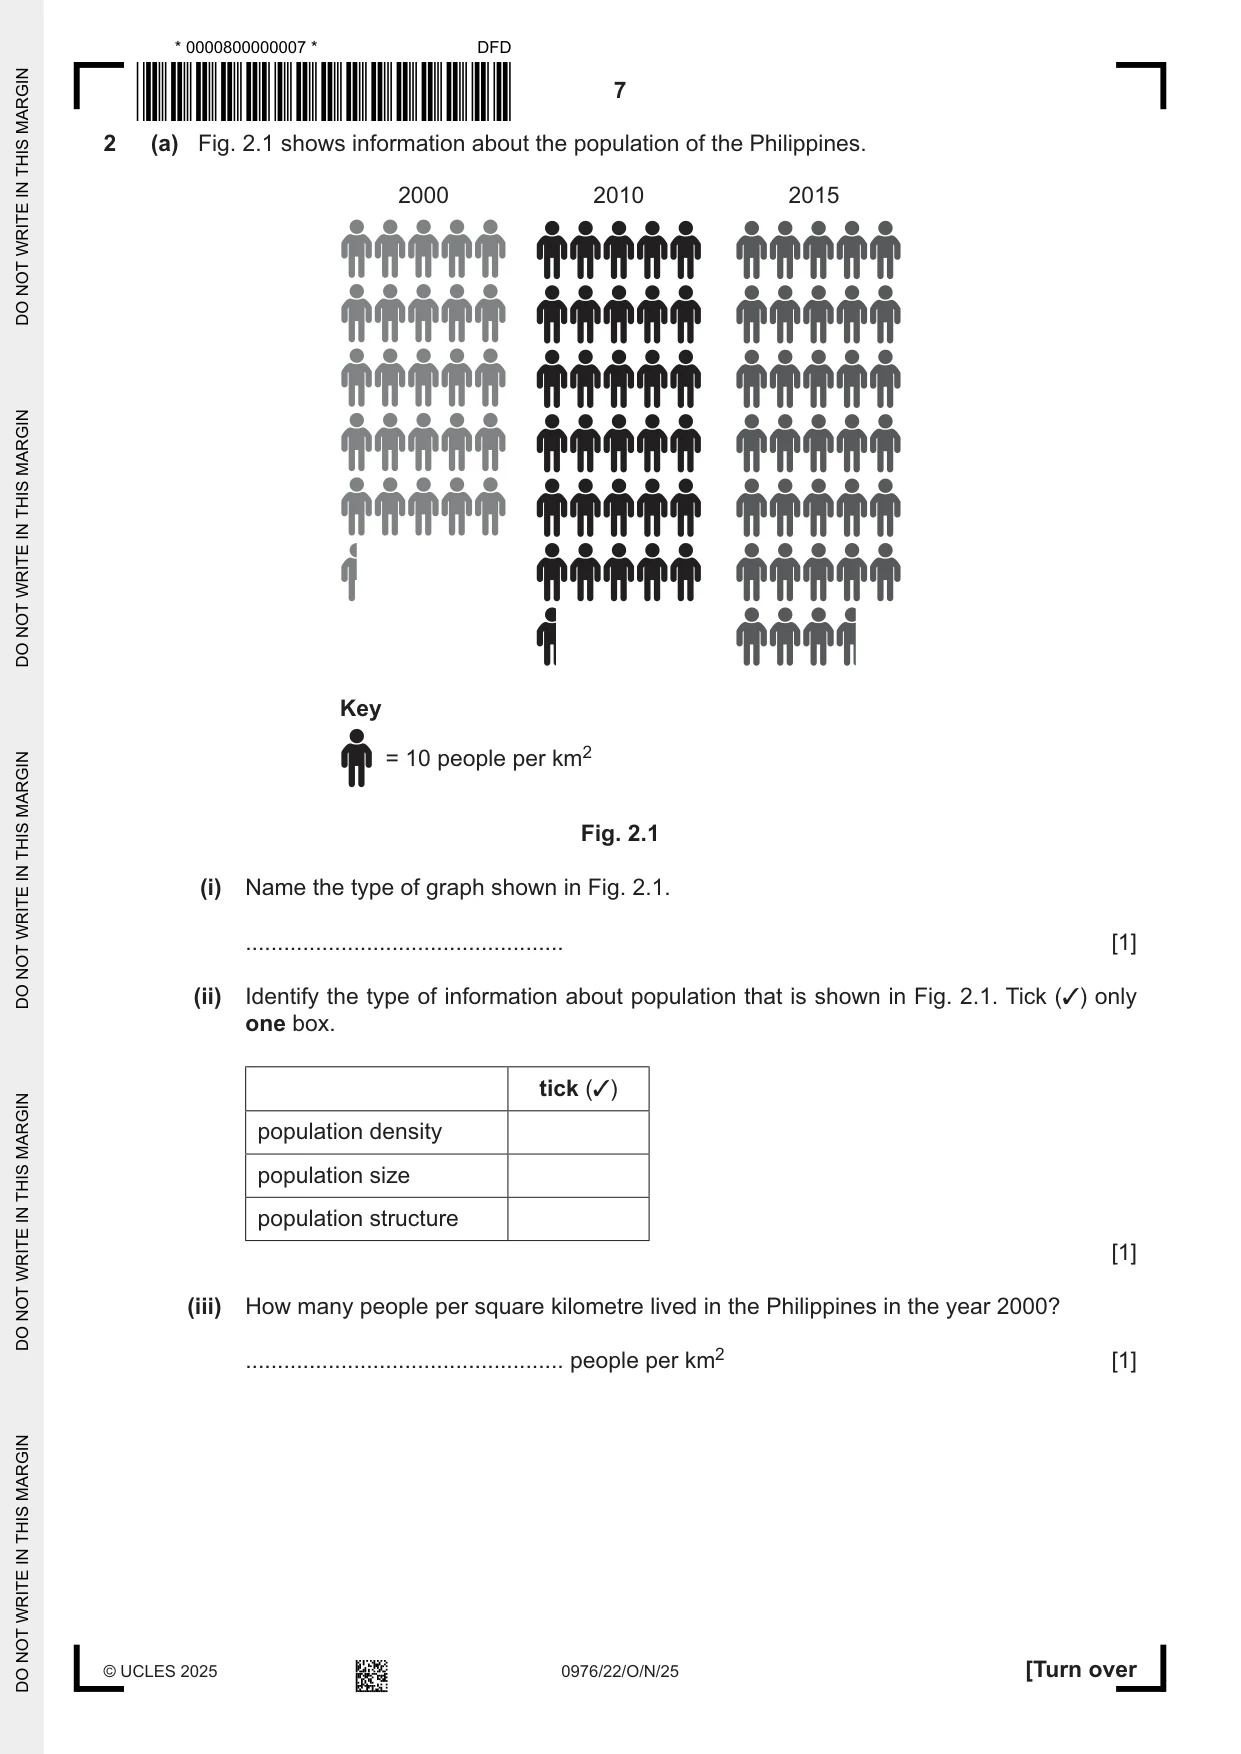
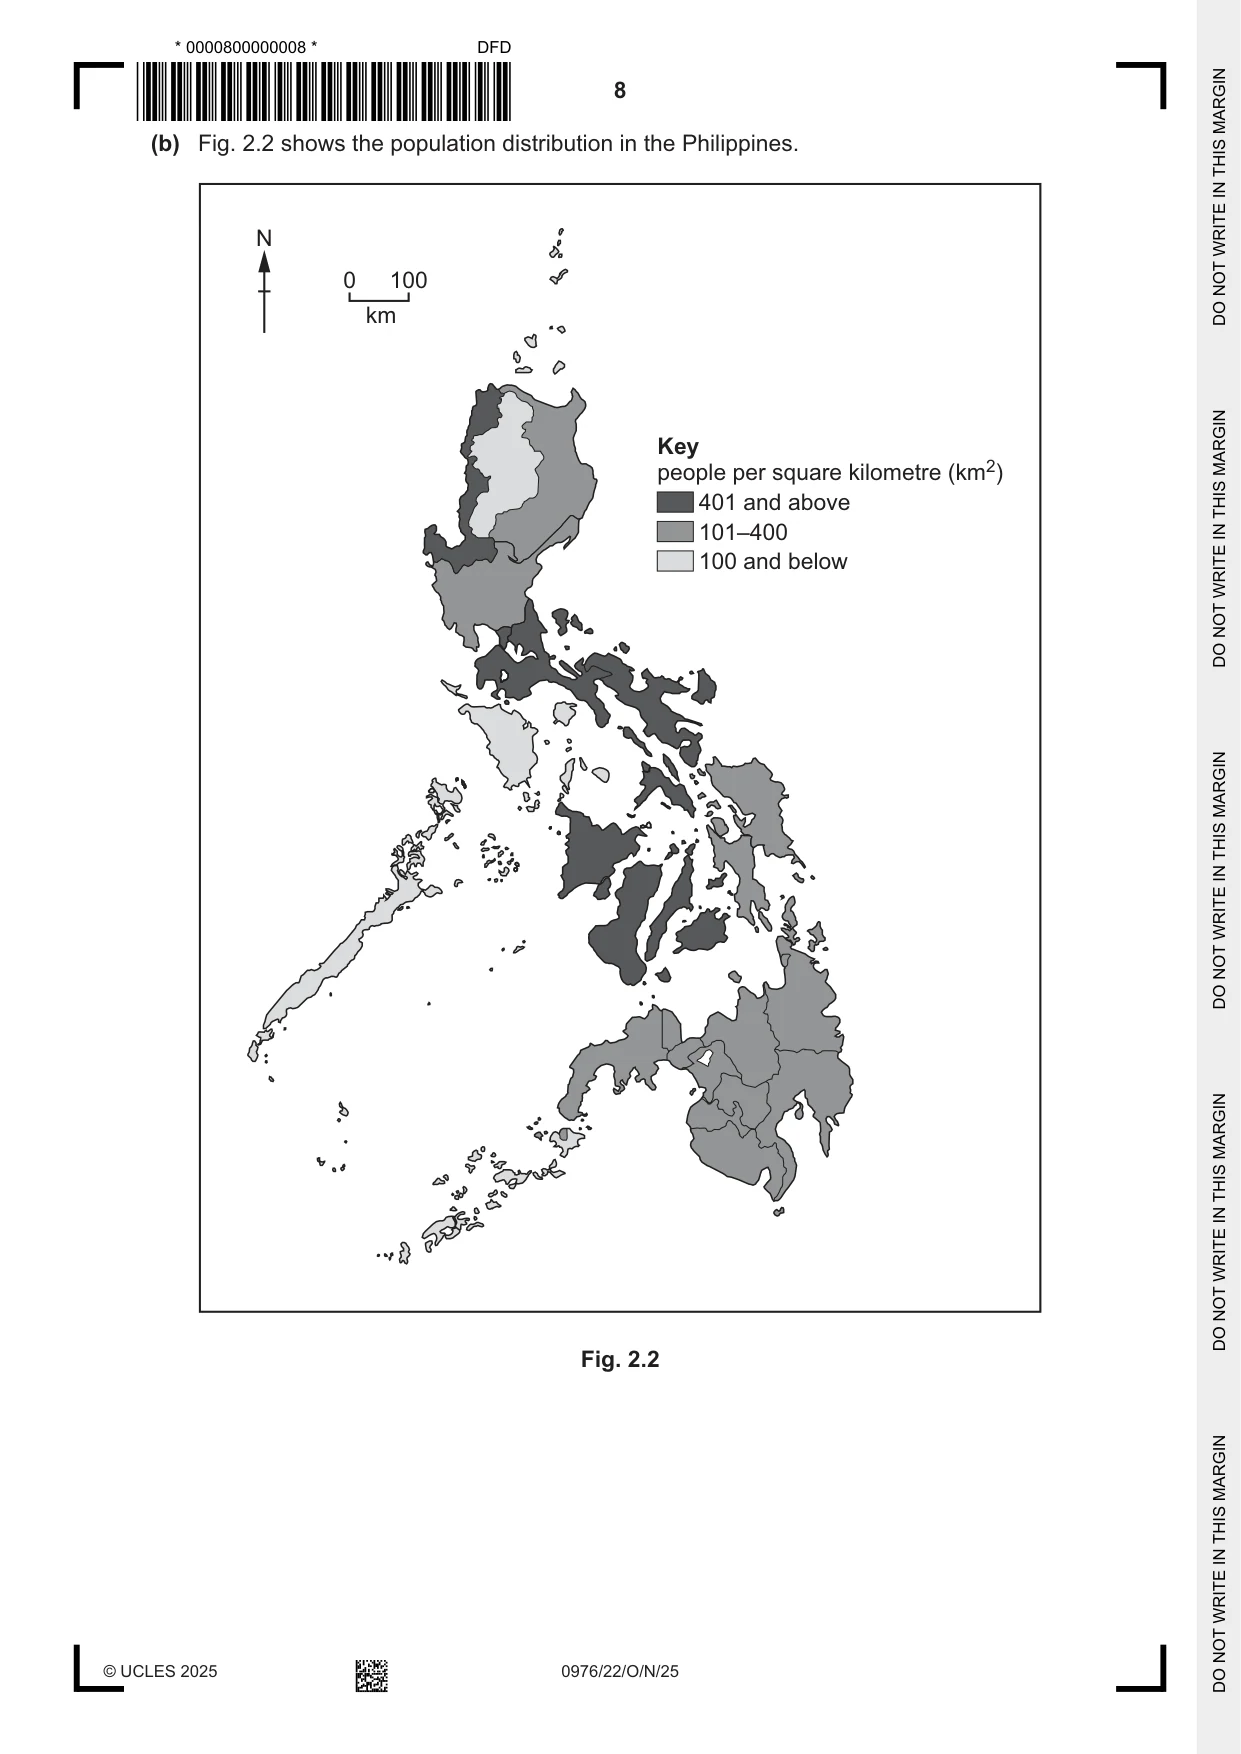
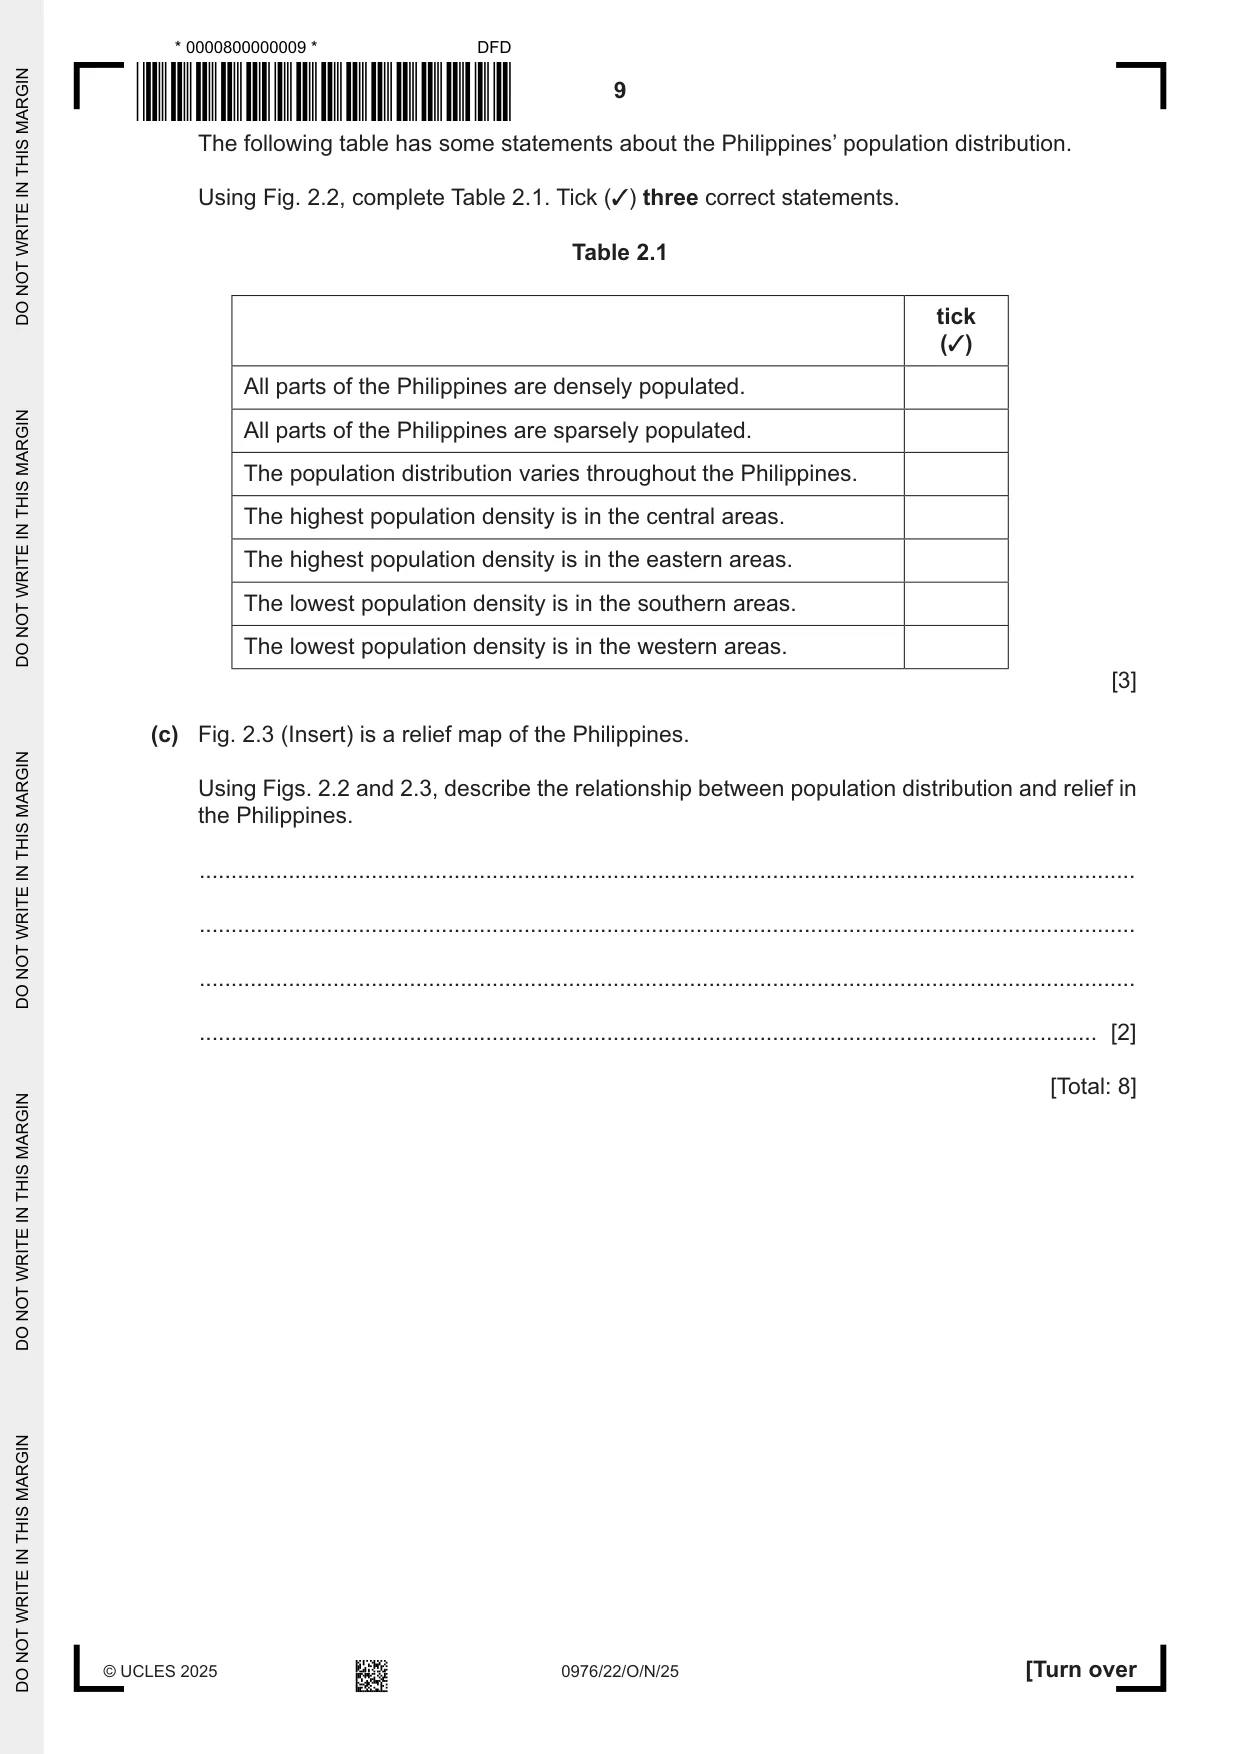
2 (a) Fig. 2.1 shows information about the population of the Philippines. 2000 2010 2015 Key = 10 people per km2 Fig. 2.1 (i) Name the type of graph shown in Fig. 2.1. .................................................. [1] (ii) Identify the type of information about population that is shown in Fig. 2.1. Tick (3) only one box. tick (3) population density population size population structure [1] (iii) How many people per square kilometre lived in the Philippines in the year 2000? .................................................. people per km2 [1] (b) Fig. 2.2 shows the population distribution in the Philippines. N 0 100 km Key people per square kilometre (km2) 401 and above 101–400 100 and below Fig. 2.2 The following table has some statements about the Philippines’ population distribution. Using Fig. 2.2, complete Table 2.1. Tick (3) three correct statements. Table 2.1 tick (3) All parts of the Philippines are densely populated. All parts of the Philippines are sparsely populated. The population distribution varies throughout the Philippines. The highest population density is in the central areas. The highest population density is in the eastern areas. The lowest population density is in the southern areas. The lowest population density is in the western areas. [3] (c) Fig. 2.3 (Insert) is a relief map of the Philippines. Using Figs. 2.2 and 2.3, describe the relationship between population distribution and relief in the Philippines. ................................................................................................................................................... ................................................................................................................................................... ................................................................................................................................................... ............................................................................................................................................. [2] [Total: 8]
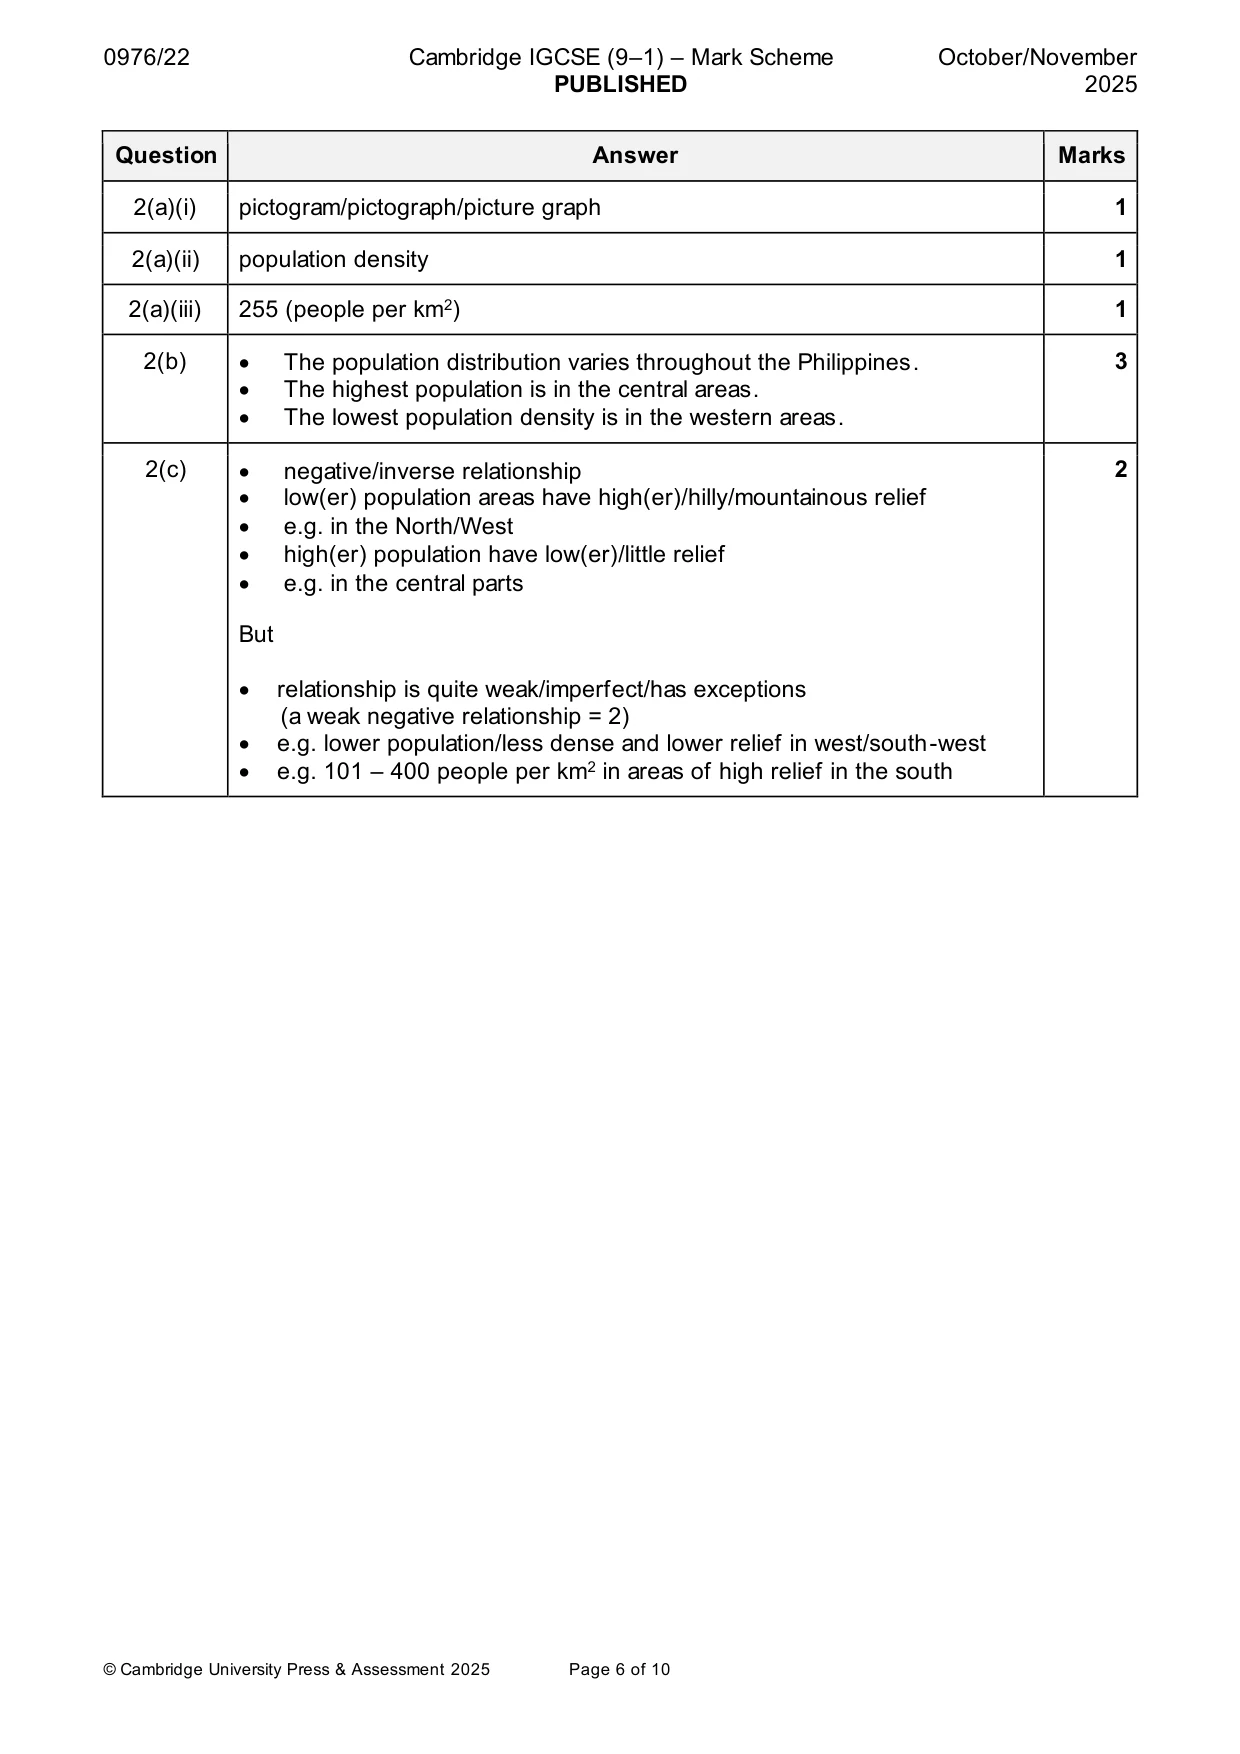
Mark scheme: 2(a)(i) pictogram/pictograph/picture graph 1 2(a)(ii) population density 1 2(a)(iii) 255 (people per km2) 1 2(b) • The population distribution varies throughout the Philippines. 3 • The highest population is in the central areas. • The lowest population density is in the western areas. 2(c) • negative/inverse relationship 2 • low(er) population areas have high(er)/hilly/mountainous relief • e.g. in the North/West • high(er) population have low(er)/little relief • e.g. in the central parts But • relationship is quite weak/imperfect/has exceptions (a weak negative relationship = 2) • e.g. lower population/less dense and lower relief in west/south-west • e.g. 101 – 400 people per km2 in areas of high relief in the south
Question 3
3 (a) Fig. 3.1 (Insert) shows information about the population living in squatter settlements in urban areas in selected countries in Africa. Content removed due to copyright restrictions. (b) Fig. 3.2 (Insert) shows a squatter settlement in Colombia, an LEDC in South America. Content removed due to copyright restrictions.
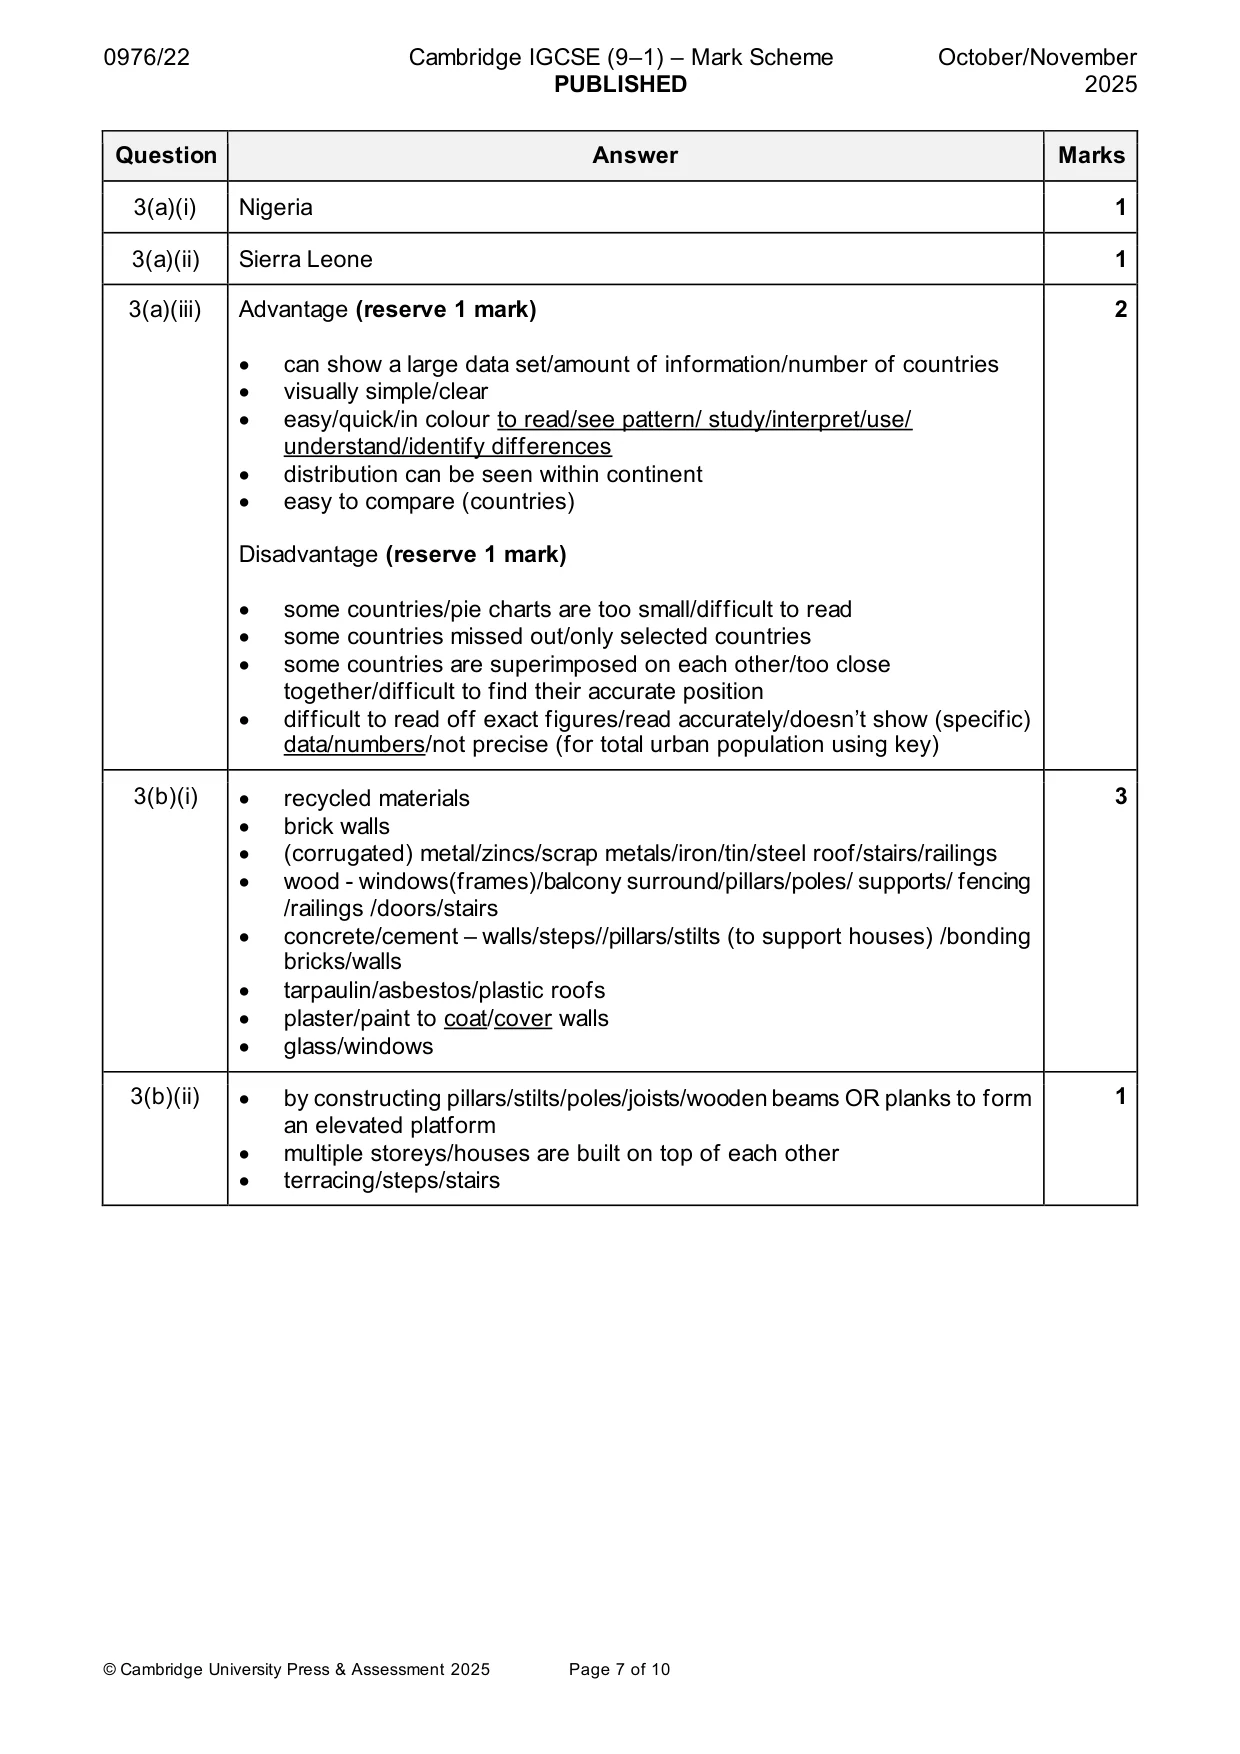
Mark scheme: 3(a)(i) Nigeria 1 3(a)(ii) Sierra Leone 1 3(a)(iii) Advantage (reserve 1 mark) 2 • can show a large data set/amount of information/number of countries • visually simple/clear • easy/quick/in colour to read/see pattern/ study/interpret/use/ understand/identify differences • distribution can be seen within continent • easy to compare (countries) Disadvantage (reserve 1 mark) • some countries/pie charts are too small/difficult to read • some countries missed out/only selected countries • some countries are superimposed on each other/too close together/difficult to find their accurate position • difficult to read off exact figures/read accurately/doesn’t show (specific) data/numbers/not precise (for total urban population using key) 3(b)(i) • recycled materials 3 • brick walls • (corrugated) metal/zincs/scrap metals/iron/tin/steel roof/stairs/railings • wood - windows(frames)/balcony surround/pillars/poles/ supports/ fencing /railings /doors/stairs • concrete/cement – walls/steps//pillars/stilts (to support houses) /bonding bricks/walls • tarpaulin/asbestos/plastic roofs • plaster/paint to coat/cover walls • glass/windows 3(b)(ii) • by constructing pillars/stilts/poles/joists/wooden beams OR planks to form 1 an elevated platform • multiple storeys/houses are built on top of each other • terracing/steps/stairs
Q4 · The tectonic plates and volcanic features of part of the USA
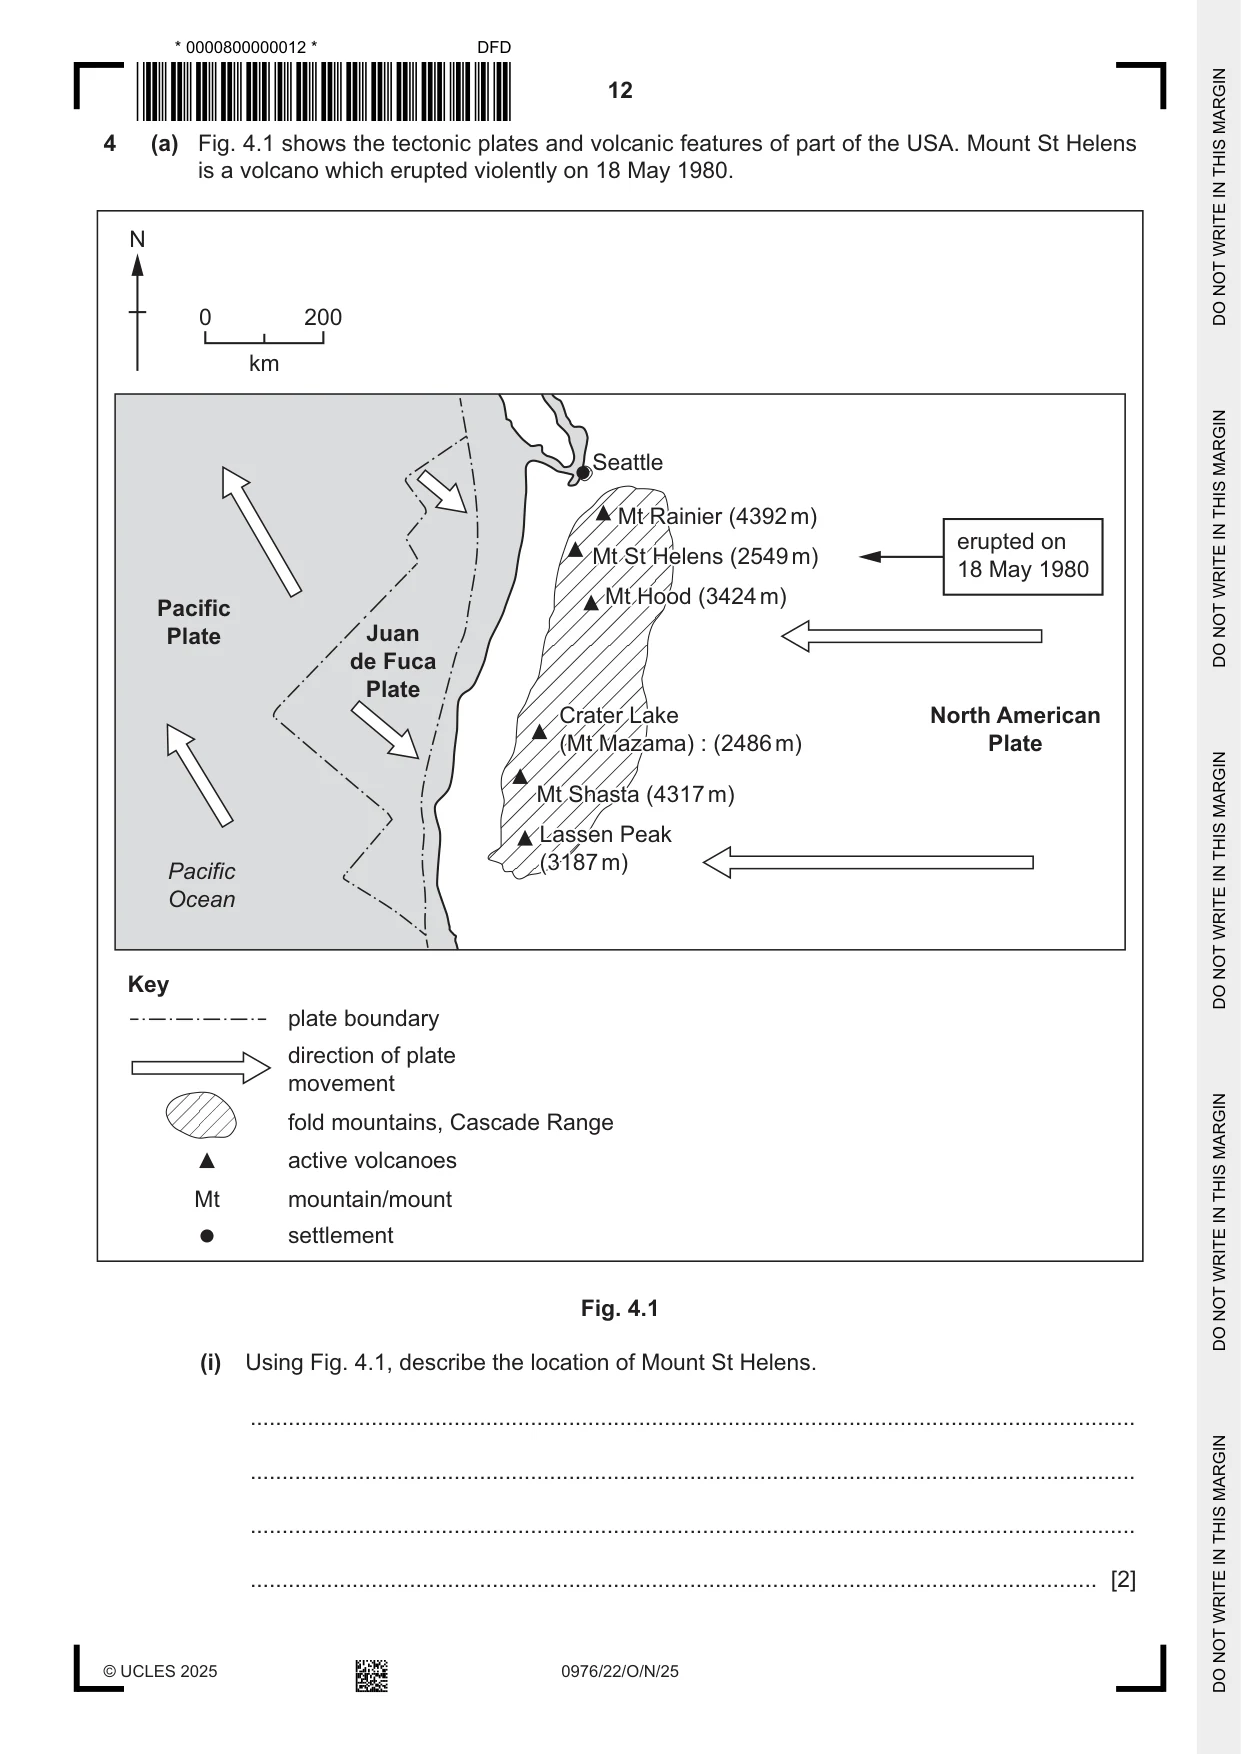
4 (a) Fig. 4.1 shows the tectonic plates and volcanic features of part of the USA. Mount St Helens is a volcano which erupted violently on 18 May 1980. N 0 200 km Seattle MtMt RainierRainier (4392(4392 m)m) erupted on MtMt StSt HelensHelens (2549(2549 m)m) 18 May 1980 MtMt HoodHood (3424(3424 m)m) Pacific Plate Juan de Fuca Plate CraterCrater LakeLake North American (Mt(Mt Mazama)Mazama) :: (2486(2486 m)m) Plate MtMt ShastaShasta (4317(4317 m)m) LassenLassen PeakPeak (3187(3187 m)m) Pacific Ocean Key plate boundary direction of plate movement fold mountains, Cascade Range active volcanoes Mt mountain/mount settlement Fig. 4.1 (i) Using Fig. 4.1, describe the location of Mount St Helens. ........................................................................................................................................... ........................................................................................................................................... ........................................................................................................................................... ..................................................................................................................................... [2] (ii) Name the type of plate boundary found between the Juan de Fuca and North American plates. Use Fig. 4.1 to explain your answer. name of type of plate boundary ......................................................................................... explanation ........................................................................................................................ ........................................................................................................................................... [2] (b) Fig. 4.2 (Insert) shows the effects of the Mount St Helens eruption on the surrounding area. Using Fig. 4.2, describe the impact of the eruption on the human environment. Content removed due to copyright restrictions.
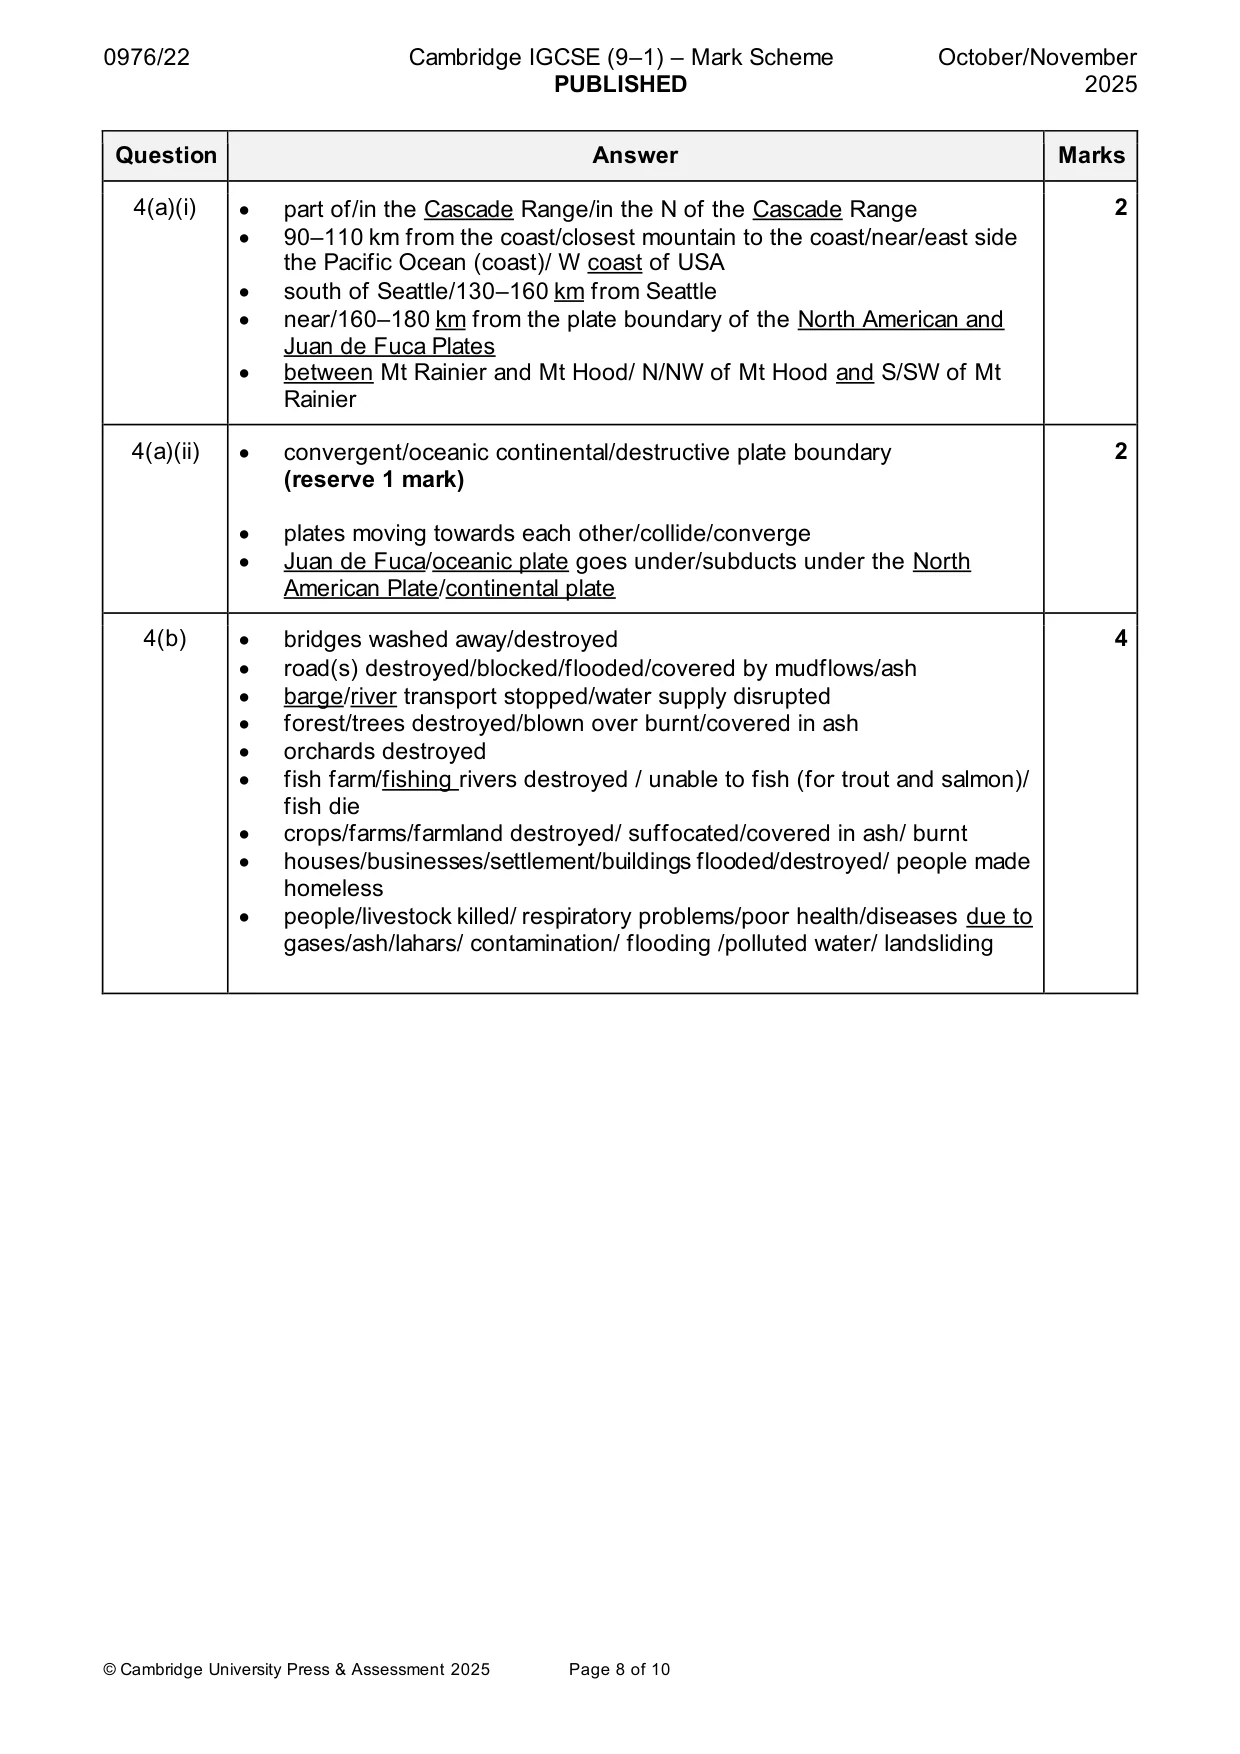
Mark scheme: 4(a)(i) • part of/in the Cascade Range/in the N of the Cascade Range 2 • 90–110 km from the coast/closest mountain to the coast/near/east side the Pacific Ocean (coast)/ W coast of USA • south of Seattle/130–160 km from Seattle • near/160–180 km from the plate boundary of the North American and Juan de Fuca Plates • between Mt Rainier and Mt Hood/ N/NW of Mt Hood and S/SW of Mt Rainier 4(a)(ii) • convergent/oceanic continental/destructive plate boundary 2 (reserve 1 mark) • plates moving towards each other/collide/converge • Juan de Fuca/oceanic plate goes under/subducts under the North American Plate/continental plate 4(b) • bridges washed away/destroyed 4 • road(s) destroyed/blocked/flooded/covered by mudflows/ash • barge/river transport stopped/water supply disrupted • forest/trees destroyed/blown over burnt/covered in ash • orchards destroyed • fish farm/fishing rivers destroyed / unable to fish (for trout and salmon)/ fish die • crops/farms/farmland destroyed/ suffocated/covered in ash/ burnt • houses/businesses/settlement/buildings flooded/destroyed/ people made homeless • people/livestock killed/ respiratory problems/poor health/diseases due to gases/ash/lahars/ contamination/ flooding /polluted water/ landsliding
Q5 · Changes in the amount of tropical rainforest (million hectares (ha)) in the Brazilian…
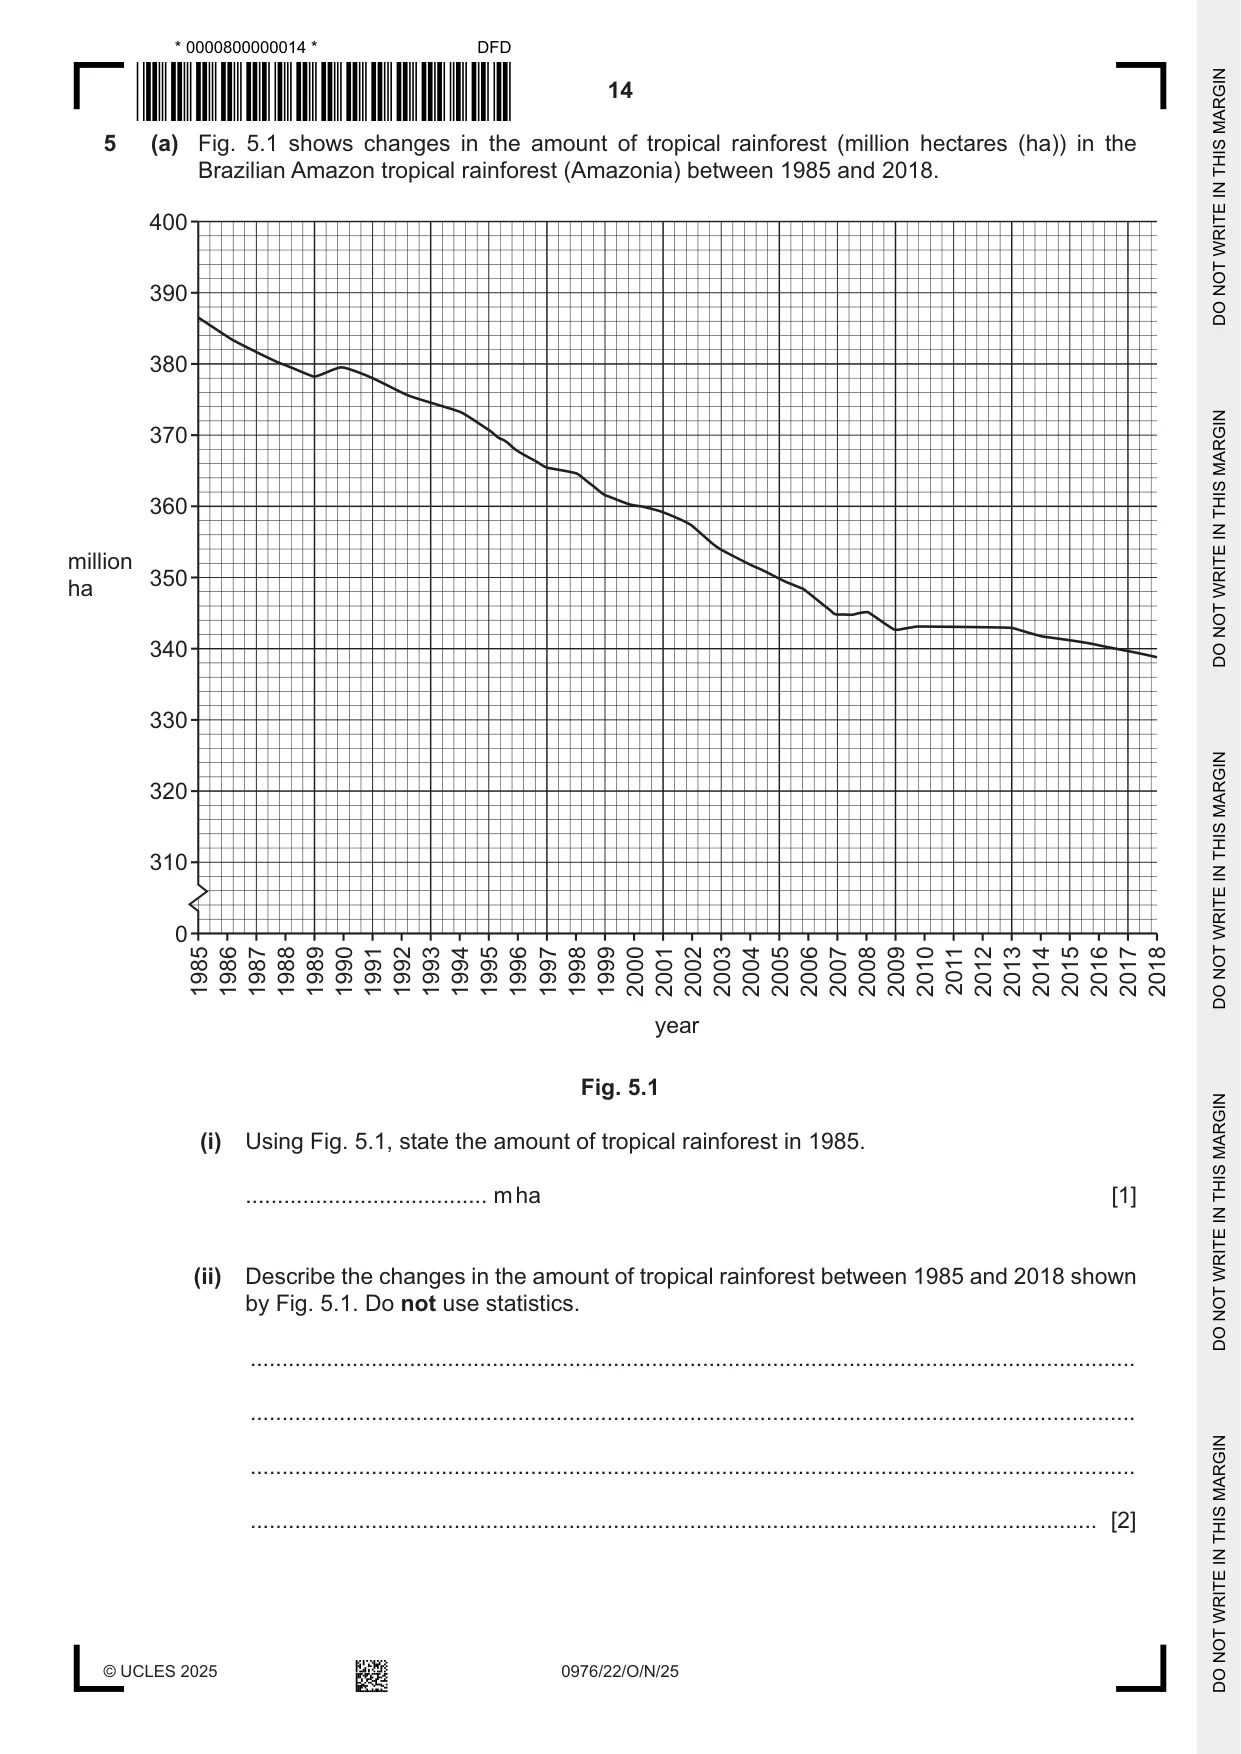
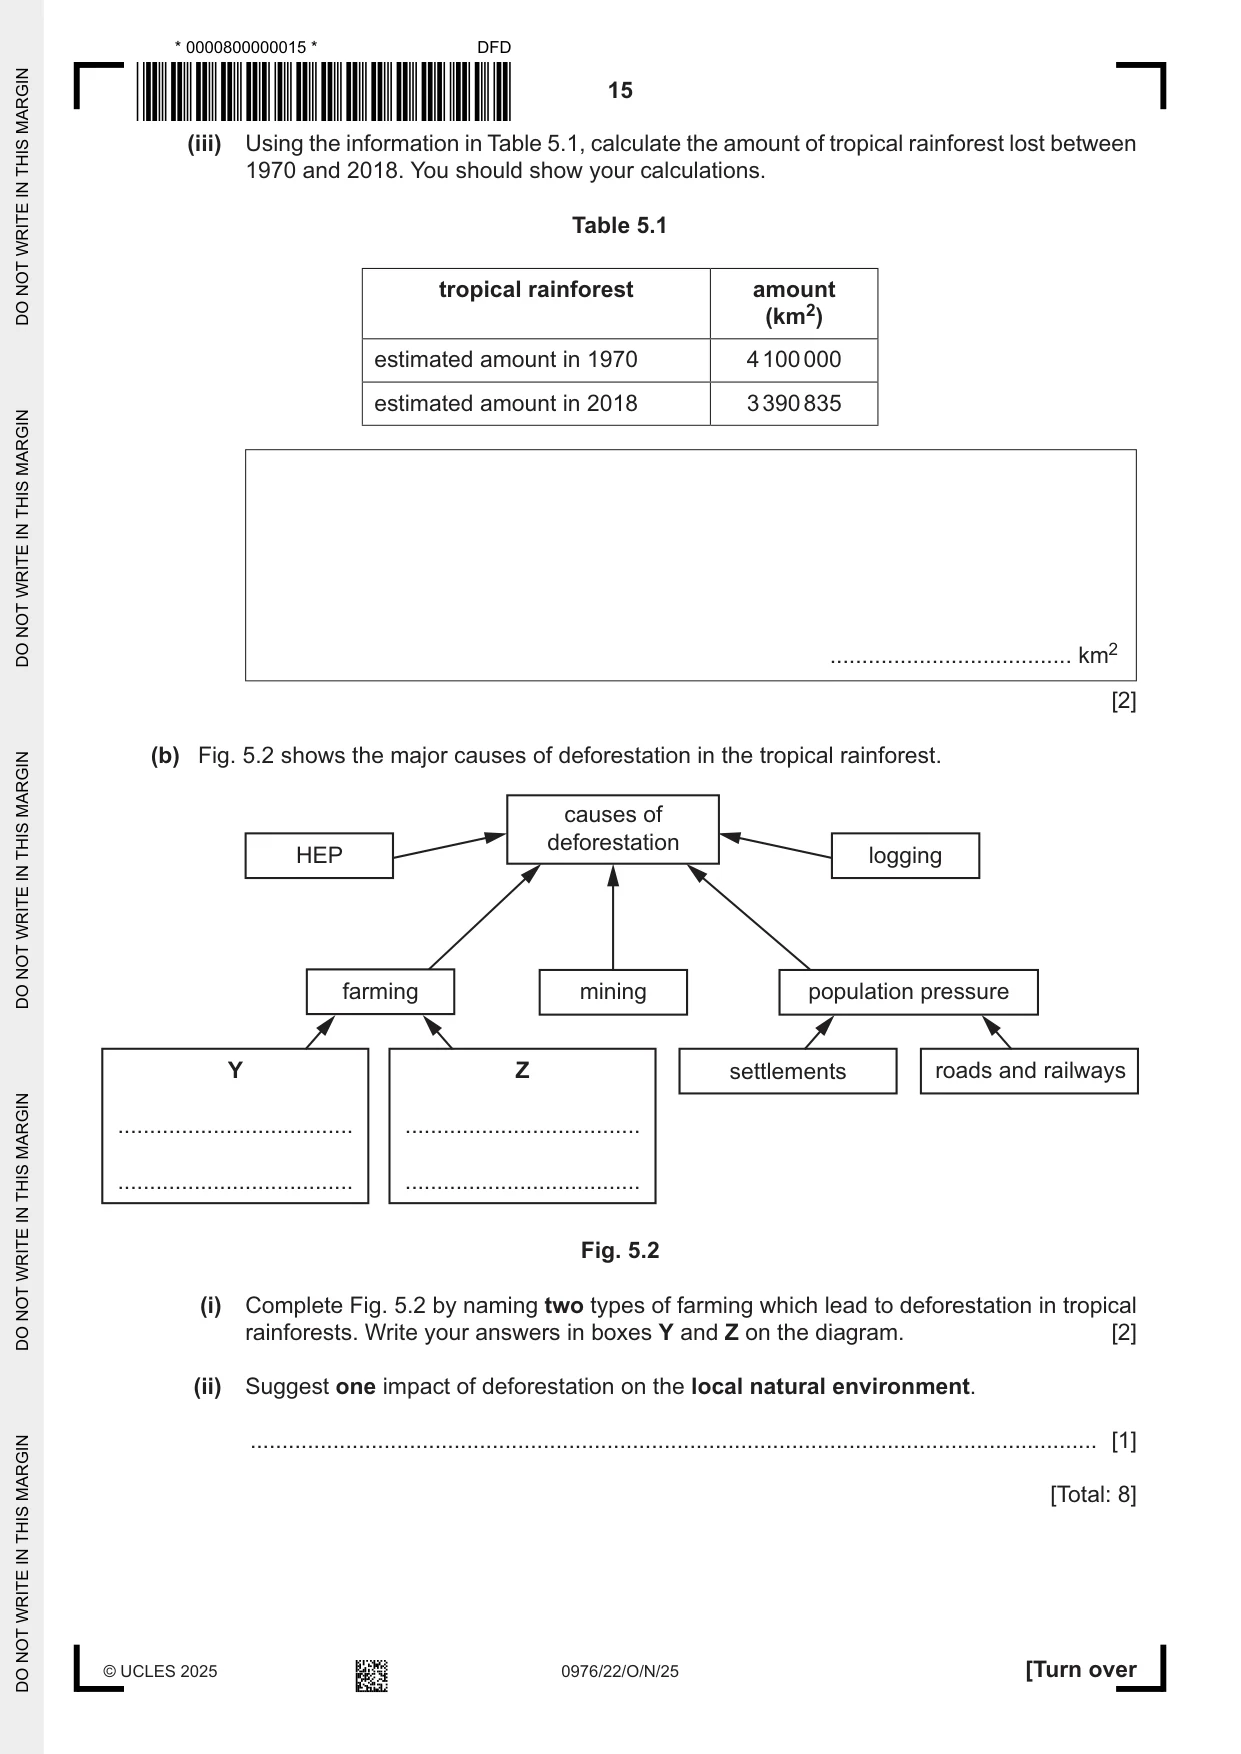
5 (a) Fig. 5.1 shows changes in the amount of tropical rainforest (million hectares (ha)) in the Brazilian Amazon tropical rainforest (Amazonia) between 1985 and 2018. 400 390 380 370 360 million 350ha 340 330 320 310 0 1985 1986 1987 1988 1989 1990 1991 1992 1993 1994 1995 1996 1997 1998 1999 2000 2001 2002 2003 2004 2005 2006 2007 2008 2009 2010 2011 2012 2013 2014 2015 2016 2017 2018 year Fig. 5.1 (i) Using Fig. 5.1, state the amount of tropical rainforest in 1985. ...................................... m ha [1] (ii) Describe the changes in the amount of tropical rainforest between 1985 and 2018 shown by Fig. 5.1. Do not use statistics. ........................................................................................................................................... ........................................................................................................................................... ........................................................................................................................................... ..................................................................................................................................... [2] (iii) Using the information in Table 5.1, calculate the amount of tropical rainforest lost between 1970 and 2018. You should show your calculations. Table 5.1 tropical rainforest amount (km2) estimated amount in 1970 4 100 000 estimated amount in 2018 3 390 835 ...................................... km2 [2] (b) Fig. 5.2 shows the major causes of deforestation in the tropical rainforest. causes of deforestation HEP logging farming mining population pressure Y Z settlements roads and railways ..................................... ..................................... ..................................... ..................................... Fig. 5.2 (i) Complete Fig. 5.2 by naming two types of farming which lead to deforestation in tropical rainforests. Write your answers in boxes Y and Z on the diagram. [2] (ii) Suggest one impact of deforestation on the local natural environment. ..................................................................................................................................... [1] [Total: 8]
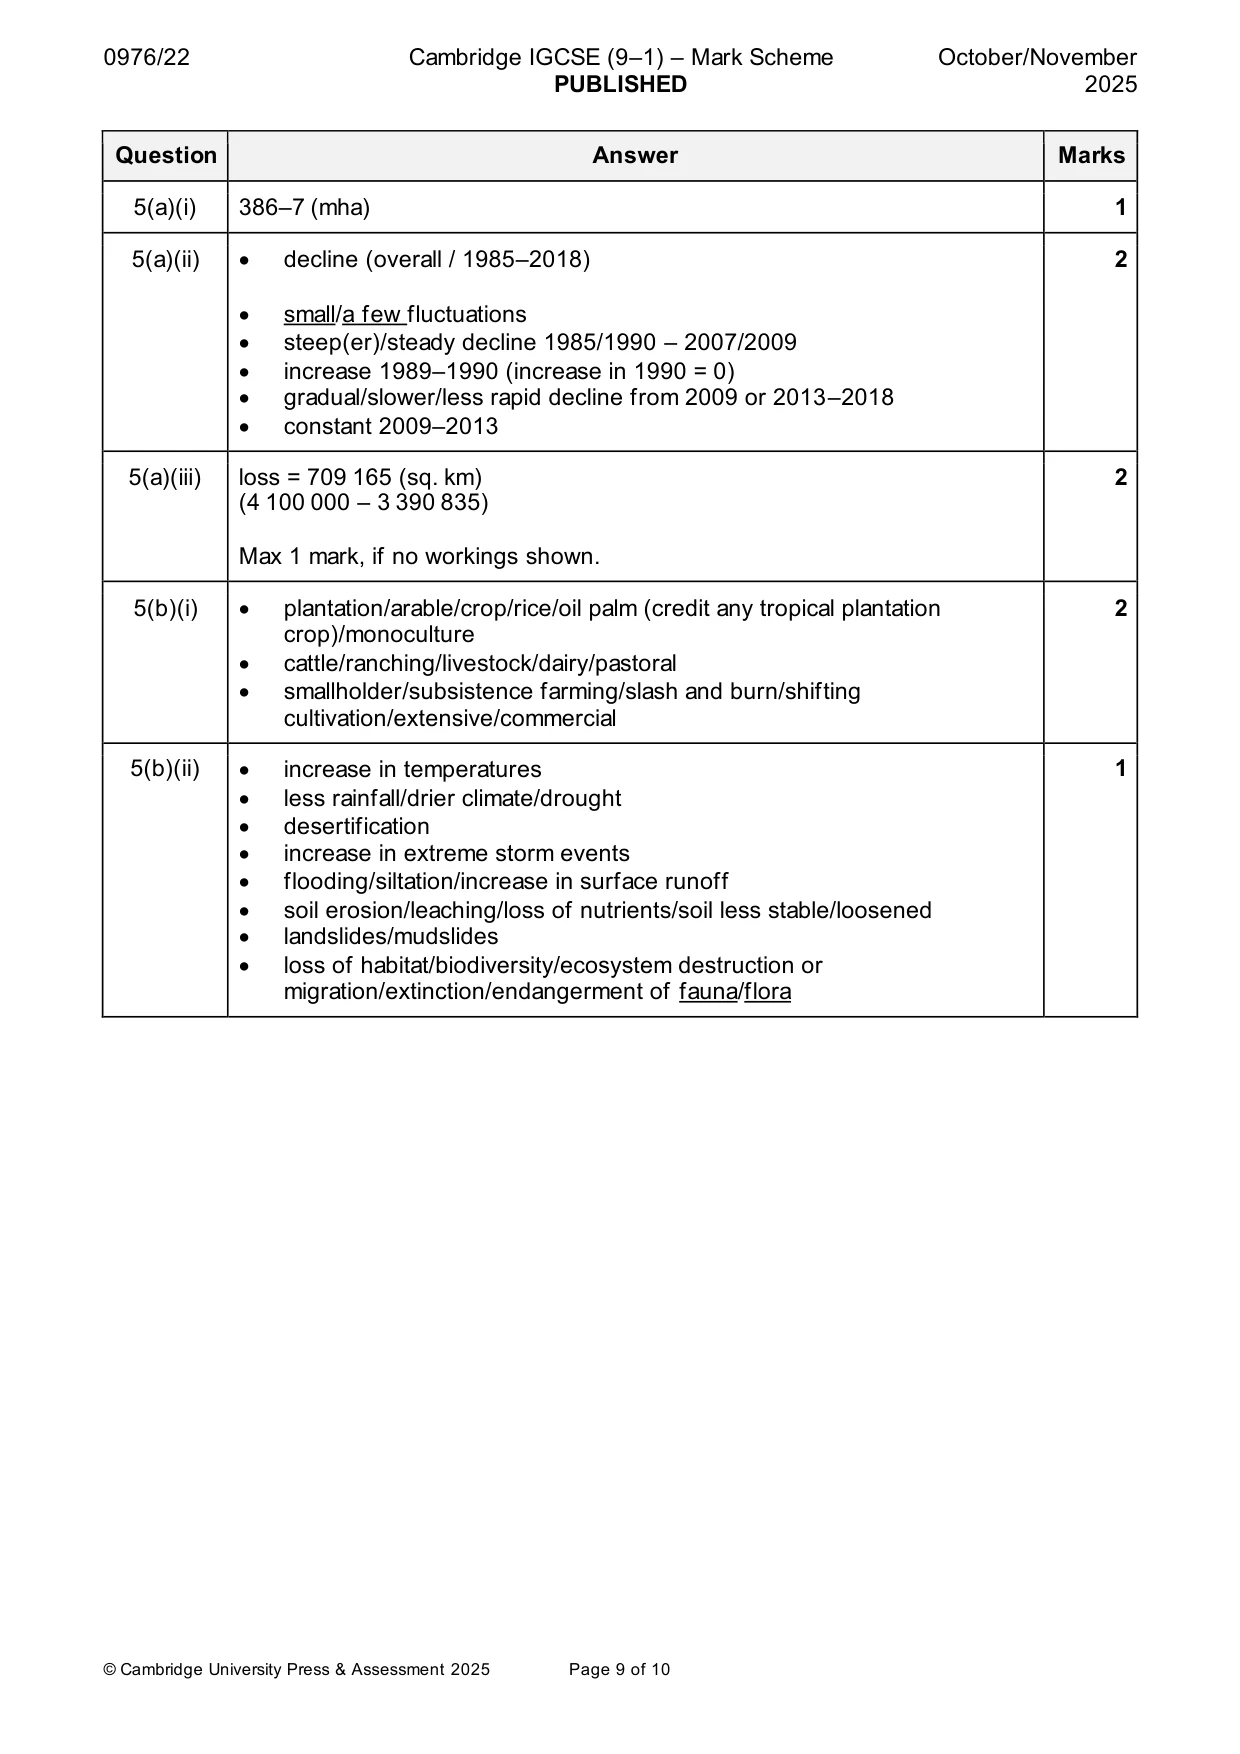
Mark scheme: 5(a)(i) 386–7 (mha) 1 5(a)(ii) • decline (overall / 1985–2018) 2 • small/a few fluctuations • steep(er)/steady decline 1985/1990 – 2007/2009 • increase 1989–1990 (increase in 1990 = 0) • gradual/slower/less rapid decline from 2009 or 2013–2018 • constant 2009–2013 5(a)(iii) loss = 709 165 (sq. km) 2 (4 100 000 – 3 390 835) Max 1 mark, if no workings shown. 5(b)(i) • plantation/arable/crop/rice/oil palm (credit any tropical plantation 2 crop)/monoculture • cattle/ranching/livestock/dairy/pastoral • smallholder/subsistence farming/slash and burn/shifting cultivation/extensive/commercial 5(b)(ii) • increase in temperatures 1 • less rainfall/drier climate/drought • desertification • increase in extreme storm events • flooding/siltation/increase in surface runoff • soil erosion/leaching/loss of nutrients/soil less stable/loosened • landslides/mudslides • loss of habitat/biodiversity/ecosystem destruction or migration/extinction/endangerment of fauna/flora
Q6 · What is meant by a ‘non-renewable resource’?
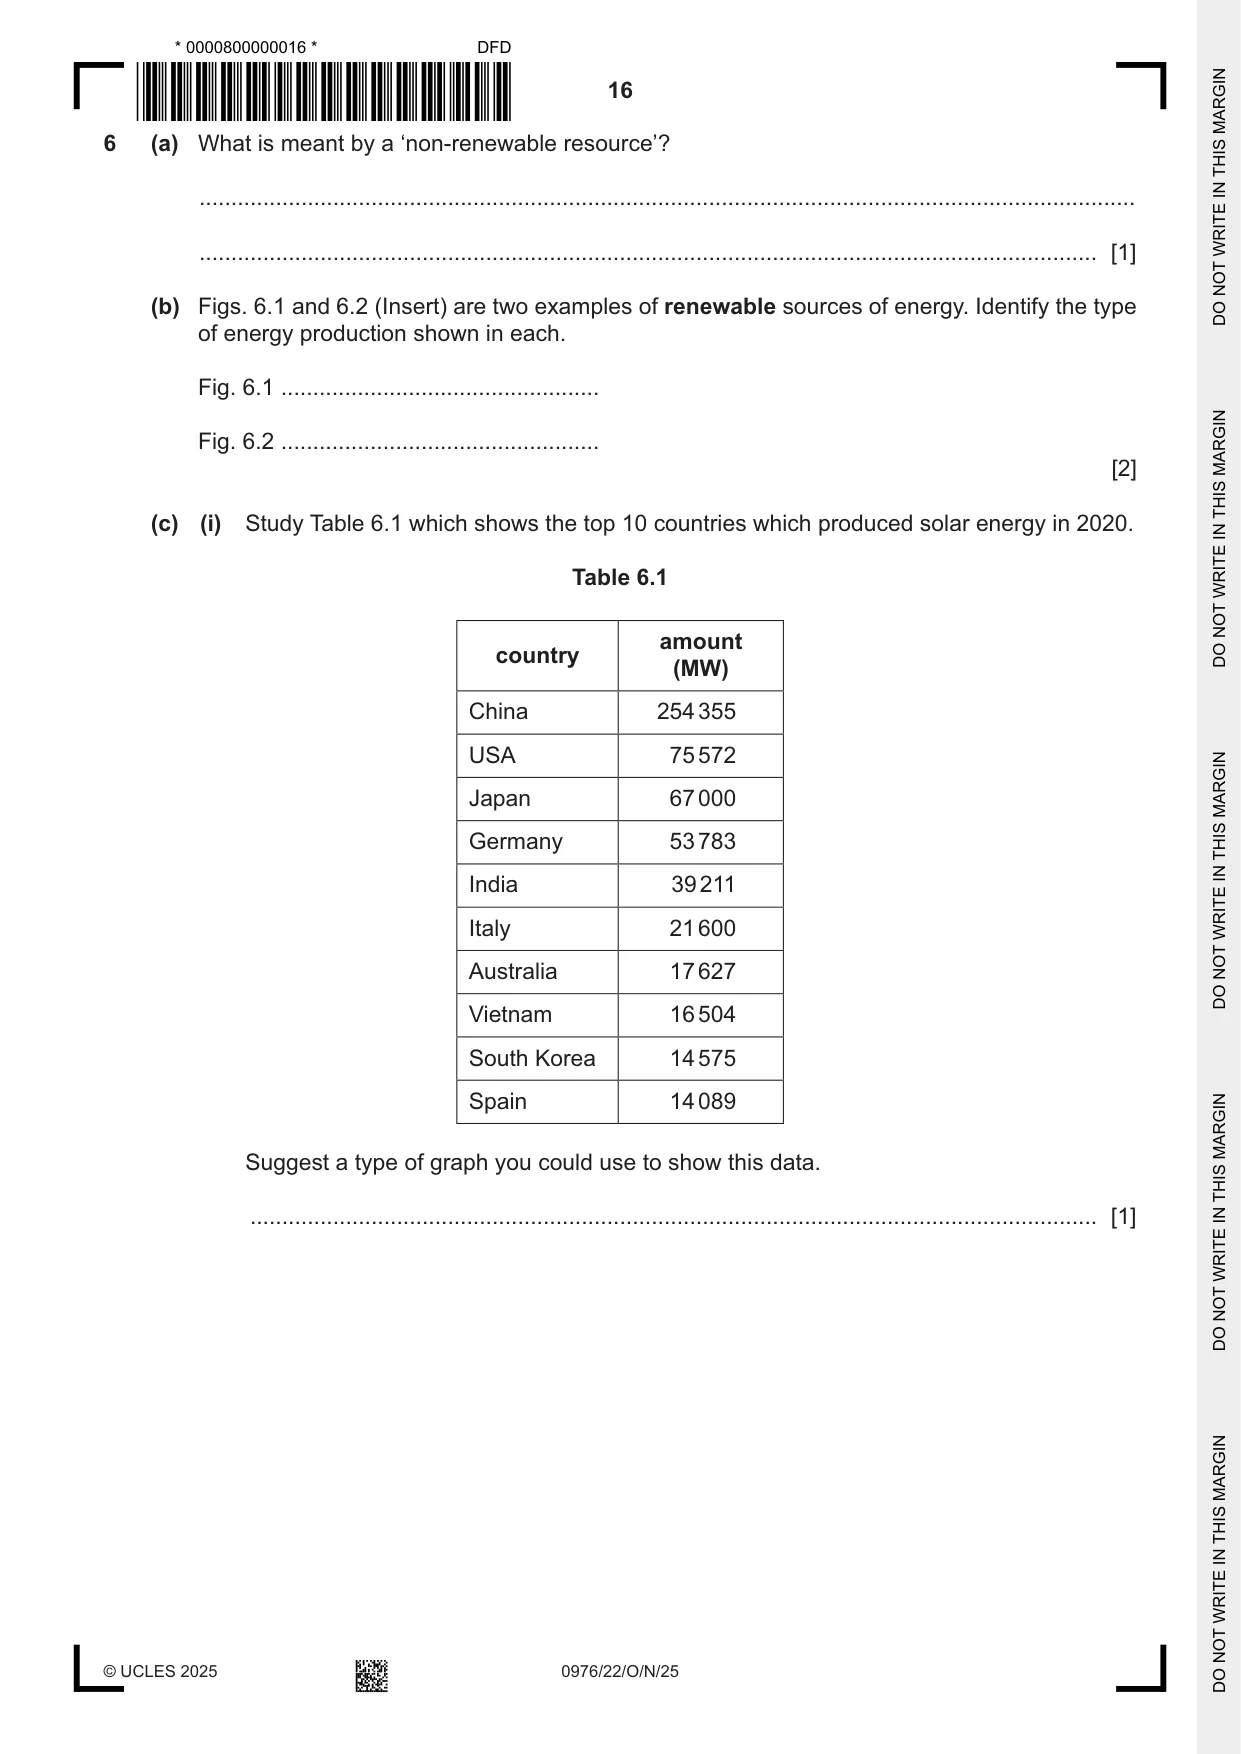
6 (a) What is meant by a ‘non-renewable resource’? ................................................................................................................................................... ............................................................................................................................................. [1] (b) Figs. 6.1 and 6.2 (Insert) are two examples of renewable sources of energy. Identify the type of energy production shown in each. Fig. 6.1 .................................................. Fig. 6.2 .................................................. [2] (c) (i) Study Table 6.1 which shows the top 10 countries which produced solar energy in 2020. Table 6.1 amount country (MW) China 254 355 USA 75 572 Japan 67 000 Germany 53 783 India 39 211 Italy 21 600 Australia 17 627 Vietnam 16 504 South Korea 14 575 Spain 14 089 Suggest a type of graph you could use to show this data. ..................................................................................................................................... [1] (ii) Solar power is not suitable for all countries. Suggest why some people are in favour of developing solar power and other people are against it. in favour ............................................................................................................................ ........................................................................................................................................... ........................................................................................................................................... ........................................................................................................................................... against ............................................................................................................................... ........................................................................................................................................... ........................................................................................................................................... ........................................................................................................................................... [4] [Total: 8] Additional page If you use the following page to complete the answer to any question, the question number must be clearly shown. .................................................................................................................................................................. .................................................................................................................................................................. .................................................................................................................................................................. .................................................................................................................................................................. .................................................................................................................................................................. .................................................................................................................................................................. .................................................................................................................................................................. .................................................................................................................................................................. .................................................................................................................................................................. .................................................................................................................................................................. .................................................................................................................................................................. .................................................................................................................................................................. .................................................................................................................................................................. .................................................................................................................................................................. .................................................................................................................................................................. .................................................................................................................................................................. .................................................................................................................................................................. .................................................................................................................................................................. .................................................................................................................................................................. .................................................................................................................................................................. .................................................................................................................................................................. .................................................................................................................................................................. .................................................................................................................................................................. .................................................................................................................................................................. .................................................................................................................................................................. .................................................................................................................................................................. © UCLES 2025 0976/22/O/N/25
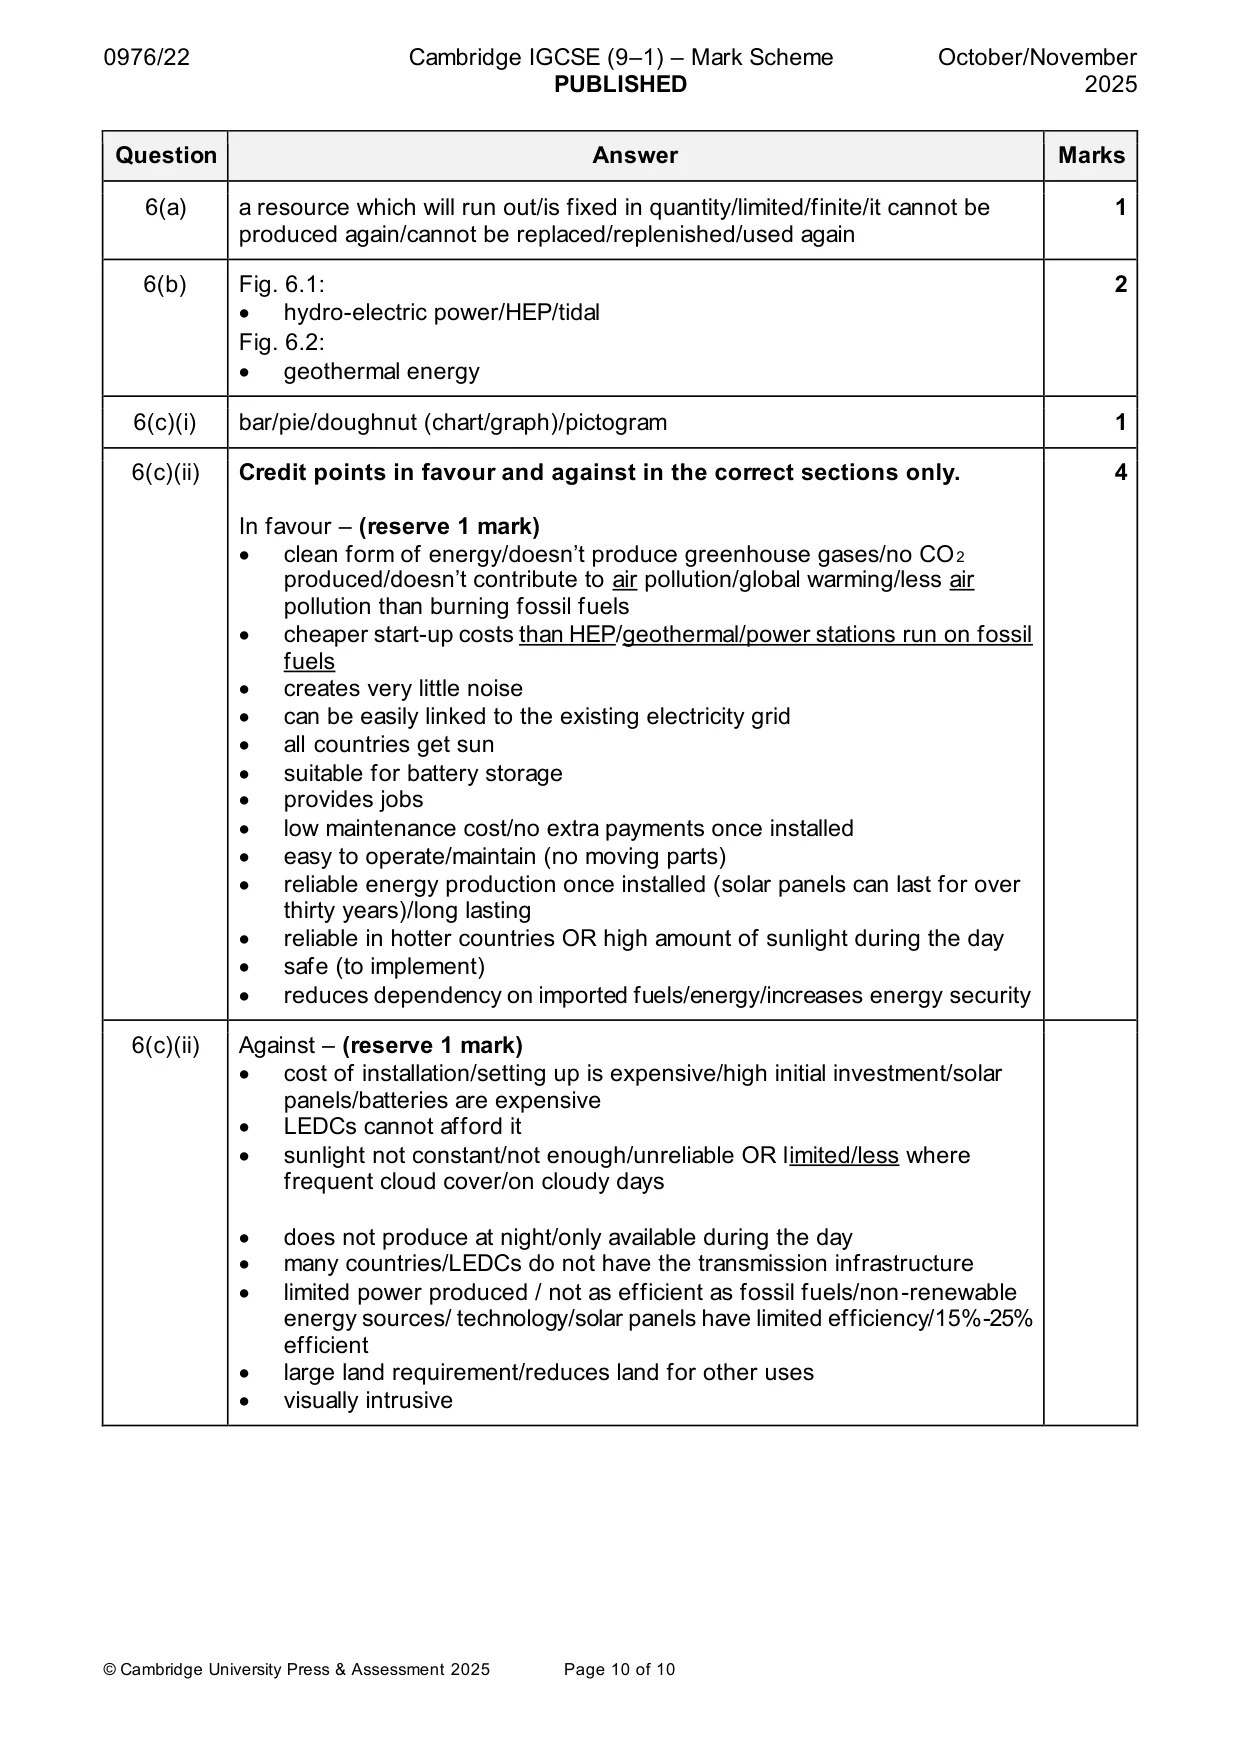
Mark scheme: 6(a) a resource which will run out/is fixed in quantity/limited/finite/it cannot be 1 produced again/cannot be replaced/replenished/used again 6(b) Fig. 6.1: 2 • hydro-electric power/HEP/tidal Fig. 6.2: • geothermal energy 6(c)(i) bar/pie/doughnut (chart/graph)/pictogram 1 6(c)(ii) Credit points in favour and against in the correct sections only. 4 In favour – (reserve 1 mark) • clean form of energy/doesn’t produce greenhouse gases/no CO2 produced/doesn’t contribute to air pollution/global warming/less air pollution than burning fossil fuels • cheaper start-up costs than HEP/geothermal/power stations run on fossil fuels • creates very little noise • can be easily linked to the existing electricity grid • all countries get sun • suitable for battery storage • provides jobs • low maintenance cost/no extra payments once installed • easy to operate/maintain (no moving parts) • reliable energy production once installed (solar panels can last for over thirty years)/long lasting • reliable in hotter countries OR high amount of sunlight during the day • safe (to implement) • reduces dependency on imported fuels/energy/increases energy security 6(c)(ii) Against – (reserve 1 mark) • cost of installation/setting up is expensive/high initial investment/solar panels/batteries are expensive • LEDCs cannot afford it • sunlight not constant/not enough/unreliable OR limited/less where frequent cloud cover/on cloudy days • does not produce at night/only available during the day • many countries/LEDCs do not have the transmission infrastructure • limited power produced / not as efficient as fossil fuels/non-renewable energy sources/ technology/solar panels have limited efficiency/15%-25% efficient • large land requirement/reduces land for other uses • visually intrusive
What was in this paper
The subtopics covered by these 6 questions, and how many questions each got. Open one in a new tab to see every Cambridge question on it.
What you needed in this session
Cambridge’s own grade thresholds for 2025 Oct/Nov, Paper 2 · Variant 2. A higher threshold means an easier paper — the bar moves with how the cohort did.