Cambridge IGCSE Geography (9-1) 0976 — 2020 May/June Paper 2 · Variant 2
0976/22/M/J/20 · 6 questions · 60 marks · ≈68 min
The question paper and its mark scheme, free to read here and free to download. This is Cambridge’s own paper, exactly as it was sat.
Question paper16 pages
Mark scheme6 pages
Answers below. Sit the paper first if you are practising.
Questions as text
Q1 · Study the map extract for Hamoir, Belgium
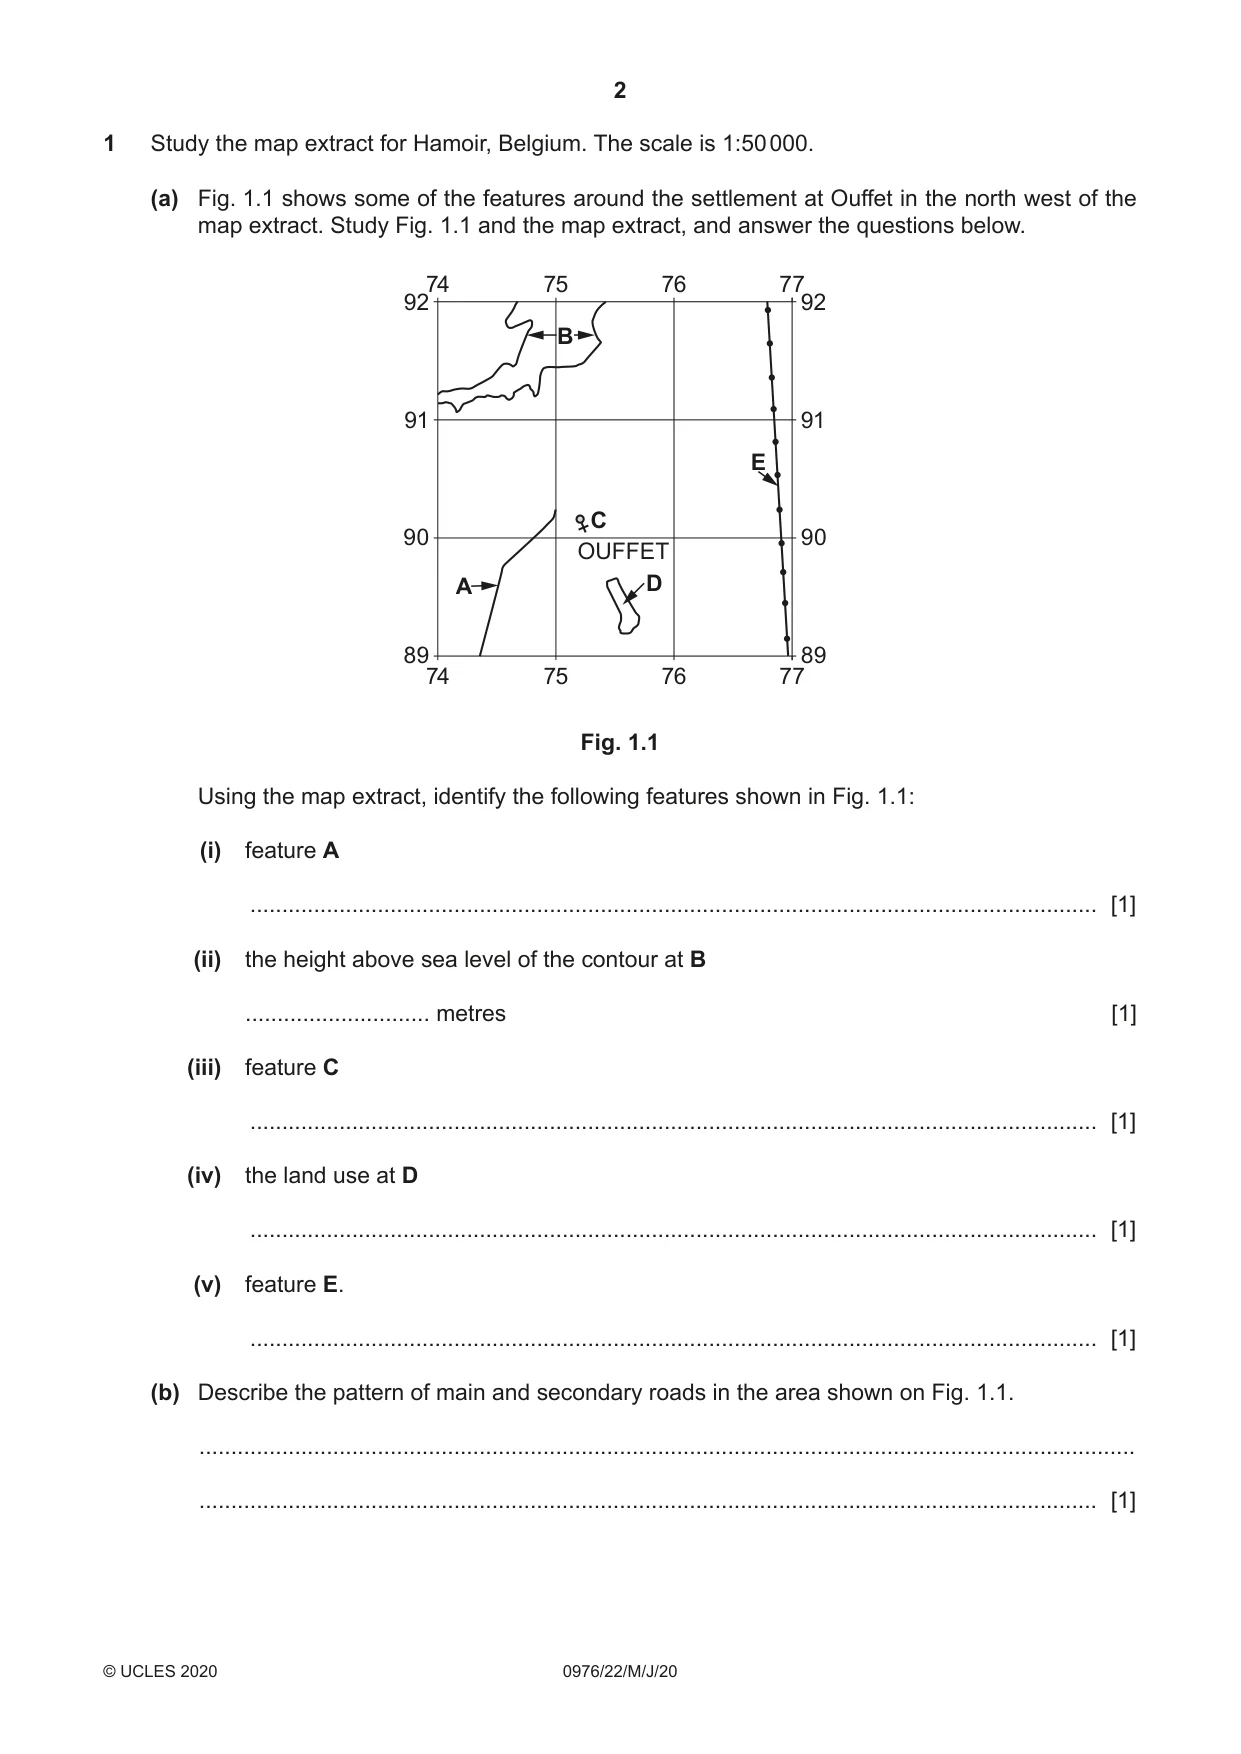
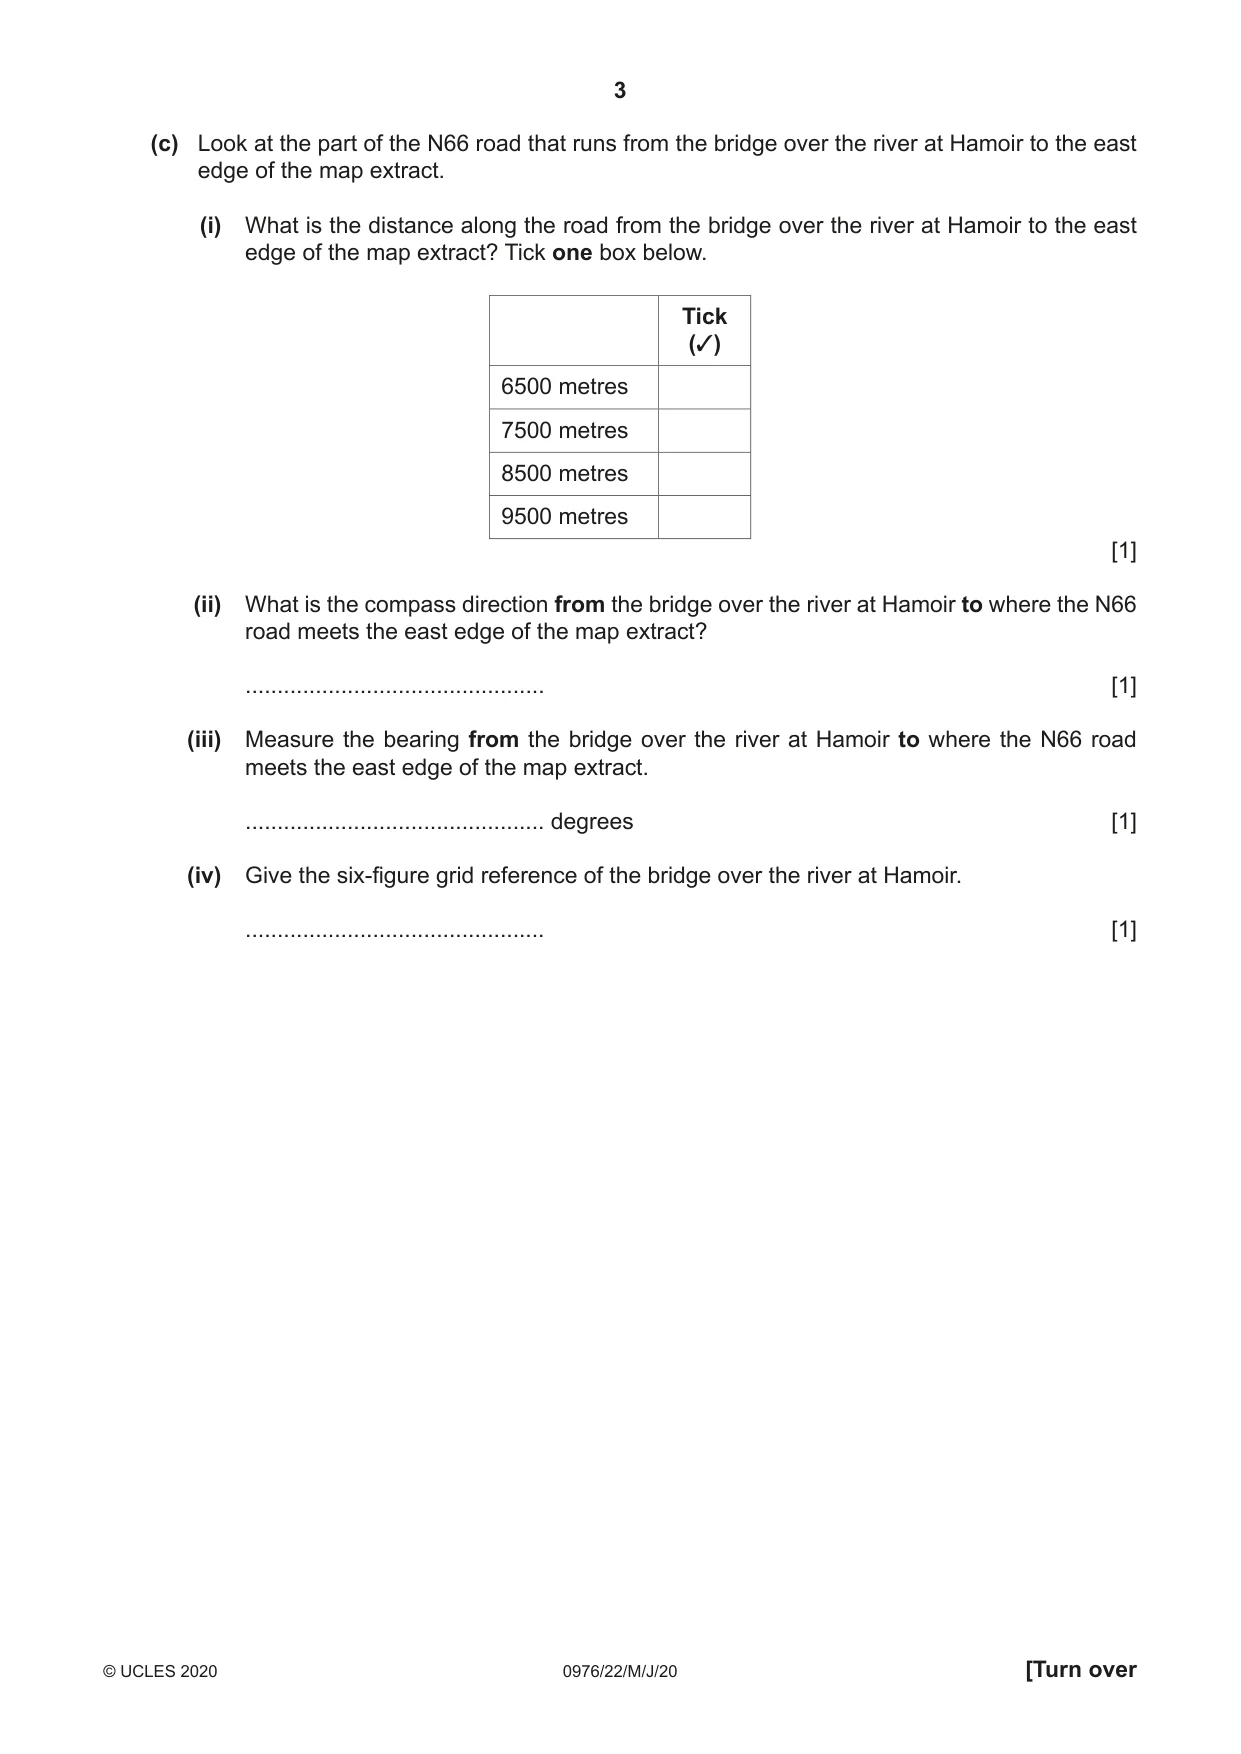
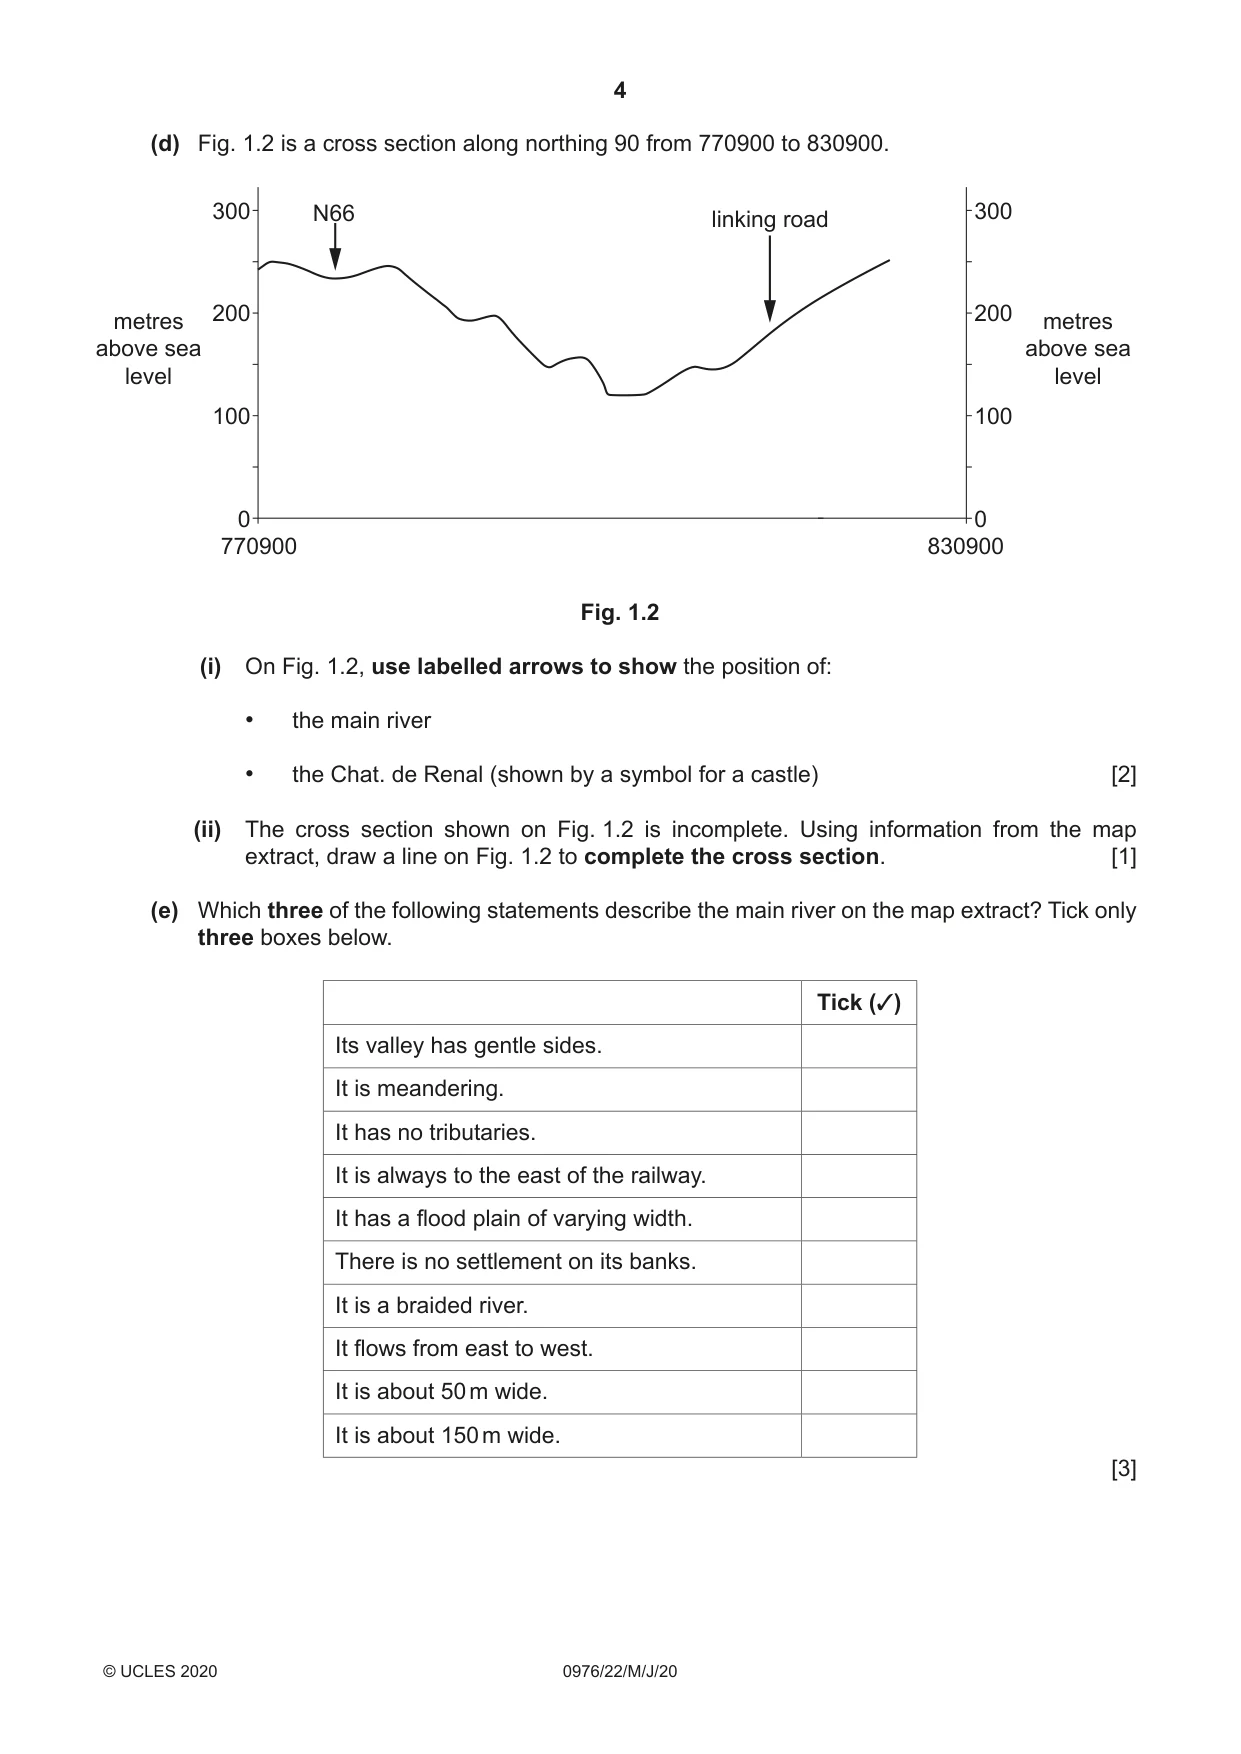
1 Study the map extract for Hamoir, Belgium. The scale is 1:50 000. (a) Fig. 1.1 shows some of the features around the settlement at Ouffet in the north west of the map extract. Study Fig. 1.1 and the map extract, and answer the questions below. 74 75 76 77 92 92 B 91 91 E C 90 90 OUFFET A D 89 89 74 75 76 77 Fig. 1.1 Using the map extract, identify the following features shown in Fig. 1.1: (i) feature A ..................................................................................................................................... [1] (ii) the height above sea level of the contour at B ............................. metres [1] (iii) feature C ..................................................................................................................................... [1] (iv) the land use at D ..................................................................................................................................... [1] (v) feature E. ..................................................................................................................................... [1] (b) Describe the pattern of main and secondary roads in the area shown on Fig. 1.1. ................................................................................................................................................... ............................................................................................................................................. [1] (c) Look at the part of the N66 road that runs from the bridge over the river at Hamoir to the east edge of the map extract. (i) What is the distance along the road from the bridge over the river at Hamoir to the east edge of the map extract? Tick one box below. Tick (✓) 6500 metres 7500 metres 8500 metres 9500 metres [1] (ii) What is the compass direction from the bridge over the river at Hamoir to where the N66 road meets the east edge of the map extract? ............................................... [1] (iii) Measure the bearing from the bridge over the river at Hamoir to where the N66 road meets the east edge of the map extract. ............................................... degrees [1] (iv) Give the six-figure grid reference of the bridge over the river at Hamoir. ............................................... [1] (d) Fig. 1.2 is a cross section along northing 90 from 770900 to 830900. 300 N66 linking road 300 200 200 metres metres above sea above sea level level 100 100 0 0 770900 830900 Fig. 1.2 (i) On Fig. 1.2, use labelled arrows to show the position of: • the main river • the Chat. de Renal (shown by a symbol for a castle) [2] (ii) The cross section shown on Fig. 1.2 is incomplete. Using information from the map extract, draw a line on Fig. 1.2 to complete the cross section. [1] (e) Which three of the following statements describe the main river on the map extract? Tick only three boxes below. Tick (✓) Its valley has gentle sides. It is meandering. It has no tributaries. It is always to the east of the railway. It has a flood plain of varying width. There is no settlement on its banks. It is a braided river. It flows from east to west. It is about 50 m wide. It is about 150 m wide. [3] (f) Look at the settlement at Hamoir. Describe the site and give reasons for the growth of the settlement. ................................................................................................................................................... ................................................................................................................................................... ................................................................................................................................................... ................................................................................................................................................... ................................................................................................................................................... ................................................................................................................................................... ................................................................................................................................................... ................................................................................................................................................... ................................................................................................................................................... ............................................................................................................................................. [4] [Total: 20]
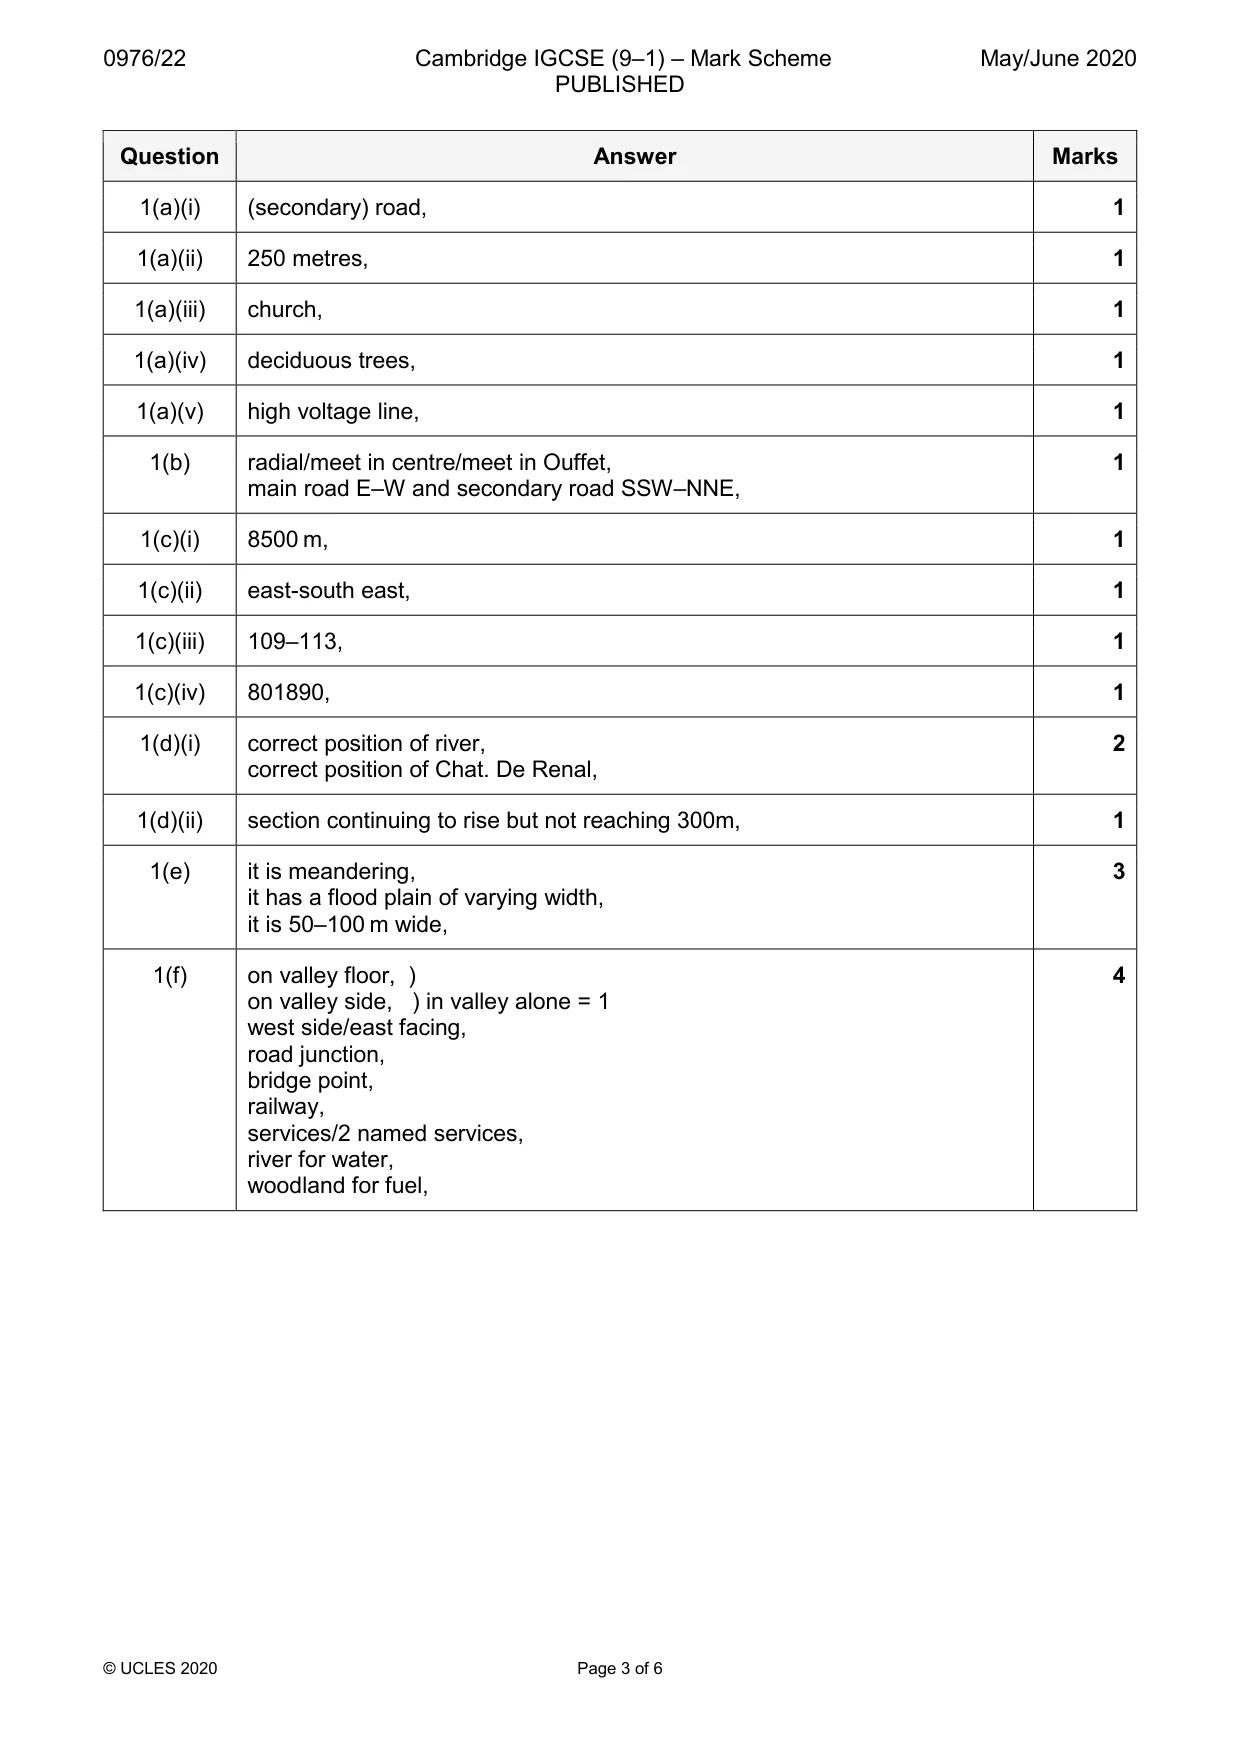
Mark scheme: Question Answer Marks 1(a)(i) (secondary) road, 1 1(a)(ii) 250 metres, 1 1(a)(iii) church, 1 1(a)(iv) deciduous trees, 1 1(a)(v) high voltage line, 1 1(b) radial/meet in centre/meet in Ouffet, 1 main road E–W and secondary road SSW–NNE, 1(c)(i) 8500 m, 1 1(c)(ii) east-south east, 1 1(c)(iii) 109–113, 1 1(c)(iv) 801890, 1 1(d)(i) correct position of river, 2 correct position of Chat. De Renal, 1(d)(ii) section continuing to rise but not reaching 300m, 1 1(e) it is meandering, 3 it has a flood plain of varying width, it is 50–100 m wide, 1(f) on valley floor, ) 4 on valley side, ) in valley alone = 1 west side/east facing, road junction, bridge point, railway, services/2 named services, river for water, woodland for fuel,
More questions on Settlements (rural and urban) and service provision
Question 2
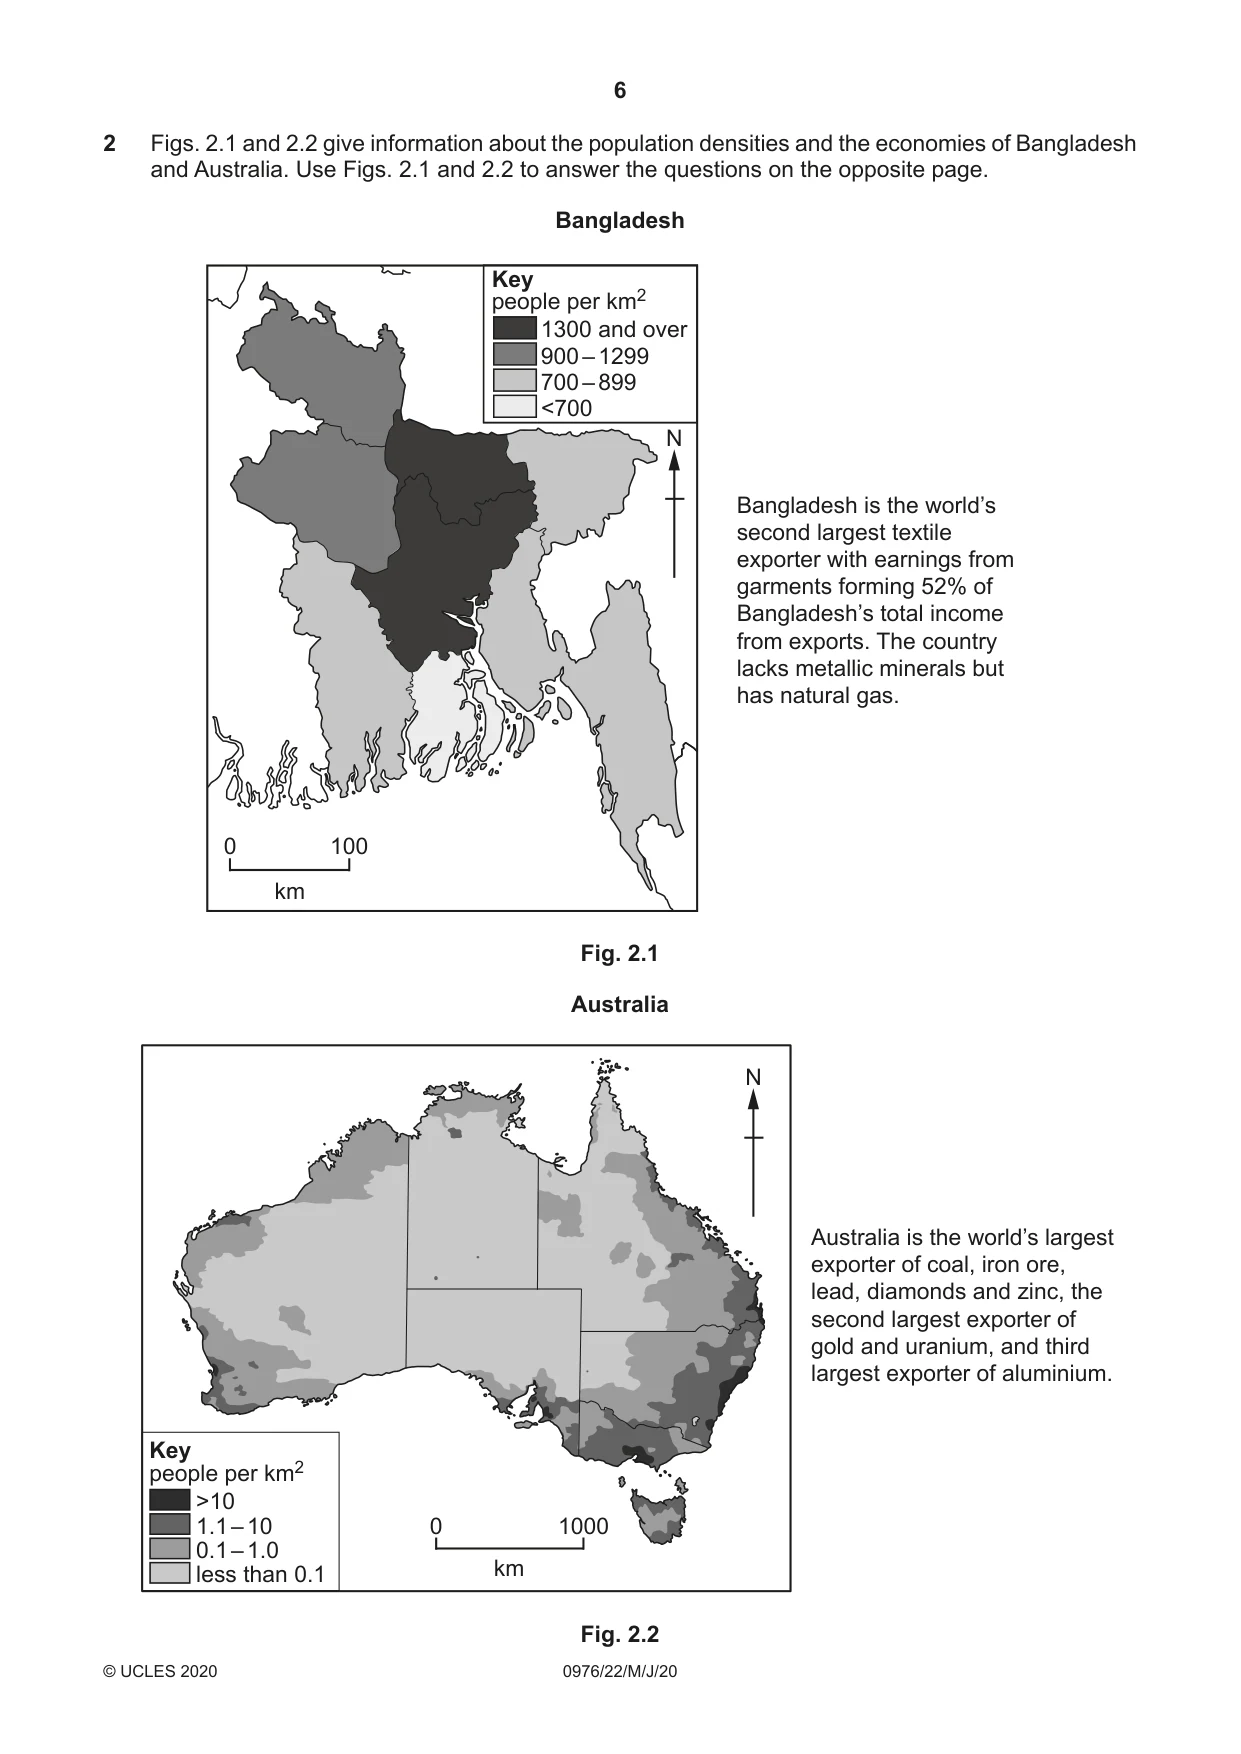
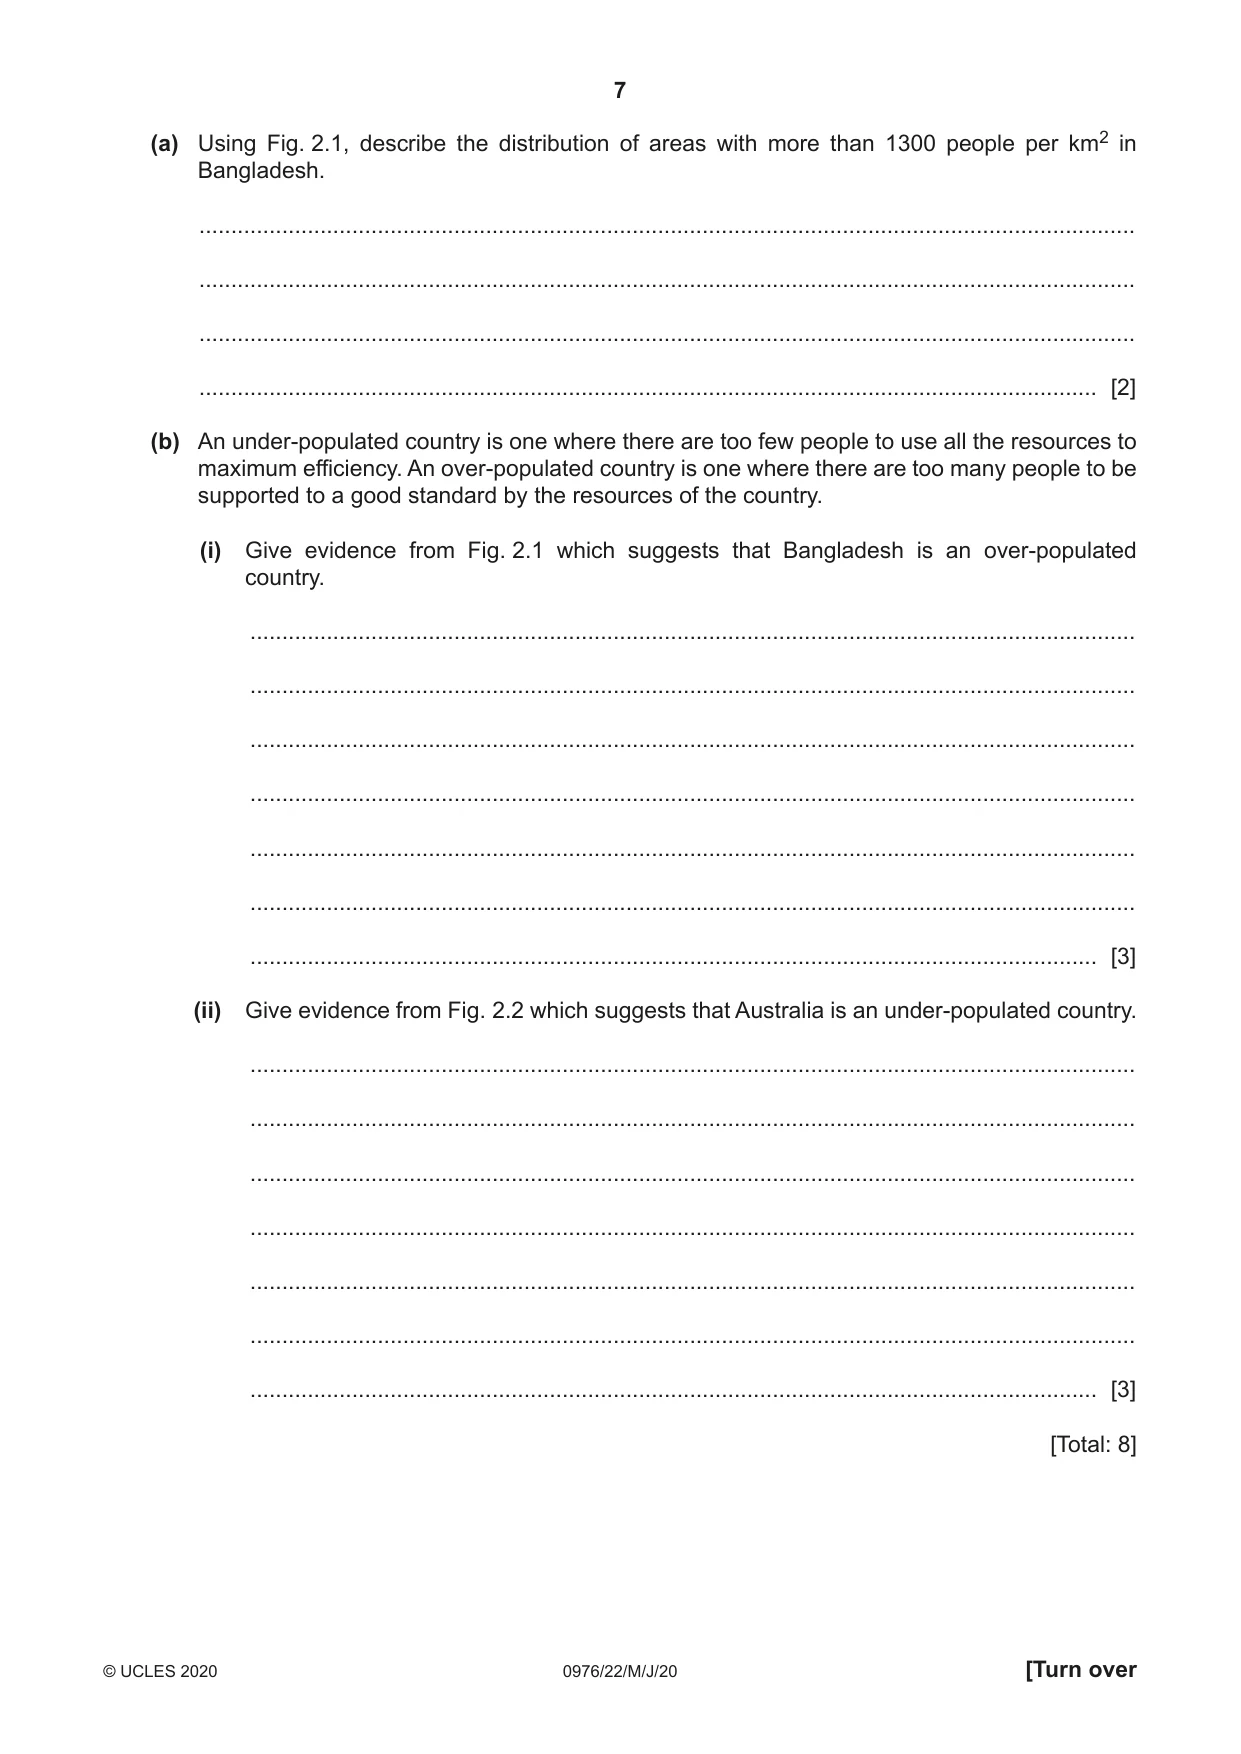
2 Figs. 2.1 and 2.2 give information about the population densities and the economies of Bangladesh and Australia. Use Figs. 2.1 and 2.2 to answer the questions on the opposite page. Bangladesh Key people per km2 1300 and over 900 – 1299 700 – 899 <700 N Bangladesh is the world’s second largest textile exporter with earnings from garments forming 52% of Bangladesh’s total income from exports. The country lacks metallic minerals but has natural gas. 0 100 km Fig. 2.1 Australia N Australia is the world’s largest exporter of coal, iron ore, lead, diamonds and zinc, the second largest exporter of gold and uranium, and third largest exporter of aluminium. Key people per km2 >10 1.1 – 10 0 1000 0.1 – 1.0 km less than 0.1 Fig. 2.2 (a) Using Fig. 2.1, describe the distribution of areas with more than 1300 people per km2 in Bangladesh. ................................................................................................................................................... ................................................................................................................................................... ................................................................................................................................................... ............................................................................................................................................. [2] (b) An under-populated country is one where there are too few people to use all the resources to maximum efficiency. An over-populated country is one where there are too many people to be supported to a good standard by the resources of the country. (i) Give evidence from Fig. 2.1 which suggests that Bangladesh is an over-populated country. ........................................................................................................................................... ........................................................................................................................................... ........................................................................................................................................... ........................................................................................................................................... ........................................................................................................................................... ........................................................................................................................................... ..................................................................................................................................... [3] (ii) Give evidence from Fig. 2.2 which suggests that Australia is an under-populated country. ........................................................................................................................................... ........................................................................................................................................... ........................................................................................................................................... ........................................................................................................................................... ........................................................................................................................................... ........................................................................................................................................... ..................................................................................................................................... [3] [Total: 8]
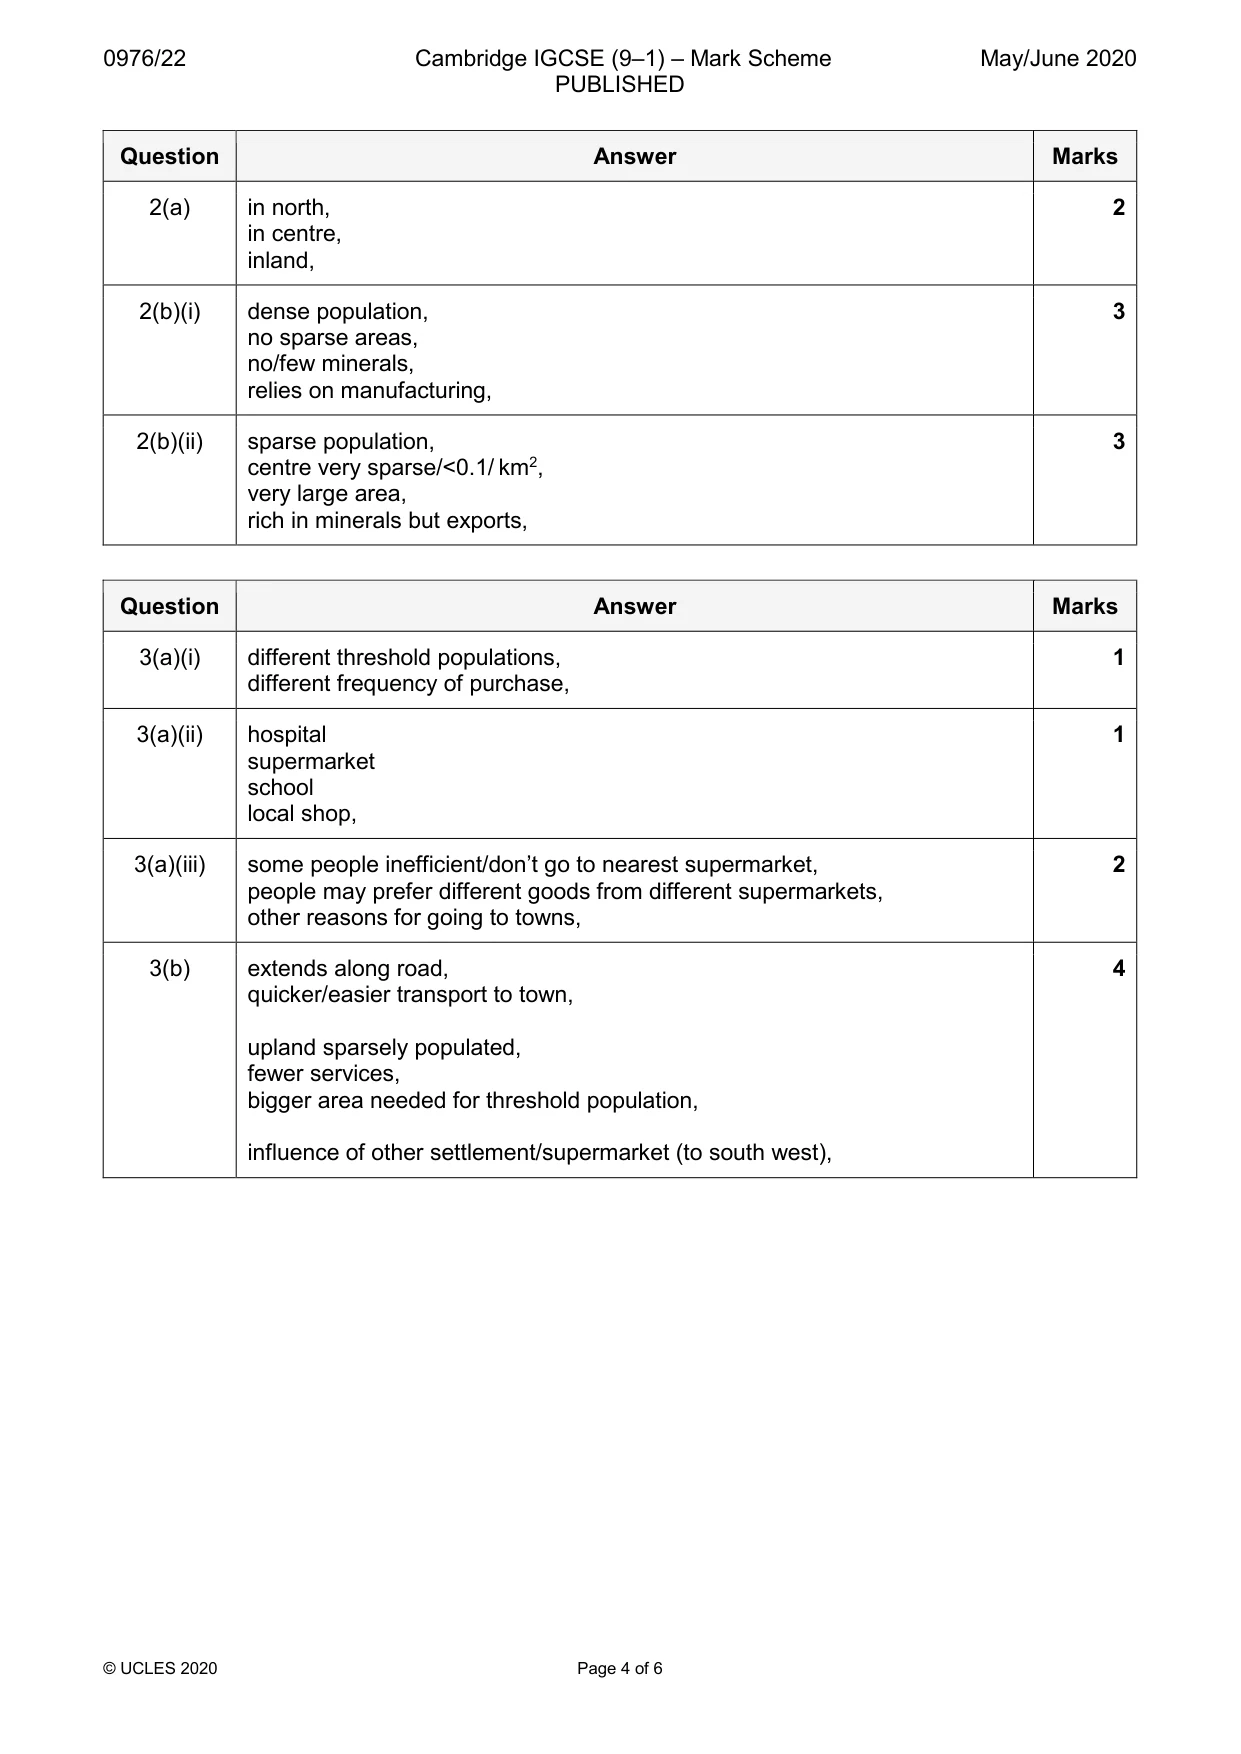
Mark scheme: 2(a) in north, 2 in centre, inland, 2(b)(i) dense population, 3 no sparse areas, no/few minerals, relies on manufacturing, 2(b)(ii) sparse population, 3 centre very sparse/<0.1/ km2, very large area, rich in minerals but exports,
Q3 · The spheres of influence of four services located in town A and the sphere of influence…
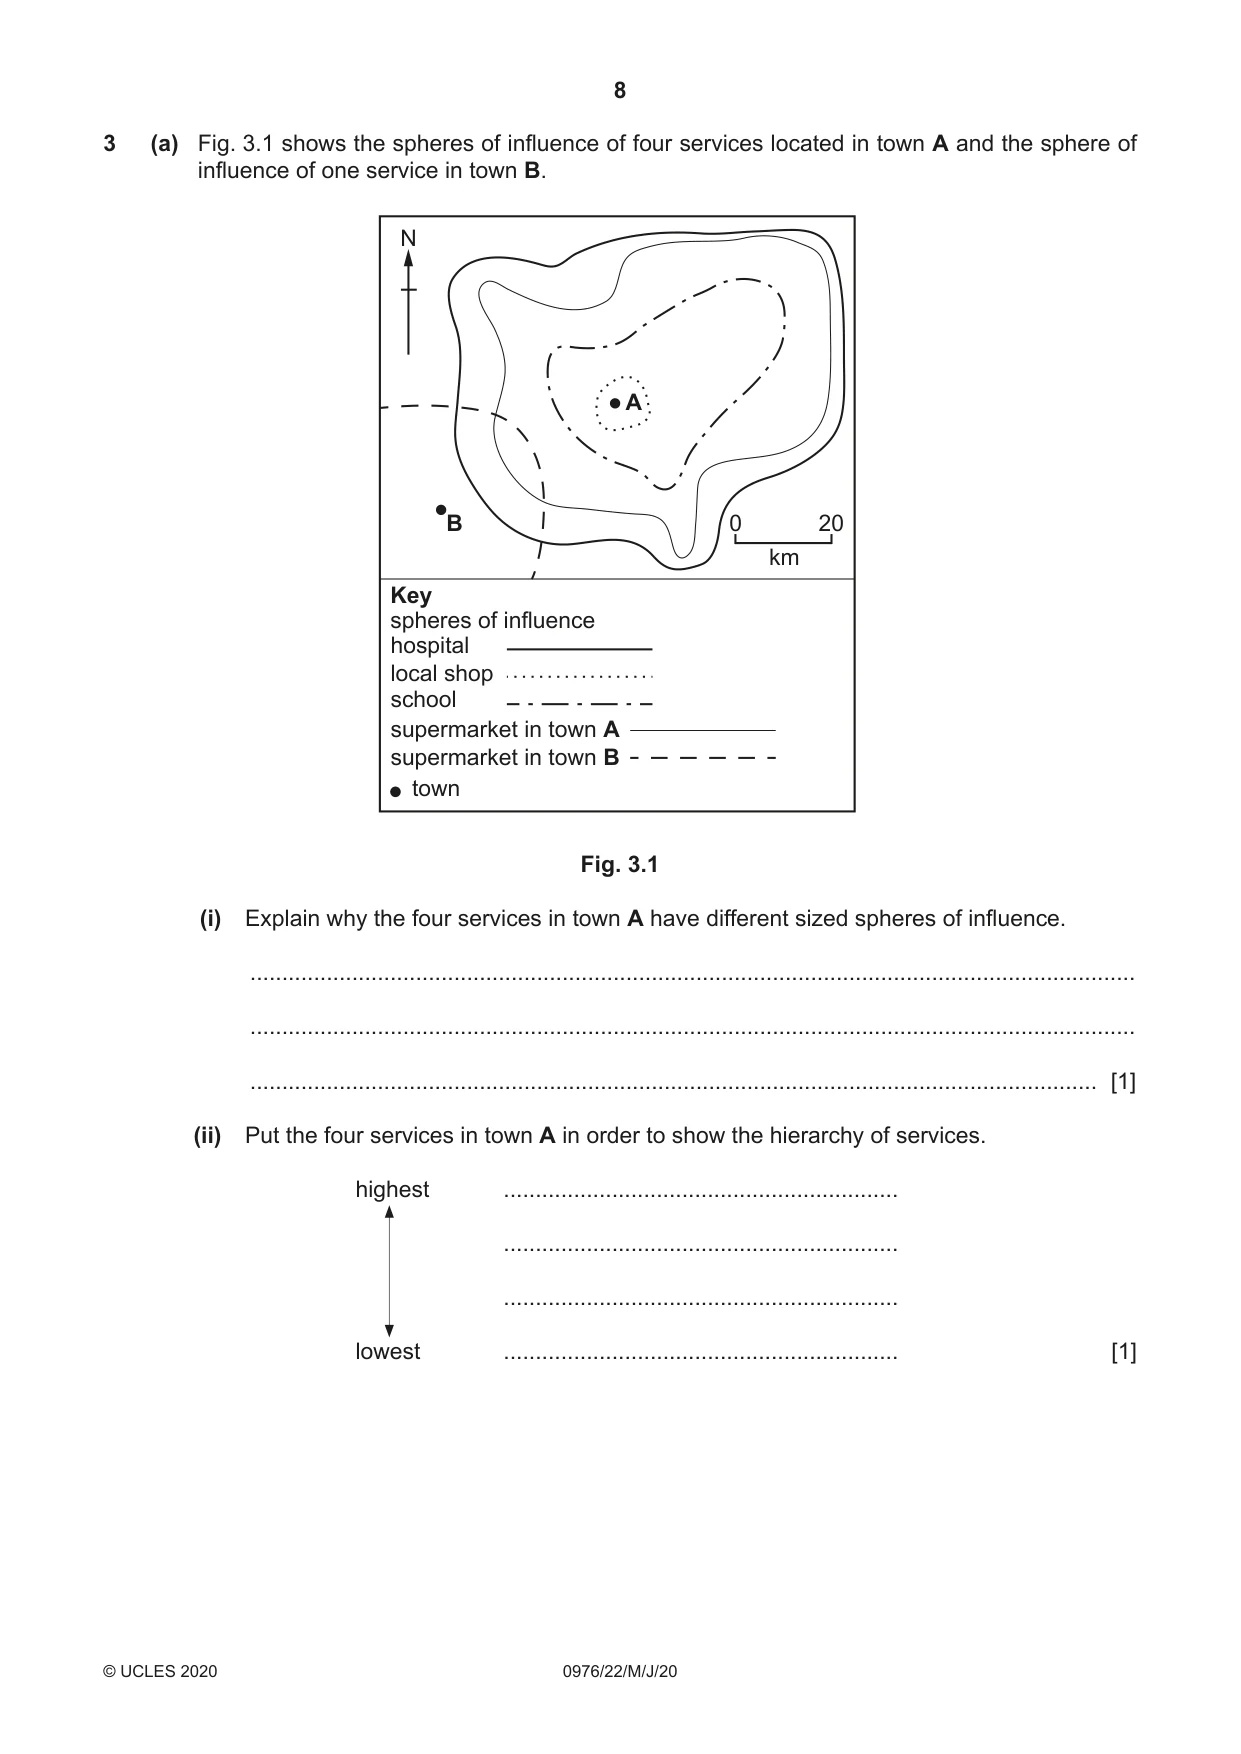
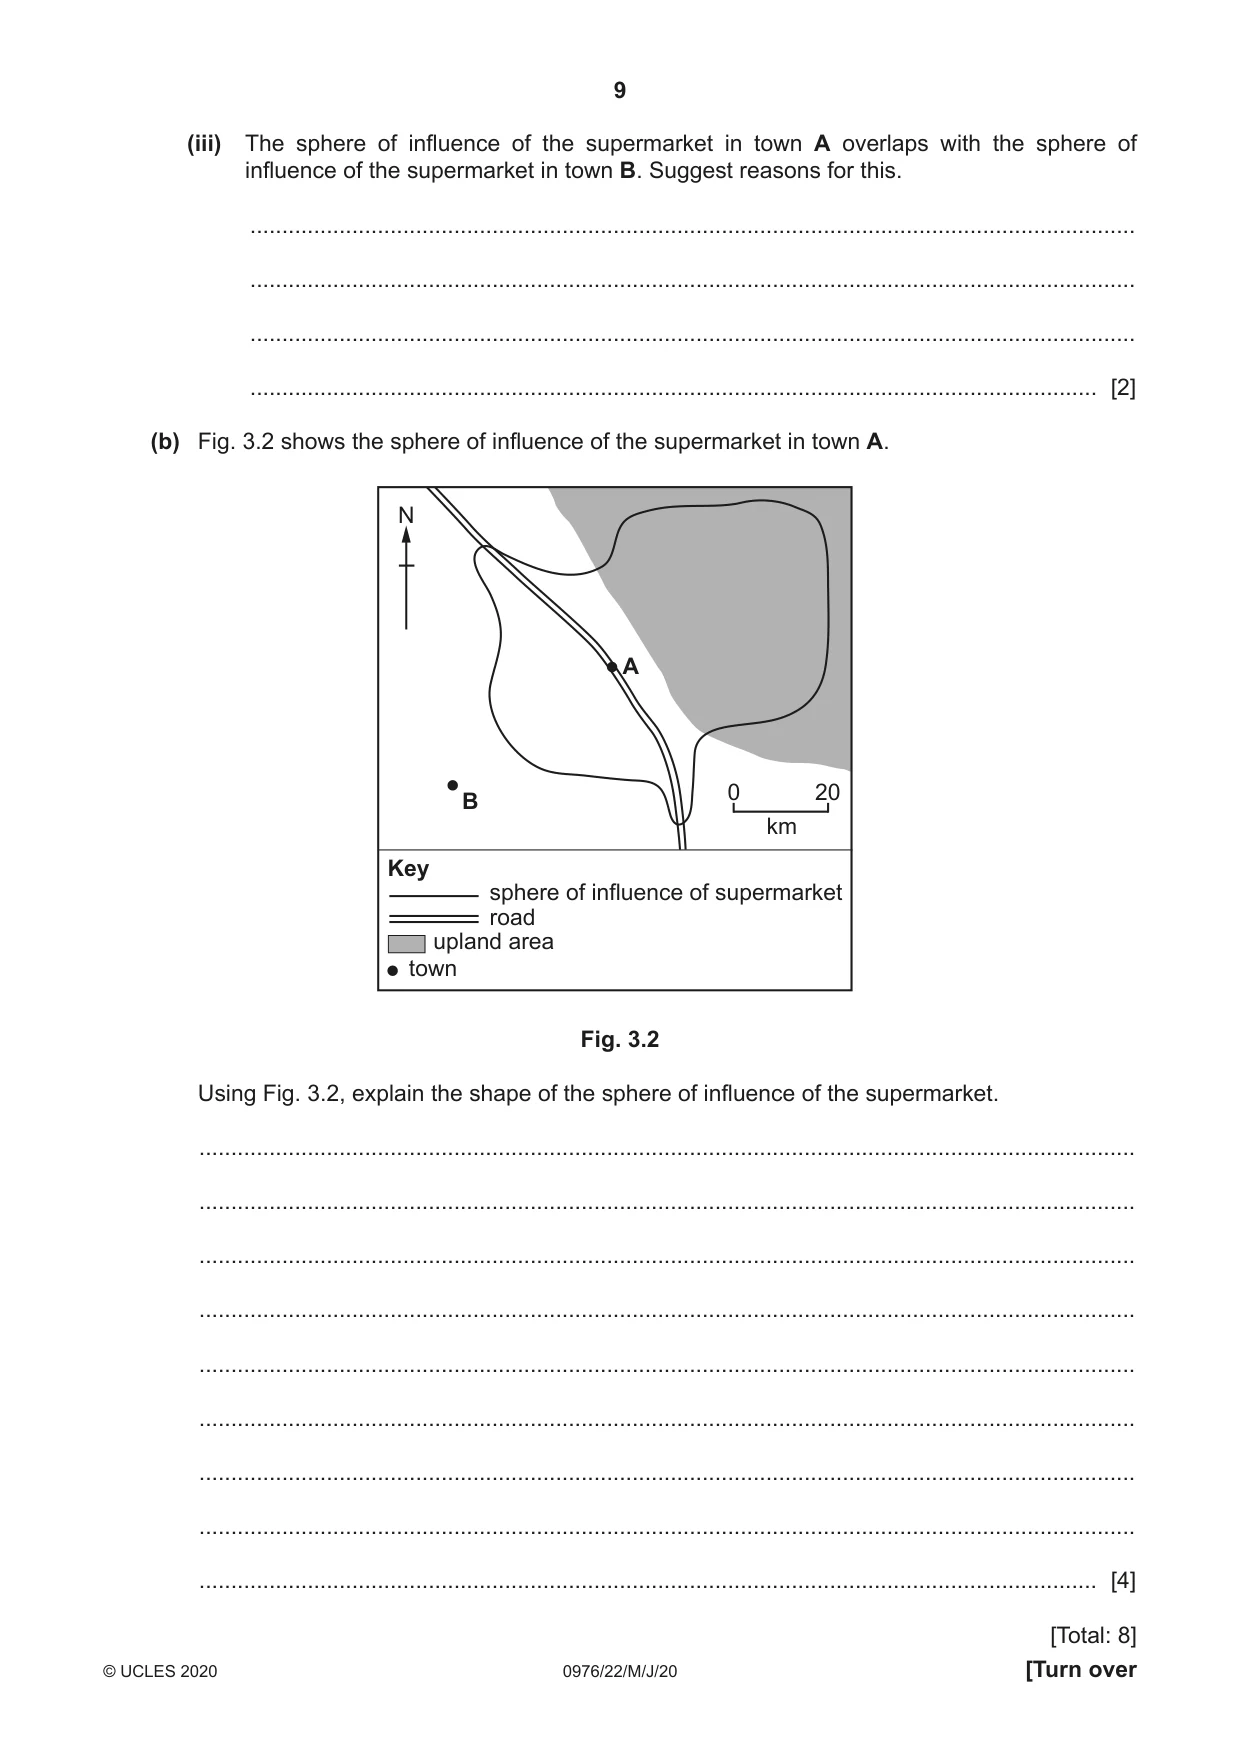
3 (a) Fig. 3.1 shows the spheres of influence of four services located in town A and the sphere of influence of one service in town B. N A B 0 20 km Key spheres of influence hospital local shop school supermarket in town A supermarket in town B town Fig. 3.1 (i) Explain why the four services in town A have different sized spheres of influence. ........................................................................................................................................... ........................................................................................................................................... ..................................................................................................................................... [1] (ii) Put the four services in town A in order to show the hierarchy of services. highest .............................................................. .............................................................. .............................................................. lowest .............................................................. [1] (iii) The sphere of influence of the supermarket in town A overlaps with the sphere of influence of the supermarket in town B. Suggest reasons for this. ........................................................................................................................................... ........................................................................................................................................... ........................................................................................................................................... ..................................................................................................................................... [2] (b) Fig. 3.2 shows the sphere of influence of the supermarket in town A. N A 0 20 B km Key sphere of influence of supermarket road upland area town Fig. 3.2 Using Fig. 3.2, explain the shape of the sphere of influence of the supermarket. ................................................................................................................................................... ................................................................................................................................................... ................................................................................................................................................... ................................................................................................................................................... ................................................................................................................................................... ................................................................................................................................................... ................................................................................................................................................... ................................................................................................................................................... ............................................................................................................................................. [4] [Total: 8]
Mark scheme: 3(a)(i) different threshold populations, 1 different frequency of purchase, 3(a)(ii) hospital 1 supermarket school local shop, 3(a)(iii) some people inefficient/don’t go to nearest supermarket, 2 people may prefer different goods from different supermarkets, other reasons for going to towns, 3(b) extends along road, 4 quicker/easier transport to town, upland sparsely populated, fewer services, bigger area needed for threshold population, influence of other settlement/supermarket (to south west),
More questions on Settlements (rural and urban) and service provision
Question 4
4 Figs. 4.1 and 4.2 (Insert) show two valleys in northern England. Describe the relief features of each valley. Valley in Fig. 4.1 .......................................................................................................................................................... .......................................................................................................................................................... .......................................................................................................................................................... .......................................................................................................................................................... .......................................................................................................................................................... .......................................................................................................................................................... .......................................................................................................................................................... .......................................................................................................................................................... .......................................................................................................................................................... .......................................................................................................................................................... .......................................................................................................................................................... Valley in Fig. 4.2 .......................................................................................................................................................... .......................................................................................................................................................... .......................................................................................................................................................... .......................................................................................................................................................... .......................................................................................................................................................... .......................................................................................................................................................... .......................................................................................................................................................... .......................................................................................................................................................... .......................................................................................................................................................... .................................................................................................................................................... [8] [Total: 8]
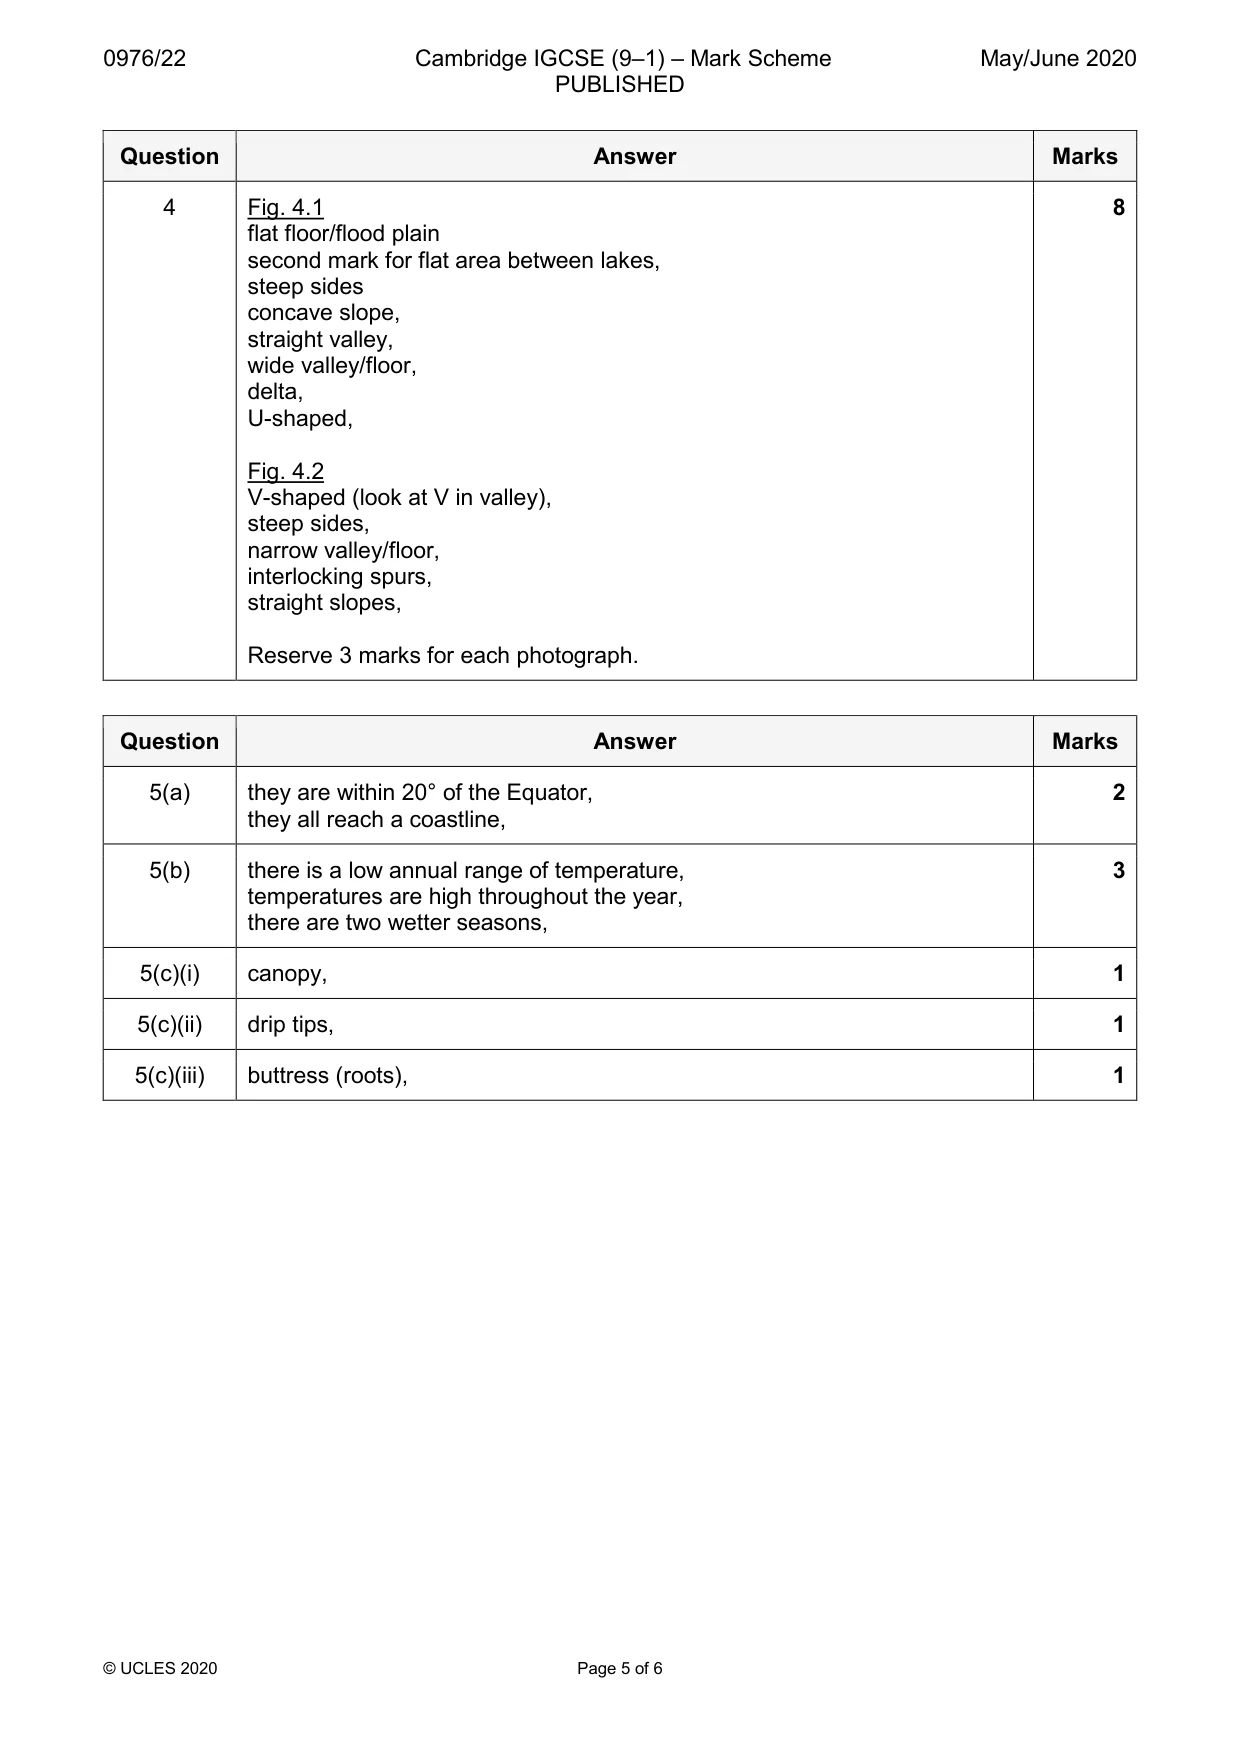
Mark scheme: 4 Fig. 4.1 8 flat floor/flood plain second mark for flat area between lakes, steep sides concave slope, straight valley, wide valley/floor, delta, U-shaped, Fig. 4.2 V-shaped (look at V in valley), steep sides, narrow valley/floor, interlocking spurs, straight slopes, Reserve 3 marks for each photograph.
Q5 · The world distribution of areas of equatorial climate
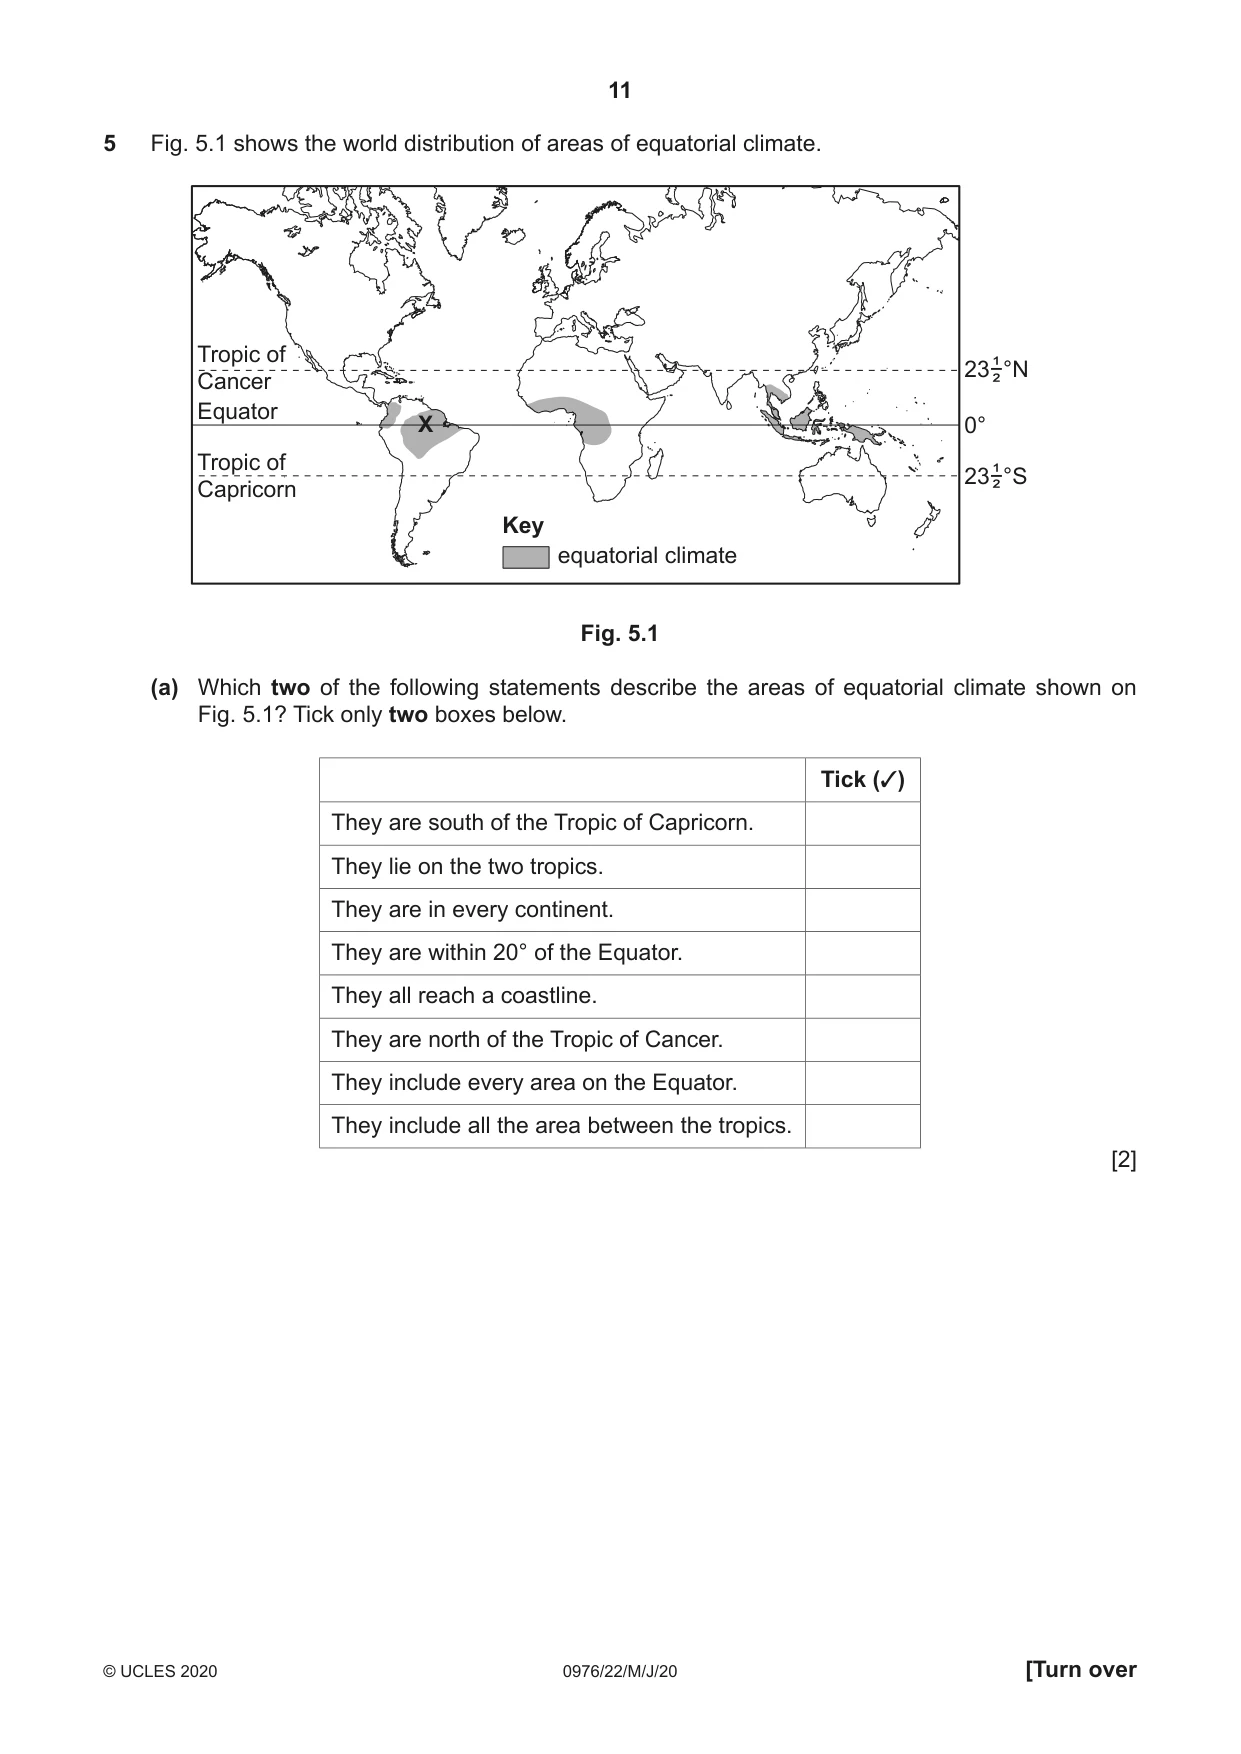
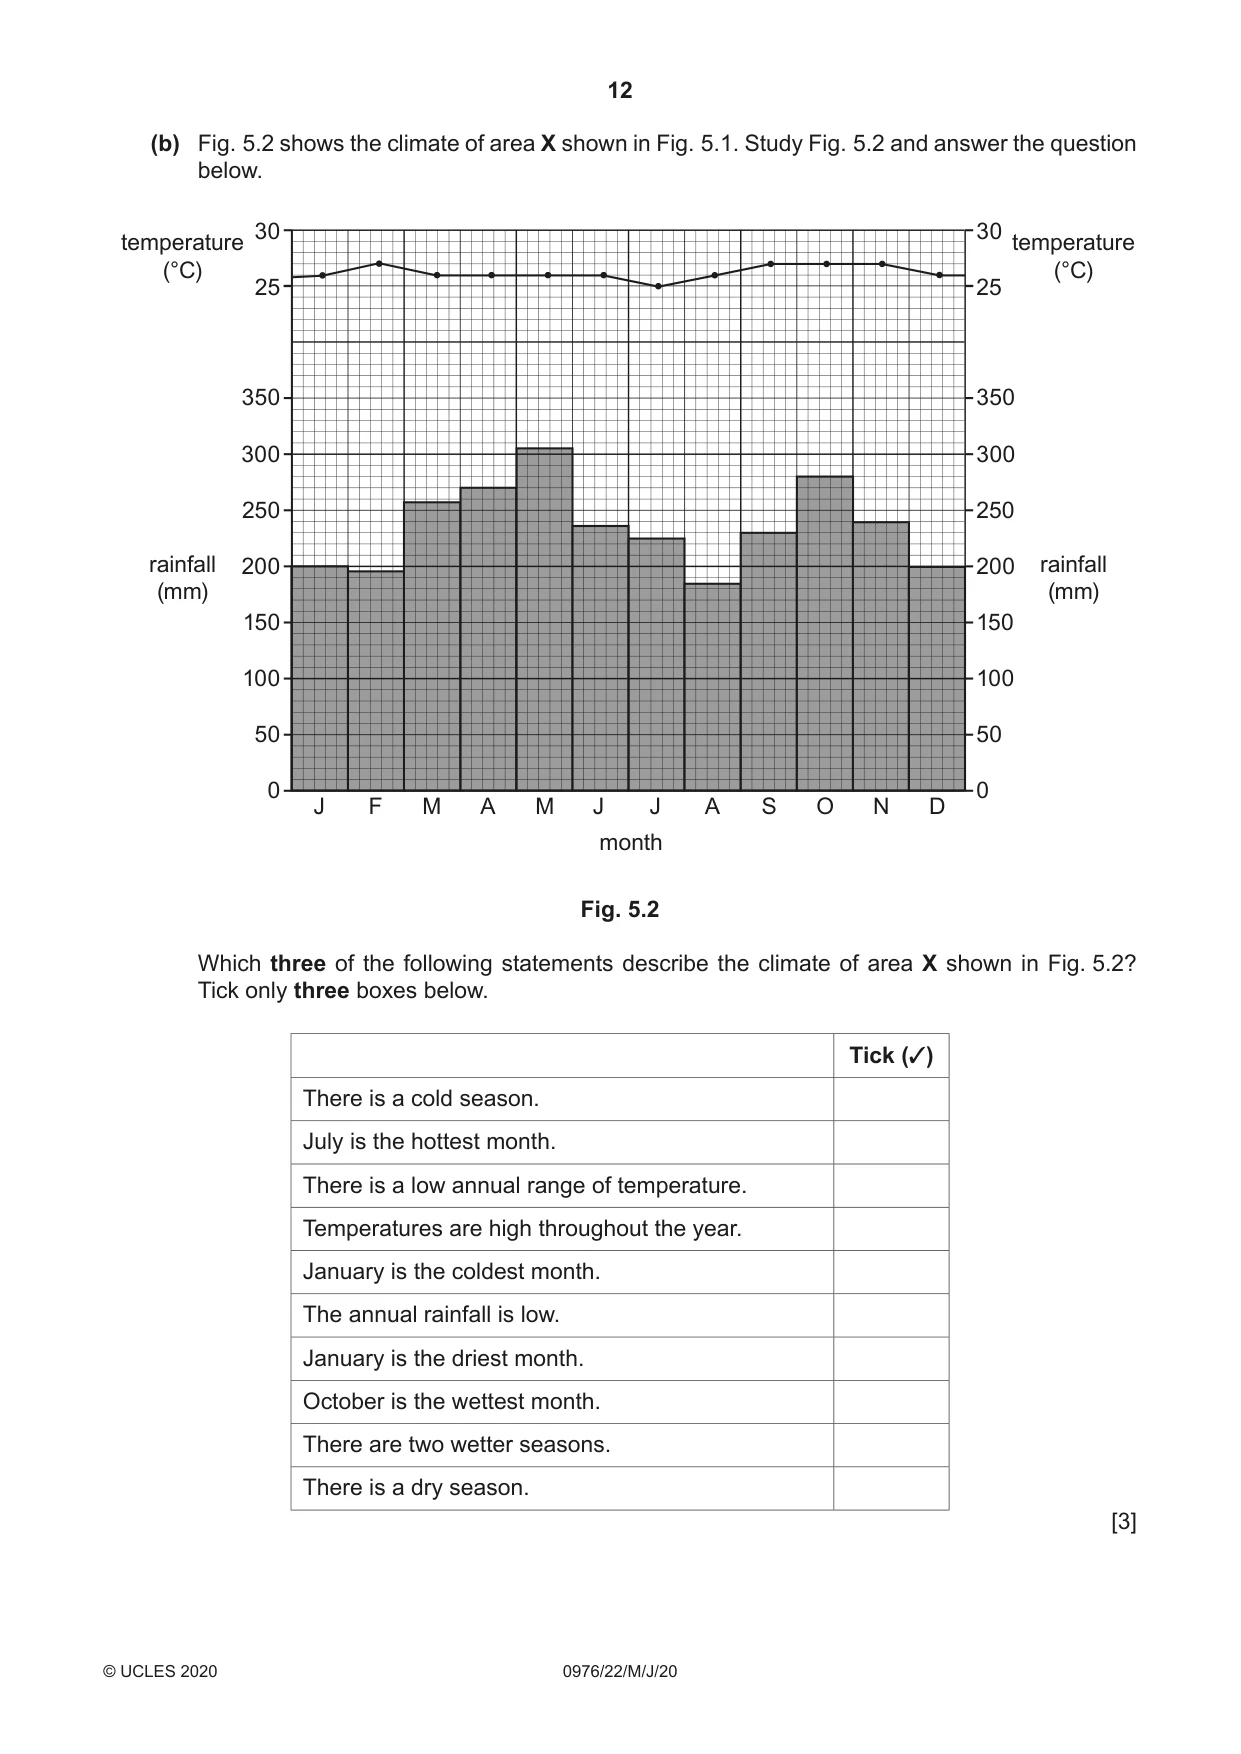
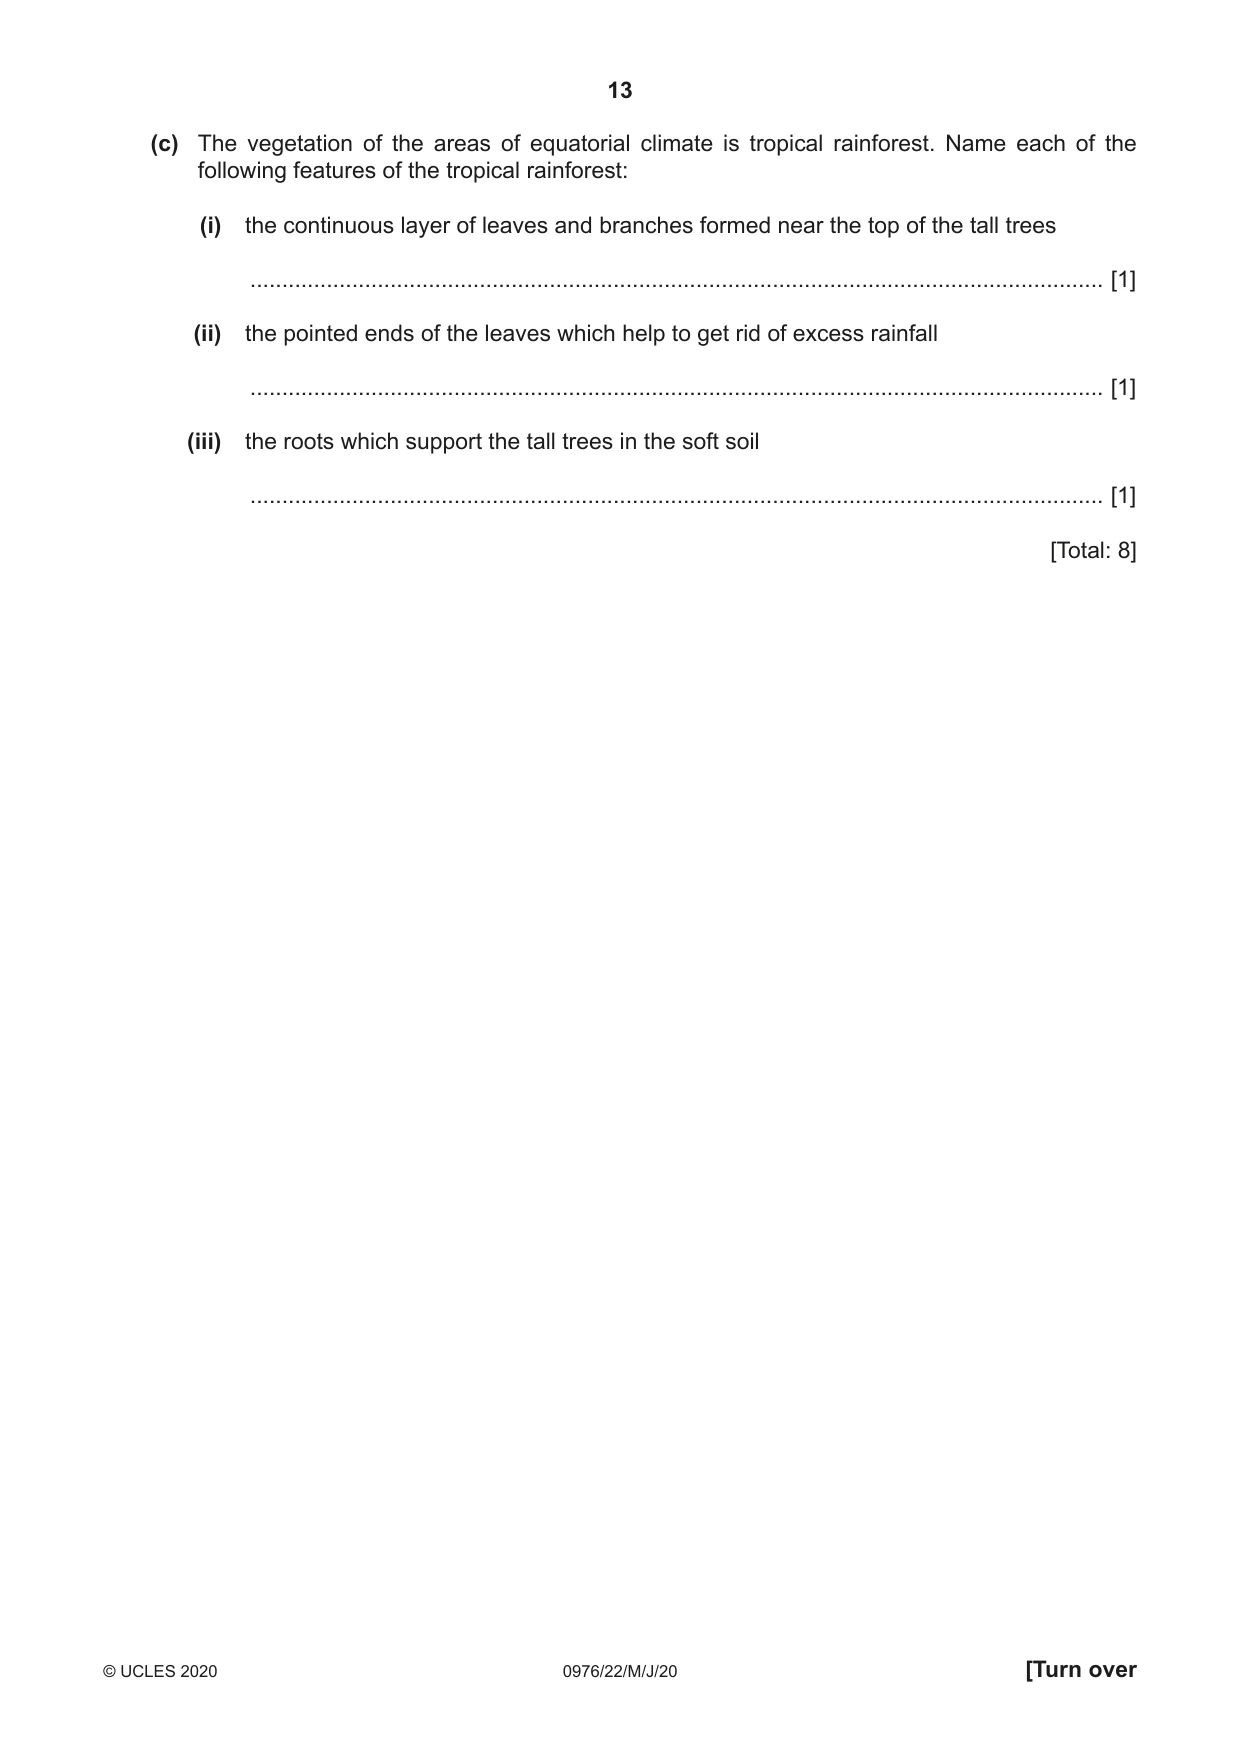
5 Fig. 5.1 shows the world distribution of areas of equatorial climate. Tropic of 23−°N Cancer ¹² Equator X 0° Tropic of 23−°S¹² Capricorn Key equatorial climate Fig. 5.1 (a) Which two of the following statements describe the areas of equatorial climate shown on Fig. 5.1? Tick only two boxes below. Tick (✓) They are south of the Tropic of Capricorn. They lie on the two tropics. They are in every continent. They are within 20° of the Equator. They all reach a coastline. They are north of the Tropic of Cancer. They include every area on the Equator. They include all the area between the tropics. [2] (b) Fig. 5.2 shows the climate of area X shown in Fig. 5.1. Study Fig. 5.2 and answer the question below. 30 30temperature temperature (°C) (°C) 25 25 350 350 300 300 250 250 rainfall 200 200 rainfall (mm) (mm) 150 150 100 100 50 50 0 0 J F M A M J J A S O N D month Fig. 5.2 Which three of the following statements describe the climate of area X shown in Fig. 5.2? Tick only three boxes below. Tick (✓) There is a cold season. July is the hottest month. There is a low annual range of temperature. Temperatures are high throughout the year. January is the coldest month. The annual rainfall is low. January is the driest month. October is the wettest month. There are two wetter seasons. There is a dry season. [3] (c) The vegetation of the areas of equatorial climate is tropical rainforest. Name each of the following features of the tropical rainforest: (i) the continuous layer of leaves and branches formed near the top of the tall trees ...................................................................................................................................... [1] (ii) the pointed ends of the leaves which help to get rid of excess rainfall ...................................................................................................................................... [1] (iii) the roots which support the tall trees in the soft soil ...................................................................................................................................... [1] [Total: 8]
Mark scheme: 5(a) they are within 20° of the Equator, 2 they all reach a coastline, 5(b) there is a low annual range of temperature, 3 temperatures are high throughout the year, there are two wetter seasons, 5(c)(i) canopy, 1 5(c)(ii) drip tips, 1 5(c)(iii) buttress (roots), 1
Question 6
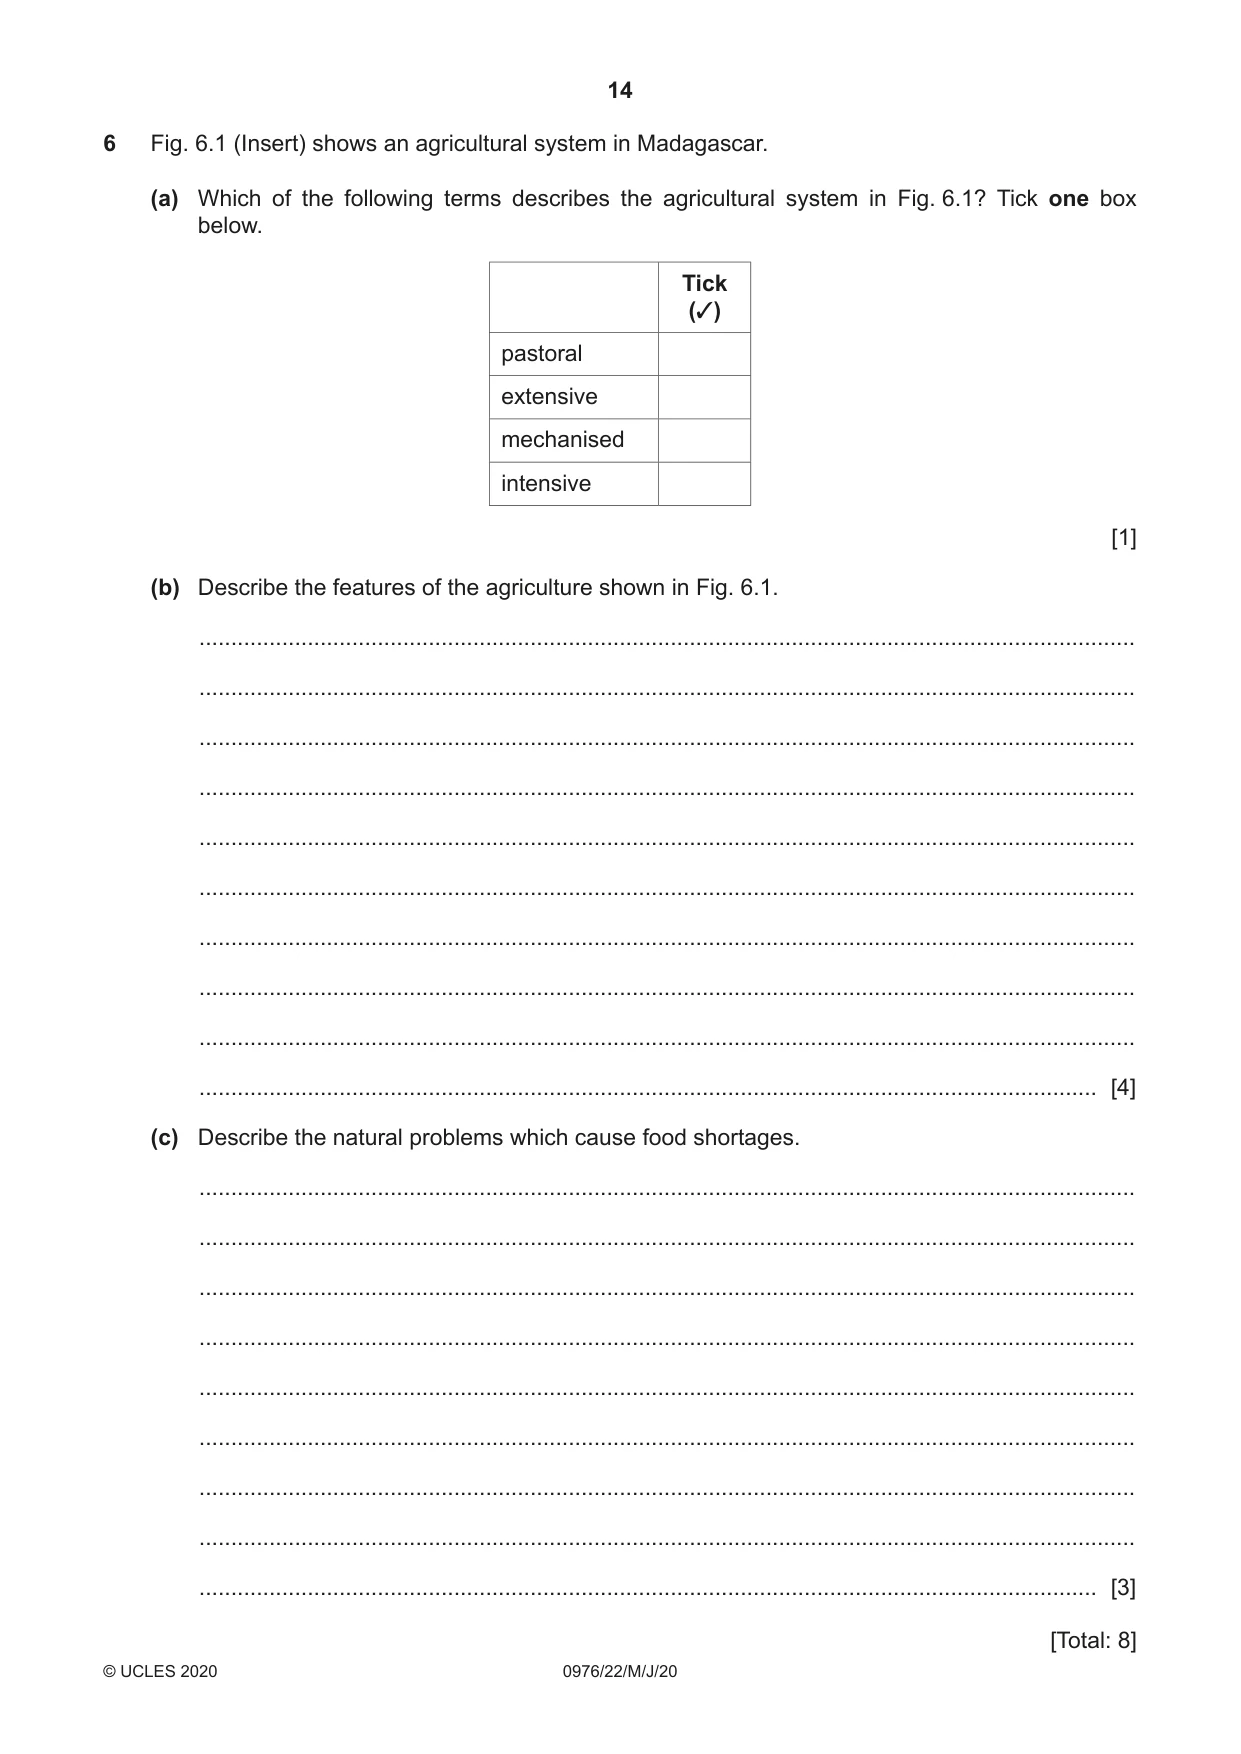
6 Fig. 6.1 (Insert) shows an agricultural system in Madagascar. (a) Which of the following terms describes the agricultural system in Fig. 6.1? Tick one box below. Tick (✓) pastoral extensive mechanised intensive [1] (b) Describe the features of the agriculture shown in Fig. 6.1. ................................................................................................................................................... ................................................................................................................................................... ................................................................................................................................................... ................................................................................................................................................... ................................................................................................................................................... ................................................................................................................................................... ................................................................................................................................................... ................................................................................................................................................... ................................................................................................................................................... ............................................................................................................................................. [4] (c) Describe the natural problems which cause food shortages. ................................................................................................................................................... ................................................................................................................................................... ................................................................................................................................................... ................................................................................................................................................... ................................................................................................................................................... ................................................................................................................................................... ................................................................................................................................................... ................................................................................................................................................... ............................................................................................................................................. [3] [Total: 8] Additional Pages If you use the following lined pages to complete the answer(s) to any question(s), the question number(s) must be clearly shown. .................................................................................................................................................................. .................................................................................................................................................................. .................................................................................................................................................................. .................................................................................................................................................................. .................................................................................................................................................................. .................................................................................................................................................................. .................................................................................................................................................................. .................................................................................................................................................................. .................................................................................................................................................................. .................................................................................................................................................................. .................................................................................................................................................................. .................................................................................................................................................................. .................................................................................................................................................................. .................................................................................................................................................................. .................................................................................................................................................................. .................................................................................................................................................................. .................................................................................................................................................................. .................................................................................................................................................................. .................................................................................................................................................................. .................................................................................................................................................................. .................................................................................................................................................................. .................................................................................................................................................................. .................................................................................................................................................................. .................................................................................................................................................................. .................................................................................................................................................................. .................................................................................................................................................................. .................................................................................................................................................................. .................................................................................................................................................................. .................................................................................................................................................................. .................................................................................................................................................................. .................................................................................................................................................................. .................................................................................................................................................................. .................................................................................................................................................................. .................................................................................................................................................................. .................................................................................................................................................................. .................................................................................................................................................................. .................................................................................................................................................................. .................................................................................................................................................................. .................................................................................................................................................................. .................................................................................................................................................................. .................................................................................................................................................................. .................................................................................................................................................................. .................................................................................................................................................................. .................................................................................................................................................................. .................................................................................................................................................................. .................................................................................................................................................................. .................................................................................................................................................................. .................................................................................................................................................................. .................................................................................................................................................................. ..................................................................................................................................................................
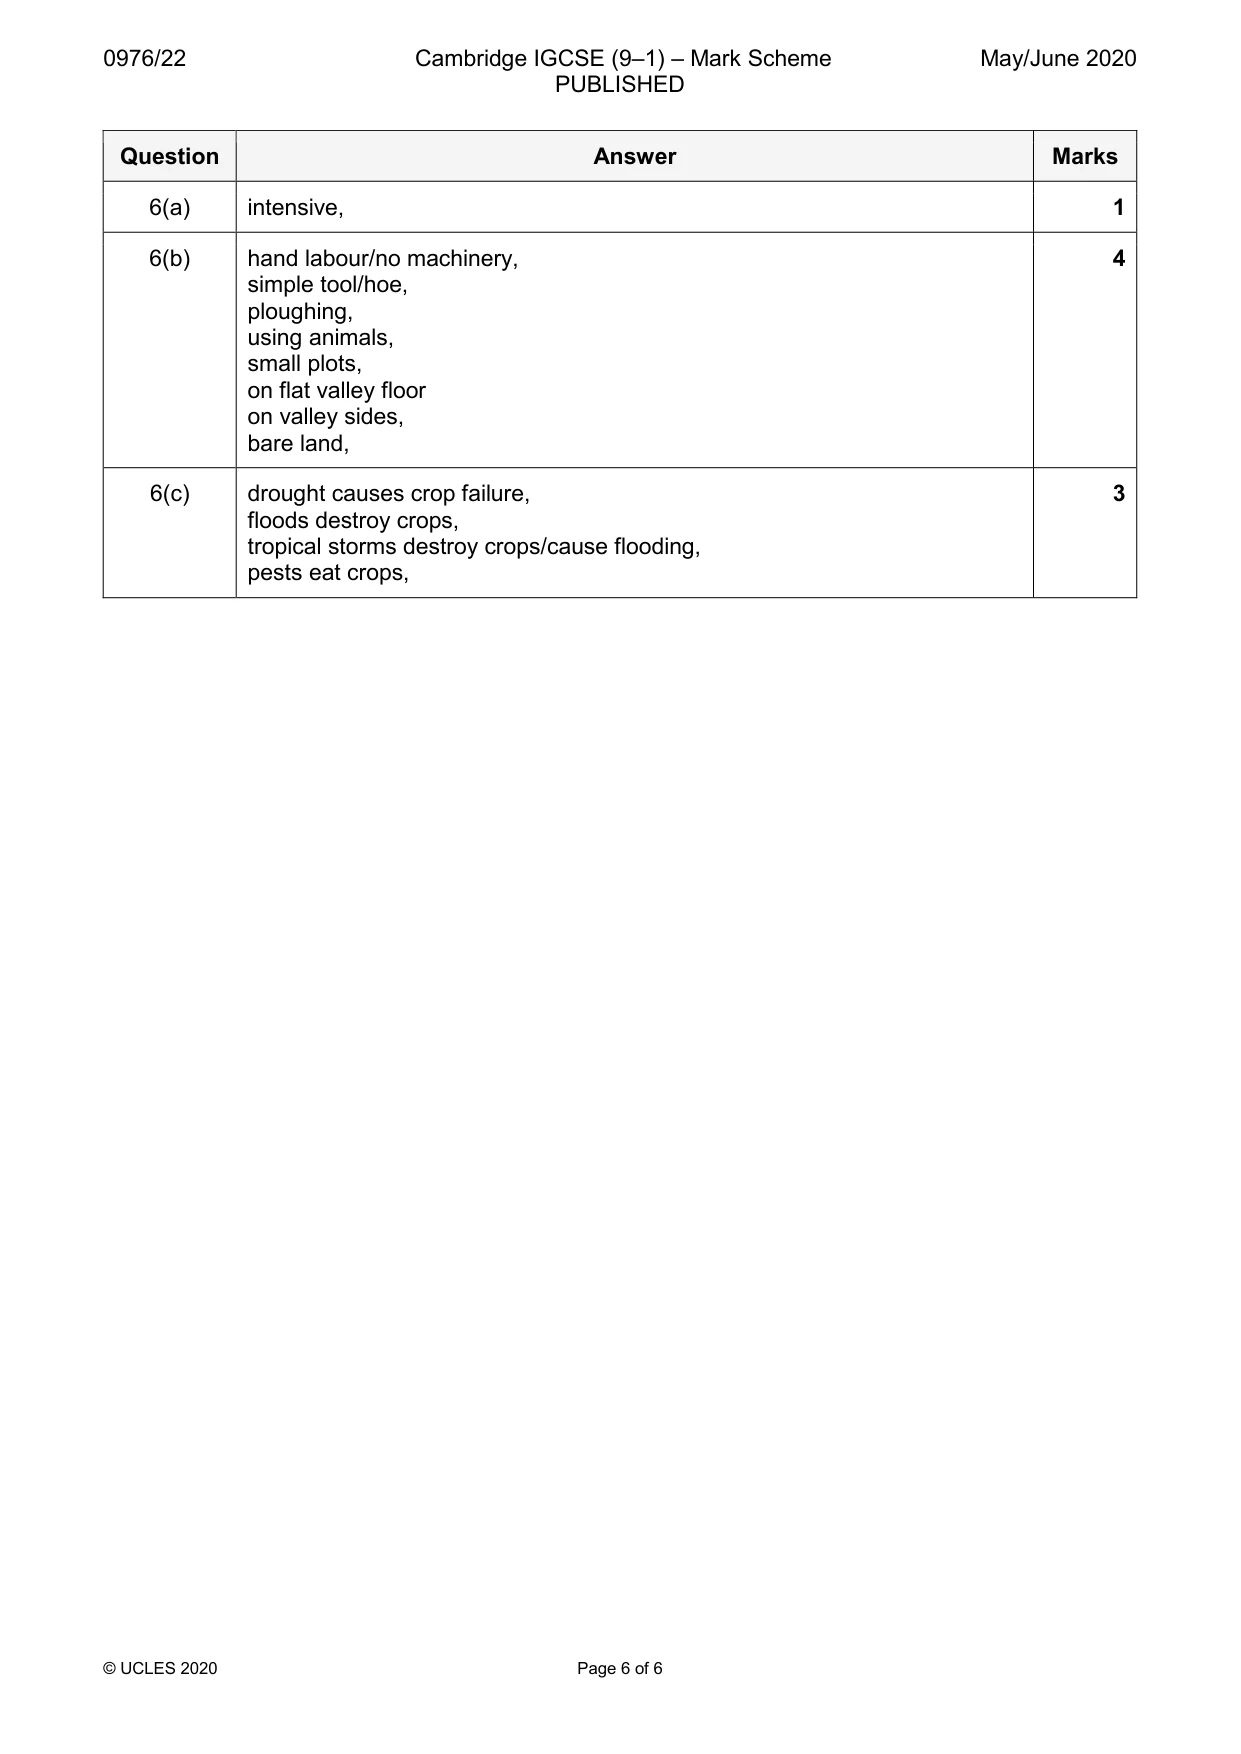
Mark scheme: 6(a) intensive, 1 6(b) hand labour/no machinery, 4 simple tool/hoe, ploughing, using animals, small plots, on flat valley floor on valley sides, bare land, 6(c) drought causes crop failure, 3 floods destroy crops, tropical storms destroy crops/cause flooding, pests eat crops,
What was in this paper
The subtopics covered by these 6 questions, and how many questions each got. Open one in a new tab to see every Cambridge question on it.