Cambridge IGCSE Geography (9-1) 0976 — 2018 Oct/Nov Paper 2 · Variant 2
0976/22/O/N/18 · 6 questions · 60 marks · ≈68 min
The question paper and its mark scheme, free to read here and free to download. This is Cambridge’s own paper, exactly as it was sat.
Question paper20 pages


Mark scheme6 pages
Answers below. Sit the paper first if you are practising.
Questions as text
Q1 · Study the map extract for Furusjøen, Norway
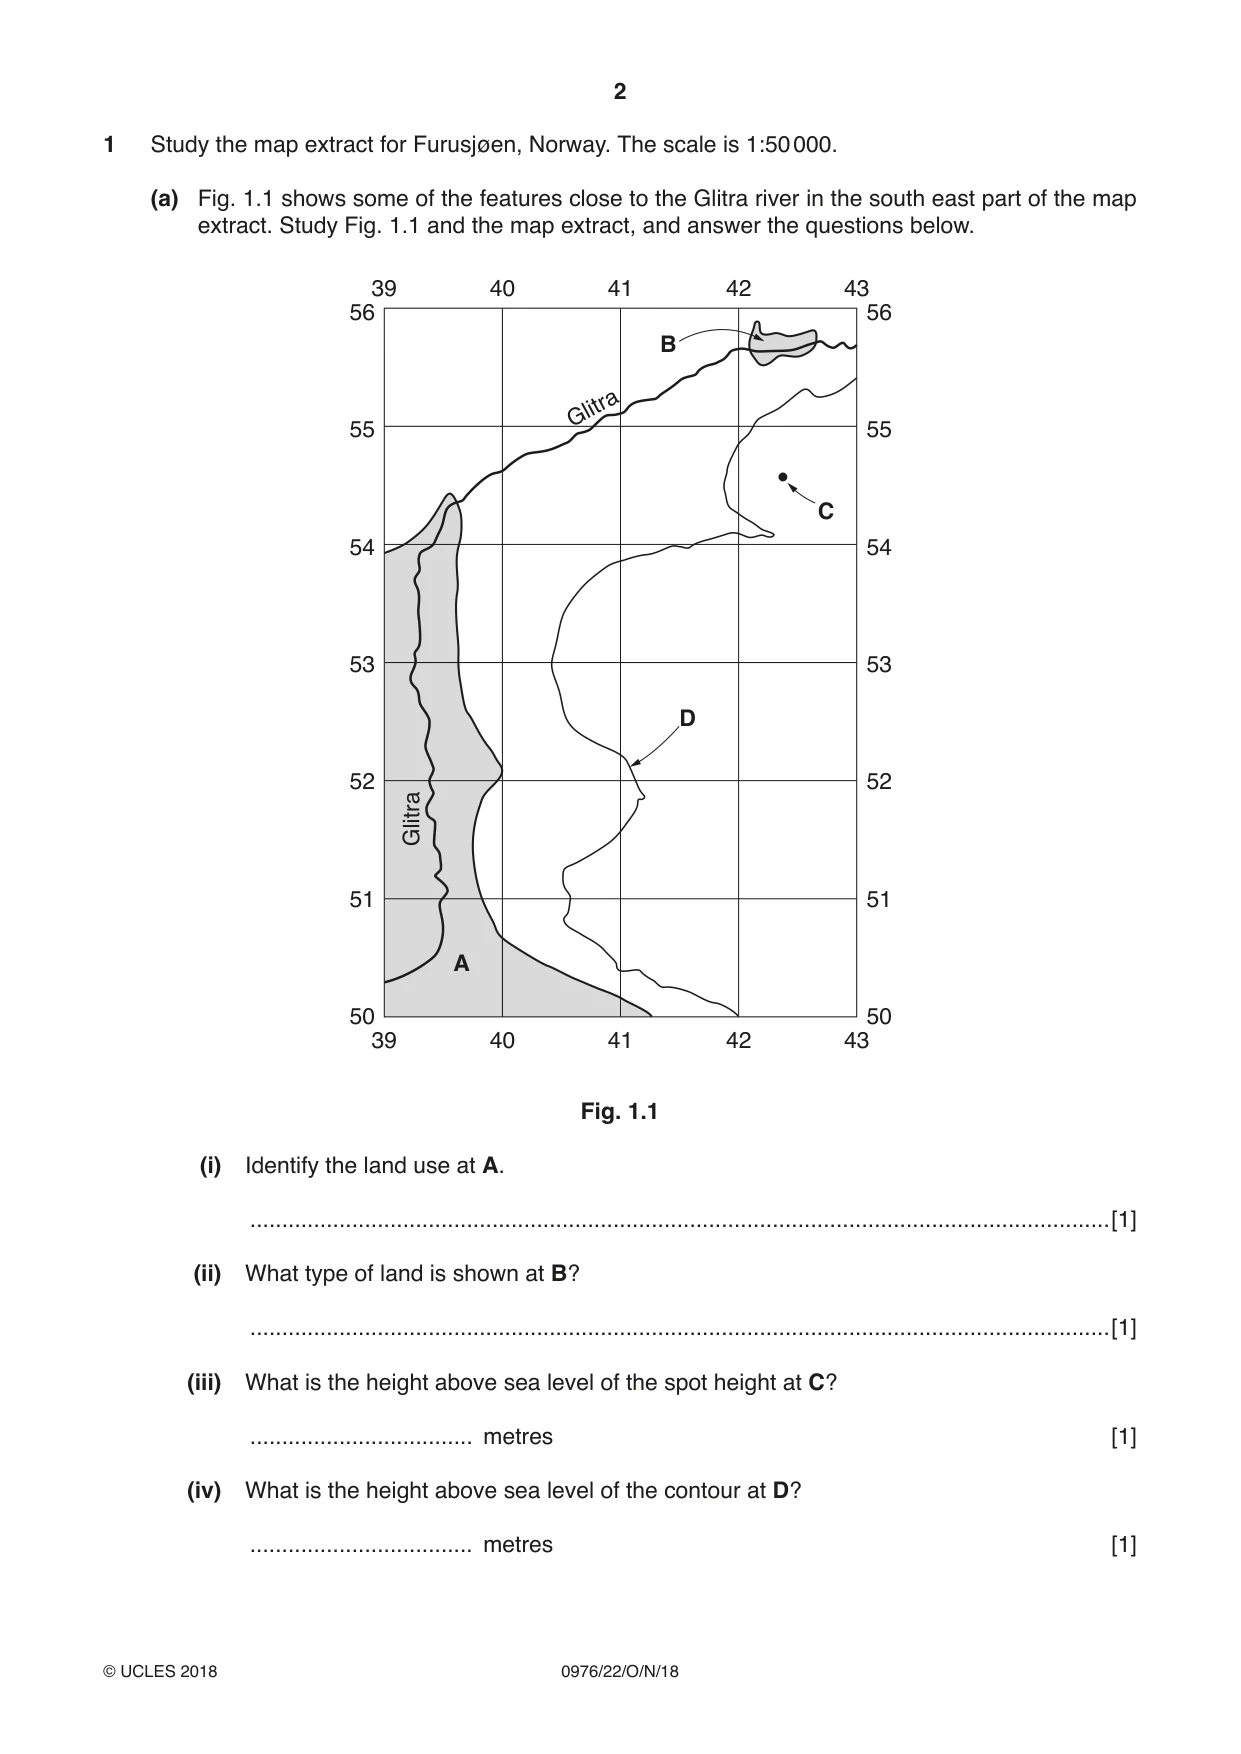
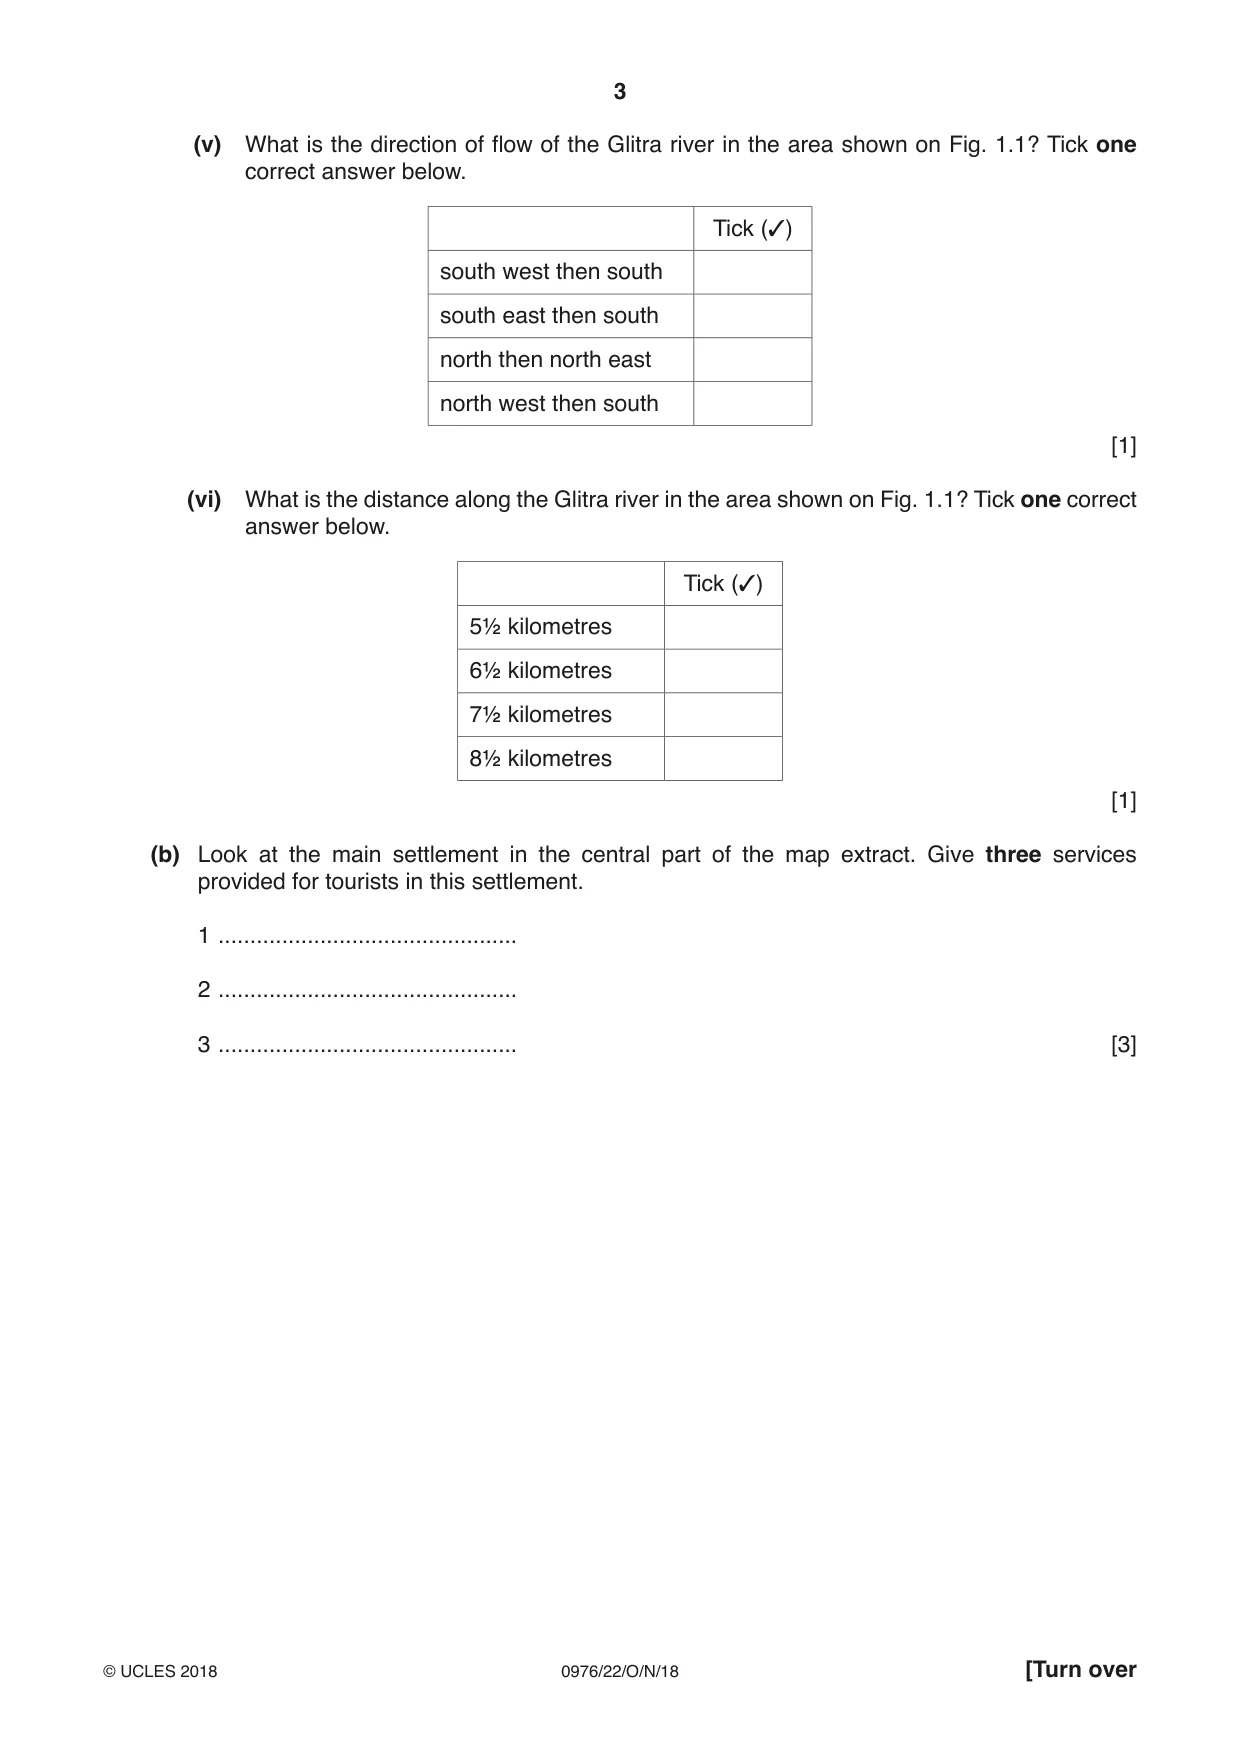
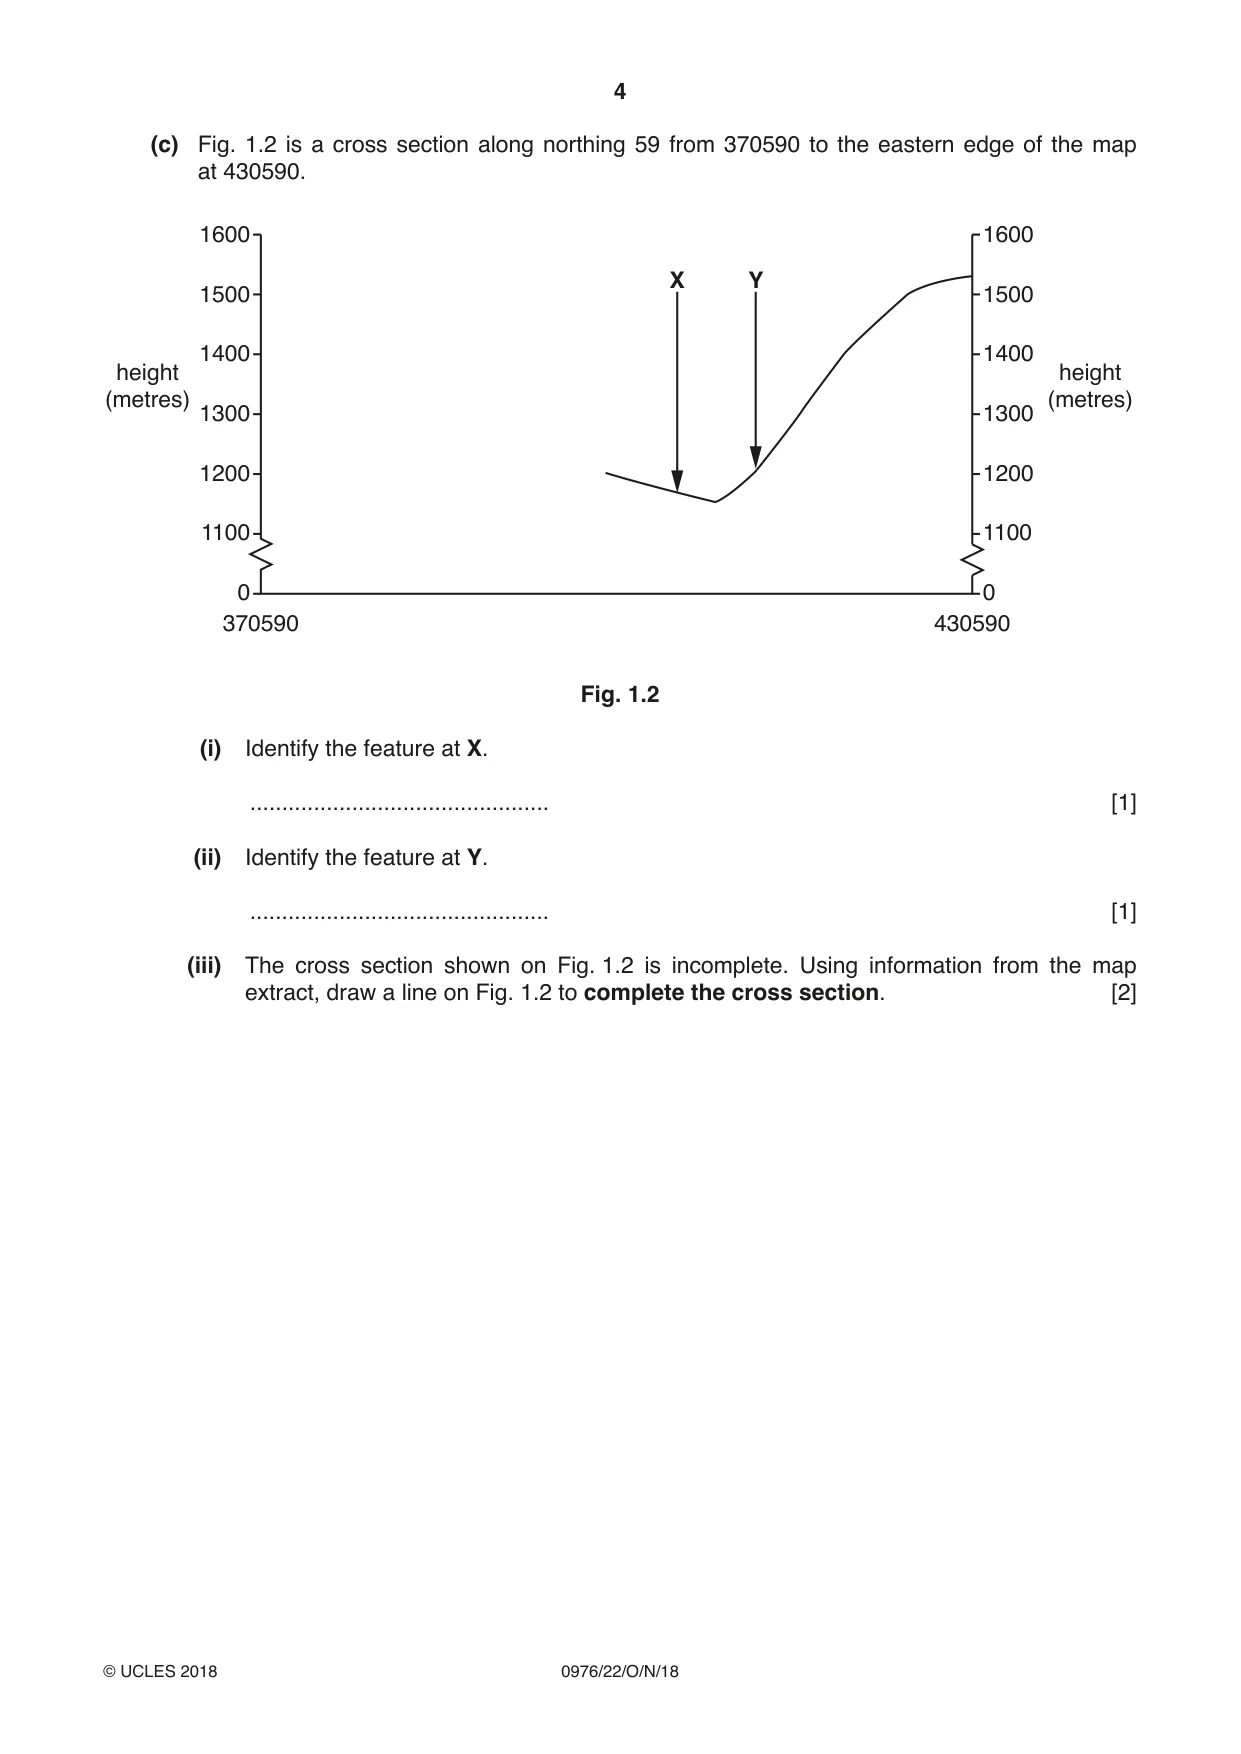
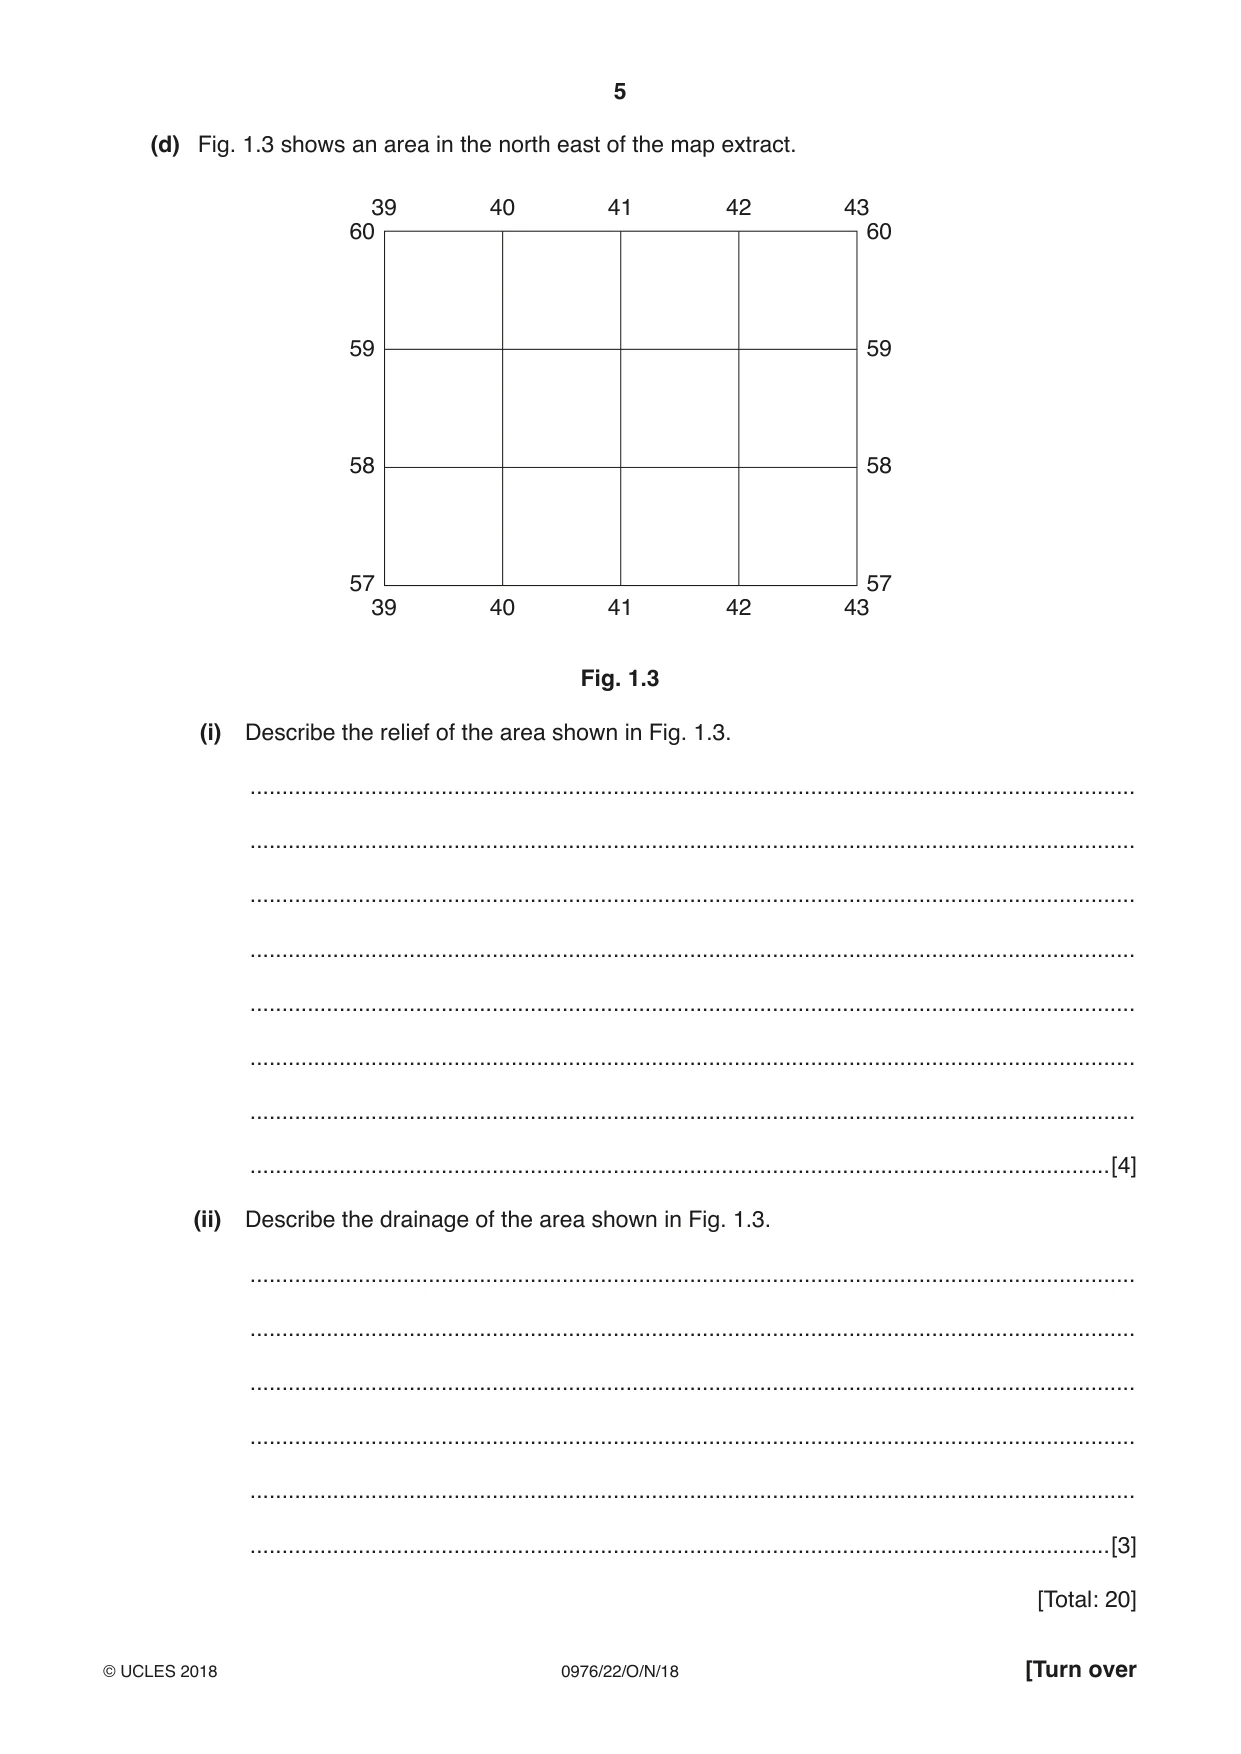
1 Study the map extract for Furusjøen, Norway. The scale is 1:50 000. (a) Fig. 1.1 shows some of the features close to the Glitra river in the south east part of the map extract. Study Fig. 1.1 and the map extract, and answer the questions below. 39 40 41 42 43 56 56 B Glitra 55 55 C 54 54 53 53 D 52 52 Glitra 51 51 A 50 50 39 40 41 42 43 Fig. 1.1 (i) Identify the land use at A. .......................................................................................................................................[1] (ii) What type of land is shown at B? .......................................................................................................................................[1] (iii) What is the height above sea level of the spot height at C? ................................... metres [1] (iv) What is the height above sea level of the contour at D? ................................... metres [1] (v) What is the direction of flow of the Glitra river in the area shown on Fig. 1.1? Tick one correct answer below. Tick (✓) south west then south south east then south north then north east north west then south [1] (vi) What is the distance along the Glitra river in the area shown on Fig. 1.1? Tick one correct answer below. Tick (✓) 5½ kilometres 6½ kilometres 7½ kilometres 8½ kilometres [1] (b) Look at the main settlement in the central part of the map extract. Give three services provided for tourists in this settlement. 1 ............................................... 2 ............................................... 3 ............................................... [3] (c) Fig. 1.2 is a cross section along northing 59 from 370590 to the eastern edge of the map at 430590. 1600 1600 X Y 1500 1500 1400 1400 height height (metres) (metres) 1300 1300 1200 1200 1100 1100 0 0 370590 430590 Fig. 1.2 (i) Identify the feature at X. ............................................... [1] (ii) Identify the feature at Y. ............................................... [1] (iii) The cross section shown on Fig. 1.2 is incomplete. Using information from the map extract, draw a line on Fig. 1.2 to complete the cross section. [2] (d) Fig. 1.3 shows an area in the north east of the map extract. 39 40 41 42 43 60 60 59 59 58 58 57 57 39 40 41 42 43 Fig. 1.3 (i) Describe the relief of the area shown in Fig. 1.3. ........................................................................................................................................... ........................................................................................................................................... ........................................................................................................................................... ........................................................................................................................................... ........................................................................................................................................... ........................................................................................................................................... ........................................................................................................................................... .......................................................................................................................................[4] (ii) Describe the drainage of the area shown in Fig. 1.3. ........................................................................................................................................... ........................................................................................................................................... ........................................................................................................................................... ........................................................................................................................................... ........................................................................................................................................... .......................................................................................................................................[3] [Total: 20]
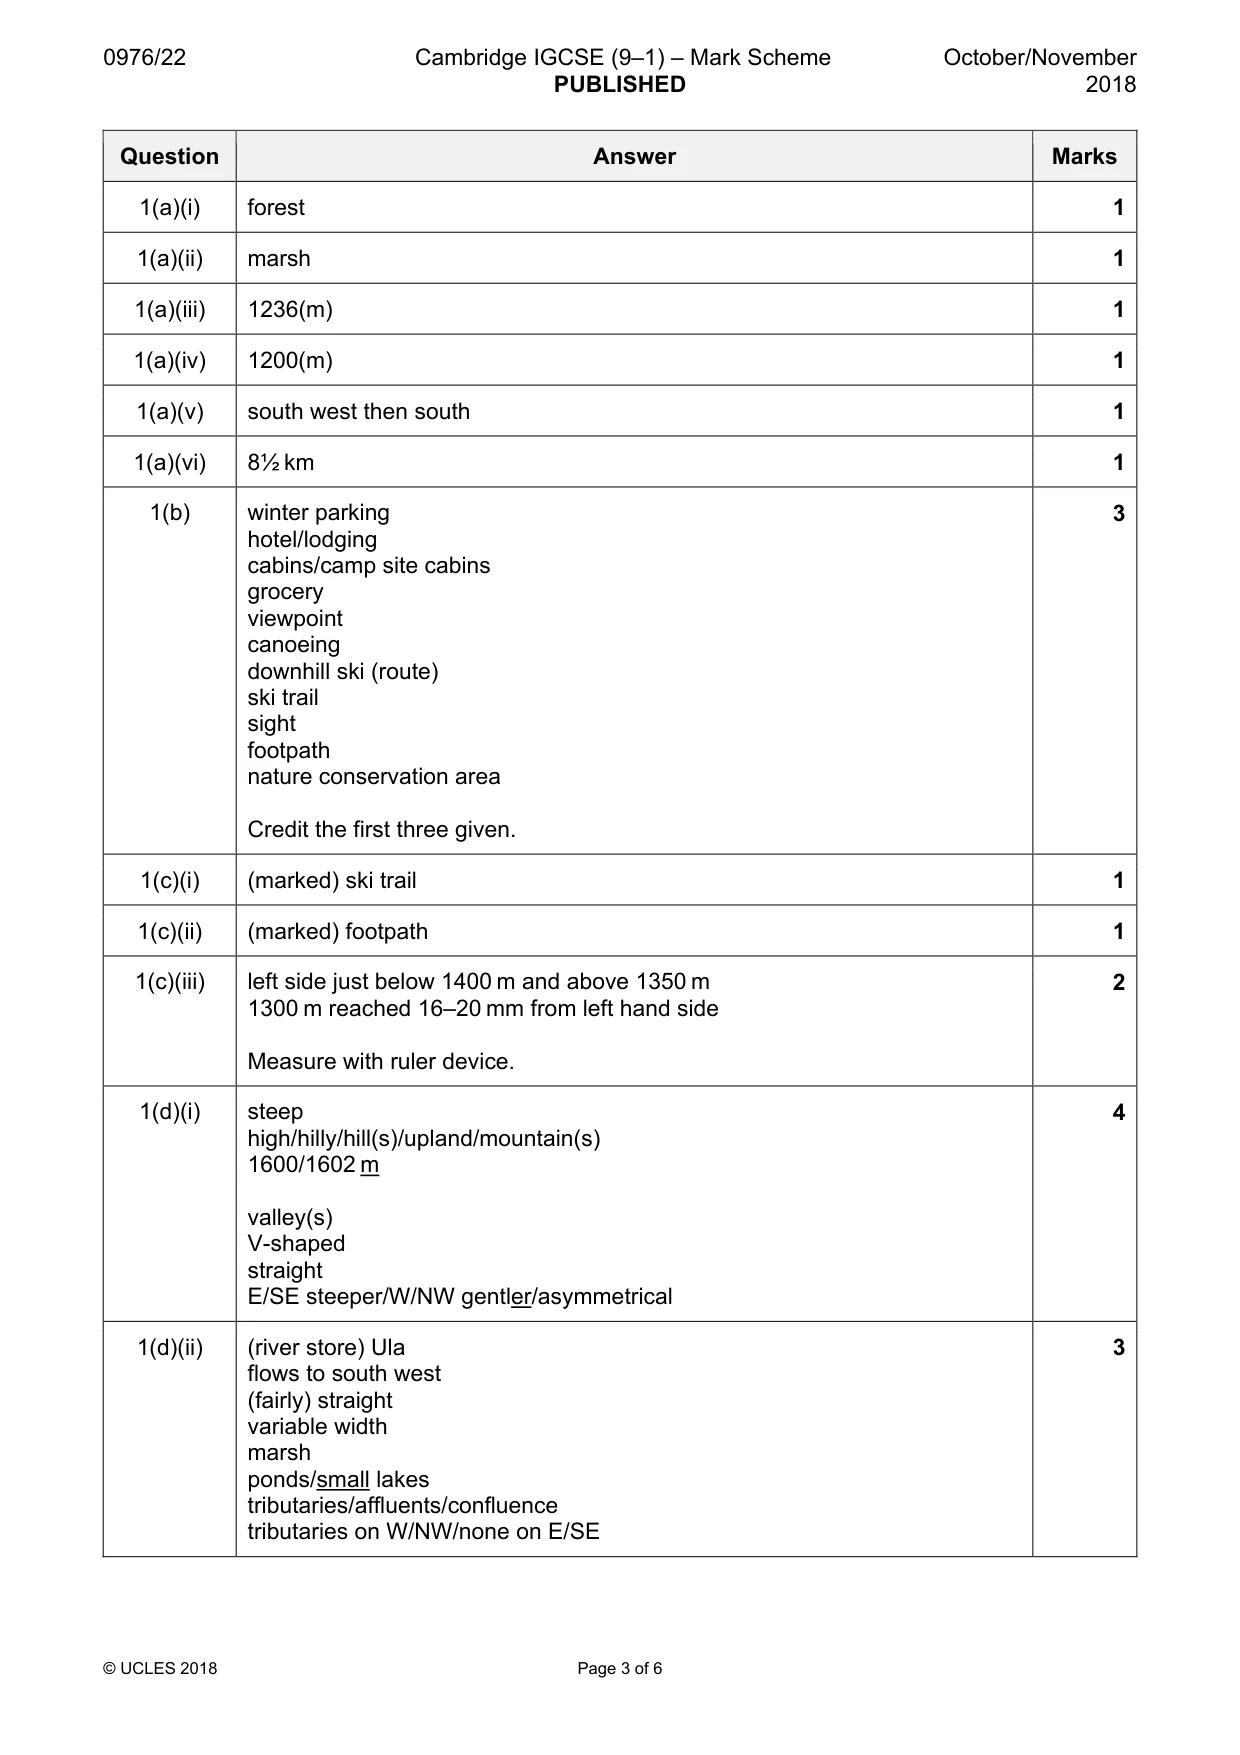
Mark scheme: Question Answer Marks 1(a)(i) forest 1 1(a)(ii) marsh 1 1(a)(iii) 1236(m) 1 1(a)(iv) 1200(m) 1 1(a)(v) south west then south 1 1(a)(vi) 8½ km 1 1(b) winter parking 3 hotel/lodging cabins/camp site cabins grocery viewpoint canoeing downhill ski (route) ski trail sight footpath nature conservation area Credit the first three given. 1(c)(i) (marked) ski trail 1 1(c)(ii) (marked) footpath 1 1(c)(iii) left side just below 1400 m and above 1350 m 2 1300 m reached 16–20 mm from left hand side Measure with ruler device. 1(d)(i) steep 4 high/hilly/hill(s)/upland/mountain(s) 1600/1602 m valley(s) V-shaped straight E/SE steeper/W/NW gentler/asymmetrical 1(d)(ii) (river store) Ula 3 flows to south west (fairly) straight variable width marsh ponds/small lakes tributaries/affluents/confluence tributaries on W/NW/none on E/SE
Q2 · Eight countries located next to the Mediterranean Sea
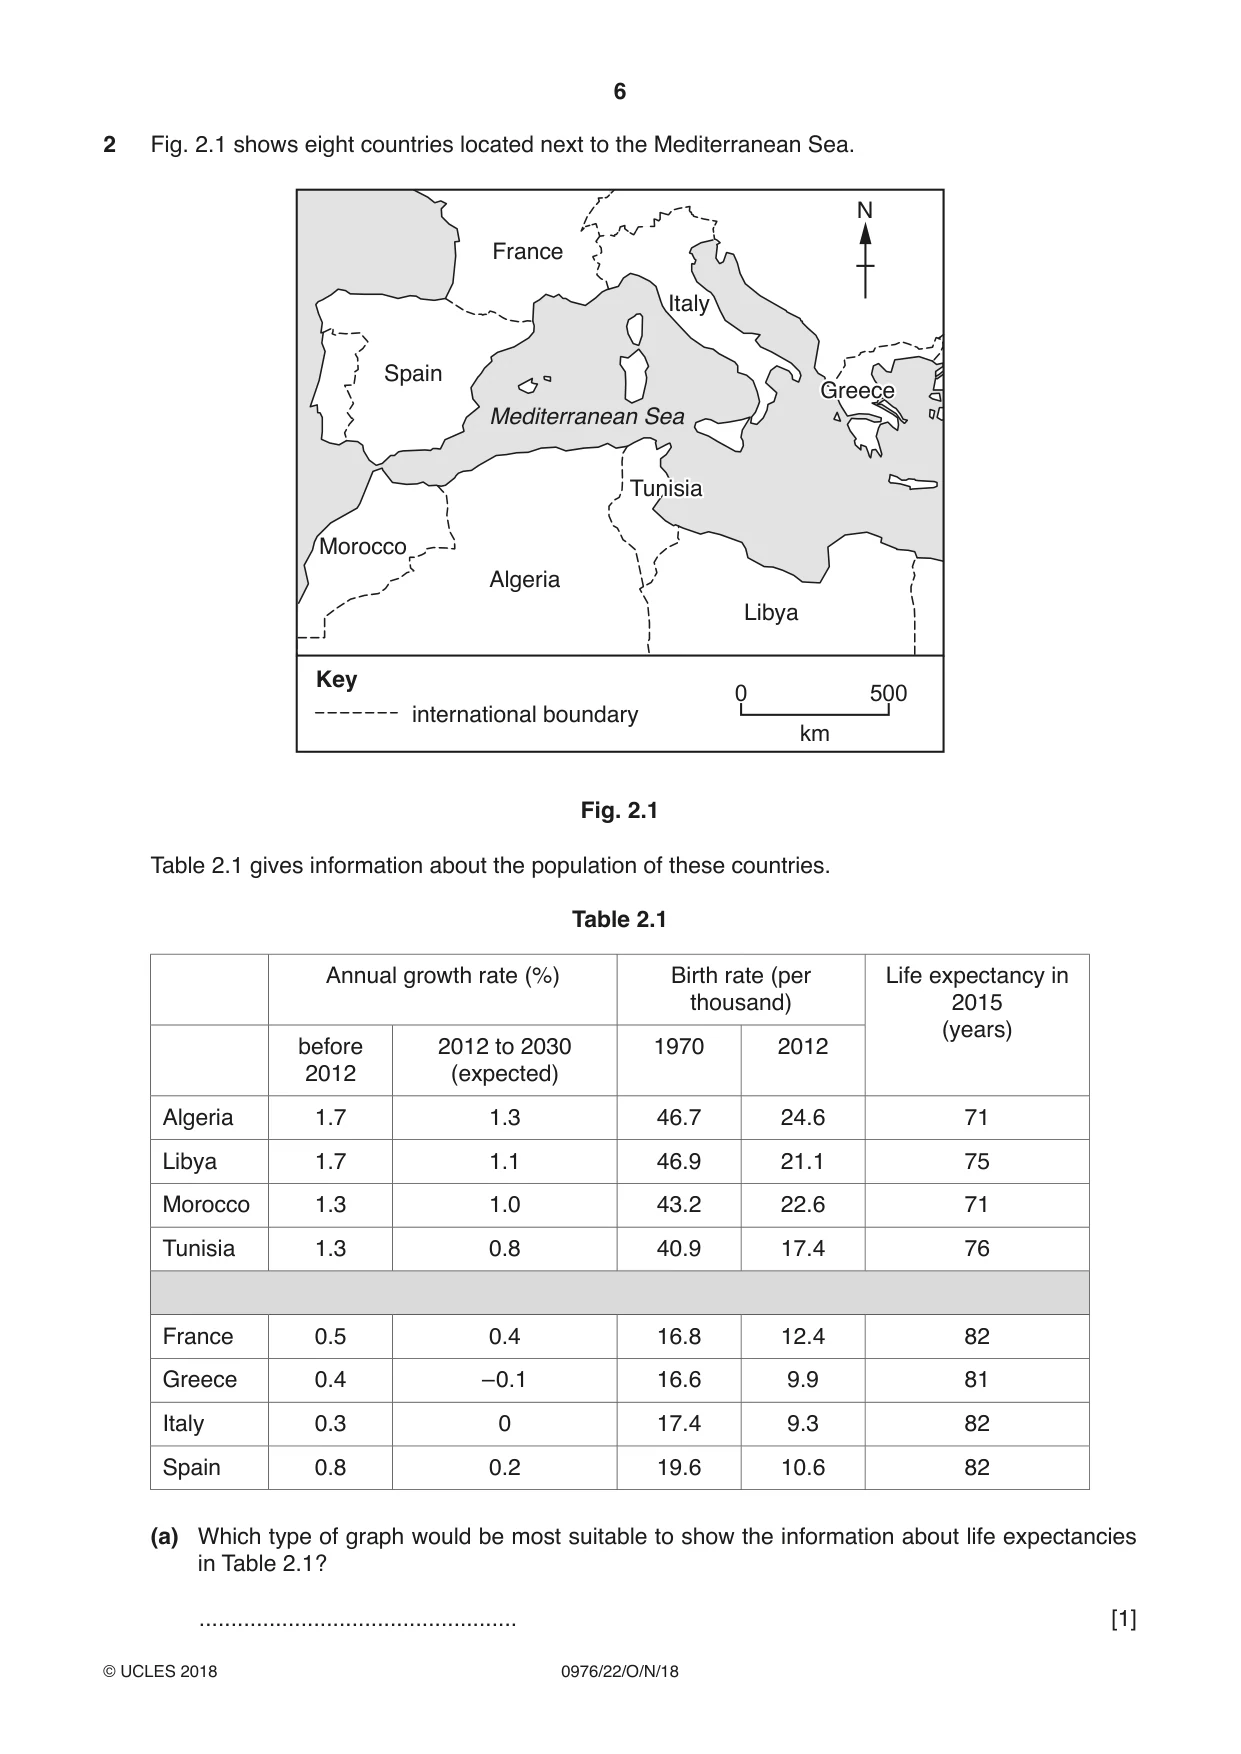
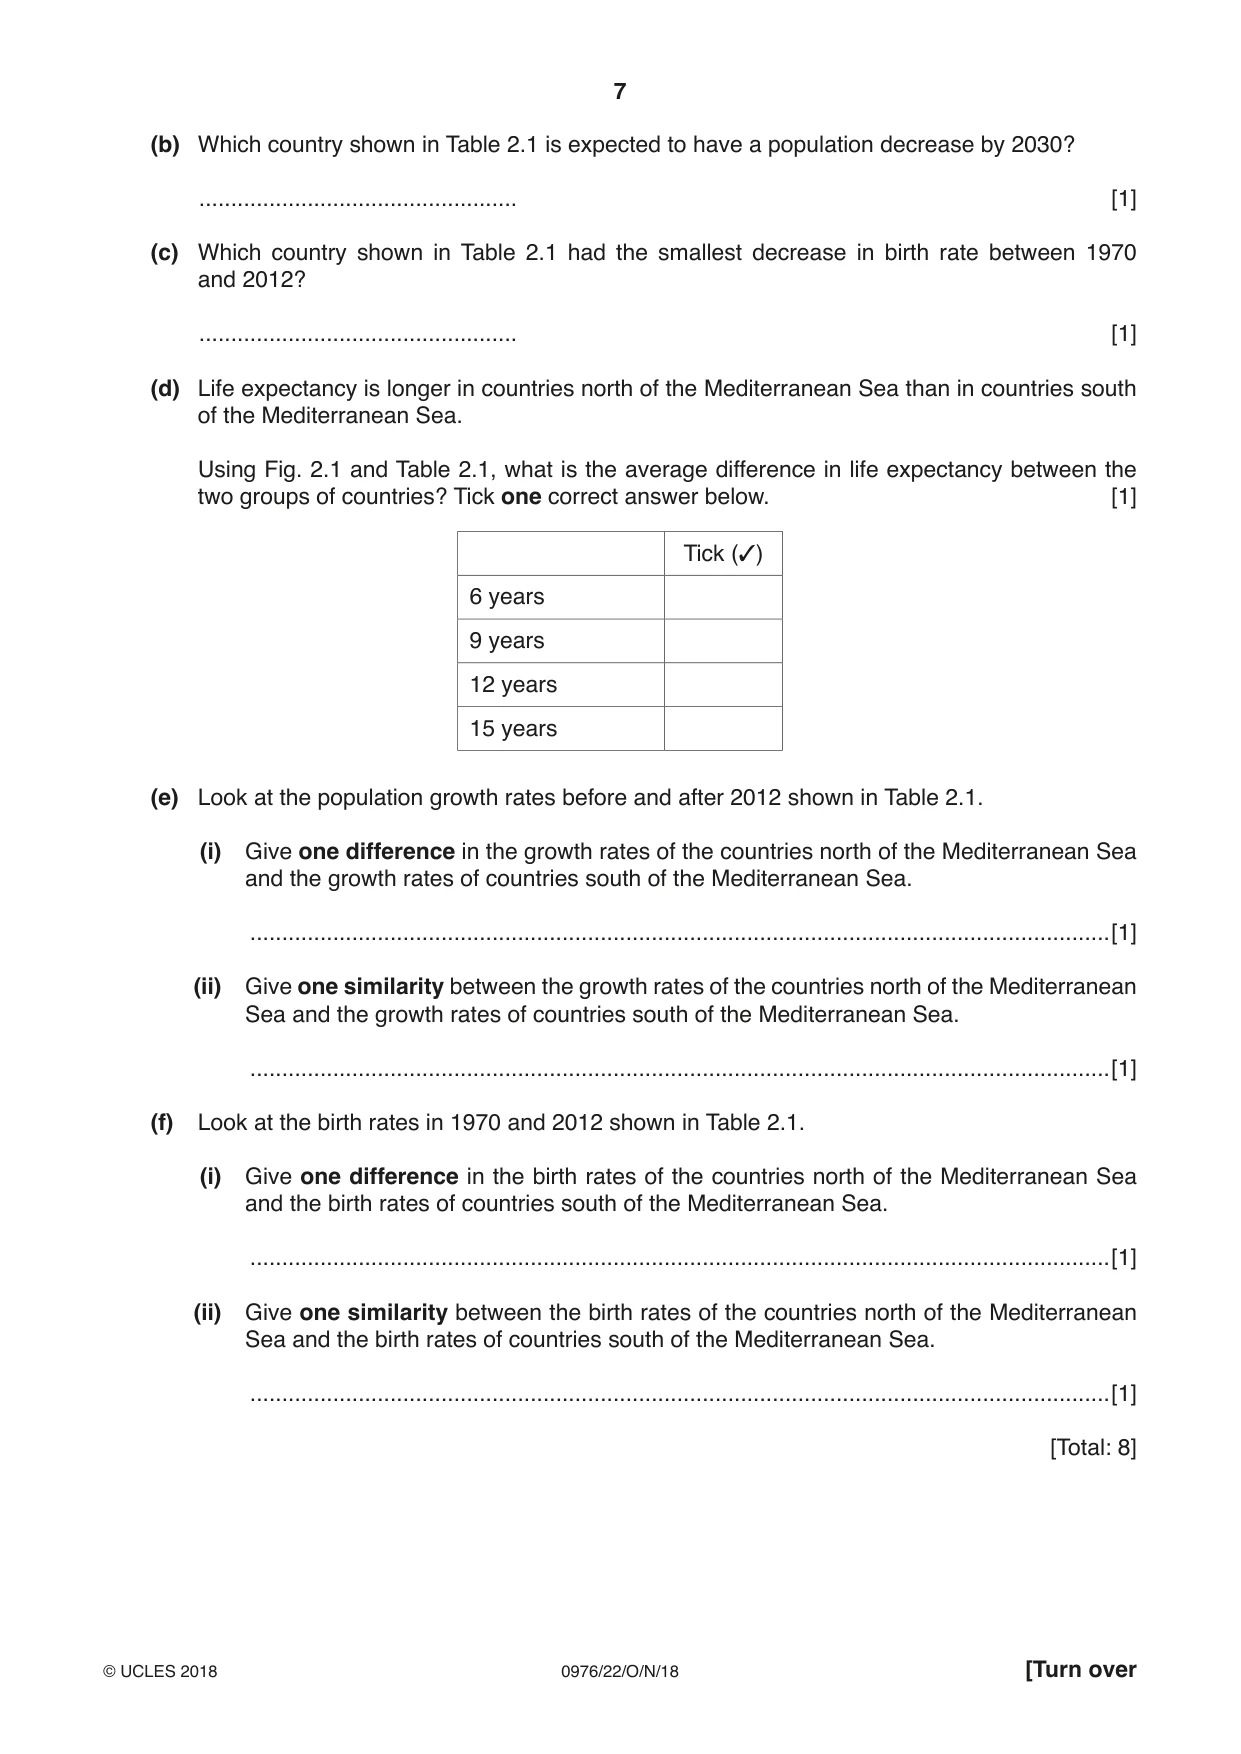
2 Fig. 2.1 shows eight countries located next to the Mediterranean Sea. N France Italy Spain Greece Mediterranean Sea TunisiaTunisia Morocco Algeria Libya Key 0 500 international boundary km Fig. 2.1 Table 2.1 gives information about the population of these countries. Table 2.1 Annual growth rate (%) Birth rate (per Life expectancy in thousand) 2015 (years) before 2012 to 2030 1970 2012 2012 (expected) Algeria 1.7 1.3 46.7 24.6 71 Libya 1.7 1.1 46.9 21.1 75 Morocco 1.3 1.0 43.2 22.6 71 Tunisia 1.3 0.8 40.9 17.4 76 France 0.5 0.4 16.8 12.4 82 Greece 0.4 –0.1 16.6 9.9 81 Italy 0.3 0 17.4 9.3 82 Spain 0.8 0.2 19.6 10.6 82 (a) Which type of graph would be most suitable to show the information about life expectancies in Table 2.1? .................................................. [1] (b) Which country shown in Table 2.1 is expected to have a population decrease by 2030? .................................................. [1] (c) Which country shown in Table 2.1 had the smallest decrease in birth rate between 1970 and 2012? .................................................. [1] (d) Life expectancy is longer in countries north of the Mediterranean Sea than in countries south of the Mediterranean Sea. Using Fig. 2.1 and Table 2.1, what is the average difference in life expectancy between the two groups of countries? Tick one correct answer below. [1] Tick (✓) 6 years 9 years 12 years 15 years (e) Look at the population growth rates before and after 2012 shown in Table 2.1. (i) Give one difference in the growth rates of the countries north of the Mediterranean Sea and the growth rates of countries south of the Mediterranean Sea. .......................................................................................................................................[1] (ii) Give one similarity between the growth rates of the countries north of the Mediterranean Sea and the growth rates of countries south of the Mediterranean Sea. .......................................................................................................................................[1] (f) Look at the birth rates in 1970 and 2012 shown in Table 2.1. (i) Give one difference in the birth rates of the countries north of the Mediterranean Sea and the birth rates of countries south of the Mediterranean Sea. .......................................................................................................................................[1] (ii) Give one similarity between the birth rates of the countries north of the Mediterranean Sea and the birth rates of countries south of the Mediterranean Sea. .......................................................................................................................................[1] [Total: 8]
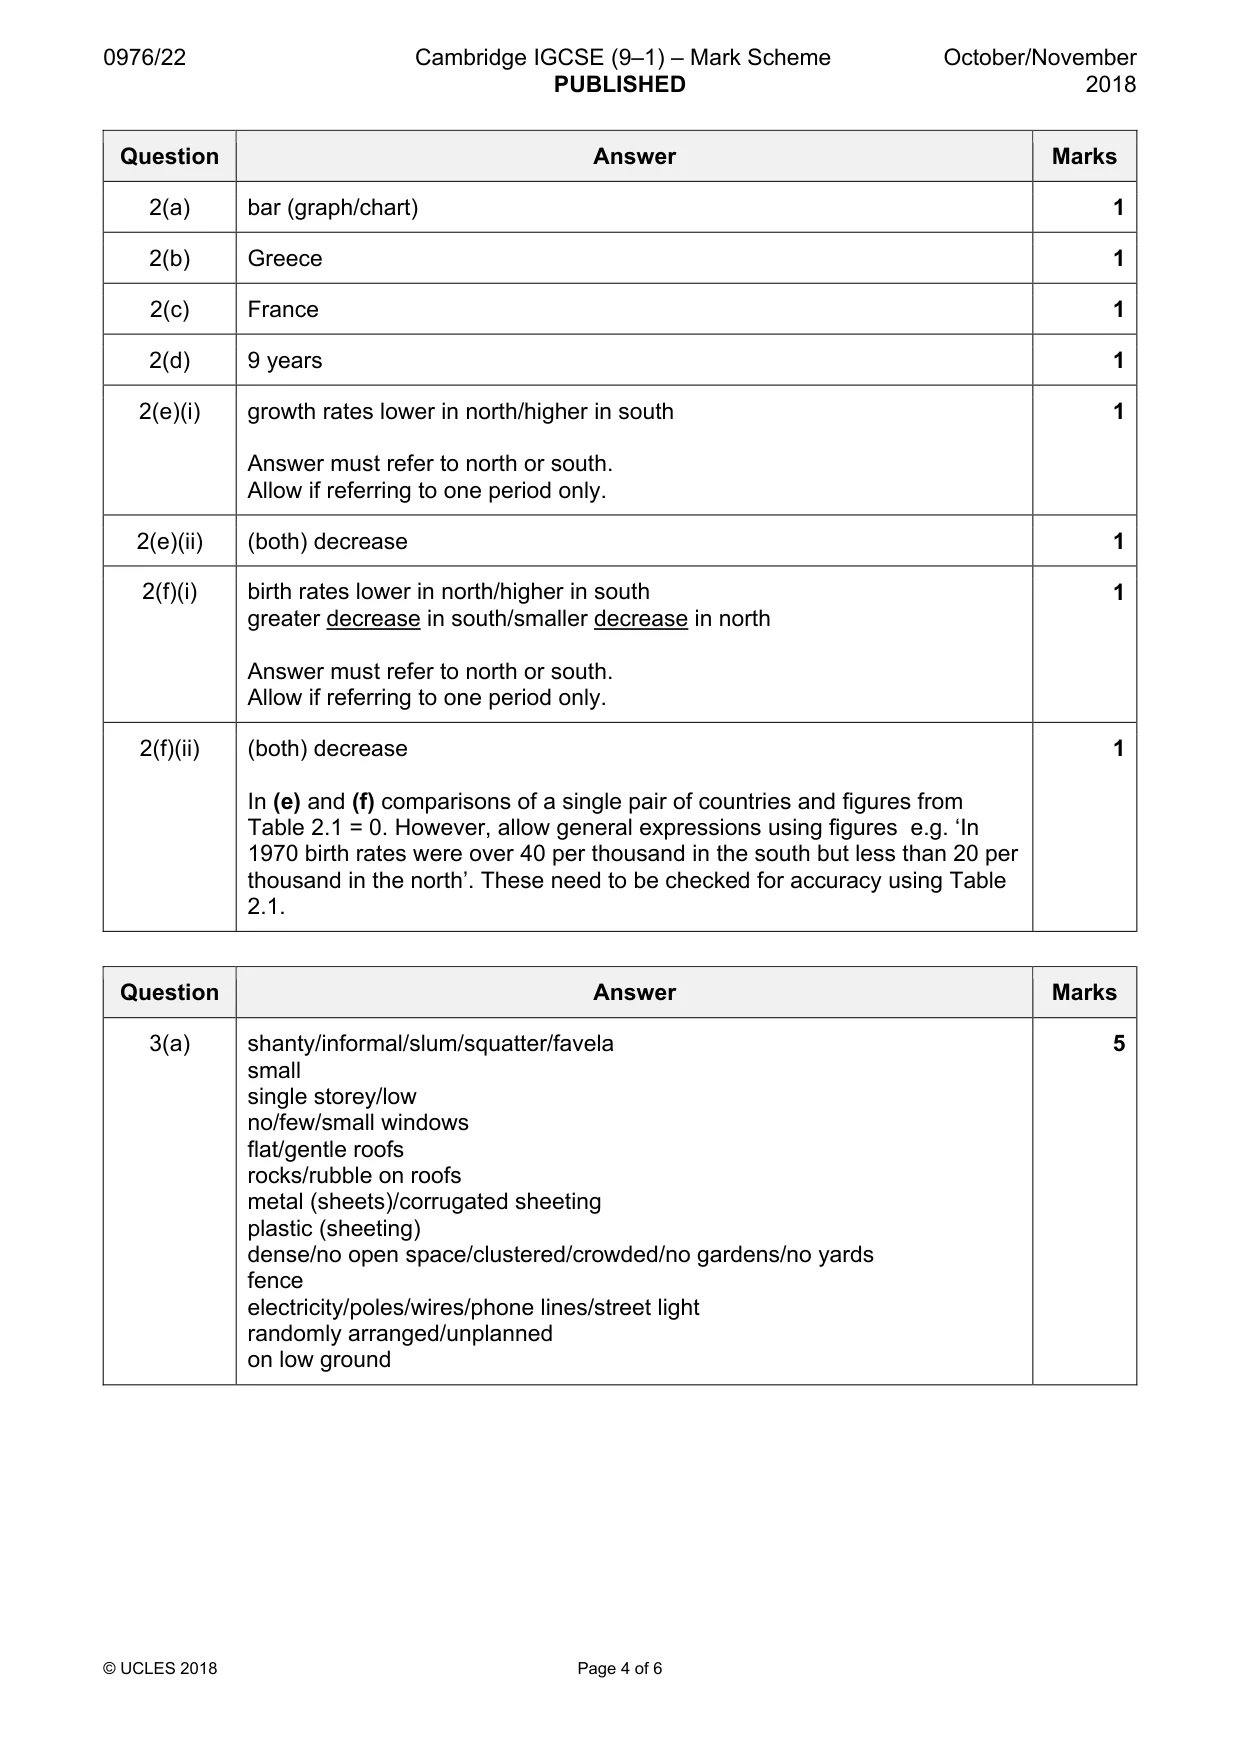
Mark scheme: 2(a) bar (graph/chart) 1 2(b) Greece 1 2(c) France 1 2(d) 9 years 1 2(e)(i) growth rates lower in north/higher in south 1 Answer must refer to north or south. Allow if referring to one period only. 2(e)(ii) (both) decrease 1 2(f)(i) birth rates lower in north/higher in south 1 greater decrease in south/smaller decrease in north Answer must refer to north or south. Allow if referring to one period only. 2(f)(ii) (both) decrease 1 In (e) and (f) comparisons of a single pair of countries and figures from Table 2.1 = 0. However, allow general expressions using figures e.g. ‘In 1970 birth rates were over 40 per thousand in the south but less than 20 per thousand in the north’. These need to be checked for accuracy using Table 2.1.
Q3 · Urbanisation is the increase in the proportion of a country’s population that live in…
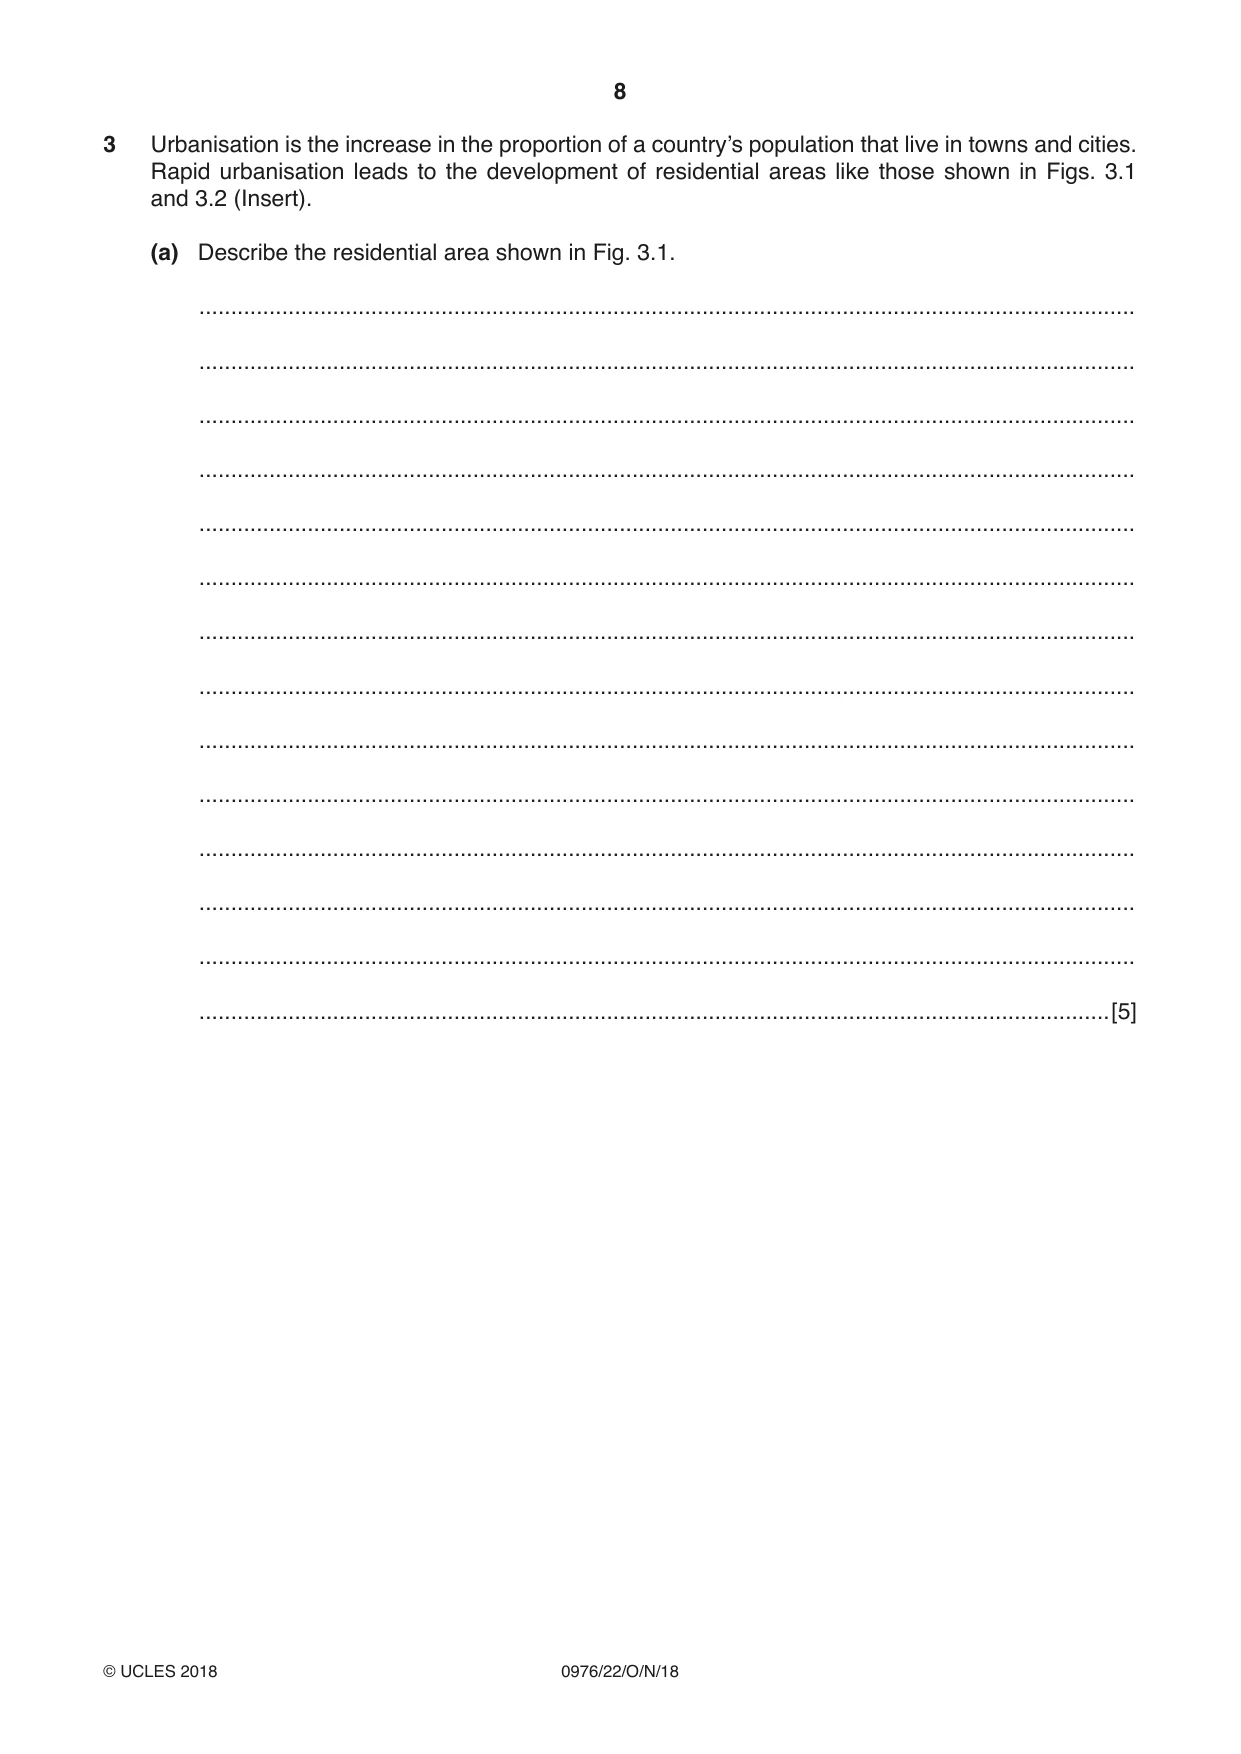
3 Urbanisation is the increase in the proportion of a country’s population that live in towns and cities. Rapid urbanisation leads to the development of residential areas like those shown in Figs. 3.1 and 3.2 (Insert). (a) Describe the residential area shown in Fig. 3.1. ................................................................................................................................................... ................................................................................................................................................... ................................................................................................................................................... ................................................................................................................................................... ................................................................................................................................................... ................................................................................................................................................... ................................................................................................................................................... ................................................................................................................................................... ................................................................................................................................................... ................................................................................................................................................... ................................................................................................................................................... ................................................................................................................................................... ................................................................................................................................................... ...............................................................................................................................................[5] (b) Using evidence from the photographs, describe three advantages of living in the residential area in Fig. 3.2 compared to the residential area in Fig. 3.1. 1 ................................................................................................................................................ ................................................................................................................................................... ................................................................................................................................................... 2 ................................................................................................................................................ ................................................................................................................................................... ................................................................................................................................................... 3 ................................................................................................................................................ ................................................................................................................................................... ...............................................................................................................................................[3] [Total: 8]
Mark scheme: 3(a) shanty/informal/slum/squatter/favela 5 small single storey/low no/few/small windows flat/gentle roofs rocks/rubble on roofs metal (sheets)/corrugated sheeting plastic (sheeting) dense/no open space/clustered/crowded/no gardens/no yards fence electricity/poles/wires/phone lines/street light randomly arranged/unplanned on low ground 3(b) gardens/yards/food plots/space to cultivate 3 space/access for cars/parking space for drying space for privacy toilets/latrines windows substantial buildings/good shelter from weather/strong/safe (not electric)/good building materials/good construction/quality building materials easier to heat/cool
Q4 · Weather information for Mbabane, Swaziland for five days in 2016
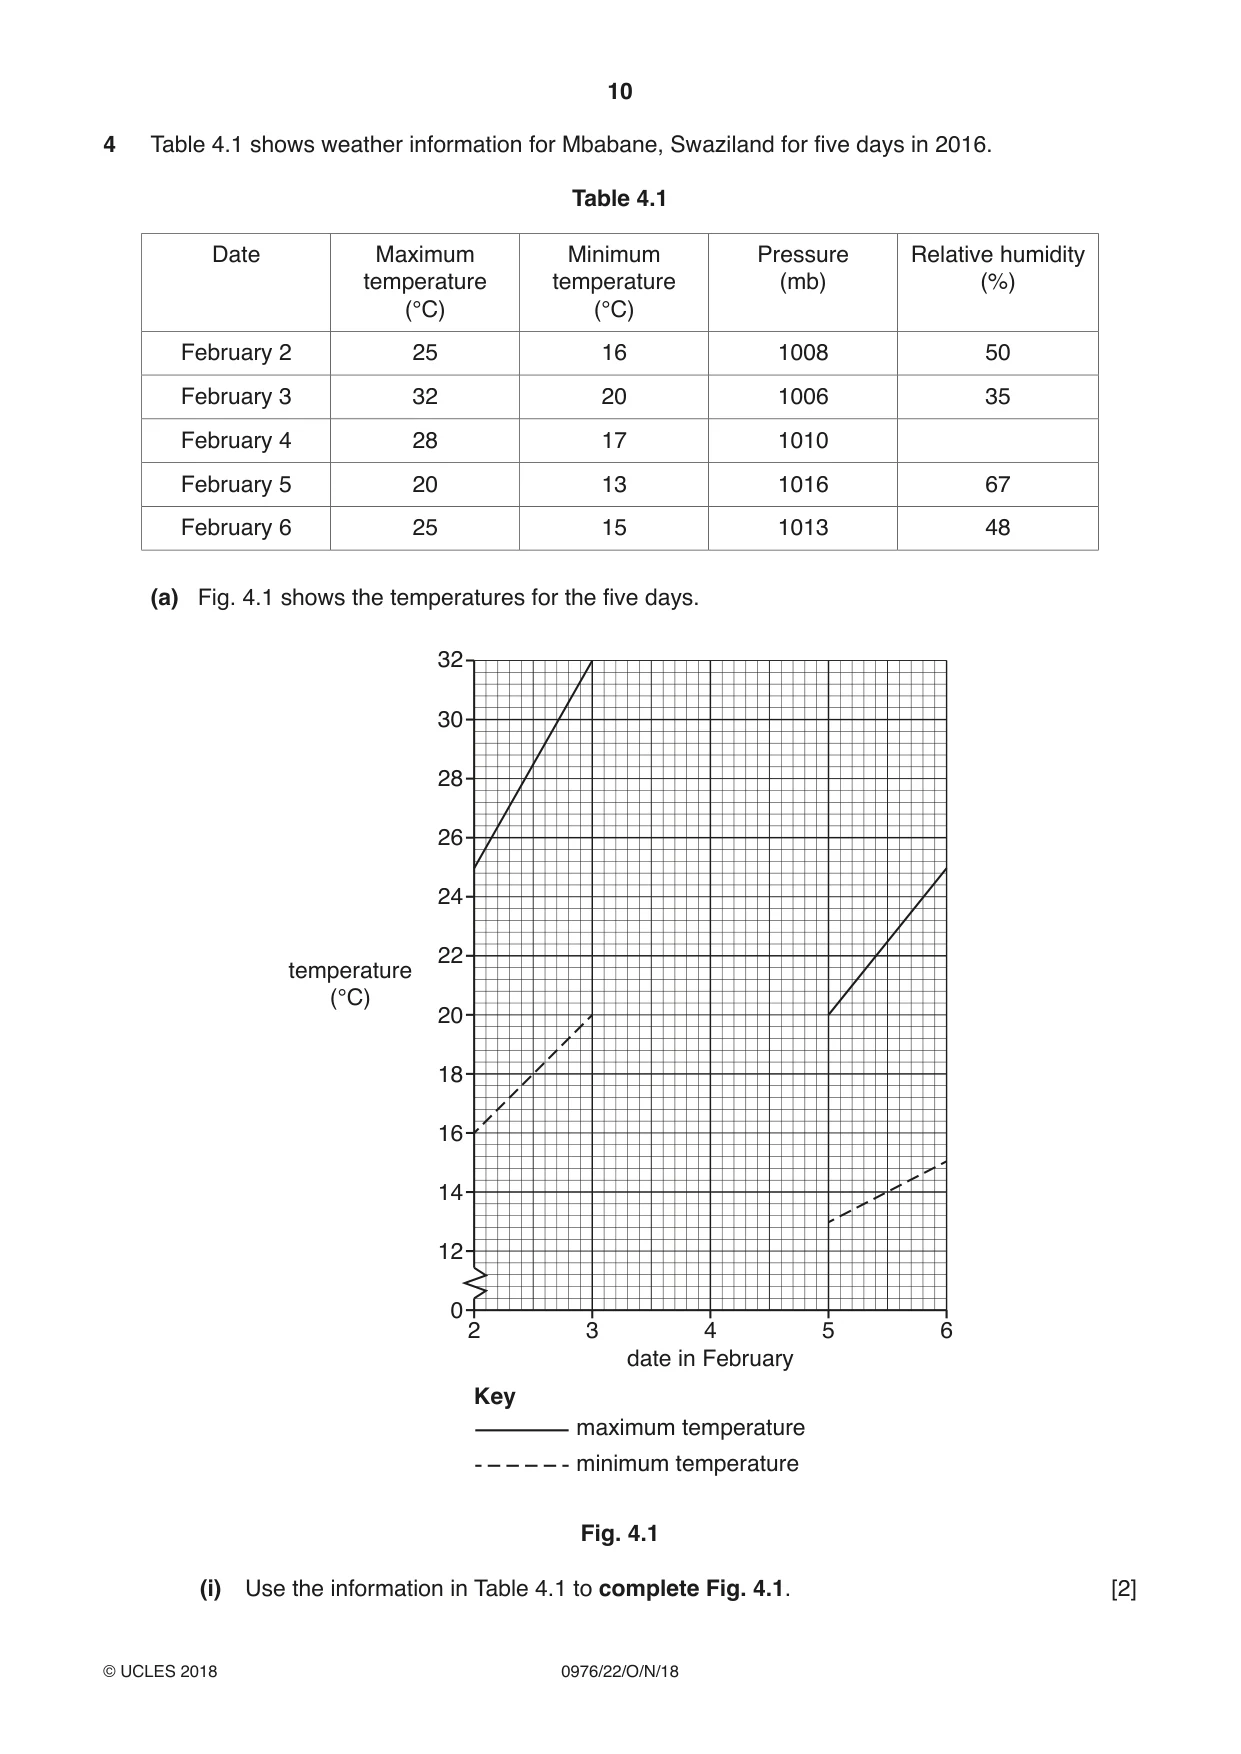
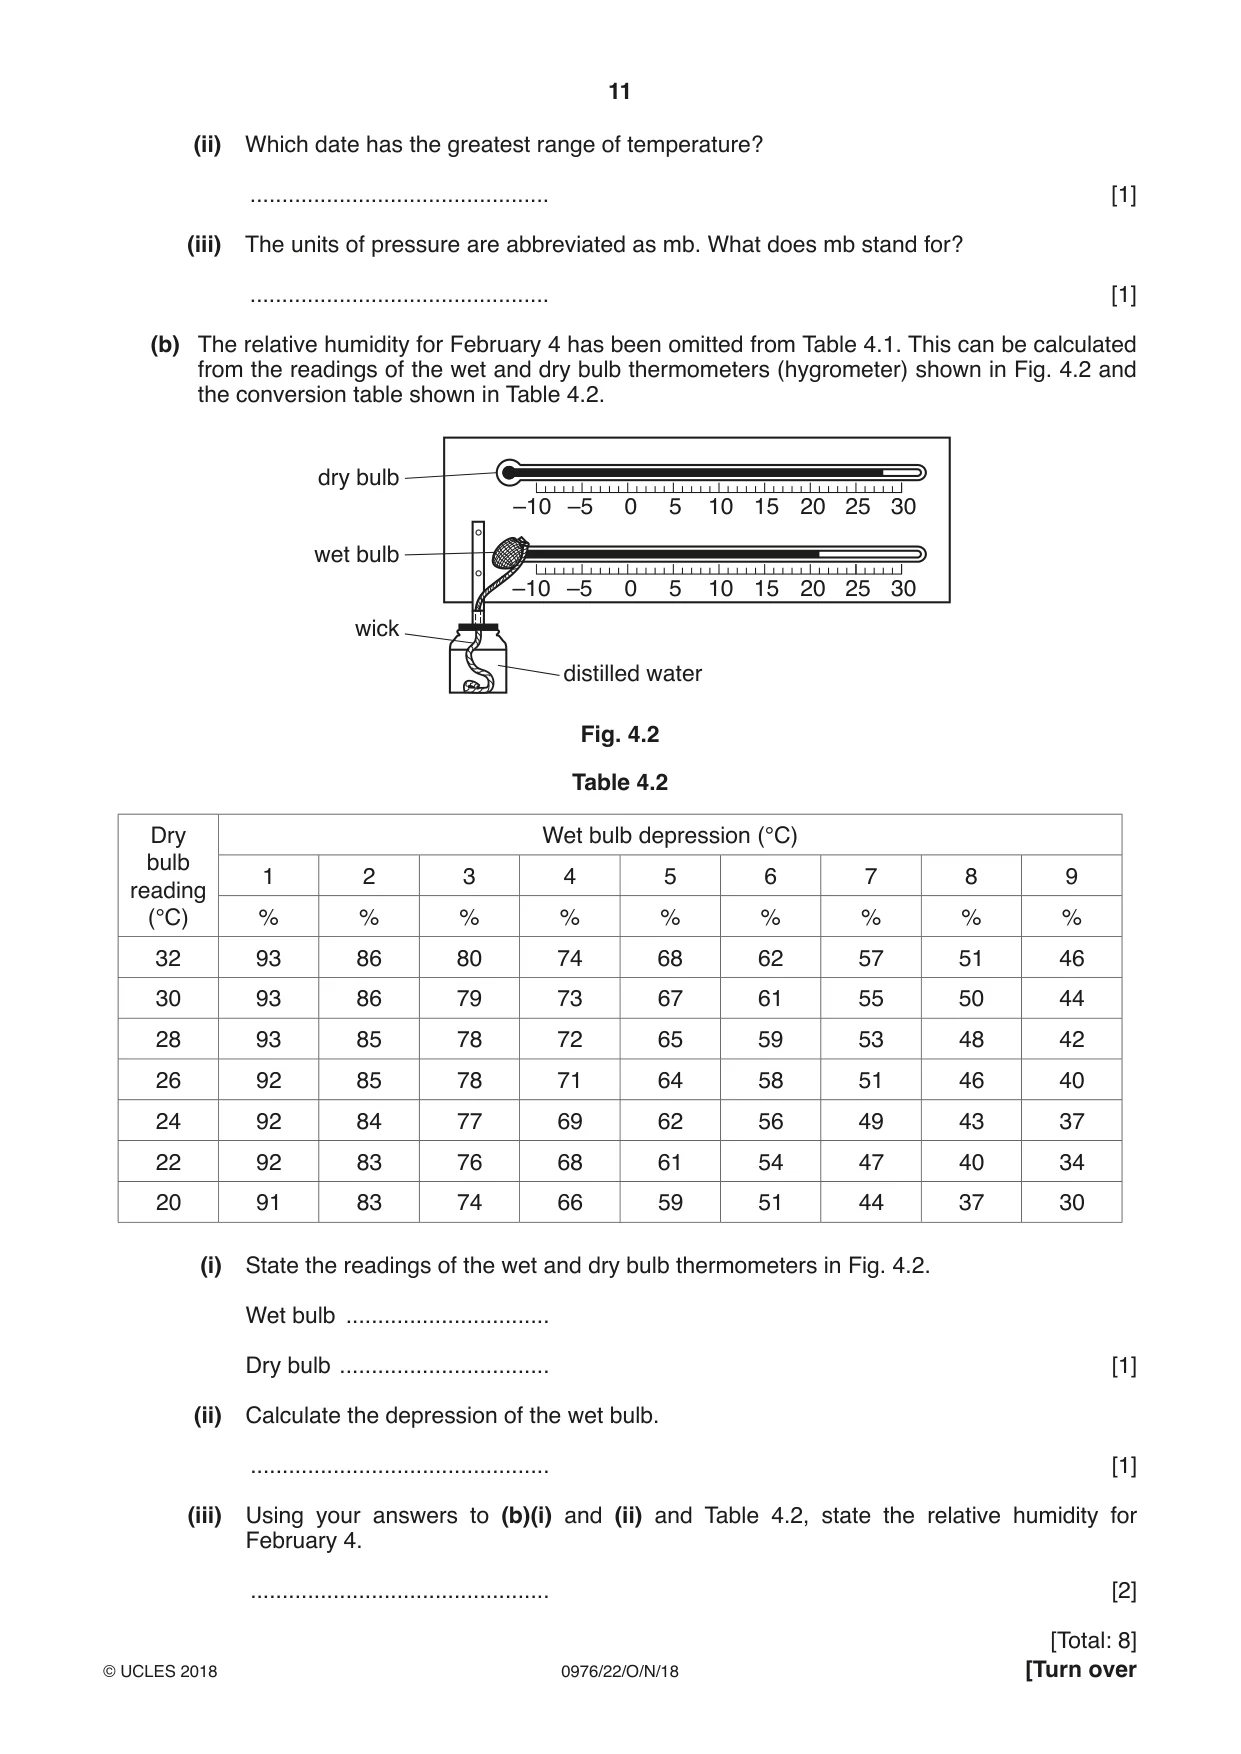
4 Table 4.1 shows weather information for Mbabane, Swaziland for five days in 2016. Table 4.1 Date Maximum Minimum Pressure Relative humidity temperature temperature (mb) (%) (°C) (°C) February 2 25 16 1008 50 February 3 32 20 1006 35 February 4 28 17 1010 February 5 20 13 1016 67 February 6 25 15 1013 48 (a) Fig. 4.1 shows the temperatures for the five days. 32 30 28 26 24 22 temperature (°C) 20 18 16 14 12 0 2 3 4 5 6 date in February Key maximum temperature minimum temperature Fig. 4.1 (i) Use the information in Table 4.1 to complete Fig. 4.1. [2] (ii) Which date has the greatest range of temperature? ............................................... [1] (iii) The units of pressure are abbreviated as mb. What does mb stand for? ............................................... [1] (b) The relative humidity for February 4 has been omitted from Table 4.1. This can be calculated from the readings of the wet and dry bulb thermometers (hygrometer) shown in Fig. 4.2 and the conversion table shown in Table 4.2. dry bulb –10 –5 0 5 10 15 20 25 30 wet bulb –10 –5 0 5 10 15 20 25 30 wick distilled water Fig. 4.2 Table 4.2 Dry Wet bulb depression (°C) bulb 1 2 3 4 5 6 7 8 9reading (°C) % % % % % % % % % 32 93 86 80 74 68 62 57 51 46 30 93 86 79 73 67 61 55 50 44 28 93 85 78 72 65 59 53 48 42 26 92 85 78 71 64 58 51 46 40 24 92 84 77 69 62 56 49 43 37 22 92 83 76 68 61 54 47 40 34 20 91 83 74 66 59 51 44 37 30 (i) State the readings of the wet and dry bulb thermometers in Fig. 4.2. Wet bulb ................................ Dry bulb ................................. [1] (ii) Calculate the depression of the wet bulb. ............................................... [1] (iii) Using your answers to (b)(i) and (ii) and Table 4.2, state the relative humidity for February 4. ............................................... [2]
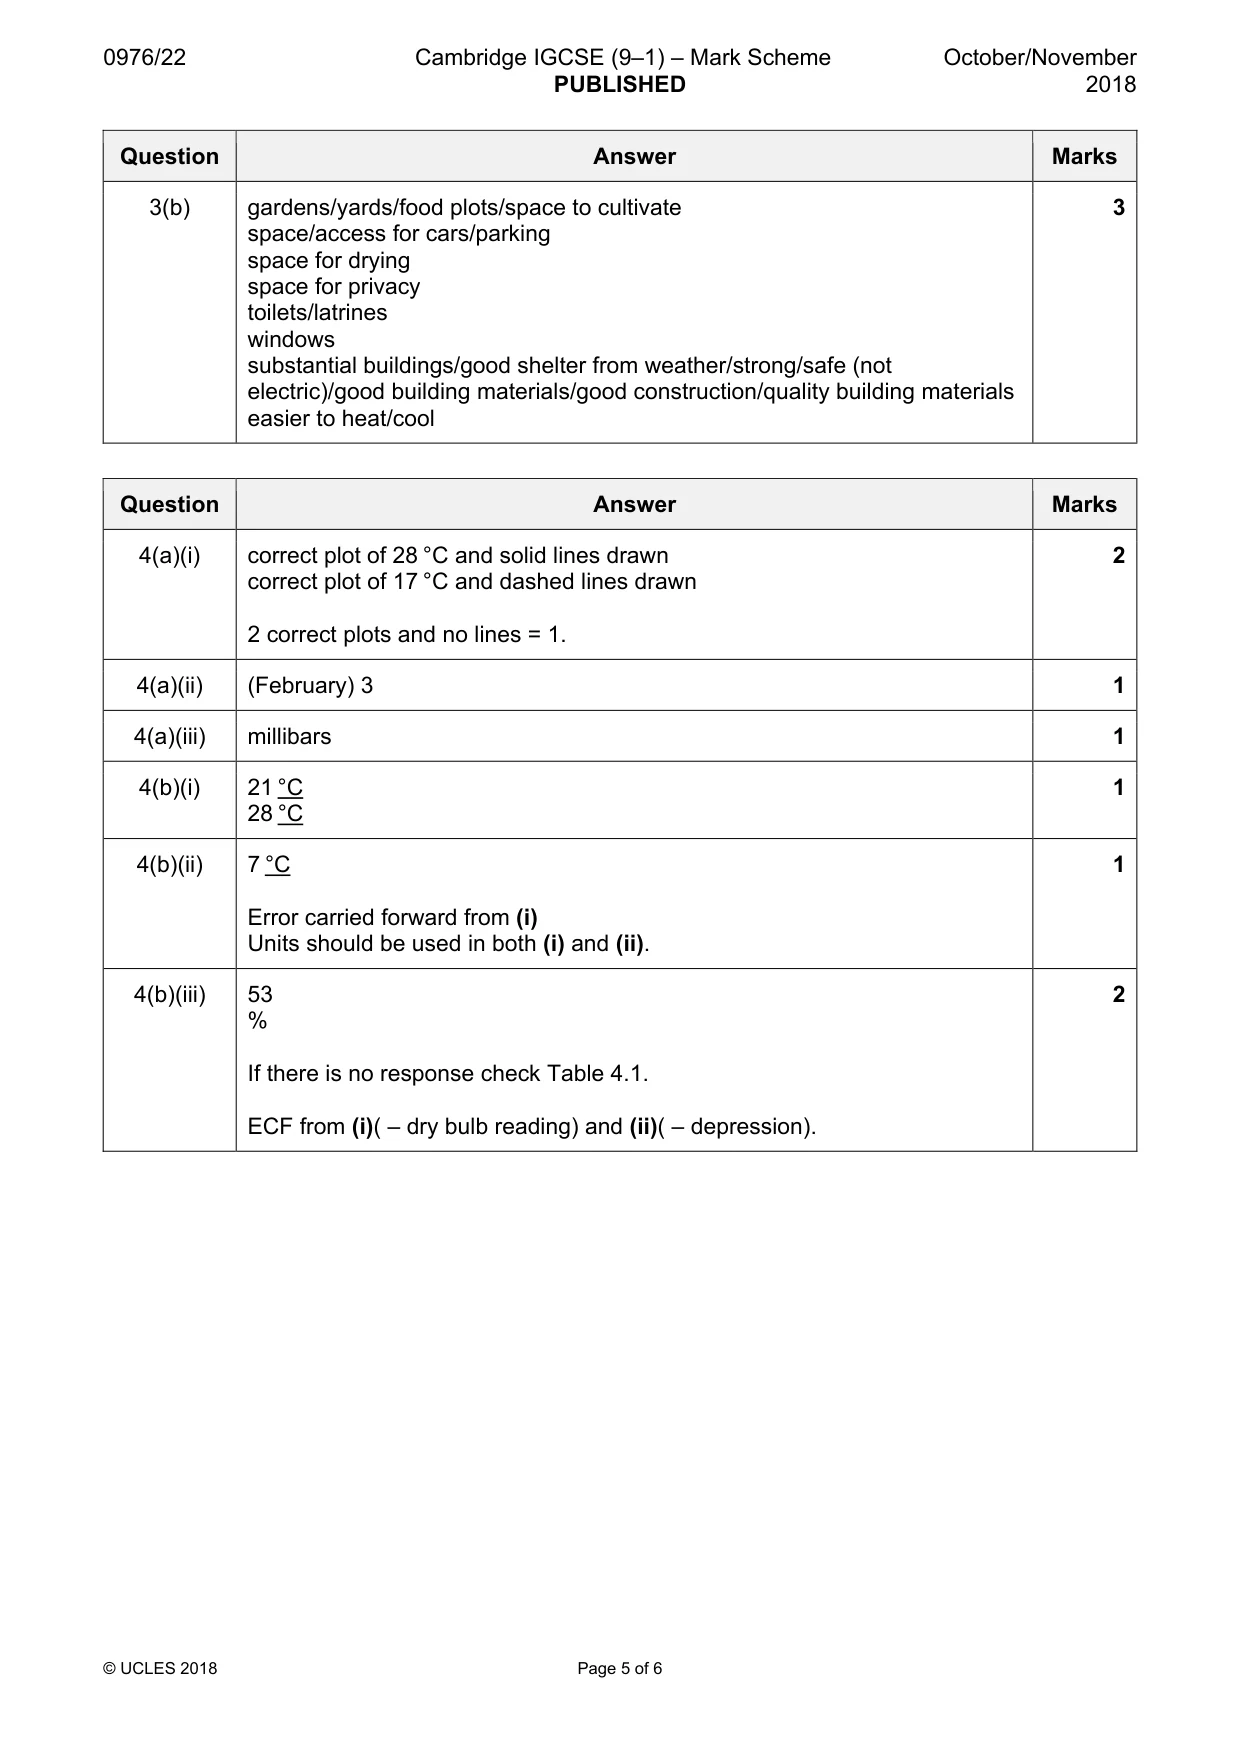
Mark scheme: 4(a)(i) correct plot of 28 °C and solid lines drawn 2 correct plot of 17 °C and dashed lines drawn 2 correct plots and no lines = 1. 4(a)(ii) (February) 3 1 4(a)(iii) millibars 1 4(b)(i) 21 °C 1 28 °C 4(b)(ii) 7 °C 1 Error carried forward from (i) Units should be used in both (i) and (ii). 4(b)(iii) 53 2 % If there is no response check Table 4.1. ECF from (i)( – dry bulb reading) and (ii)( – depression).
Q5 · The tectonic plates, plate movements and plate margins around the Atlantic Ocean
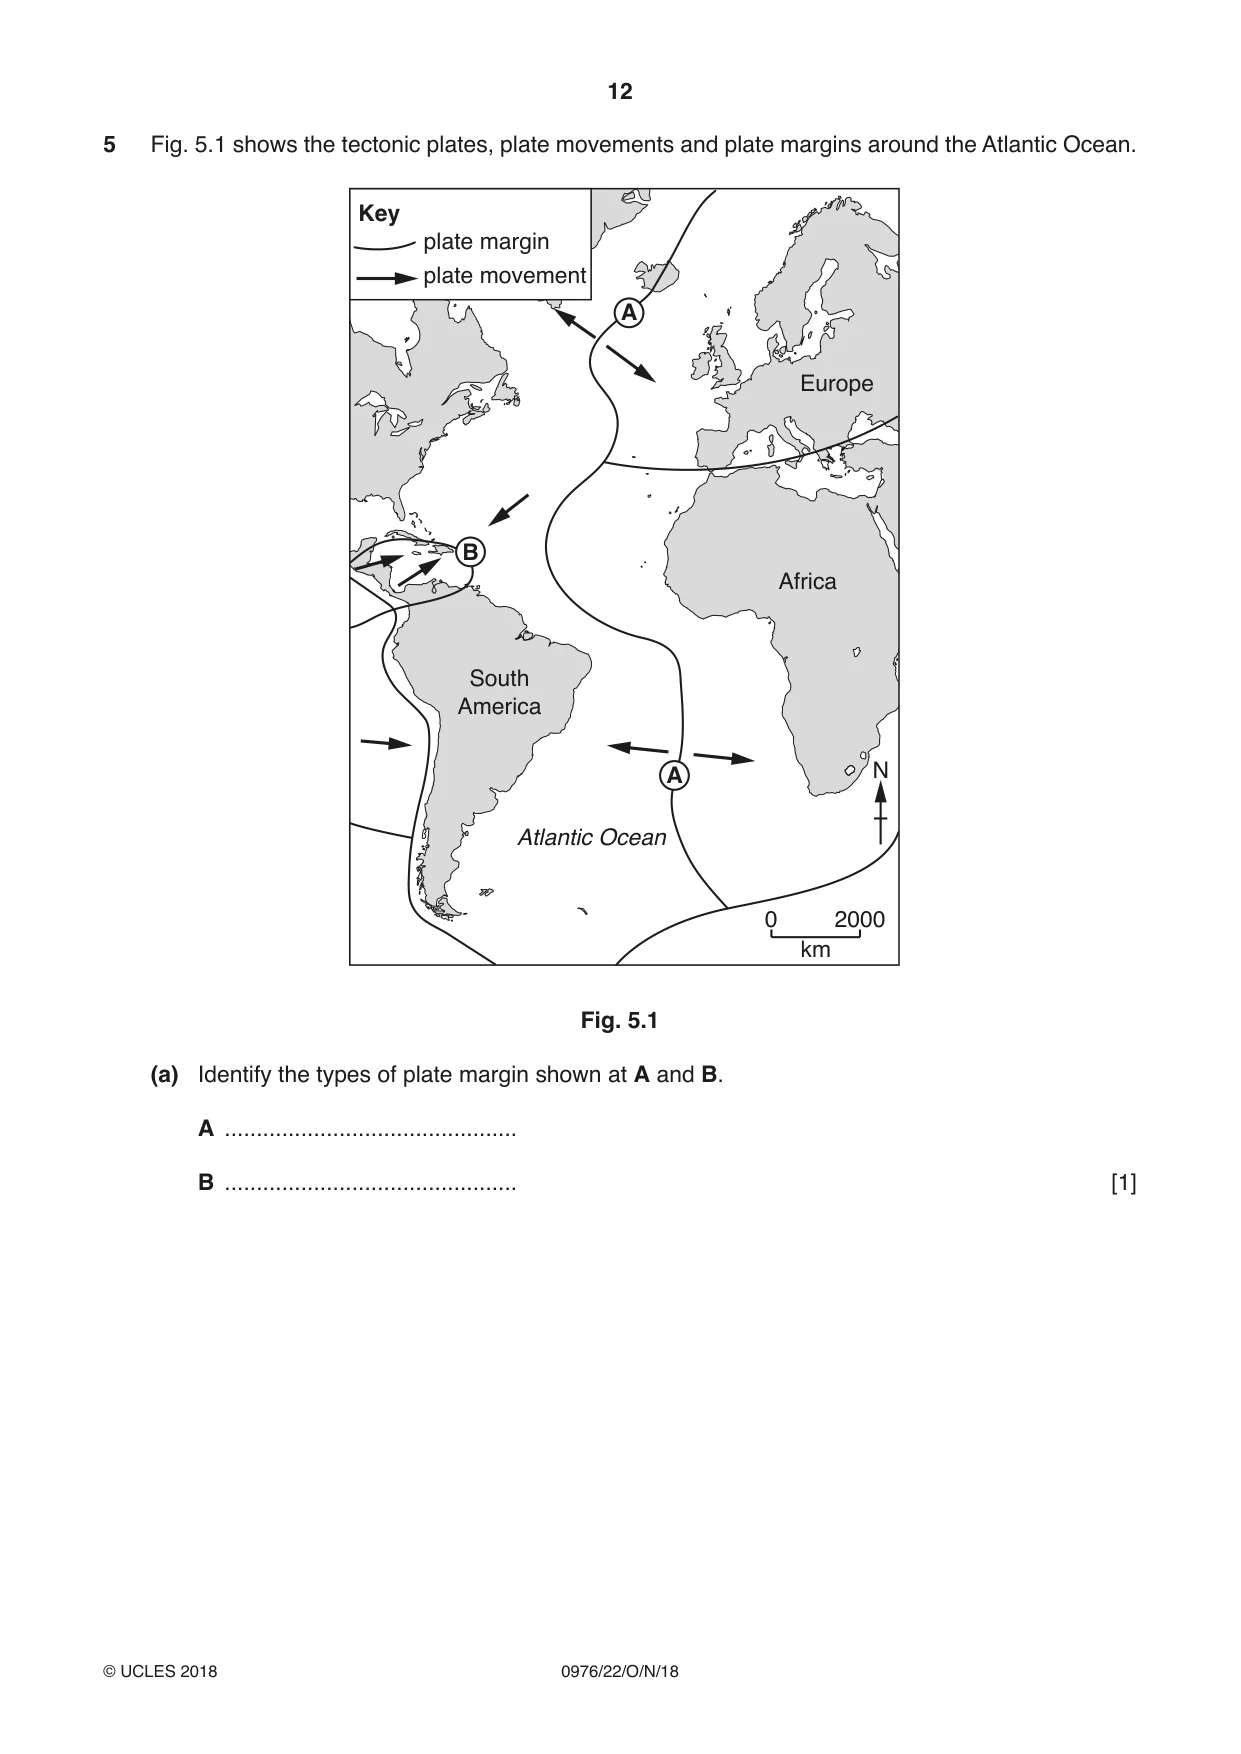
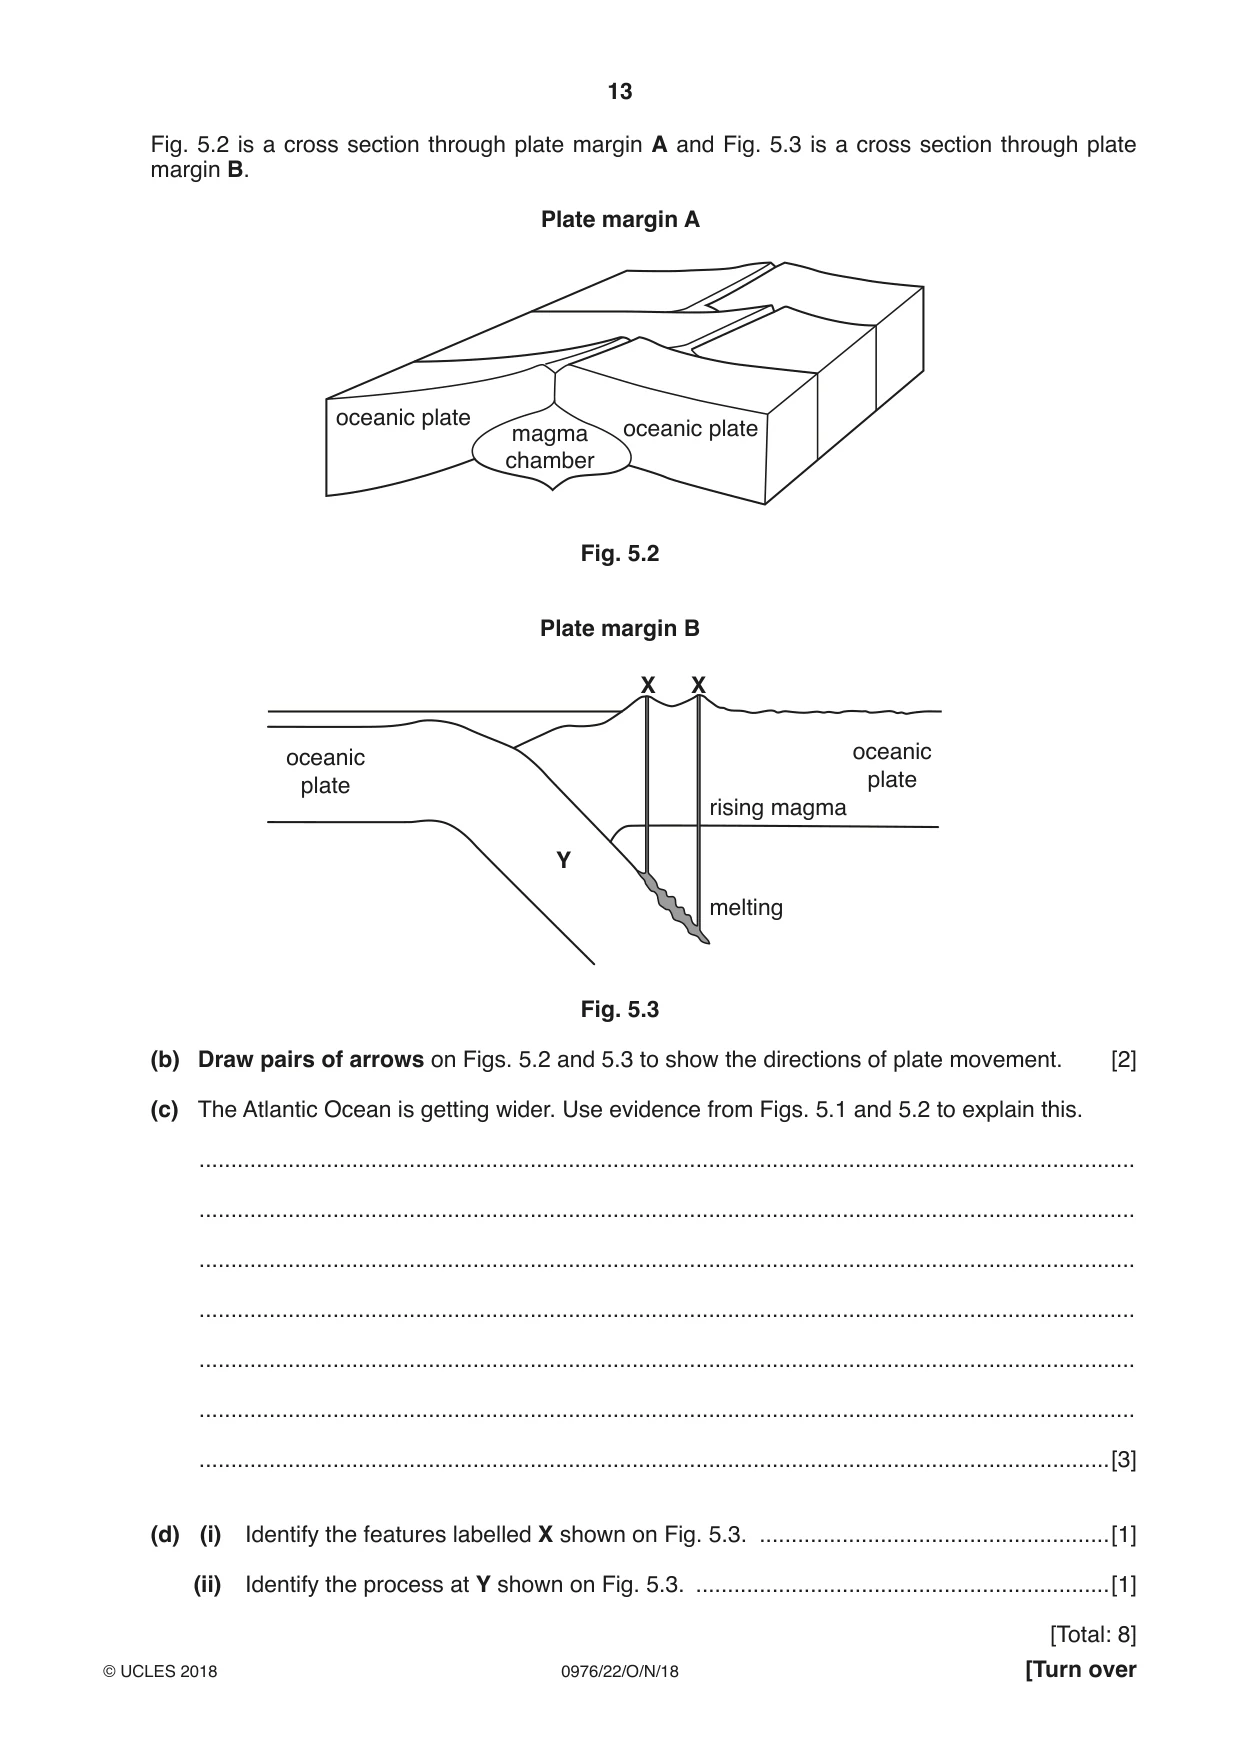
5 Fig. 5.1 shows the tectonic plates, plate movements and plate margins around the Atlantic Ocean. Key plate margin plate movement A Europe B Africa South America A N Atlantic Ocean 0 2000 km Fig. 5.1 (a) Identify the types of plate margin shown at A and B. A .............................................. B .............................................. [1] Fig. 5.2 is a cross section through plate margin A and Fig. 5.3 is a cross section through plate margin B. Plate margin A oceanic plate magma oceanic plate chamber Fig. 5.2 Plate margin B X X oceanic oceanic plate plate rising magma Y melting Fig. 5.3 (b) Draw pairs of arrows on Figs. 5.2 and 5.3 to show the directions of plate movement. [2] (c) The Atlantic Ocean is getting wider. Use evidence from Figs. 5.1 and 5.2 to explain this. ................................................................................................................................................... ................................................................................................................................................... ................................................................................................................................................... ................................................................................................................................................... ................................................................................................................................................... ................................................................................................................................................... ...............................................................................................................................................[3] (d) (i) Identify the features labelled X shown on Fig. 5.3. .......................................................[1] (ii) Identify the process at Y shown on Fig. 5.3. .................................................................[1] [Total: 8]
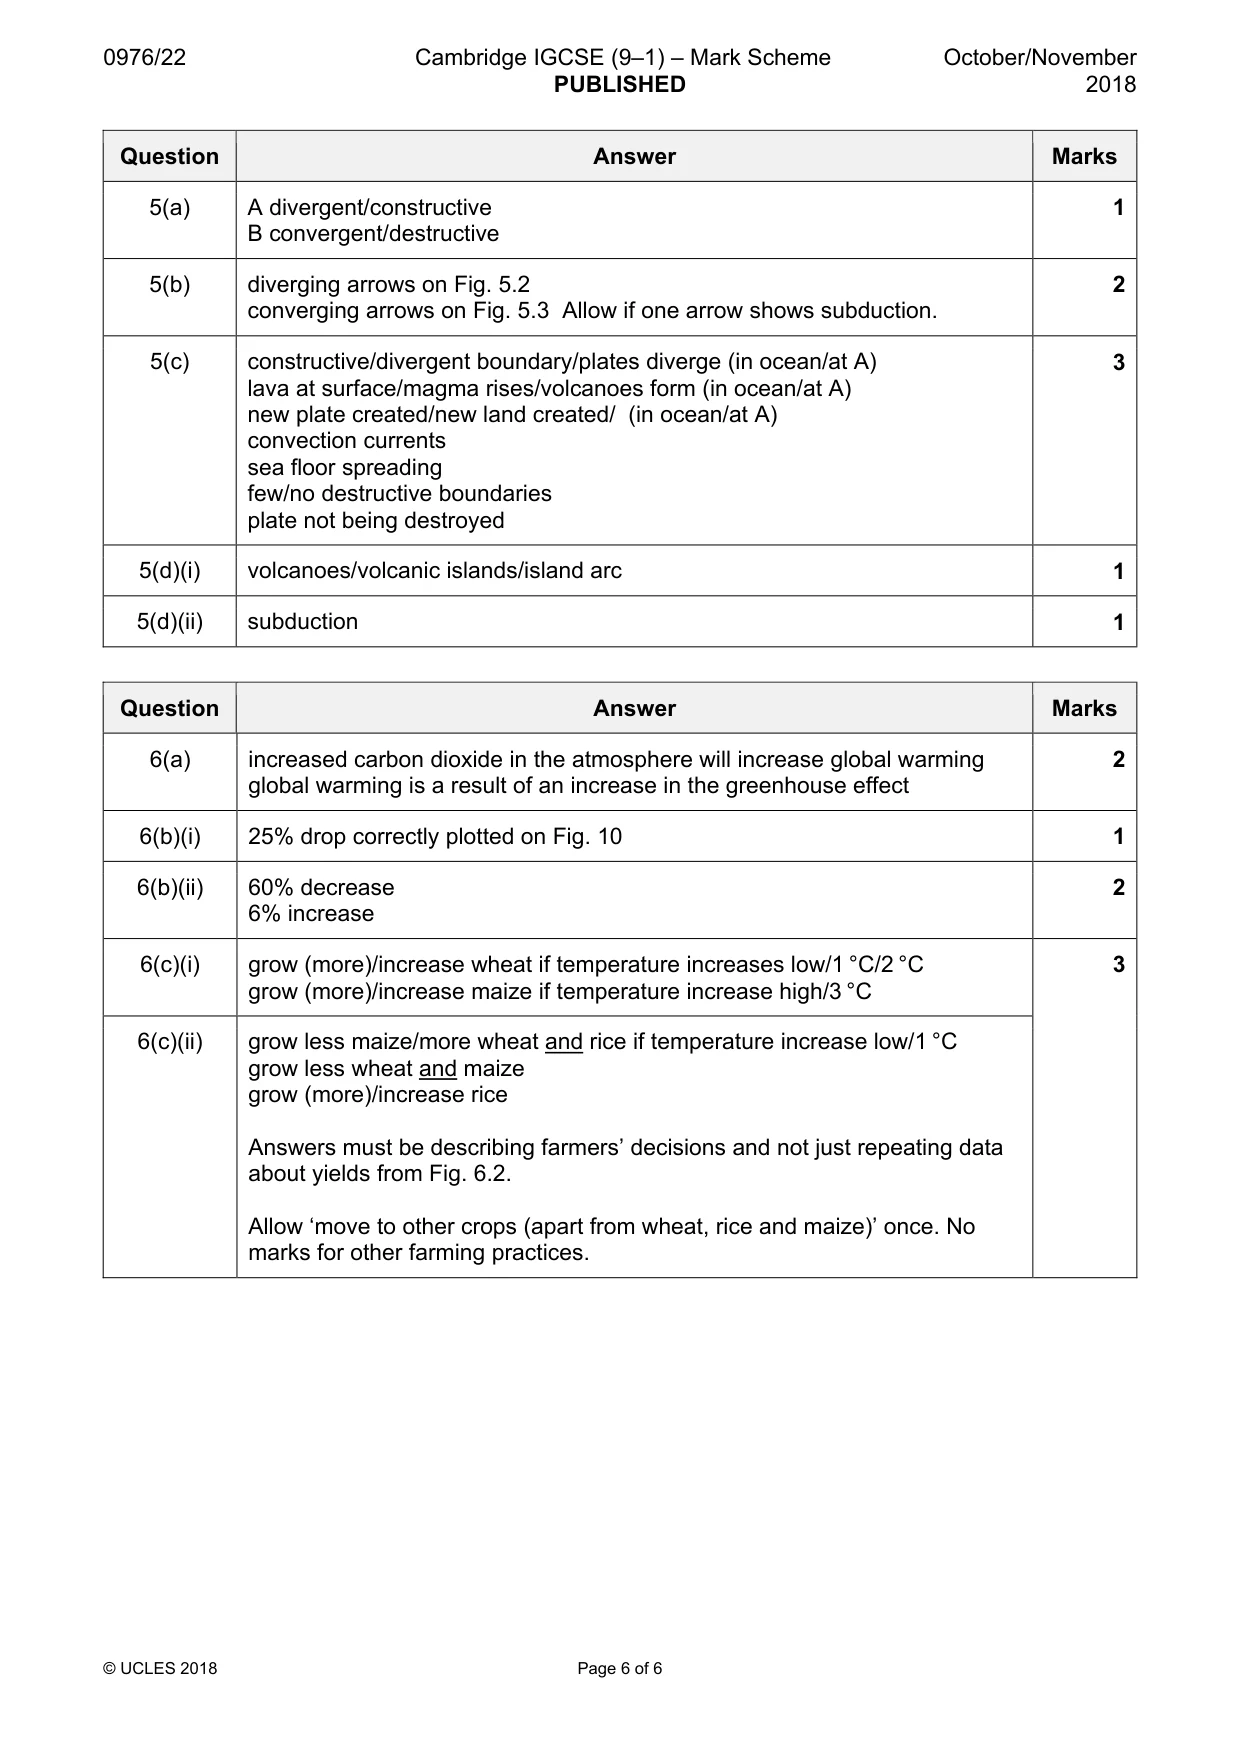
Mark scheme: 5(a) A divergent/constructive 1 B convergent/destructive 5(b) diverging arrows on Fig. 5.2 2 converging arrows on Fig. 5.3 Allow if one arrow shows subduction. 5(c) constructive/divergent boundary/plates diverge (in ocean/at A) 3 lava at surface/magma rises/volcanoes form (in ocean/at A) new plate created/new land created/ (in ocean/at A) convection currents sea floor spreading few/no destructive boundaries plate not being destroyed 5(d)(i) volcanoes/volcanic islands/island arc 1 5(d)(ii) subduction 1
Q6 · In recent years people have become more concerned about global warming
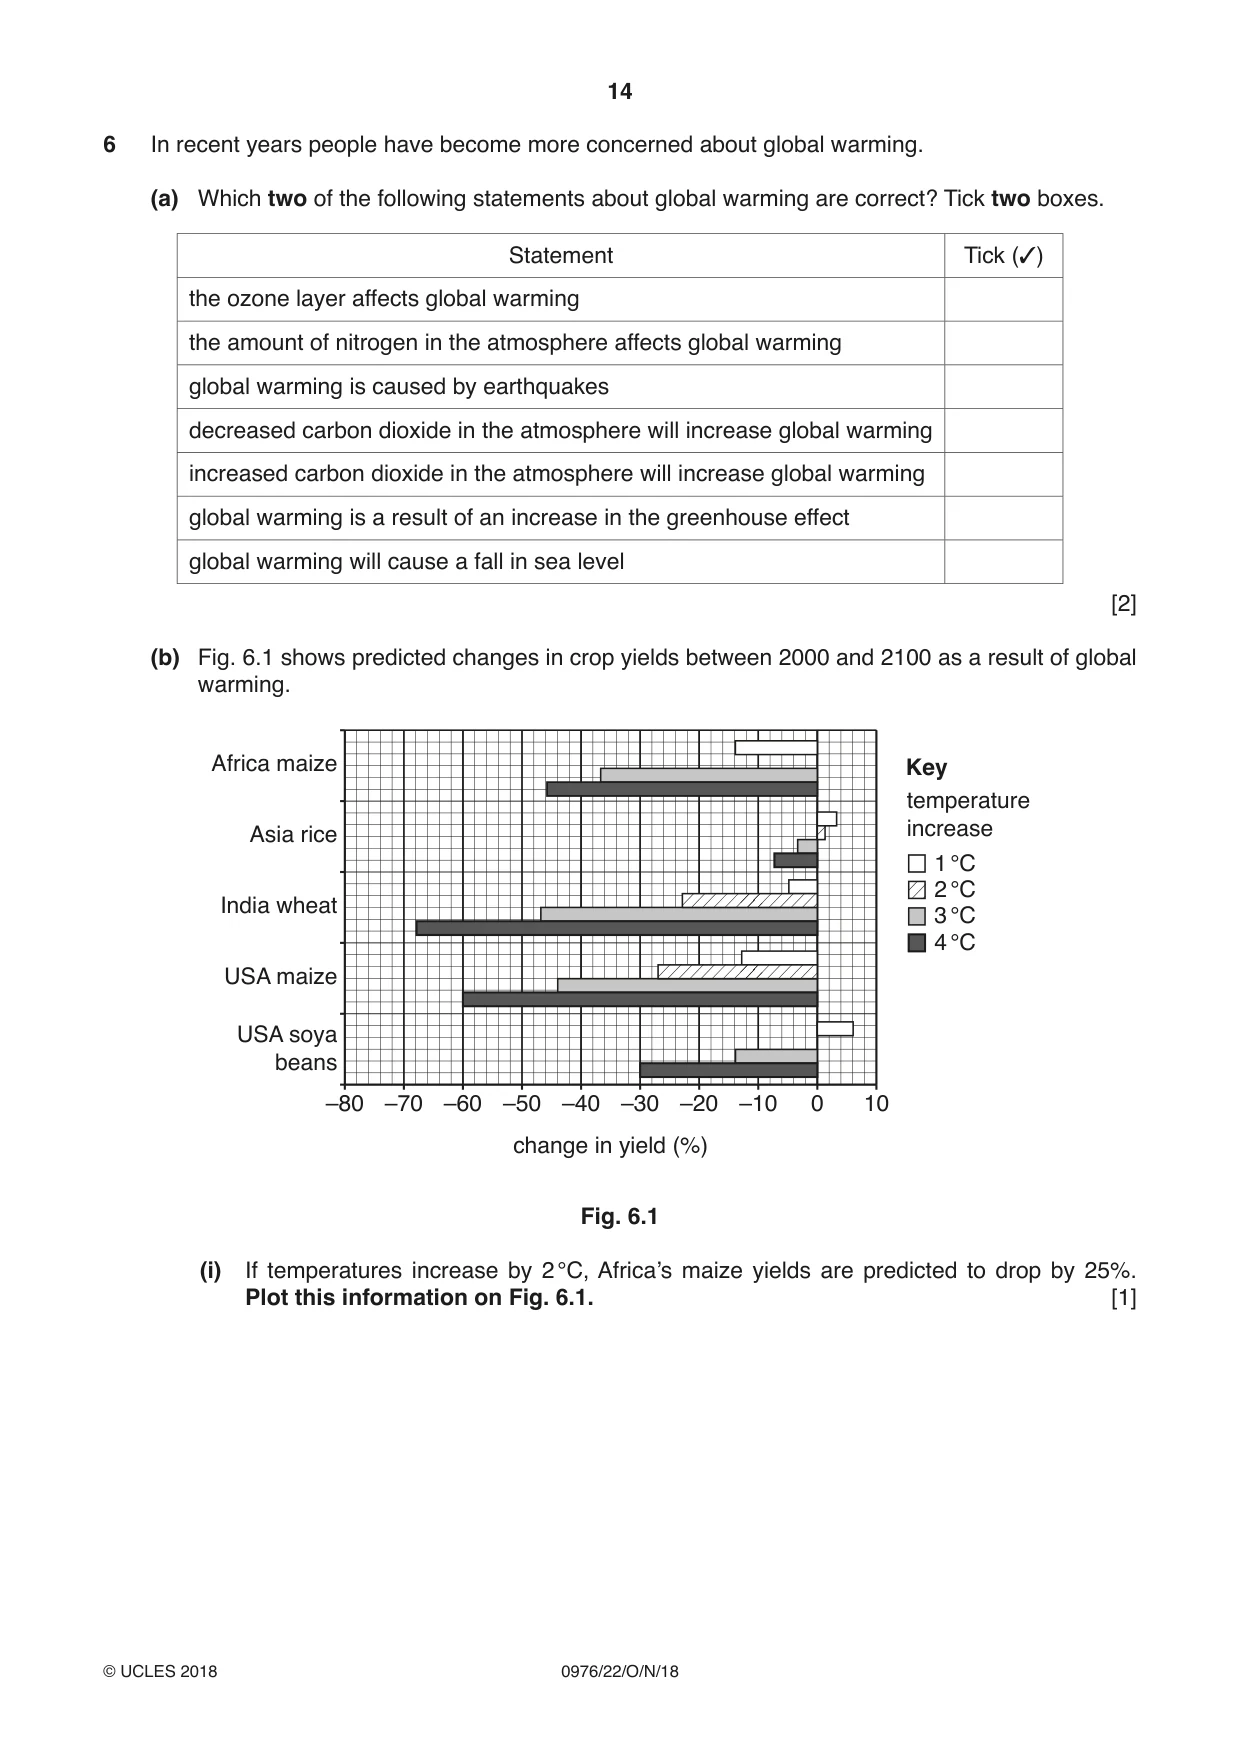
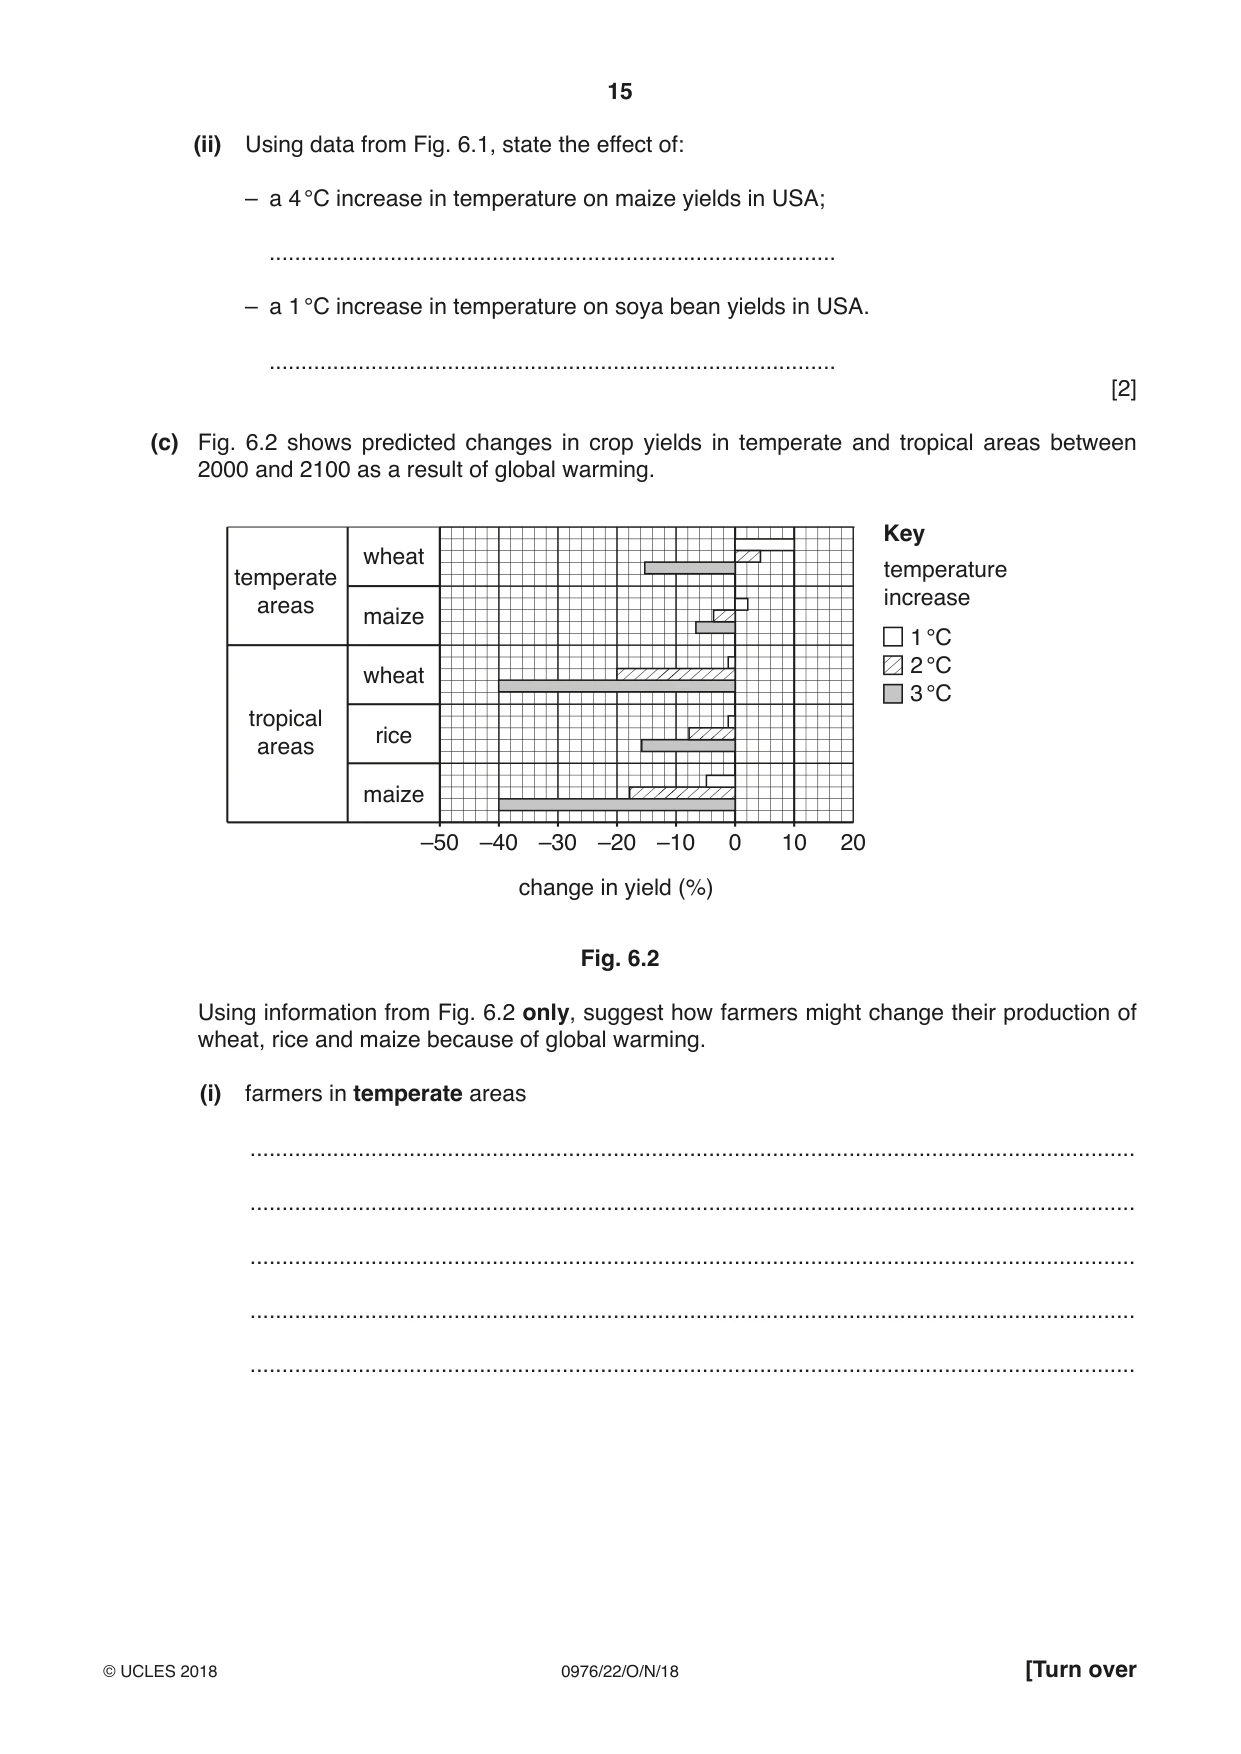
6 In recent years people have become more concerned about global warming. (a) Which two of the following statements about global warming are correct? Tick two boxes. Statement Tick (✓) the ozone layer affects global warming the amount of nitrogen in the atmosphere affects global warming global warming is caused by earthquakes decreased carbon dioxide in the atmosphere will increase global warming increased carbon dioxide in the atmosphere will increase global warming global warming is a result of an increase in the greenhouse effect global warming will cause a fall in sea level [2] (b) Fig. 6.1 shows predicted changes in crop yields between 2000 and 2100 as a result of global warming. Africa maize Key temperature Asia rice increase 1 °C 2 °C India wheat 3 °C 4 °C USA maize USA soya beans –80 –70 –60 –50 –40 –30 –20 –10 0 10 change in yield (%) Fig. 6.1 (i) If temperatures increase by 2 °C, Africa’s maize yields are predicted to drop by 25%. Plot this information on Fig. 6.1. [1] (ii) Using data from Fig. 6.1, state the effect of: – a 4 °C increase in temperature on maize yields in USA; ......................................................................................... – a 1 °C increase in temperature on soya bean yields in USA. ......................................................................................... [2] (c) Fig. 6.2 shows predicted changes in crop yields in temperate and tropical areas between 2000 and 2100 as a result of global warming. Key wheat temperature temperate increase areas maize 1 °C 2 °C wheat 3 °C tropical rice areas maize –50 –40 –30 –20 –10 0 10 20 change in yield (%) Fig. 6.2 Using information from Fig. 6.2 only, suggest how farmers might change their production of wheat, rice and maize because of global warming. (i) farmers in temperate areas ........................................................................................................................................... ........................................................................................................................................... ........................................................................................................................................... ........................................................................................................................................... ........................................................................................................................................... (ii) farmers in tropical areas ........................................................................................................................................... ........................................................................................................................................... ........................................................................................................................................... ........................................................................................................................................... ........................................................................................................................................... ........................................................................................................................................... .......................................................................................................................................[3] [Total: 8]
Mark scheme: 6(a) increased carbon dioxide in the atmosphere will increase global warming 2 global warming is a result of an increase in the greenhouse effect 6(b)(i) 25% drop correctly plotted on Fig. 10 1 6(b)(ii) 60% decrease 2 6% increase 6(c)(i) grow (more)/increase wheat if temperature increases low/1 °C/2 °C 3 grow (more)/increase maize if temperature increase high/3 °C 6(c)(ii) grow less maize/more wheat and rice if temperature increase low/1 °C grow less wheat and maize grow (more)/increase rice Answers must be describing farmers’ decisions and not just repeating data about yields from Fig. 6.2. Allow ‘move to other crops (apart from wheat, rice and maize)’ once. No marks for other farming practices.
What was in this paper
The subtopics covered by these 6 questions, and how many questions each got. Open one in a new tab to see every Cambridge question on it.
What you needed in this session
Cambridge’s own grade thresholds for 2018 Oct/Nov, Paper 2 · Variant 2. A higher threshold means an easier paper — the bar moves with how the cohort did.