Cambridge IGCSE Geography (9-1) 0976 — 2018 May/June Paper 2 · Variant 2
0976/22/M/J/18 · 6 questions · 60 marks · ≈68 min
The question paper and its mark scheme, free to read here and free to download. This is Cambridge’s own paper, exactly as it was sat.
Question paper20 pages



Mark scheme7 pages
Answers below. Sit the paper first if you are practising.
Questions as text
Q1 · Study the map extract for Vinstra, Norway
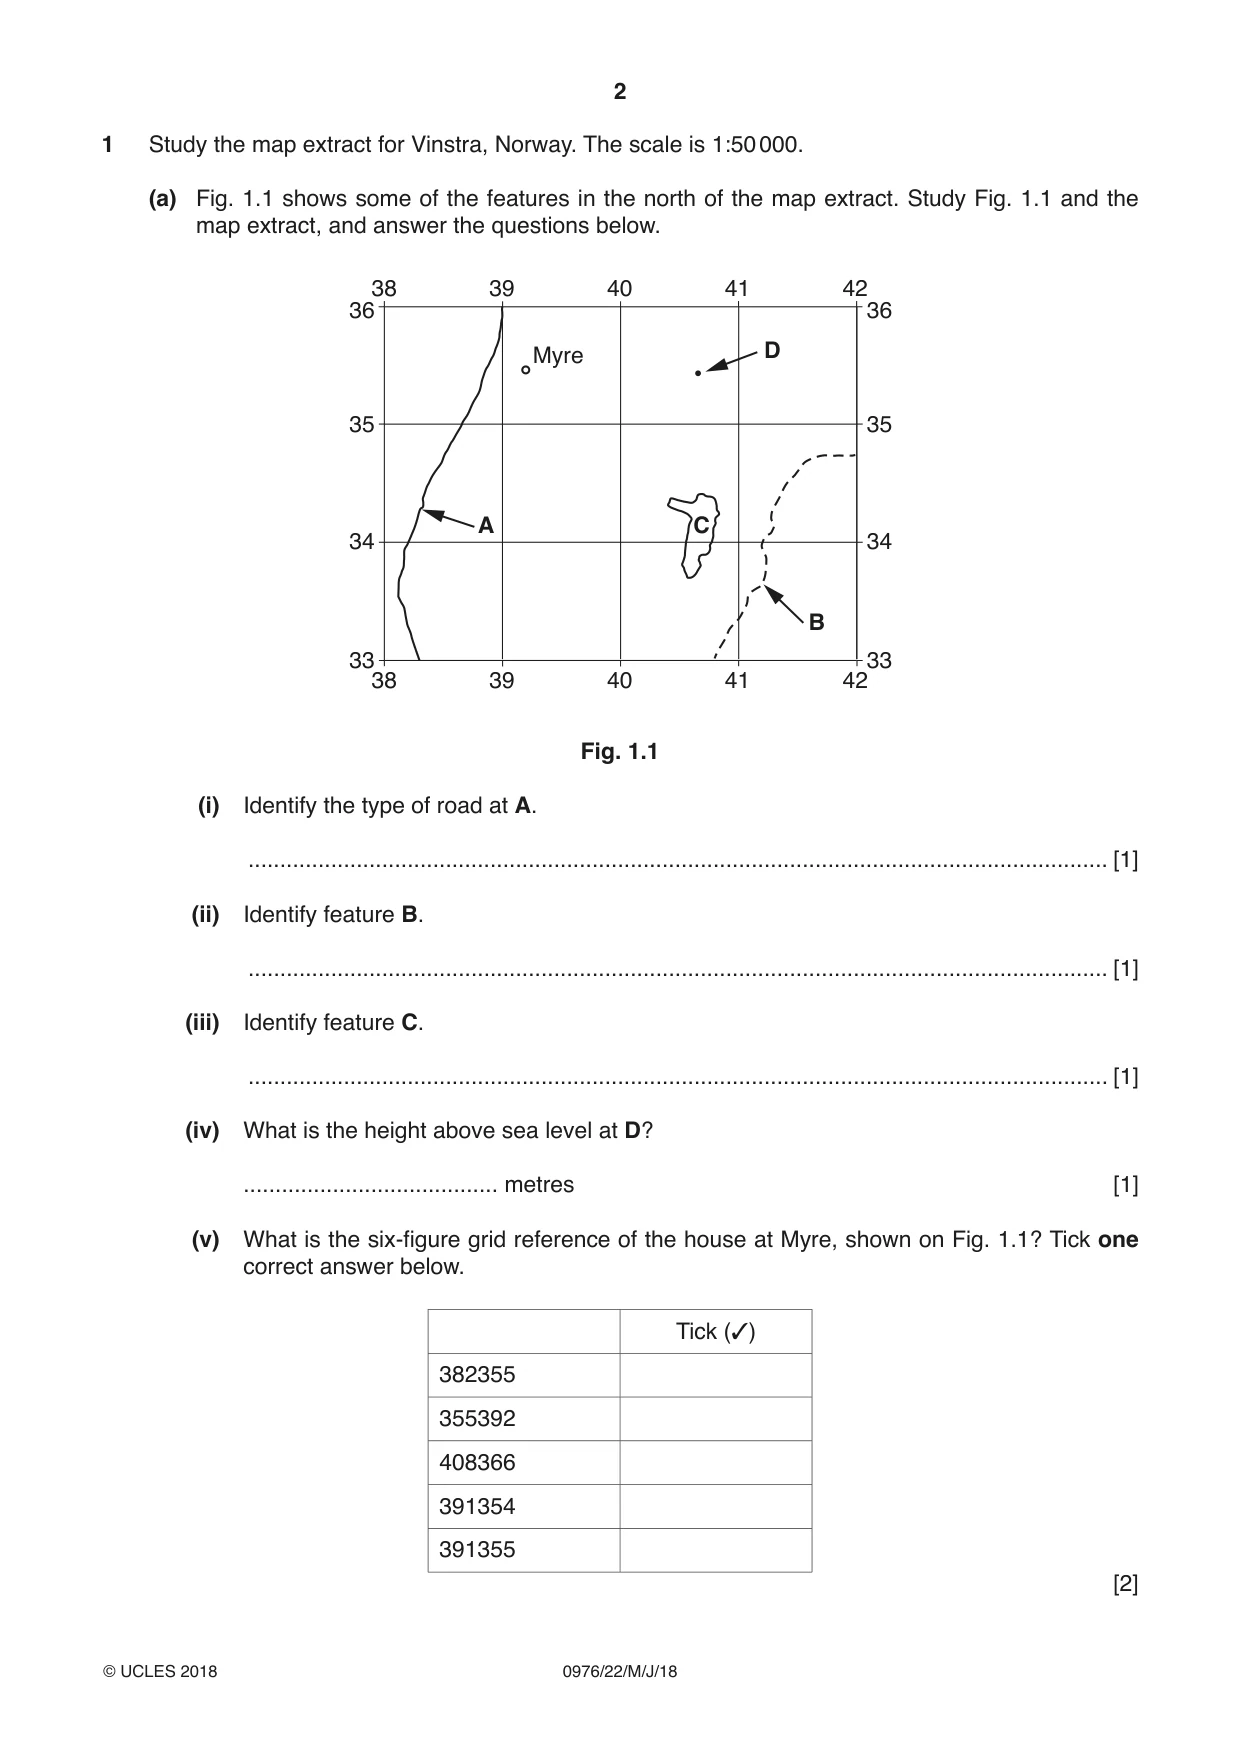
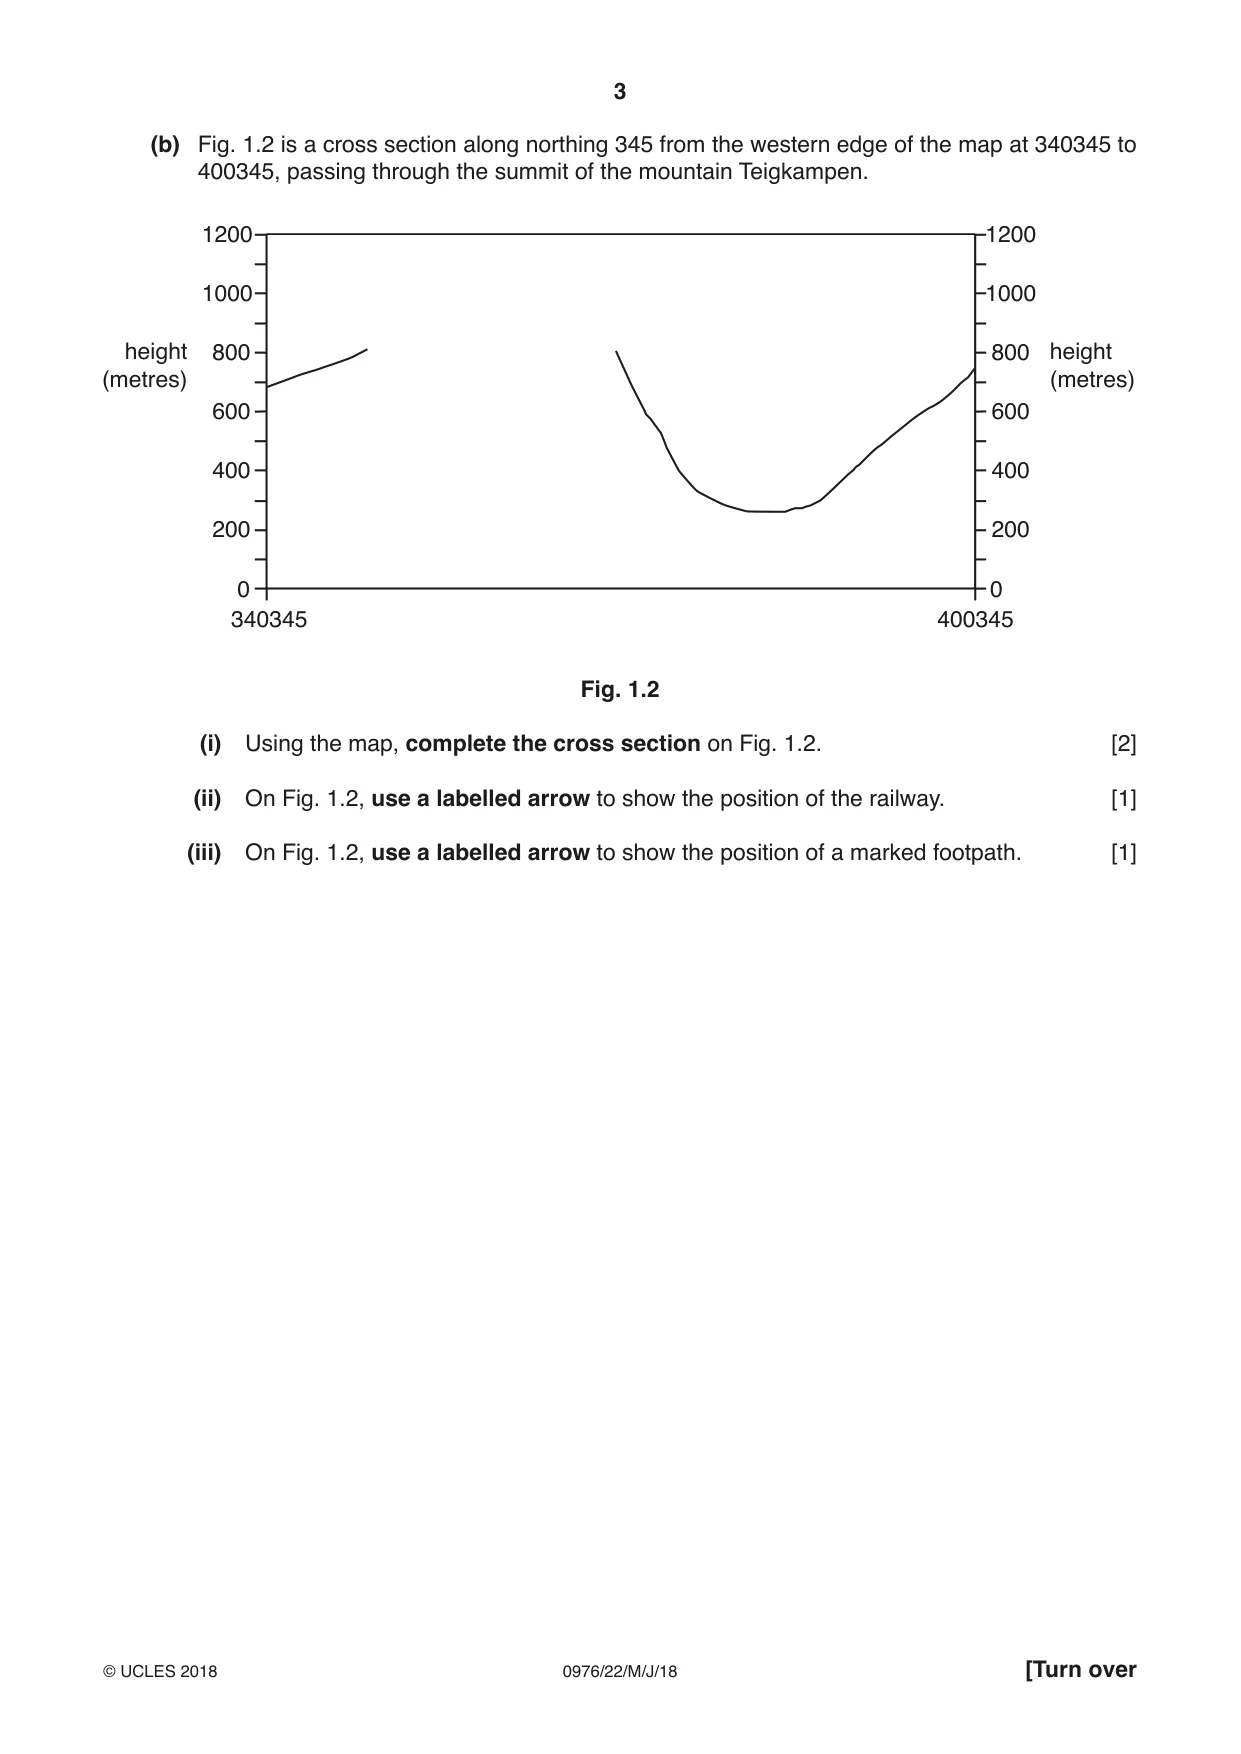
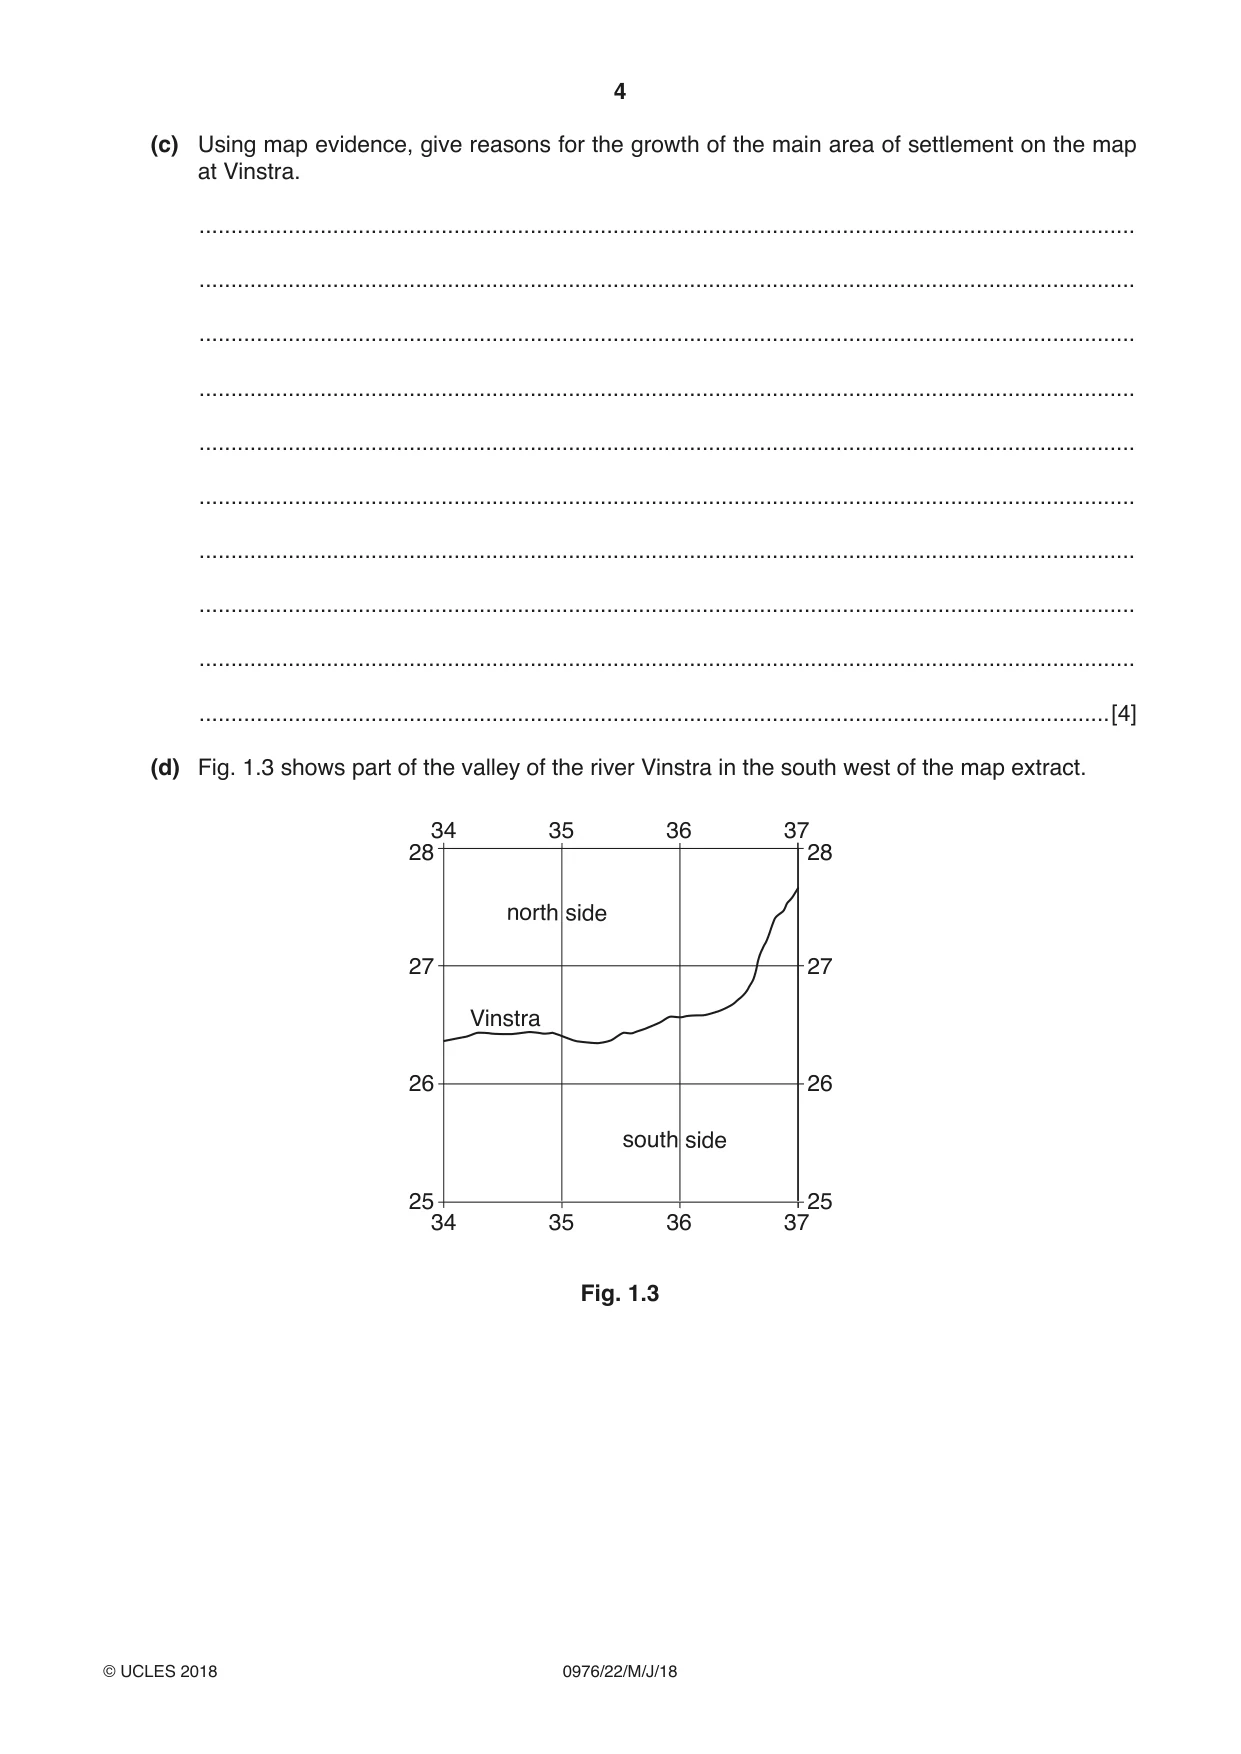
1 Study the map extract for Vinstra, Norway. The scale is 1:50 000. (a) Fig. 1.1 shows some of the features in the north of the map extract. Study Fig. 1.1 and the map extract, and answer the questions below. 38 39 40 41 42 36 36 Myre D 35 35 A C 34 34 B 33 33 38 39 40 41 42 Fig. 1.1 (i) Identify the type of road at A. ....................................................................................................................................... [1] (ii) Identify feature B. ....................................................................................................................................... [1] (iii) Identify feature C. ....................................................................................................................................... [1] (iv) What is the height above sea level at D? ........................................ metres [1] (v) What is the six-figure grid reference of the house at Myre, shown on Fig. 1.1? Tick one correct answer below. Tick (3) 382355 355392 408366 391354 391355 [2] (b) Fig. 1.2 is a cross section along northing 345 from the western edge of the map at 340345 to 400345, passing through the summit of the mountain Teigkampen. 1200 1200 1000 1000 height 800 800 height (metres) (metres) 600 600 400 400 200 200 0 0 340345 400345 Fig. 1.2 (i) Using the map, complete the cross section on Fig. 1.2. [2] (ii) On Fig. 1.2, use a labelled arrow to show the position of the railway. [1] (iii) On Fig. 1.2, use a labelled arrow to show the position of a marked footpath. [1] (c) Using map evidence, give reasons for the growth of the main area of settlement on the map at Vinstra. ................................................................................................................................................... ................................................................................................................................................... ................................................................................................................................................... ................................................................................................................................................... ................................................................................................................................................... ................................................................................................................................................... ................................................................................................................................................... ................................................................................................................................................... ................................................................................................................................................... ...............................................................................................................................................[4] (d) Fig. 1.3 shows part of the valley of the river Vinstra in the south west of the map extract. 34 35 36 37 28 28 north side 27 27 Vinstra 26 26 south side 25 25 34 35 36 37 Fig. 1.3 Compare the following features on the north side of the valley and the south side of the valley: roads ................................................................................................................................................... ................................................................................................................................................... ................................................................................................................................................... ................................................................................................................................................... settlement ................................................................................................................................................... ................................................................................................................................................... ................................................................................................................................................... ................................................................................................................................................... land use ................................................................................................................................................... ................................................................................................................................................... ................................................................................................................................................... ................................................................................................................................................... relief. ................................................................................................................................................... ................................................................................................................................................... ................................................................................................................................................... ...............................................................................................................................................[6] [Total: 20]
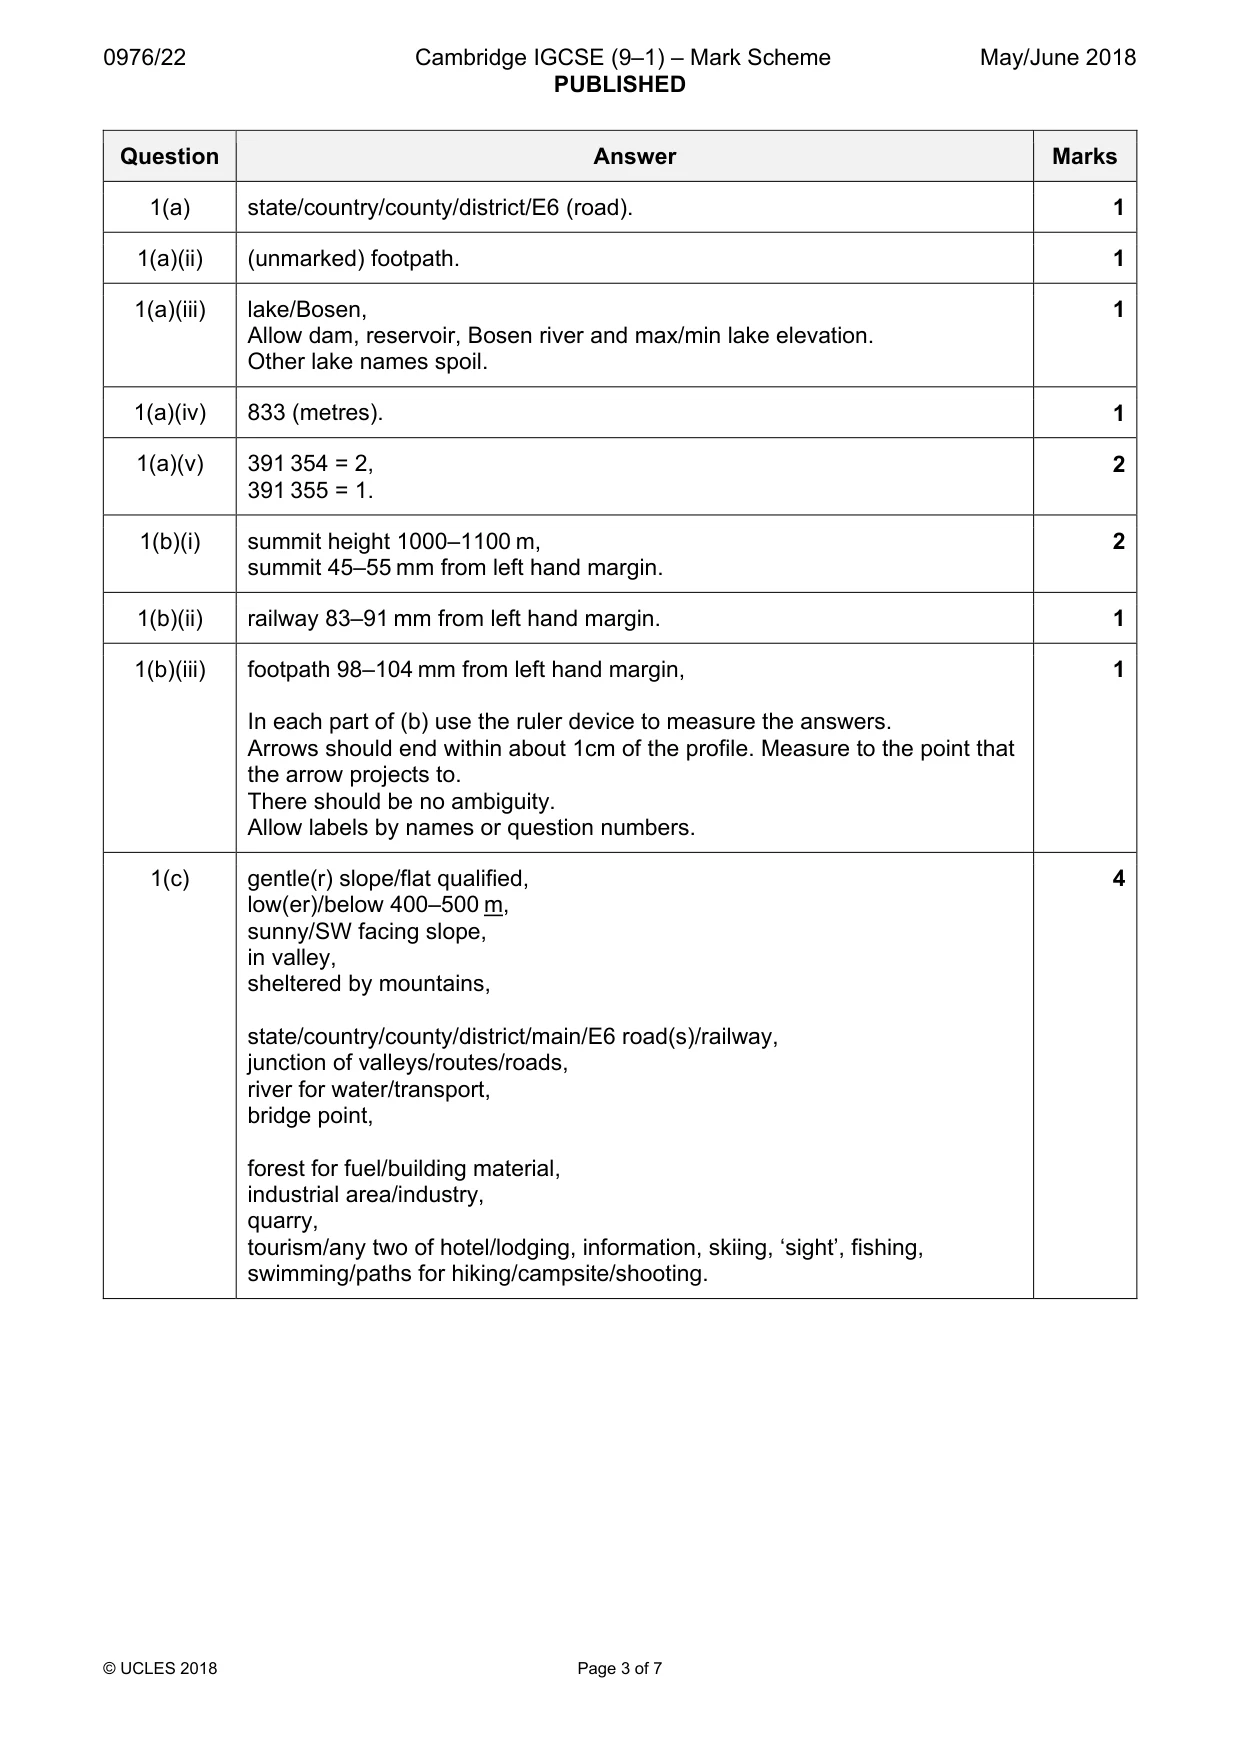
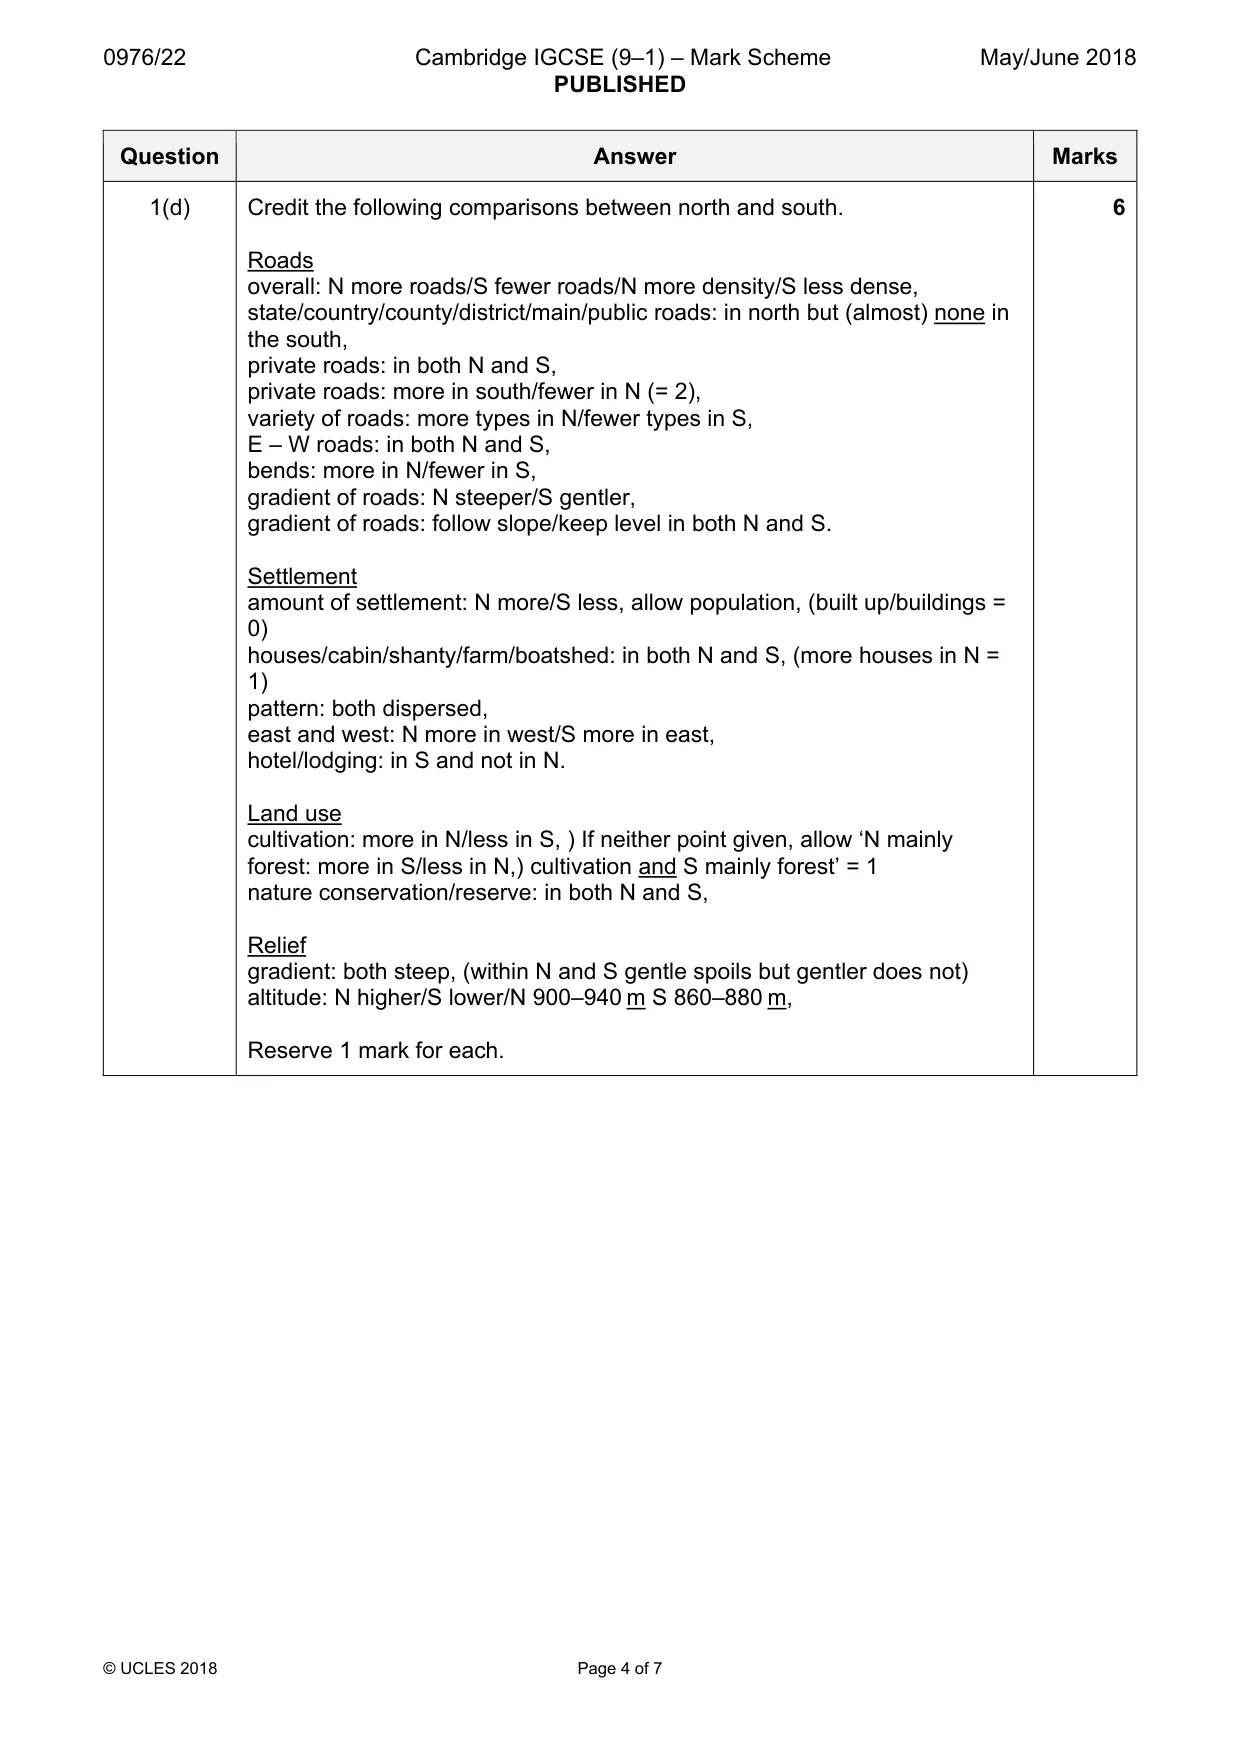
Mark scheme: Question Answer Marks 1(a) state/country/county/district/E6 (road). 1 1(a)(ii) (unmarked) footpath. 1 1(a)(iii) lake/Bosen, 1 Allow dam, reservoir, Bosen river and max/min lake elevation. Other lake names spoil. 1(a)(iv) 833 (metres). 1 1(a)(v) 391 354 = 2, 2 391 355 = 1. 1(b)(i) summit height 1000–1100 m, 2 summit 45–55 mm from left hand margin. 1(b)(ii) railway 83–91 mm from left hand margin. 1 1(b)(iii) footpath 98–104 mm from left hand margin, 1 In each part of (b) use the ruler device to measure the answers. Arrows should end within about 1cm of the profile. Measure to the point that the arrow projects to. There should be no ambiguity. Allow labels by names or question numbers. 1(c) gentle(r) slope/flat qualified, 4 low(er)/below 400–500 m, sunny/SW facing slope, in valley, sheltered by mountains, state/country/county/district/main/E6 road(s)/railway, junction of valleys/routes/roads, river for water/transport, bridge point, forest for fuel/building material, industrial area/industry, quarry, tourism/any two of hotel/lodging, information, skiing, ‘sight’, fishing, swimming/paths for hiking/campsite/shooting. 1(d) Credit the following comparisons between north and south. 6 Roads overall: N more roads/S fewer roads/N more density/S less dense, state/country/county/district/main/public roads: in north but (almost) none in the south, private roads: in both N and S, private roads: more in south/fewer in N (= 2), variety of roads: more types in N/fewer types in S, E – W roads: in both N and S, bends: more in N/fewer in S, gradient of roads: N steeper/S gentler, gradient of roads: follow slope/keep level in both N and S. Settlement amount of settlement: N more/S less, allow population, (built up/buildings = 0) houses/cabin/shanty/farm/boatshed: in both N and S, (more houses in N = 1) pattern: both dispersed, east and west: N more in west/S more in east, hotel/lodging: in S and not in N. Land use cultivation: more in N/less in S, ) If neither point given, allow ‘N mainly forest: more in S/less in N,) cultivation and S mainly forest’ = 1 nature conservation/reserve: in both N and S, Relief gradient: both steep, (within N and S gentle spoils but gentler does not) altitude: N higher/S lower/N 900–940 m S 860–880 m, Reserve 1 mark for each.
More questions on Settlements (rural and urban) and service provision
Q2 · The five countries expected to have the largest populations by the year 2100
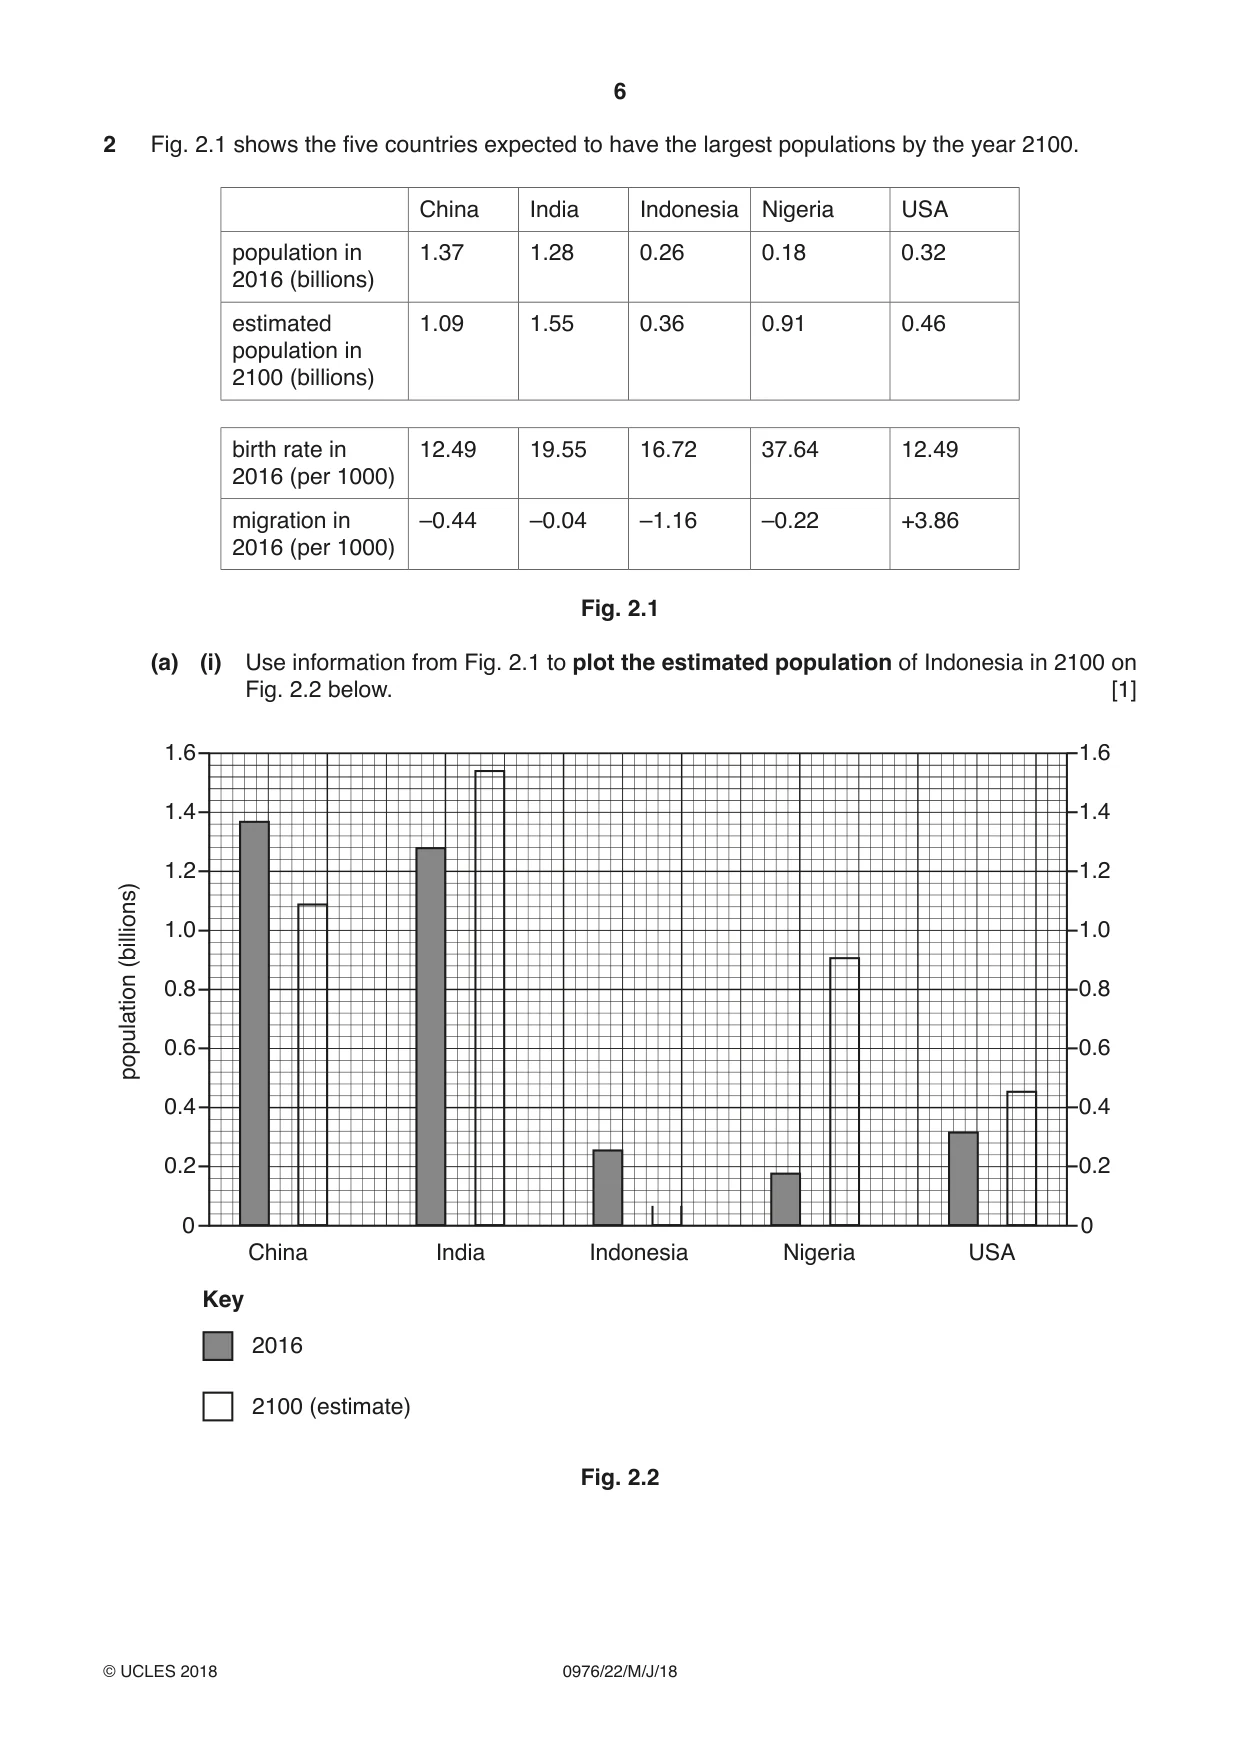
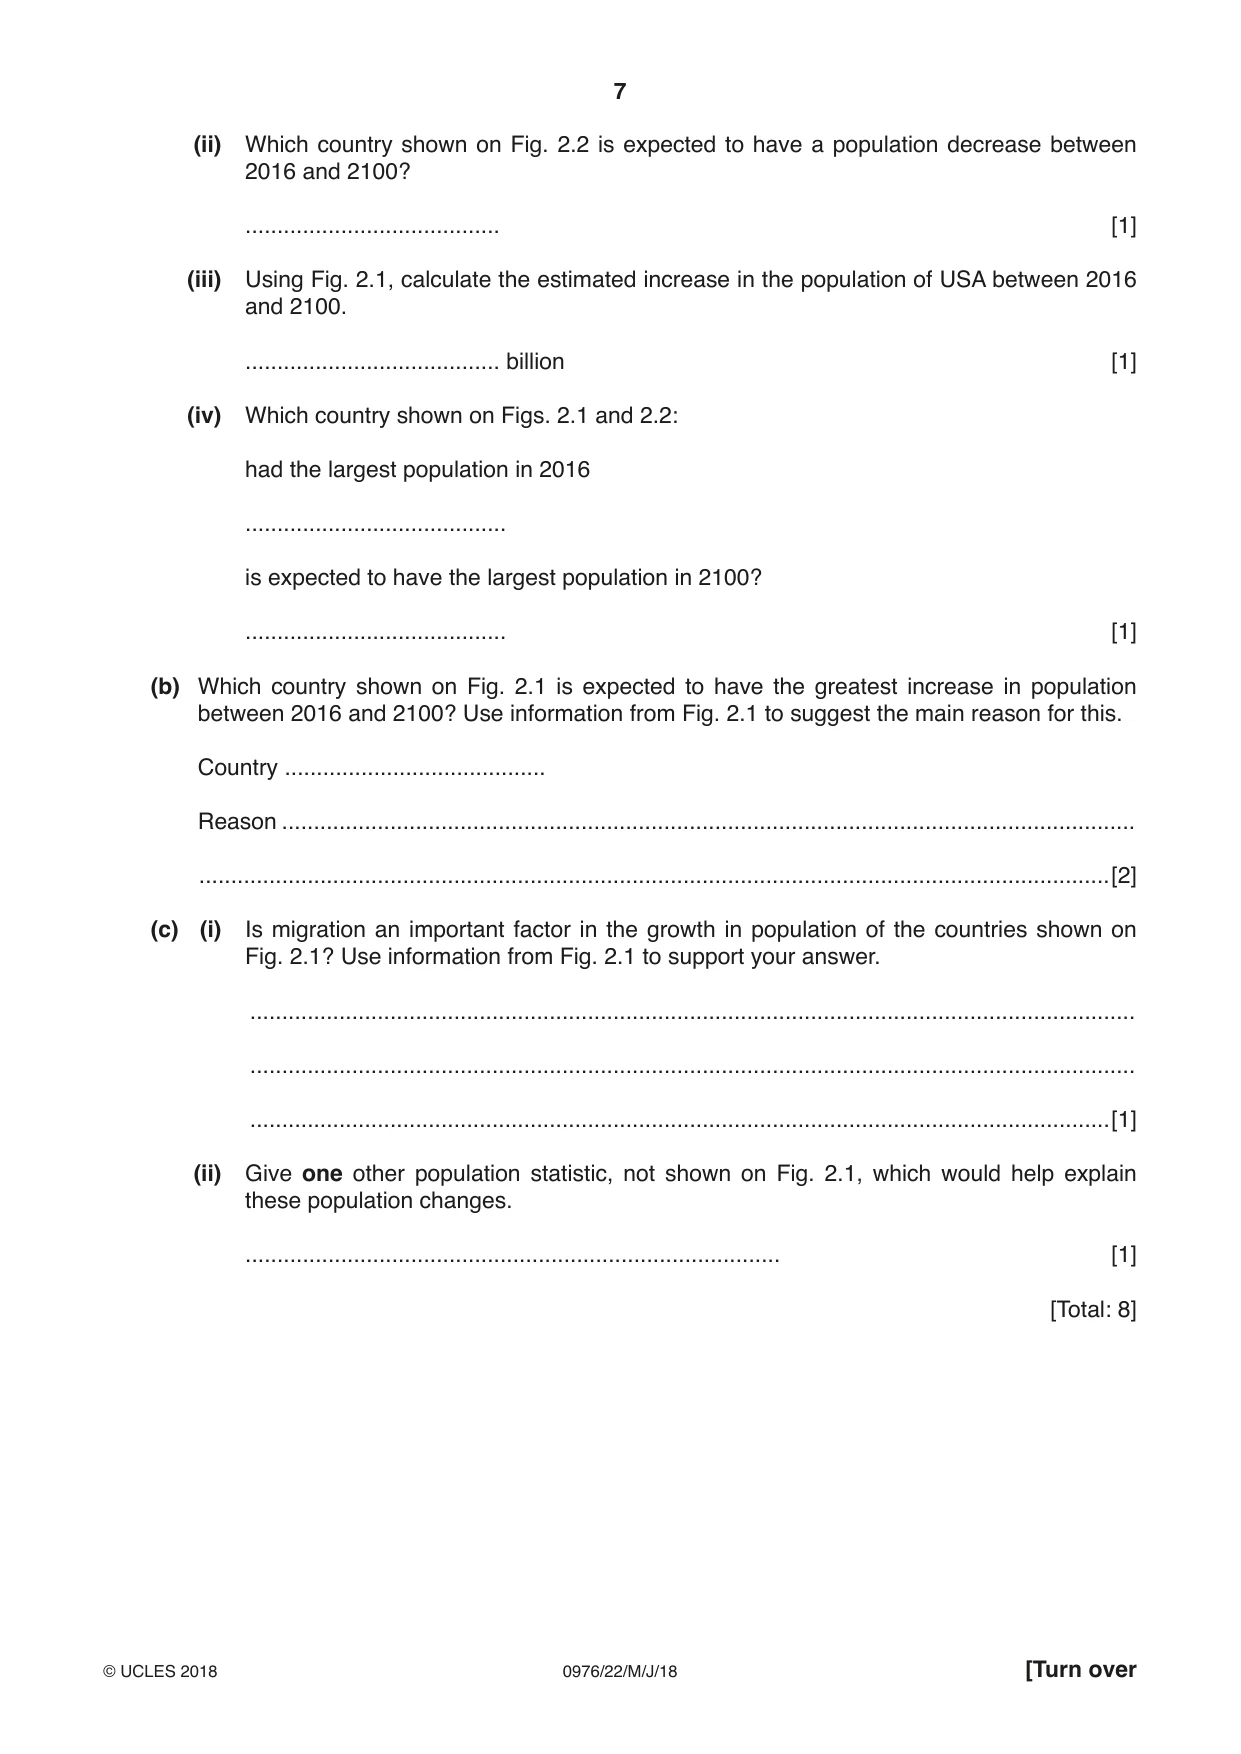
2 Fig. 2.1 shows the five countries expected to have the largest populations by the year 2100. China India Indonesia Nigeria USA population in 1.37 1.28 0.26 0.18 0.32 2016 (billions) estimated 1.09 1.55 0.36 0.91 0.46 population in 2100 (billions) birth rate in 12.49 19.55 16.72 37.64 12.49 2016 (per 1000) migration in –0.44 –0.04 –1.16 –0.22 +3.86 2016 (per 1000) Fig. 2.1 (a) (i) Use information from Fig. 2.1 to plot the estimated population of Indonesia in 2100 on Fig. 2.2 below. [1] 1.6 1.6 1.4 1.4 1.2 1.2 1.0 1.0 (billions) 0.8 0.8 0.6 0.6 population 0.4 0.4 0.2 0.2 0 0 China India Indonesia Nigeria USA Key 2016 2100 (estimate) Fig. 2.2 (ii) Which country shown on Fig. 2.2 is expected to have a population decrease between 2016 and 2100? ........................................ [1] (iii) Using Fig. 2.1, calculate the estimated increase in the population of USA between 2016 and 2100. ........................................ billion [1] (iv) Which country shown on Figs. 2.1 and 2.2: had the largest population in 2016 ......................................... is expected to have the largest population in 2100? ......................................... [1] (b) Which country shown on Fig. 2.1 is expected to have the greatest increase in population between 2016 and 2100? Use information from Fig. 2.1 to suggest the main reason for this. Country ......................................... Reason ...................................................................................................................................... ...............................................................................................................................................[2] (c) (i) Is migration an important factor in the growth in population of the countries shown on Fig. 2.1? Use information from Fig. 2.1 to support your answer. ........................................................................................................................................... ........................................................................................................................................... .......................................................................................................................................[1] (ii) Give one other population statistic, not shown on Fig. 2.1, which would help explain these population changes. .................................................................................... [1] [Total: 8]
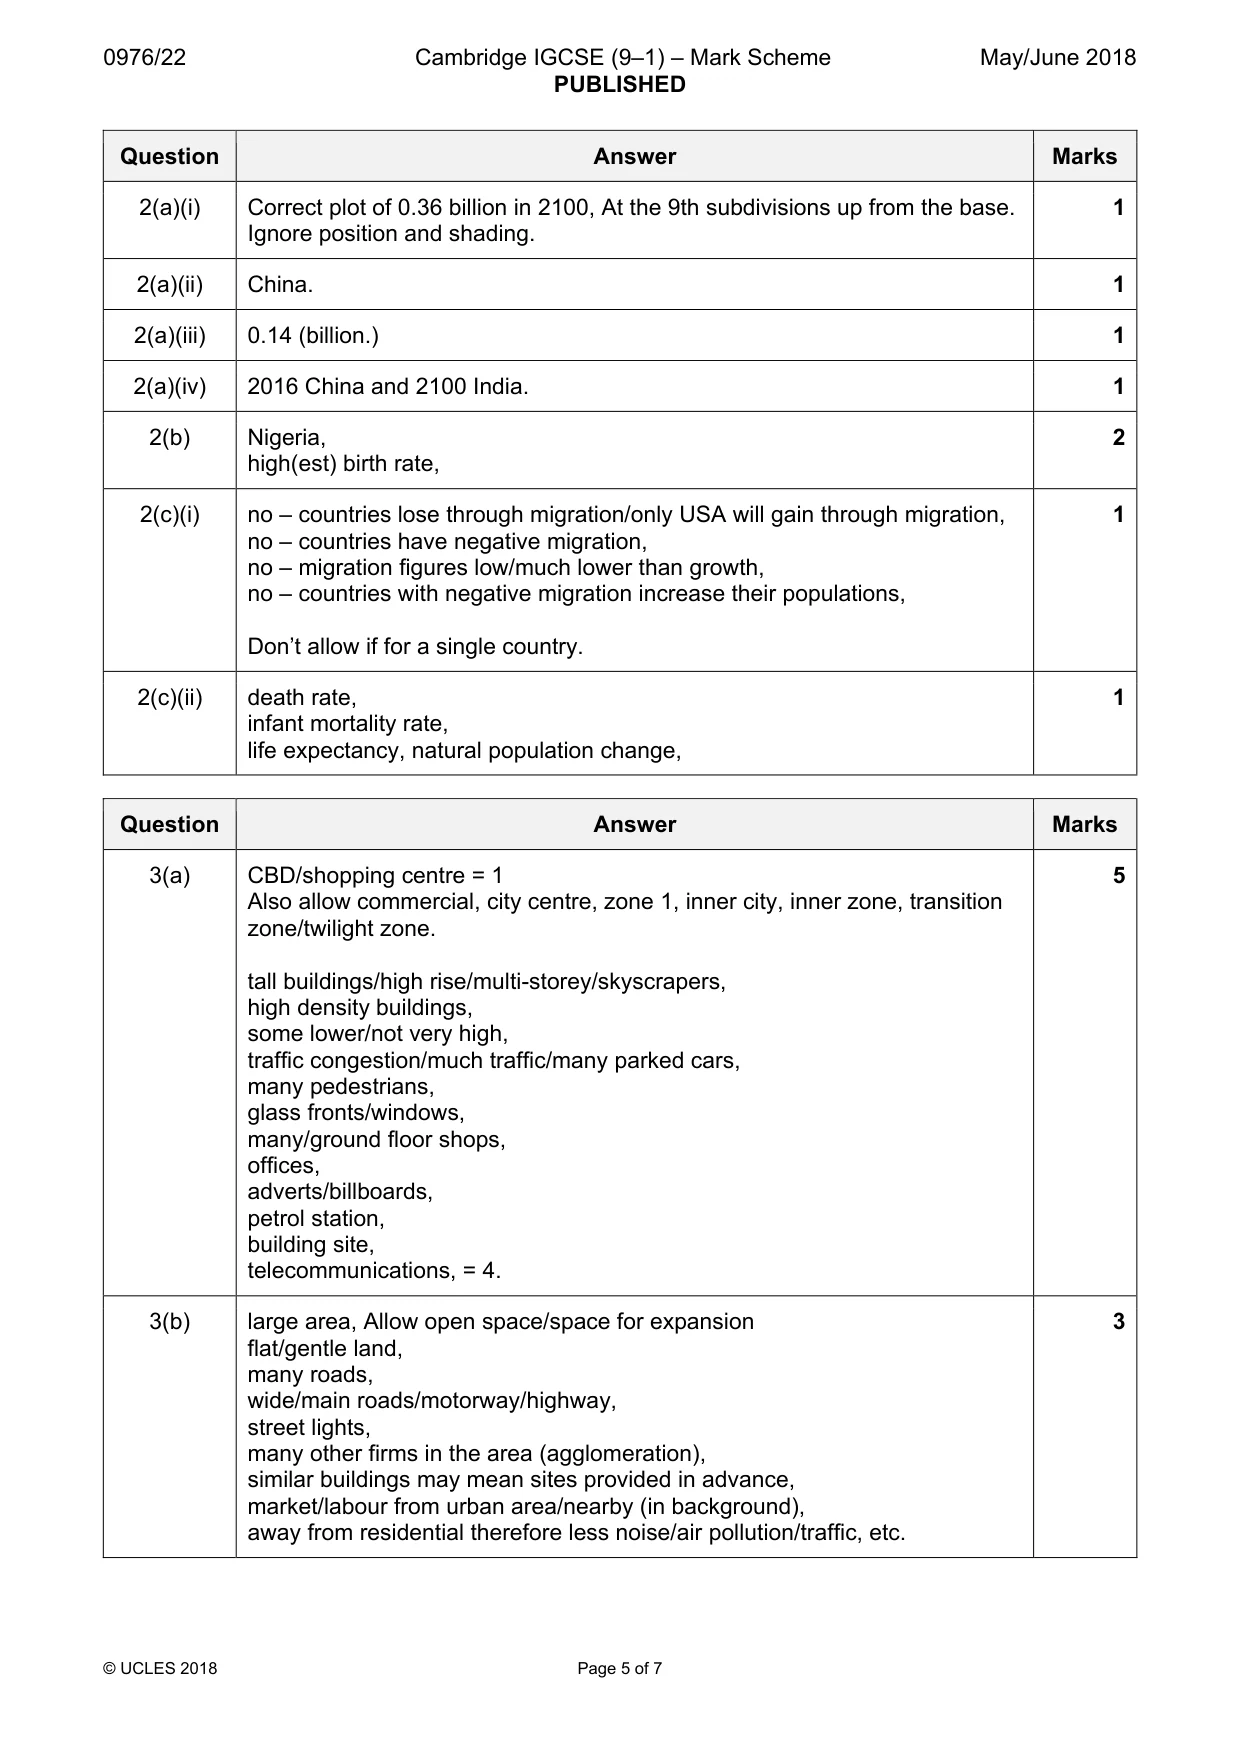
Mark scheme: 2(a)(i) Correct plot of 0.36 billion in 2100, At the 9th subdivisions up from the base. 1 Ignore position and shading. 2(a)(ii) China. 1 2(a)(iii) 0.14 (billion.) 1 2(a)(iv) 2016 China and 2100 India. 1 2(b) Nigeria, 2 high(est) birth rate, 2(c)(i) no – countries lose through migration/only USA will gain through migration, 1 no – countries have negative migration, no – migration figures low/much lower than growth, no – countries with negative migration increase their populations, Don’t allow if for a single country. 2(c)(ii) death rate, 1 infant mortality rate, life expectancy, natural population change,
Question 3
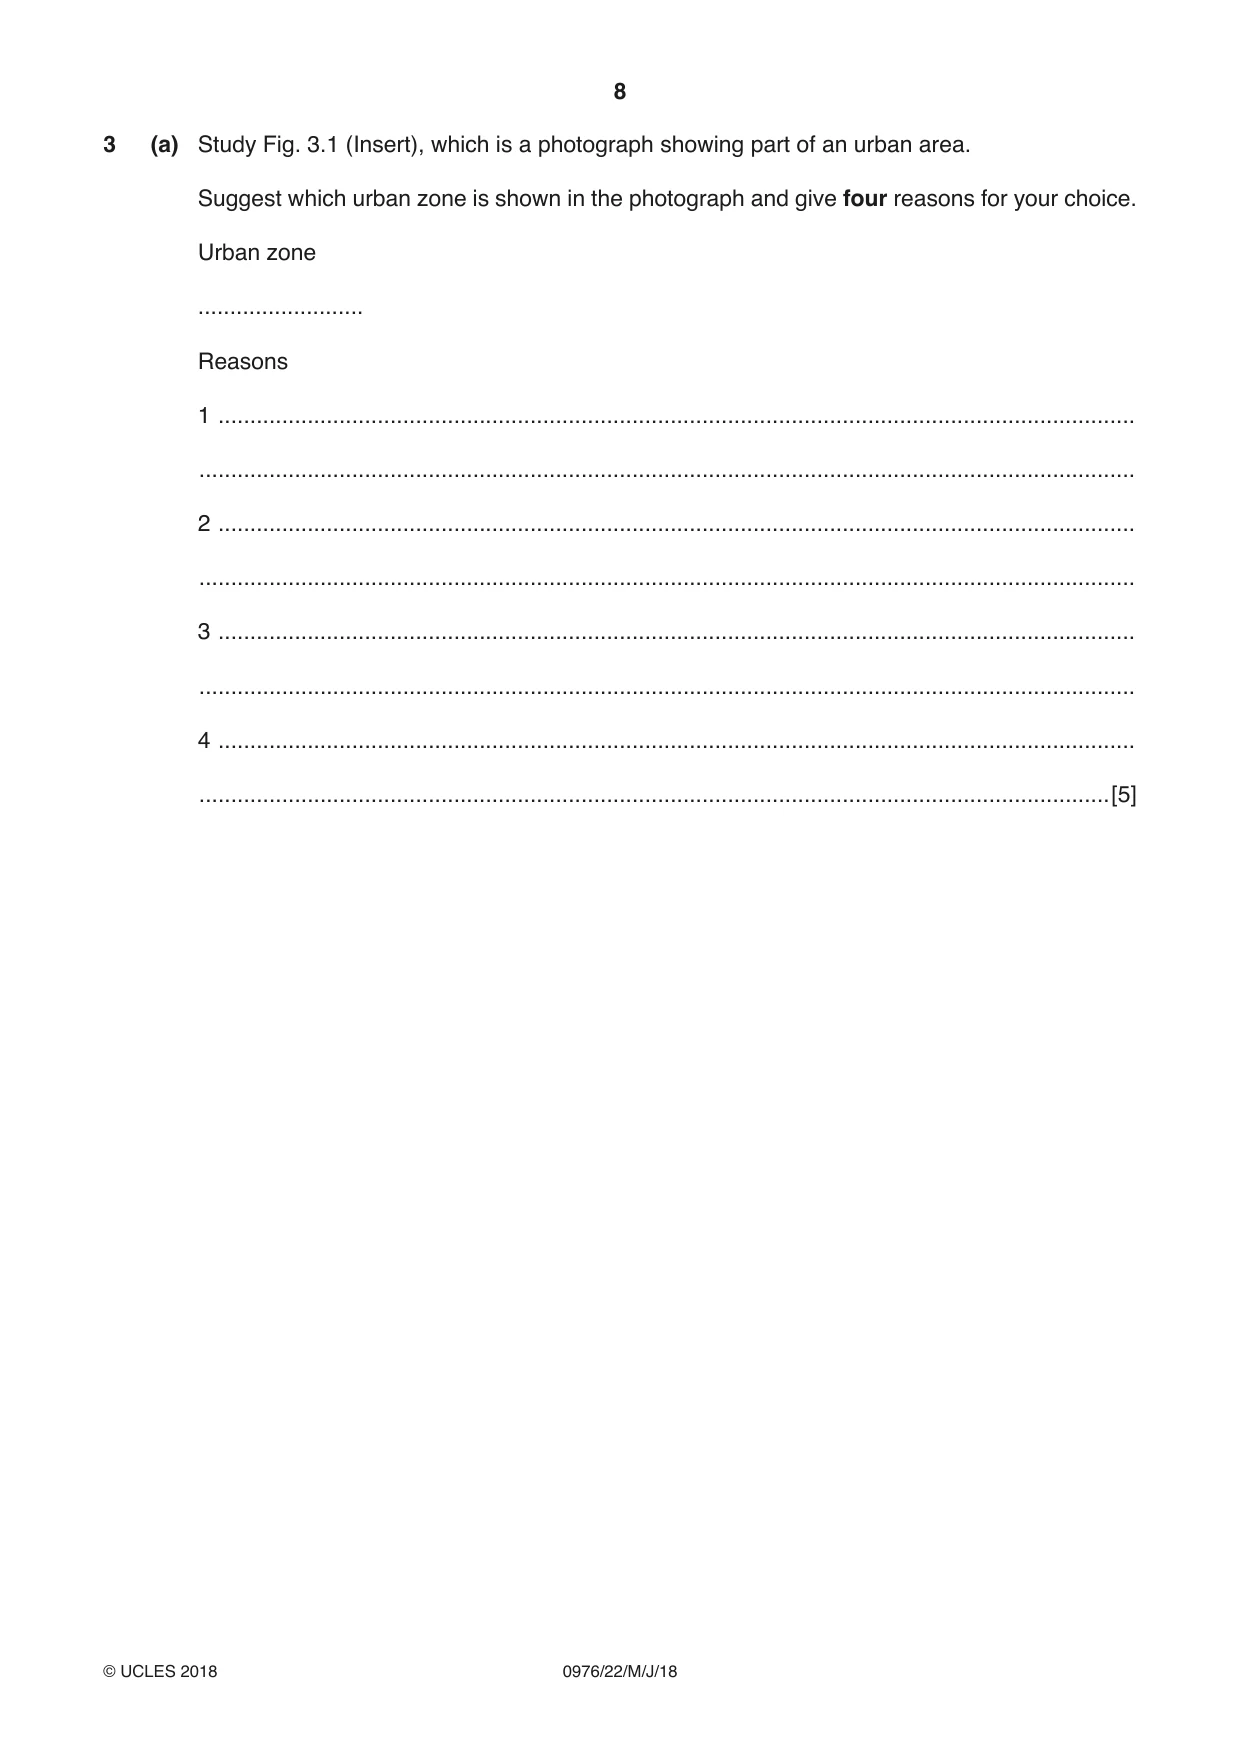
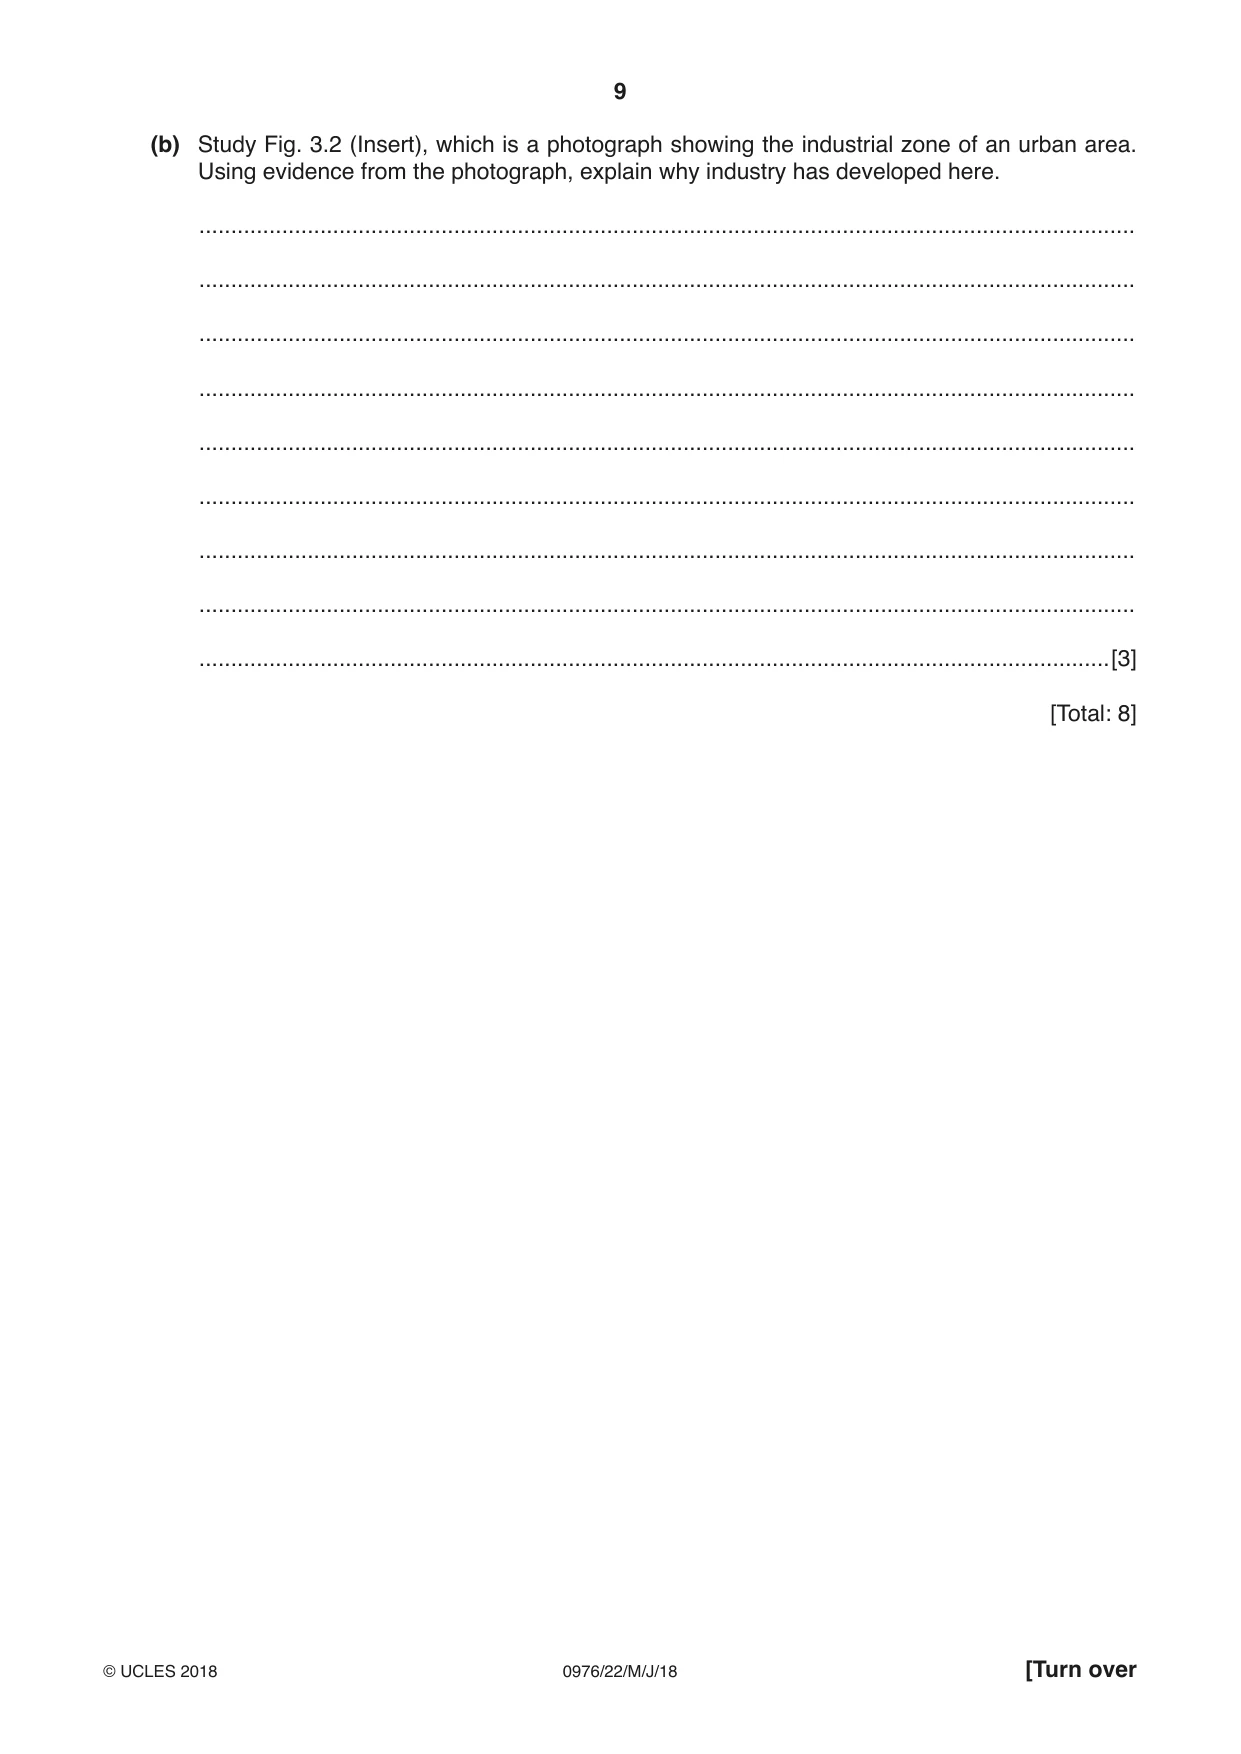
3 (a) Study Fig. 3.1 (Insert), which is a photograph showing part of an urban area. Suggest which urban zone is shown in the photograph and give four reasons for your choice. Urban zone .......................... Reasons 1 ................................................................................................................................................ ................................................................................................................................................... 2 ................................................................................................................................................ ................................................................................................................................................... 3 ................................................................................................................................................ ................................................................................................................................................... 4 ................................................................................................................................................ ...............................................................................................................................................[5] (b) Study Fig. 3.2 (Insert), which is a photograph showing the industrial zone of an urban area. Using evidence from the photograph, explain why industry has developed here. ................................................................................................................................................... ................................................................................................................................................... ................................................................................................................................................... ................................................................................................................................................... ................................................................................................................................................... ................................................................................................................................................... ................................................................................................................................................... ................................................................................................................................................... ...............................................................................................................................................[3] [Total: 8]
Mark scheme: 3(a) CBD/shopping centre = 1 5 Also allow commercial, city centre, zone 1, inner city, inner zone, transition zone/twilight zone. tall buildings/high rise/multi-storey/skyscrapers, high density buildings, some lower/not very high, traffic congestion/much traffic/many parked cars, many pedestrians, glass fronts/windows, many/ground floor shops, offices, adverts/billboards, petrol station, building site, telecommunications, = 4. 3(b) large area, Allow open space/space for expansion 3 flat/gentle land, many roads, wide/main roads/motorway/highway, street lights, many other firms in the area (agglomeration), similar buildings may mean sites provided in advance, market/labour from urban area/nearby (in background), away from residential therefore less noise/air pollution/traffic, etc.
Q4 · A cross section through an area affected by an earthquake
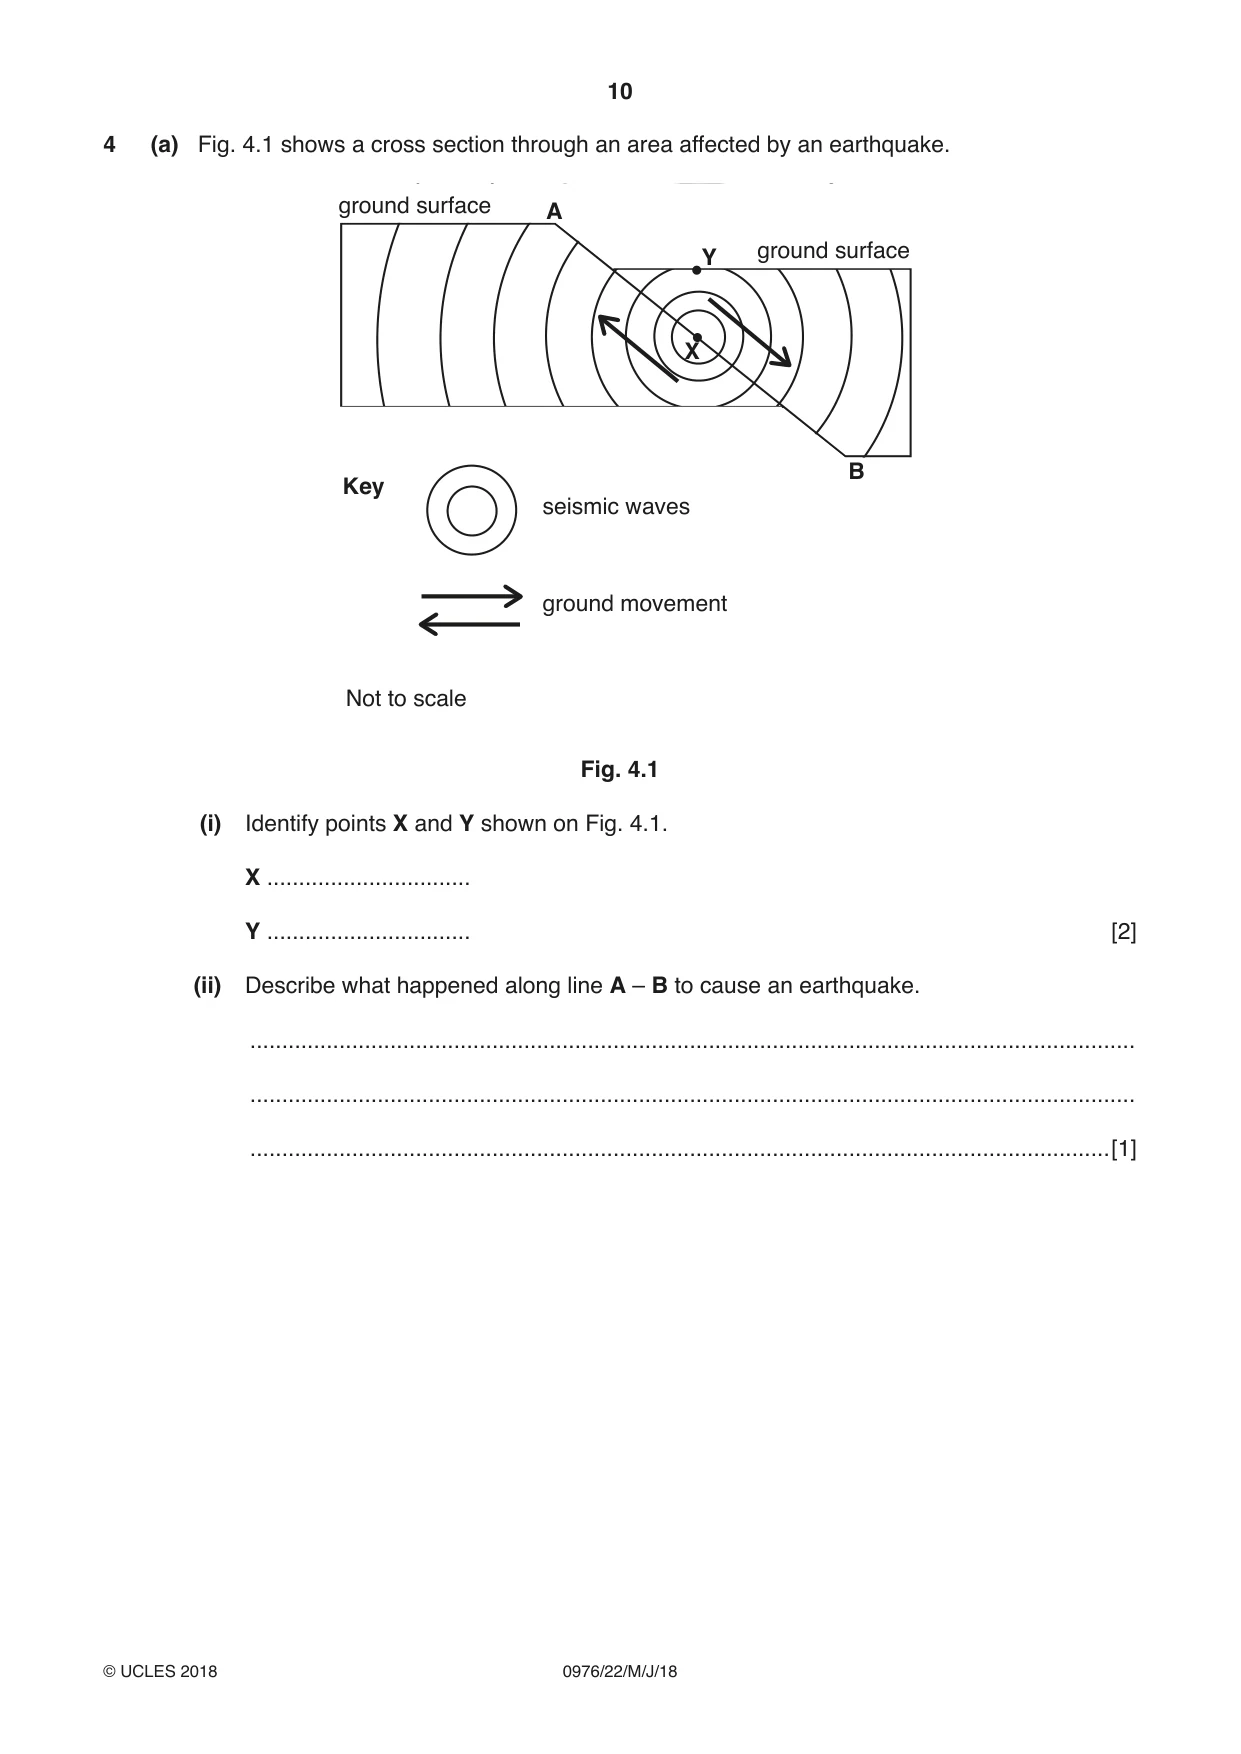
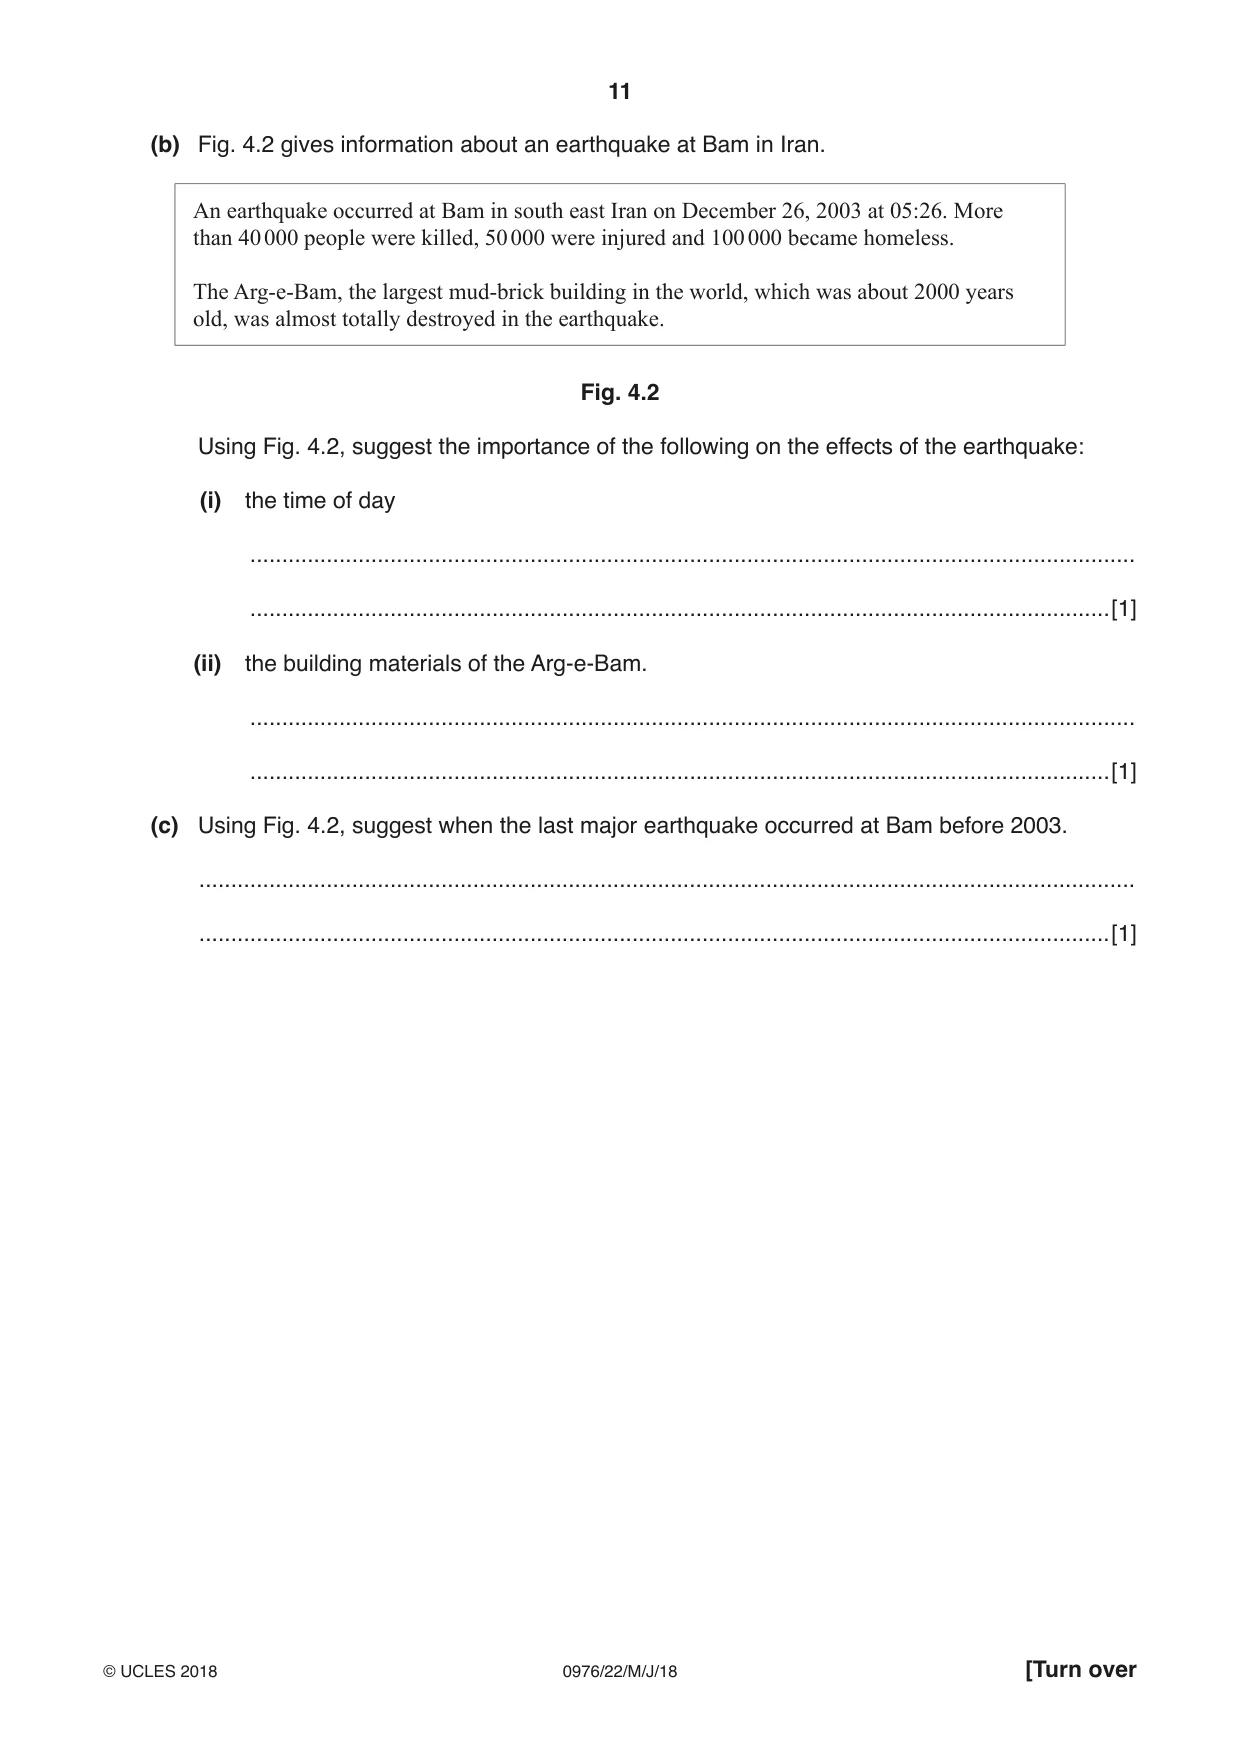
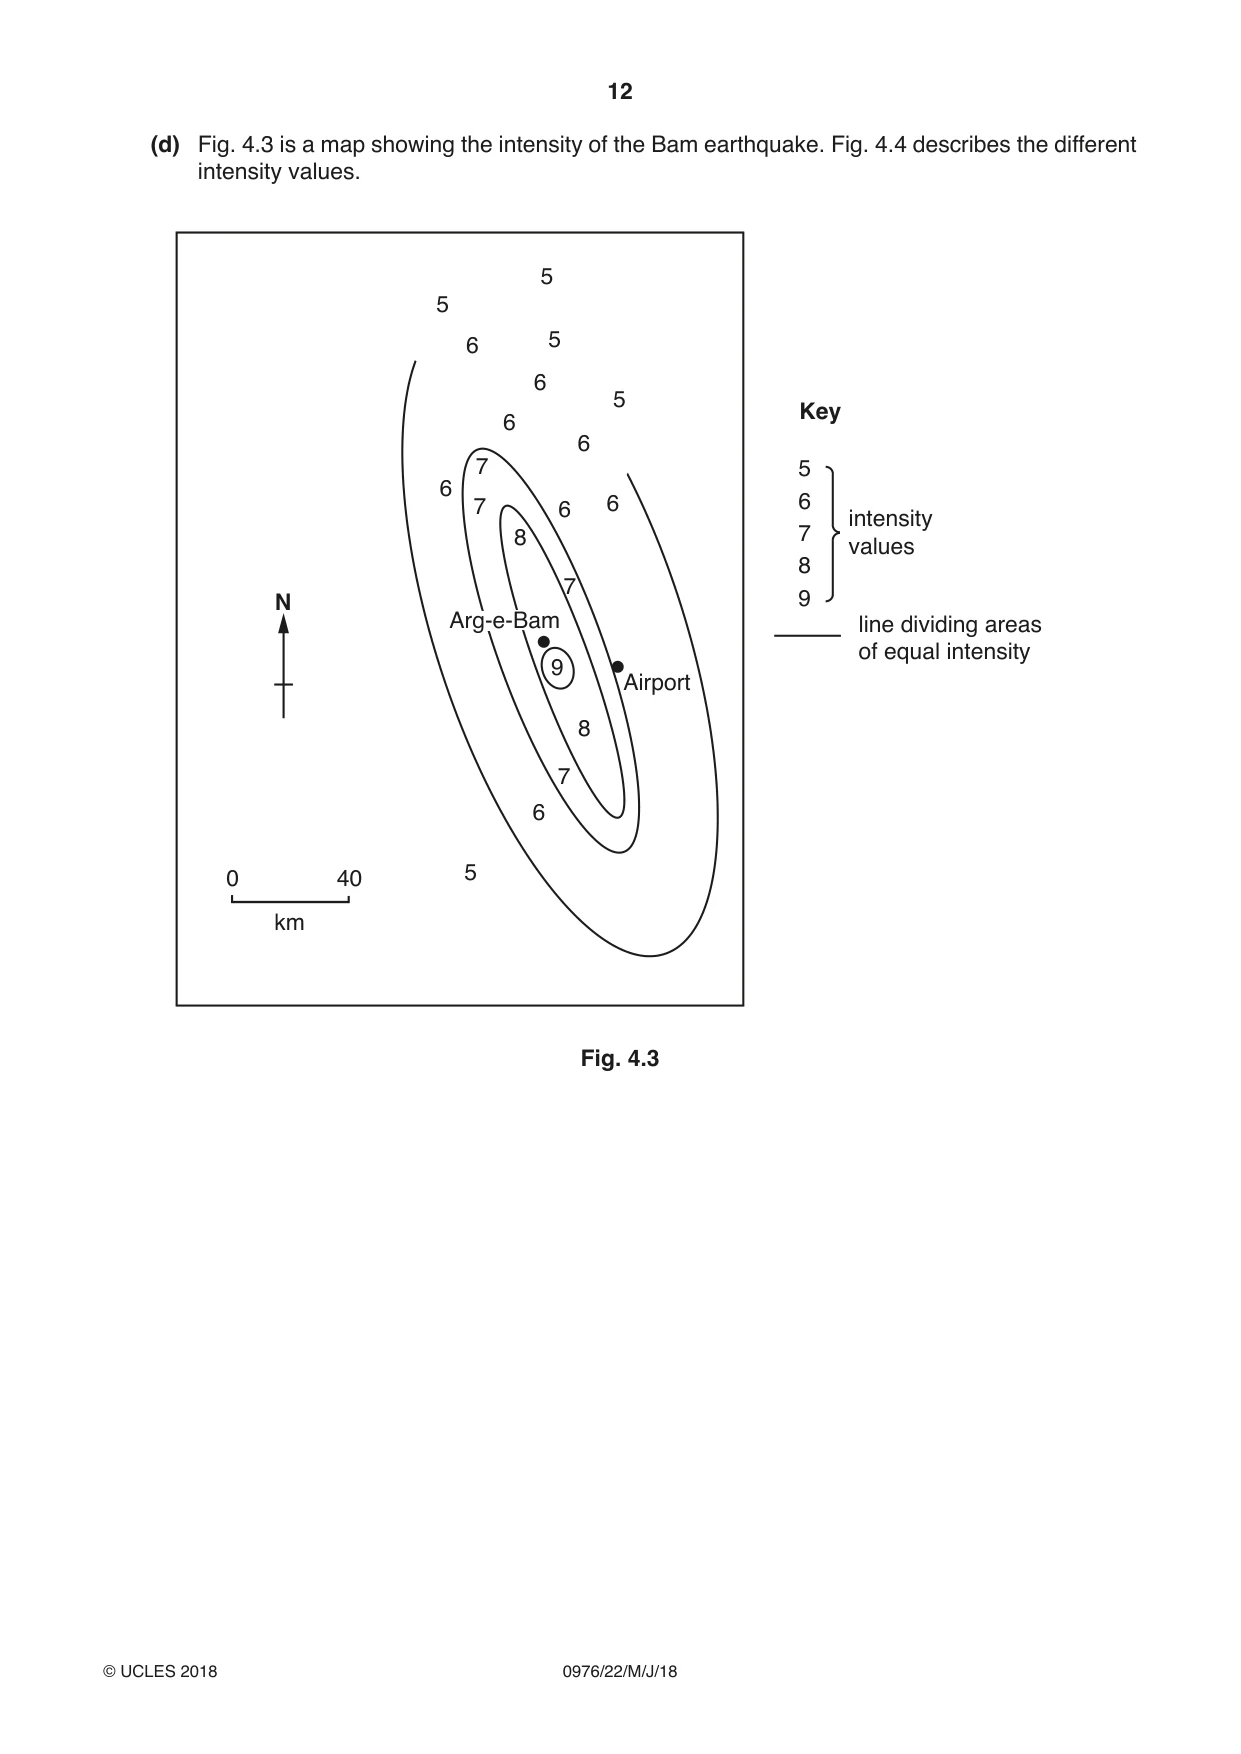
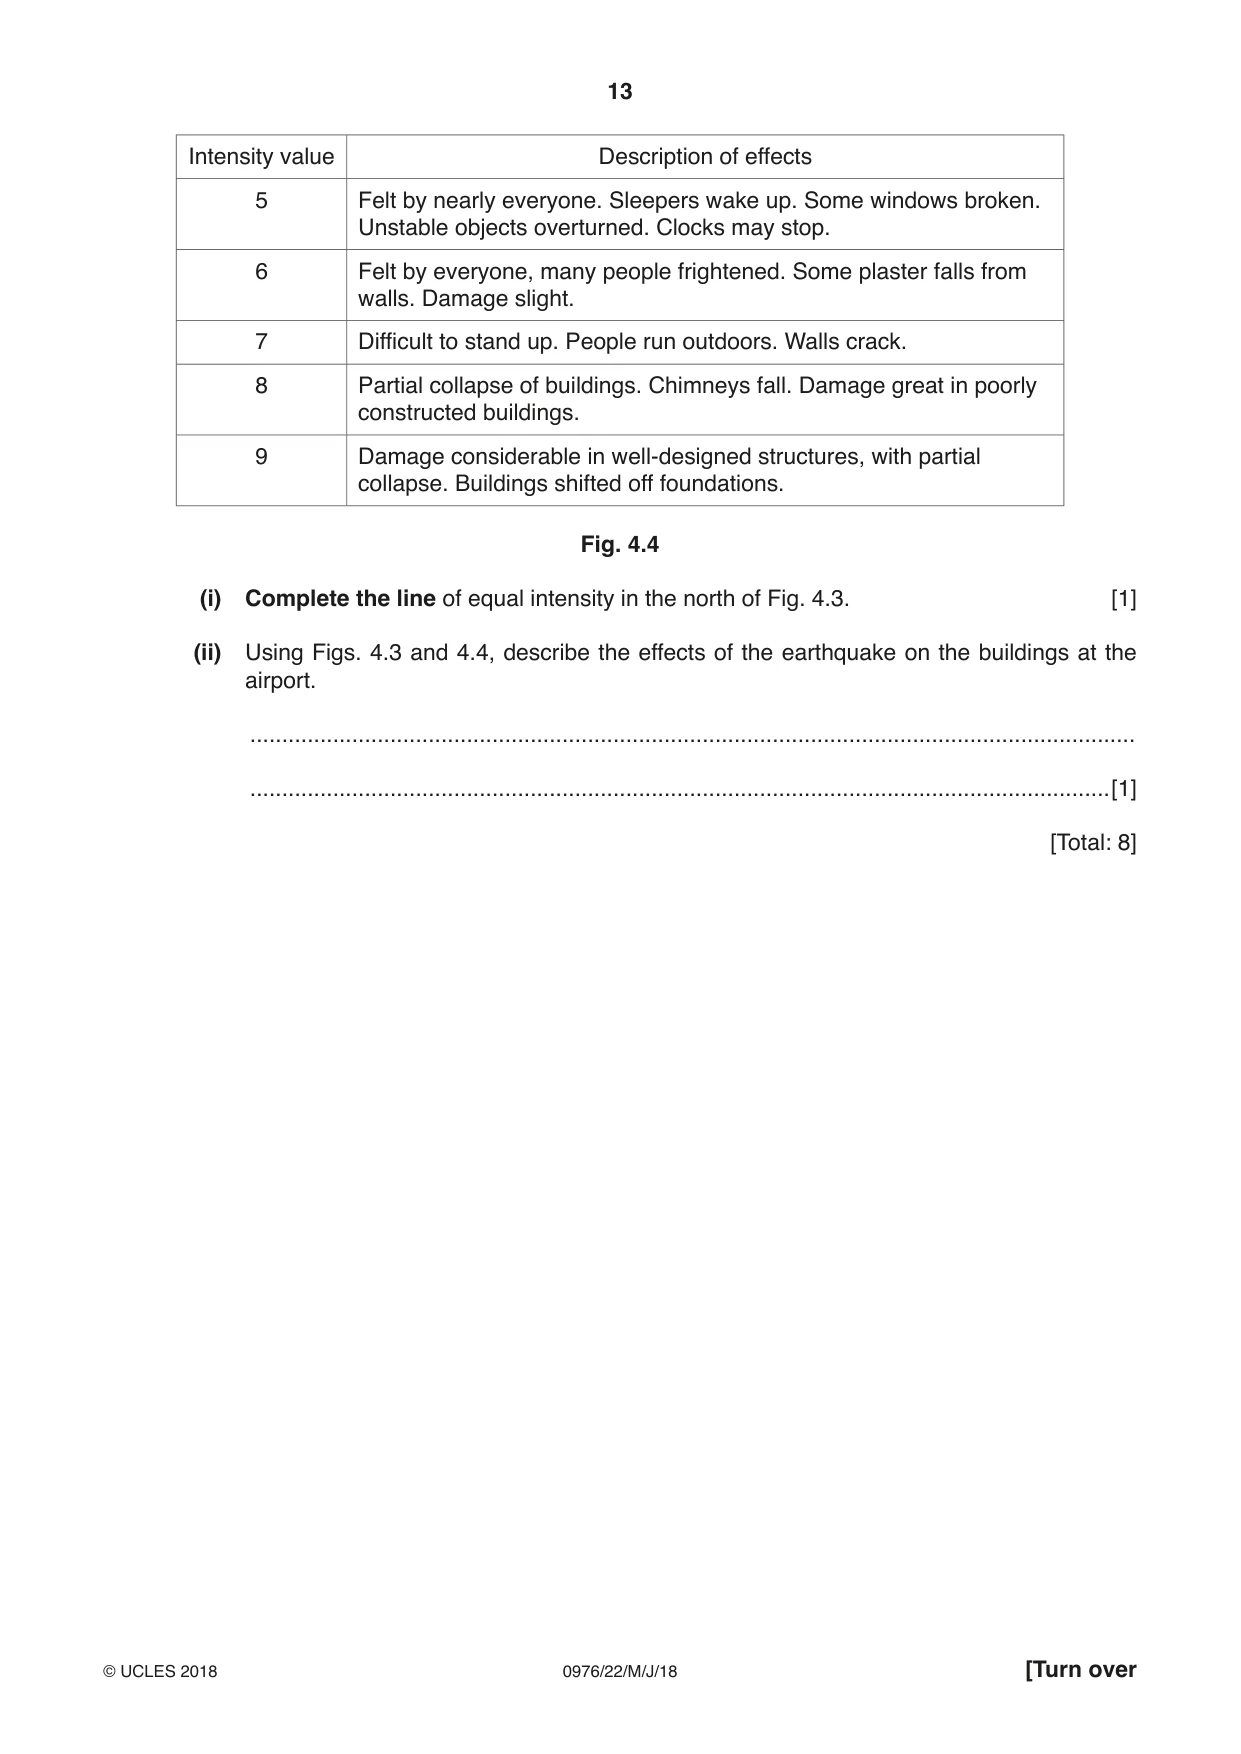
4 (a) Fig. 4.1 shows a cross section through an area affected by an earthquake. ground surface A Y ground surface X B Key seismic waves ground movement Not to scale Fig. 4.1 (i) Identify points X and Y shown on Fig. 4.1. X ................................ Y ................................ [2] (ii) Describe what happened along line A – B to cause an earthquake. ........................................................................................................................................... ........................................................................................................................................... .......................................................................................................................................[1] (b) Fig. 4.2 gives information about an earthquake at Bam in Iran. An earthquake occurred at Bam in south east Iran on December 26, 2003 at 05:26. More than 40 000 people were killed, 50 000 were injured and 100 000 became homeless. The Arg-e-Bam, the largest mud-brick building in the world, which was about 2000 years old, was almost totally destroyed in the earthquake. Fig. 4.2 Using Fig. 4.2, suggest the importance of the following on the effects of the earthquake: (i) the time of day ........................................................................................................................................... .......................................................................................................................................[1] (ii) the building materials of the Arg-e-Bam. ........................................................................................................................................... .......................................................................................................................................[1] (c) Using Fig. 4.2, suggest when the last major earthquake occurred at Bam before 2003. ................................................................................................................................................... ...............................................................................................................................................[1] (d) Fig. 4.3 is a map showing the intensity of the Bam earthquake. Fig. 4.4 describes the different intensity values. 5 5 5 6 6 5 Key 6 6 7 5 6 7 6 6 6 intensity 8 7 values 8 7 N 9 Arg-e-Bam line dividing areas of equal intensity 9 Airport 8 7 6 0 40 5 km Fig. 4.3 Intensity value Description of effects 5 Felt by nearly everyone. Sleepers wake up. Some windows broken. Unstable objects overturned. Clocks may stop. 6 Felt by everyone, many people frightened. Some plaster falls from walls. Damage slight. 7 Difficult to stand up. People run outdoors. Walls crack. 8 Partial collapse of buildings. Chimneys fall. Damage great in poorly constructed buildings. 9 Damage considerable in well-designed structures, with partial collapse. Buildings shifted off foundations. Fig. 4.4 (i) Complete the line of equal intensity in the north of Fig. 4.3. [1] (ii) Using Figs. 4.3 and 4.4, describe the effects of the earthquake on the buildings at the airport. ........................................................................................................................................... .......................................................................................................................................[1] [Total: 8]
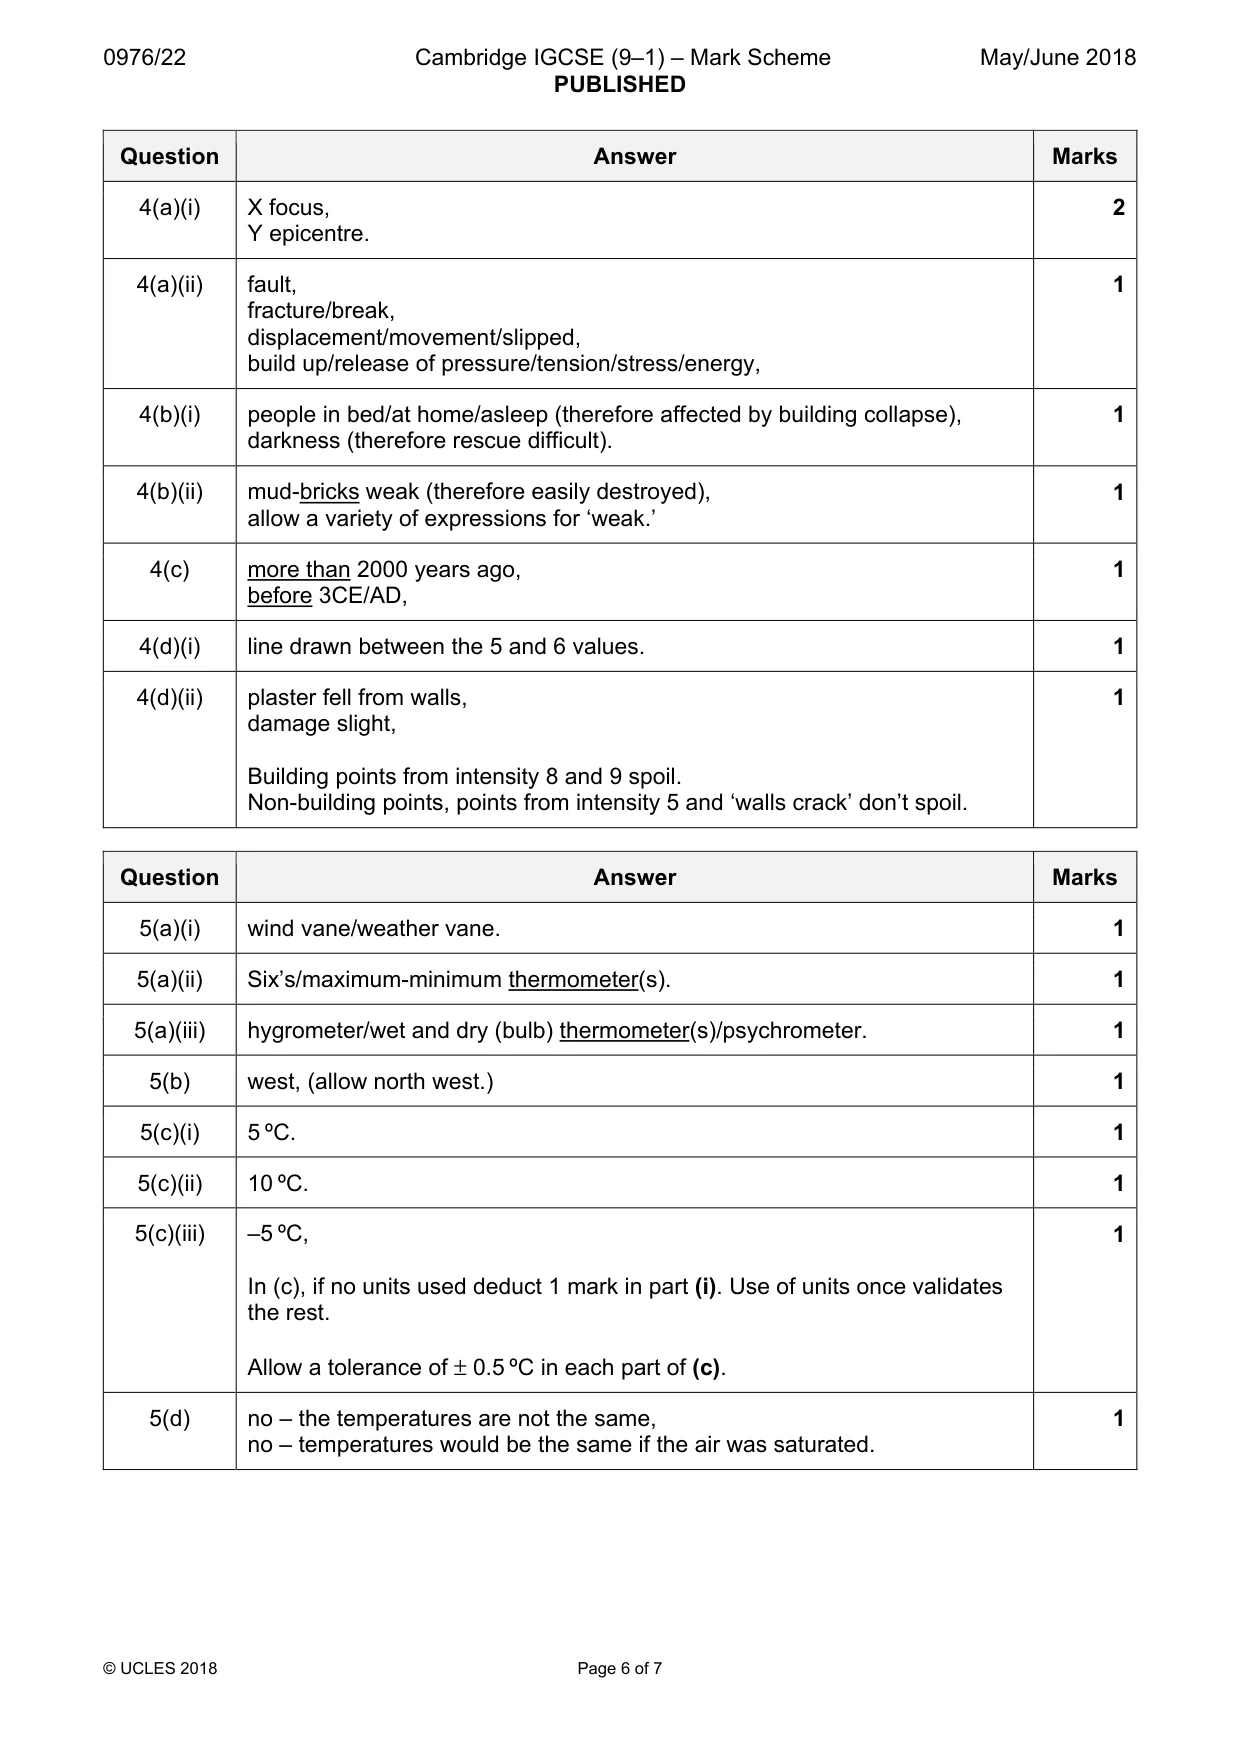
Mark scheme: 4(a)(i) X focus, 2 Y epicentre. 4(a)(ii) fault, 1 fracture/break, displacement/movement/slipped, build up/release of pressure/tension/stress/energy, 4(b)(i) people in bed/at home/asleep (therefore affected by building collapse), 1 darkness (therefore rescue difficult). 4(b)(ii) mud-bricks weak (therefore easily destroyed), 1 allow a variety of expressions for ‘weak.’ 4(c) more than 2000 years ago, 1 before 3CE/AD, 4(d)(i) line drawn between the 5 and 6 values. 1 4(d)(ii) plaster fell from walls, 1 damage slight, Building points from intensity 8 and 9 spoil. Non-building points, points from intensity 5 and ‘walls crack’ don’t spoil.
Question 5
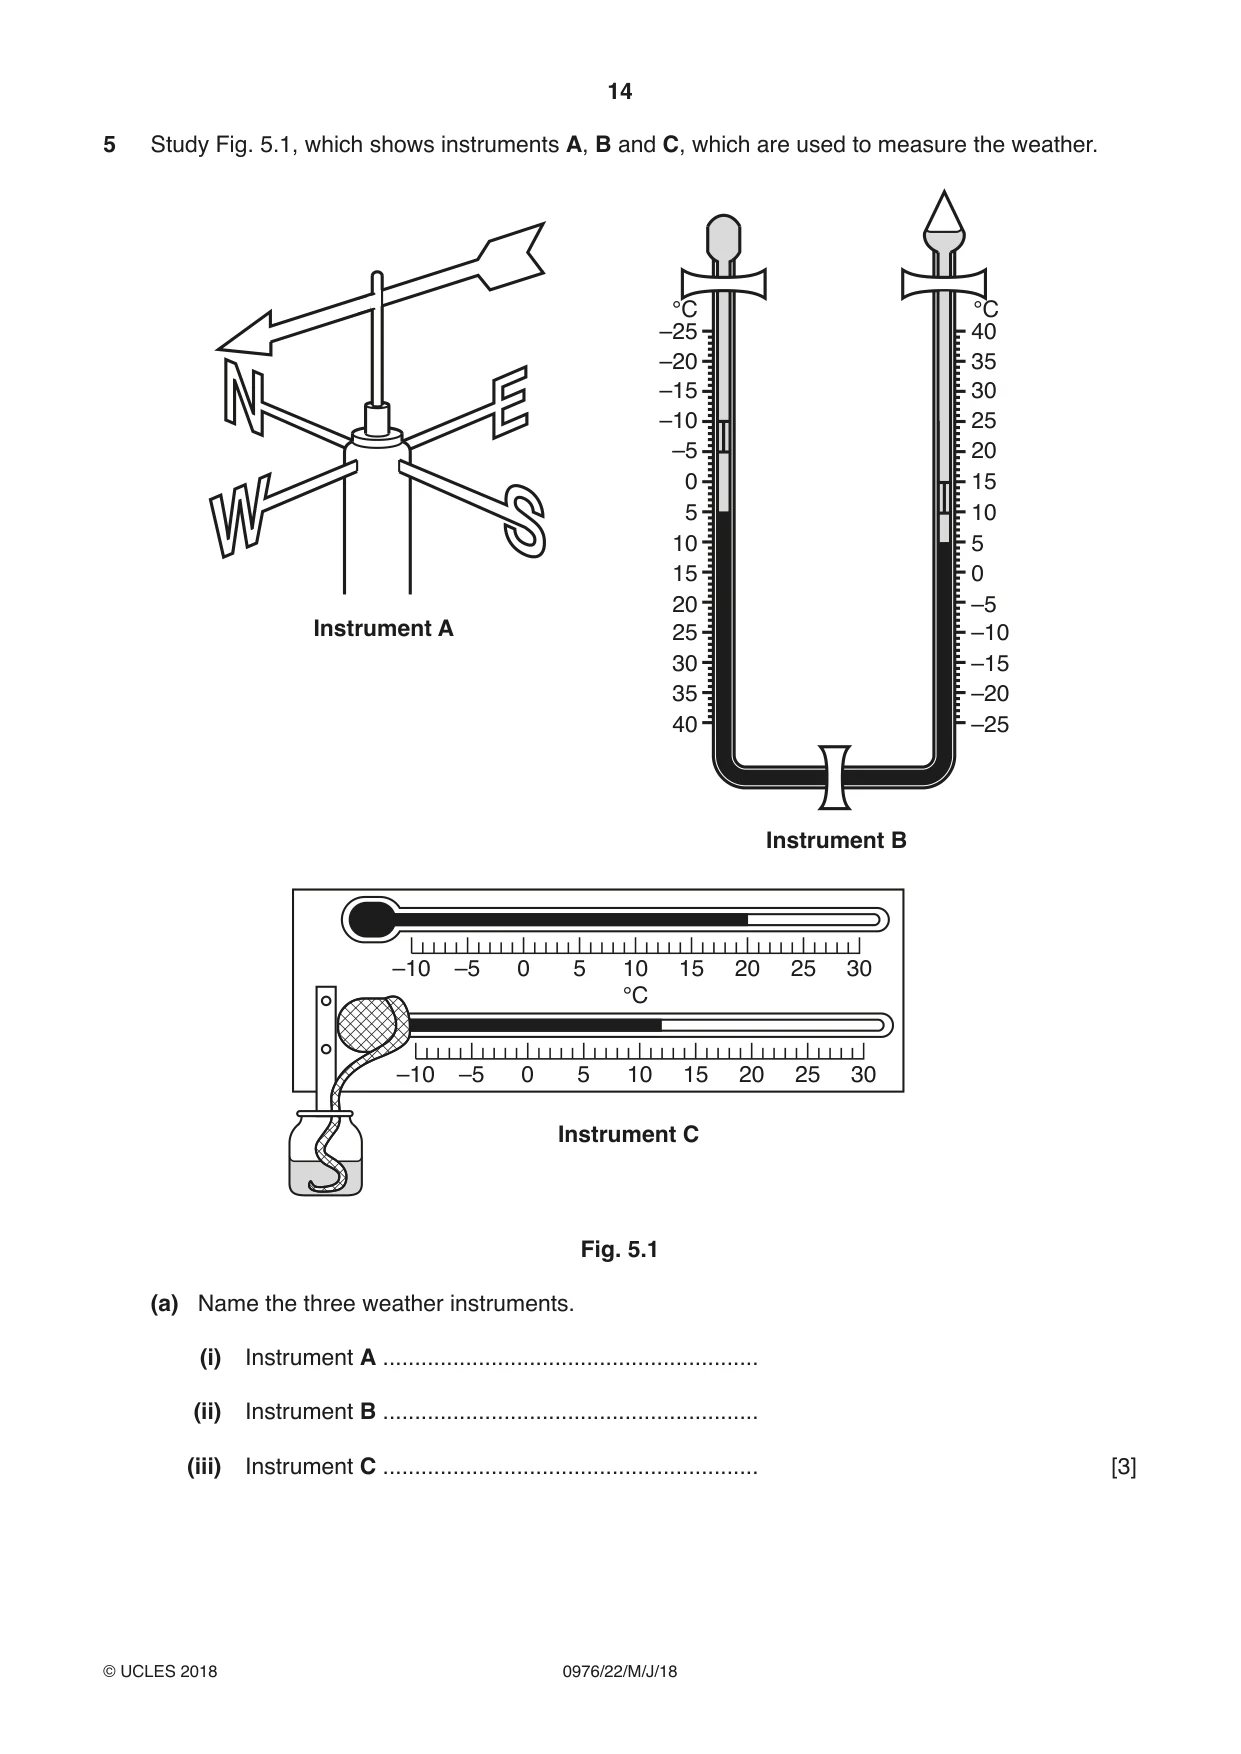
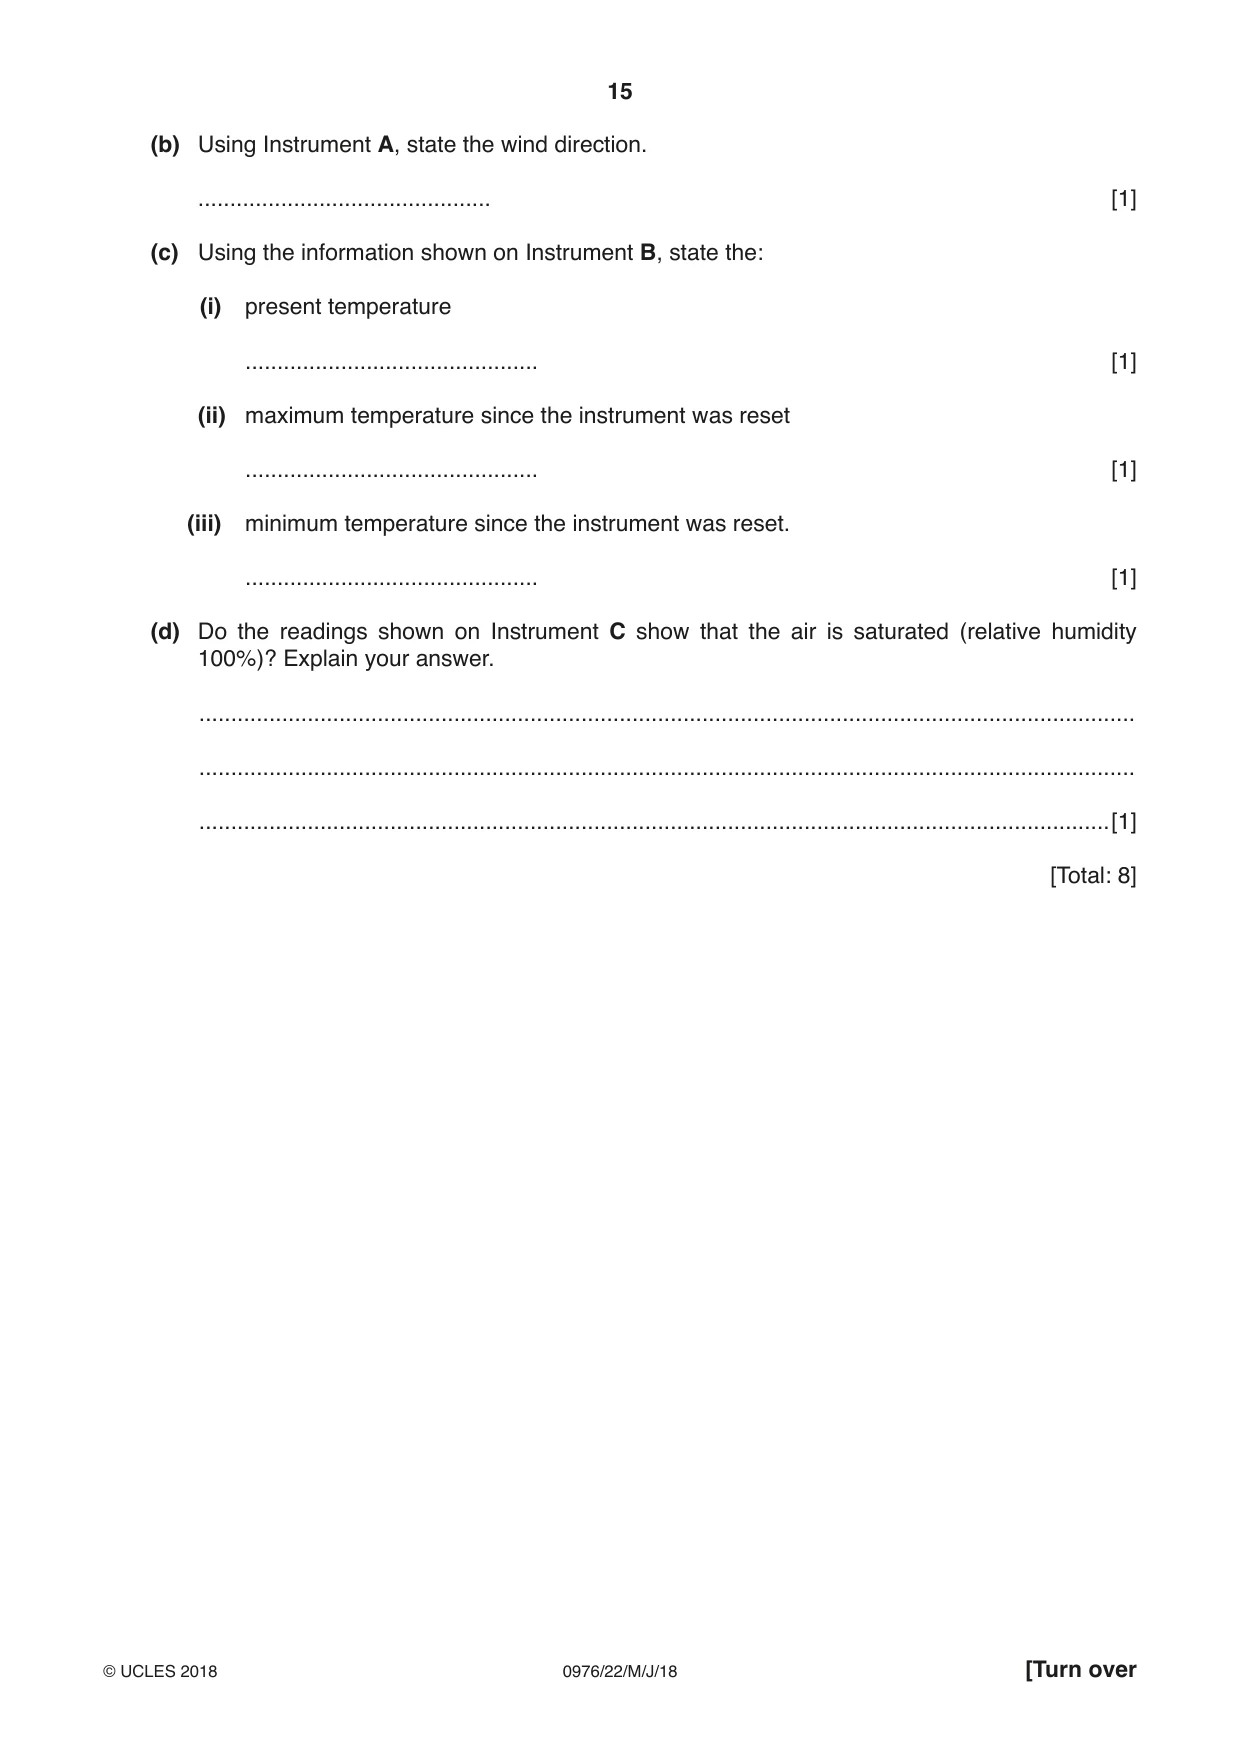
5 Study Fig. 5.1, which shows instruments A, B and C, which are used to measure the weather. °C °C –25 40 –20 35 –15 30 –10 25 –5 20 0 15 5 10 10 5 15 0 20 –5 Instrument A 25 –10 30 –15 35 –20 40 –25 Instrument B –10 –5 0 5 10 15 20 25 30 °C –10 –5 0 5 10 15 20 25 30 Instrument C Fig. 5.1 (a) Name the three weather instruments. (i) Instrument A ........................................................... (ii) Instrument B ........................................................... (iii) Instrument C ........................................................... [3] (b) Using Instrument A, state the wind direction. .............................................. [1] (c) Using the information shown on Instrument B, state the: (i) present temperature .............................................. [1] (ii) maximum temperature since the instrument was reset .............................................. [1] (iii) minimum temperature since the instrument was reset. .............................................. [1] (d) Do the readings shown on Instrument C show that the air is saturated (relative humidity 100%)? Explain your answer. ................................................................................................................................................... ................................................................................................................................................... ...............................................................................................................................................[1] [Total: 8]
Mark scheme: 5(a)(i) wind vane/weather vane. 1 5(a)(ii) Six’s/maximum-minimum thermometer(s). 1 5(a)(iii) hygrometer/wet and dry (bulb) thermometer(s)/psychrometer. 1 5(b) west, (allow north west.) 1 5(c)(i) 5 ºC. 1 5(c)(ii) 10 ºC. 1 5(c)(iii) –5 ºC, 1 In (c), if no units used deduct 1 mark in part (i). Use of units once validates the rest. Allow a tolerance of ± 0.5 ºC in each part of (c). 5(d) no – the temperatures are not the same, 1 no – temperatures would be the same if the air was saturated.
Question 6
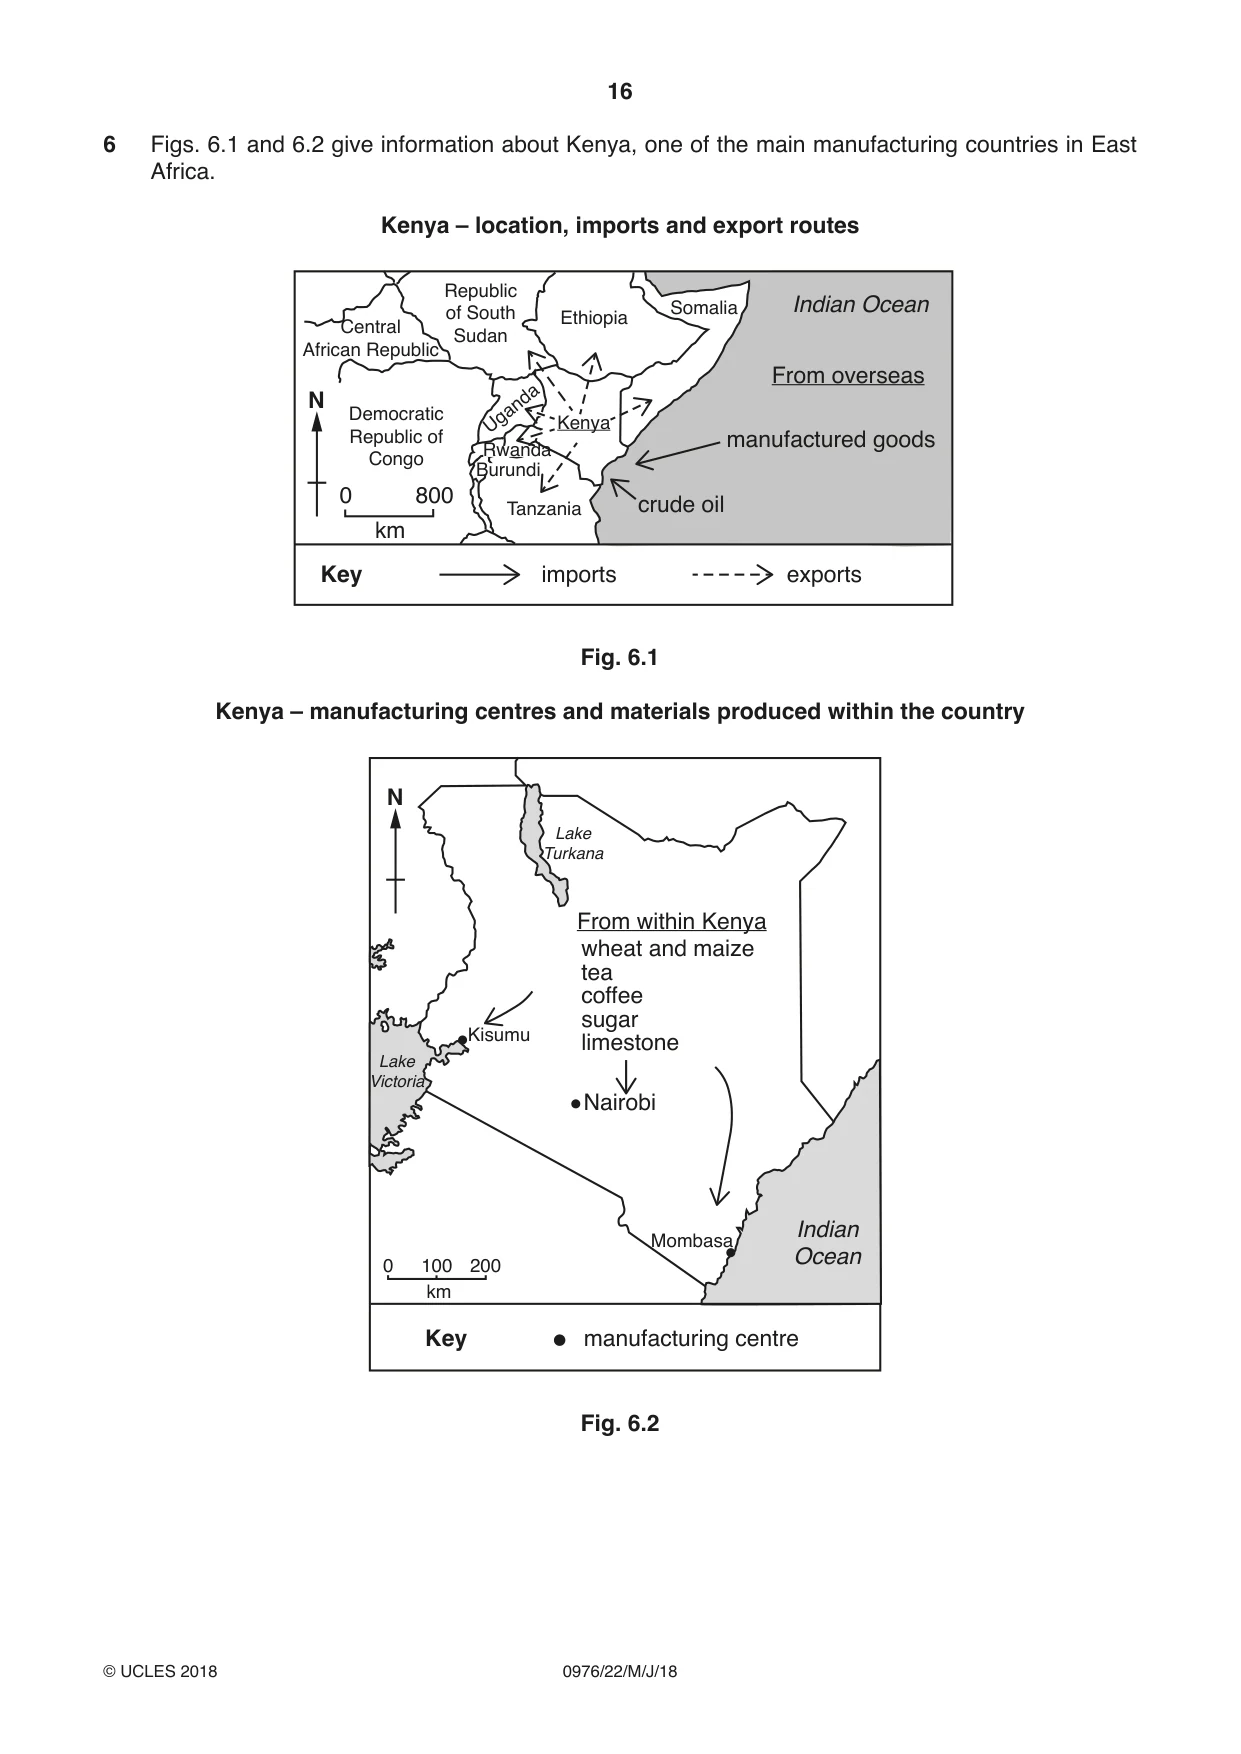
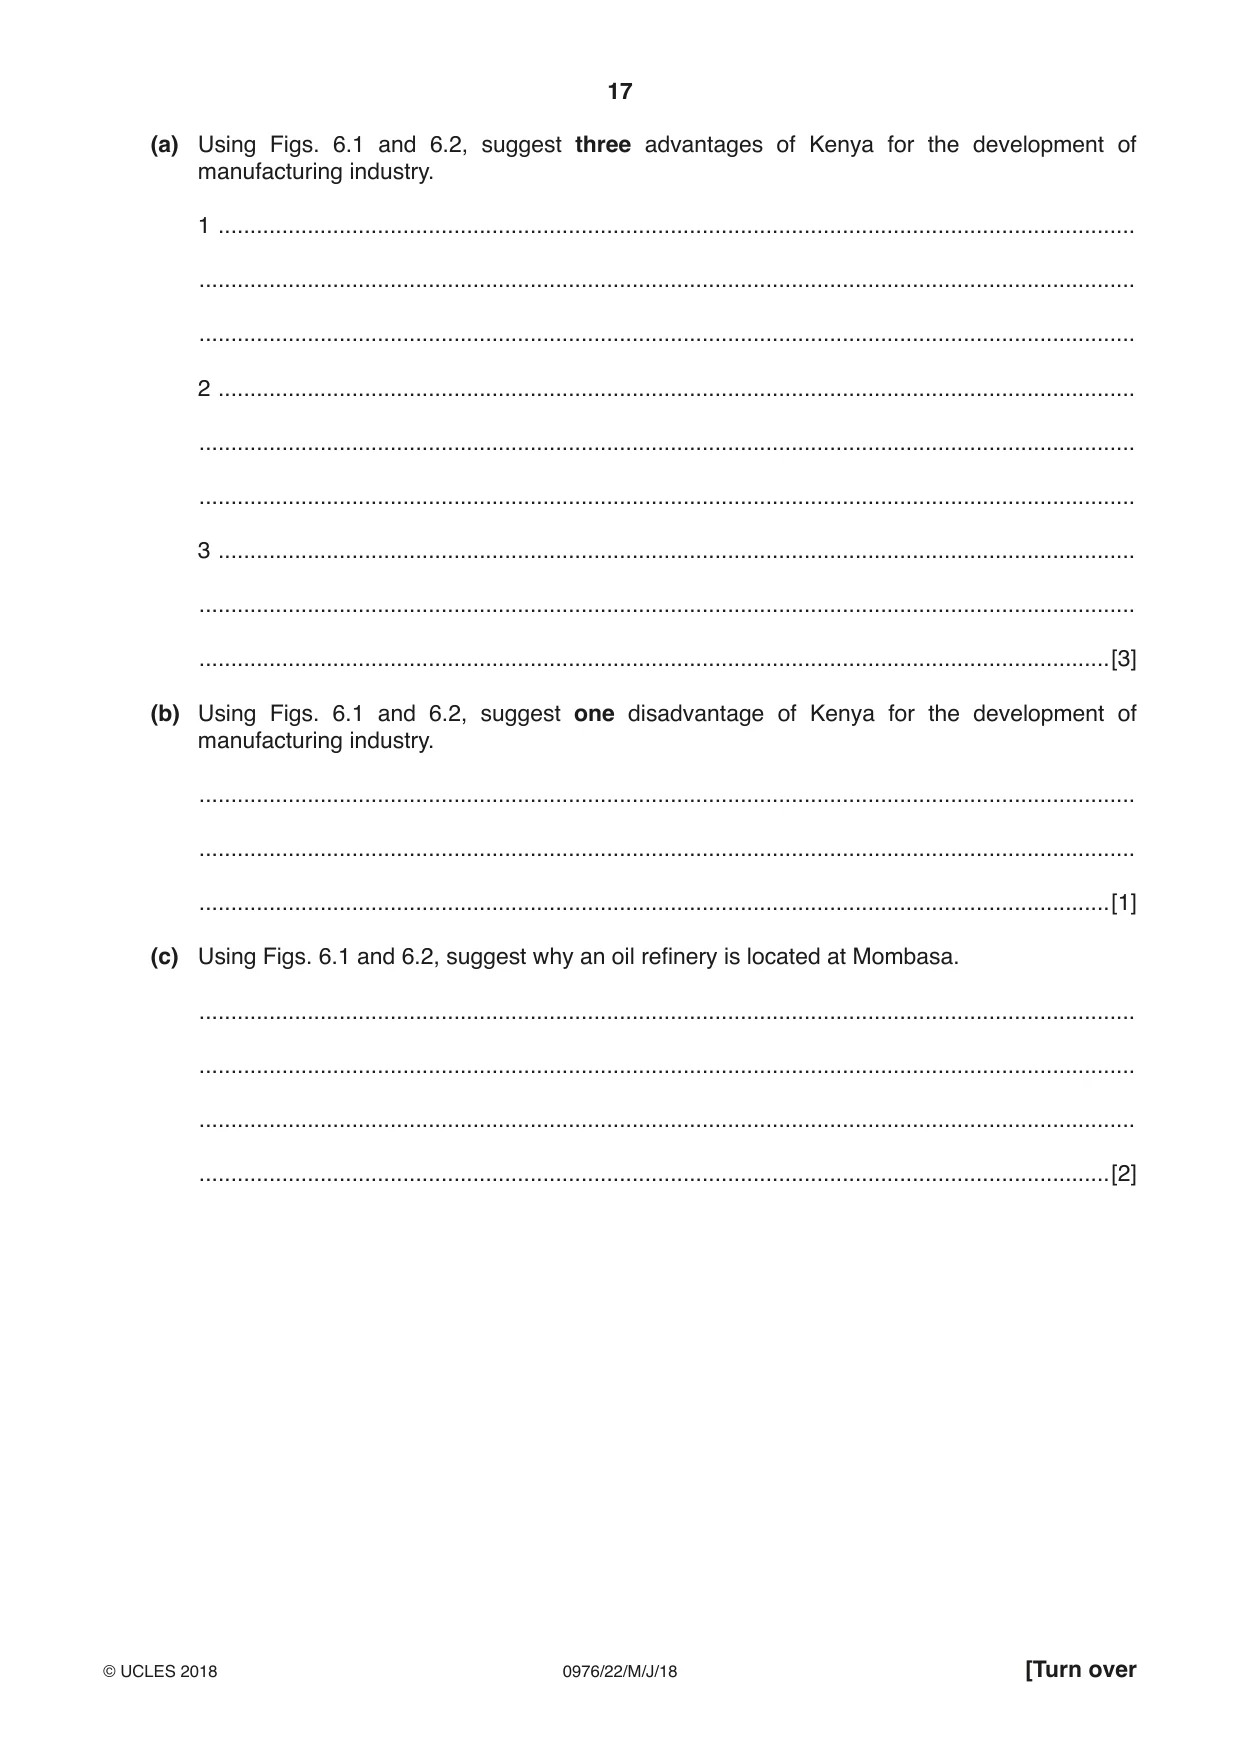
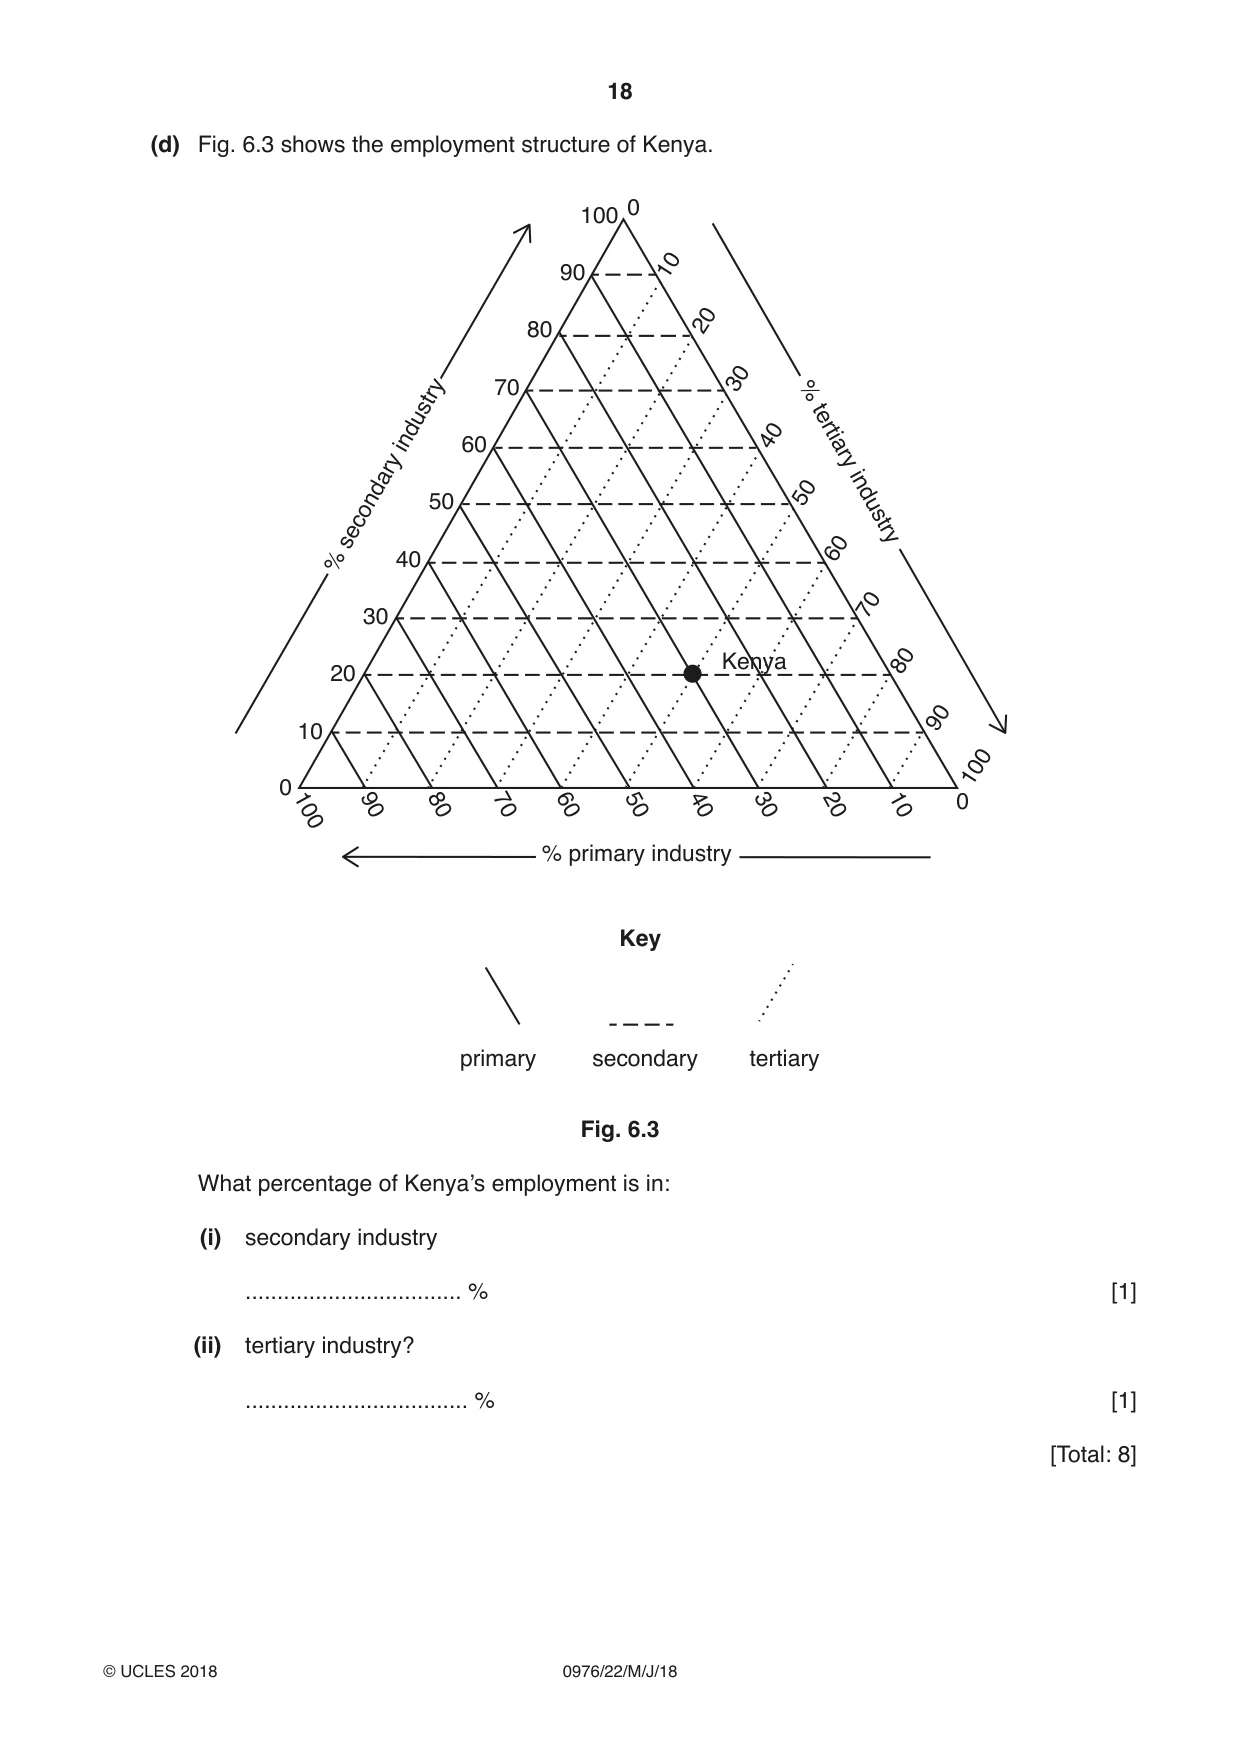
6 Figs. 6.1 and 6.2 give information about Kenya, one of the main manufacturing countries in East Africa. Kenya – location, imports and export routes Republic Indian Ocean of South Ethiopia Somalia Central Sudan African Republic From overseas N Democratic Uganda Kenya Republic of manufactured goods Rwanda Congo Burundi 0 800 Tanzania crude oil km Key imports exports Fig. 6.1 Kenya – manufacturing centres and materials produced within the country N Lake Turkana From within Kenya wheat and maize tea coffee sugar Kisumu limestone Lake Victoria Nairobi Indian Mombasa 0 100 200 Ocean km Key manufacturing centre Fig. 6.2 (a) Using Figs. 6.1 and 6.2, suggest three advantages of Kenya for the development of manufacturing industry. 1 ................................................................................................................................................ ................................................................................................................................................... ................................................................................................................................................... 2 ................................................................................................................................................ ................................................................................................................................................... ................................................................................................................................................... 3 ................................................................................................................................................ ................................................................................................................................................... ...............................................................................................................................................[3] (b) Using Figs. 6.1 and 6.2, suggest one disadvantage of Kenya for the development of manufacturing industry. ................................................................................................................................................... ................................................................................................................................................... ...............................................................................................................................................[1] (c) Using Figs. 6.1 and 6.2, suggest why an oil refinery is located at Mombasa. ................................................................................................................................................... ................................................................................................................................................... ................................................................................................................................................... ...............................................................................................................................................[2] (d) Fig. 6.3 shows the employment structure of Kenya. 0 100 90 10 20 80 30 40 industry 60 70 % tertiary 50 50 secondary industry 60 % 40 70 30 Kenya 80 20 90 10 100 0 100 90 80 70 60 50 40 30 20 10 0 % primary industry Key primary secondary tertiary Fig. 6.3 What percentage of Kenya’s employment is in: (i) secondary industry .................................. % [1] (ii) tertiary industry? ................................... % [1] [Total: 8]
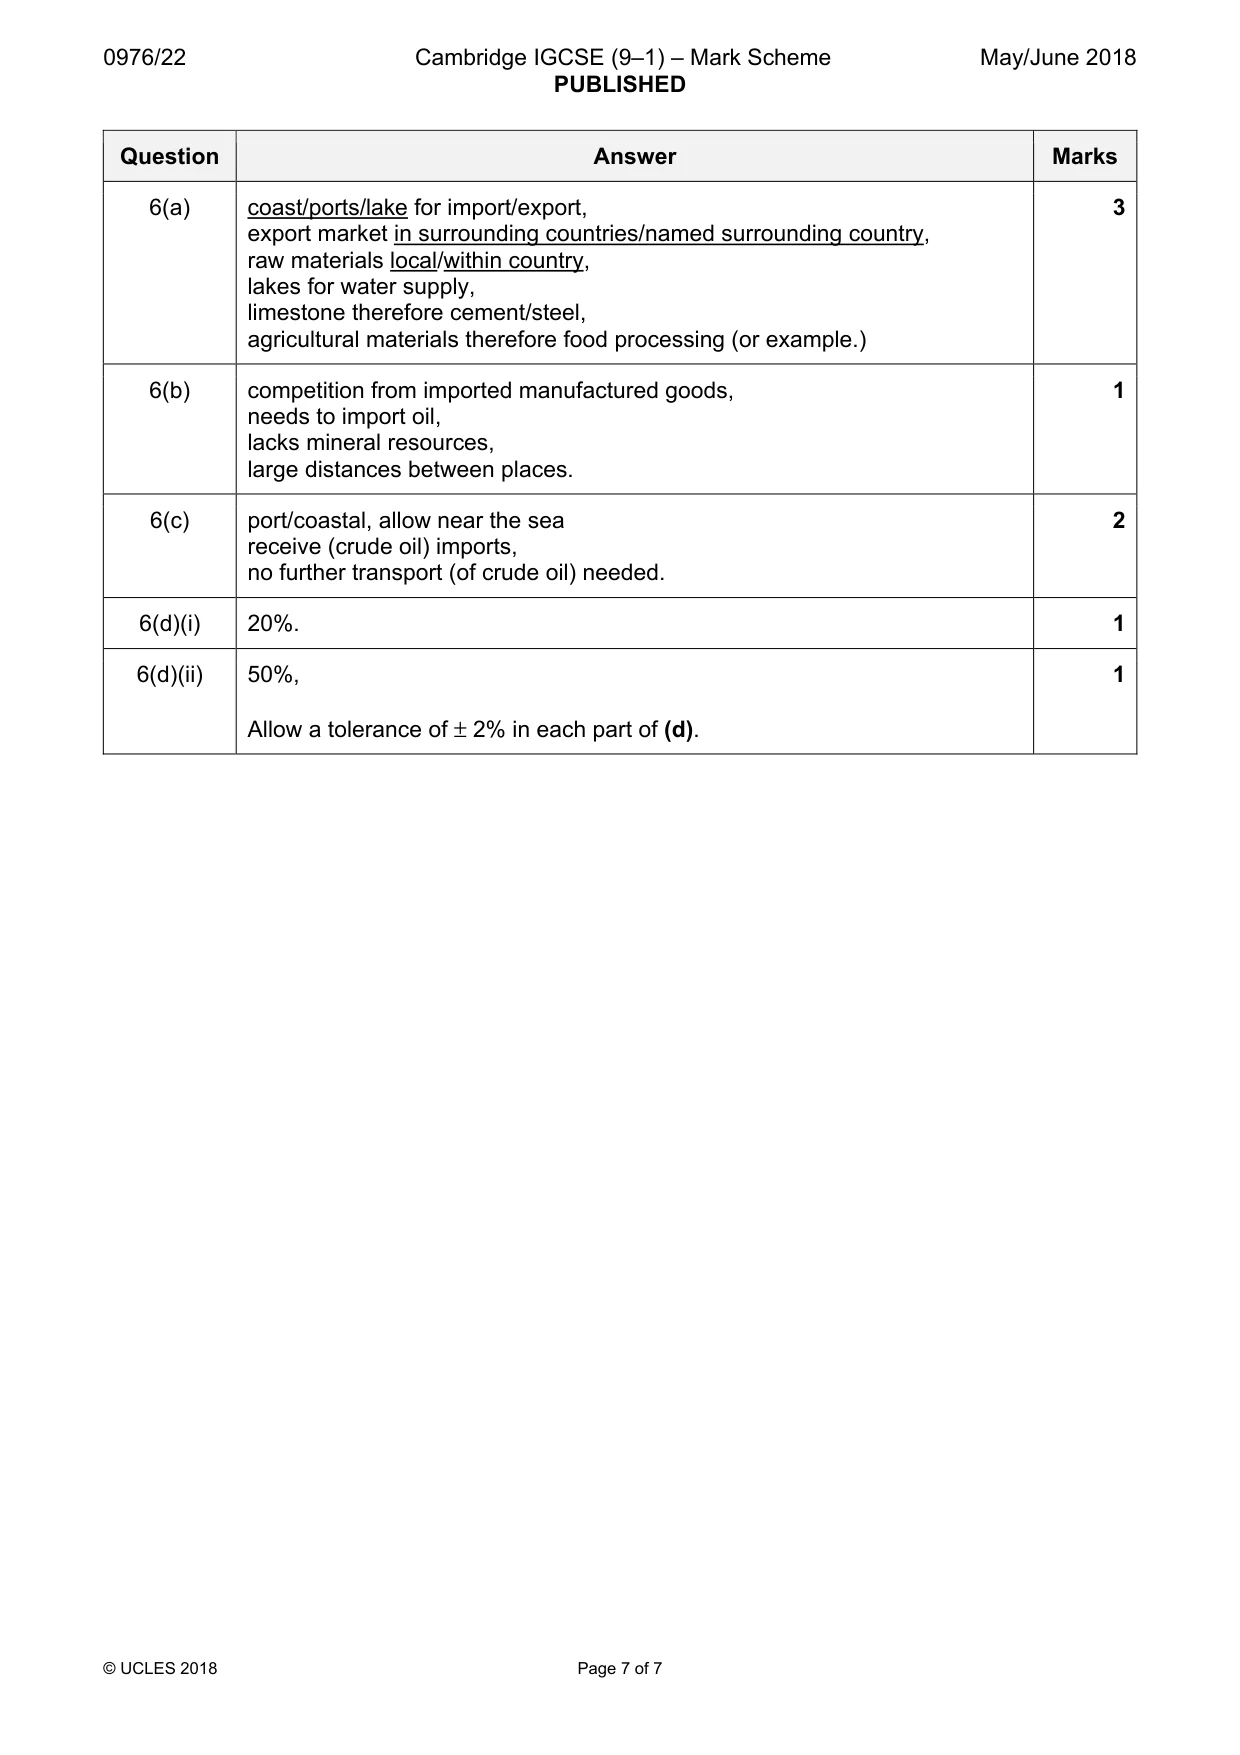
Mark scheme: 6(a) coast/ports/lake for import/export, 3 export market in surrounding countries/named surrounding country, raw materials local/within country, lakes for water supply, limestone therefore cement/steel, agricultural materials therefore food processing (or example.) 6(b) competition from imported manufactured goods, 1 needs to import oil, lacks mineral resources, large distances between places. 6(c) port/coastal, allow near the sea 2 receive (crude oil) imports, no further transport (of crude oil) needed. 6(d)(i) 20%. 1 6(d)(ii) 50%, 1 Allow a tolerance of ± 2% in each part of (d).
What was in this paper
The subtopics covered by these 6 questions, and how many questions each got. Open one in a new tab to see every Cambridge question on it.
What you needed in this session
Cambridge’s own grade thresholds for 2018 May/June, Paper 2 · Variant 2. A higher threshold means an easier paper — the bar moves with how the cohort did.