Cambridge IGCSE Development Studies 0453 — 2021 Oct/Nov Paper 2 · Variant 0
0453/20/O/N/21 · 80 marks · ≈90 min
The question paper and its mark scheme, free to read here and free to download. This is Cambridge’s own paper, exactly as it was sat.
Question paper20 pages


Mark scheme
No mark scheme is in the library for this paper.
Paper as text
Question paper, page 1
Cambridge IGCSE™ This document has 20 pages. * 6 1 4 2 1 2 8 9 1 3 * DEVELOPMENT STUDIES 0453/02 Paper 2 October/November 2021 2 hours You must answer on the question paper. You will need: Ruler INSTRUCTIONS ● Answer all questions. ● Use a black or dark blue pen. You may use an HB pencil for any diagrams or graphs. ● Write your name, centre number and candidate number in the boxes at the top of the page. ● Write your answer to each question in the space provided. ● Do not use an erasable pen or correction fluid. ● Do not write on any bar codes. INFORMATION ● The total mark for this paper is 80. ● The number of marks for each question or part question is shown in brackets [ ]. DC (CJ/FC) 192957/3 © UCLES 2021 [Turn over
Question paper, page 2
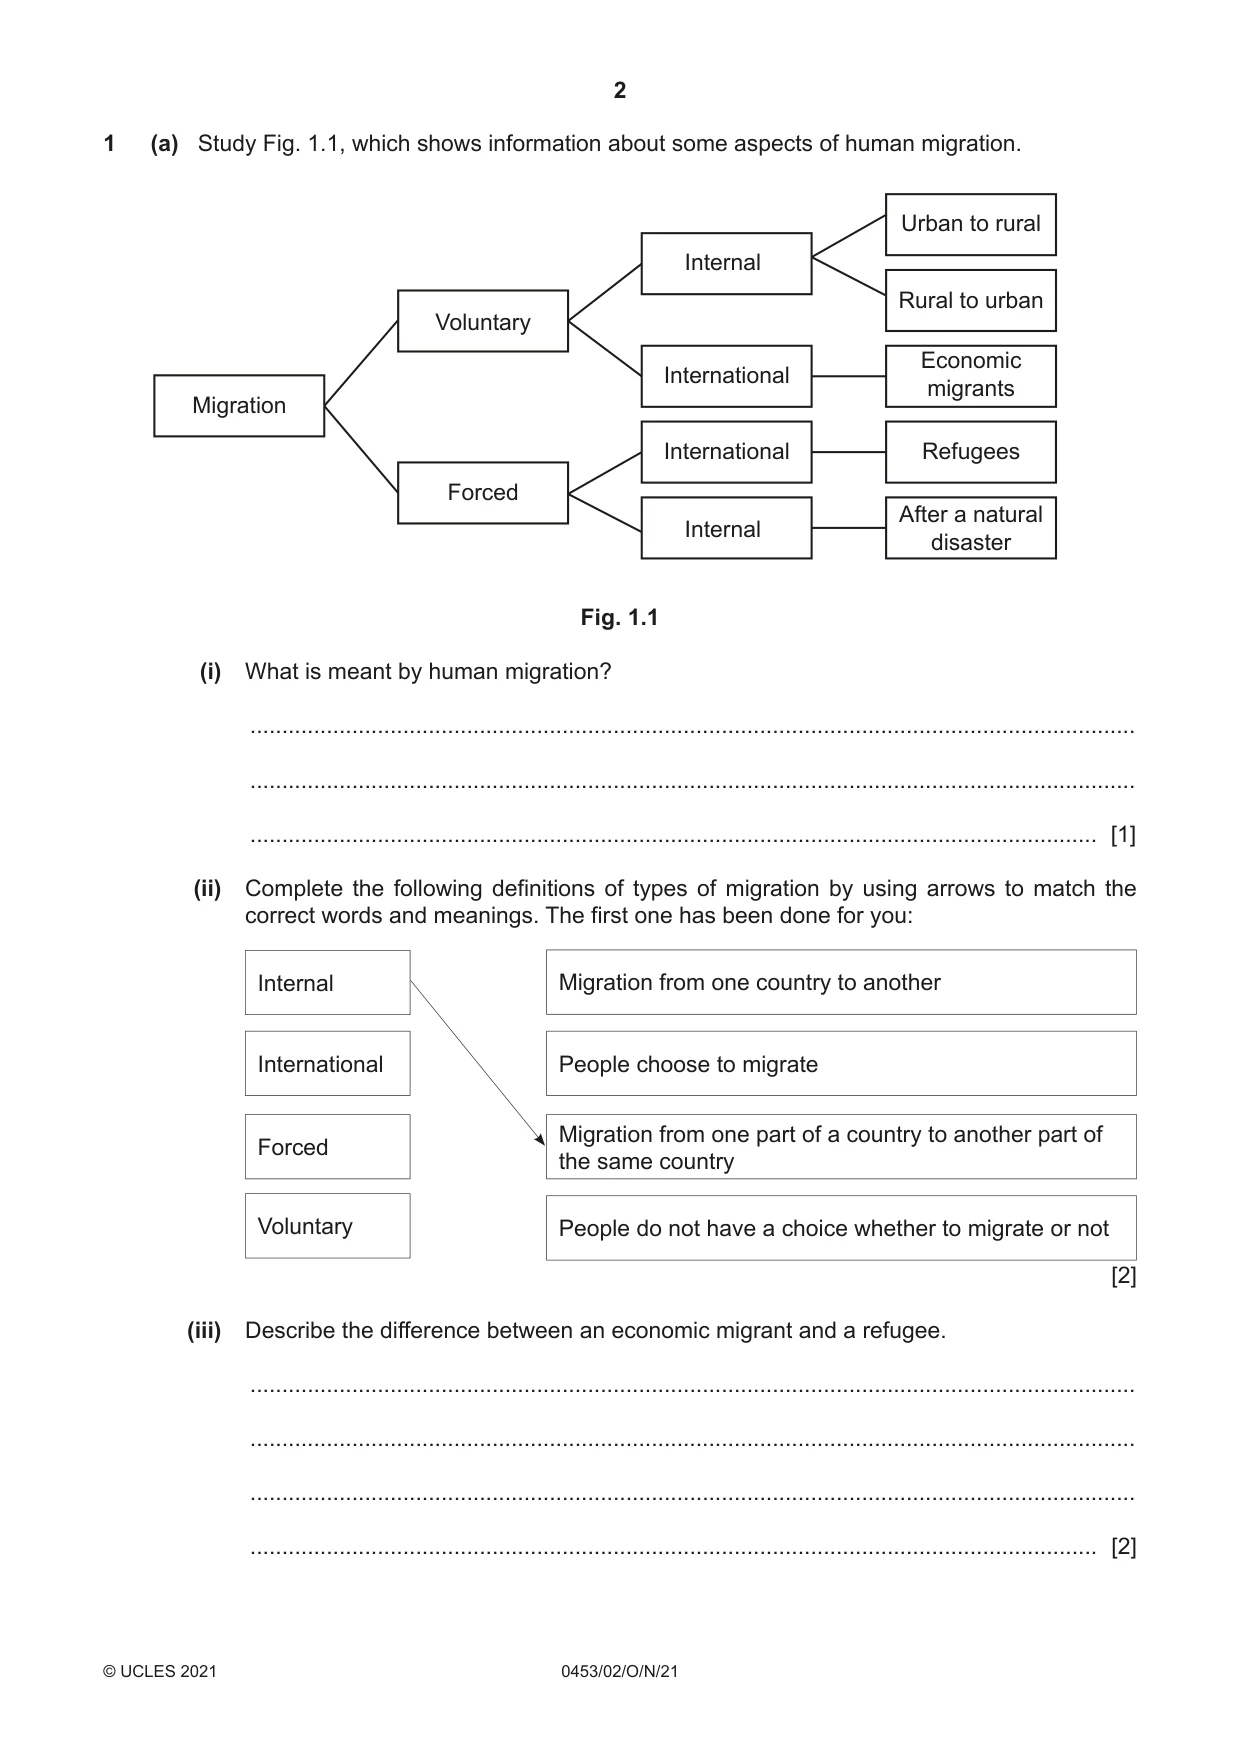
2 0453/02/O/N/21 © UCLES 2021 1 (a) Study Fig. 1.1, which shows information about some aspects of human migration. Migration Voluntary Forced Internal Internal International International Urban to rural Rural to urban Economic migrants Refugees After a natural disaster Fig. 1.1 (i) What is meant by human migration? … … … [1] (ii) Complete the following definitions of types of migration by using arrows to match the correct words and meanings. The first one has been done for you: Internal Migration from one country to another International People choose to migrate Forced Migration from one part of a country to another part of the same country Voluntary People do not have a choice whether to migrate or not [2] (iii) Describe the difference between an economic migrant and a refugee. … … … … [2]
Question paper, page 3
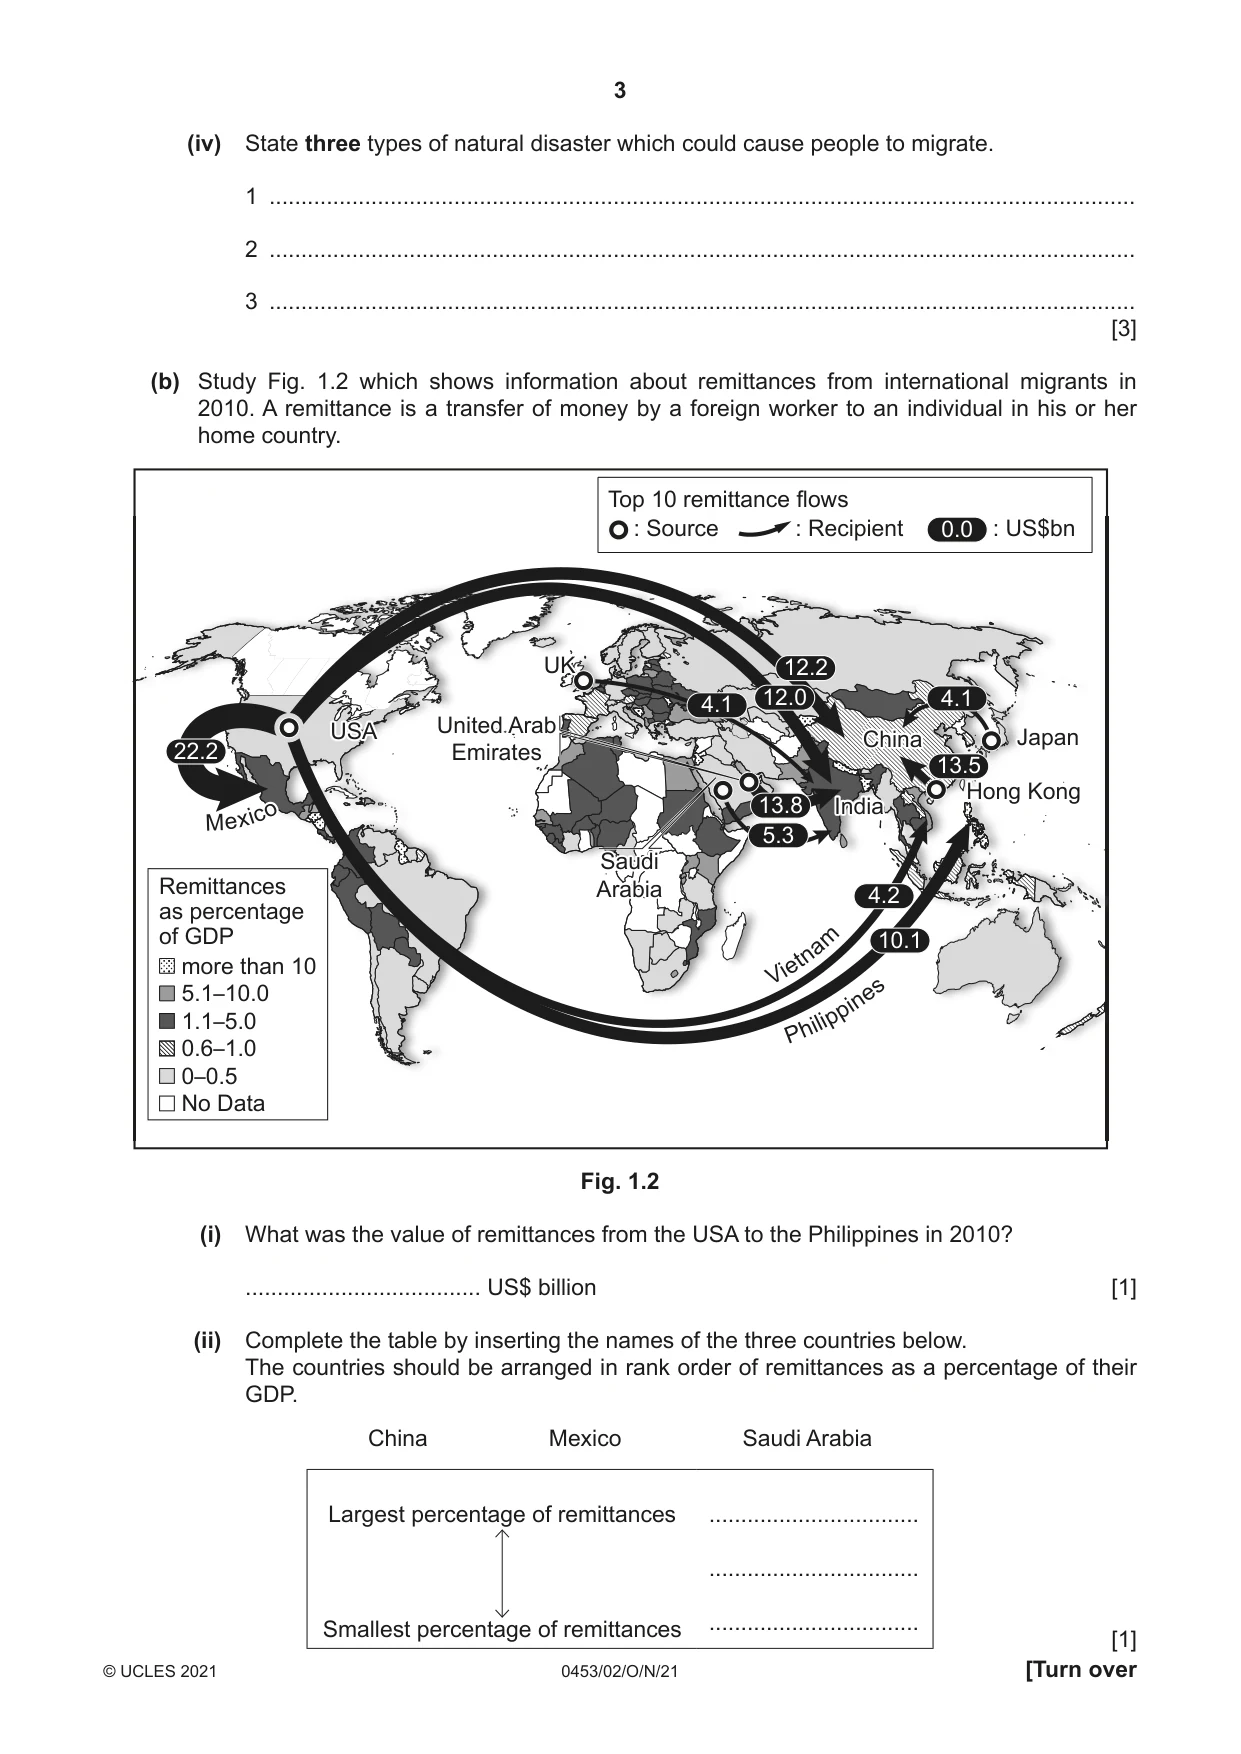
3 0453/02/ O/ N/21 © UCLES 2021 [Turn over (iv) State three types of natural disaster which could cause people to migrate. 1 … 2 … 3 … [3] (b) Study Fig. 1.2 which shows information about remittances from international migrants in 2010. A remittance is a transfer of money by a foreign worker to an individual in his or her home country. P hi li pp in es Vi et n a m USA Saudi Arabia United Arab Emirates India China Japan Hong Kong UK USA Saudi Arabia United Arab Emirates India China Japan Hong Kong Top 10 remittance flows : Source : Recipient : US$bn Remittances as percentage of GDP more than 10 5.1—10.0 1.1—5.0 0.6—1.0 0—0.5 No Data 4.1 12.2 0.0 12.0 13.8 5.3 4.1 13.5 4.2 10.1 22.2 UK P hi li pp in es Vi et n a m M e x i c o M e x i c o Fig. 1.2 (i) What was the value of remittances from the USA to the Philippines in 2010? … US$ billion [1] (ii) Complete the table by inserting the names of the three countries below. The countries should be arranged in rank order of remittances as a percentage of their GDP. China Mexico Saudi Arabia Largest percentage of remittances Smallest percentage of remittances … … … [1]
Question paper, page 4
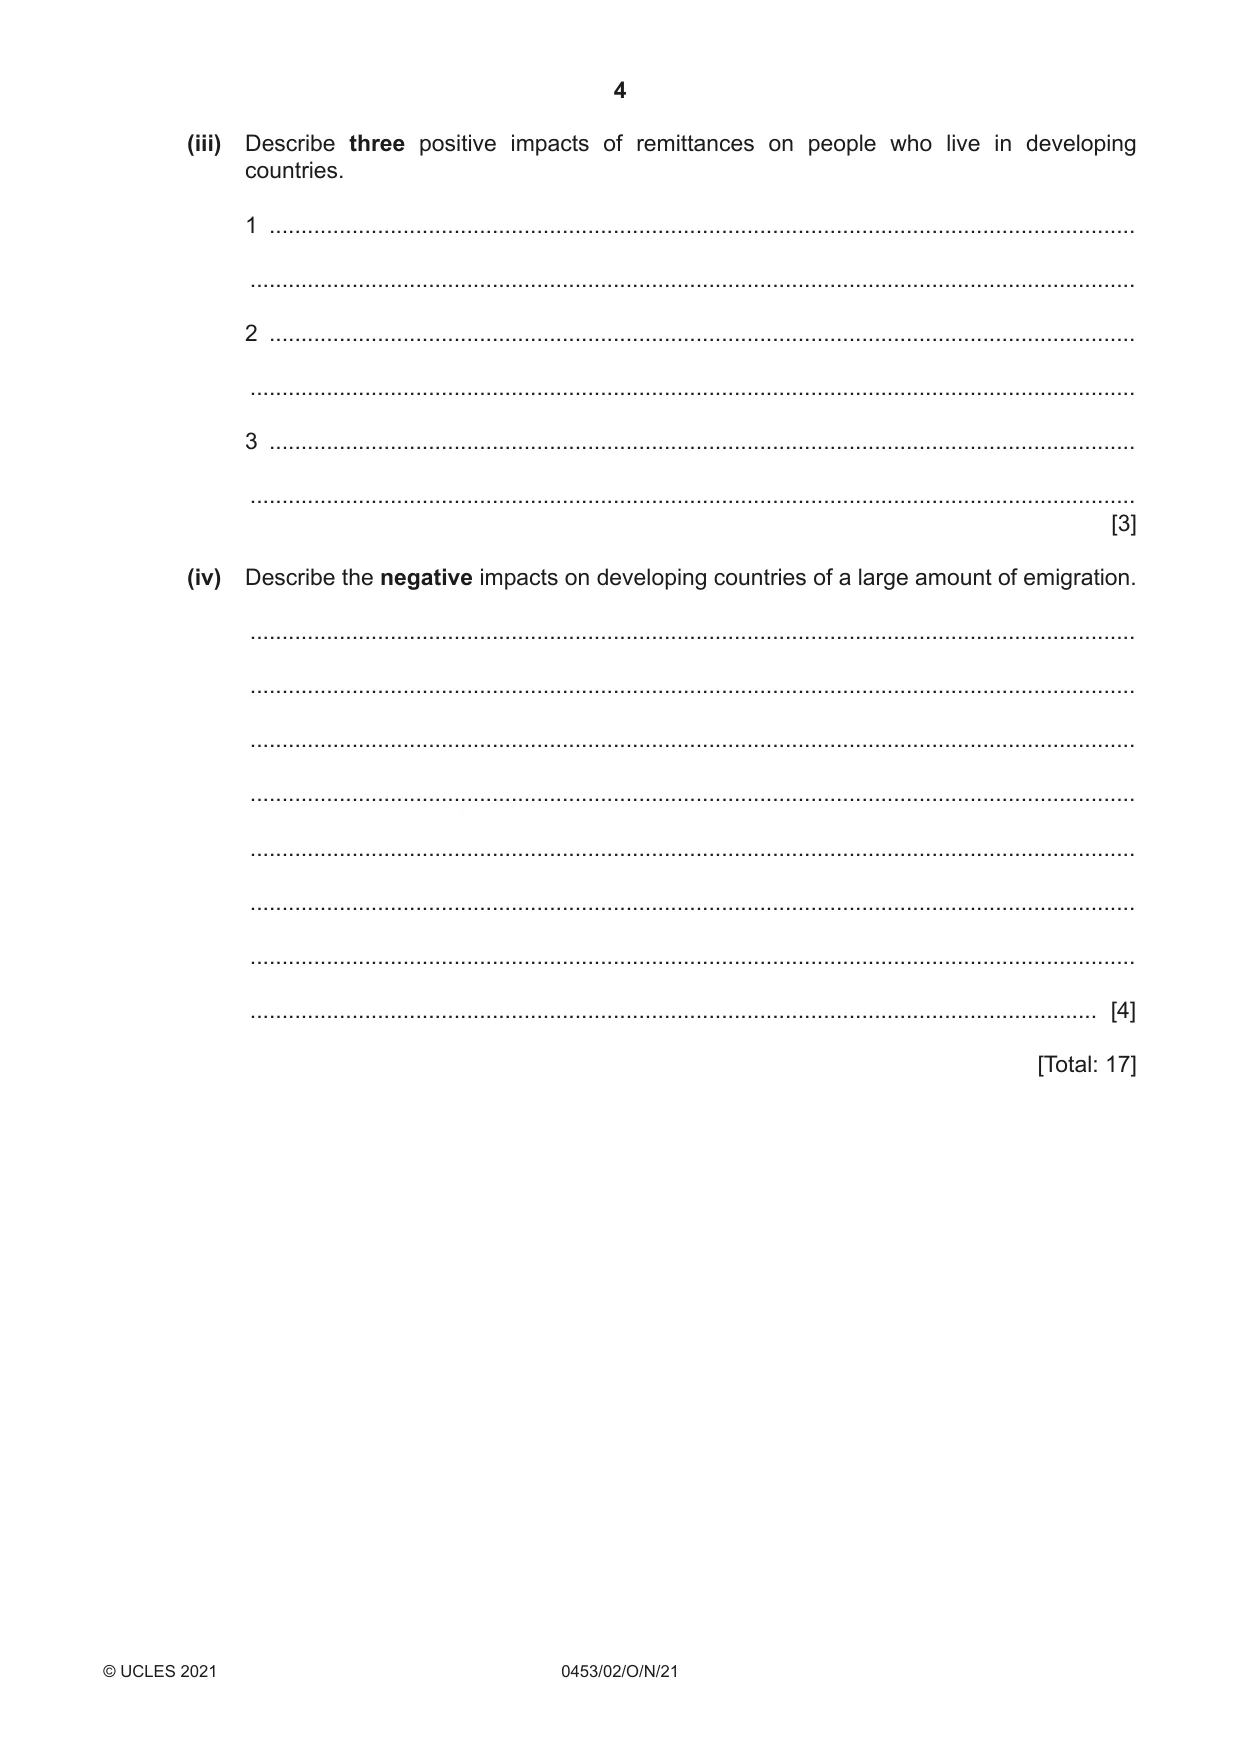
4 0453/02/O/N/21 © UCLES 2021 (iii) Describe three positive impacts of remittances on people who live in developing countries. 1 … … 2 … … 3 … … [3] (iv) Describe the negative impacts on developing countries of a large amount of emigration. … … … … … … … … [4] [Total: 17]
Question paper, page 5
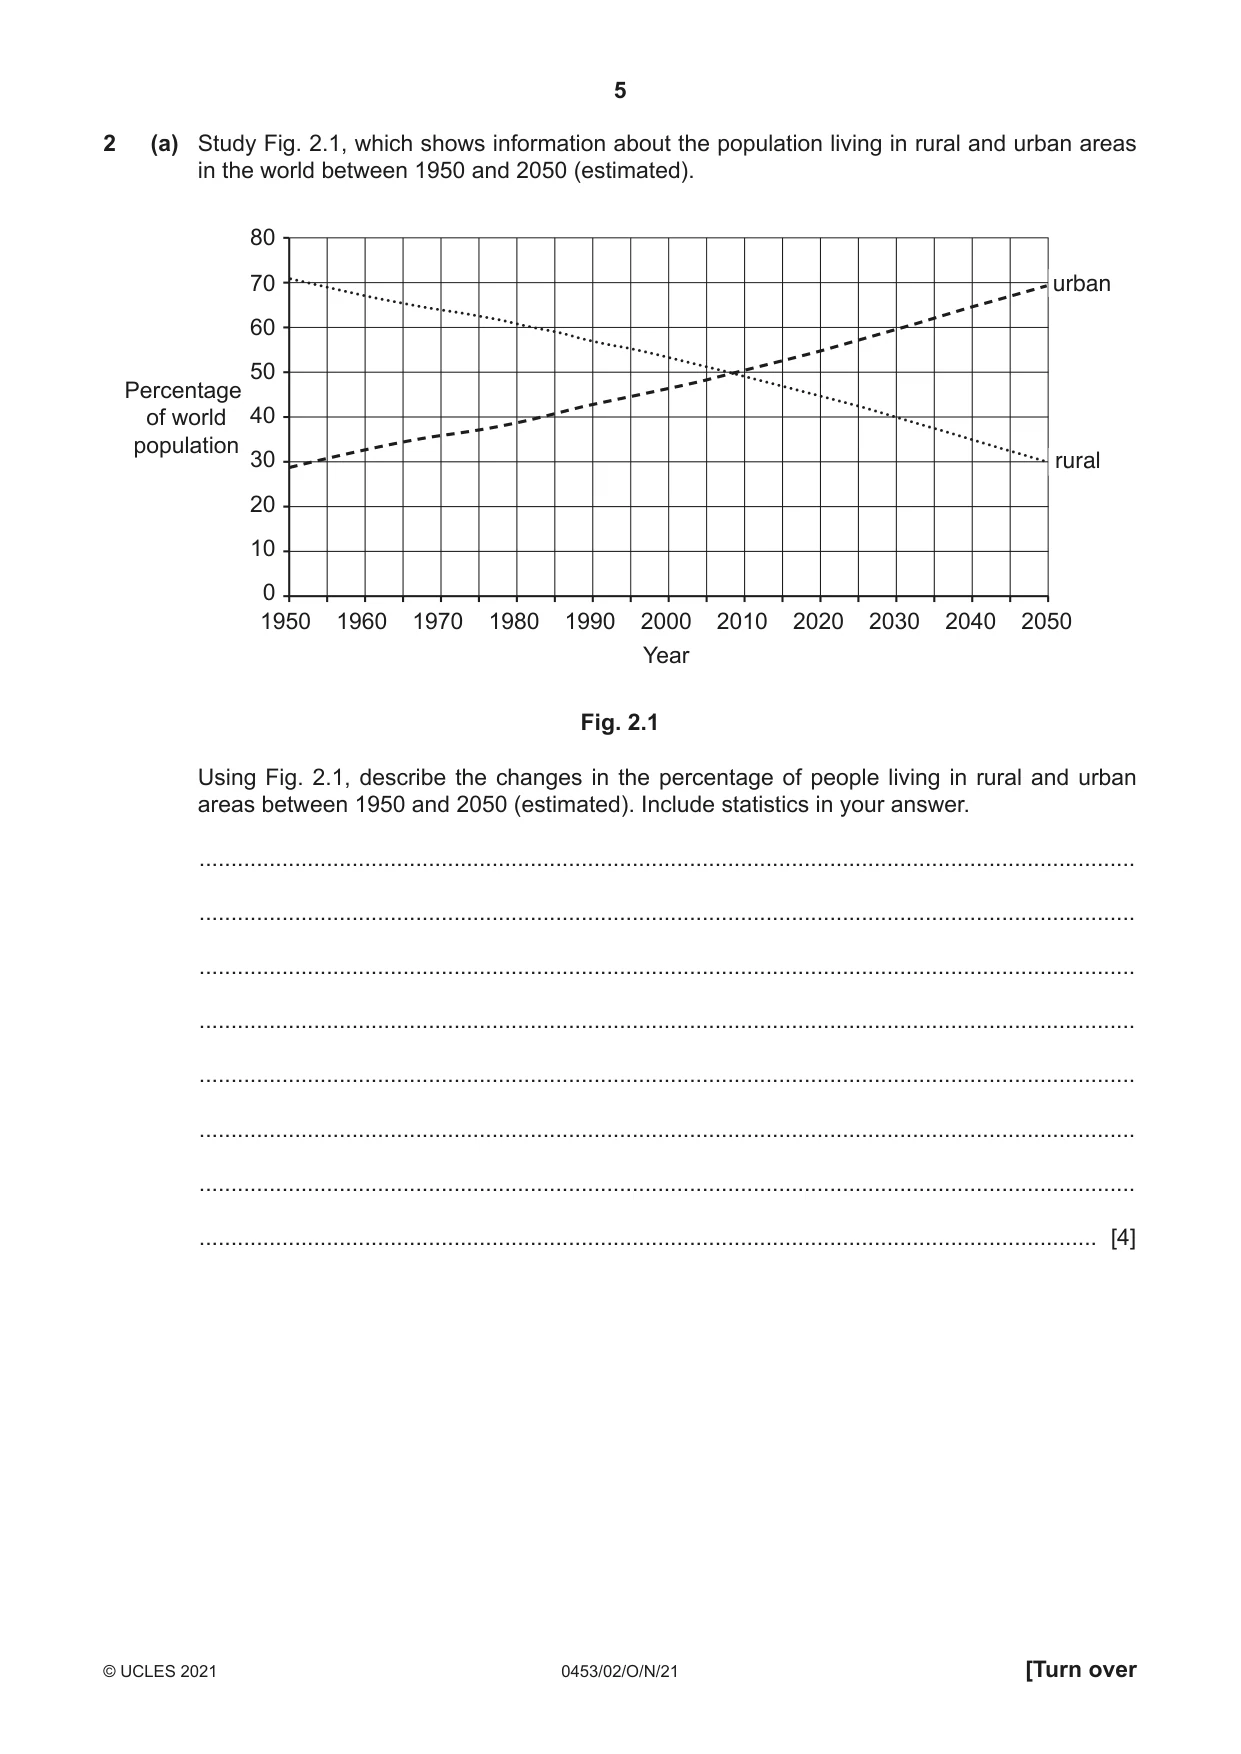
5 0453/02/O/N/21 © UCLES 2021 [Turn over 2 (a) Study Fig. 2.1, which shows information about the population living in rural and urban areas in the world between 1950 and 2050 (estimated). 80 70 60 50 40 30 20 10 0 1950 1960 1970 1980 1990 2000 2010 2020 2030 2040 2050 Percentage of world population Year urban rural Fig. 2.1 Using Fig. 2.1, describe the changes in the percentage of people living in rural and urban areas between 1950 and 2050 (estimated). Include statistics in your answer. … … … … … … … … [4]
Question paper, page 6
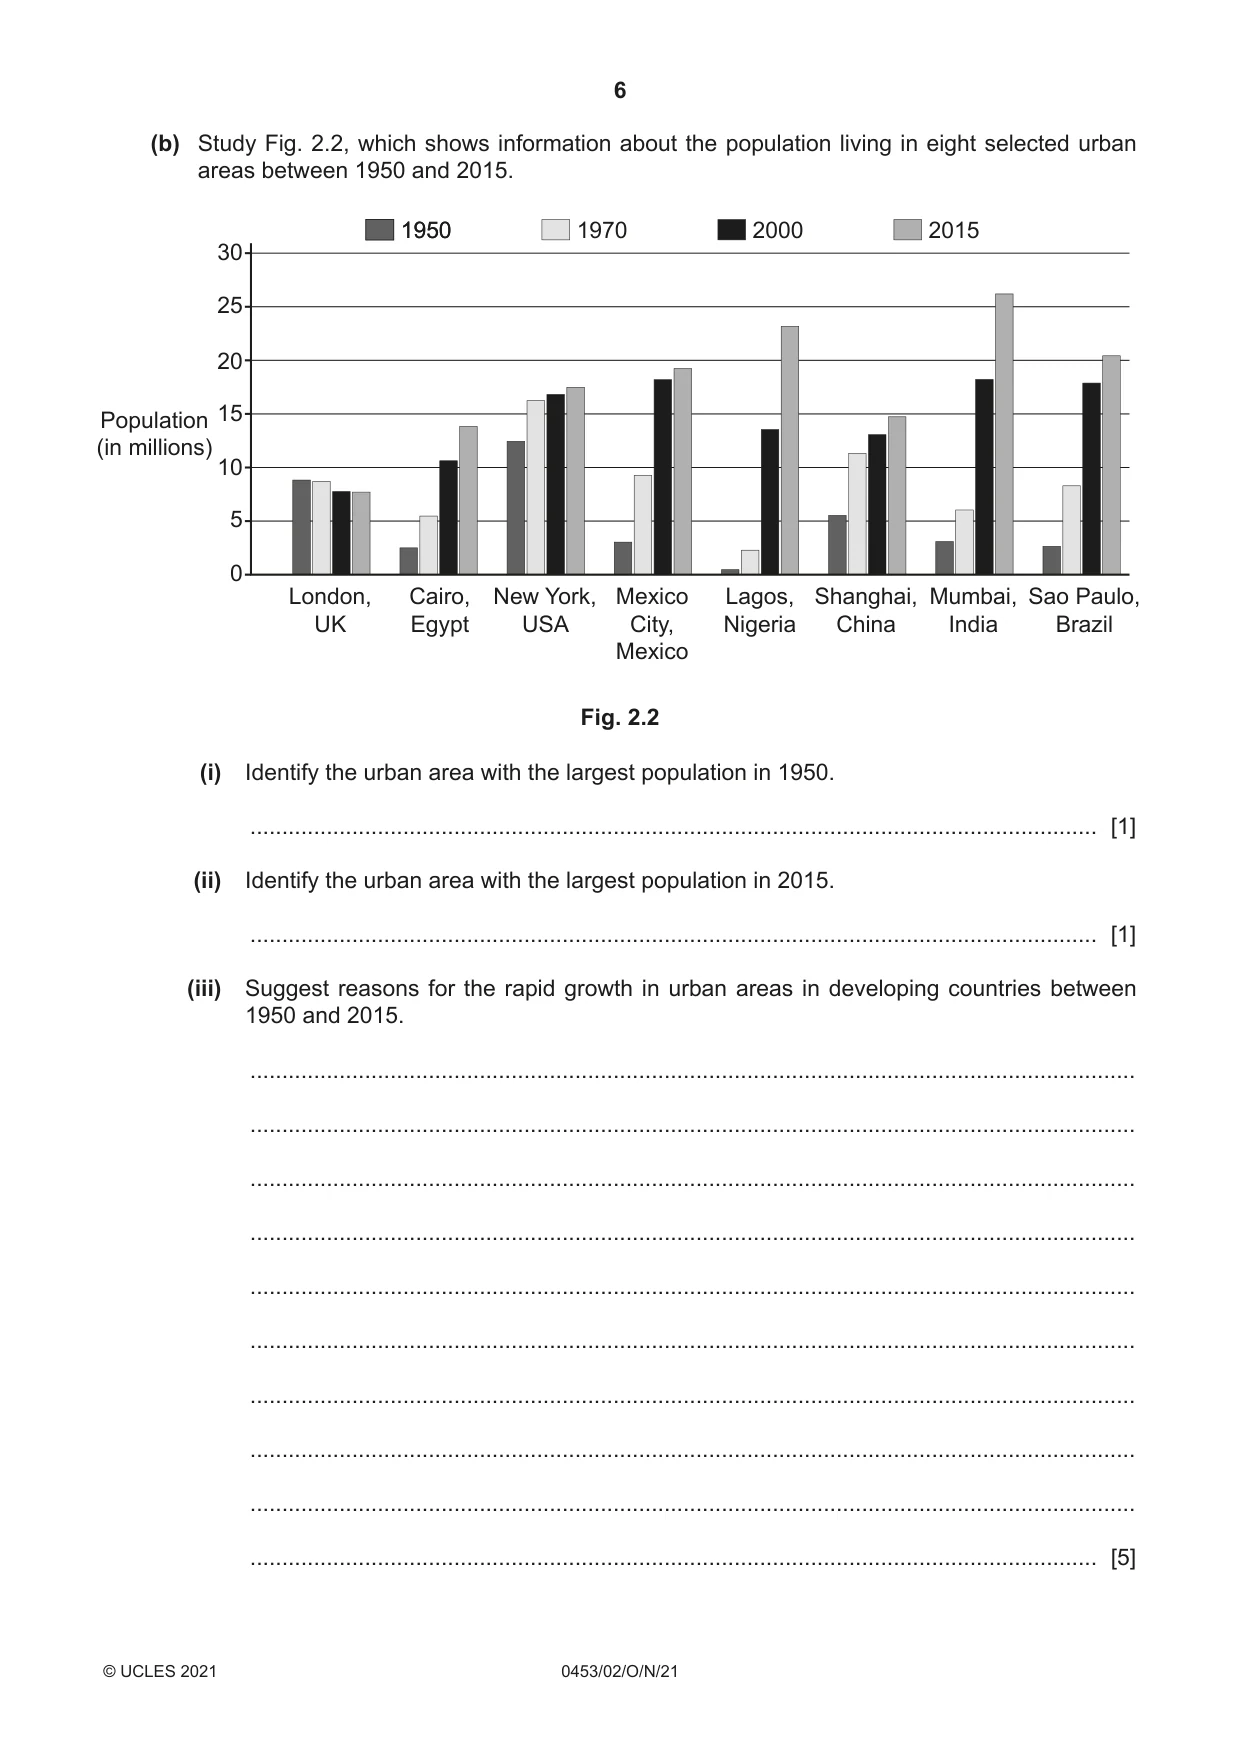
6 0453/02/O/N/21 © UCLES 2021 (b) Study Fig. 2.2, which shows information about the population living in eight selected urban areas between 1950 and 2015. 25 30 20 15 10 5 0 Population (in millions) 1950 1950 1970 2000 2015 London, UK Cairo, Egypt New York, USA Mexico City, Mexico Lagos, Nigeria Shanghai, China Mumbai, India Sao Paulo, Brazil Fig. 2.2 (i) Identify the urban area with the largest population in 1950. … [1] (ii) Identify the urban area with the largest population in 2015. … [1] (iii) Suggest reasons for the rapid growth in urban areas in developing countries between 1950 and 2015. … … … … … … … … … … [5]
Question paper, page 7
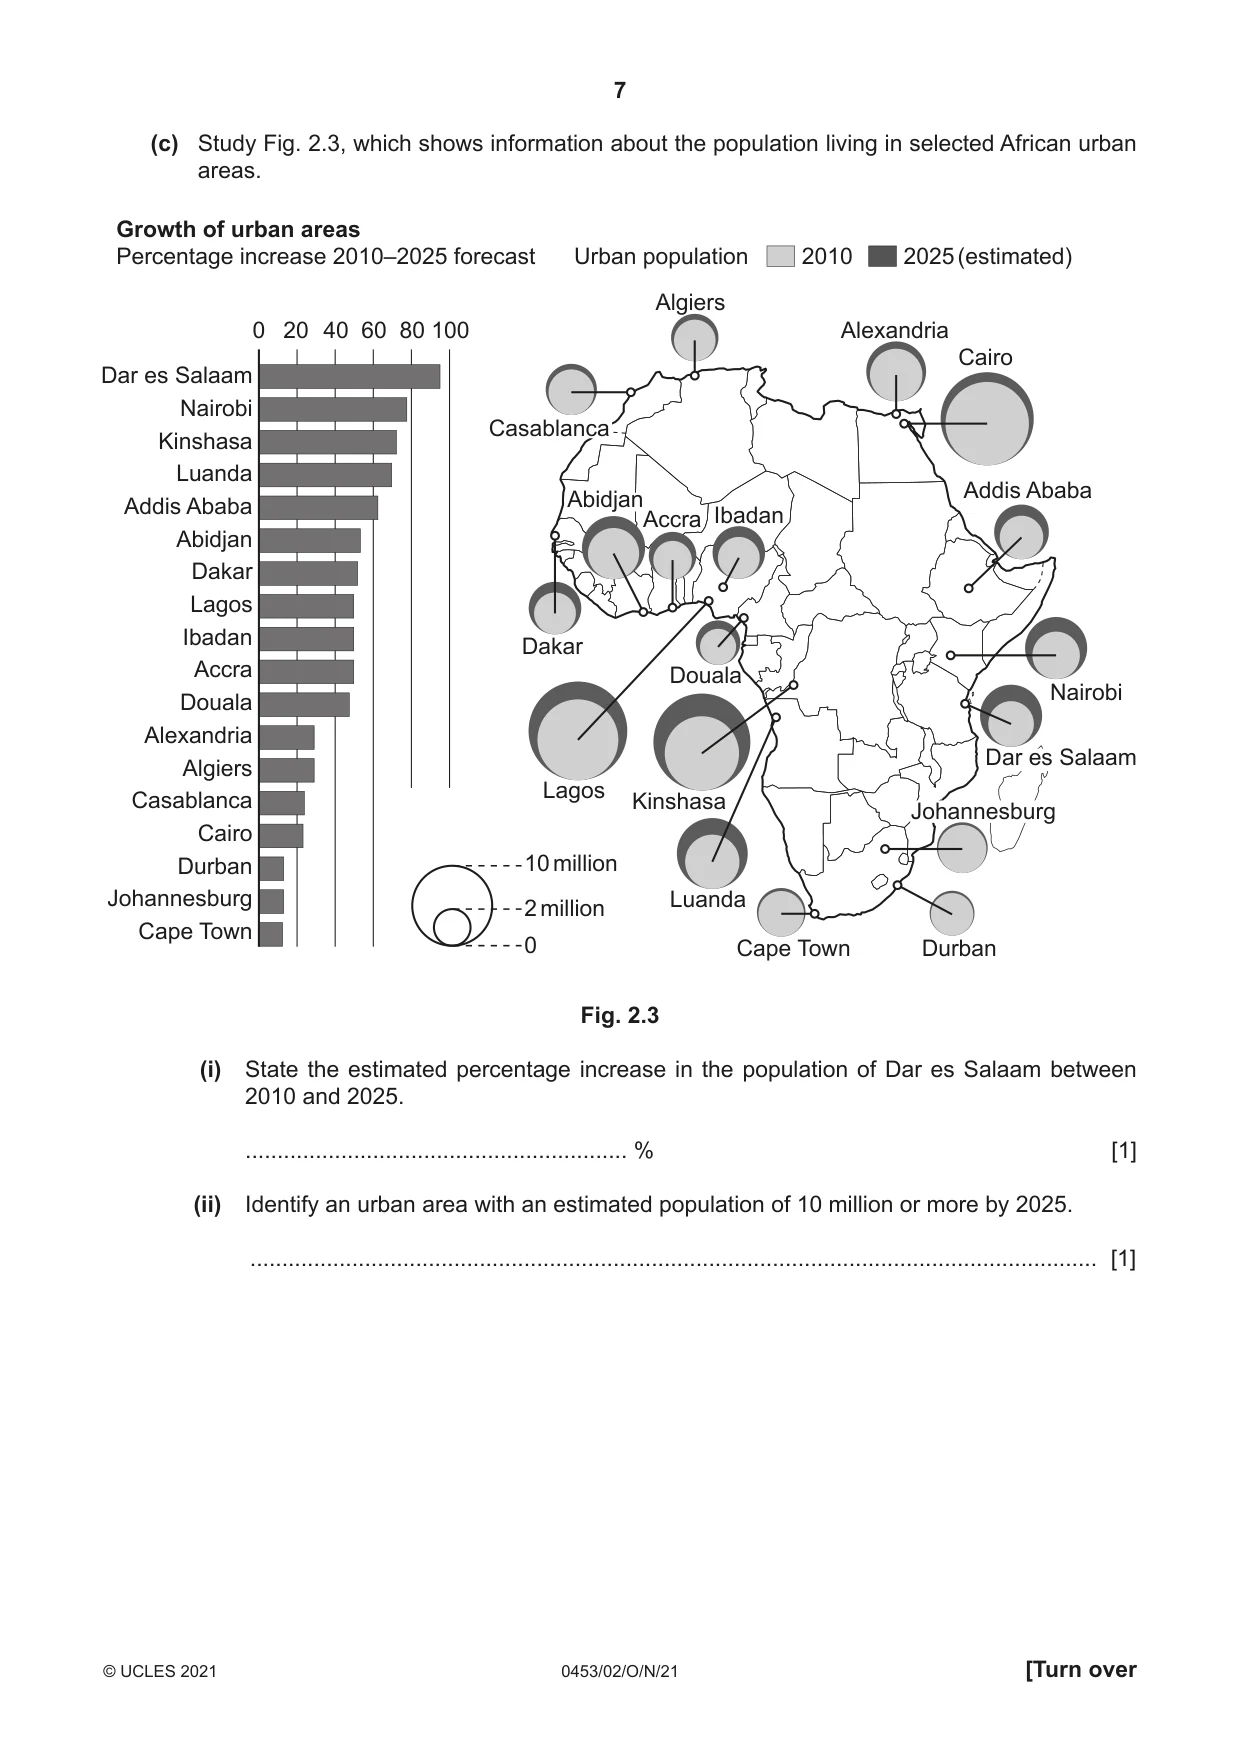
7 0453/02/O/N/21 © UCLES 2021 [Turn over (c) Study Fig. 2.3, which shows information about the population living in selected African urban areas. 10 million 2 million 0 Growth of urban areas Percentage increase 2010–2025 forecast Urban population 2010 Alexandria Cairo Addis Ababa 2025 (estimated) Casablanca Abidjan Accra Ibadan Dakar Douala Lagos Kinshasa Luanda Cape Town Durban Johannesburg Algiers Nairobi Dar es Salaam Dar es Salaam Nairobi Kinshasa Luanda Addis Ababa Abidjan Dakar Lagos Ibadan Accra Douala Alexandria Algiers Casablanca Cairo Durban Johannesburg Cape Town 0 20 40 60 80 100 Fig. 2.3 (i) State the estimated percentage increase in the population of Dar es Salaam between 2010 and 2025. … % [1] (ii) Identify an urban area with an estimated population of 10 million or more by 2025. … [1]
Question paper, page 8
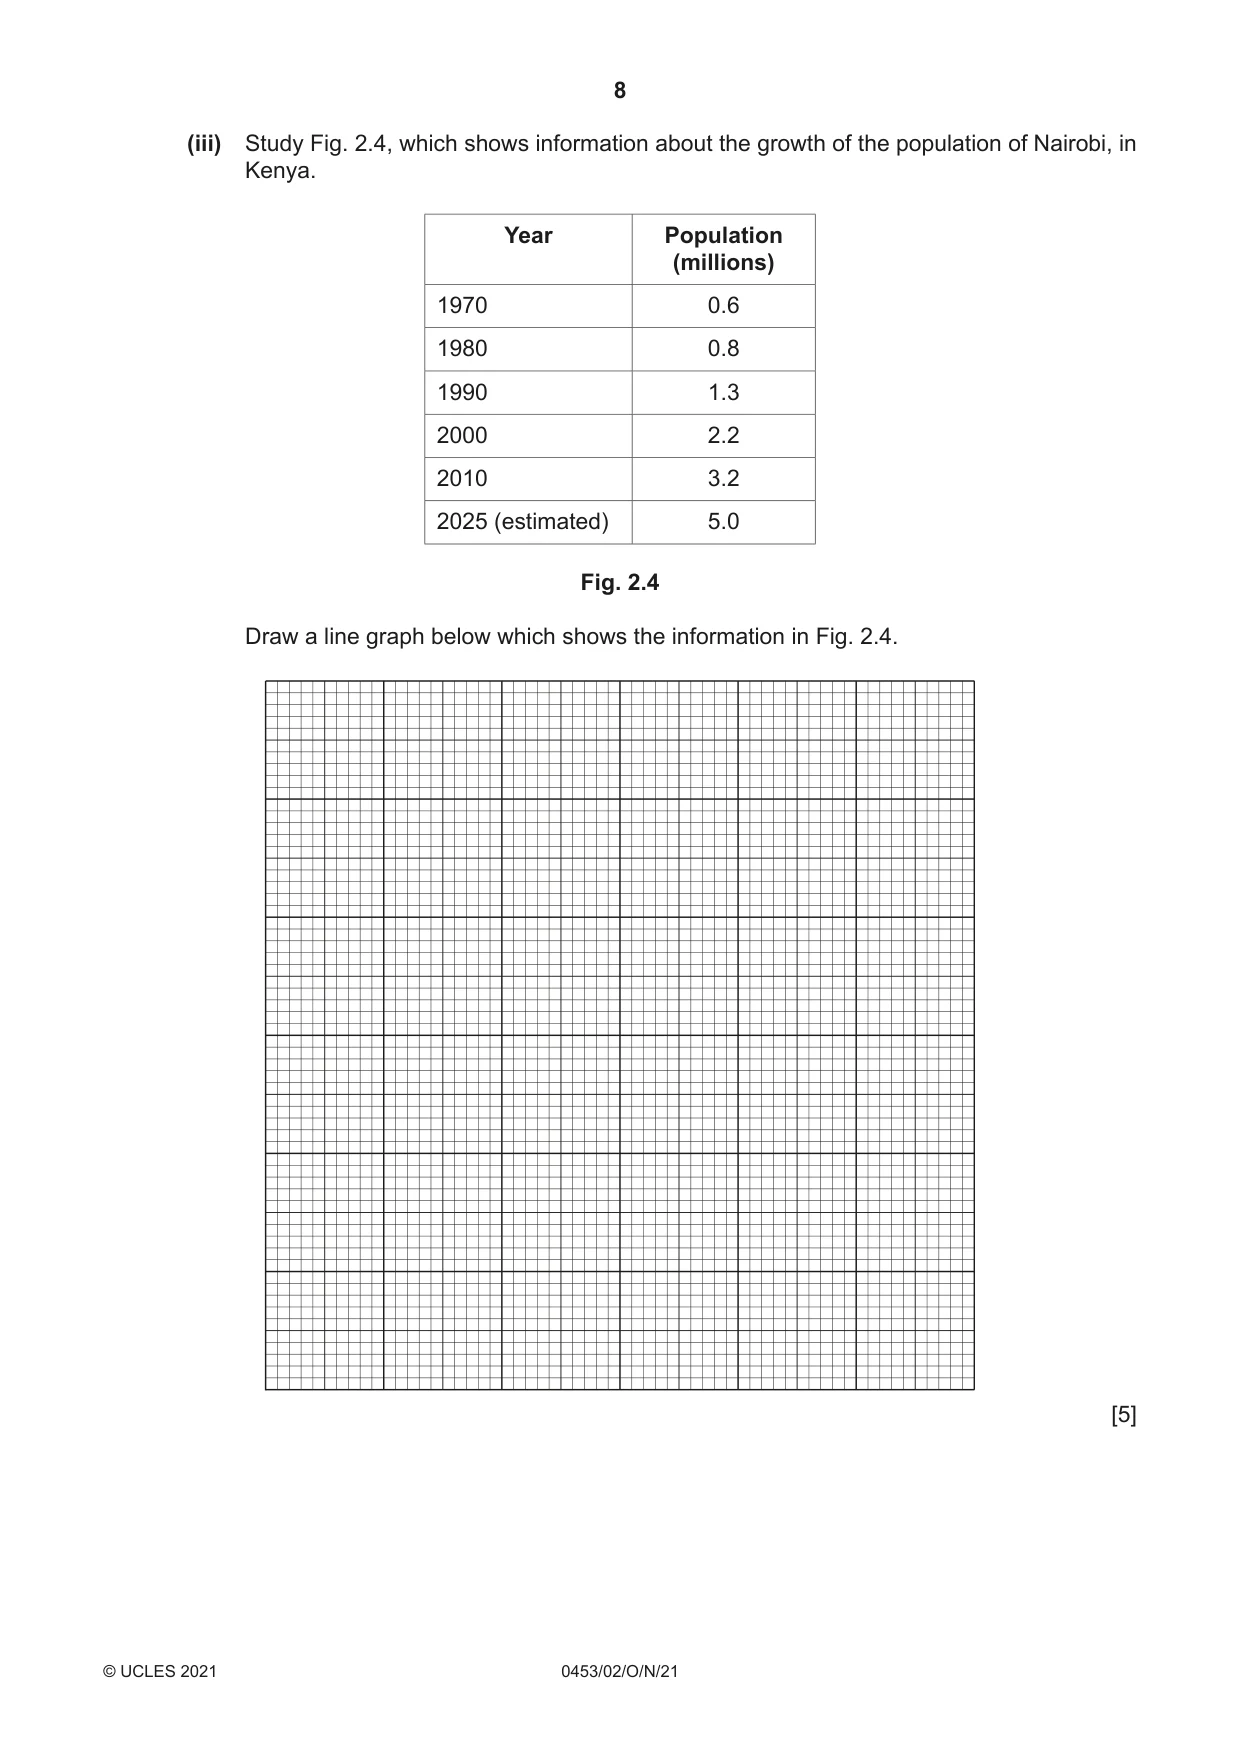
8 0453/02/O/N/21 © UCLES 2021 (iii) Study Fig. 2.4, which shows information about the growth of the population of Nairobi, in Kenya. Year Population (millions) 1970 0.6 1980 0.8 1990 1.3 2000 2.2 2010 3.2 2025 (estimated) 5.0 Fig. 2.4 Draw a line graph below which shows the information in Fig. 2.4. [5]
Question paper, page 9
9 0453/02/O/N/21 © UCLES 2021 [Turn over Question 2(d) starts on page 10.
Question paper, page 10
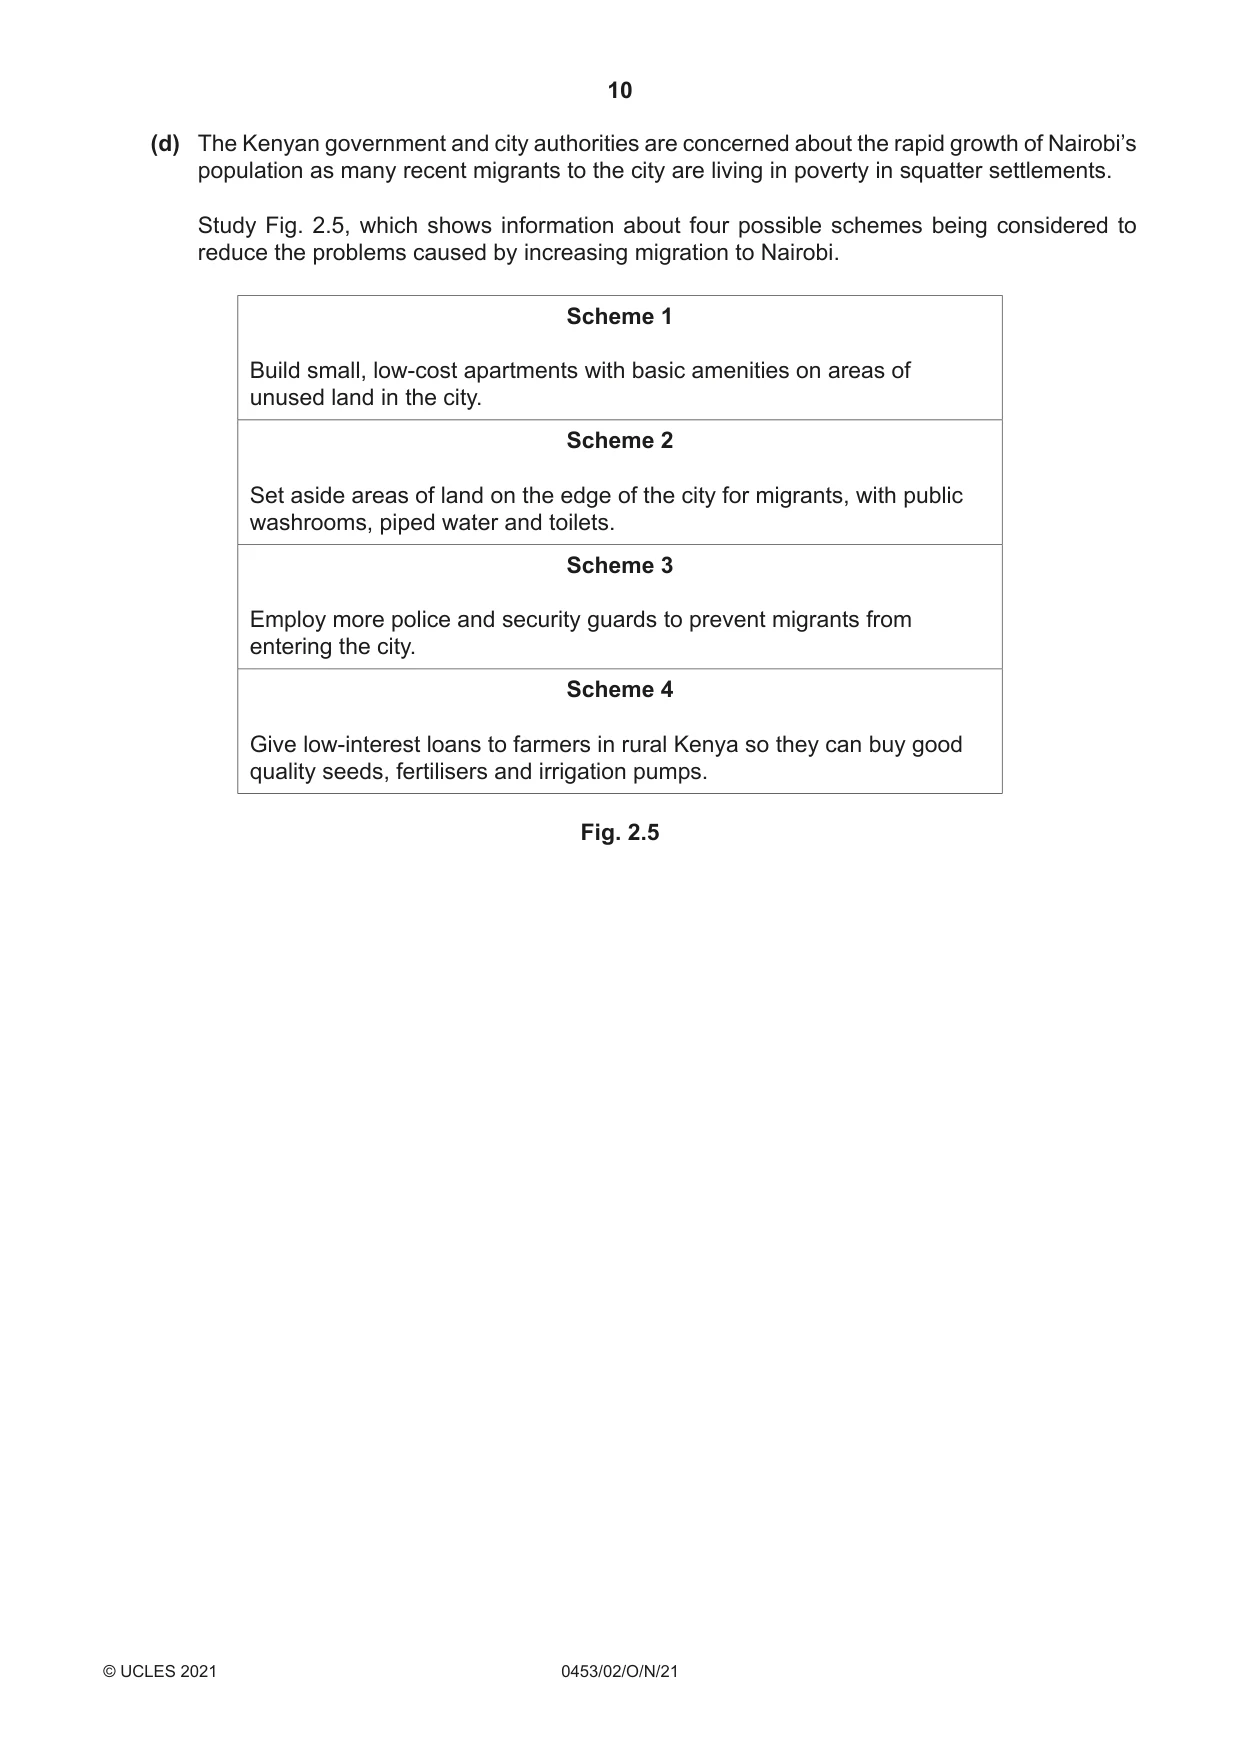
10 0453/02/O/N/21 © UCLES 2021 (d) The Kenyan government and city authorities are concerned about the rapid growth of Nairobi’s population as many recent migrants to the city are living in poverty in squatter settlements. Study Fig. 2.5, which shows information about four possible schemes being considered to reduce the problems caused by increasing migration to Nairobi. Scheme 1 Build small, low-cost apartments with basic amenities on areas of unused land in the city. Scheme 2 Set aside areas of land on the edge of the city for migrants, with public washrooms, piped water and toilets. Scheme 3 Employ more police and security guards to prevent migrants from entering the city. Scheme 4 Give low-interest loans to farmers in rural Kenya so they can buy good quality seeds, fertilisers and irrigation pumps. Fig. 2.5
Question paper, page 11
11 0453/02/O/N/21 © UCLES 2021 [Turn over Choose the scheme which you think will be most likely to reduce the problems caused by migration to Nairobi. Explain your reasons for choosing this scheme. You should do this by describing the advantages of the scheme you have chosen and the disadvantages of the schemes you have rejected. Scheme chosen … … … … … … … … … … … … … … … [7] [Total: 25]
Question paper, page 12
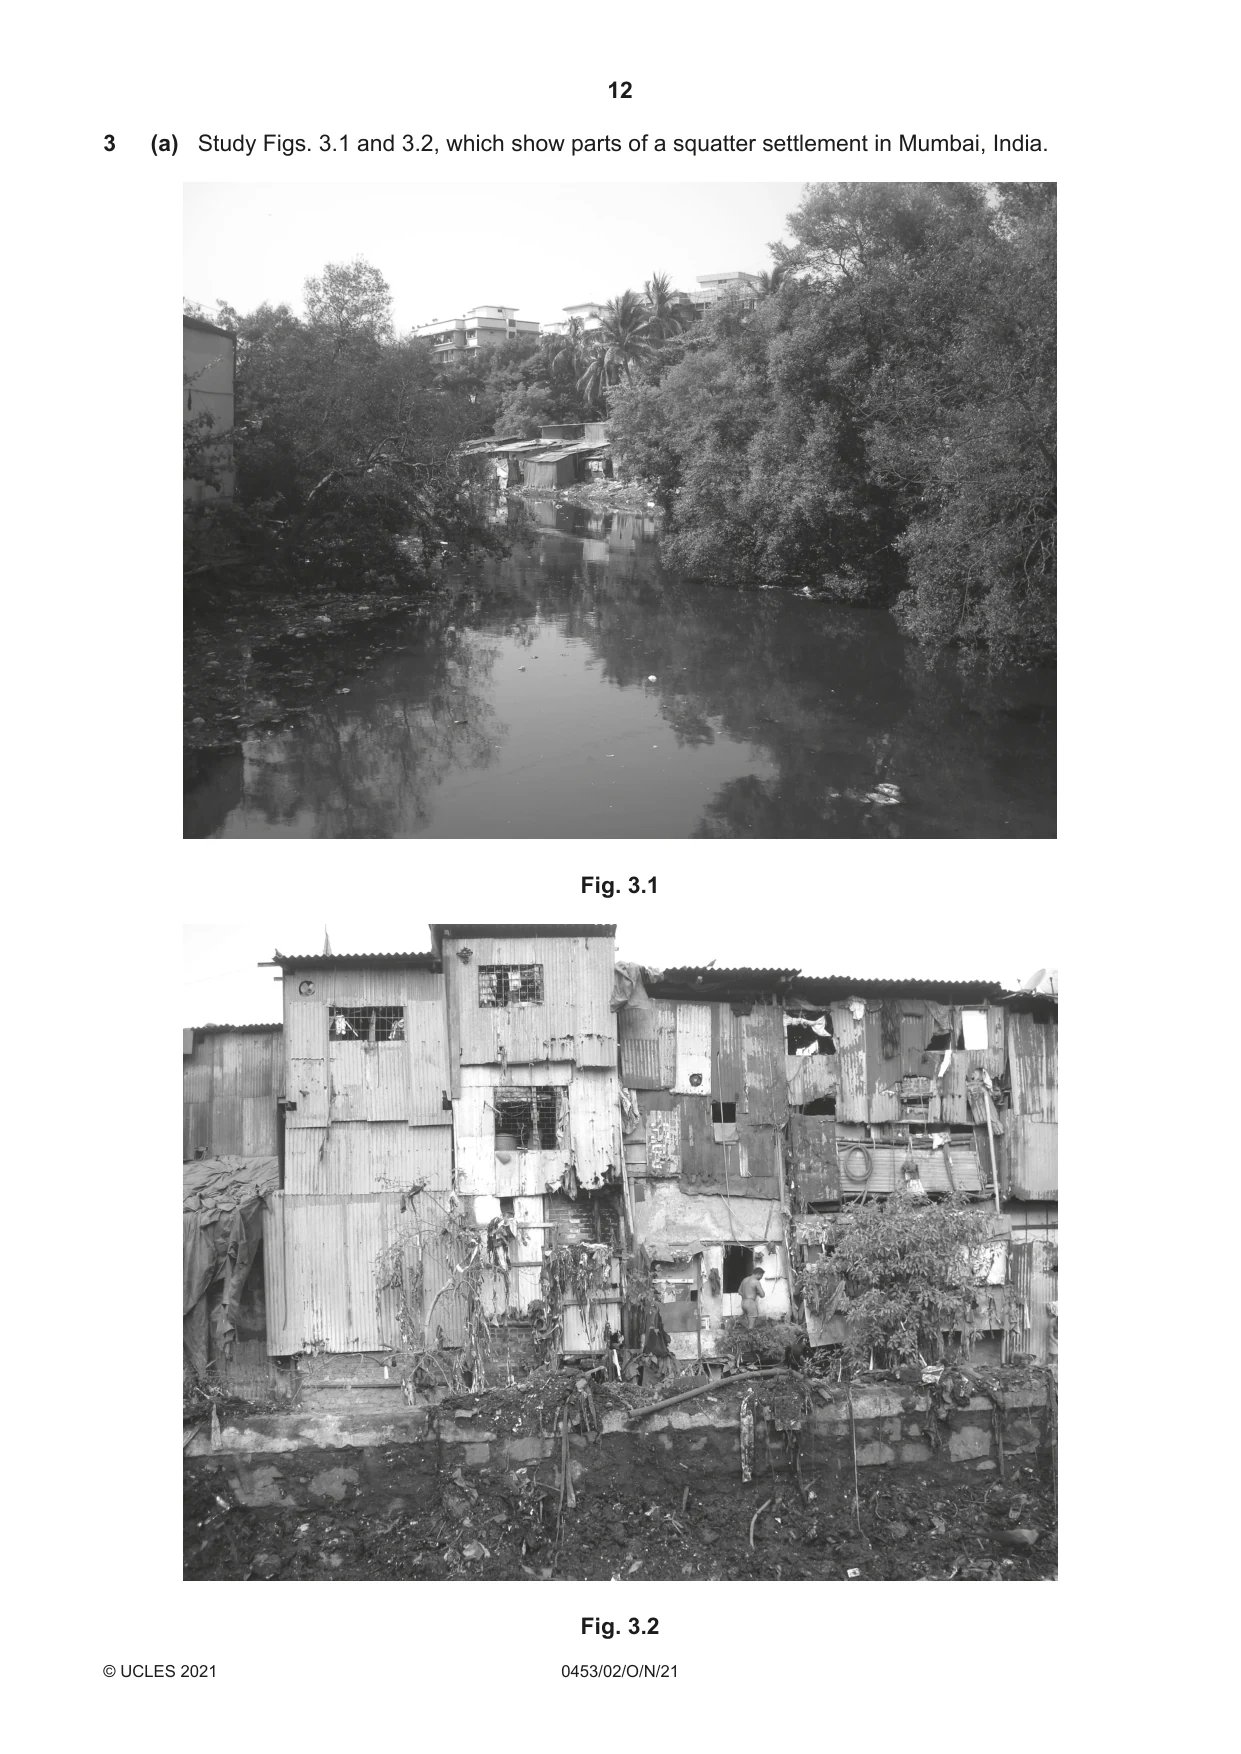
12 0453/02/O/N/21 © UCLES 2021 3 (a) Study Figs. 3.1 and 3.2, which show parts of a squatter settlement in Mumbai, India. Fig. 3.1 Fig. 3.2
Question paper, page 13
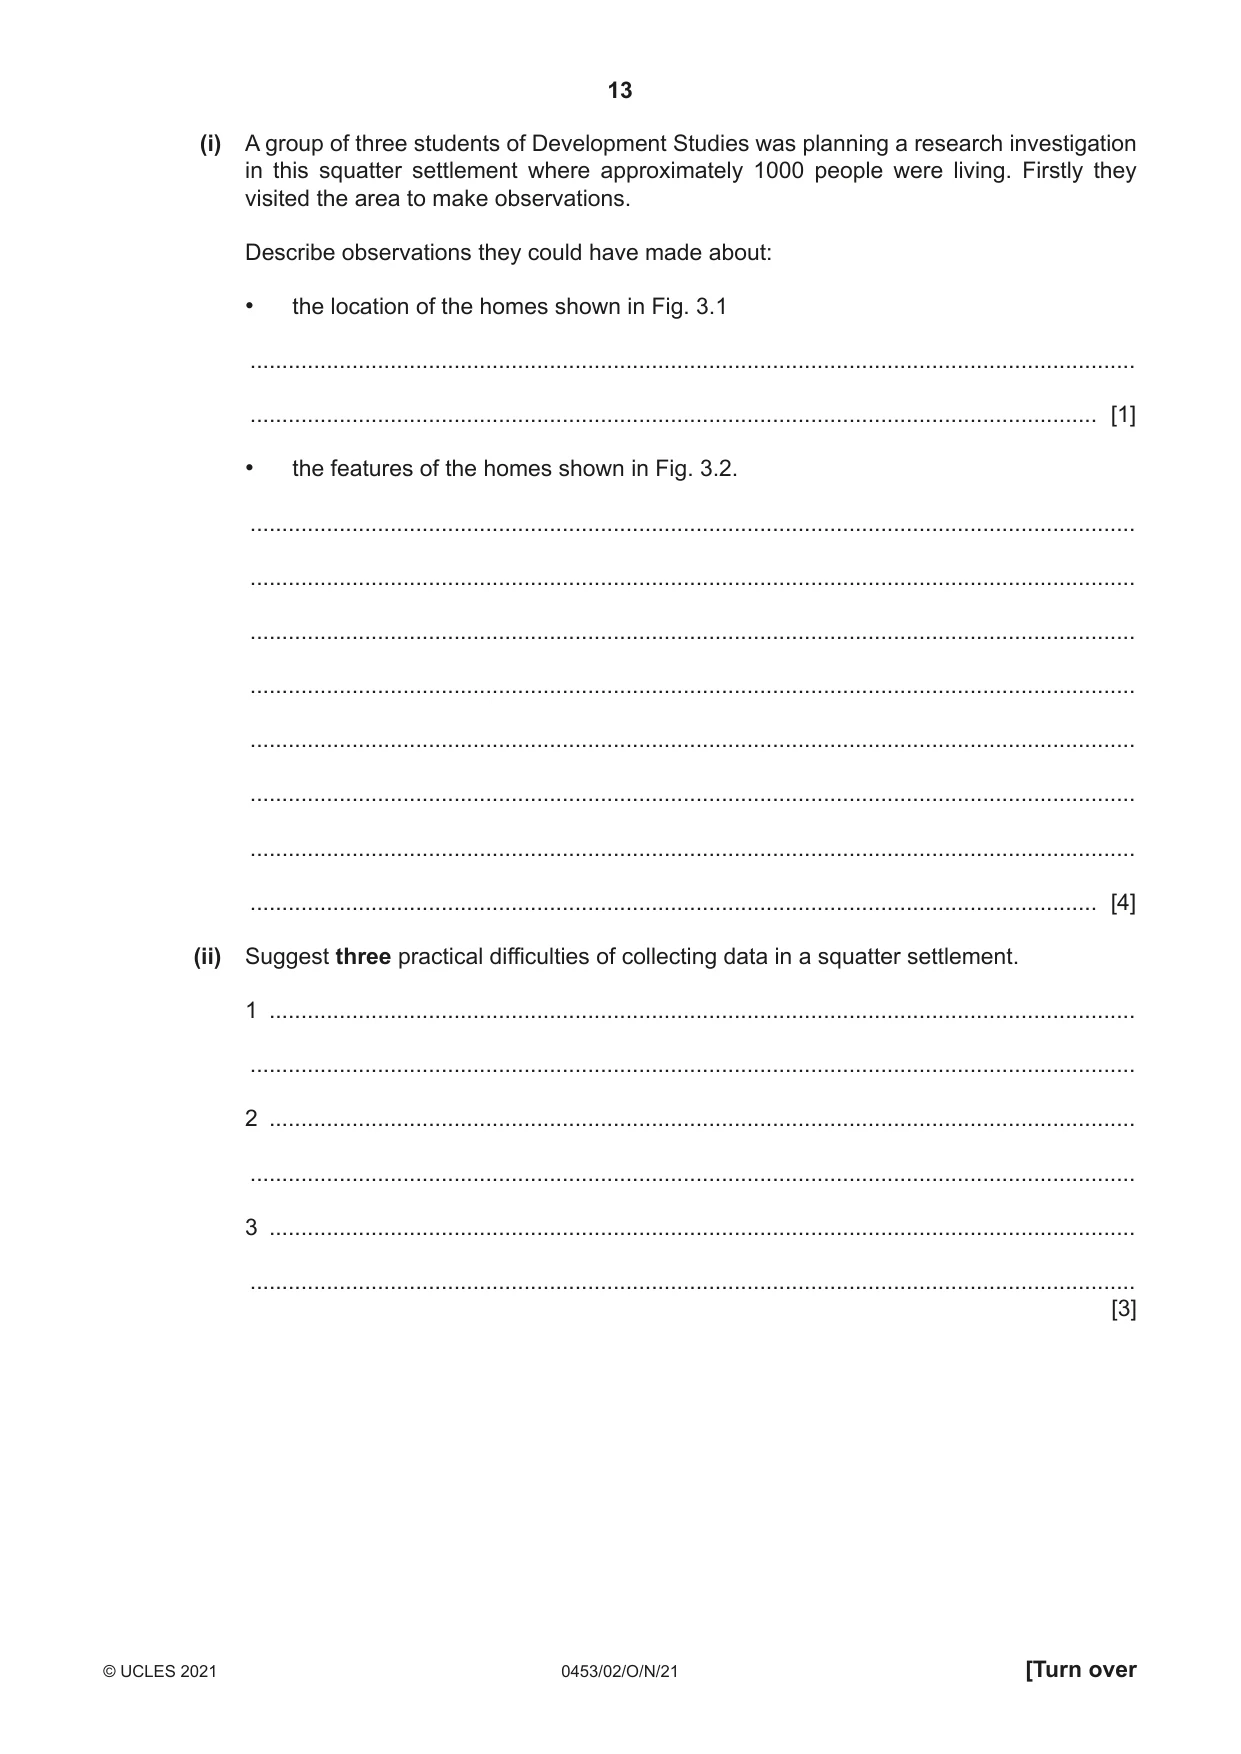
13 0453/02/O/N/21 © UCLES 2021 [Turn over (i) A group of three students of Development Studies was planning a research investigation in this squatter settlement where approximately 1000 people were living. Firstly they visited the area to make observations. Describe observations they could have made about: • the location of the homes shown in Fig. 3.1 … … [1] • the features of the homes shown in Fig. 3.2. … … … … … … … … [4] (ii) Suggest three practical difficulties of collecting data in a squatter settlement. 1 … … 2 … … 3 … … [3]
Question paper, page 14
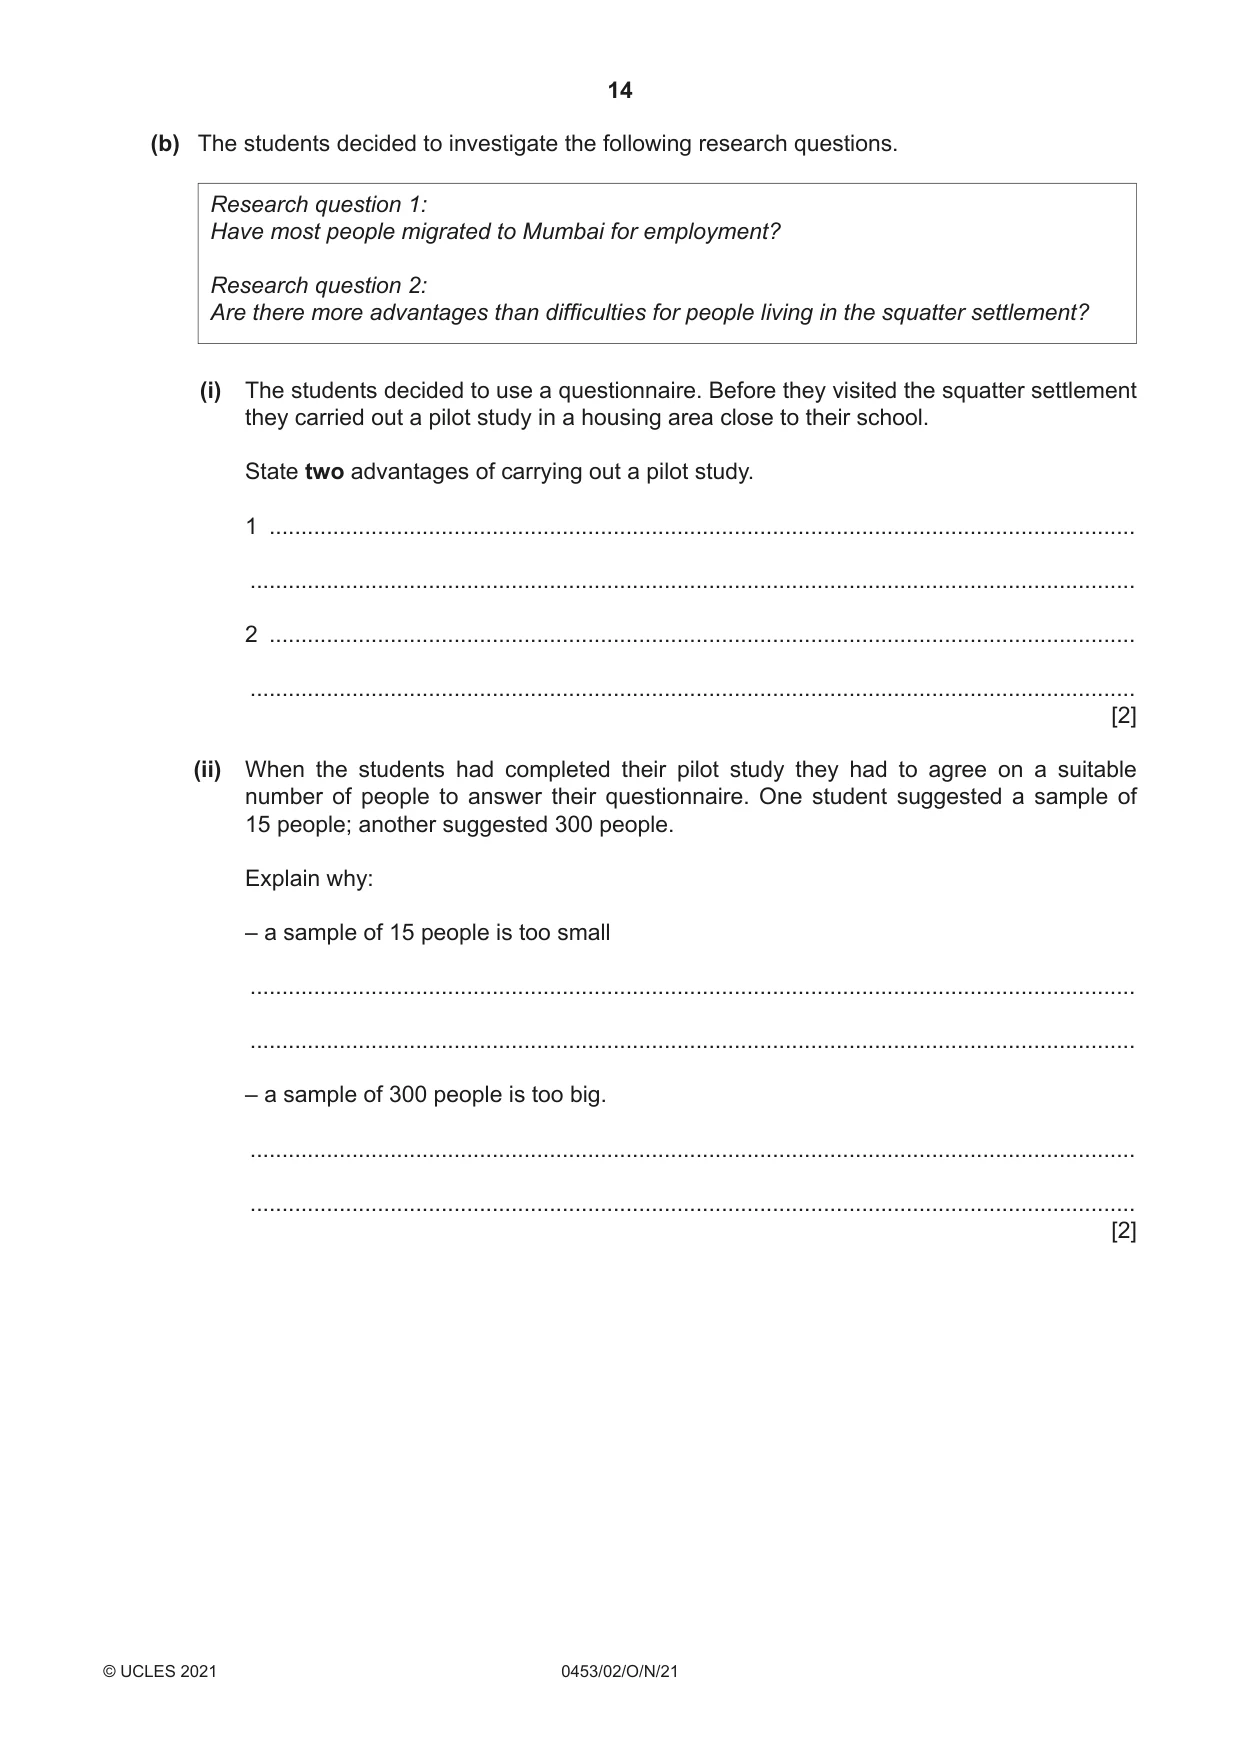
14 0453/02/O/N/21 © UCLES 2021 (b) The students decided to investigate the following research questions. Research question 1: Have most people migrated to Mumbai for employment? Research question 2: Are there more advantages than difficulties for people living in the squatter settlement? (i) The students decided to use a questionnaire. Before they visited the squatter settlement they carried out a pilot study in a housing area close to their school. State two advantages of carrying out a pilot study. 1 … … 2 … … [2] (ii) When the students had completed their pilot study they had to agree on a suitable number of people to answer their questionnaire. One student suggested a sample of 15 people; another suggested 300 people. Explain why: – a sample of 15 people is too small … … – a sample of 300 people is too big. … … [2]
Question paper, page 15
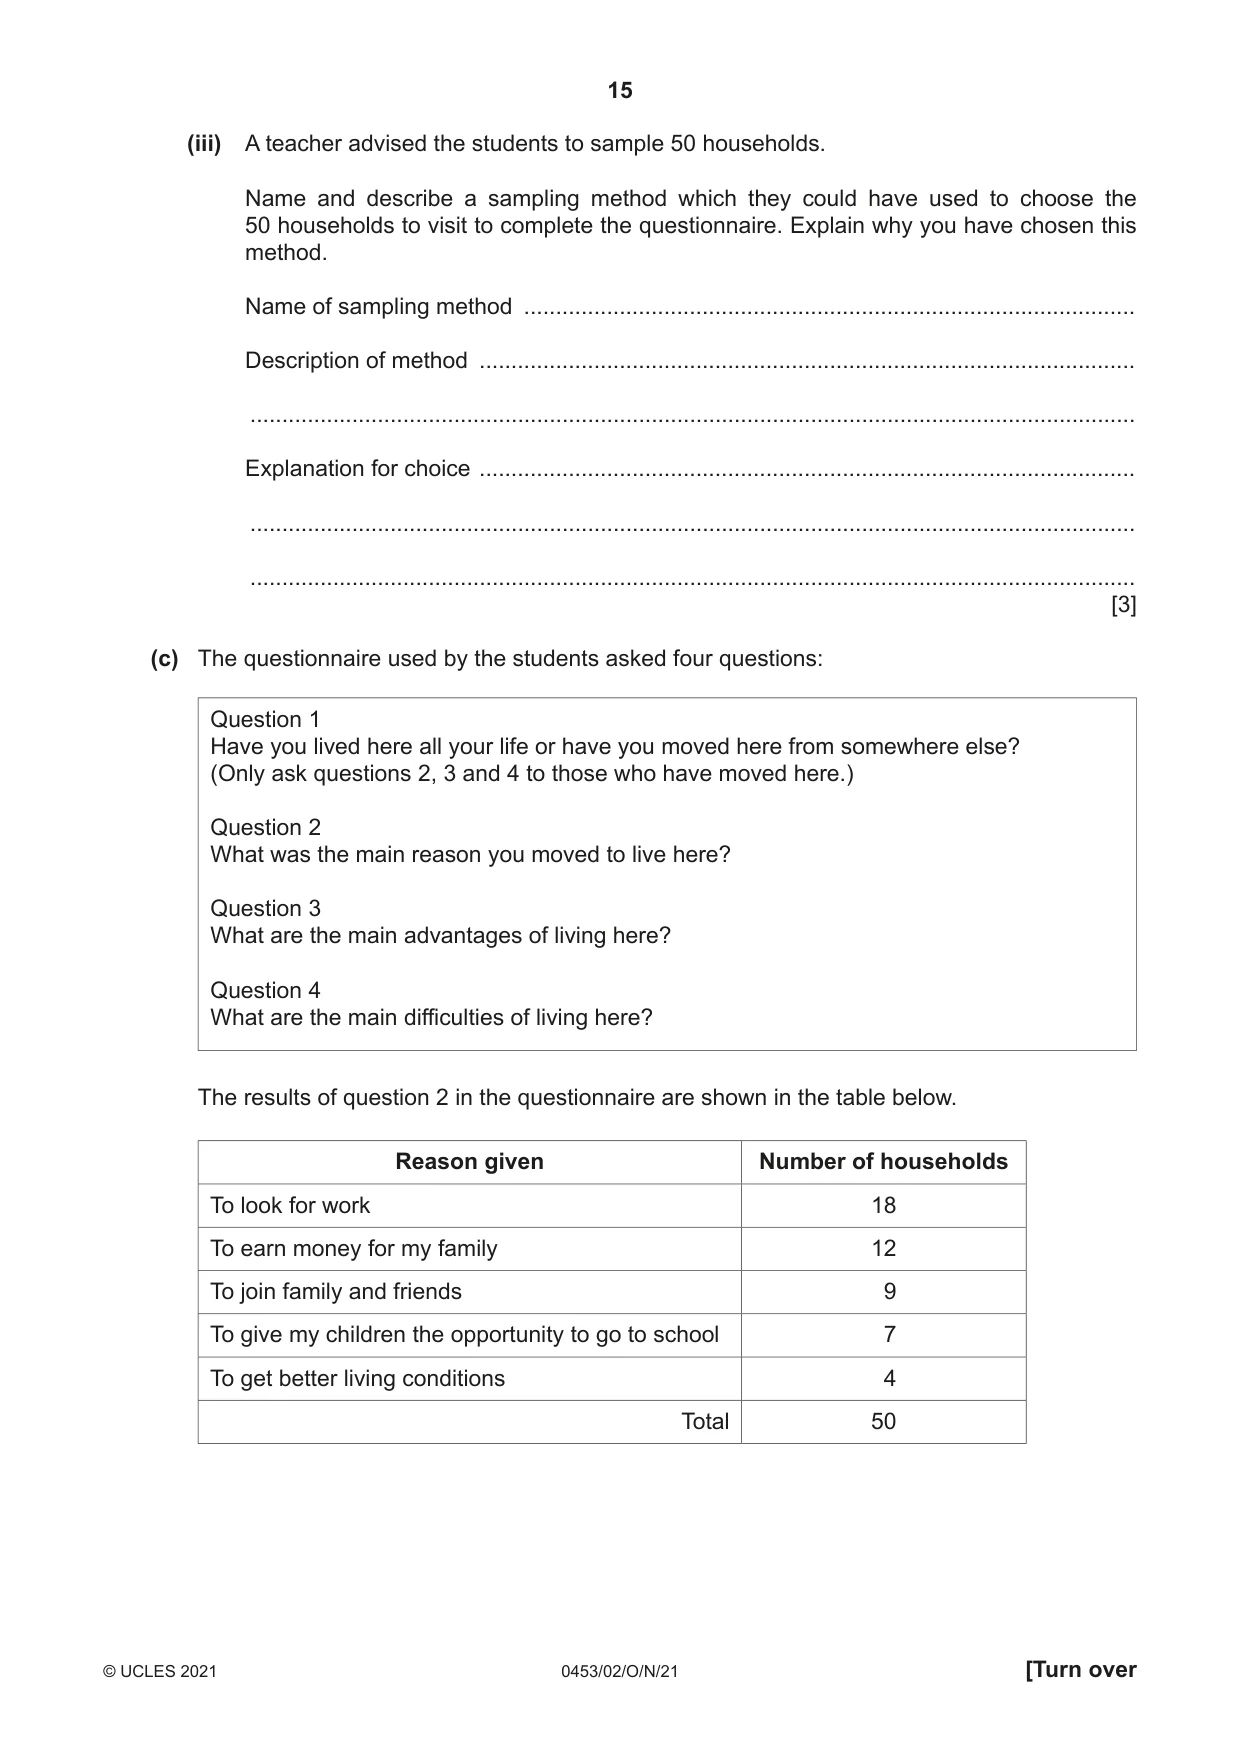
15 0453/02/O/N/21 © UCLES 2021 [Turn over (iii) A teacher advised the students to sample 50 households. Name and describe a sampling method which they could have used to choose the 50 households to visit to complete the questionnaire. Explain why you have chosen this method. Name of sampling method … Description of method … … Explanation for choice … … … [3] (c) The questionnaire used by the students asked four questions: Question 1 Have you lived here all your life or have you moved here from somewhere else? (Only ask questions 2, 3 and 4 to those who have moved here.) Question 2 What was the main reason you moved to live here? Question 3 What are the main advantages of living here? Question 4 What are the main difficulties of living here? The results of question 2 in the questionnaire are shown in the table below. Reason given Number of households To look for work 18 To earn money for my family 12 To join family and friends 9 To give my children the opportunity to go to school 7 To get better living conditions 4 Total 50
Question paper, page 16
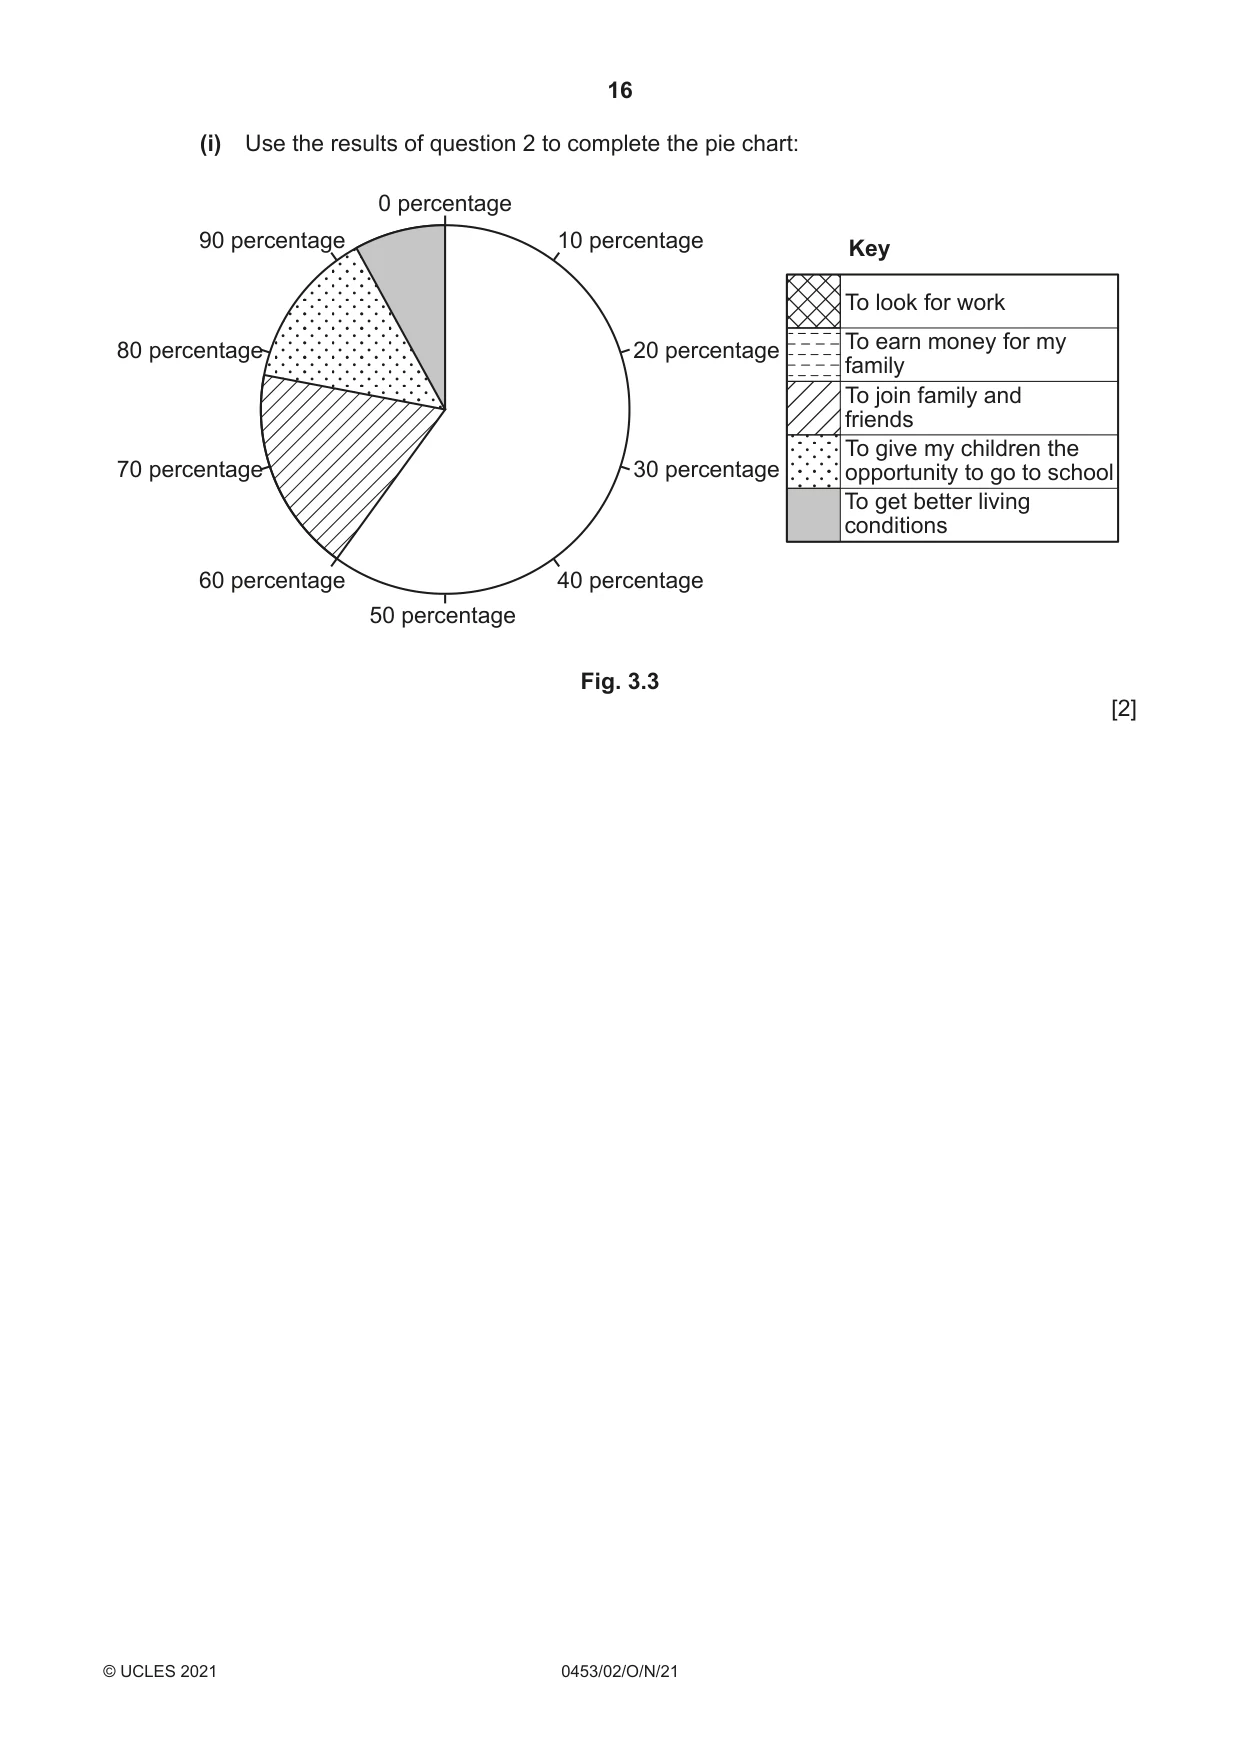
16 0453/02/O/N/21 © UCLES 2021 (i) Use the results of question 2 to complete the pie chart: Key 0 percentage 20 percentage 30 percentage 80 percentage 70 percentage 40 percentage 10 percentage 60 percentage 90 percentage 50 percentage To look for work To earn money for my family To join family and friends To give my children the opportunity to go to school To get better living conditions Fig. 3.3 [2]
Question paper, page 17
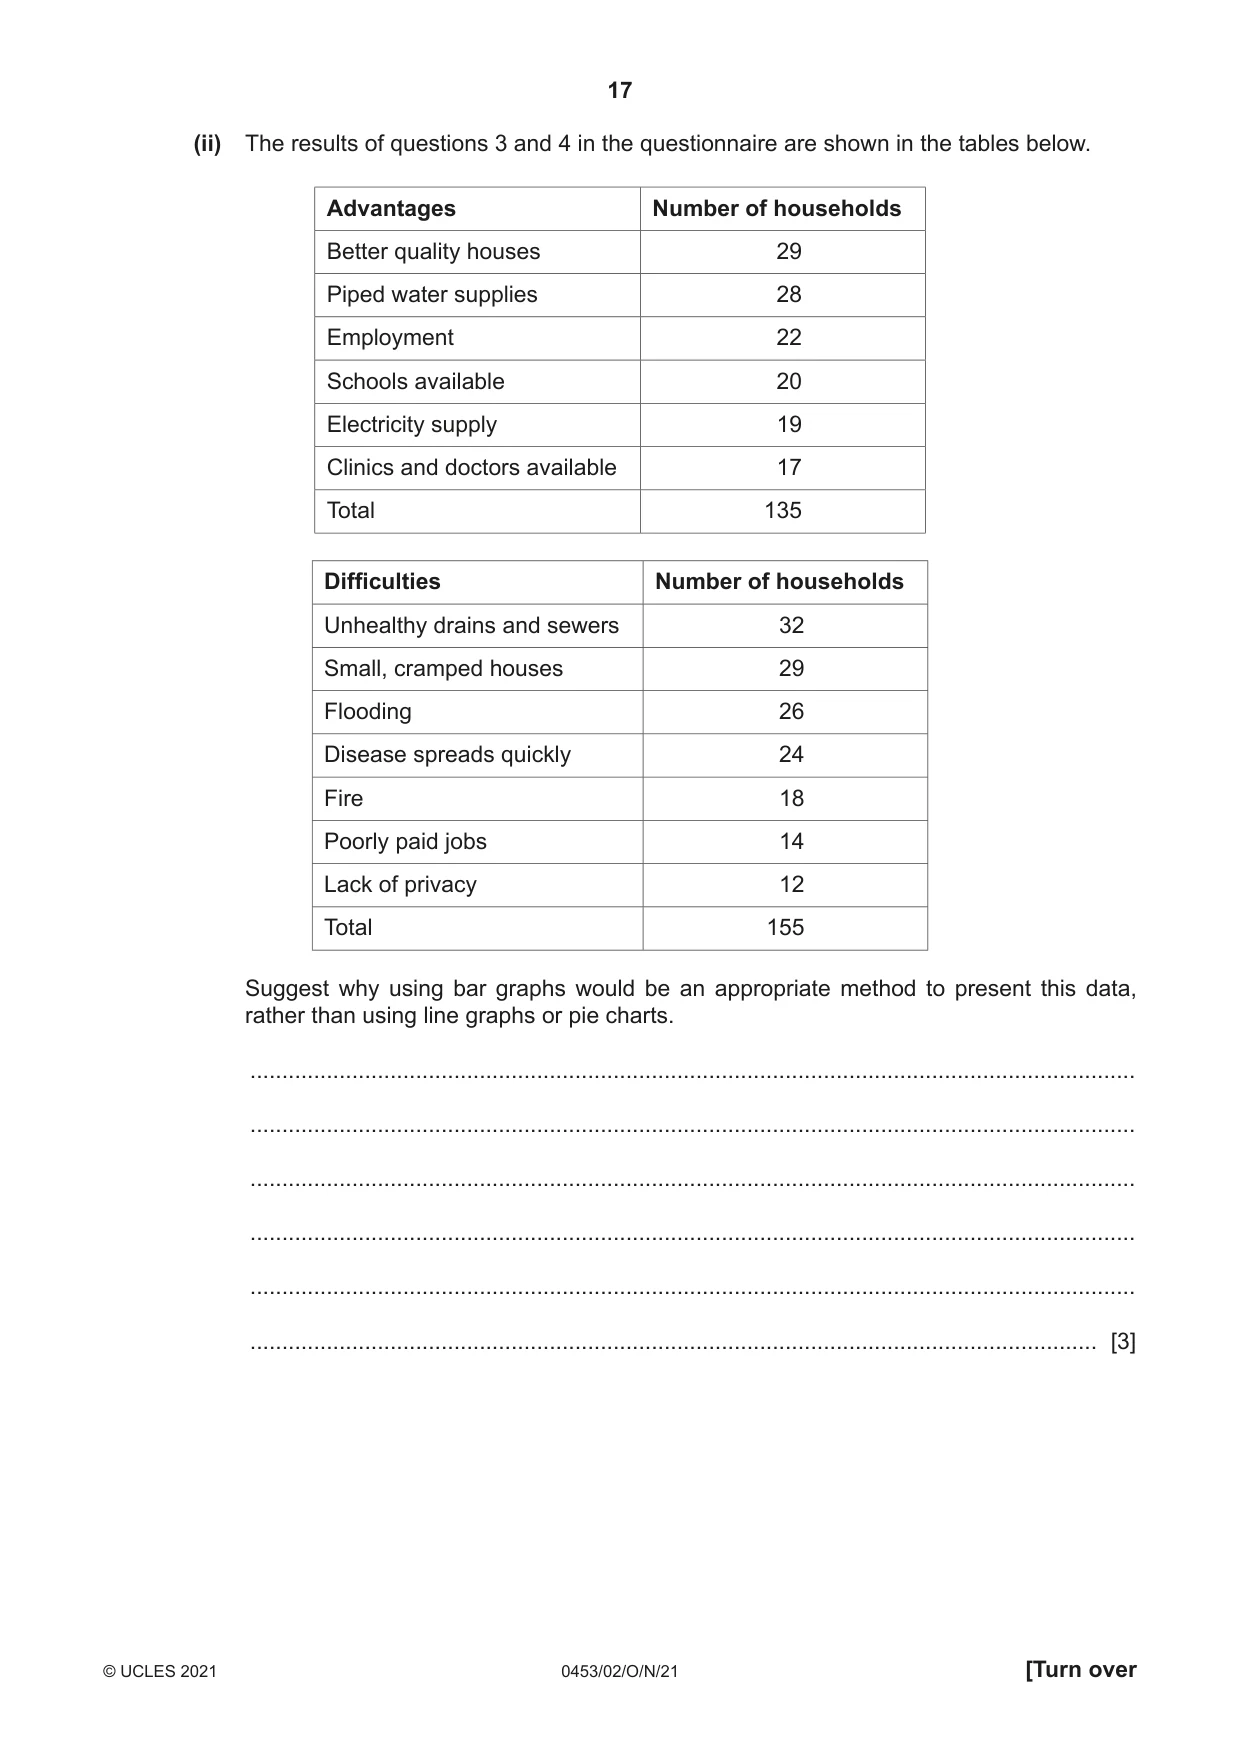
17 0453/02/O/N/21 © UCLES 2021 [Turn over (ii) The results of questions 3 and 4 in the questionnaire are shown in the tables below. Advantages Number of households Better quality houses 29 Piped water supplies 28 Employment 22 Schools available 20 Electricity supply 19 Clinics and doctors available 17 Total 135 Difficulties Number of households Unhealthy drains and sewers 32 Small, cramped houses 29 Flooding 26 Disease spreads quickly 24 Fire 18 Poorly paid jobs 14 Lack of privacy 12 Total 155 Suggest why using bar graphs would be an appropriate method to present this data, rather than using line graphs or pie charts. … … … … … … [3]
Question paper, page 18
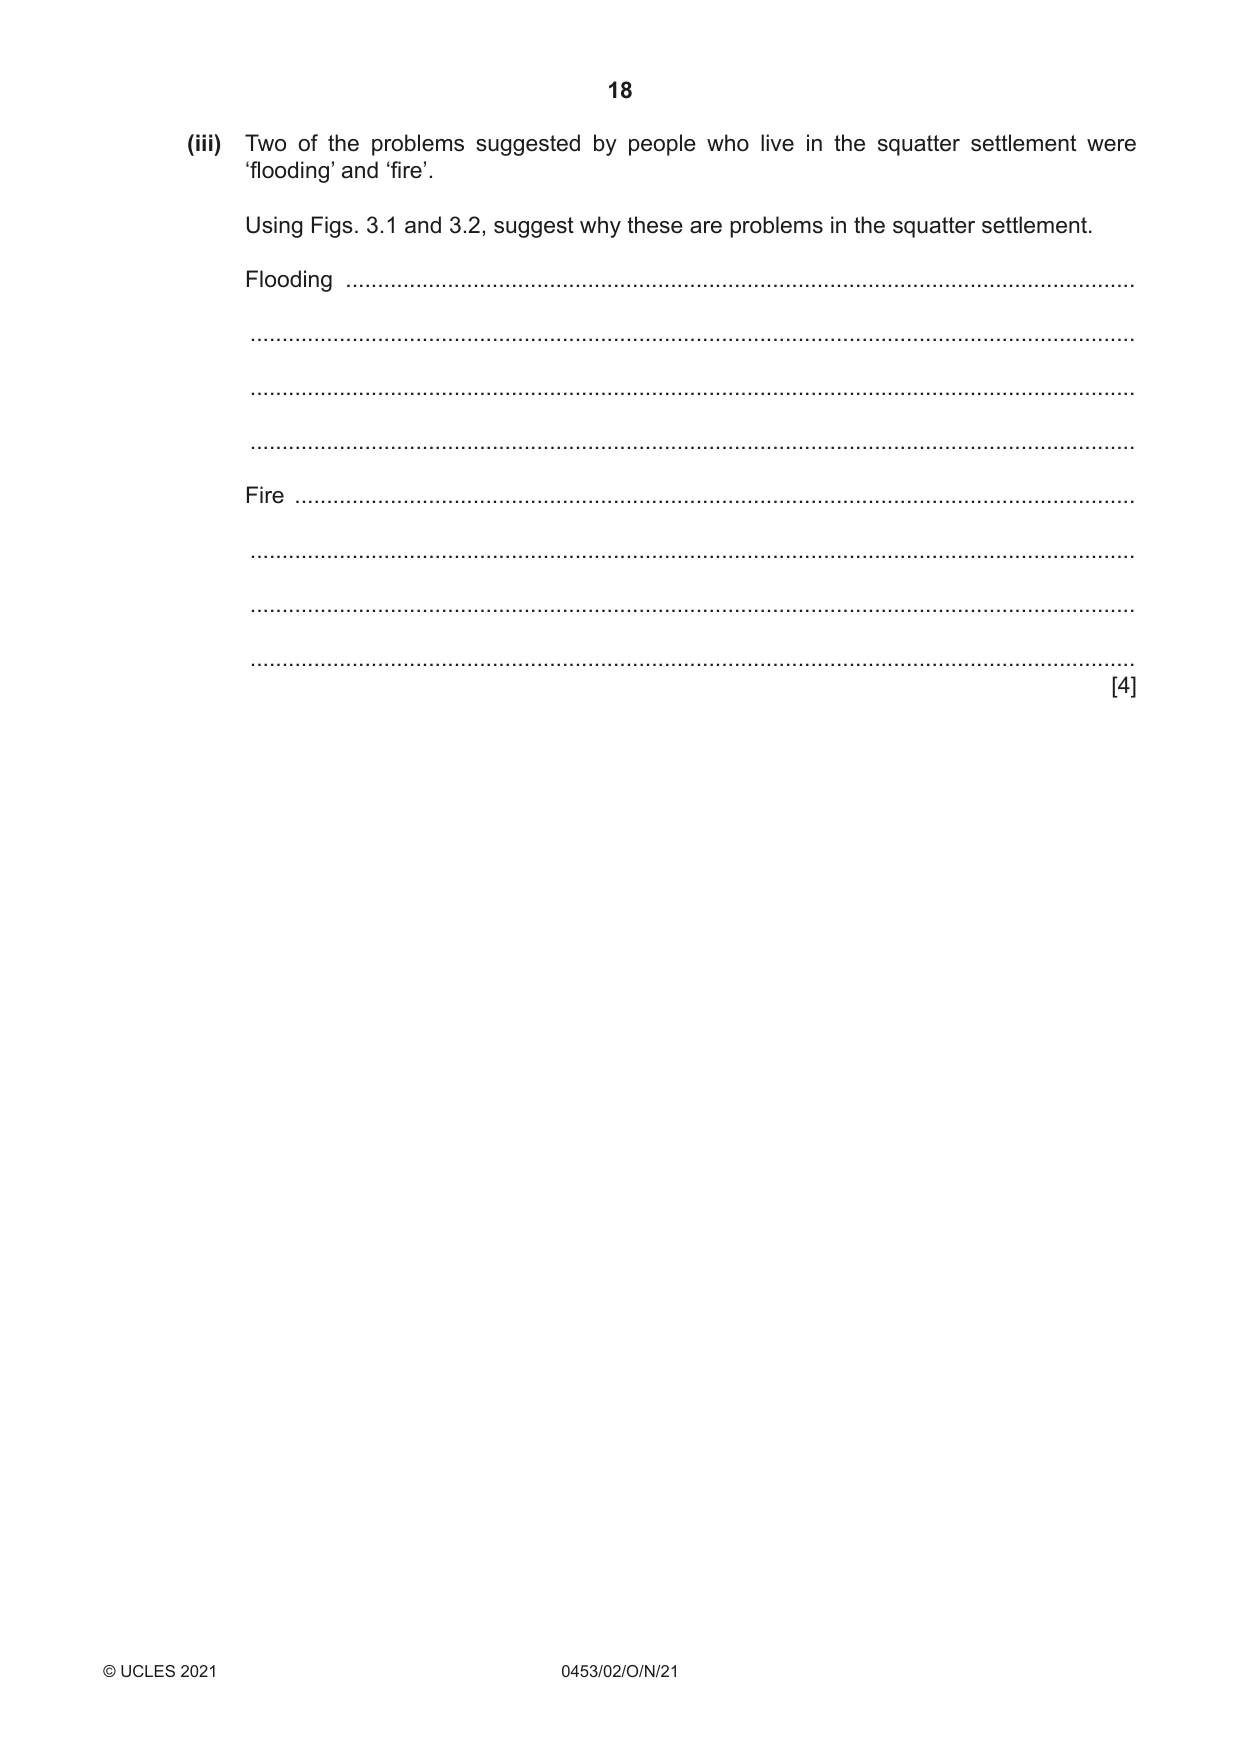
18 0453/02/O/N/21 © UCLES 2021 (iii) Two of the problems suggested by people who live in the squatter settlement were ‘flooding’ and ‘fire’. Using Figs. 3.1 and 3.2, suggest why these are problems in the squatter settlement. Flooding … … … … Fire … … … … [4]
Question paper, page 19
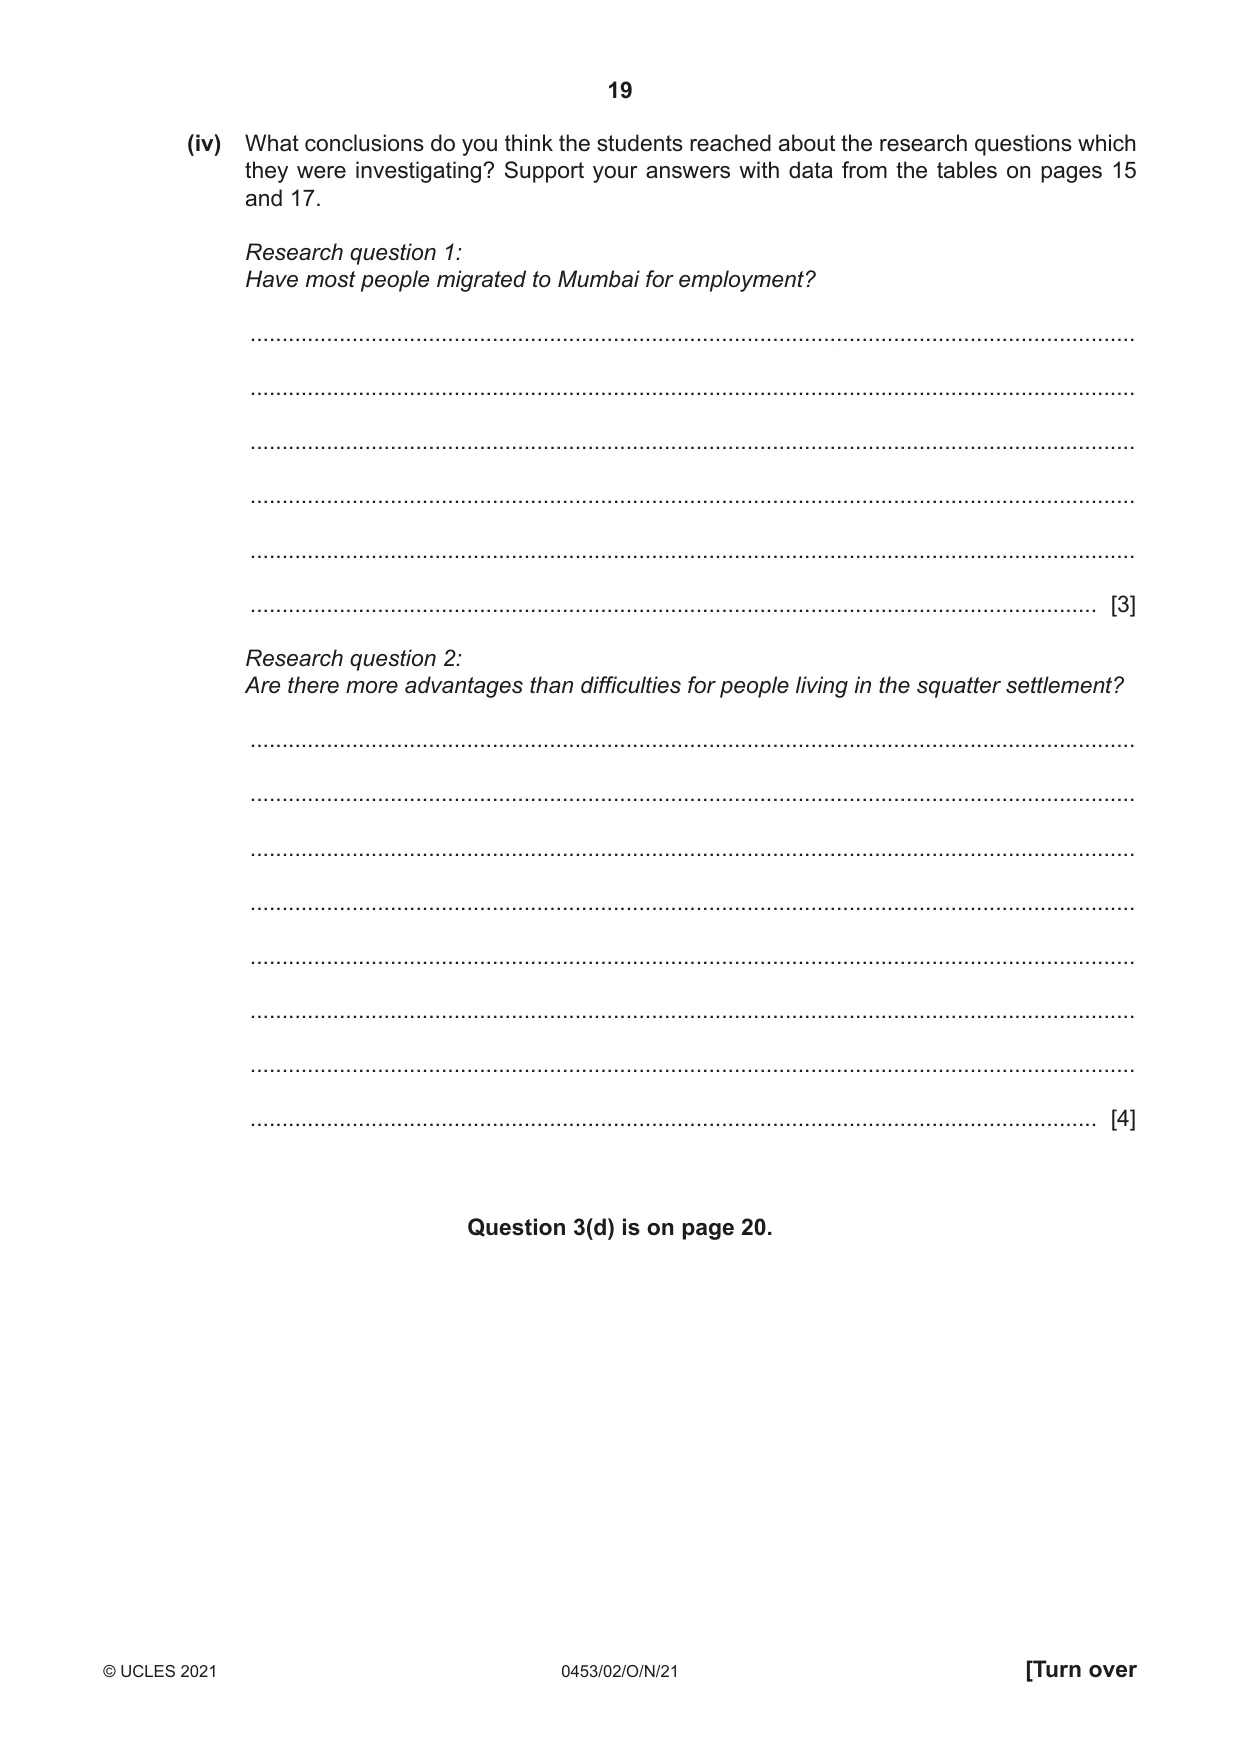
19 0453/02/O/N/21 © UCLES 2021 [Turn over (iv) What conclusions do you think the students reached about the research questions which they were investigating? Support your answers with data from the tables on pages 15 and 17. Research question 1: Have most people migrated to Mumbai for employment? … … … … … … [3] Research question 2: Are there more advantages than difficulties for people living in the squatter settlement? … … … … … … … … [4] Question 3(d) is on page 20.
Question paper, page 20
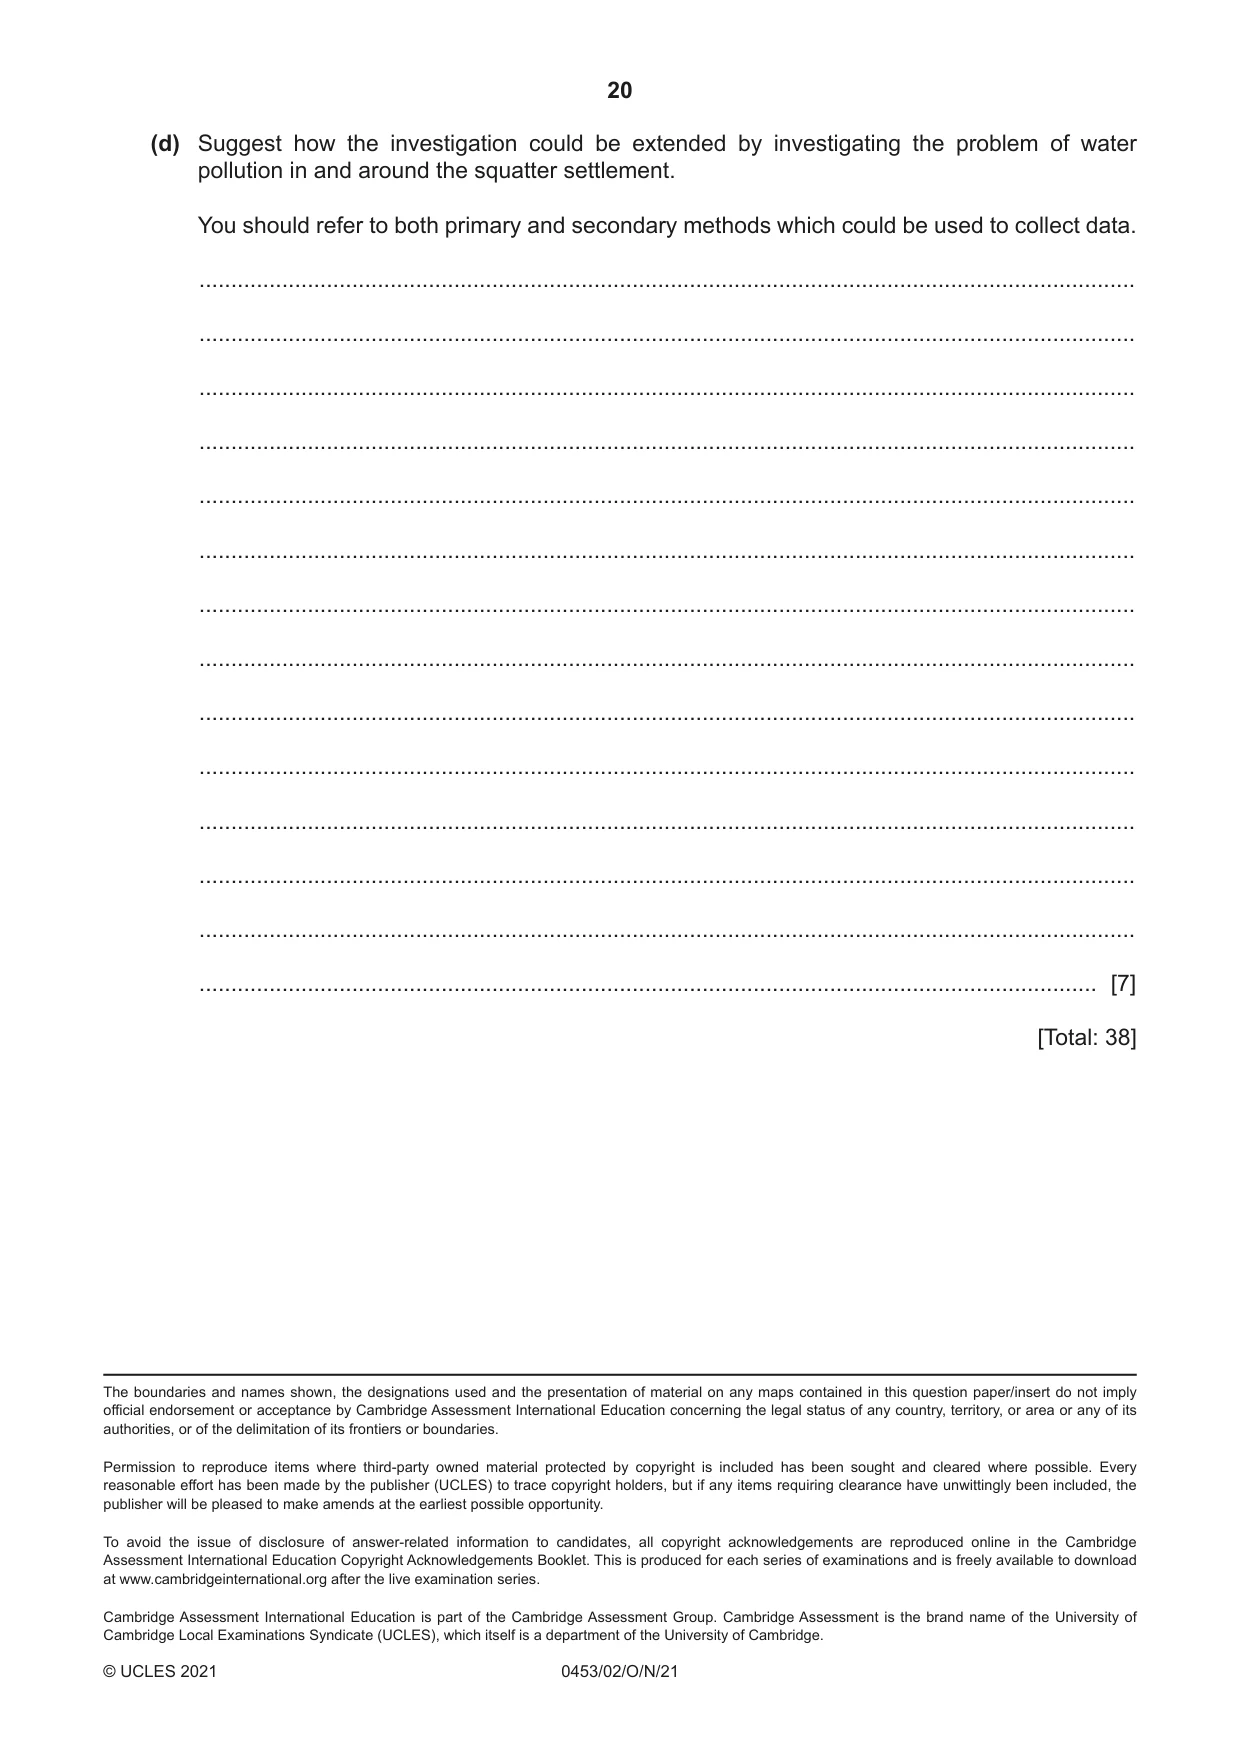
20 0453/02/O/N/21 © UCLES 2021 (d) Suggest how the investigation could be extended by investigating the problem of water pollution in and around the squatter settlement. You should refer to both primary and secondary methods which could be used to collect data. … … … … … … … … … … … … … … [7] [Total: 38] The boundaries and names shown, the designations used and the presentation of material on any maps contained in this question paper/insert do not imply official endorsement or acceptance by Cambridge Assessment International Education concerning the legal status of any country, territory, or area or any of its authorities, or of the delimitation of its frontiers or boundaries. Permission to reproduce items where third-party owned material protected by copyright is included has been sought and cleared where possible. Every reasonable effort has been made by the publisher (UCLES) to trace copyright holders, but if any items requiring clearance have unwittingly been included, the publisher will be pleased to make amends at the earliest possible opportunity. To avoid the issue of disclosure of answer-related information to candidates, all copyright acknowledgements are reproduced online in the Cambridge Assessment International Education Copyright Acknowledgements Booklet. This is produced for each series of examinations and is freely available to download at www.cambridgeinternational.org after the live examination series. Cambridge Assessment International Education is part of the Cambridge Assessment Group. Cambridge Assessment is the brand name of the University of Cambridge Local Examinations Syndicate (UCLES), which itself is a department of the University of Cambridge.
What you needed in this session
Cambridge’s own grade thresholds for 2021 Oct/Nov, Paper 2 · Variant 0. A higher threshold means an easier paper — the bar moves with how the cohort did.