Questions as text
Q1 · A flat circular coil P carrying a current produces a magnetic field 9702/52 Oct/Nov 2017
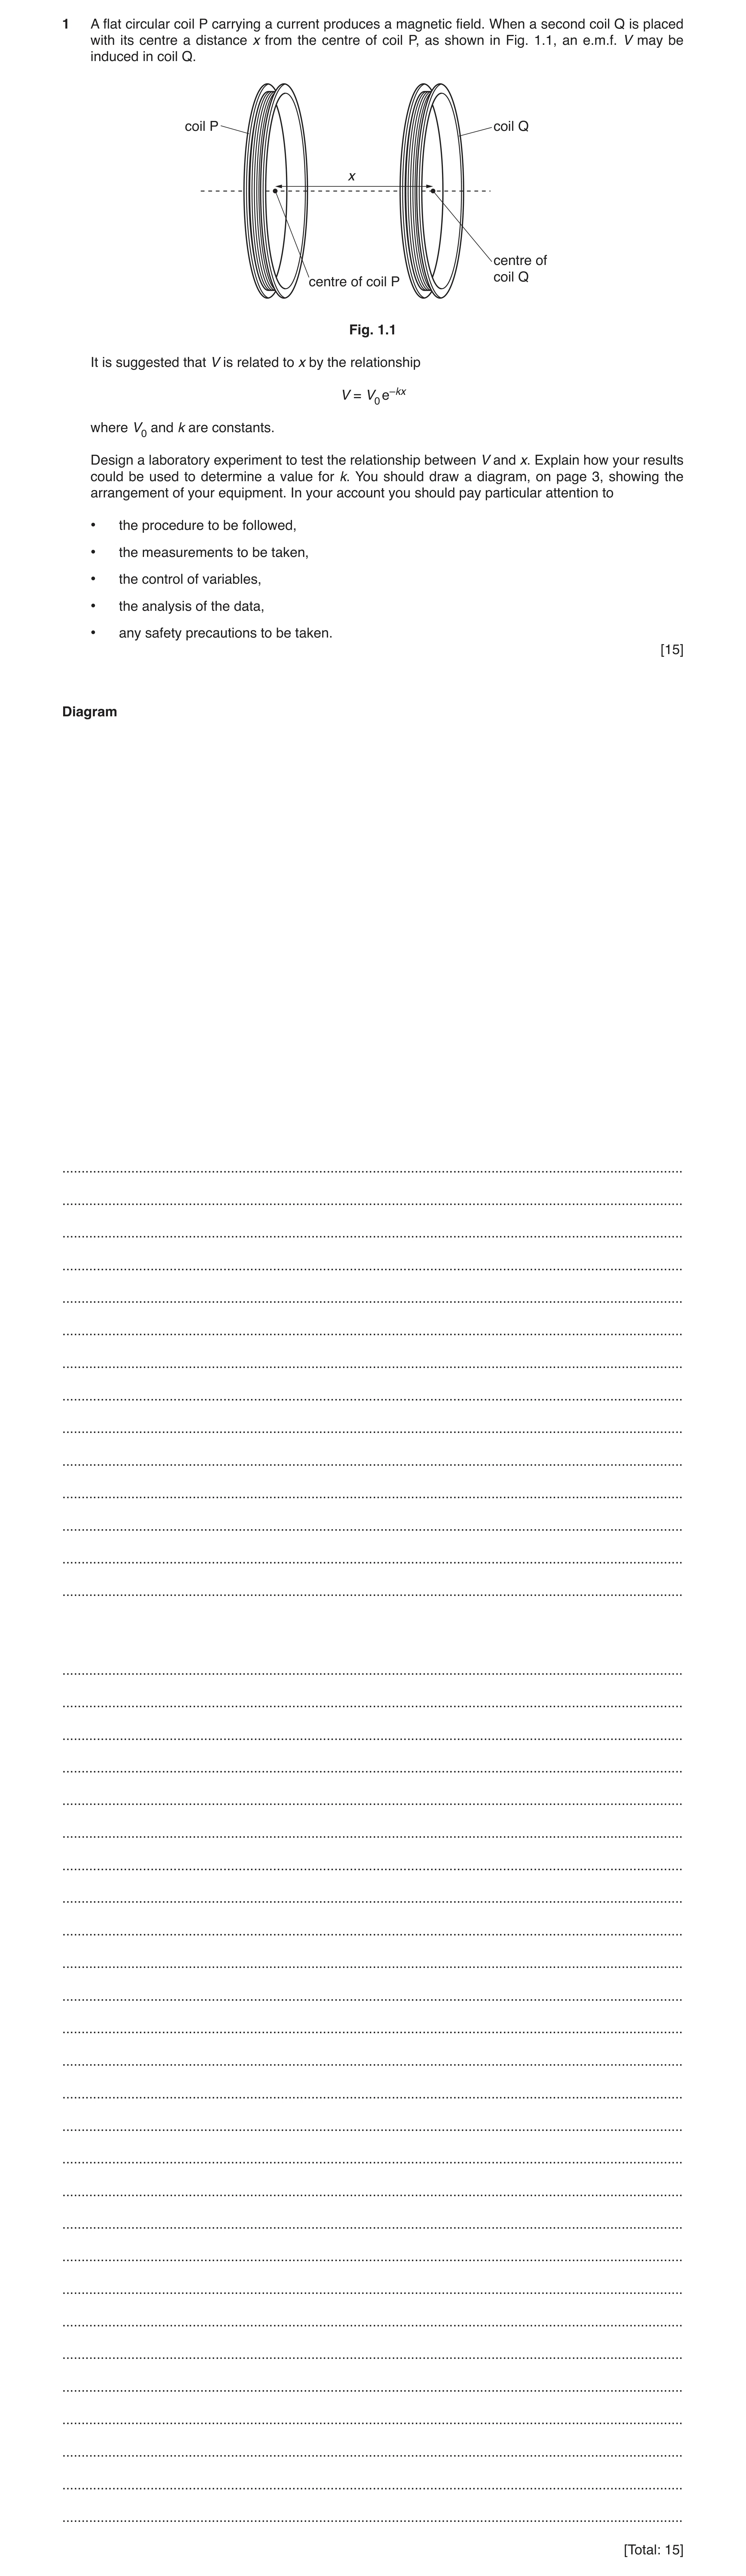
1 A flat circular coil P carrying a current produces a magnetic field. When a second coil Q is placed with its centre a distance x from the centre of coil P, as shown in Fig. 1.1, an e.m.f. V may be induced in coil Q. coil P coil Q x centre of coil Q centre of coil P Fig. 1.1 It is suggested that V is related to x by the relationship V = V0 e–kx where V0 and k are constants. Design a laboratory experiment to test the relationship between V and x. Explain how your results could be used to determine a value for k. You should draw a diagram, on page 3, showing the arrangement of your equipment. In your account you should pay particular attention to • the procedure to be followed, • the measurements to be taken, • the control of variables, • the analysis of the data, • any safety precautions to be taken. [15] Diagram … … … … … … … … … … … … … … … … … … … … … … … … … … … … … … … … … … … … … … … … … [Total: 15]
15 marks
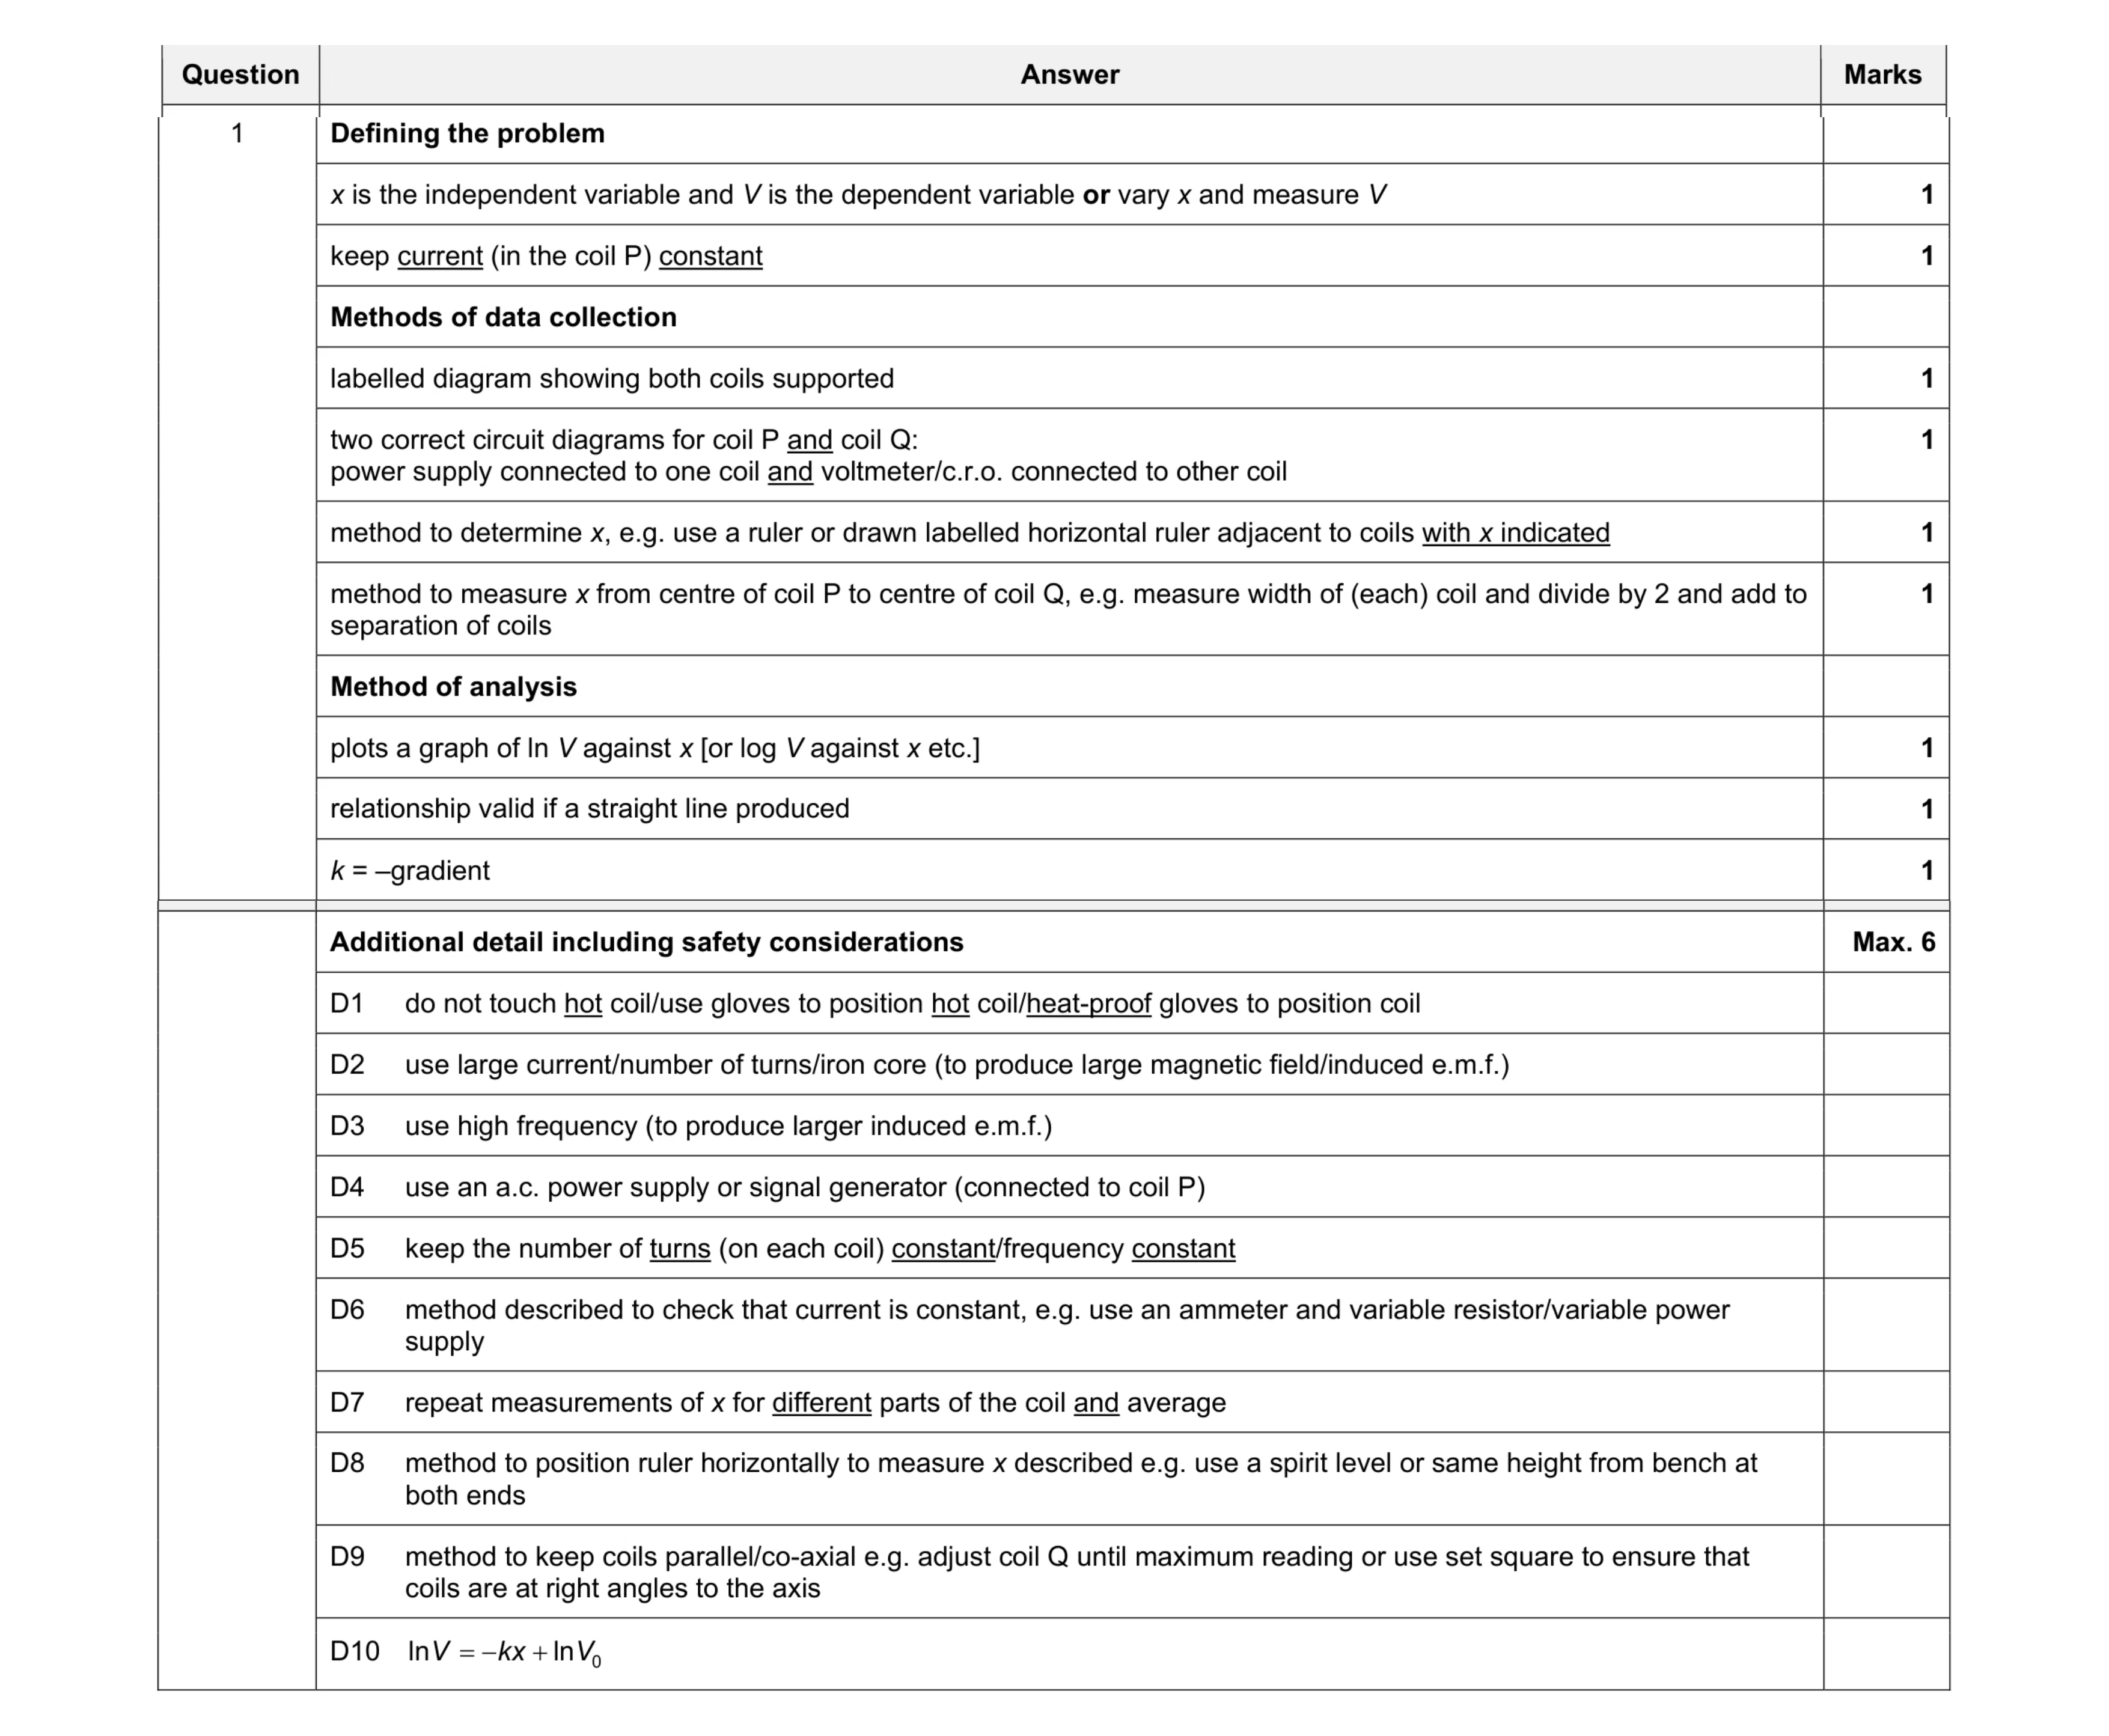
Mark scheme: 1 Defining the problem x is the independent variable and V is the dependent variable or vary x and measure V 1 keep current (in the coil P) constant 1 Methods of data collection labelled diagram showing both coils supported 1 two correct circuit diagrams for coil P and coil Q: power supply connected to one coil and voltmeter/c.r.o. connected to other coil 1 method to determine x, e.g. use a ruler or drawn labelled horizontal ruler adjacent to coils with x indicated 1 method to measure x from centre of coil P to centre of coil Q, e.g. measure width of (each) coil and divide by 2 and add to separation of coils 1 Method of analysis plots a graph of ln V against x [or log V against x etc.] 1 relationship valid if a straight line produced 1 k = –gradient 1 Question Answer Marks Additional detail including safety considerations Max. 6 D1 do not touch hot coil/use gloves to position hot coil/heat-proof gloves to position coil D2 use large current/number of turns/iron core (to produce large magnetic field/induced e.m.f.) D3 use high frequency (to produce larger induced e.m.f.) D4 use an a.c. power supply or signal generator (connected to coil P) D5 keep the number of turns (on each coil) constant/frequency constant D6 method described to check that current is constant, e.g. use an ammeter and variable resistor/variable power supply D7 repeat measurements of x for different parts of the coil and average D8 method to position ruler horizontally to measure x described e.g. use a spirit level or same height from bench at both ends D9 method to keep coils parallel/co-axial e.g. adjust coil Q until maximum reading or use set square to ensure that coils are at right angles to the axis D10 0 ln ln V kx V = − +
This question in 9702/52 Oct/Nov 2017
Q2 · A bar magnet attached to a spring 9702/52 Feb/March 2020
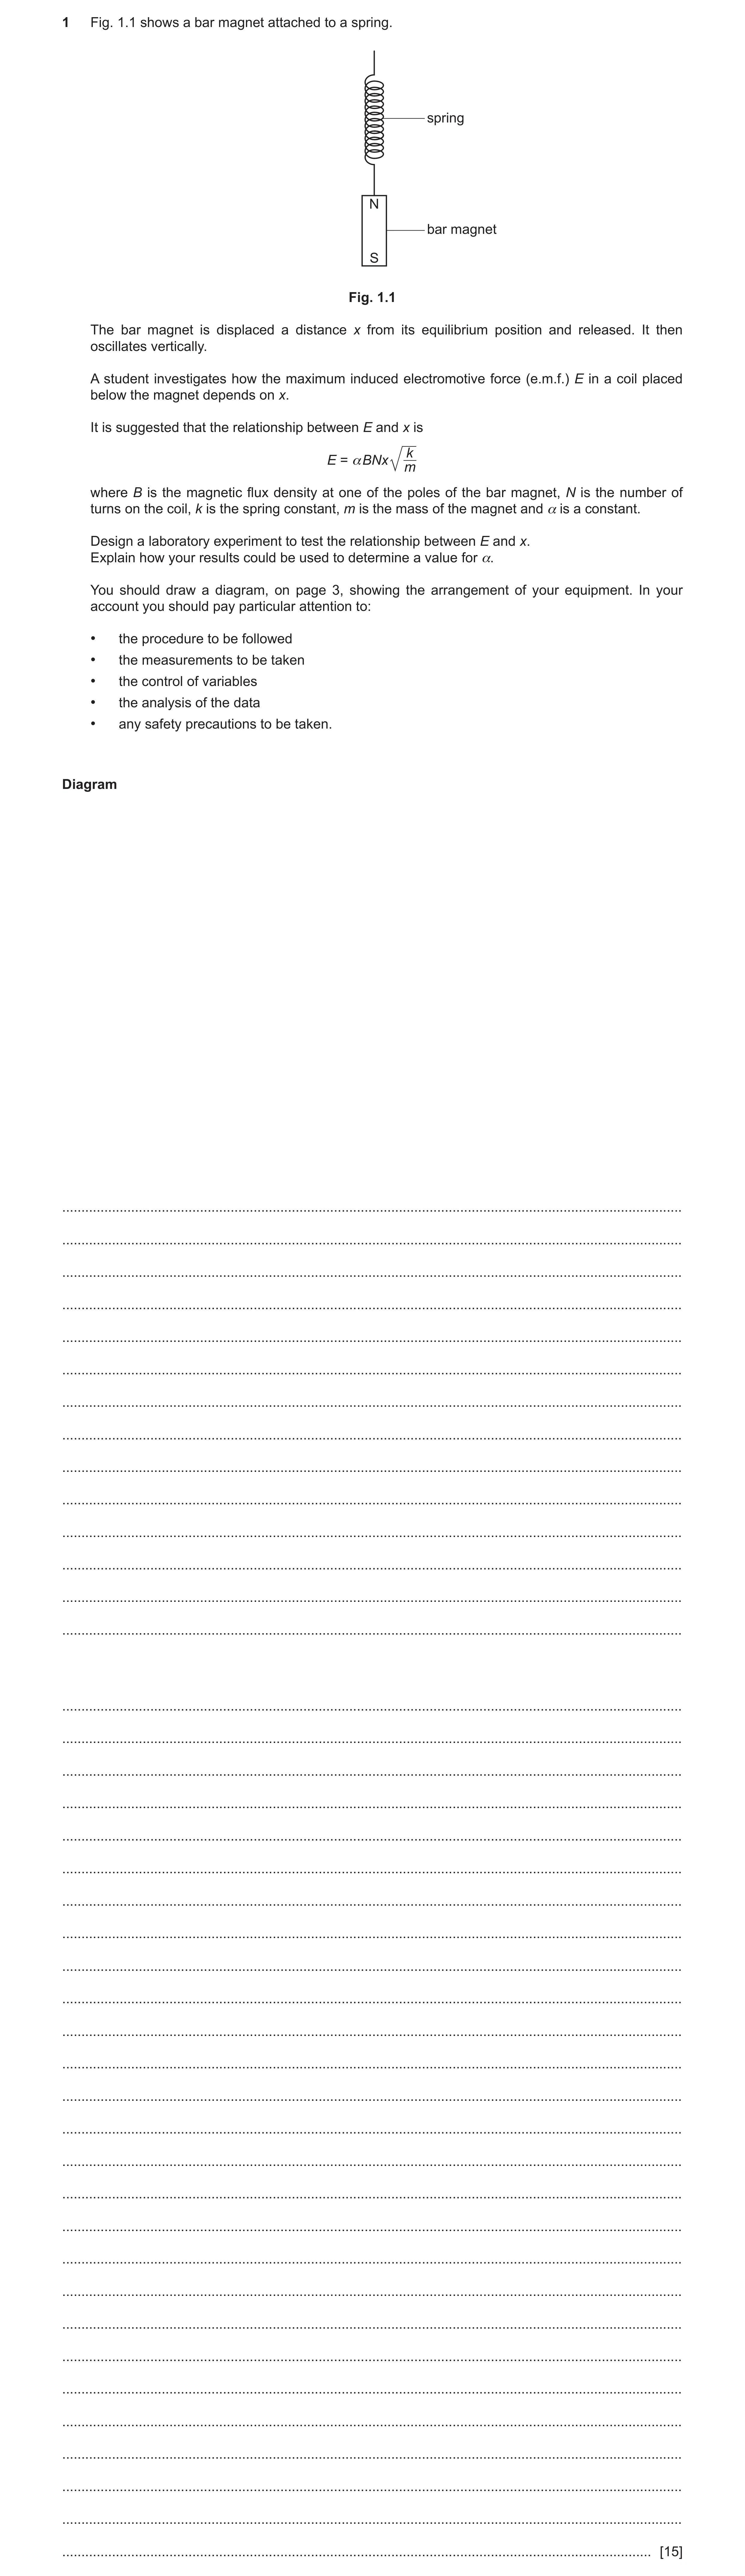
1 Fig. 1.1 shows a bar magnet attached to a spring. spring N bar magnet S Fig. 1.1 The bar magnet is displaced a distance x from its equilibrium position and released. It then oscillates vertically. A student investigates how the maximum induced electromotive force (e.m.f.) E in a coil placed below the magnet depends on x. It is suggested that the relationship between E and x is k E = αBNx m where B is the magnetic flux density at one of the poles of the bar magnet, N is the number of turns on the coil, k is the spring constant, m is the mass of the magnet and α is a constant. Design a laboratory experiment to test the relationship between E and x. Explain how your results could be used to determine a value for α. You should draw a diagram, on page 3, showing the arrangement of your equipment. In your account you should pay particular attention to: • the procedure to be followed • the measurements to be taken • the control of variables • the analysis of the data • any safety precautions to be taken. Diagram … … … … … … … … … … … … … … … … … … … … … … … … … … … … … … … … … … … … … … … … … [15]
15 marks
Mark scheme: 1 Defining the problem x is the independent variable and E is the dependent variable, or vary x and measure E. 1 Keep B or m constant and keep k or N constant. 1 Methods of data collection Labelled diagram of workable experiment including: • labelled spring supported by stand and clamp • labelled magnet • labelled coil positioned so that magnet is vertically above the coil by eye in the correct orientation. 1 Circuit diagram showing voltmeter / multimeter set to p.d. range / oscilloscope connected to the ends of the coil. Do not accept other electrical components. 1 Method to measure x, e.g. labelled ruler drawn parallel to spring/magnet and equilibrium position and displaced position indicated and x indicated or difference determined or description of use of ruler to measure equilibrium position and displaced position and difference determined. 1 Method to measure mass of magnet e.g. use balance or use newton-meter to measure weight and divide by g. 1 Method of Analysis Plots a graph of E against x or equivalent. Allow lg E against lg x. 1 Relationship valid if a straight line passing through the origin is produced. (for lg E against lg x: relationship valid if a straight line with gradient = 1). 1 α = gradient m BN k (for lg E against lg x: α = -intercept 10 y m BN k ) 1 Question Answer Marks 1 Additional detail including safety considerations Max 6 6 Use safety goggles / safety screen to prevent injury (to eyes) from (detached) spring/magnet; do not accept from D1 oscillating magnet or use cushion / sand box in case magnet falls or use g clamp / weights on stand to prevent toppling. Keep distance between equilibrium position and coil constant. D2 Check that the unstretched length of the spring has not changed or is not permanently deformed (after removing D3 load / magnet). Expression to determine k from relevant experiment, e.g. k = mg / extension or gradient of F – extension graph. D4 Weight / force must be defined. Measure B using a (calibrated) Hall probe. D5 Additional detail on use of Hall probe, e.g. D6 adjust probe until maximum value or measure B using Hall probe first in one direction and then in the opposite direction and average. Method to maximise E, e.g. position magnet so that equilibrium position is at the centre of the coil or use D7 a large number of turns. Explanation to determine max E e.g. use of video and slow-motion playback. D8 Repeat experiment for each x and average E. D9 Method to ensure clamped rule to measure x is vertical, e.g. correctly positioned set square indicated at D10 right angles between the rule and the horizontal surface or plumb line supported on a surface shown in appropriate position.
This question in 9702/52 Feb/March 2020
Q3 · A thin copper sheet is suspended from a small hole near the top of the sheet and placed… 9702/51 Oct/Nov 2022
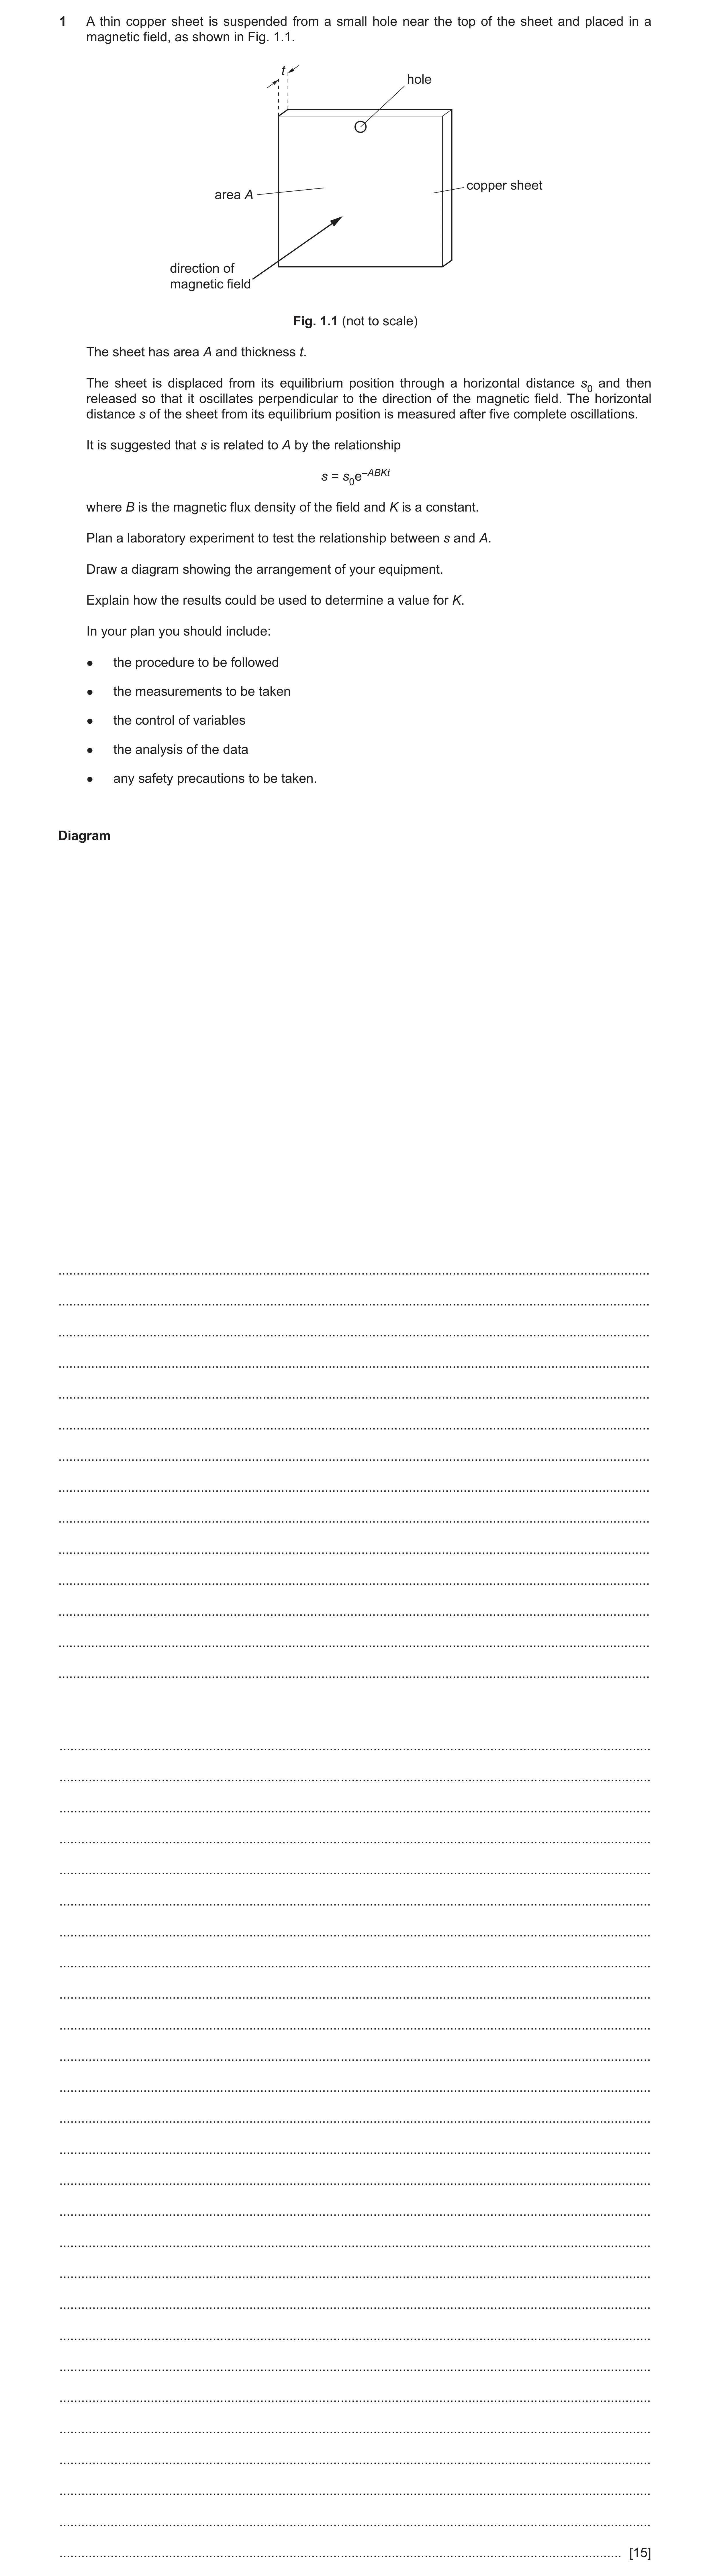
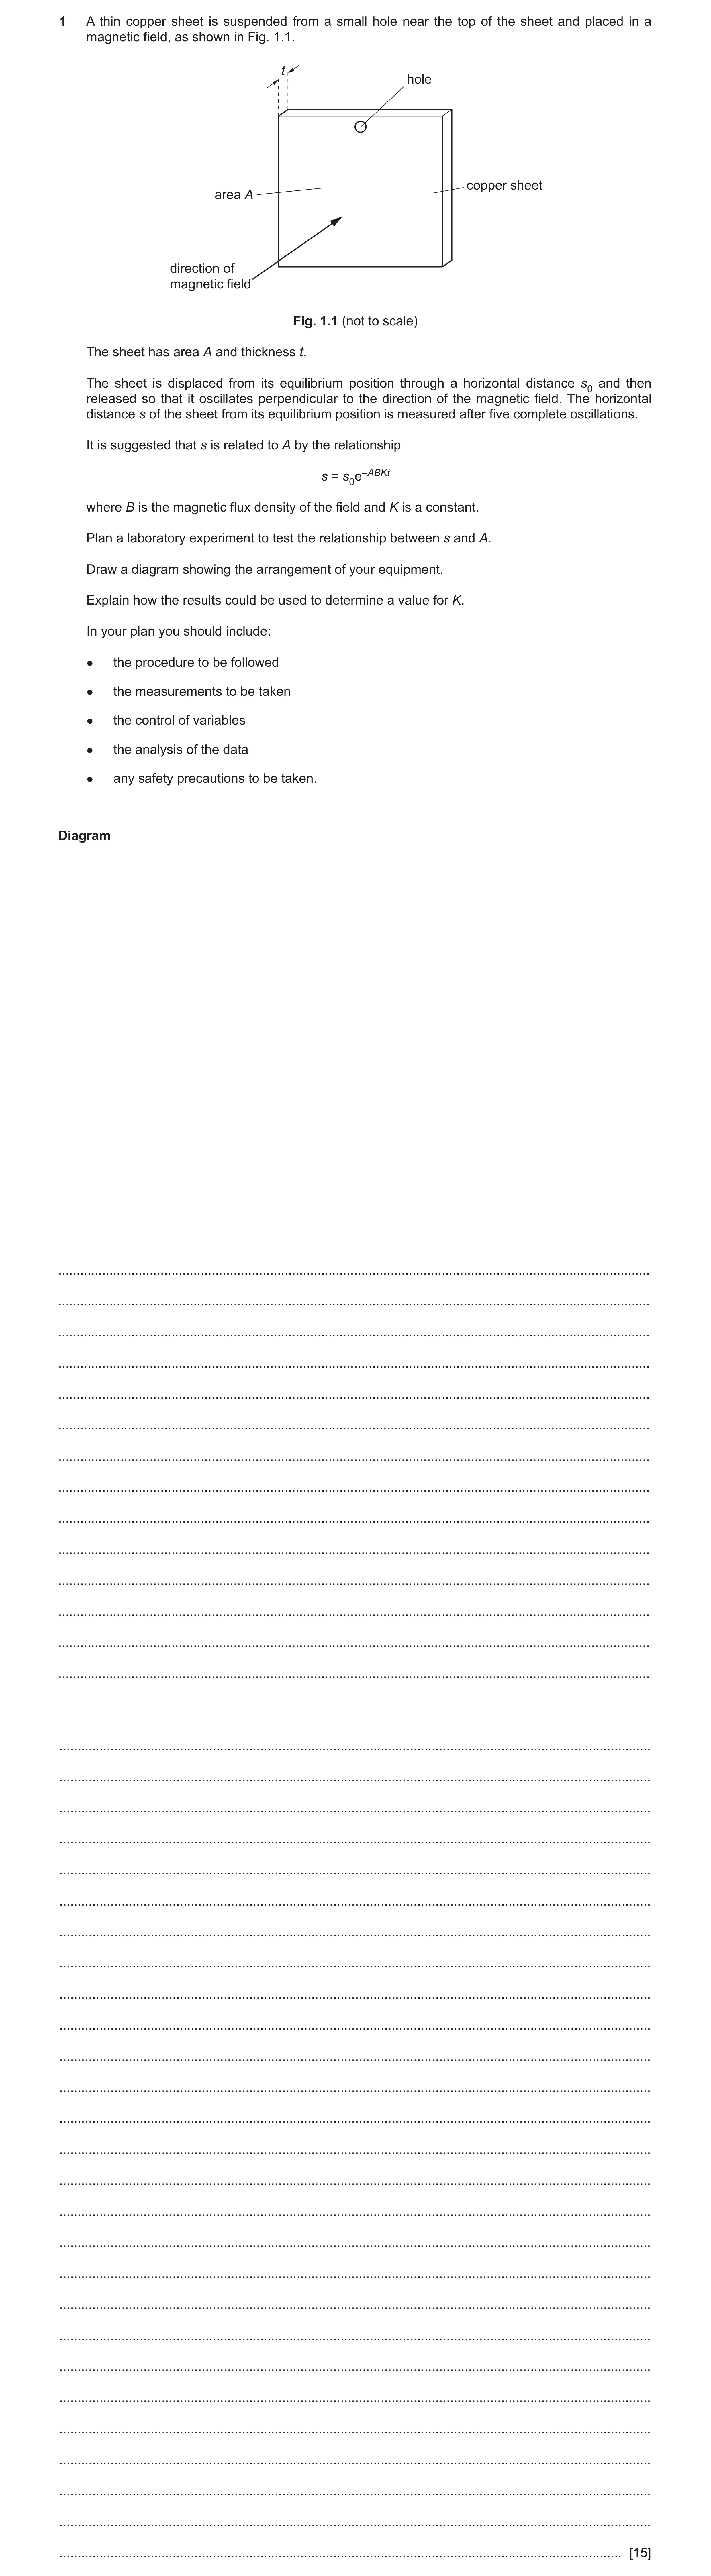
1 A thin copper sheet is suspended from a small hole near the top of the sheet and placed in a magnetic field, as shown in Fig. 1.1. t hole copper sheet area A direction of magnetic field Fig. 1.1 (not to scale) The sheet has area A and thickness t. The sheet is displaced from its equilibrium position through a horizontal distance s0 and then released so that it oscillates perpendicular to the direction of the magnetic field. The horizontal distance s of the sheet from its equilibrium position is measured after five complete oscillations. It is suggested that s is related to A by the relationship s = s0e–ABKt where B is the magnetic flux density of the field and K is a constant. Plan a laboratory experiment to test the relationship between s and A. Draw a diagram showing the arrangement of your equipment. Explain how the results could be used to determine a value for K. In your plan you should include: ● the procedure to be followed ● the measurements to be taken ● the control of variables ● the analysis of the data ● any safety precautions to be taken. Diagram … … … … … … … … … … … … … … … … … … … … … … … … … … … … … … … … … … … … … … … … … [15]
15 marks
Mark scheme: Question Answer Marks 1 Defining the problem A is the independent variable and s is the dependent variable or vary A and measure s 1 keep B and t constant 1 Methods of data collection labelled diagram of workable experiment including: 1 • pin / rod through hole • supported by a stand • sheet able to oscillate freely • at least one label from copper/sheet, hole, clamp, stand, rod, pin. drawn clamped rule(r) parallel to the direction of the oscillations (by eye) (to measure s) 1 use rule(r) to measure lengths to determine A 1 and A = length breadth use of micrometer to measure t 1 Method of Analysis plot a graph of ln s against A or equivalent 1 relationship valid if a straight line (with y-intercept = ln s0) is produced 1 gradient 1 K = − Bt 1 ( K = − for A against ln s) Bt gradient 1 Additional detail including safety considerations 6 D1 use of cushion/sand box in case sheet falls or use gloves to protect hands from cuts / sharp edges D2 keep (initial) distance between (copper) sheet and (poles of) magnet constant or keep (initial) distance between (copper) sheet and coil(s) constant D3 keep s0 constant D4 method to ensure s0 is constant, e.g. initially line up (corner of) plate with fiducial marker / vertical pin to keep s0 constant D5 method to determine s using video camera: • rule(r) in a position to measure s in the diagram • video camera shown in diagram or description of use of video camera • playback video recording by frame by frame / slow motion (to measure s) D6 repeat measurements of t in different positions and average t D7 measure B/magnetic flux density using a (calibrated) Hall probe D8 additional detail on use of Hall probe, e.g. adjust probe until maximum value or measure B using Hall probe first in one direction and then in the opposite direction and average D9 drawn method to create a magnetic field perpendicular to the area of the sheet, e.g. pair of magnets/horseshoe magnet/pair of coils connected to a (d.c.) supply D10 repeat experiment for each A and average s
This question in 9702/51 Oct/Nov 2022
Q4 · A thin copper sheet is suspended from a small hole near the top of the sheet and placed… 9702/52 Oct/Nov 2022
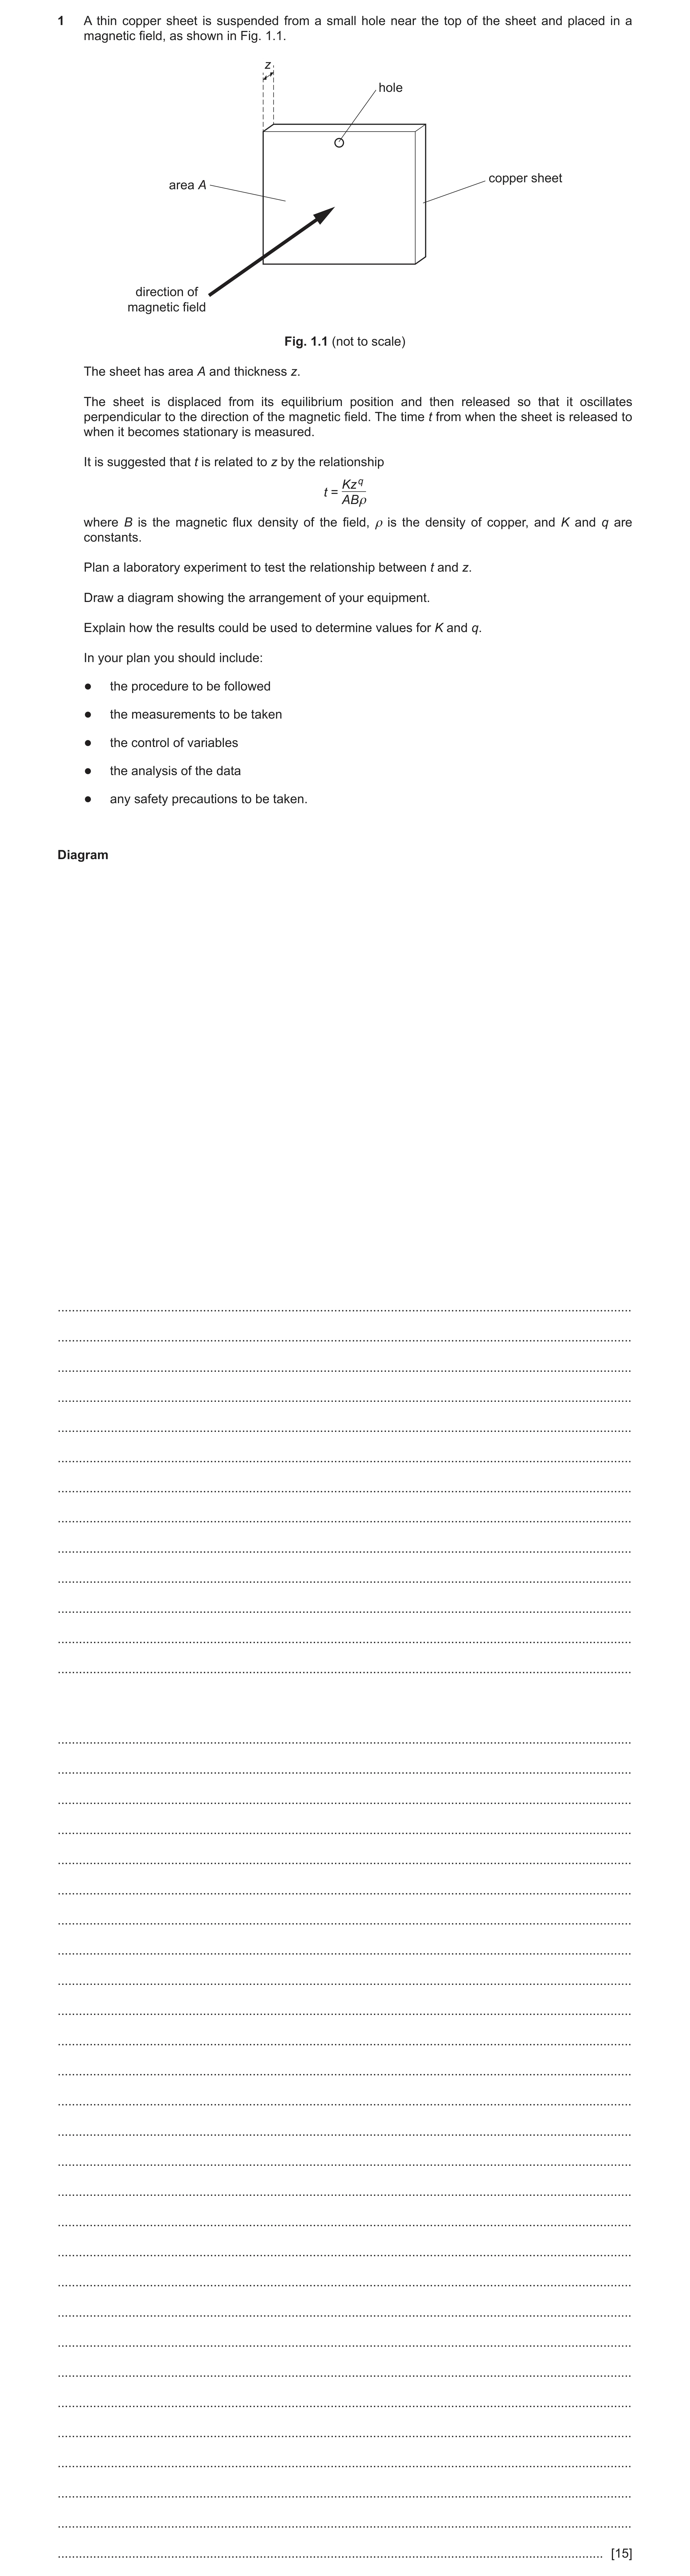
1 A thin copper sheet is suspended from a small hole near the top of the sheet and placed in a magnetic field, as shown in Fig. 1.1. z hole copper sheet area A direction of magnetic field Fig. 1.1 (not to scale) The sheet has area A and thickness z. The sheet is displaced from its equilibrium position and then released so that it oscillates perpendicular to the direction of the magnetic field. The time t from when the sheet is released to when it becomes stationary is measured. It is suggested that t is related to z by the relationship Kz q t = ABρ where B is the magnetic flux density of the field, ρ is the density of copper, and K and q are constants. Plan a laboratory experiment to test the relationship between t and z. Draw a diagram showing the arrangement of your equipment. Explain how the results could be used to determine values for K and q. In your plan you should include: ● the procedure to be followed ● the measurements to be taken ● the control of variables ● the analysis of the data ● any safety precautions to be taken. Diagram … … … … … … … … … … … … … … … … … … … … … … … … … … … … … … … … … … … … … … … … … [15]
15 marks
Mark scheme: Question Answer Marks 1 Defining the problem z is the independent variable and t is the dependent variable or vary z and measure t 1 keep B and A constant 1 Methods of data collection labelled diagram of workable experiment including: 1 • pin/rod though hole • supported by a stand • sheet able to oscillate freely • at least one label from copper/sheet, hole, clamp stand, rod, pin use of stop-watch/timer to measure t (from release to stopping) 1 or use of stop-watch/timer to measure time for the sheet (to stop) oscillating use of micrometer to measure z 1 use of rule(r) to measure lengths to determine A 1 and A = length breadth Method of Analysis plot a graph of lg t against lg z or equivalent (e.g. ln t against ln z) 1 q = gradient 1 K = AB 10y -intercept 1 ( K = AB ey -intercept for ln t against ln z) 1 Additional detail including safety considerations 6 D1 use of cushion / sand box in case sheet falls or use gloves to protect hands from cuts / sharp edges D2 keep (initial) distance between (copper) sheet and (poles of) magnet constant or keep (initial) distance between (copper) sheet and coil(s) constant D3 keep initial displacement (of copper sheet) constant D4 method to ensure initial displacement (of copper sheet) is constant, e.g. initially line up (corner of) plate with fiducial marker/vertical pin K D5 relationship valid if a straight line (with y-intercept = log ) is produced AB D6 repeat measurements of z in different positions and average z D7 measure B / magnetic flux density using a (calibrated) Hall probe D8 additional detail on use of Hall probe, e.g. adjust (position of) probe until maximum value or measure B using Hall probe first in one direction and then in the opposite direction and average D9 drawn method to create a magnetic field perpendicular to the area of the sheet, e.g. pair of magnets/horseshoe magnet/pair of coils connected to a (d.c.) supply D10 repeat experiment for each z and average t D11 method to determine , e.g. measure mass with balance and volume = Az and density = mass / volume
This question in 9702/52 Oct/Nov 2022
Q5 · A thin copper sheet is suspended from a small hole near the top of the sheet and placed… 9702/53 Oct/Nov 2022
1 A thin copper sheet is suspended from a small hole near the top of the sheet and placed in a magnetic field, as shown in Fig. 1.1. t hole copper sheet area A direction of magnetic field Fig. 1.1 (not to scale) The sheet has area A and thickness t. The sheet is displaced from its equilibrium position through a horizontal distance s0 and then released so that it oscillates perpendicular to the direction of the magnetic field. The horizontal distance s of the sheet from its equilibrium position is measured after five complete oscillations. It is suggested that s is related to A by the relationship s = s0e–ABKt where B is the magnetic flux density of the field and K is a constant. Plan a laboratory experiment to test the relationship between s and A. Draw a diagram showing the arrangement of your equipment. Explain how the results could be used to determine a value for K. In your plan you should include: ● the procedure to be followed ● the measurements to be taken ● the control of variables ● the analysis of the data ● any safety precautions to be taken. Diagram … … … … … … … … … … … … … … … … … … … … … … … … … … … … … … … … … … … … … … … … … [15]
15 marks
Mark scheme: Question Answer Marks 1 Defining the problem A is the independent variable and s is the dependent variable or vary A and measure s 1 keep B and t constant 1 Methods of data collection labelled diagram of workable experiment including: 1 • pin / rod through hole • supported by a stand • sheet able to oscillate freely • at least one label from copper/sheet, hole, clamp, stand, rod, pin. drawn clamped rule(r) parallel to the direction of the oscillations (by eye) (to measure s) 1 use rule(r) to measure lengths to determine A 1 and A = length breadth use of micrometer to measure t 1 Method of Analysis plot a graph of ln s against A or equivalent 1 relationship valid if a straight line (with y-intercept = ln s0) is produced 1 gradient 1 K = − Bt 1 ( K = − for A against ln s) Bt gradient 1 Additional detail including safety considerations 6 D1 use of cushion/sand box in case sheet falls or use gloves to protect hands from cuts / sharp edges D2 keep (initial) distance between (copper) sheet and (poles of) magnet constant or keep (initial) distance between (copper) sheet and coil(s) constant D3 keep s0 constant D4 method to ensure s0 is constant, e.g. initially line up (corner of) plate with fiducial marker / vertical pin to keep s0 constant D5 method to determine s using video camera: • rule(r) in a position to measure s in the diagram • video camera shown in diagram or description of use of video camera • playback video recording by frame by frame / slow motion (to measure s) D6 repeat measurements of t in different positions and average t D7 measure B/magnetic flux density using a (calibrated) Hall probe D8 additional detail on use of Hall probe, e.g. adjust probe until maximum value or measure B using Hall probe first in one direction and then in the opposite direction and average D9 drawn method to create a magnetic field perpendicular to the area of the sheet, e.g. pair of magnets/horseshoe magnet/pair of coils connected to a (d.c.) supply D10 repeat experiment for each A and average s
This question in 9702/53 Oct/Nov 2022
Q6 · Two coils, P and Q, are placed close to each other, as shown in Fig 9702/52 May/June 2023
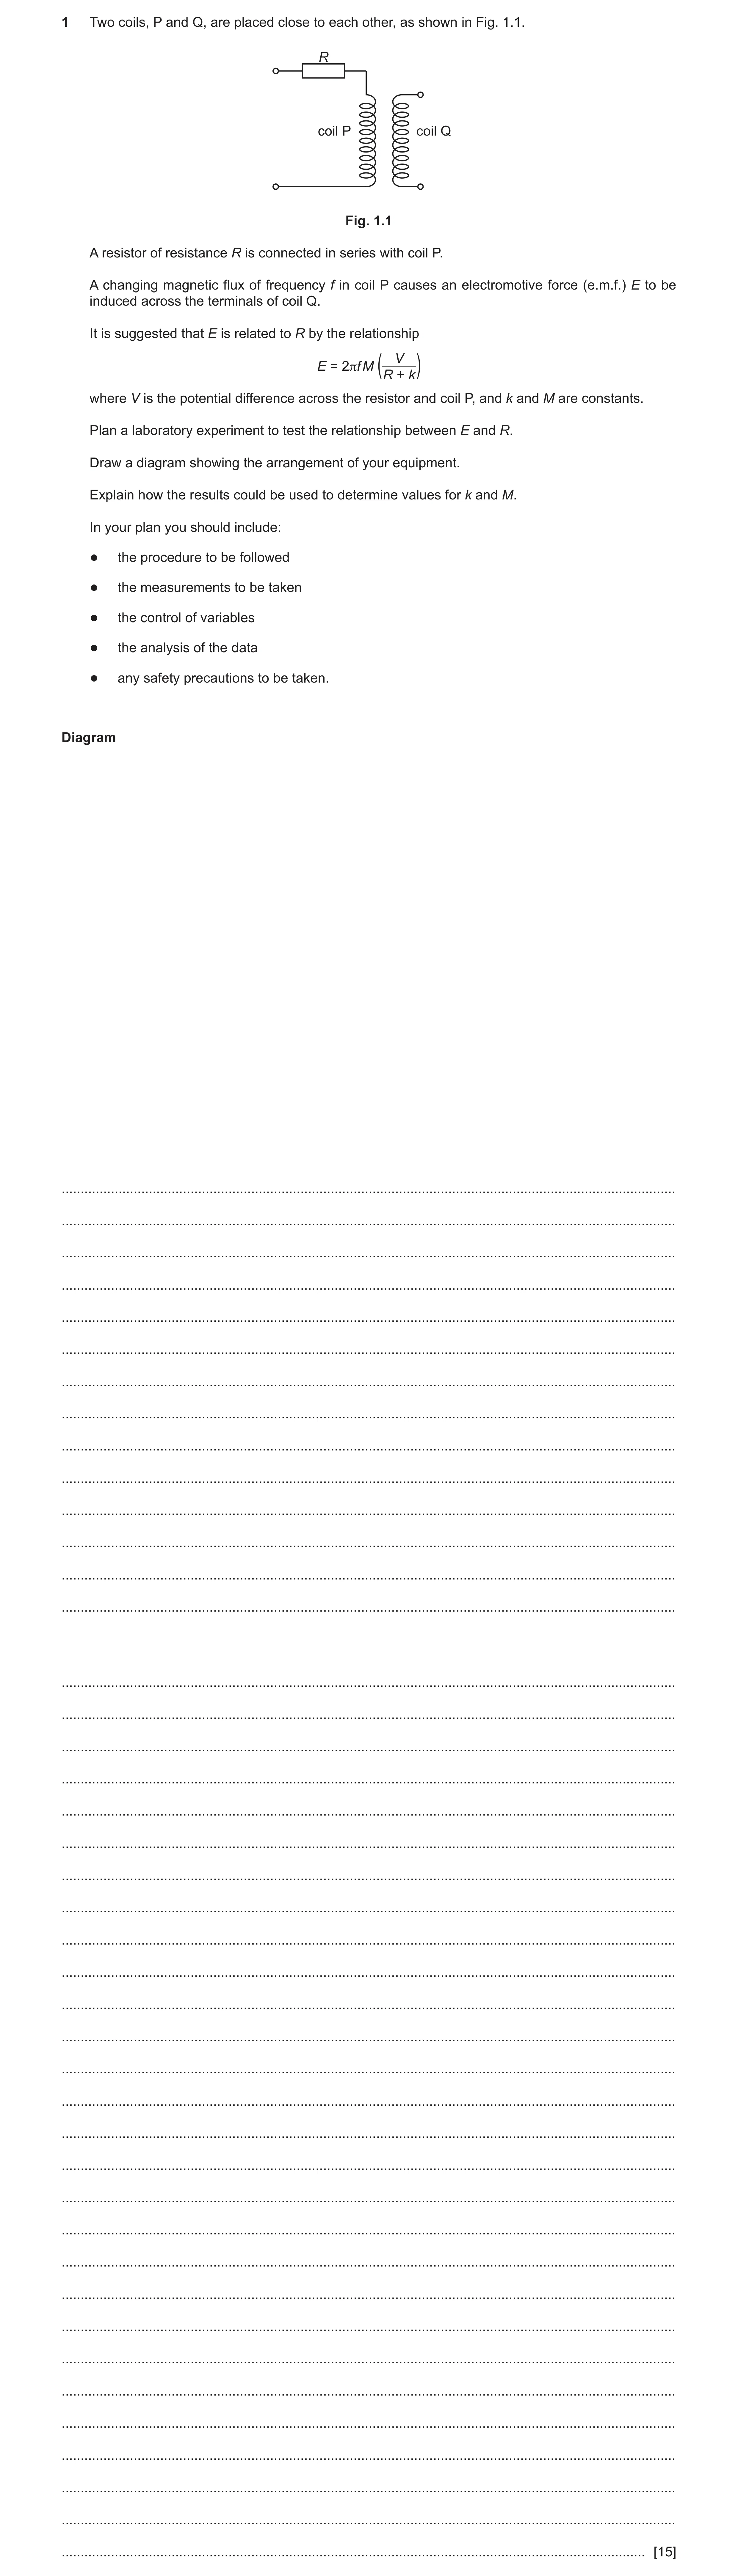
1 Two coils, P and Q, are placed close to each other, as shown in Fig. 1.1. R coil P coil Q Fig. 1.1 A resistor of resistance R is connected in series with coil P. A changing magnetic flux of frequency f in coil P causes an electromotive force (e.m.f.) E to be induced across the terminals of coil Q. It is suggested that E is related to R by the relationship V E = 2πf M ( R + k) where V is the potential difference across the resistor and coil P, and k and M are constants. Plan a laboratory experiment to test the relationship between E and R. Draw a diagram showing the arrangement of your equipment. Explain how the results could be used to determine values for k and M. In your plan you should include: ● the procedure to be followed ● the measurements to be taken ● the control of variables ● the analysis of the data ● any safety precautions to be taken. Diagram … … … … … … … … … … … … … … … … … … … … … … … … … … … … … … … … … … … … … … … … … … [15]
15 marks
Mark scheme: 1 Defining the problem R is the independent variable and E is the dependent variable or vary R and measure E 1 keep V constant 1 Methods of data collection labelled diagram of workable experiment including: coil P placed close to coil Q separate workable circuit for coil Q (a.c.) voltmeter or oscilloscope connected across coil Q (Do not accept a power supply connected to coil Q.) 1 a.c. power supply/signal generator connected to resistor and coil P in series 1 workable circuit with power supply and (a.c.) voltmeter/oscilloscope in parallel with resistor and coil P or across terminals of power supply/signal generator 1 method to determine R, e.g. measure current in R and p.d. across R and use R = VR/I or measure R using an ohmmeter 1 Question Answer Marks 1 Method of Analysis plot a graph of 1 E against R or equivalent (e.g. R against 1 E ) Do not accept logarithms. 1 1 2 gradient M fV (for R against 1 E : gradient 2 M fV ) 1 2 -intercept k fVM y or -intercept gradient y k (for R against 1 E : k = y-intercept) 1 Question Answer Marks 1 Additional detail including safety considerations 6 D1 precaution linked to hot coil (P) / hot resistor, e.g. use of (heat-proof) gloves, wait until circuit cools down or precaution linked to shocks from high voltages e.g. use of (insulating) gloves or switch off supply before touching the circuit (to change R) D2 keep the number of turns on (both) coils constant D3 keep f constant D4 keep distance between the coils constant D5 method to keep distance between the coils constant, e.g. fix/clamp coils to bench D6 method to measure f, e.g. read from signal generator or use of oscilloscope D7 method to determine f from oscilloscope, e.g. period from oscilloscope T = time-base horizontal distance and f = 1/T D8 method to determine V or E from oscilloscope, e.g. V = y-gain vertical distance D9 method to increase E e.g. use iron core/more turns on coil Q/high frequency/high p.d. (across R and coil P) D10 relationship valid if a straight line is produced (not passing through the origin) Do not accept straight line passing through the origin.
This question in 9702/52 May/June 2023
Q7 · Two coils, C and D, are placed with their axes on a straight line, as shown in Fig 9702/51 Oct/Nov 2023
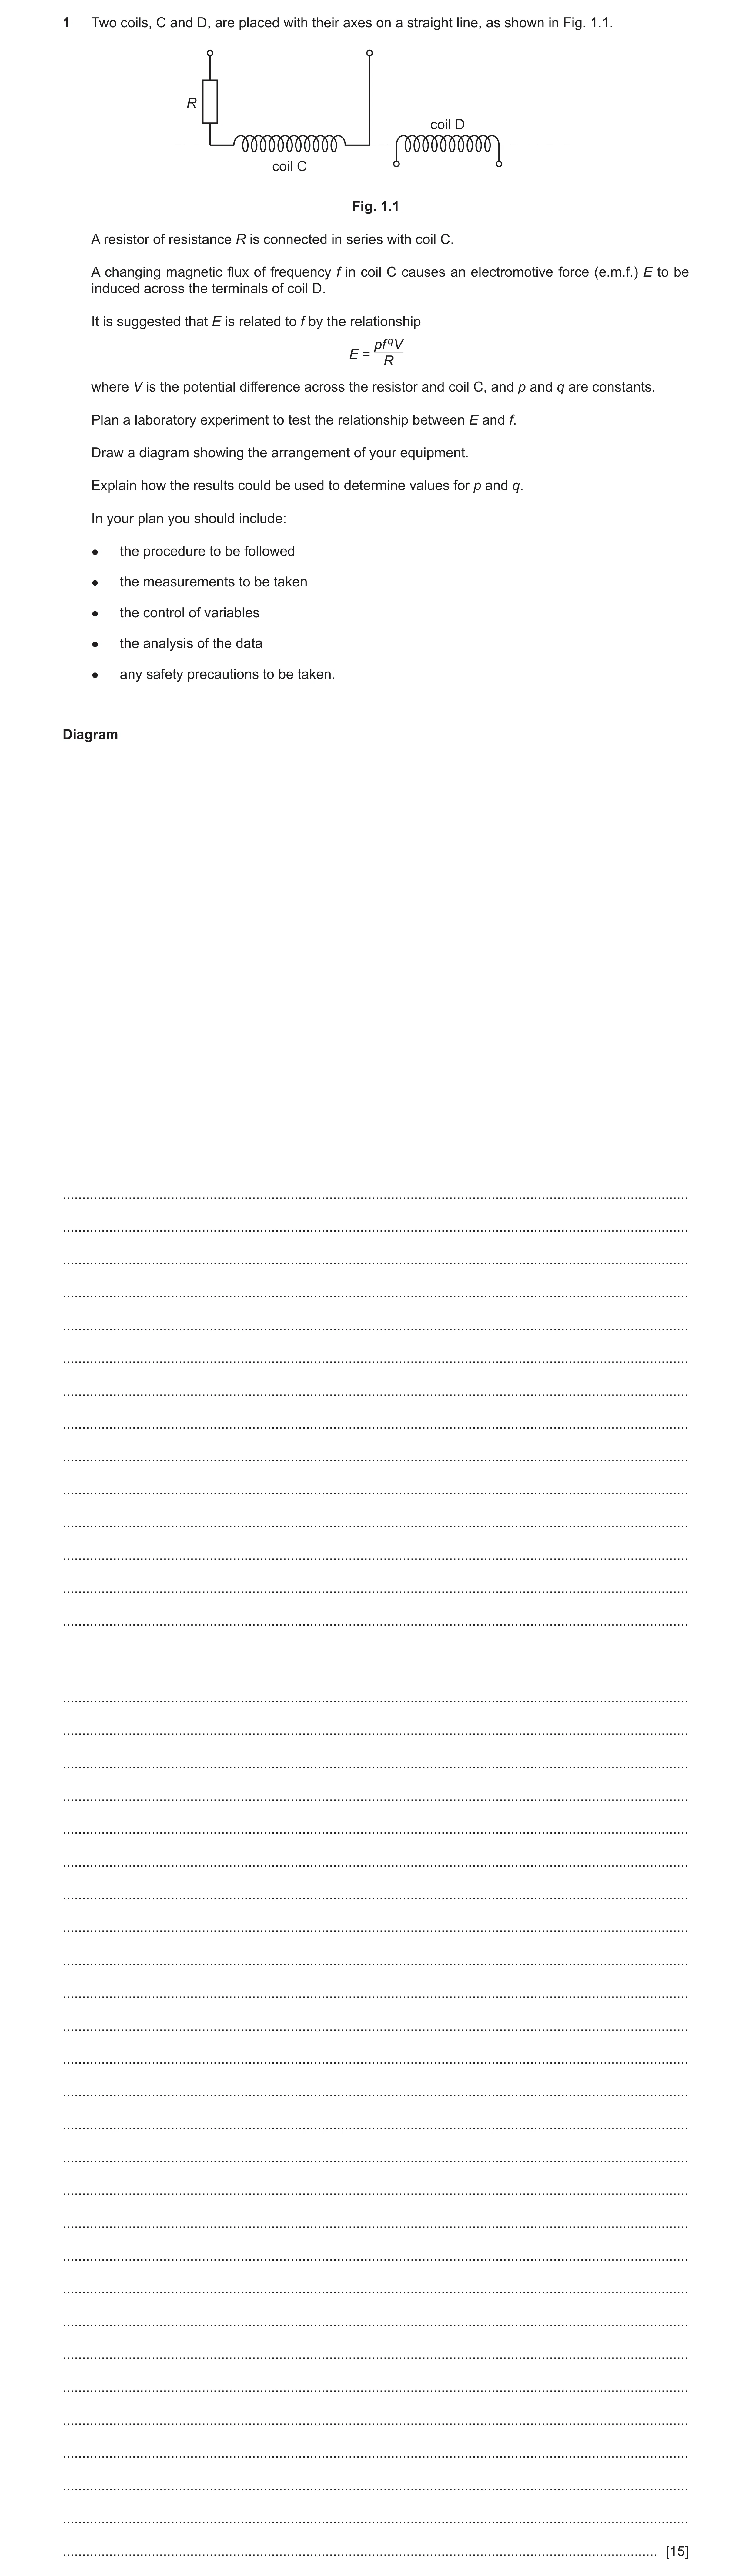
1 Two coils, C and D, are placed with their axes on a straight line, as shown in Fig. 1.1. R coil D coil C Fig. 1.1 A resistor of resistance R is connected in series with coil C. A changing magnetic flux of frequency f in coil C causes an electromotive force (e.m.f.) E to be induced across the terminals of coil D. It is suggested that E is related to f by the relationship pf qV E = R where V is the potential difference across the resistor and coil C, and p and q are constants. Plan a laboratory experiment to test the relationship between E and f. Draw a diagram showing the arrangement of your equipment. Explain how the results could be used to determine values for p and q. In your plan you should include: ● the procedure to be followed ● the measurements to be taken ● the control of variables ● the analysis of the data ● any safety precautions to be taken. Diagram … … … … … … … … … … … … … … … … … … … … … … … … … … … … … … … … … … … … … … … … … [15]
15 marks
Mark scheme: Question Answer Marks 1 Defining the problem. f is the independent variable and E is the dependent variable or vary f and measure E 1 keep V and R constant 1 Methods of data collection labelled diagram of workable experiment including: 1 • coils C and D placed with their axes on a straight line • separate workable circuit for coil D • (a.c.) voltmeter or oscilloscope connected across coil D (Do not accept a power supply connected to coil D.) a.c. power supply/signal generator connected to coil C 1 workable circuit for coil C with power supply and (a.c.) voltmeter/oscilloscope in parallel with resistor and coil C 1 method to determine f, e.g. read from signal generator or use of oscilloscope 1 Method of Analysis plot a graph of lg E against lg f or equivalent (e.g. ln E against ln f) 1 q = gradient 1 R -intercept 1 p = 10y V R -intercept (for ln E against ln f: p = ey ) V 1 Additional detail including safety considerations 6 D1 precaution (to prevent burns) from hot coils/hot resistor, e.g. use gloves to handle hot coil/resistor, switch off circuit and wait for hot coil/resistor to cool D2 keep the number of turns on each coil constant D3 keep distance between the coils constant D4 workable circuit diagram to determine R. e.g. circuit with ammeter connected in series and voltmeter in parallel with resistor or resistor connected to ohmmeter only D5 determination of resistance R: potential difference across R ÷ current in R or use ohmmeter to measure R D6 method to keep distance between the coils constant, e.g. fix/clamp coils to bench D7 method to determine f from oscilloscope, e.g. period T = time-base horizontal distance and f = 1 / T D8 method to determine V or E from oscilloscope, e.g. V or E = y-gain vertical distance D9 method to increase E e.g. use iron core, place coils closer, increase V, decrease R pV D10 relationship valid if a straight line is produced (passing through log ) R Do not accept line passing through the origin.
This question in 9702/51 Oct/Nov 2023
Q8 · Two coils, C and D, are placed with their axes on a straight line, as shown in Fig 9702/53 Oct/Nov 2023
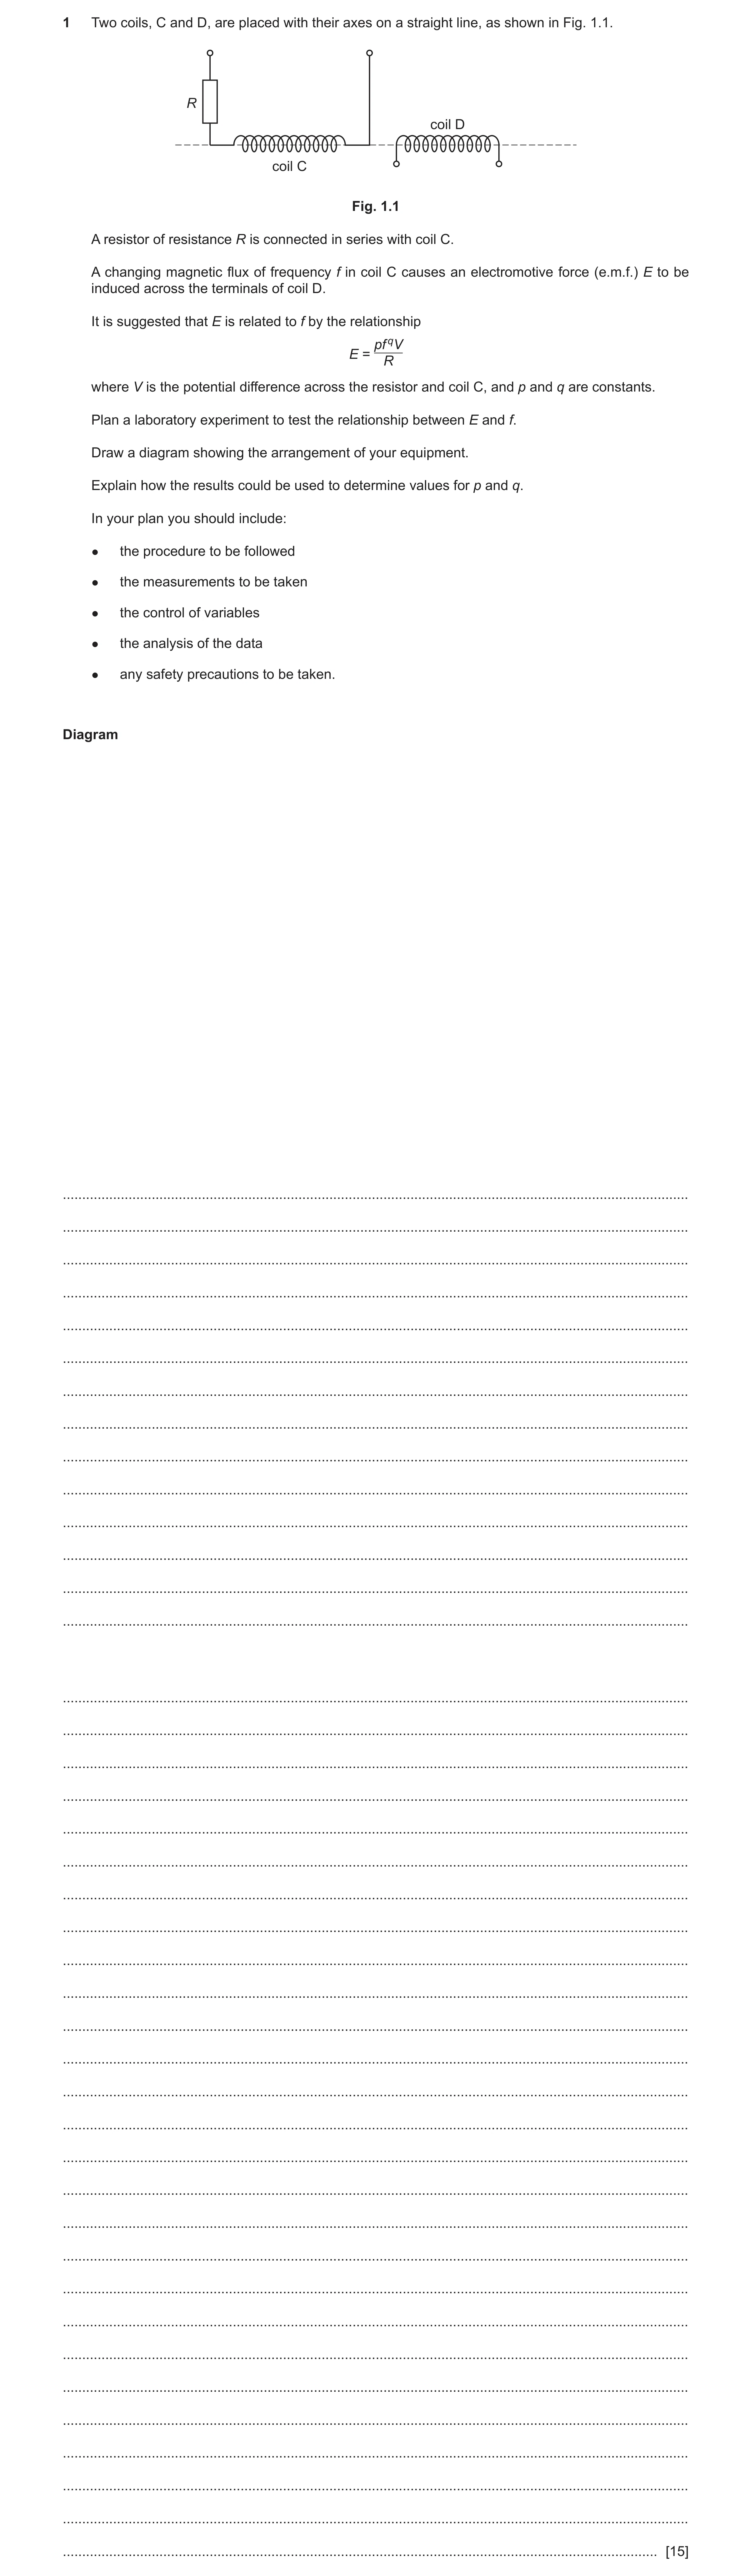
1 Two coils, C and D, are placed with their axes on a straight line, as shown in Fig. 1.1. R coil D coil C Fig. 1.1 A resistor of resistance R is connected in series with coil C. A changing magnetic flux of frequency f in coil C causes an electromotive force (e.m.f.) E to be induced across the terminals of coil D. It is suggested that E is related to f by the relationship pf qV E = R where V is the potential difference across the resistor and coil C, and p and q are constants. Plan a laboratory experiment to test the relationship between E and f. Draw a diagram showing the arrangement of your equipment. Explain how the results could be used to determine values for p and q. In your plan you should include: ● the procedure to be followed ● the measurements to be taken ● the control of variables ● the analysis of the data ● any safety precautions to be taken. Diagram … … … … … … … … … … … … … … … … … … … … … … … … … … … … … … … … … … … … … … … … … [15]
15 marks
Mark scheme: Question Answer Marks 1 Defining the problem. f is the independent variable and E is the dependent variable or vary f and measure E 1 keep V and R constant 1 Methods of data collection labelled diagram of workable experiment including: 1 • coils C and D placed with their axes on a straight line • separate workable circuit for coil D • (a.c.) voltmeter or oscilloscope connected across coil D (Do not accept a power supply connected to coil D.) a.c. power supply/signal generator connected to coil C 1 workable circuit for coil C with power supply and (a.c.) voltmeter/oscilloscope in parallel with resistor and coil C 1 method to determine f, e.g. read from signal generator or use of oscilloscope 1 Method of Analysis plot a graph of lg E against lg f or equivalent (e.g. ln E against ln f) 1 q = gradient 1 R -intercept 1 p = 10y V R -intercept (for ln E against ln f: p = ey ) V 1 Additional detail including safety considerations 6 D1 precaution (to prevent burns) from hot coils/hot resistor, e.g. use gloves to handle hot coil/resistor, switch off circuit and wait for hot coil/resistor to cool D2 keep the number of turns on each coil constant D3 keep distance between the coils constant D4 workable circuit diagram to determine R. e.g. circuit with ammeter connected in series and voltmeter in parallel with resistor or resistor connected to ohmmeter only D5 determination of resistance R: potential difference across R ÷ current in R or use ohmmeter to measure R D6 method to keep distance between the coils constant, e.g. fix/clamp coils to bench D7 method to determine f from oscilloscope, e.g. period T = time-base horizontal distance and f = 1 / T D8 method to determine V or E from oscilloscope, e.g. V or E = y-gain vertical distance D9 method to increase E e.g. use iron core, place coils closer, increase V, decrease R pV D10 relationship valid if a straight line is produced (passing through log ) R Do not accept line passing through the origin.
This question in 9702/53 Oct/Nov 2023
Q9 · A thin coil of cross-sectional area A and length l connected to a resistor of resistance… 9702/51 May/June 2025
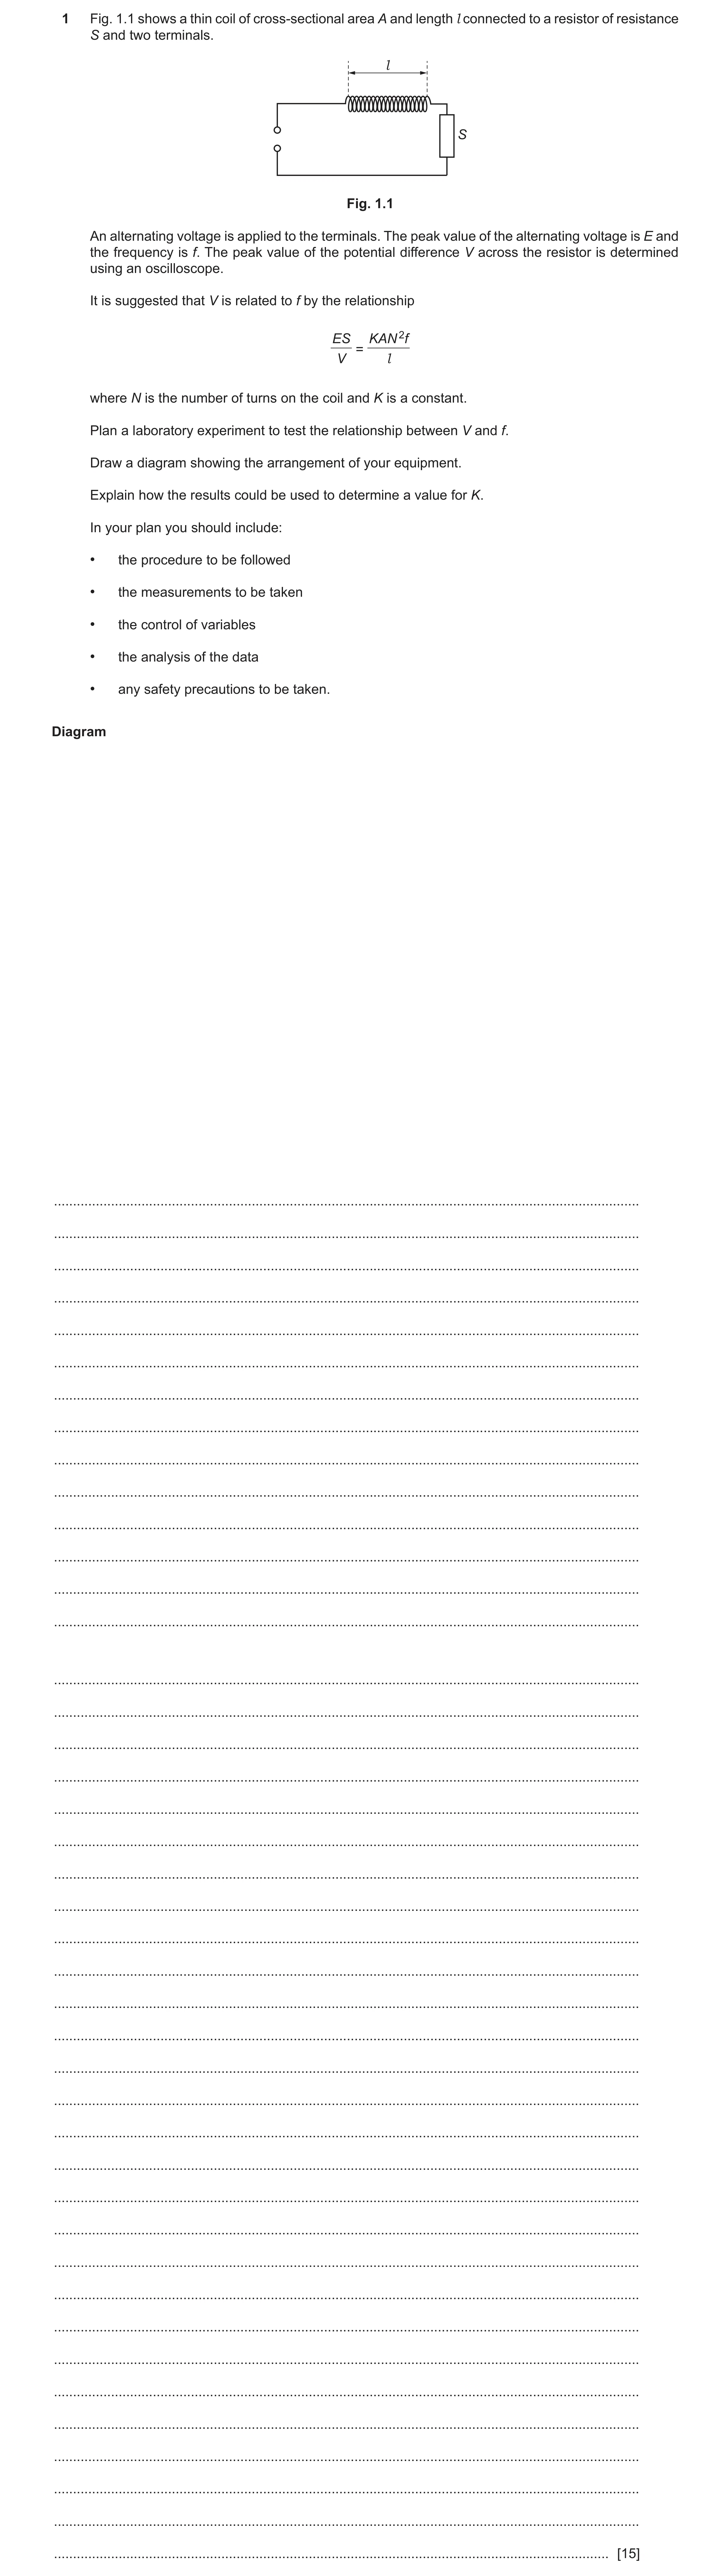
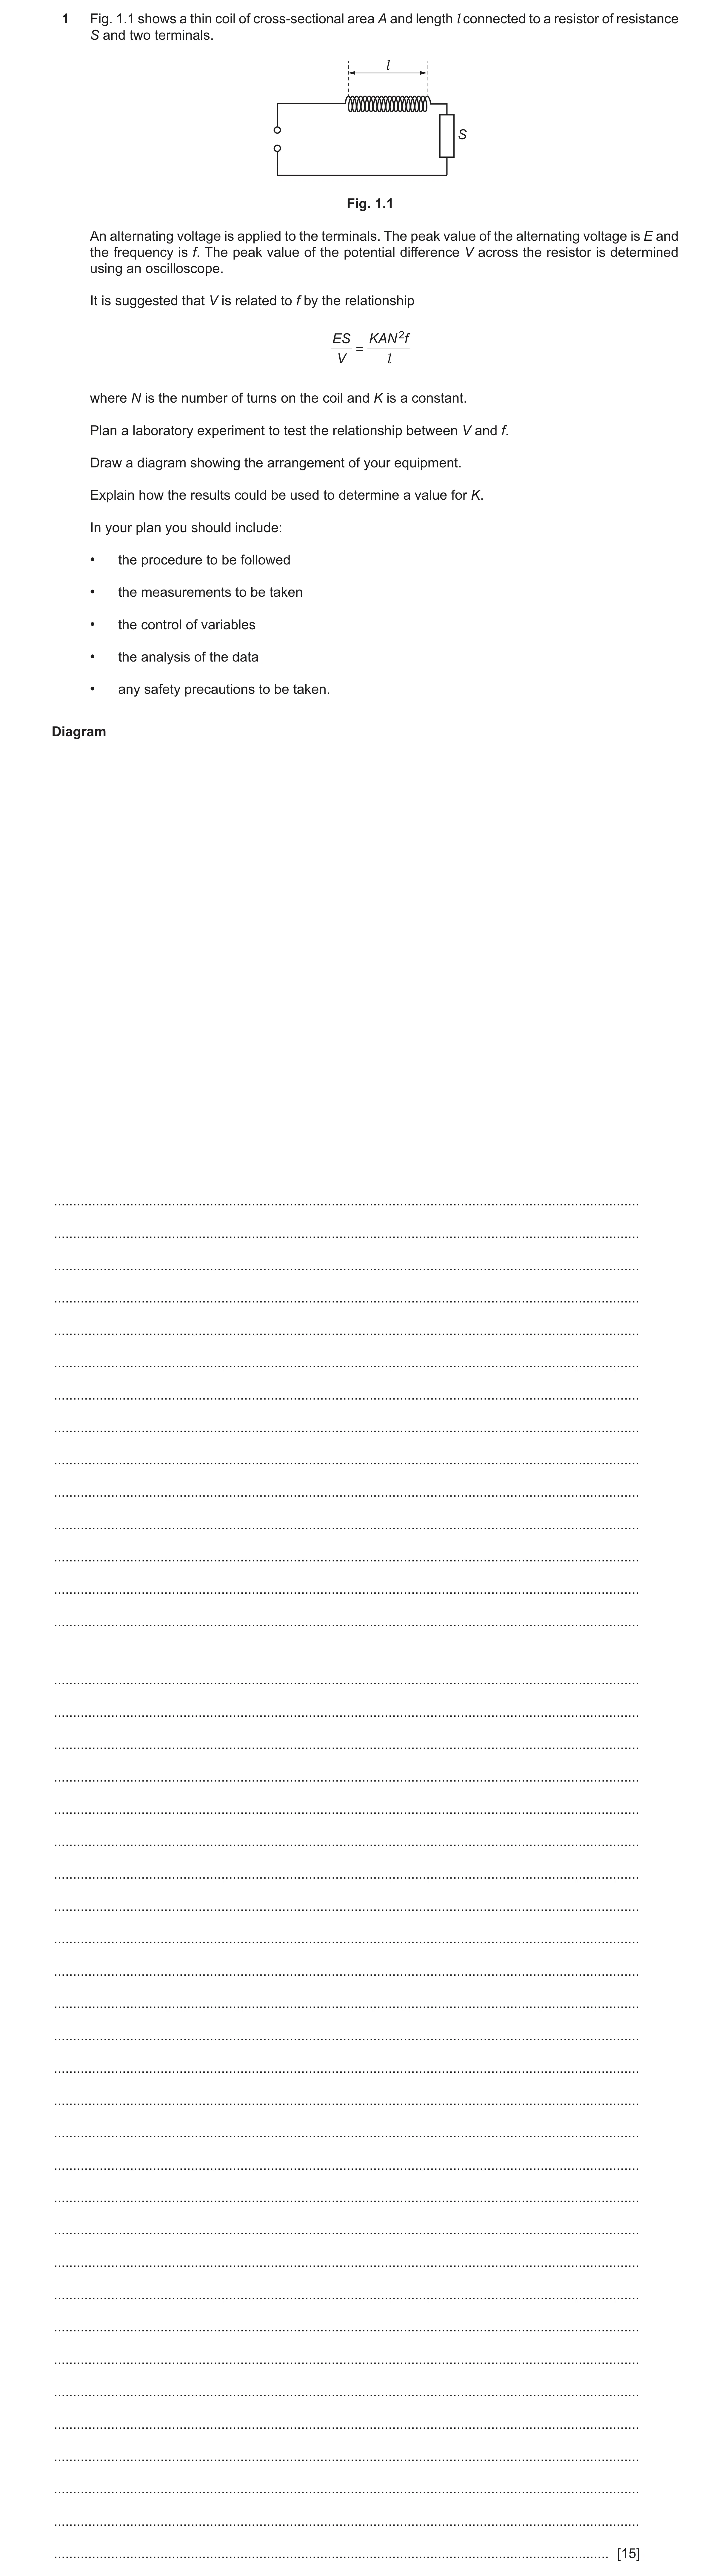
1 Fig. 1.1 shows a thin coil of cross-sectional area A and length l connected to a resistor of resistance S and two terminals. l S Fig. 1.1 An alternating voltage is applied to the terminals. The peak value of the alternating voltage is E and the frequency is f. The peak value of the potential difference V across the resistor is determined using an oscilloscope. It is suggested that V is related to f by the relationship ES KAN 2f = V l where N is the number of turns on the coil and K is a constant. Plan a laboratory experiment to test the relationship between V and f. Draw a diagram showing the arrangement of your equipment. Explain how the results could be used to determine a value for K. In your plan you should include: • the procedure to be followed • the measurements to be taken • the control of variables • the analysis of the data • any safety precautions to be taken. Diagram … … … … … … … … … … … … … … … … … … … … … … … … … … … … … … … … … … … … … … … … … … [15]
15 marks
Mark scheme: Question Answer Marks 1 Defining the problem vary f and measure V or f is the independent variable and V is the dependent variable 1 keep E constant 1 Methods of data collection labelled diagram of workable experiment including: 1 • circuit with a.c. supply • oscilloscope connected in parallel with the resistor • workable circuit • oscilloscope and a.c. supply labelled labelled signal generator or variable frequency power supply connected across the terminals 1 method to determine V or E from oscilloscope, e.g. multiply amplitude / height of wave by y-gain on oscilloscope 1 method to determine f from oscilloscope, e.g. determine period T by multiplying number of divisions in 1 cycle or horizontal 1 distance in 1 cycle by the time base and f = 1 / T Method of Analysis 1 1 1 plot a graph of against f or equivalent, e.g. f against V V Allow logarithms e.g. lg V against lg f. relationship valid if a straight line is produced passing through the origin 1 (for lg V against lg f: relationship valid if a straight line is produced with gradient = −1) 1 1 1 1 against f f against V V l ES l ES 1 K = gradient K = 2 2 AN AN gradient El S − y -intercept (for lg V against lg f: K = 10 ). AN 2 Additional detail including safety considerations 6 D1 precaution linked to hot coil or hot resistor or prevention of burns from coil or resistor, e.g. use gloves / switch off power supply when not measuring V to prevent burns from coil / resistor D2 keep N and A and l and S constant D3 method to keep S constant, e.g. switch off power supply between readings to prevent heating of resistor or to allow resistor to cool d 2 D4 method to determine A, e.g. use calipers / micrometer to measure diameter (of coil) / d and A= 4 D5 repeat measurements of diameter d along the length of the coil / in different directions and determine the average value of d D6 method to determine the value of S, e.g. separate circuit diagram showing resistor connected to ohmmeter, or circuit diagram showing resistor connected to a power supply with an ammeter and voltmeter and S = V / I D7 measure l with a ruler / calipers D8 oscilloscope drawn connected across terminals / across signal generator and description to determine E D9 adjust y-gain for maximum amplitude or adjust time base for length of one wave or measure n waves and divide measured time by n 1 D10 method to keep E constant, e.g. check p.d. and alter supply or method to keep l constant, e.g. tape coil or method to keep A constant, e.g. wind wire on a cylinder
This question in 9702/51 May/June 2025
Q10 · A thin coil of cross-sectional area A and length l connected to a resistor of resistance… 9702/53 May/June 2025
1 Fig. 1.1 shows a thin coil of cross-sectional area A and length l connected to a resistor of resistance S and two terminals. l S Fig. 1.1 An alternating voltage is applied to the terminals. The peak value of the alternating voltage is E and the frequency is f. The peak value of the potential difference V across the resistor is determined using an oscilloscope. It is suggested that V is related to f by the relationship ES KAN 2f = V l where N is the number of turns on the coil and K is a constant. Plan a laboratory experiment to test the relationship between V and f. Draw a diagram showing the arrangement of your equipment. Explain how the results could be used to determine a value for K. In your plan you should include: • the procedure to be followed • the measurements to be taken • the control of variables • the analysis of the data • any safety precautions to be taken. Diagram … … … … … … … … … … … … … … … … … … … … … … … … … … … … … … … … … … … … … … … … … … [15]
15 marks
Mark scheme: Question Answer Marks 1 Defining the problem vary f and measure V or f is the independent variable and V is the dependent variable 1 keep E constant 1 Methods of data collection labelled diagram of workable experiment including: 1 • circuit with a.c. supply • oscilloscope connected in parallel with the resistor • workable circuit • oscilloscope and a.c. supply labelled labelled signal generator or variable frequency power supply connected across the terminals 1 method to determine V or E from oscilloscope, e.g. multiply amplitude / height of wave by y-gain on oscilloscope 1 method to determine f from oscilloscope, e.g. determine period T by multiplying number of divisions in 1 cycle or horizontal 1 distance in 1 cycle by the time base and f = 1 / T Method of Analysis 1 1 1 plot a graph of against f or equivalent, e.g. f against V V Allow logarithms e.g. lg V against lg f. relationship valid if a straight line is produced passing through the origin 1 (for lg V against lg f: relationship valid if a straight line is produced with gradient = −1) 1 1 1 1 against f f against V V l ES l ES 1 K = gradient K = 2 2 AN AN gradient El S − y -intercept (for lg V against lg f: K = 10 ). AN 2 Additional detail including safety considerations 6 D1 precaution linked to hot coil or hot resistor or prevention of burns from coil or resistor, e.g. use gloves / switch off power supply when not measuring V to prevent burns from coil / resistor D2 keep N and A and l and S constant D3 method to keep S constant, e.g. switch off power supply between readings to prevent heating of resistor or to allow resistor to cool d 2 D4 method to determine A, e.g. use calipers / micrometer to measure diameter (of coil) / d and A= 4 D5 repeat measurements of diameter d along the length of the coil / in different directions and determine the average value of d D6 method to determine the value of S, e.g. separate circuit diagram showing resistor connected to ohmmeter, or circuit diagram showing resistor connected to a power supply with an ammeter and voltmeter and S = V / I D7 measure l with a ruler / calipers D8 oscilloscope drawn connected across terminals / across signal generator and description to determine E D9 adjust y-gain for maximum amplitude or adjust time base for length of one wave or measure n waves and divide measured time by n 1 D10 method to keep E constant, e.g. check p.d. and alter supply or method to keep l constant, e.g. tape coil or method to keep A constant, e.g. wind wire on a cylinder
This question in 9702/53 May/June 2025
 15
15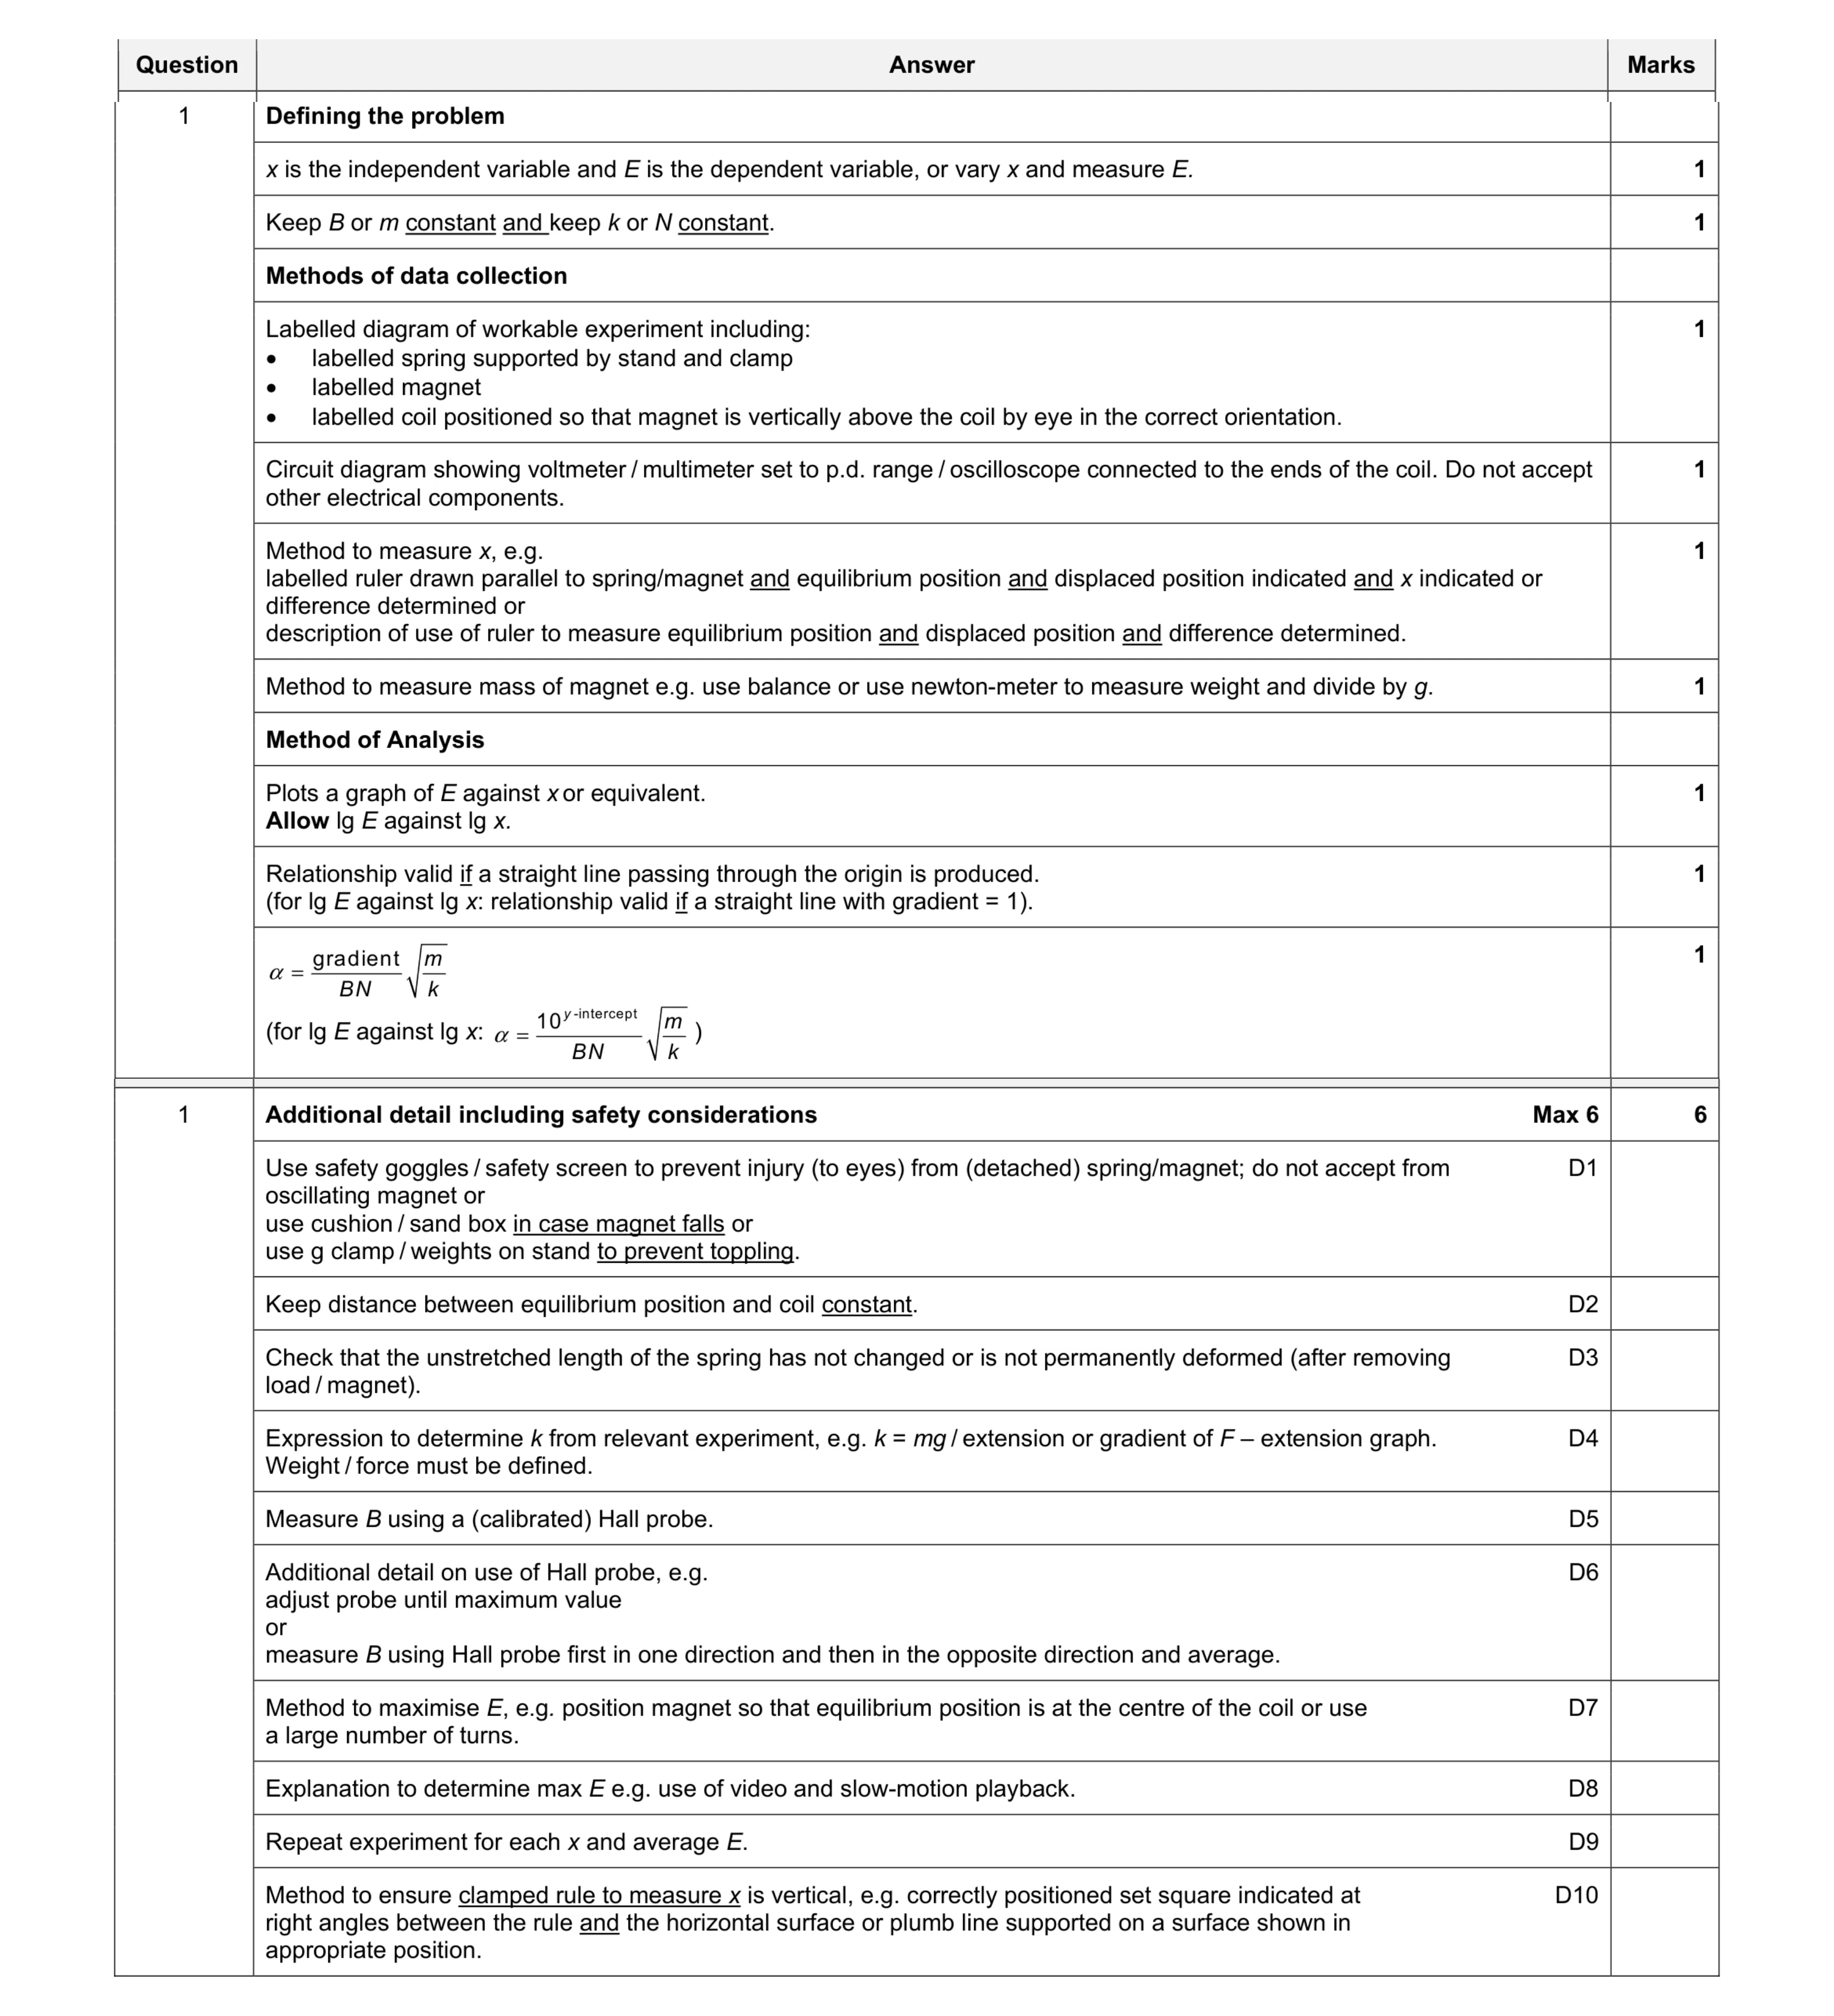 15
15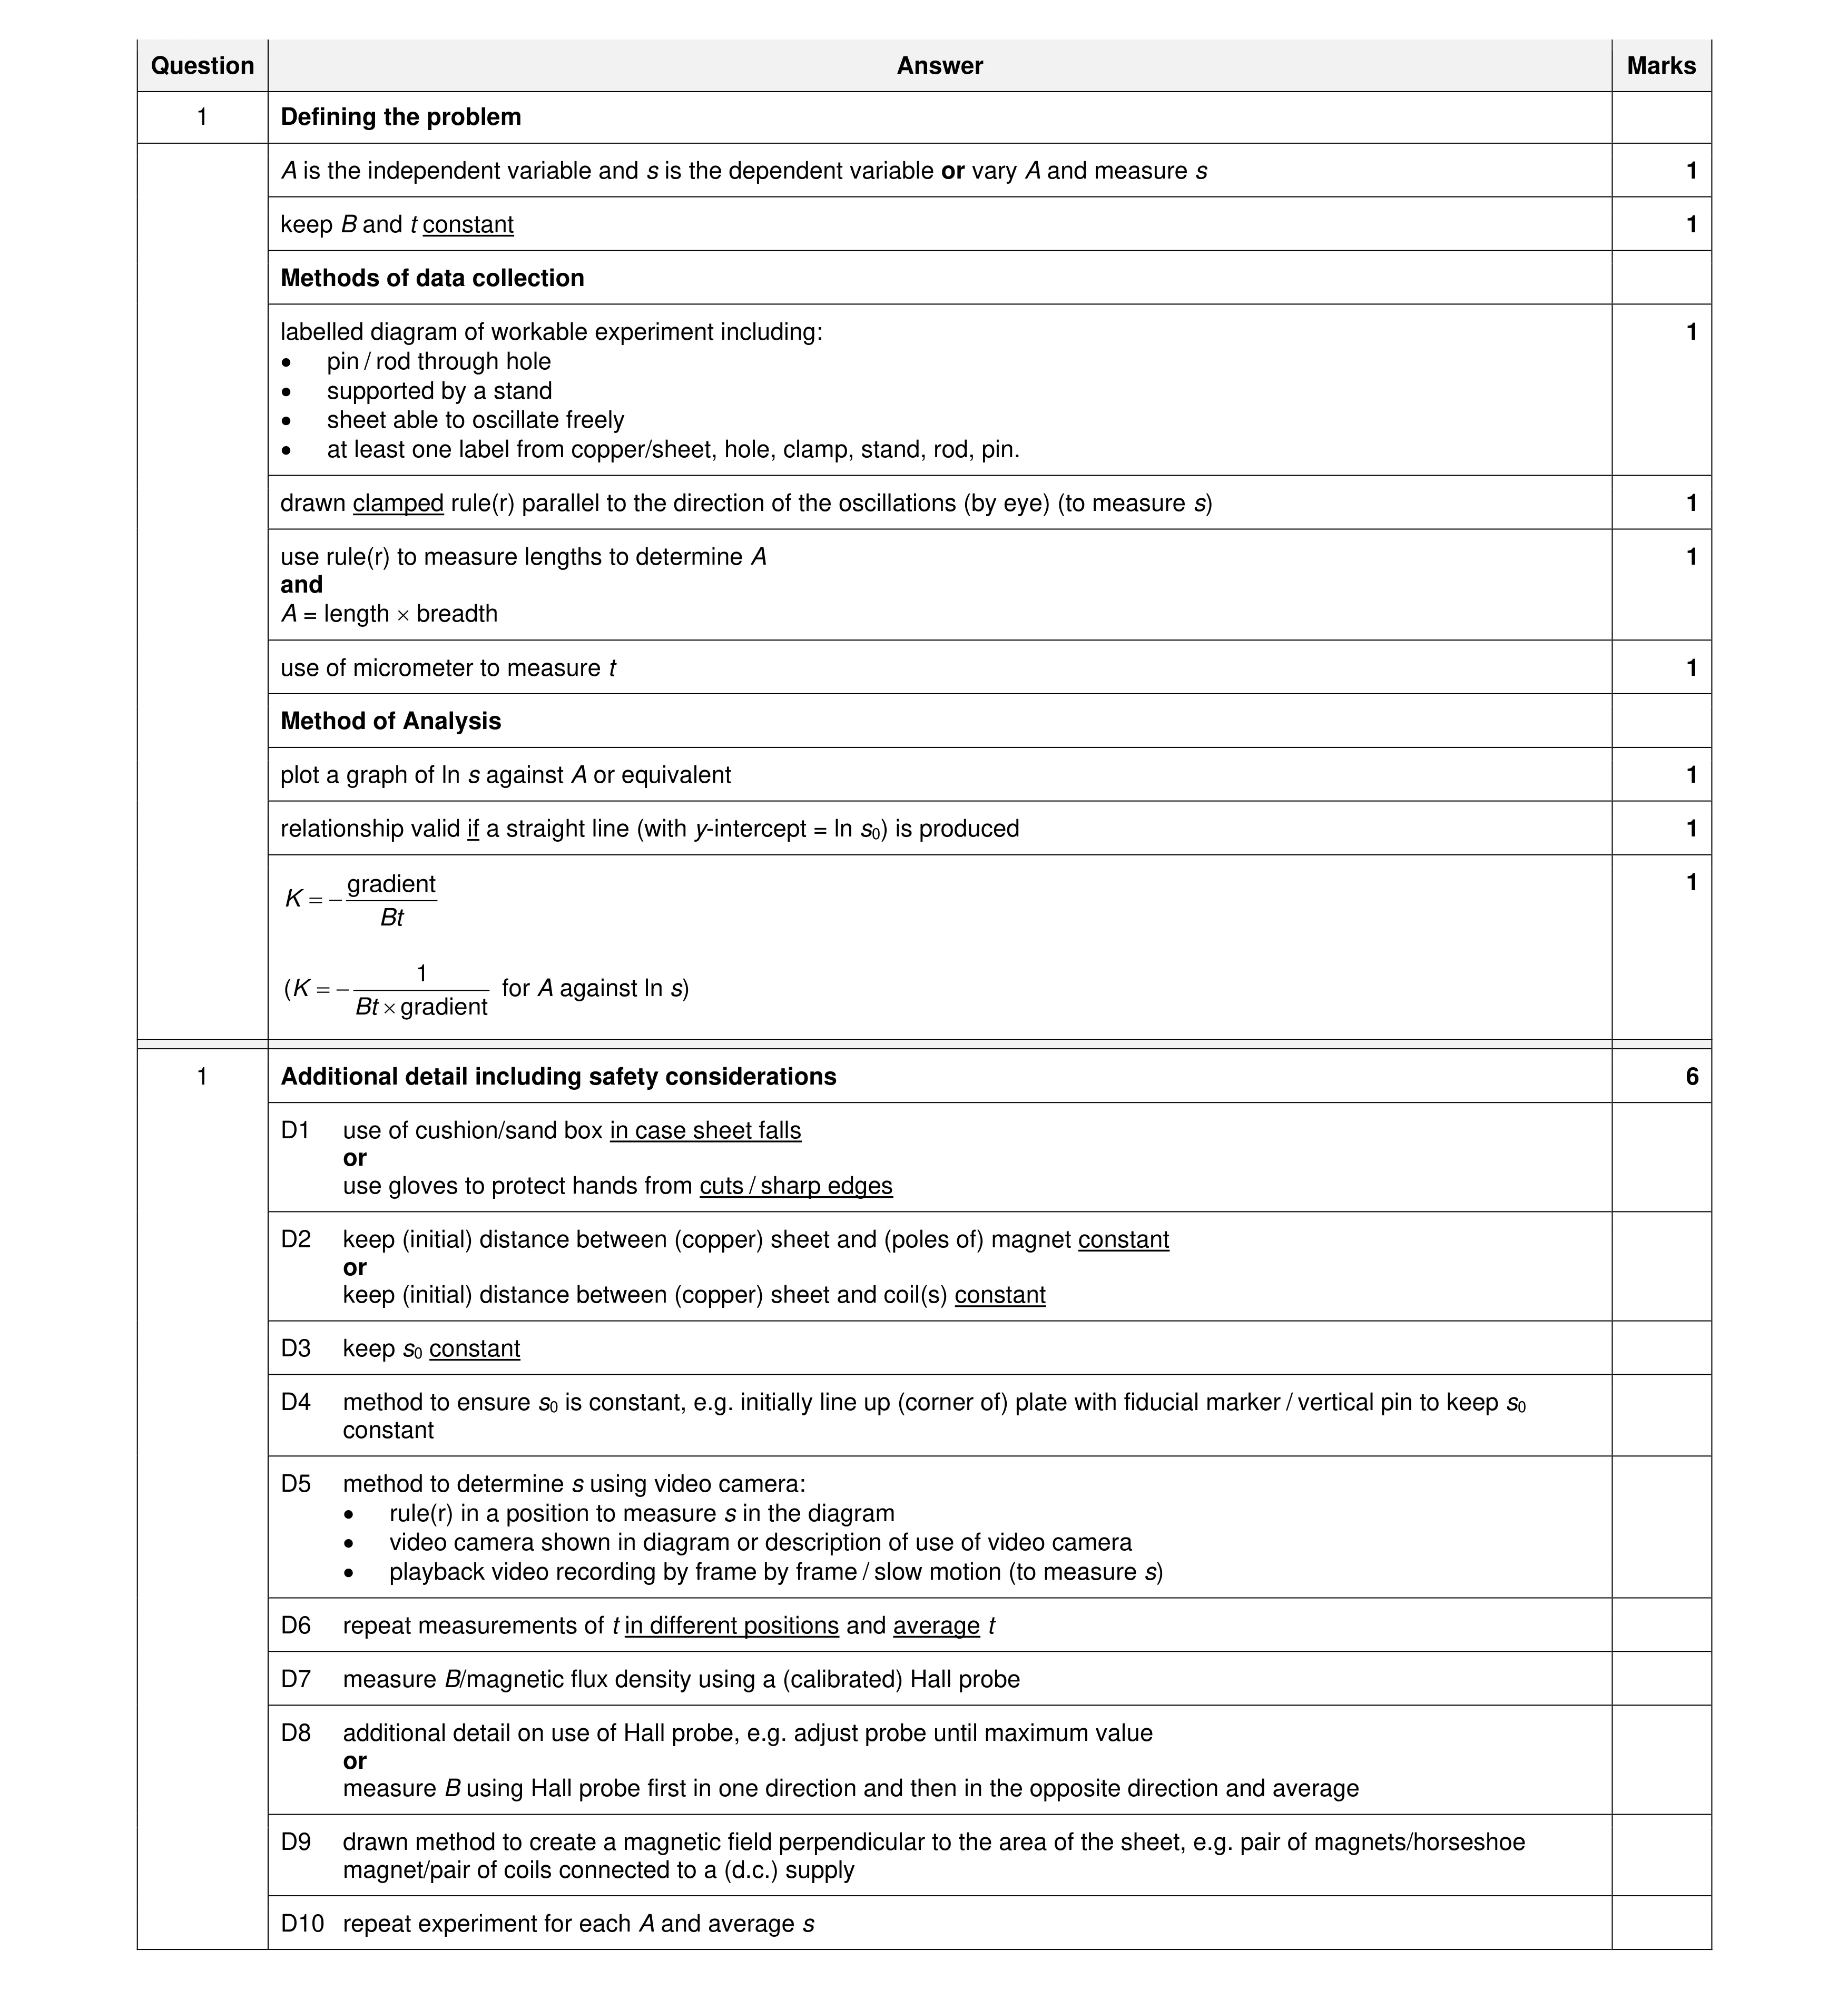 15
15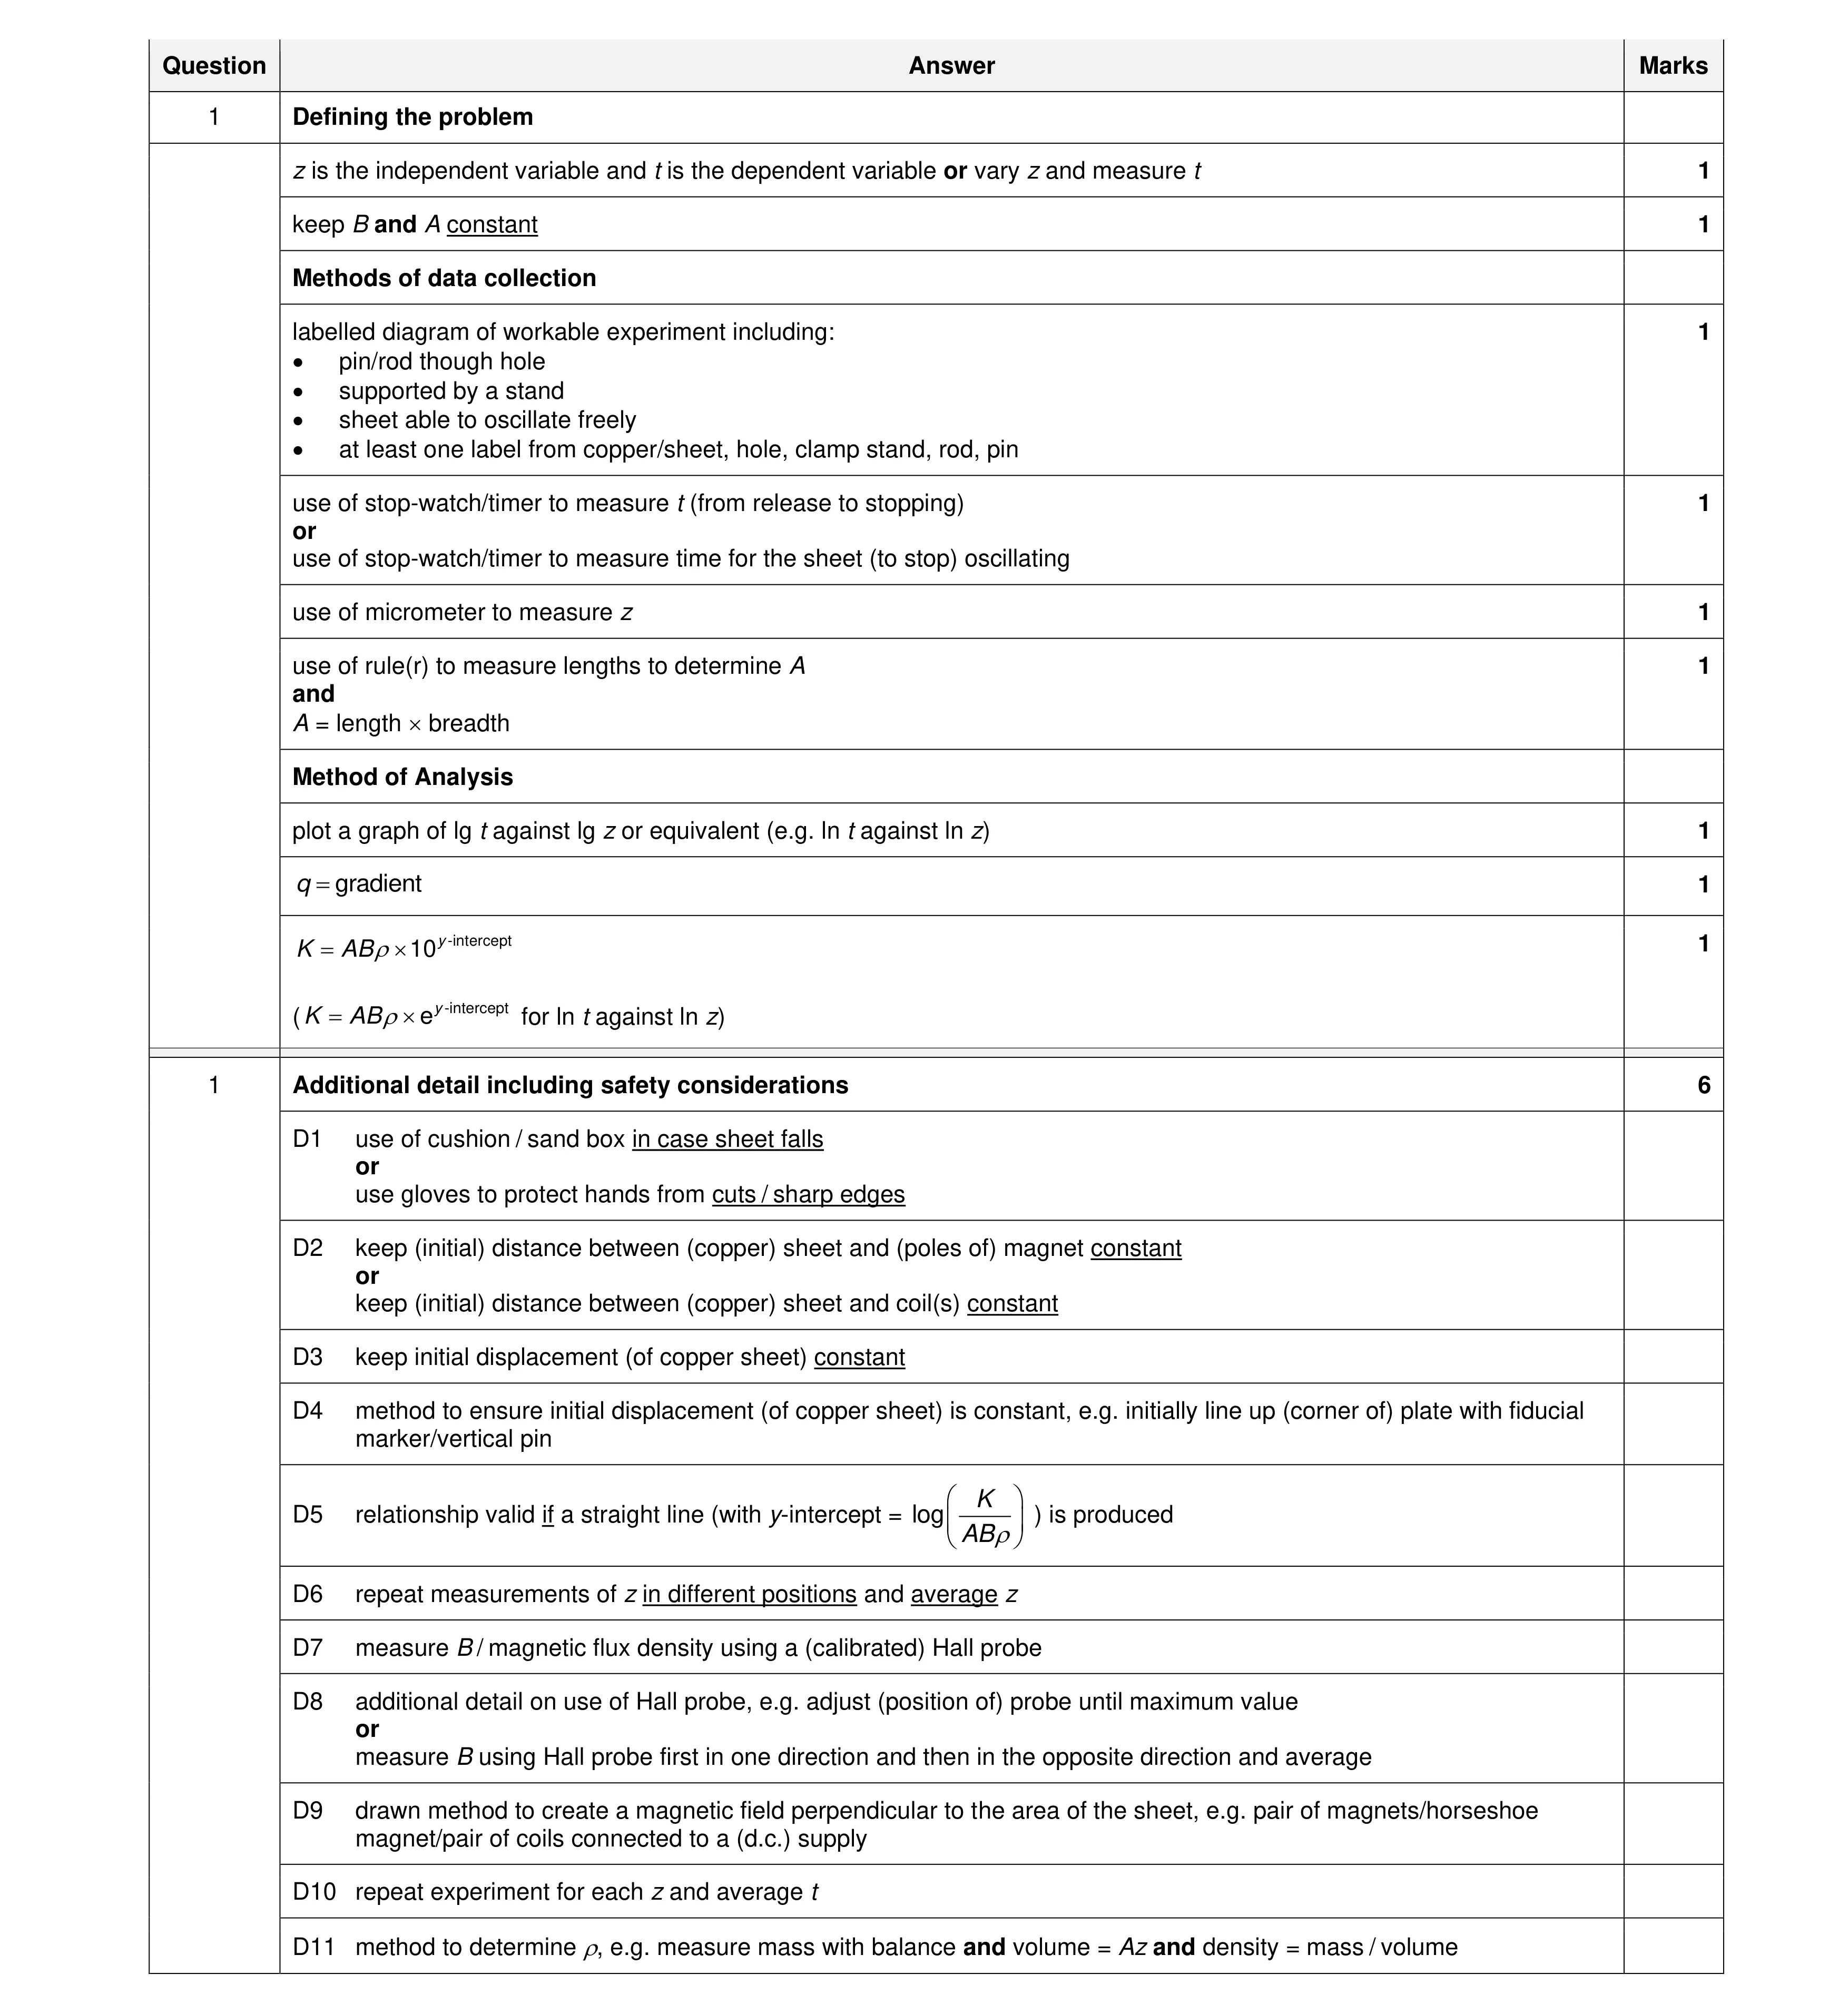 15
15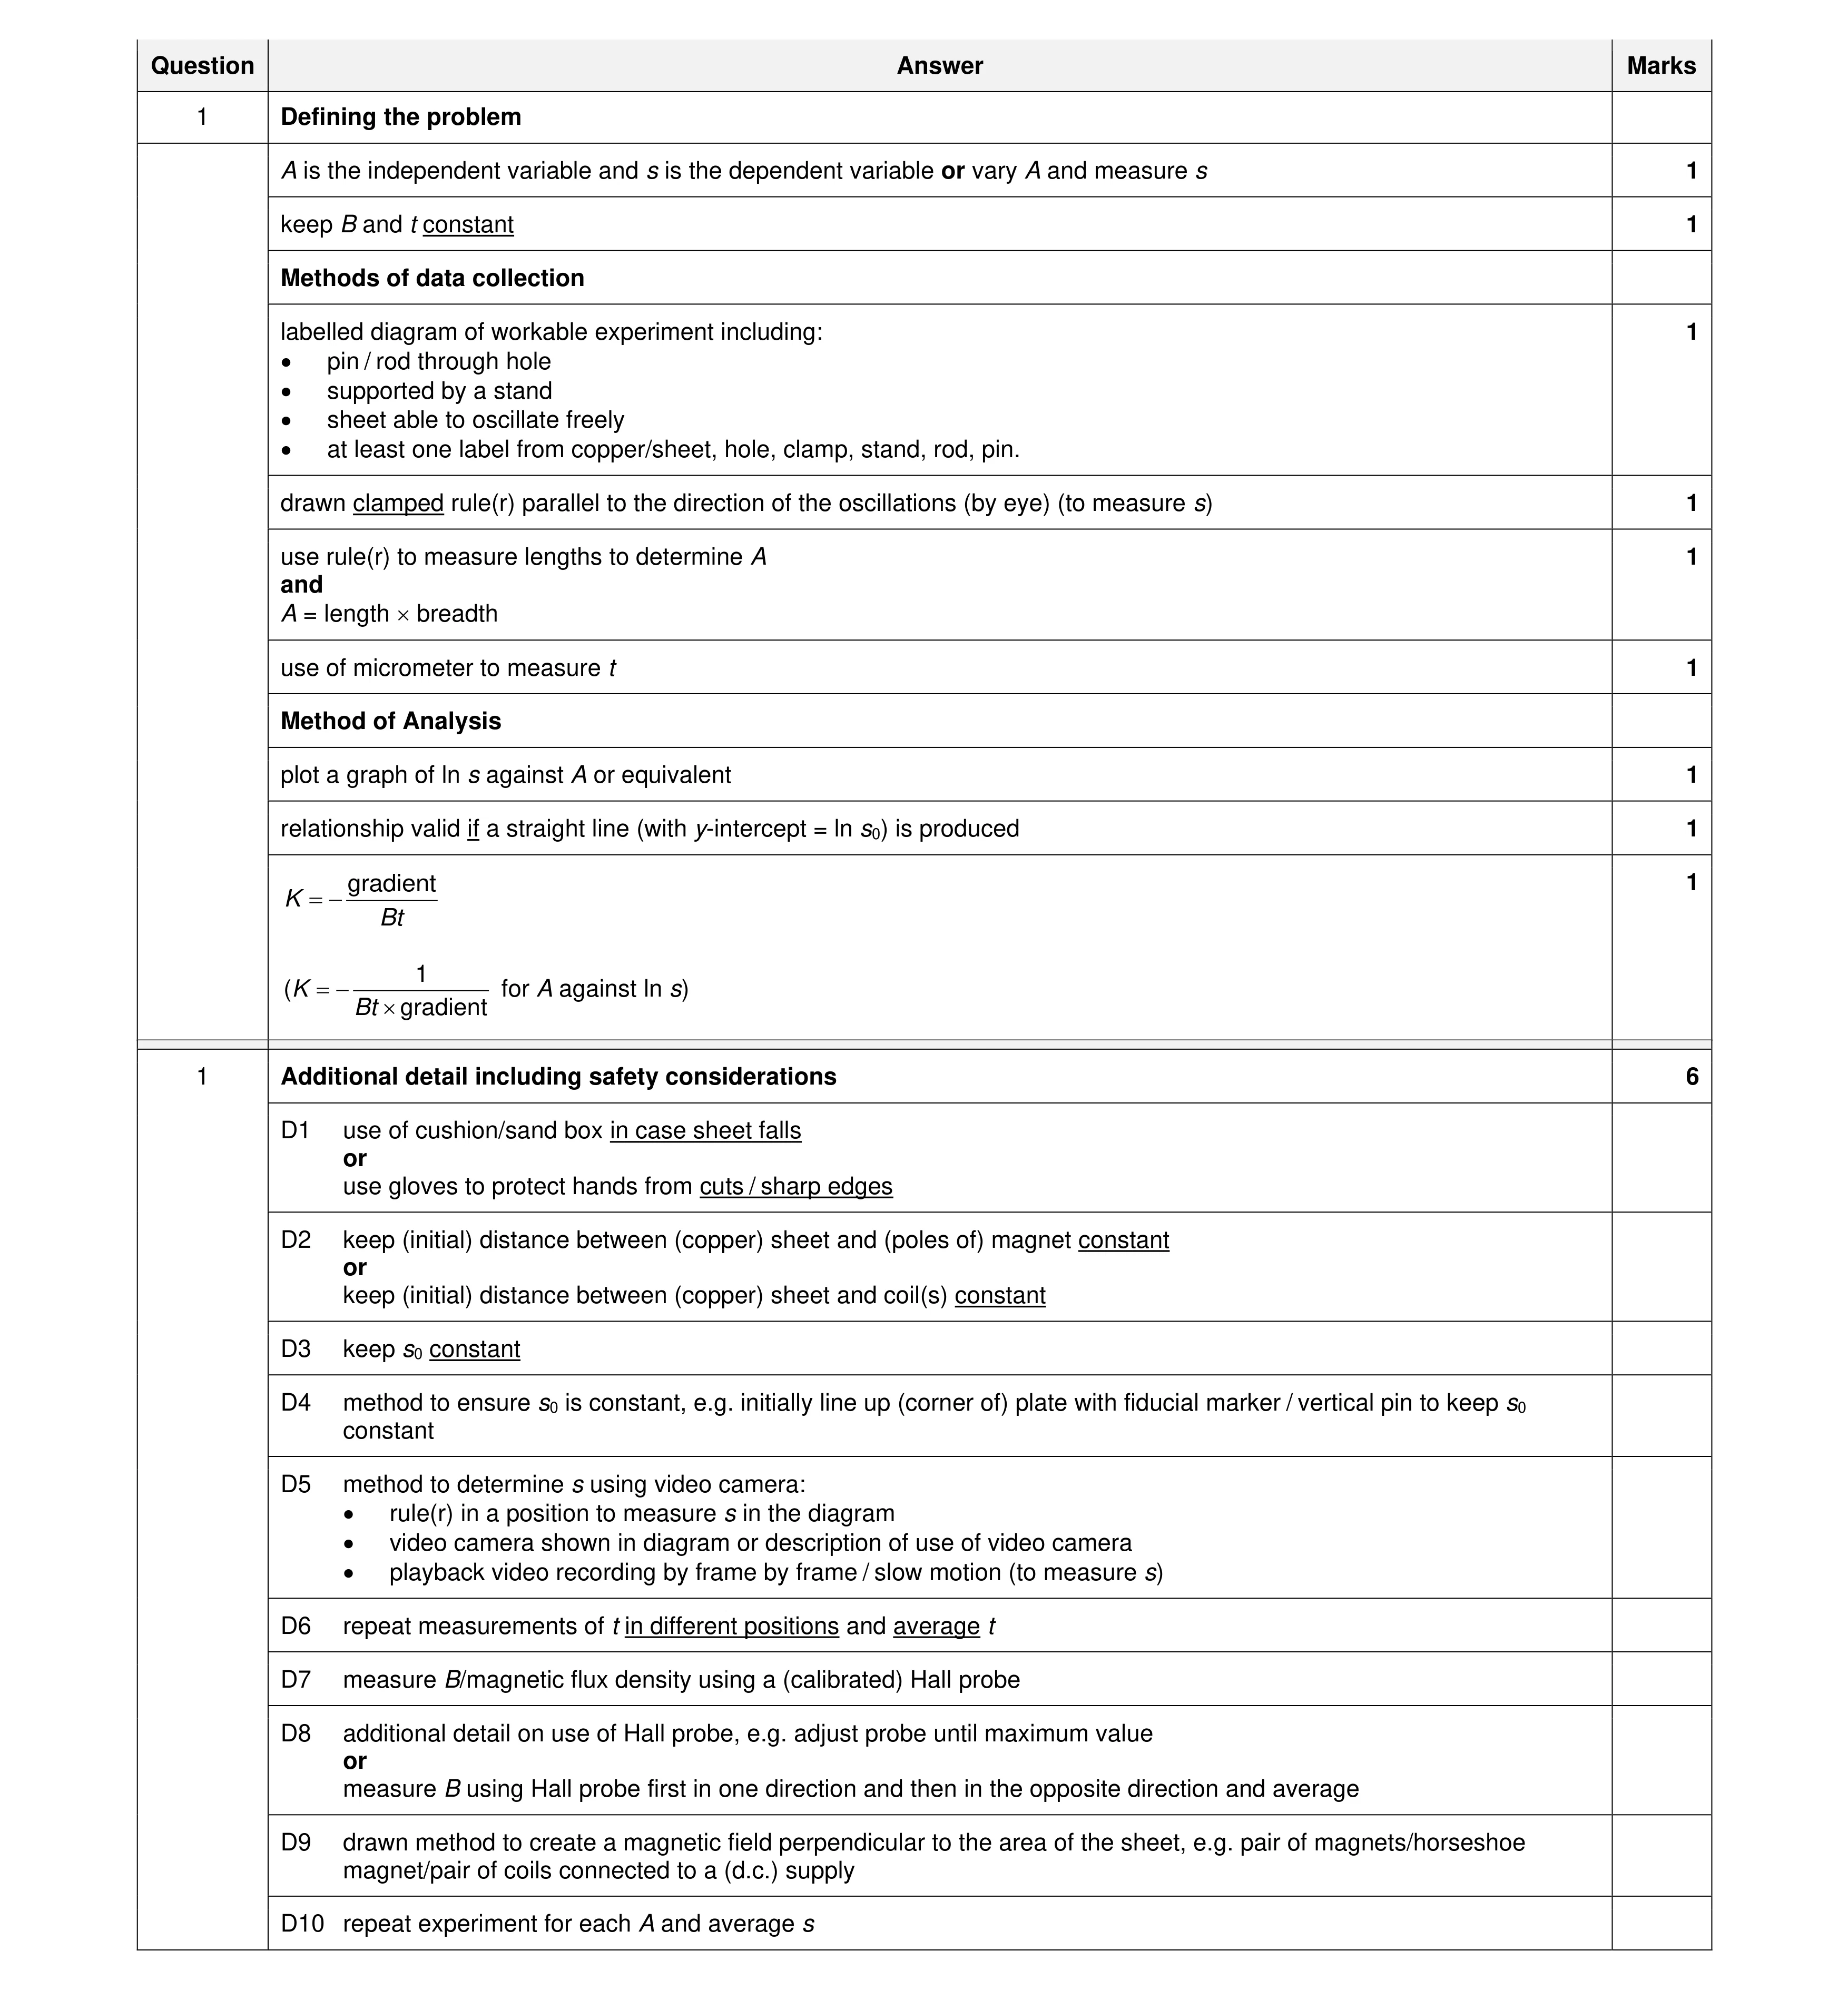 15
15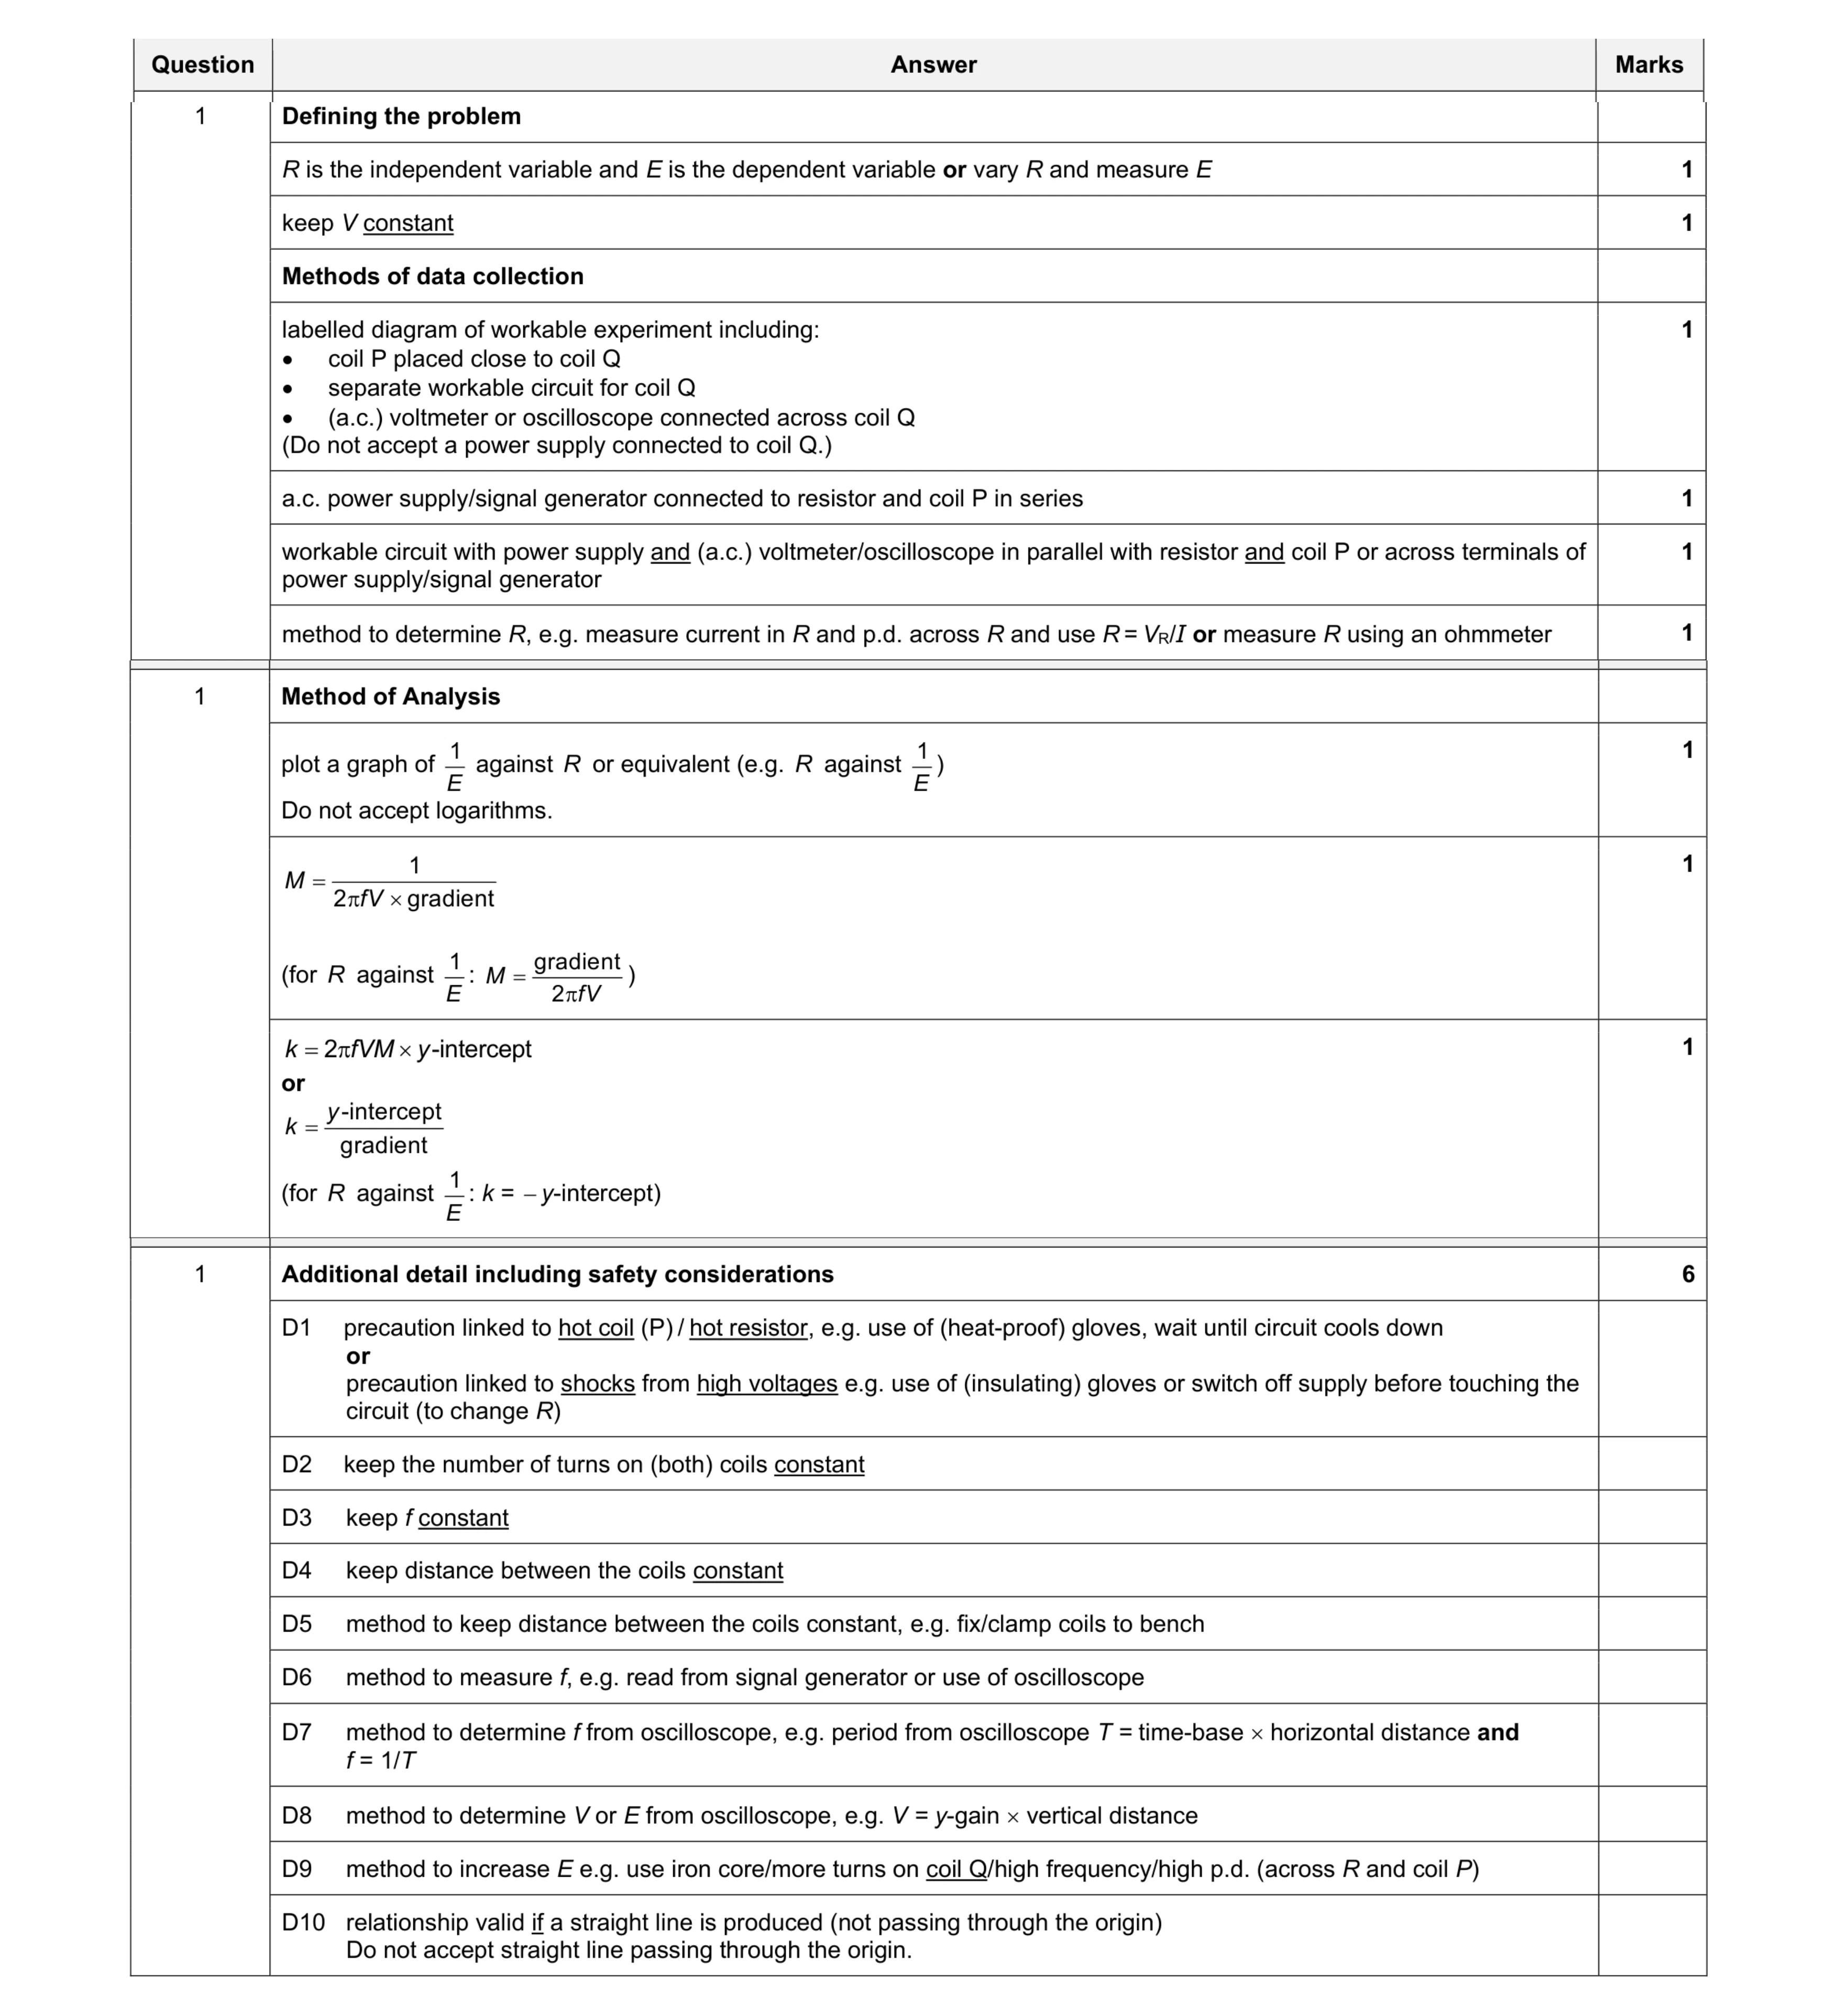 15
15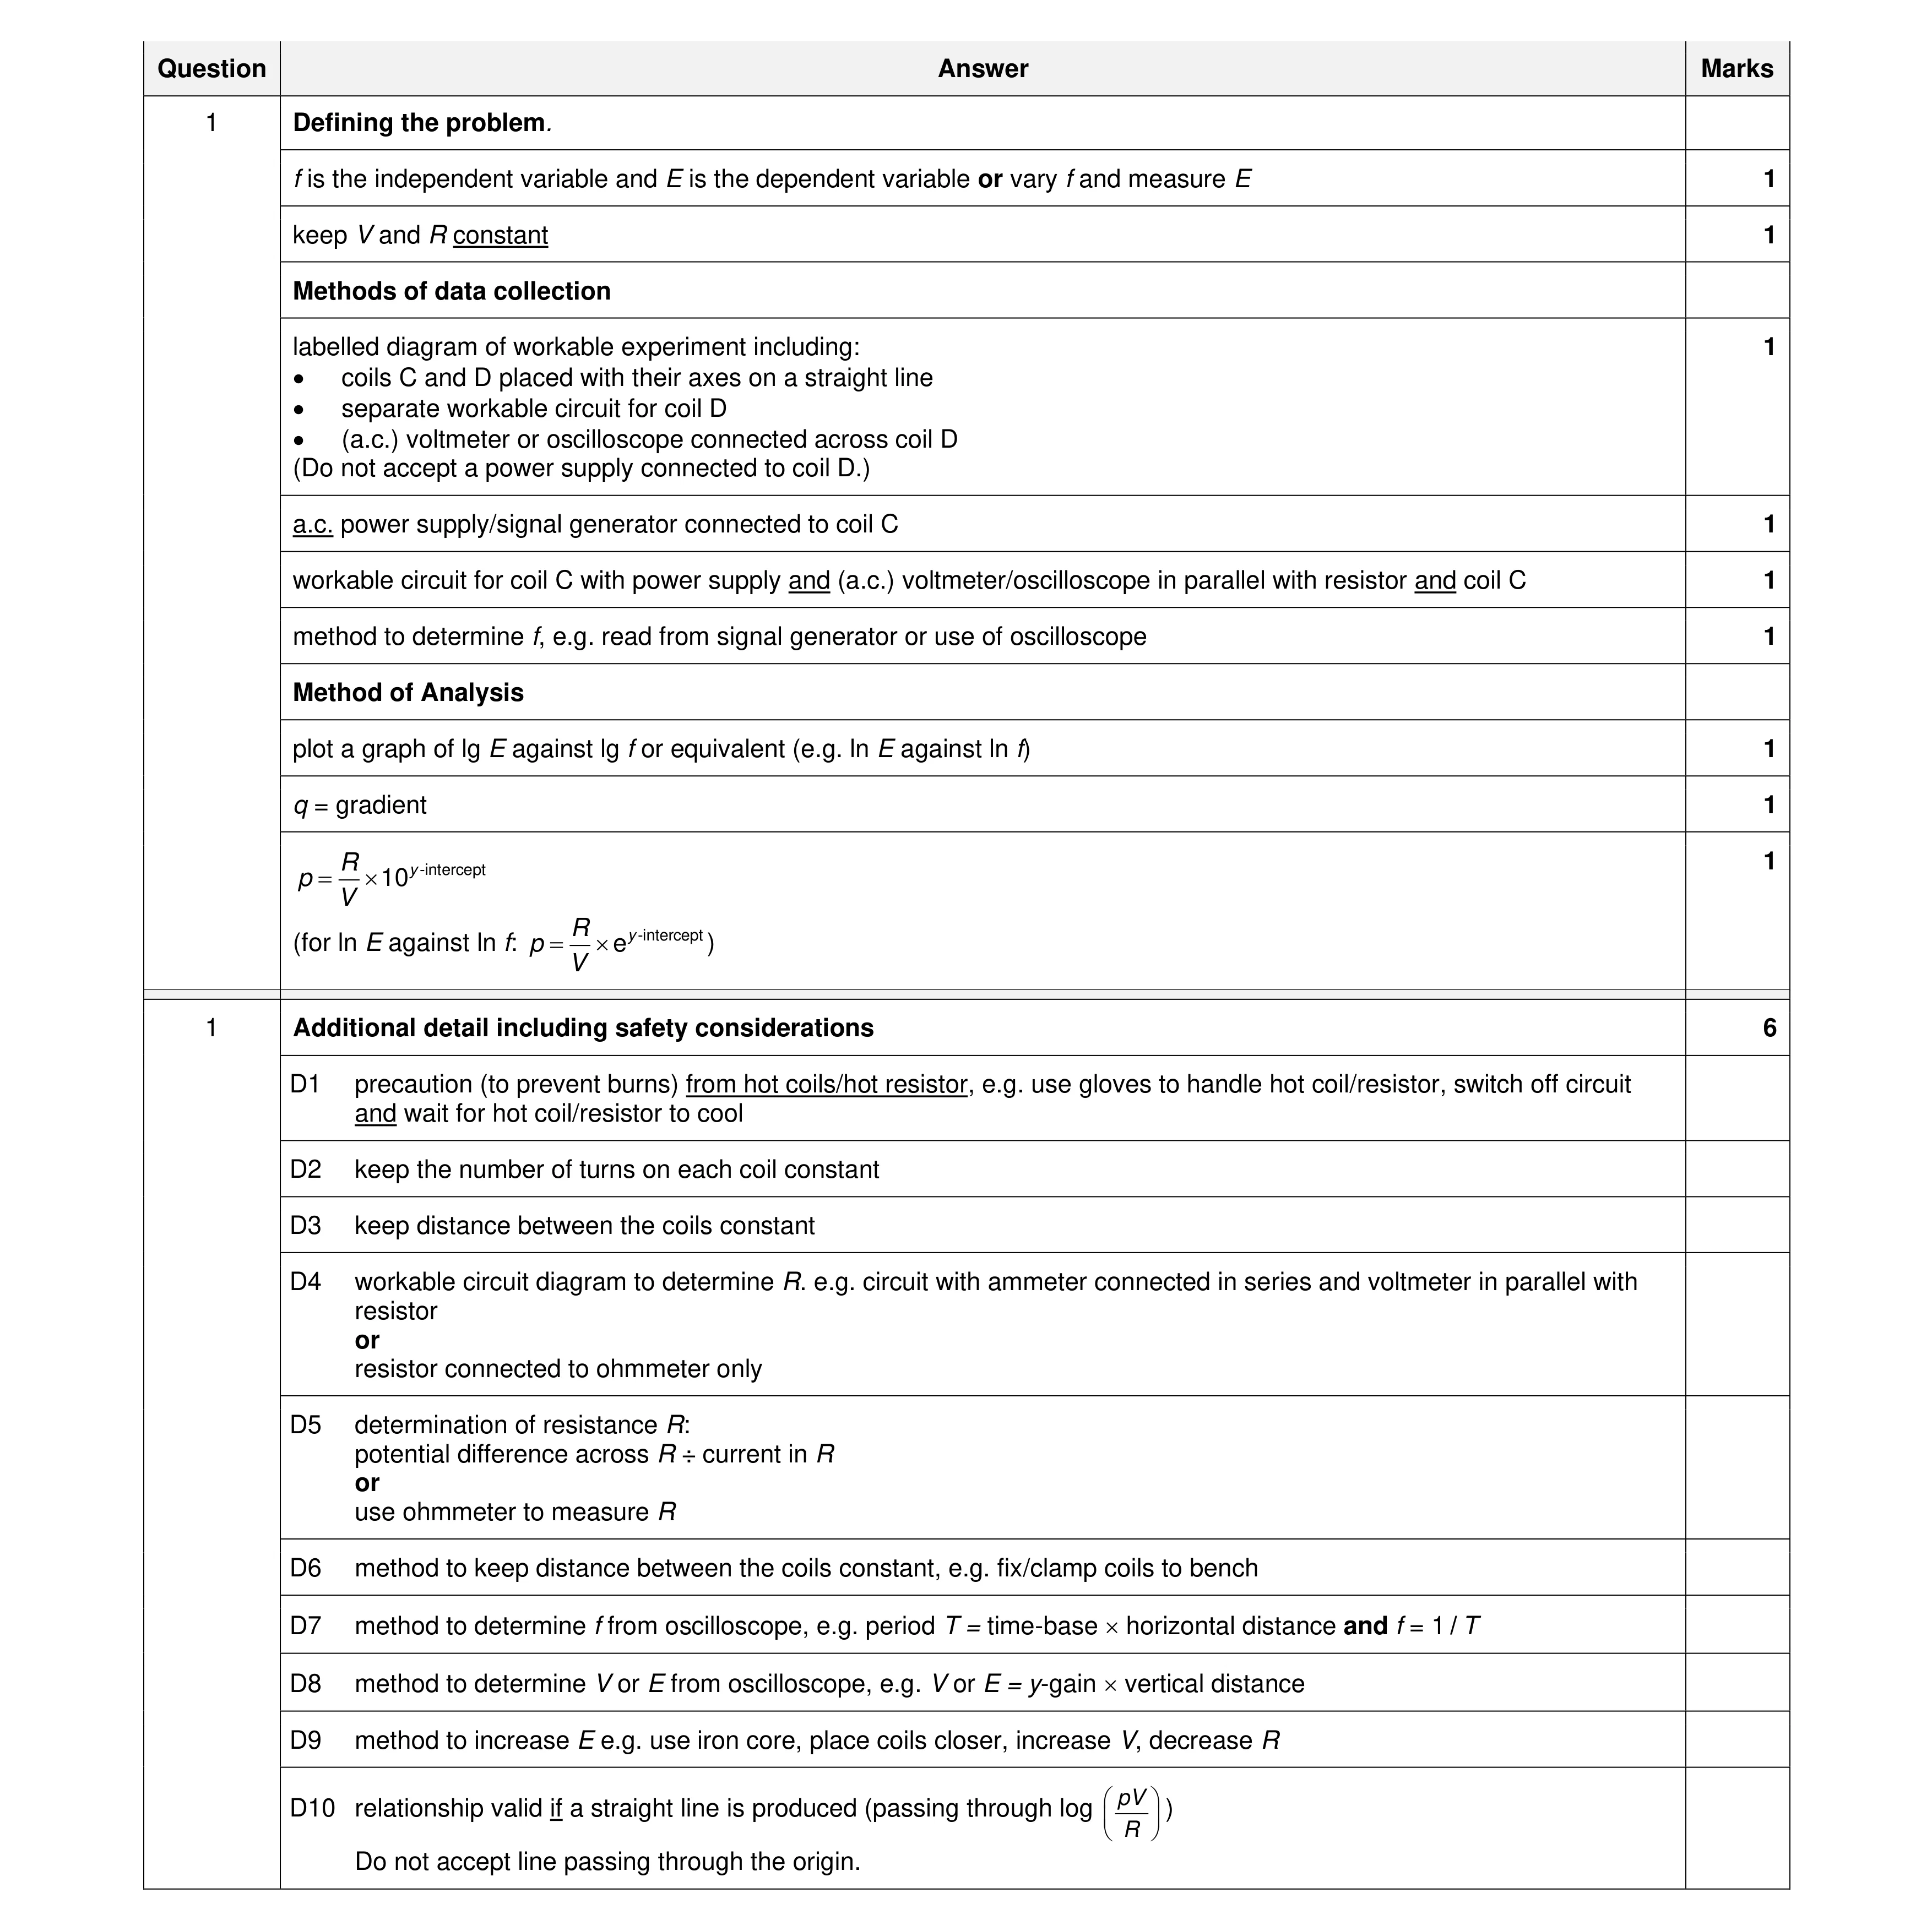 15
15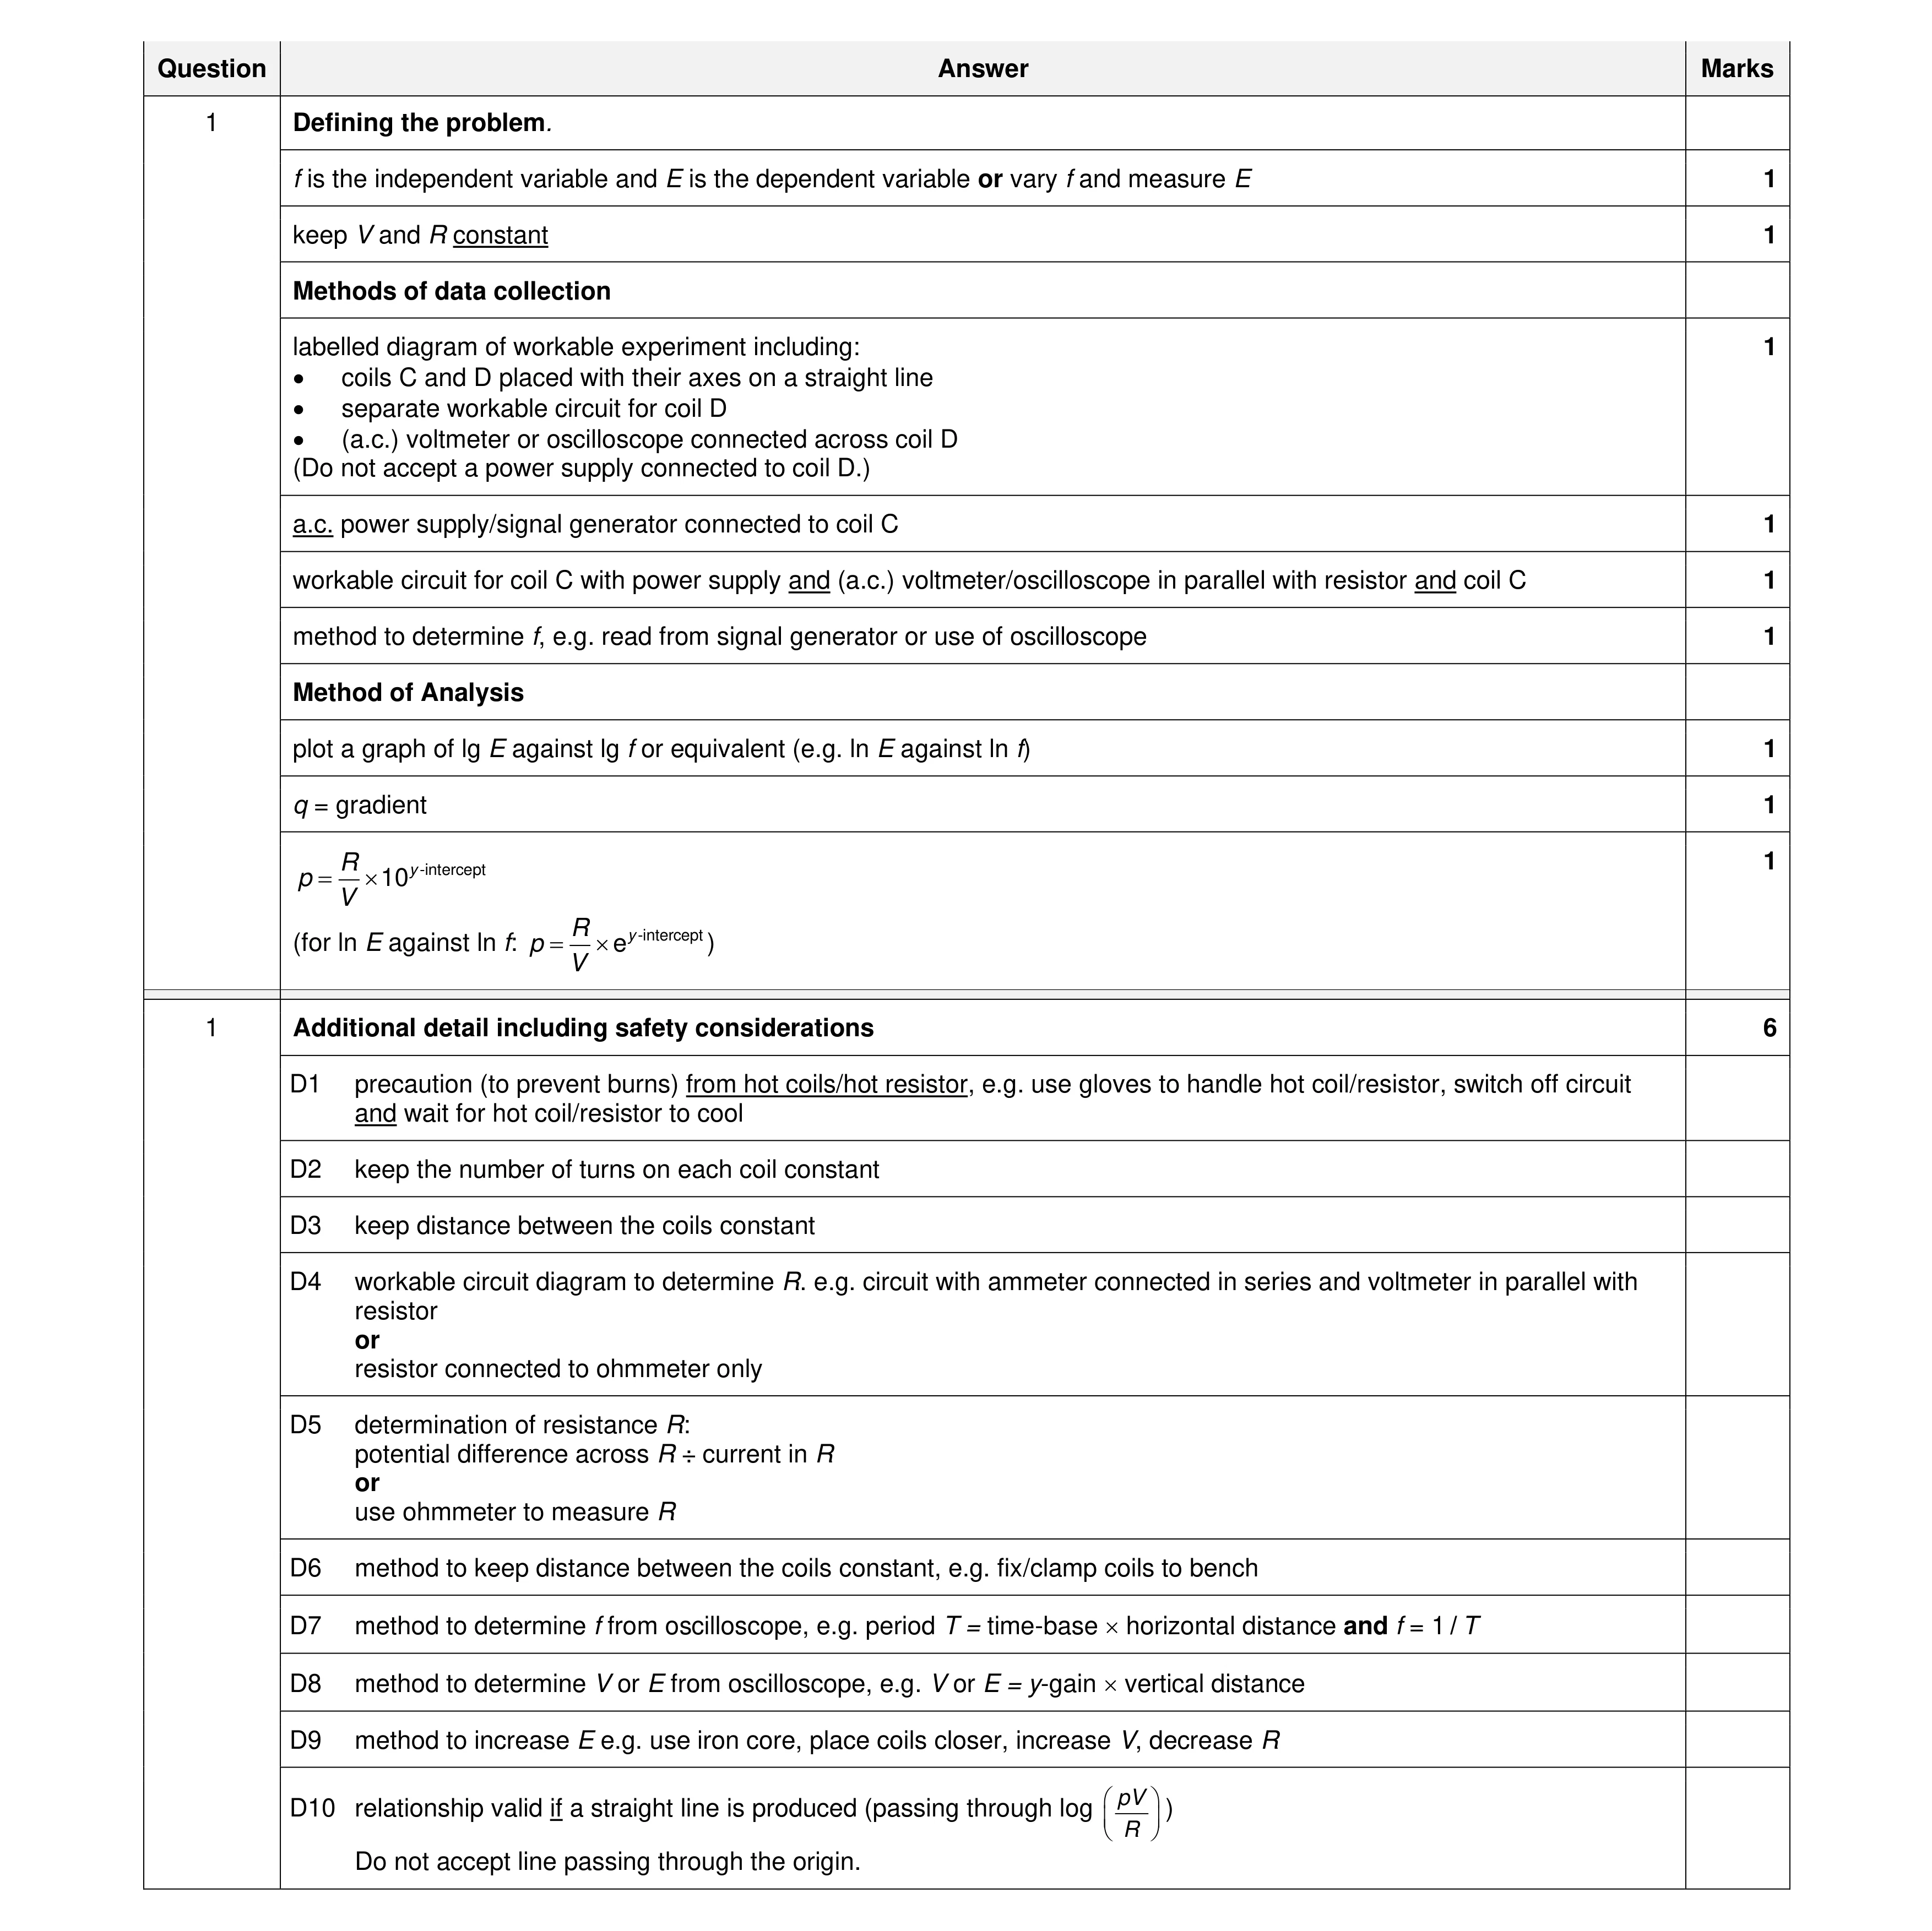 15
15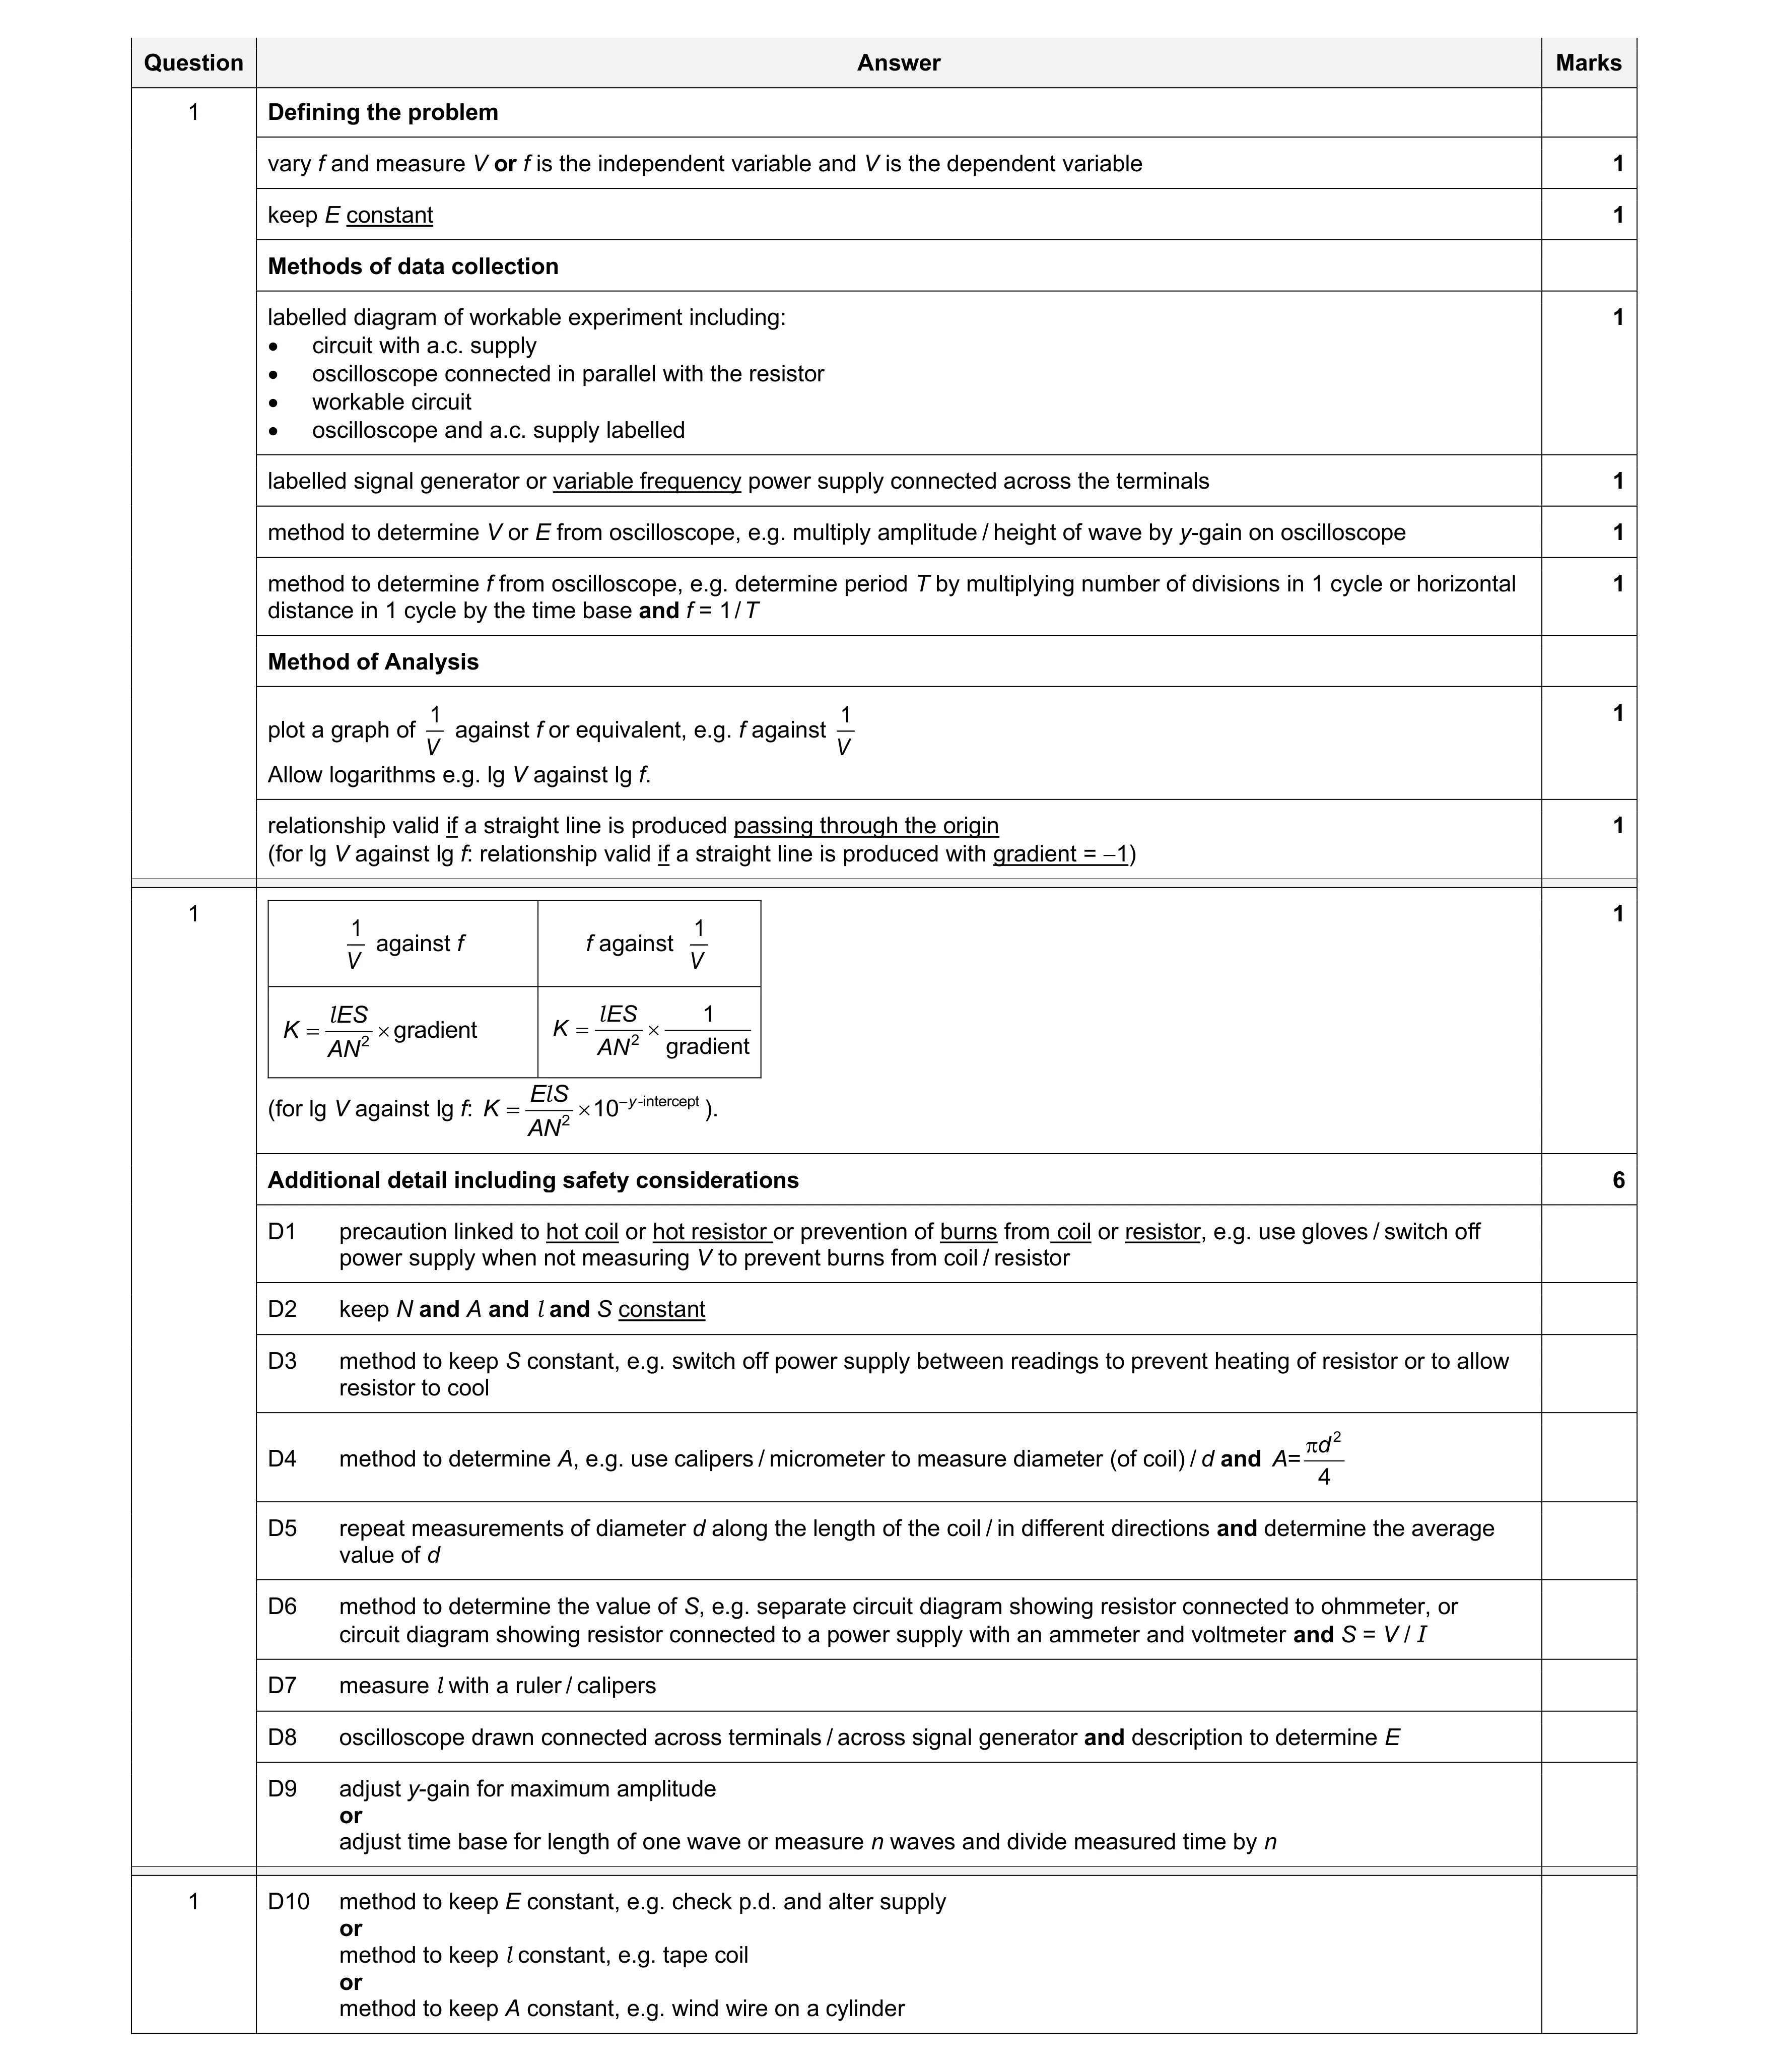 15
15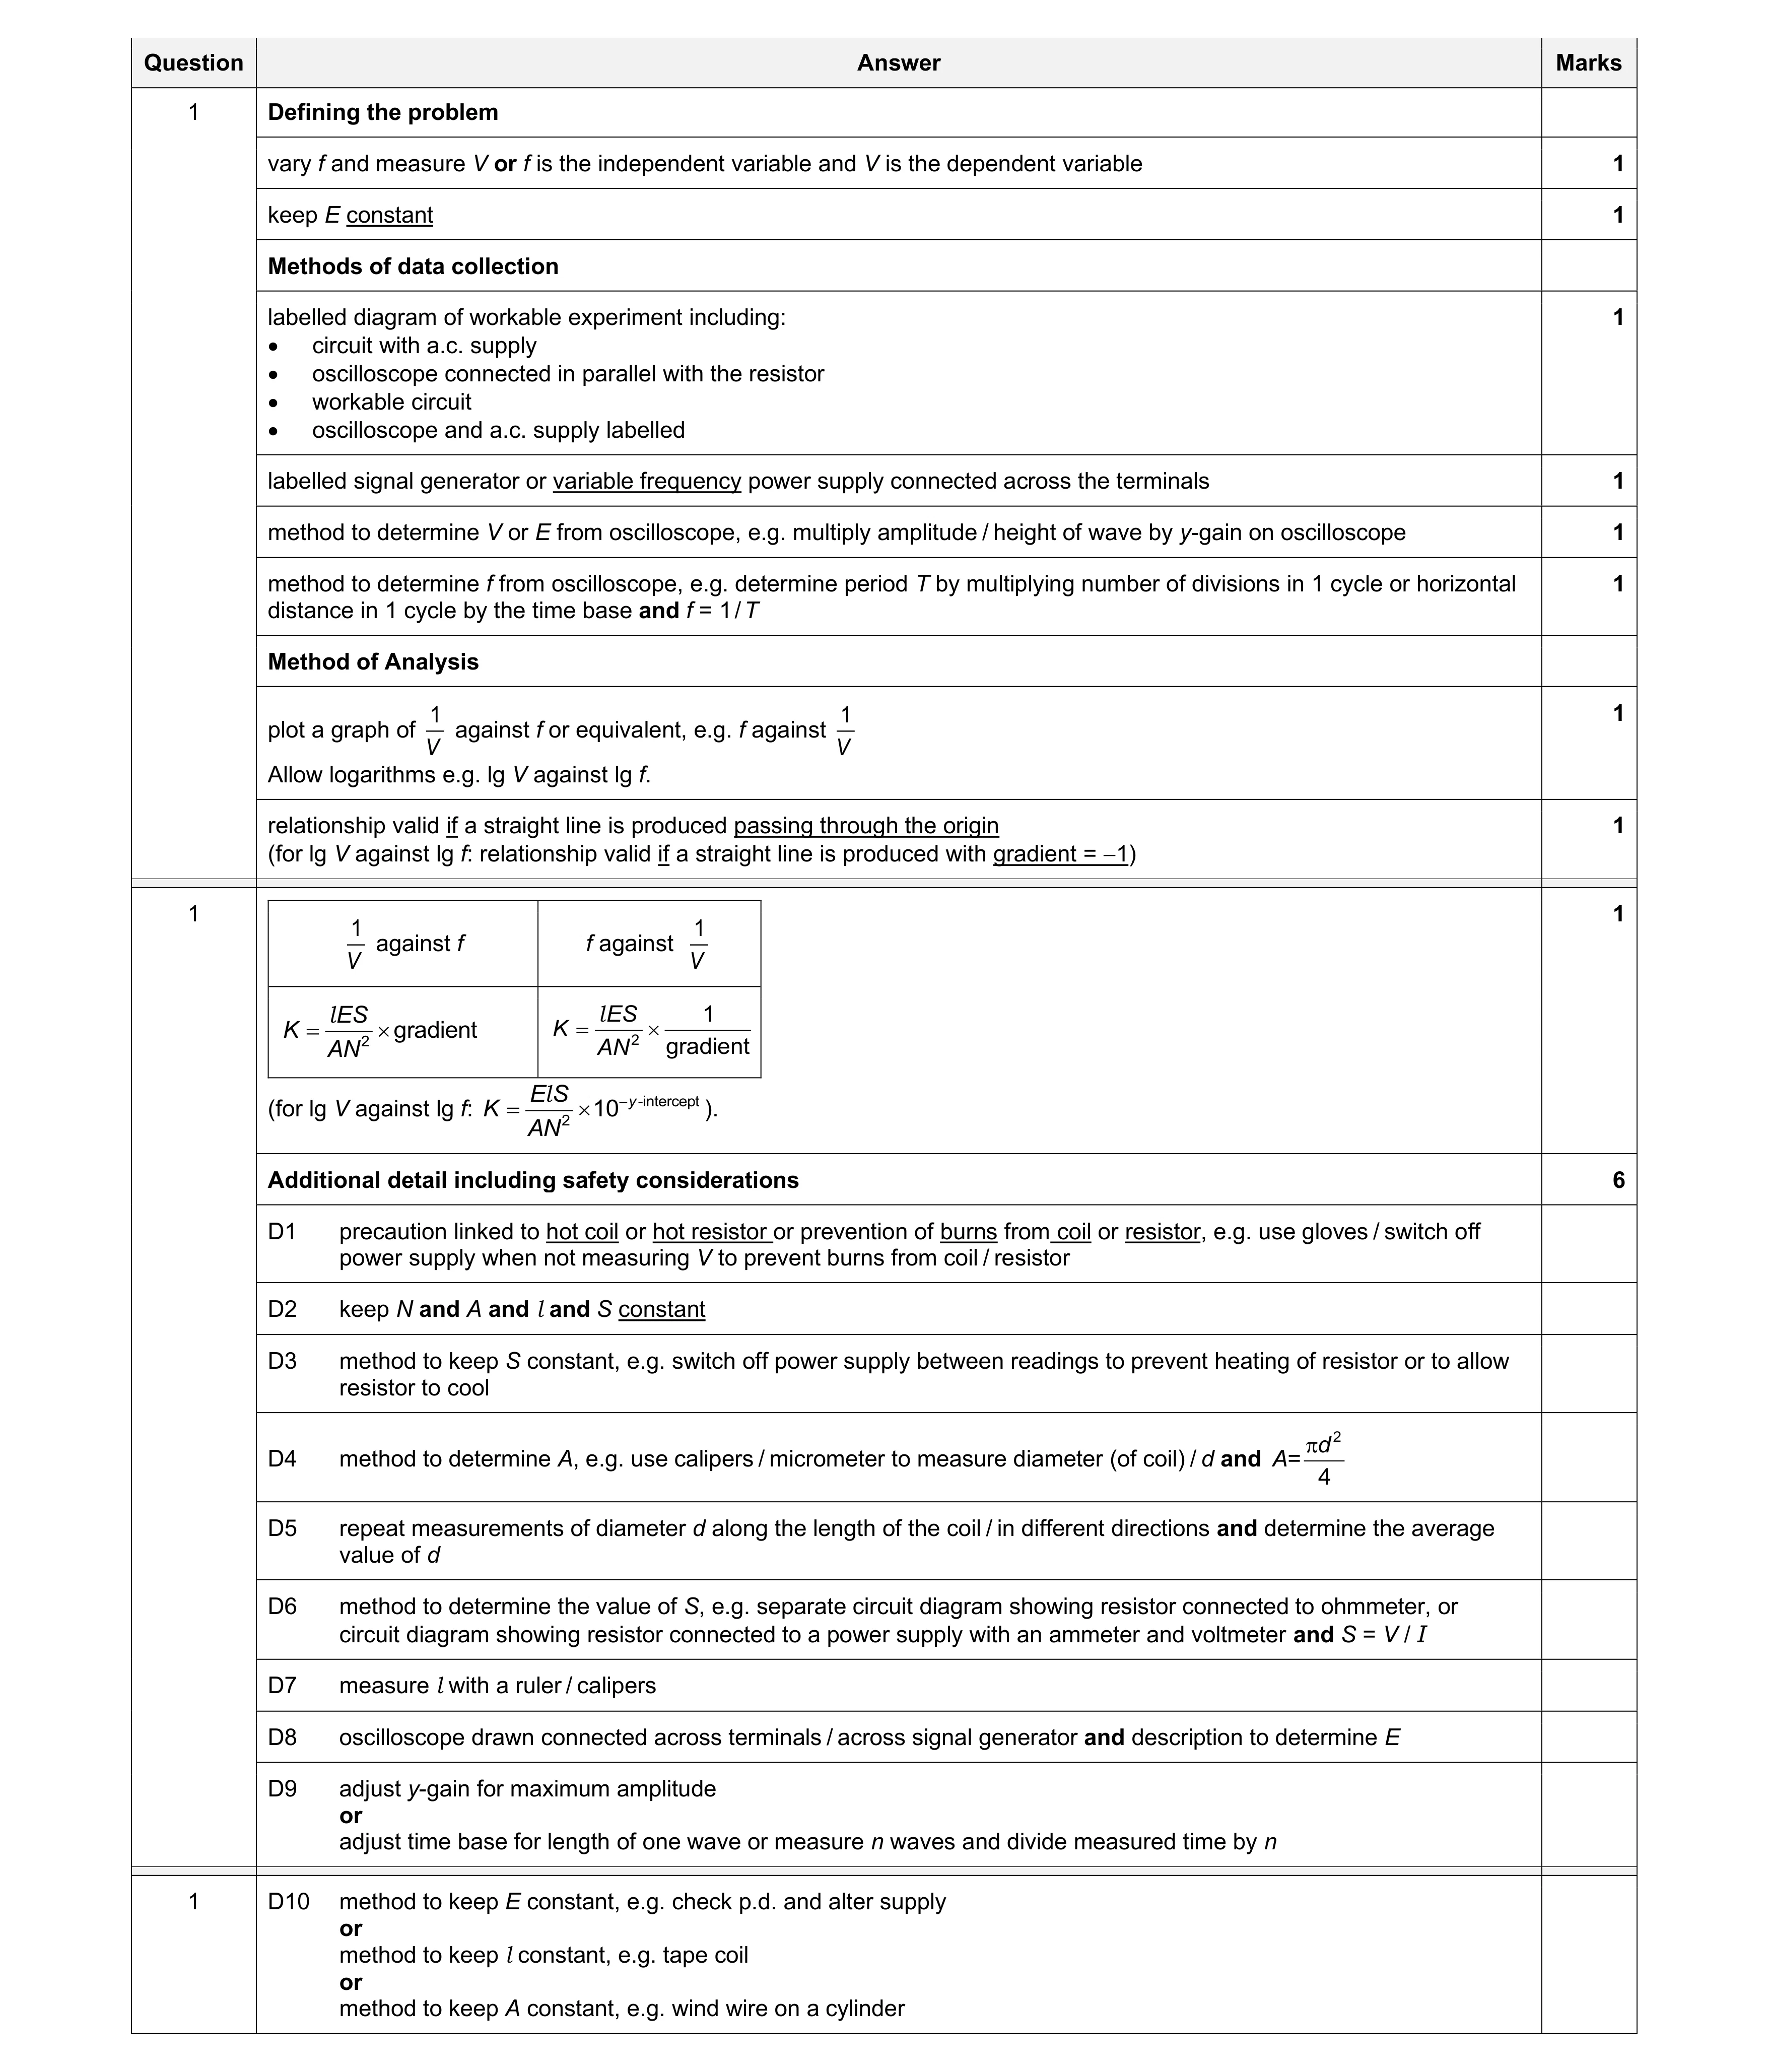 15
15